the Creative Commons Attribution 4.0 License.
the Creative Commons Attribution 4.0 License.
 | 01 Jul 2026
Evaluation of the particulate inorganic carbon export efficiency in the global ocean
The oceanic carbonate pump corresponds to the production and sinking of particulate inorganic carbon (PIC) by calcifying planktonic organisms. In this study, global estimates of PIC standing stock, production derived from ocean colour, and the contribution of calcifying taxa were combined with PIC flux observations from short-term sediment traps deployed over the past decades, covering the global ocean. Coccolithophores are the main calcifying plankton group in the euphotic zone, exhibiting a significant seasonal blooming pattern and a pronounced latitude-dependent seasonal response. The present study highlights that PIC production in the euphotic zone, and the pelagic PIC flux vary among oceanic regions, depths, and seasons. Based on a geographic matchup between PIC flux from sediment traps and remote sensing climatological observations, a correlation between net primary production (NPP) of particulate organic carbon (POC) in the euphotic zone and PIC flux is revealed. However, PIC production in the euphotic zone is not correlated with PIC flux at a global scale, but only in specific ocean basins, such as the North Atlantic and the Southern Ocean. Despite lower PIC production and PIC POC ratios in the euphotic zone, temperate and subpolar areas are more efficient at exporting PIC compared to equatorial and subtropical regions, which have higher PIC production and PIC POC ratios in the euphotic zone. Plankton phenology appears to be an important driver of PIC export efficiency (PIC Eeff) and PIC transfer efficiency (PIC Teff). This study suggests that the “packaging factor”, which includes the vehicles of the biological carbon pump (e.g., marine snow aggregates, fecal pellets) and the plankton network (e.g., zooplankton communities, microbial loop), largely determines PIC export and transfer efficiencies.
- Article
(9569 KB) - Full-text XML
-
Supplement
(425 KB) - BibTeX
- EndNote


Through gravitational settling, the biological carbon pump (BCP) transports photosynthetically fixed CO2 into the deep ocean for decades to centuries to come. Without the BCP, atmospheric CO2 concentration would be twice as high (Passow and Carlson, 2012). Phytoplankton, through photosynthesis, uptake CO2 and produce particulate organic carbon (POC). On the other hand, calcifying phytoplankton (such as coccolithophores), produce both POC and particulate inorganic carbon (PIC). Calcification process, often referred to as calcium carbonate (CaCO3) production, releases CO2, which is known as the counter pump effect. Even though calcification contributes to the release of CO2 (counter effect), all planktonic calcifying organisms (such as coccolithophores, foraminifers and pteropods) also transport POC to deep waters through gravitational settling. Field observation of particulate sinking flux (PIC and POC) has been made over many decades to better understand the BCP. To measure a particle flux, the sediment traps and Thorium-234 activity (234Th activity) are the most widespread techniques, both in terms of time and geography (Savoye et al., 2006; Le Moigne et al., 2014).
Coccolithophores contribute to 70 %–90 % of PIC production in the North Pacific Ocean when nutrient and light are available (Ziveri et al., 2023) and more than 90 % in the South Atlantic (Kruijt et al., 2026). Coccolithophore are generally considered dominant at global scale (Neukermans et al., 2023). In the global ocean, coccolithophores form mesoscale blooms in high-latitude oceans (Brown and Yoder, 1994; Balch et al., 2005), which are associated with high rates of calcification (Poulton et al., 2007, 2014; Balch et al., 2011; Krumhardt et al., 2017, 2019). The total annual CaCO3 production by planktonic organisms is characterised by a high uncertainty, with a range of 0.7–4.7 Pg C yr−1 (Berelson et al., 2007; Buitenhuis et al., 2019; Neukermans et al., 2023). A large proportion of these CaCO3 produced in the euphotic zone is dissolved within the first 300 m of the ocean (Ziveri et al., 2025; Sulpis et al., 2021; Feely et al., 2002; Milliman et al., 1999). This shallow dissolution is not yet clearly explained but considered to be associated with biological and ecological mechanisms such as zooplankton and procaryotes mediated dissolution (Sulpis et al., 2021; Kwon et al., 2024; Dean et al., 2024). The sedimentation of calcifying organisms constitutes an export flux of CaCO3 with an estimated range of 0.4–1.8 Pg C yr−1 (Berelson et al., 2007; Neukermans et al., 2023).
At a global scale, particle export efficiency (PEeff, corresponding to the POC sinking flux in the euphotic layer/POC production) is higher at high latitudes and lower at low latitudes (Henson et al., 2012). The transfer efficiency (Teff) corresponds to the proportion of exported organic matter that reaches the deep ocean. Teff is lower at high latitudes and higher at low latitudes (Henson et al., 2012).
Satellite-based estimates of net primary production (NPP) at low latitudes carry substantial uncertainties, potentially biasing PEeff calculations (Henson et al., 2019; Ryan-Keogh et al., 2023; Weber et al., 2016). Recent AI-based models improve the link between deep-ocean particle flux measurements and satellite observations (Picard et al., 2024, 2025). While Teff is not consistently correlated with CaCO3 export flux (Henson et al., 2012), sediment trap data show that coccoliths and coccospheres are more efficiently transported when incorporated into fecal pellets or marine snow (Honjo, 1976; Pilskaln and Honjo, 1987; Guerreiro et al., 2021; Toullec et al., 2022). The “ballast effect” postulates that biominerals like CaCO3 and biogenic silica are expected to increase particle density and sinking velocity (Iversen and Ploug, 2010; Laurenceau-Cornec et al., 2020). Hence, the BCP is expected to be enhanced by biomineralizing plankton (coccolithophores, diatoms). Nonetheless, the ballast effect remains debated because upper-ocean CaCO3 export flux is not always linked to particle transfer efficiency, leaving the ballast hypothesis controversial (Henson et al., 2012).
Seasonal influence is an important factor affecting Teff of carbon to the deep sea. During phytoplankton blooms, the exported organic matter is more labile, which is likely expected to reduce its transfer efficiency. In low latitudes, which are annually CaCO3-productive regions, some modelling and observational syntheses have demonstrated that PEeff tends to be lower while Teff is relatively higher (Henson et al., 2012; Lima et al., 2014; Huang and Fassbender, 2024). However, the most recent studies agree that the structure of the ecosystem is a major driver of PEeff and Teff, even more so than latitude (Henson et al., 2019).
The “packaging factor” theory suggests that CaCO3-dominated ecosystems (subtropics and equatorial area) are associated with a complex food web, and CaCO3 would be more tightly packaged in fast-sinking fecal pellets, associated with potential ballast effect on the POC (Laurenceau-Cornec et al., 2020). However, particle flux from seasonal, opal-dominated systems (Temperate and sub-Polar ecosystems) would be highly “degradable” formed aggregates, produced by the coagulation of senescent diatoms (Francois et al., 2002). This “packaging factor” as well as the potential associated ballast effect hence should be a strong driver of Teff. Biominerals such as CaCO3 could be a major driver of POC flux (Lacour et al., 2023) or by physically protecting the more labile POC in aggregates from degradation during gravitational settling (Armstrong et al., 2001).
The biogeographical approach is particularly appealing to understand the structures of plankton communities as well as biogeochemical processes according to the latitude and different ocean basins, also under climate change scenarios (Barton et al., 2013). Indeed, biogeographic patterns are common in macroecology (Kaneko et al., 2023; Thuiller et al., 2015), and BCP understanding (Clements et al., 2023; Ricour et al., 2023; Wang et al., 2023).
In this context, ocean colour data derived from satellite observation is valuable to estimate surface ocean processes over time. Satellite observations of coccolithophore blooms have been available since the emergence of remote sensing of ocean colour techniques (Holligan et al., 1993). Blooms of coccolithophores (e.g., Gephyrocapsa (Emiliania) huxleyi) can produce highly reflective patches at the ocean surface and exhibit distinctive optical properties (Balch et al., 1996, 2005; Balch and Mitchell, 2023). These optical signatures can be used to estimate particulate inorganic carbon (PIC) concentrations and production rates at the global scale (Hopkins and Balch, 2018; Hopkins et al., 2019). There remains a gap in our comprehension of processes controlling the transfer of photosynthetically produced organic carbon to the deep (Buesseler et al., 2007; Henson et al., 2012). Nowadays, heterotrophic respiration in sinking aggregates is considered creating a microenvironment supporting dissolution of CaCO3 in the upper ocean (Morse et al., 2006; Friis et al., 2006; Buitenhuis et al., 2019; Sulpis et al., 2021, Dean et al., 2024). In the deep ocean, dissolution of CaCO3 is primarily driven by conventional thermodynamics of CaCO3 solubility with reduced fluxes of CaCO3 burial to marine sediments. Kwon et al. (2024) showed that without CaCO3 dissolution in the upper ocean, approximately 20 % more CO2 would be released to the atmosphere.
Understanding how the surface processes control the export of POC and PIC is still an ongoing challenge in the biogeochemical oceanographic community (Renforth and Henderson, 2017). In addition, processes such as PIC production, sinking flux, and dissolution are key components of the ocean alkalinity balance, which in turn regulates atmospheric carbon uptake in surface waters (Renforth and Henderson, 2017; Planchat et al., 2023).
This work examines the variability of euphotic zone PIC production and deep PIC flux. In this study, a compilation of existing data sources (e.g. PIC flux from sediment traps, calcified taxa group biomass global estimation) and satellite images, geographically covering the open ocean at different seasonal scales is compared and discussed. The objective of this study is to address the following questions: How do spatial and seasonal pattern modulate the PIC export efficiency (PIC Eeff) and the PIC transfer efficiency (PIC Teff) at the global scale?
2.1 PIC production remote sensing-based modelling
PIC production at a global scale was modelled using satellite ocean colour measurements (see Hopkins and Balch, 2018 and reference therein for more details), coupled with physiological constant (growth rate under variable light intensity and temperature) associated with Gephyrocapsa (Emiliania) huxleyi, which is the most cosmopolitan coccolithophore and extensive blooms former (Holligan et al., 1993) across the majority of the world's oceans (Tyrrell and Merico, 2004).
2.1.1 Calcification model
The model proposed by Hopkins and Balch (2018) was applied to estimate the calcification rate in the euphotic zone (expressed as EZ PIC production). The model of coccolithophores calcification rate is a function of PIC concentration, growth rate, irradiance, and depth (Eq. 1):
In this model, general assumptions are made, such as that PIC production is proportional to the coccolithophores growth rate. The coccolithophores growth rate is a function of temperature and irradiance (parameters established on G. huxleyi culture). The calcification rate decreases as a function of light availability through the water column (Hopkins and Balch, 2018). The model generalizes the euphotic zone integrated PIC production rate (g C m−2 d−1) (Eq. 2):
Where μ is a temperature-derived growth rate, h(Isurf) is a growth limiting irradiance function, and g(Zeu) is a depth dependency function (see Hopkins and Balch, 2018 and reference inhere for more details). All the satellite products used in the model are described in the following section.
2.1.2 PIC and POC standing stocks
Surface PIC and POC satellite-based concentrations were depth integrated to 100 m using empirical relationships based on in situ measurements across the Atlantic Ocean (Balch et al., 2018):
2.1.3 Satellite products collection
The computation was performed with 1° by 1° grid average monthly data (from September 1997 to October 2023) from different sensors merged (Table S1 in the Supplement). Ocean color observations are representative to the near-surface optical properties (upper 20–40 m in open ocean conditions). The satellite data used in this study (PIC concentration, PAR and Kd490 nm) were downloaded from the Globcolour website (https://hermes.acri.fr/, last access: 2 February 2024). The Sea surface temperatures were obtained from NASA Ocean Color website (https://oceancolor.gsfc.nasa.gov/, last access: 2 February 2024) and the COPERNICUS marine service website (https://marine.copernicus.eu/fr/, last access: 2 February 2024). The following products (Table S1) were used in determining the PIC production rate (g C m−2 d−1): the monthly surface PIC concentration (mol C m−3), the monthly SST (Sea Surface Temperature in °C) for the determination of G. huxleyi growth rate, the monthly photosynthetic available radiation (PAR; mol photons m−2 d−1) for the growth rate limiting irradiance, the monthly Kd490 nm (Light diffuse attenuation coefficient at 490 nm; m−1) used for the determination of the euphotic depth and depth-integrated calcification rate, see details of the methods below. Euphotic zone integrated Primary Production (mg C m−2 d−1) was obtained from COPERNICUS marine service website (https://marine.copernicus.eu/fr/, last access: 2 February 2024, https://doi.org/10.48670/moi-00281, Copernicus Marine Service, 2024), the different variables were obtained from multi-sensors products based on SeaWiFS, MERIS, MODIS-A, MODIS-T, VIIRS-SNPP and JPPS1, OLCI-S3A and S3B). The primary production algorithm was developed by Antoine and Morel (1996).
2.1.4 PIC standing stock evaluation, and taxa contribution
Monthly climatology of depth-integrated coccolithophores PIC standing stock (g C m−2) in the top 100 m was obtained from ocean colour remote sensing using empirical relationships between surface ocean PIC concentration and depth-integrated PIC standing stock (Eq. 3, Balch et al., 2018). Monthly climatology PIC standing stock for foraminifers and pteropods in the top 200 m was obtained from Knecht et al. (2023; see Fig. 4), supplementary data. The carbon biomass concentration for foraminifers and pteropods in the top 200 m (g C m−3) was converted into PIC mass concentration (Bednaršek et al., 2012; Knecht et al., 2023; Schiebel and Movellan, 2012). Integrated PIC standing stock (g C m−2) were obtained for foraminifers and pteropods, by multiplying the PIC biomass concentration (g C m−3) by the layer of integration (200 m).
2.2 PIC flux
PIC production in the euphotic zone are expressed in g C m−2 d−1 (as detailed in Sect. 2.1.1). PIC fluxes for the different depth of integration are expressed in g C m−2 d−1, considering the deployment duration (in day), the sediment trap collecting surface area (m2) and the quantity of collected matter (g).
2.2.1 Sediment trap data collection
PIC flux from sediment trap data was obtained from public repositories and published data (https://www.pangaea.de/, last access: 2 February 2024, see Table S2; Fig. 1).
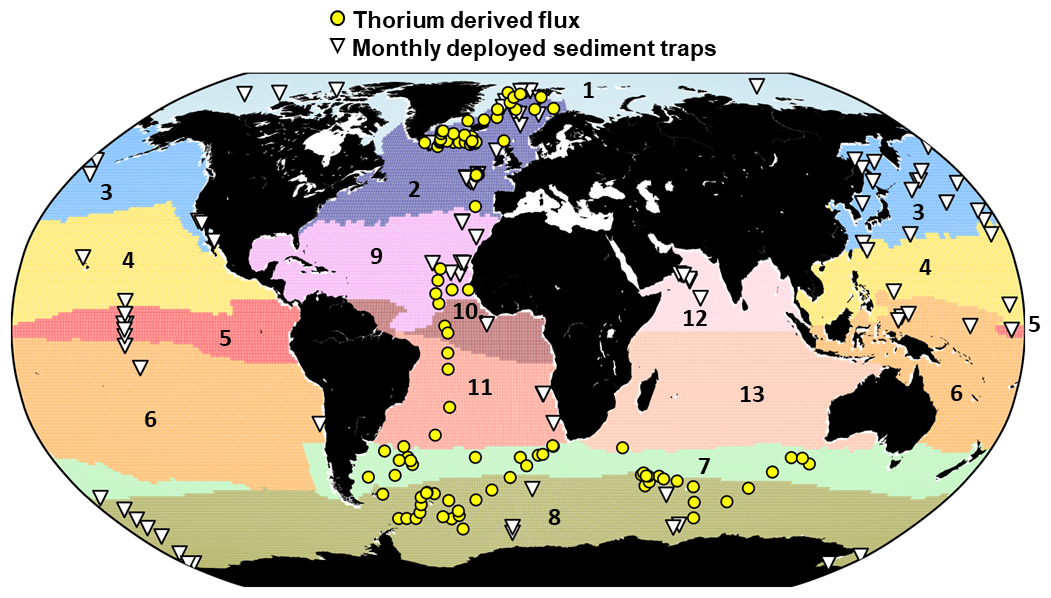
Figure 1Locations of sediment traps measuring PIC flux within 13 biogeochemical regions (RECCAP 2 regions). Region 1 = Arctic (Ar); 2 = North Atlantic (NA); 3 = North Pacific (NP); 4 = North Subtropics Pacific (NSTP); 5 = Equatorial Pacific (EP); 6 = South Subtropics Pacific (SSTP); 7 = Subantarctic (SAZ); 8 = Antarctic (AAZ); 9 = North Subtropics Atlantic (NSTA); 10 = Equatorial Atlantic (EA); 11 = South Subtropics Atlantic (SSTA); 12 = North Indian Ocean (NI) and 13 = South Indian Ocean (SI). The monthly deployed sediment traps are depicted by white triangles and Thorium-derived PIC flux is depicted by yellow dots. 54 stations were out of the RECCAP2 mask (open ocean station) and then have been removed from the 6057 PIC flux observations subset.
To ensure that the time scale of the PIC flux corresponds as closely as possible to the products derived from the satellites, the analysis were performed on a subset of sediment traps deployed 31 d or less (monthly), for a total of 6057 PIC flux observations (sediment traps deployed from 1983 to 2012) were performed. PIC flux observation was then aggregated into seven different layers of depth (0–100, 100–500, 500–1000, 1000–2000, 2000–3000, 3000–4000 and > 4000 m), as presented in Table 1. Analysis on monthly deployed sediment flux were matched with monthly remote-sensing climatology (see details in the following section). On the other hand, a possible bias associated with the interaction of hydrodynamics, the capture of zooplankton, organic particle remineralization, and PIC dissolution could happen for a longer time of deployment.
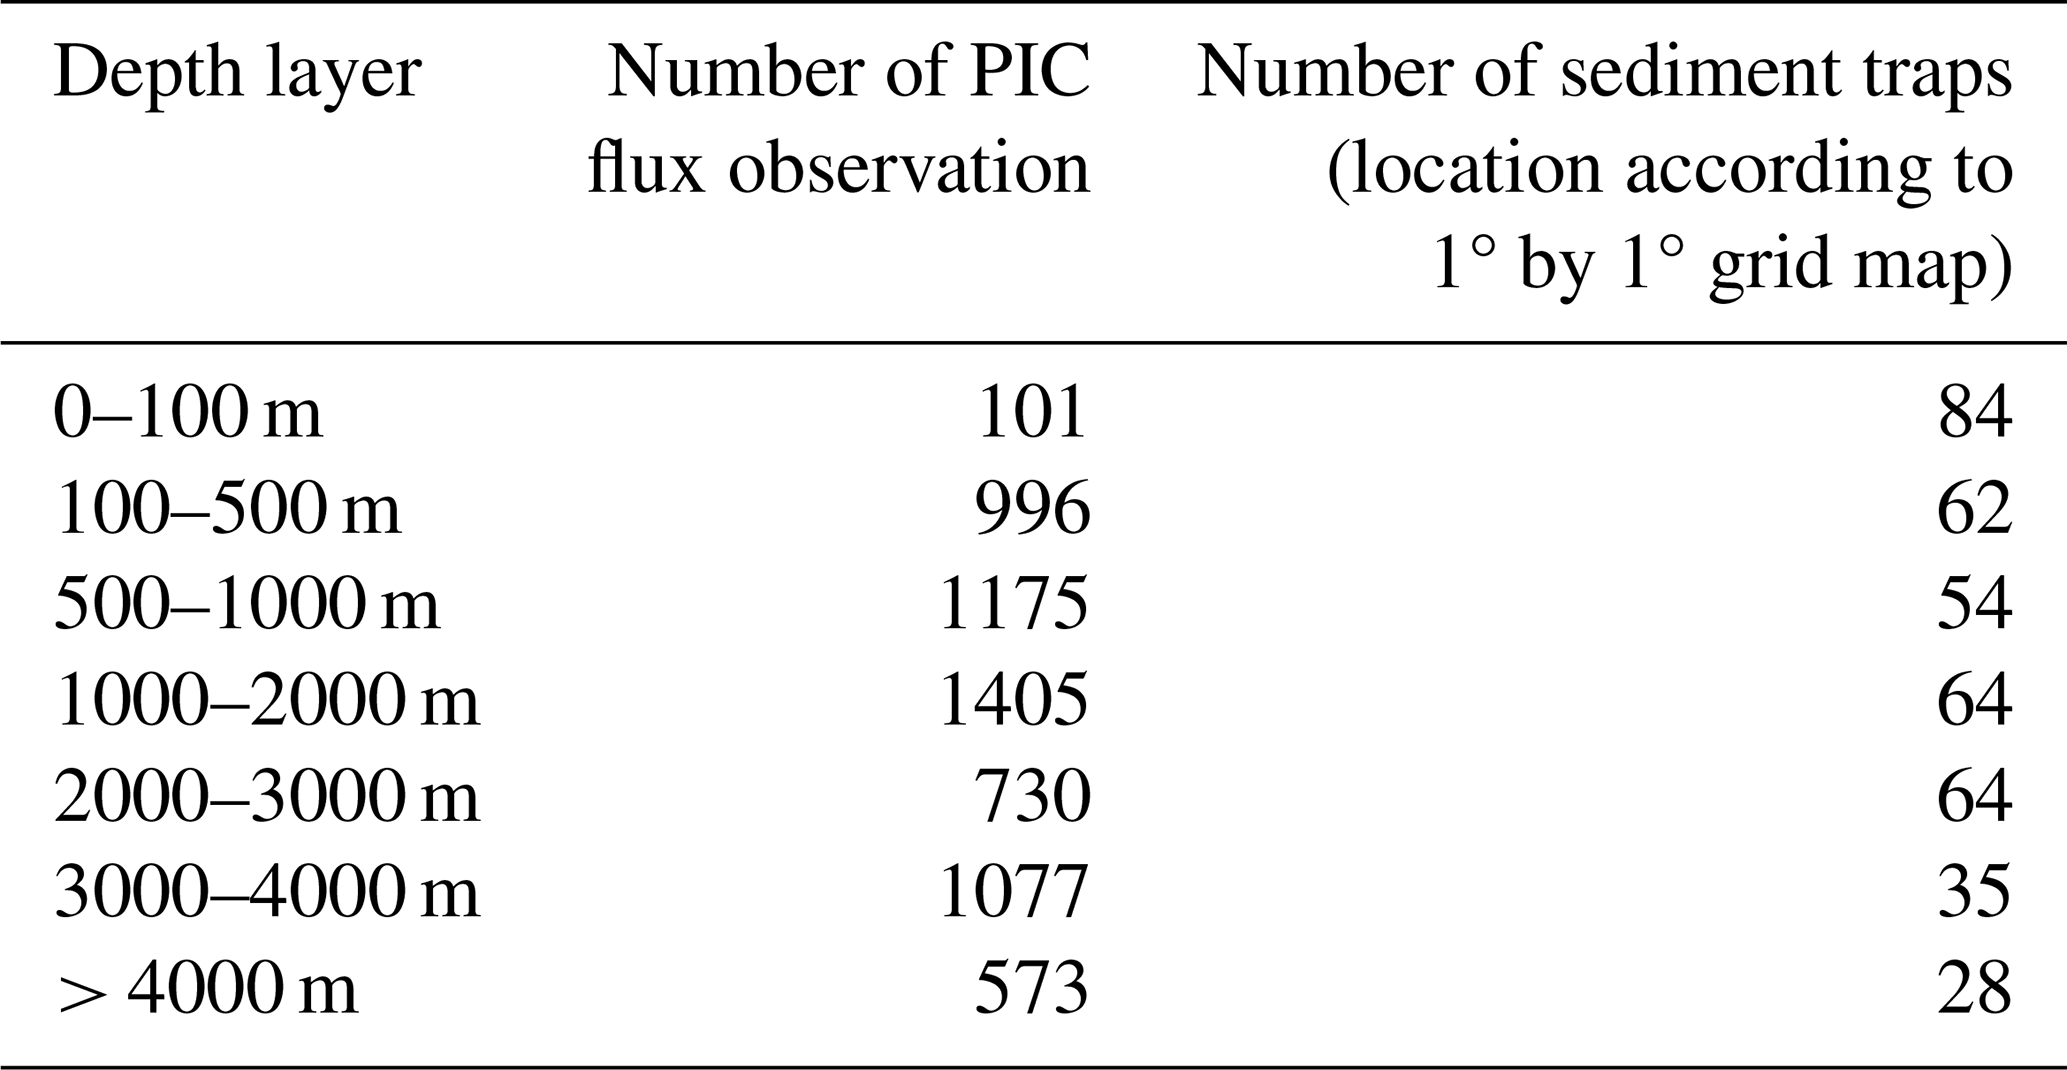
A total of 262 sediment trap locations were used in the analysis. Note that the total of sediment traps for each layer of depth is equal to 391 (multiple sediment traps may have been deployed on the same mooring line), due to the multiple depth deployments at the same geographic location. Moreover, multiple PIC flux observations can be attributed to the same sediment trap deployments (time series, e.g. PAP, ALOHA station). As for EZ PIC production model output, the analysis and interpretation of observed PIC flux were applied to the open ocean only, excluding data obtained from a water column of less than 200 m depth.
2.2.2 Global data flux estimates
Total global EZ PIC production (Pg C yr−1) was determined by multiplying integrated PIC production by the latitudinally varying area of each 1° by 1° pixel. The latitude variation pixel surface (m2) was computed using Eq. (5):
where the equatorial earth circumference = 40 075.017 km and the meridional earth circumference = 40 007.864 km. The data downloaded were a matrix of 180 pixels of latitude by 360 pixels of longitude (based on cylindric projection).
The analysis and interpretation of the EZ PIC production model output were focus on the open ocean only, excluding data obtained from bathymetry lower than 200 m depth.
2.2.3 Biogeochemical regions
RECCAP2 biogeochemical regions (second REgional Carbon Cycle Assessment and Processes) aim to accurately assess land and ocean CO2 sources and sinks through the efforts of hundreds of scientists around the globe (Hauck et al., 2023). The overall aim of RECCAP2 is to support the Global Carbon Project (https://www.globalcarbonproject.org/, last access: 2 February 2024) and the stocktaking of greenhouse gases by providing a reliable scientific basis for the transport of carbon between land, ocean and atmosphere. RECCAP2 biogeochemical regions mask was used to aggregate data from sediment traps and remote sensing according to relevant geographical regions (Fig. 1, Table S3).
2.2.4 Euphotic zone integrated satellite-derived production and deep PIC flux matchup
The majority of sediment trap deployments occurred before the launch of ocean colour observation from satellite, from 1983 to 2012 (SeaWiFS observation started in September 1997). 75.7 % of PIC flux data used in the analysis (4588 observations over a total of 6057 observations) were collected before the satellite record. Hence, a match-up between the PIC flux data and EZ PIC production monthly climatology were performed (monthly mean from September 1997 to November 2023).
In the analysis, 7 different layers of depth were aggregated (0–100, 100–500, 500–1000, 1000–2000, 2000–3000, 3000–4000 and > 4000 m). Discrete observed PIC flux values obtained from sediment traps were aggregated over the depth layer of interest and matched geographically with the monthly climatology-modelled EZ PIC production and NPP on the 1°×1° grid. PIC flux values were therefore matched to the same 1° pixel and then associated to the same EZ PIC production. The monthly climatology average of EZ PIC production was established on a period from September 1997 to November 2023 on the 1°×1° grid map. Pearson's correlation test was performed between the monthly climatology average of EZ PIC production and PIC flux values for the depth layers of interest. The process has been performed for the 13 RECCAP2 biogeochemical regions, covering the global ocean.
EZ PIC production values <0.1 mg m−2 d−1 were removed from the dataset to exclude values close to zero or below the detection limit, which may result from a lack of satellite coverage. (e.g. winter months in the north hemisphere above 40° N).
2.2.5 Supporting dataset
1° by 1° grid map of fecal pellets and aggregates contribution to the total particles export were obtained from model ensemble output from Nowicki et al. (2022a) (FigShare database: https://doi.org/10.6084/m9.figshare.19074521, Nowicki et al., 2022b).
3.1 NPP, PIC production and residence time seasonality
At the global scale, annual EZ PIC production of 1.65±0.36 Pg C yr−1 was estimated (monthly mean ±σ, 1997–2023 annual mean, 302 months of observation), which is congruent with previous estimation based on the same calcification model (ca. 1.42±1.69 Pg C yr−1 in Hopkins and Balch, 2018). The difference between the global estimates reported by Hopkins and Balch (2018) and those obtained in this study may be explained using a merged satellite product (see Table S1), which provides broader ocean coverage.
The most NPP annual productive areas are located along the continental margins, above 40° N and within equatorial upwelling ecosystems (Fig. 2a). In contrast to the NPP, the most PIC productive areas are located within subtropical gyres, in the Southern Ocean (along the “Great Calcite Belt”), in the North Atlantic, but not in the Northern Indian Ocean, and less productive within equatorial upwelling ecosystems (Fig. 2b). NPP (POC production, Fig. 2) is driven by nutrient availability (nitrate, phosphate, iron). Upwelling zones or high-latitude oceans have high nutrient supply, so phytoplankton production is high. PIC production, particularly by coccolithophores such as G. huxleyi, is enhanced in nutrient-poor, stable waters, including oligotrophic subtropical gyres, where these organisms can grow and calcify efficiently. The seasonal variation of NPP and PIC production follows the phytoplanktonic bloom phenology, with higher seasonal variation above 40° N and below 40° S (Fig. 2c and d). It is noticeable that the PIC production seasonal bias amplitude is higher than NPP seasonal bias (Fig. 2c and d). Both residence time (the integrated stock divided by the integrated production) and amplitude variation are higher for PIC than for POC (Fig. 2e and f). The amplitude of spatial variation of POC residence time is lower than PIC residence time (Fig. 2e and f). The residence time is obtained by dividing the euphotic layer integrated standing stock (g m−2) by the euphotic layer integrated production rate (g m−2 d−1). POC residence time highest values reach 20 d in the Southern Ocean and over 20 d in arctic regions (Fig. 2e). However, PIC residence time values reach more than 30 d at high latitudes regions (the Southern Ocean and above 40 °C). PIC residence time values over 10 d are also observed within equatorial upwelling (Indian Ocean and West Pacific equatorial). Both PIC and POC residence times reflect a balance between sinking and removal processes such as dissolution or remineralization. For either to sink efficiently, aggregation into marine snow or incorporation into fecal pellets is generally required. PIC observation (ocean colors based) results mainly from free-floating coccoliths, which can accumulate at the surface to a greater extent than POC. In contrast, POC is readily consumed by bacteria and zooplankton, leading to rapid remineralization in the upper ocean. PIC (CaCO3), however, is chemically more resistant to biological degradation in surface waters and typically dissolves only under specific conditions, such as in undersaturated carbonate waters, in the deep ocean.
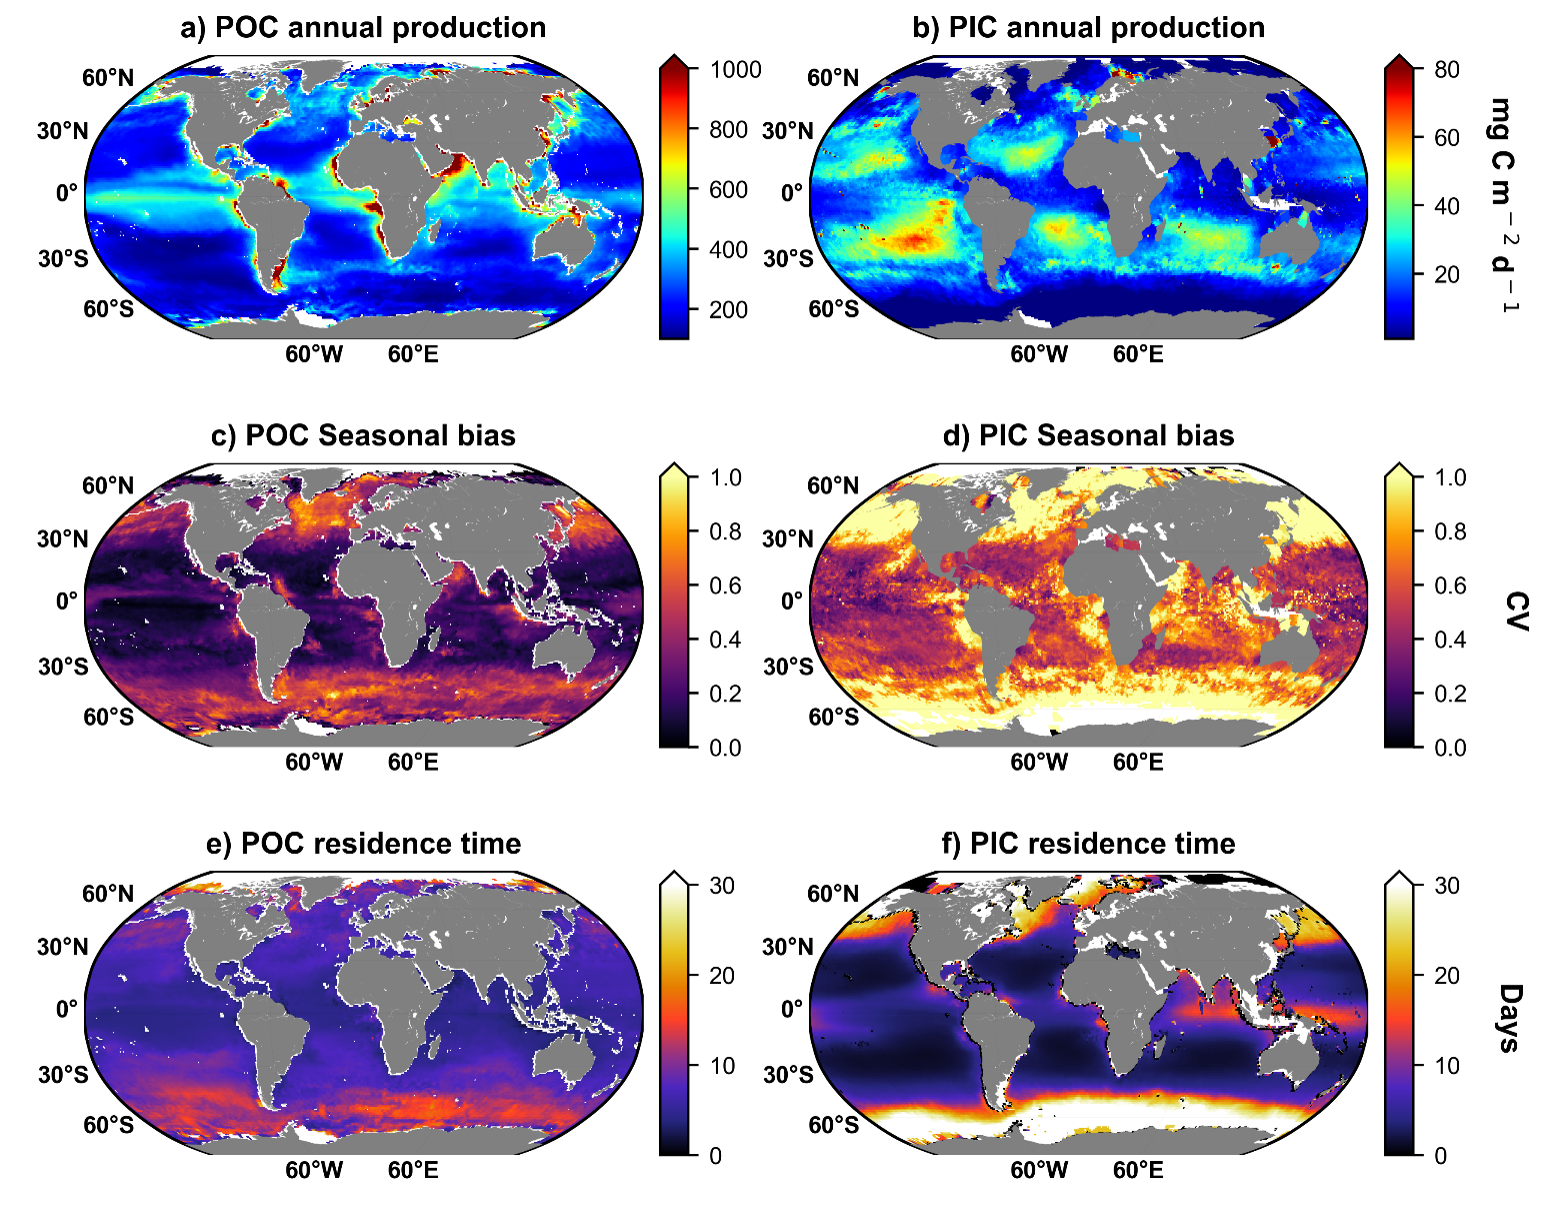
Figure 2Global maps of (a) POC production (NPP) annual mean (mg C m−2 d−1, 1997–2023 annual mean), (b) PIC production annual mean (mg C m−2 d−1, 1998–2023 annual mean), (c) NPP seasonal bias expressed as coefficient of variation () of monthly NPP climatology, (c) PIC production seasonal bias expressed as coefficient of variation () of monthly PIC production climatology, (e) POC residence time (day, 1997–2023 annual mean) and (f) PIC residence time (day, 1998–2023 annual mean). POC and PIC residence time is obtained by dividing the annual standing integrated stock (mg m−2) by annual production (mg C m−2 d−1), results are expressed in days.
3.2 Taxa contribution to the PIC standing stock estimation
At the global scale, coccolithophores PIC standing stock dominates the total estimated PIC standing stock, except in few areas of Equatorial Atlantic (EA), Equatorial Pacific (EP), North Atlantic (NA) and North Pacific (NP), where the pteropods PIC standing stock reach almost 50 % (Fig. 3). Foraminifers PIC standing stock represent less than 10 % of the PIC standing stock, with higher value in the North Atlantic (NA). Regarding the seasonal variation index, coccolithophores are characterised by high seasonal variation in high latitudes (> 30° N and < 30° S), while pteropods' seasonal index is higher only > 30° N, and in the Equatorial Pacific (EP). Foraminifers tend not to reveal any seasonal variation at a global scale, except in the southeastern North Atlantic (NA) (Fig. 3). Note that the depth of integration is different for coccolithophore (100 m) and zooplankton taxa (200 m for Pteropods and Foraminifers, from Knecht et al., 2023). Although coccolithophore integration to 100 over 200 m for pteropods and foraminifers leads to an underestimation of coccolithophore contribution to the global PIC standing stock in a 200 m layer, the general statement that coccolithophore dominates the standing stock remains unchanged. In addition, the foraminifers maximum abundance peak between 0–100 m depth (Chaabane et al., 2024).
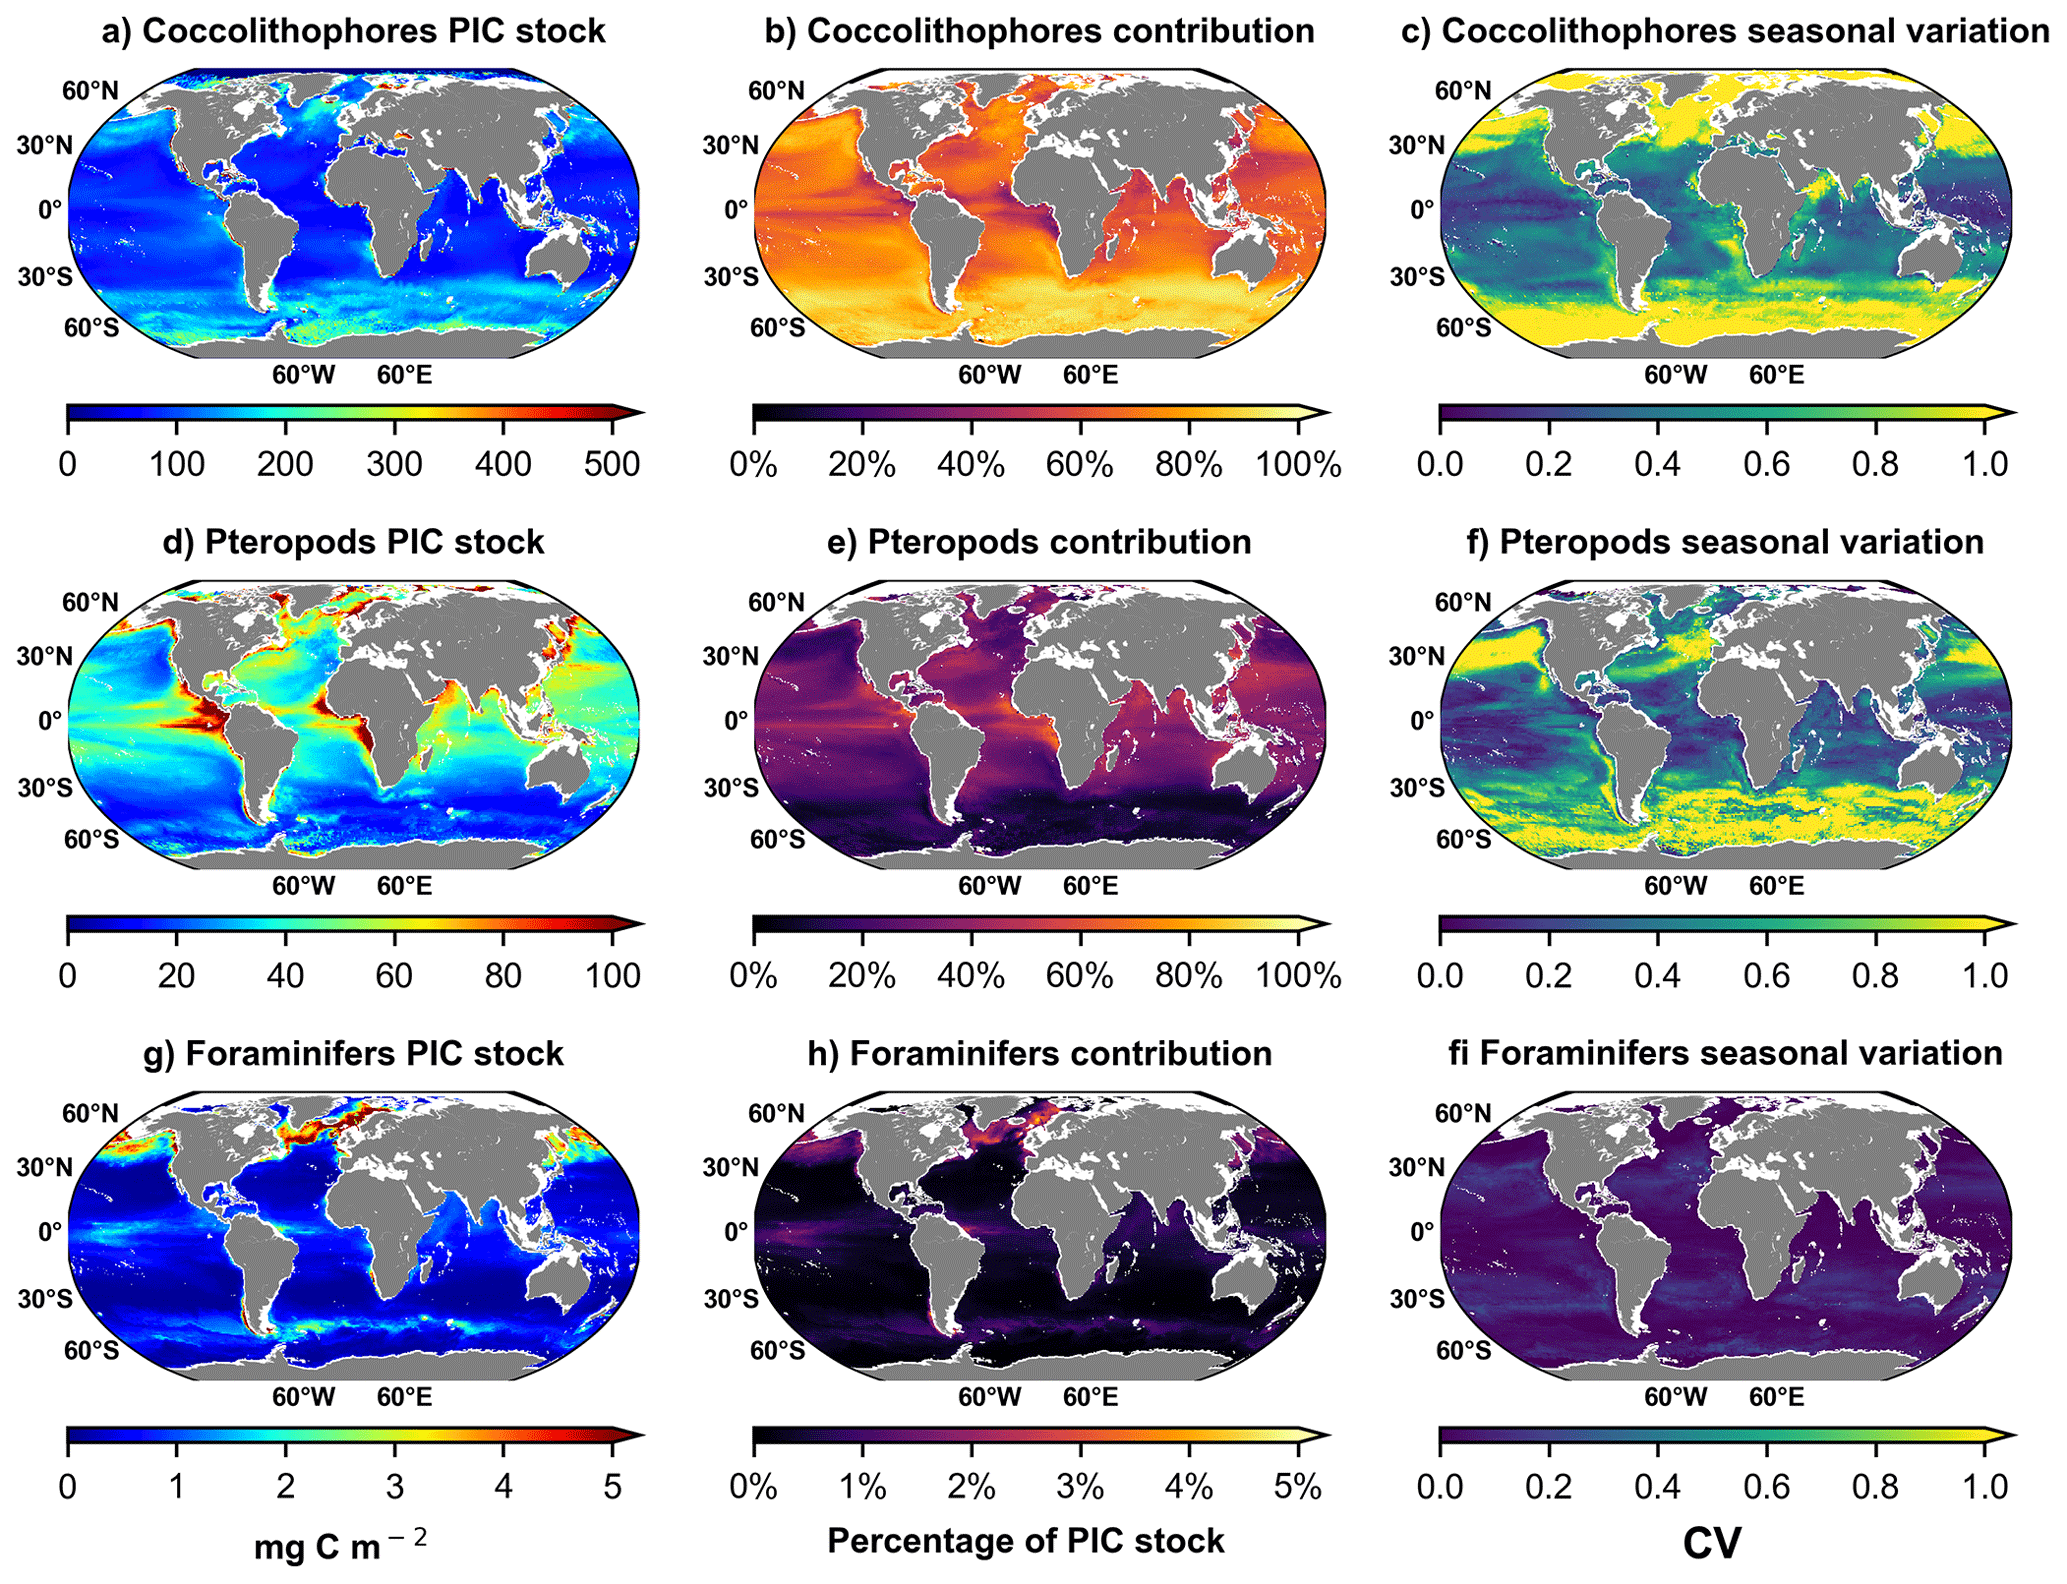
Figure 3Maps of taxa contribution to the total PIC standing stock regrouping the 3 calcifying taxa: Coccolithophore (a, b, c) Pteropods (d, e, f) and Foraminifers (g, h, i). (a, d, g) Maps of annual PIC standing stock for the 3 calcifying taxa. (b, e, h) Maps of annual PIC standing stock contribution for the 3 calcifying taxa. (b, e, h) Maps of annual PIC standing stock for the 3 calcifying taxa. (c, f, i) Maps of temporal variability (seasonal index) of PIC standing stock as measured by the seasonal bias (SB) expressed as coefficient of variation () of monthly standing stock for the 3 calcifying taxa. Note that the depth of integration is different for coccolithophore (100 m) and zooplankton taxa (200 m for Pteropods and Foraminifera, from Knecht et al., 2023).
Satellite observations of coccolithophore blooms, which typically last less than 30 d, suggest that PIC fluxes from sediment traps should be integrated over short deployments rather than longer periods. Short-term sediment traps (less than 30 d) primarily capture fast sedimentation events. Combining these data with monthly satellite climatology helps identify the potential processes involved Despite pteropods and foraminifers contribute to PIC production and deep flux, their seasonality pattern and residence time were not coupled with PIC flux observation, considering short time deployed sediment traps (less than 30 d). In the other hand, other pelagic contributors (Pteropods and foraminifers) are expected to be more peripheral in the export efficiency of the PIC in this study, regarding their respective residence time (more than 30 d for foraminifers and months to year for pteropods). This aspect is the main constraint in the present study. It is assumed that G. huxleyi blooms would be present in the water for an average of 30 d (Hopkins et al., 2015), hence, monthly PIC production climatology coverage map represents the mean monthly conditions. Pelagic calcifiers are characterized by different surface stock and seasonality (Fig. 3) and residence time: less than a month for coccolithophore (Hopkins et al., 2015), a month for foraminifers (Schiebel and Movellan, 2012) and months to years for pteropods (Lalli and Gilmer, 1989; Bednaršek et al., 2012).
The estimate of calcifying taxa PIC stock, including coccolithophores, pteropods, and foraminifera, is not correlated with annual PIC export flux on a global scale (Fig. 4a). These estimates show that coccolithophores dominate the PIC standing stock, followed by pteropods and then foraminifera (Fig. 4). The latitudinal variation in PIC standing stock indicates an overlap between coccolithophore and pteropod PIC standing stock at the equator (Figs. 3b, e and 4b). Coccolithophores and pteropods can contribute roughly equally to the PIC standing stock, but coccolithophores dominate at latitudes above 40°.
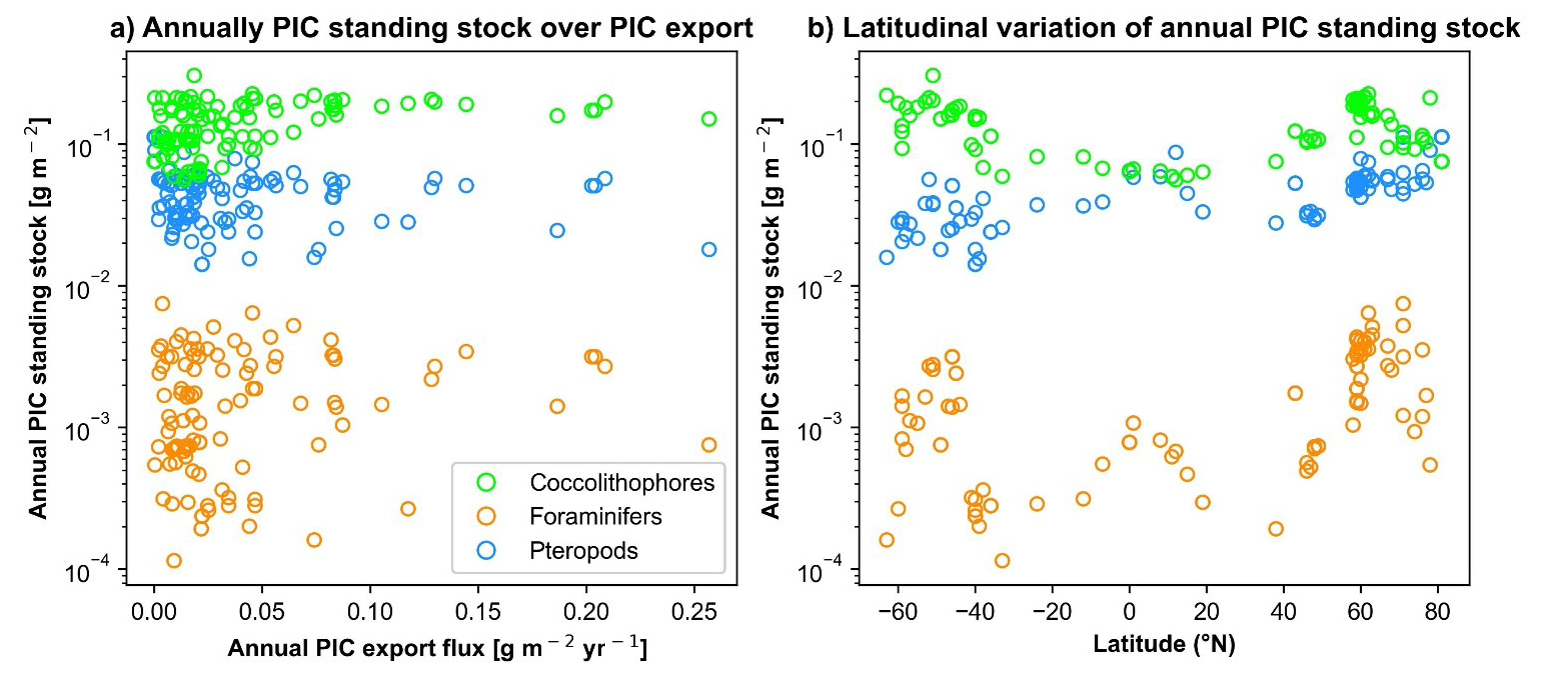
Figure 4(a) Calcifying taxa annual PIC standing stock (g m−2) over annual 234Th-derived PIC flux (g m−2 yr−1). (b) Latitudinal variation of annual PIC standing stock (g m−2) for each calcifying taxa. Coccolithophore PIC standing stock is derived from ocean colours (Balch et al., 2005). Pteropods and foraminifers are extracted from Knecht et al. (2023) supplementary data.
3.3 PIC production, NPP and PIC flux
No significant correlation is observed between log-transformed PIC flux and log-transformed NPP in the upper 100 m (Fig. 5). On average, although Pearson's correlation coefficients are low (R2<0.25), the correlation between PIC flux and NPP is generally higher than that between PIC flux and PIC production (Fig. 5). At the deepest layer (> 4000 m), the correlation between PIC flux and PIC production (R2=0.104) exceeds that between PIC flux and NPP (R2=0.089).
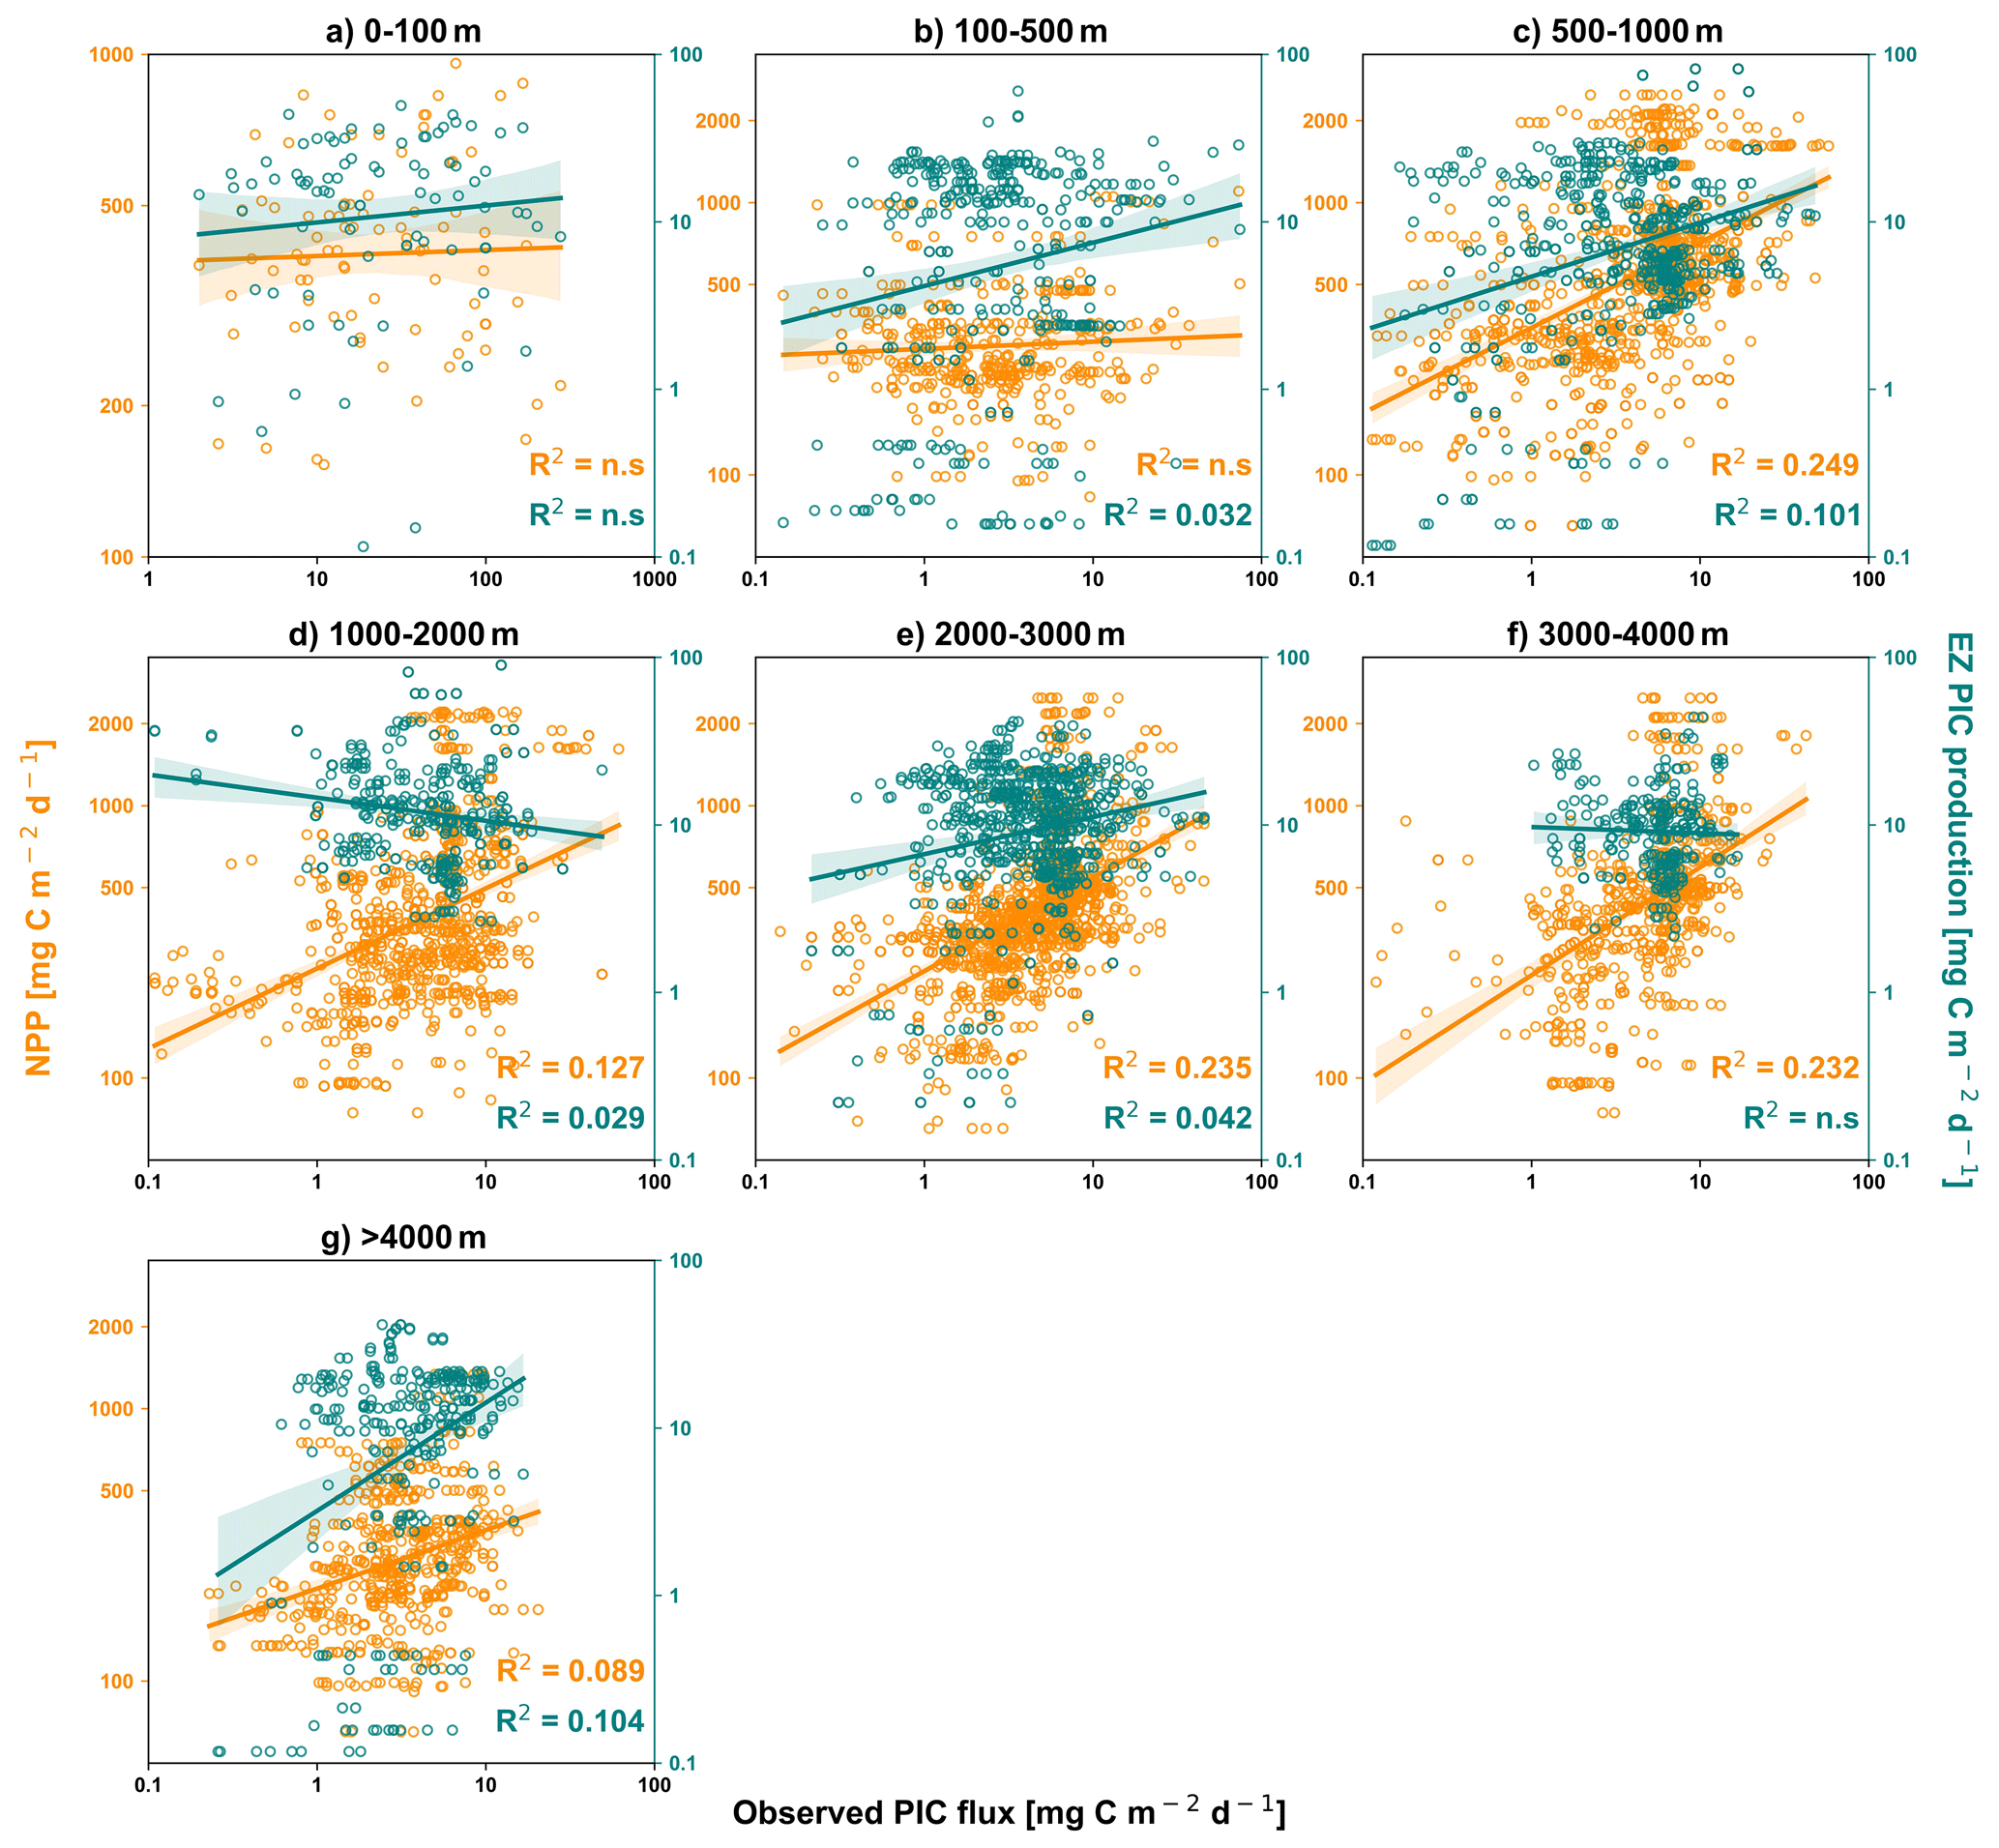
Figure 5Matchup between observed sediment traps PIC flux (x-axis, mg PIC m−2 d−1) and NPP (mg POC m−2 d−1) in orange, and satellite-derived PIC production (mg PIC m−2 d−1) in green (Hopkins and Balch, 2018 model). The different windows correspond to the different layers of depth. Non-significant correlations (p-value > 0.5, Pearson test) are indicated by “n.s.”.
3.4 Correlation between EZ PIC production and deep PIC flux
Most of the RECCAP2 biogeochemical regions have no observations of PIC flux or are insufficient to perform correlation in shallow waters (0–100 m depth). PIC flux established in shallow waters (0–100 m depth) in the North Atlantic was collected during the productive period (May, June, July and August) and does not reflect the EZ PIC production seasonal variation (a non-significant correlation between EZ PIC production and PIC flux has been established, see Table S4). At the global scale, the linear regression and correlation test between EZ PIC production and PIC flux are displayed for the 6 layers of depth and regarding the RECCAP2 biogeochemical regions in the Fig. 6 (see Table S4, for the linear regression parameters). At the global scale, EZ PIC production is not correlated with PIC flux in the upper ocean. However, considering distinct oceanic bioregions (RECCAP2, Fig. 6), in the mesopelagic layer and deeper, significant correlations between EZ PIC production and deep PIC flux are observed in the North Atlantic (100 to 4000 m) and the Southern Ocean (100–500 and 1000–2000 m). North Indian Ocean regions (subtropical areas) are also characterized by PIC production positively correlated with deep PIC flux (500 to 4000 m, Fig. 6).
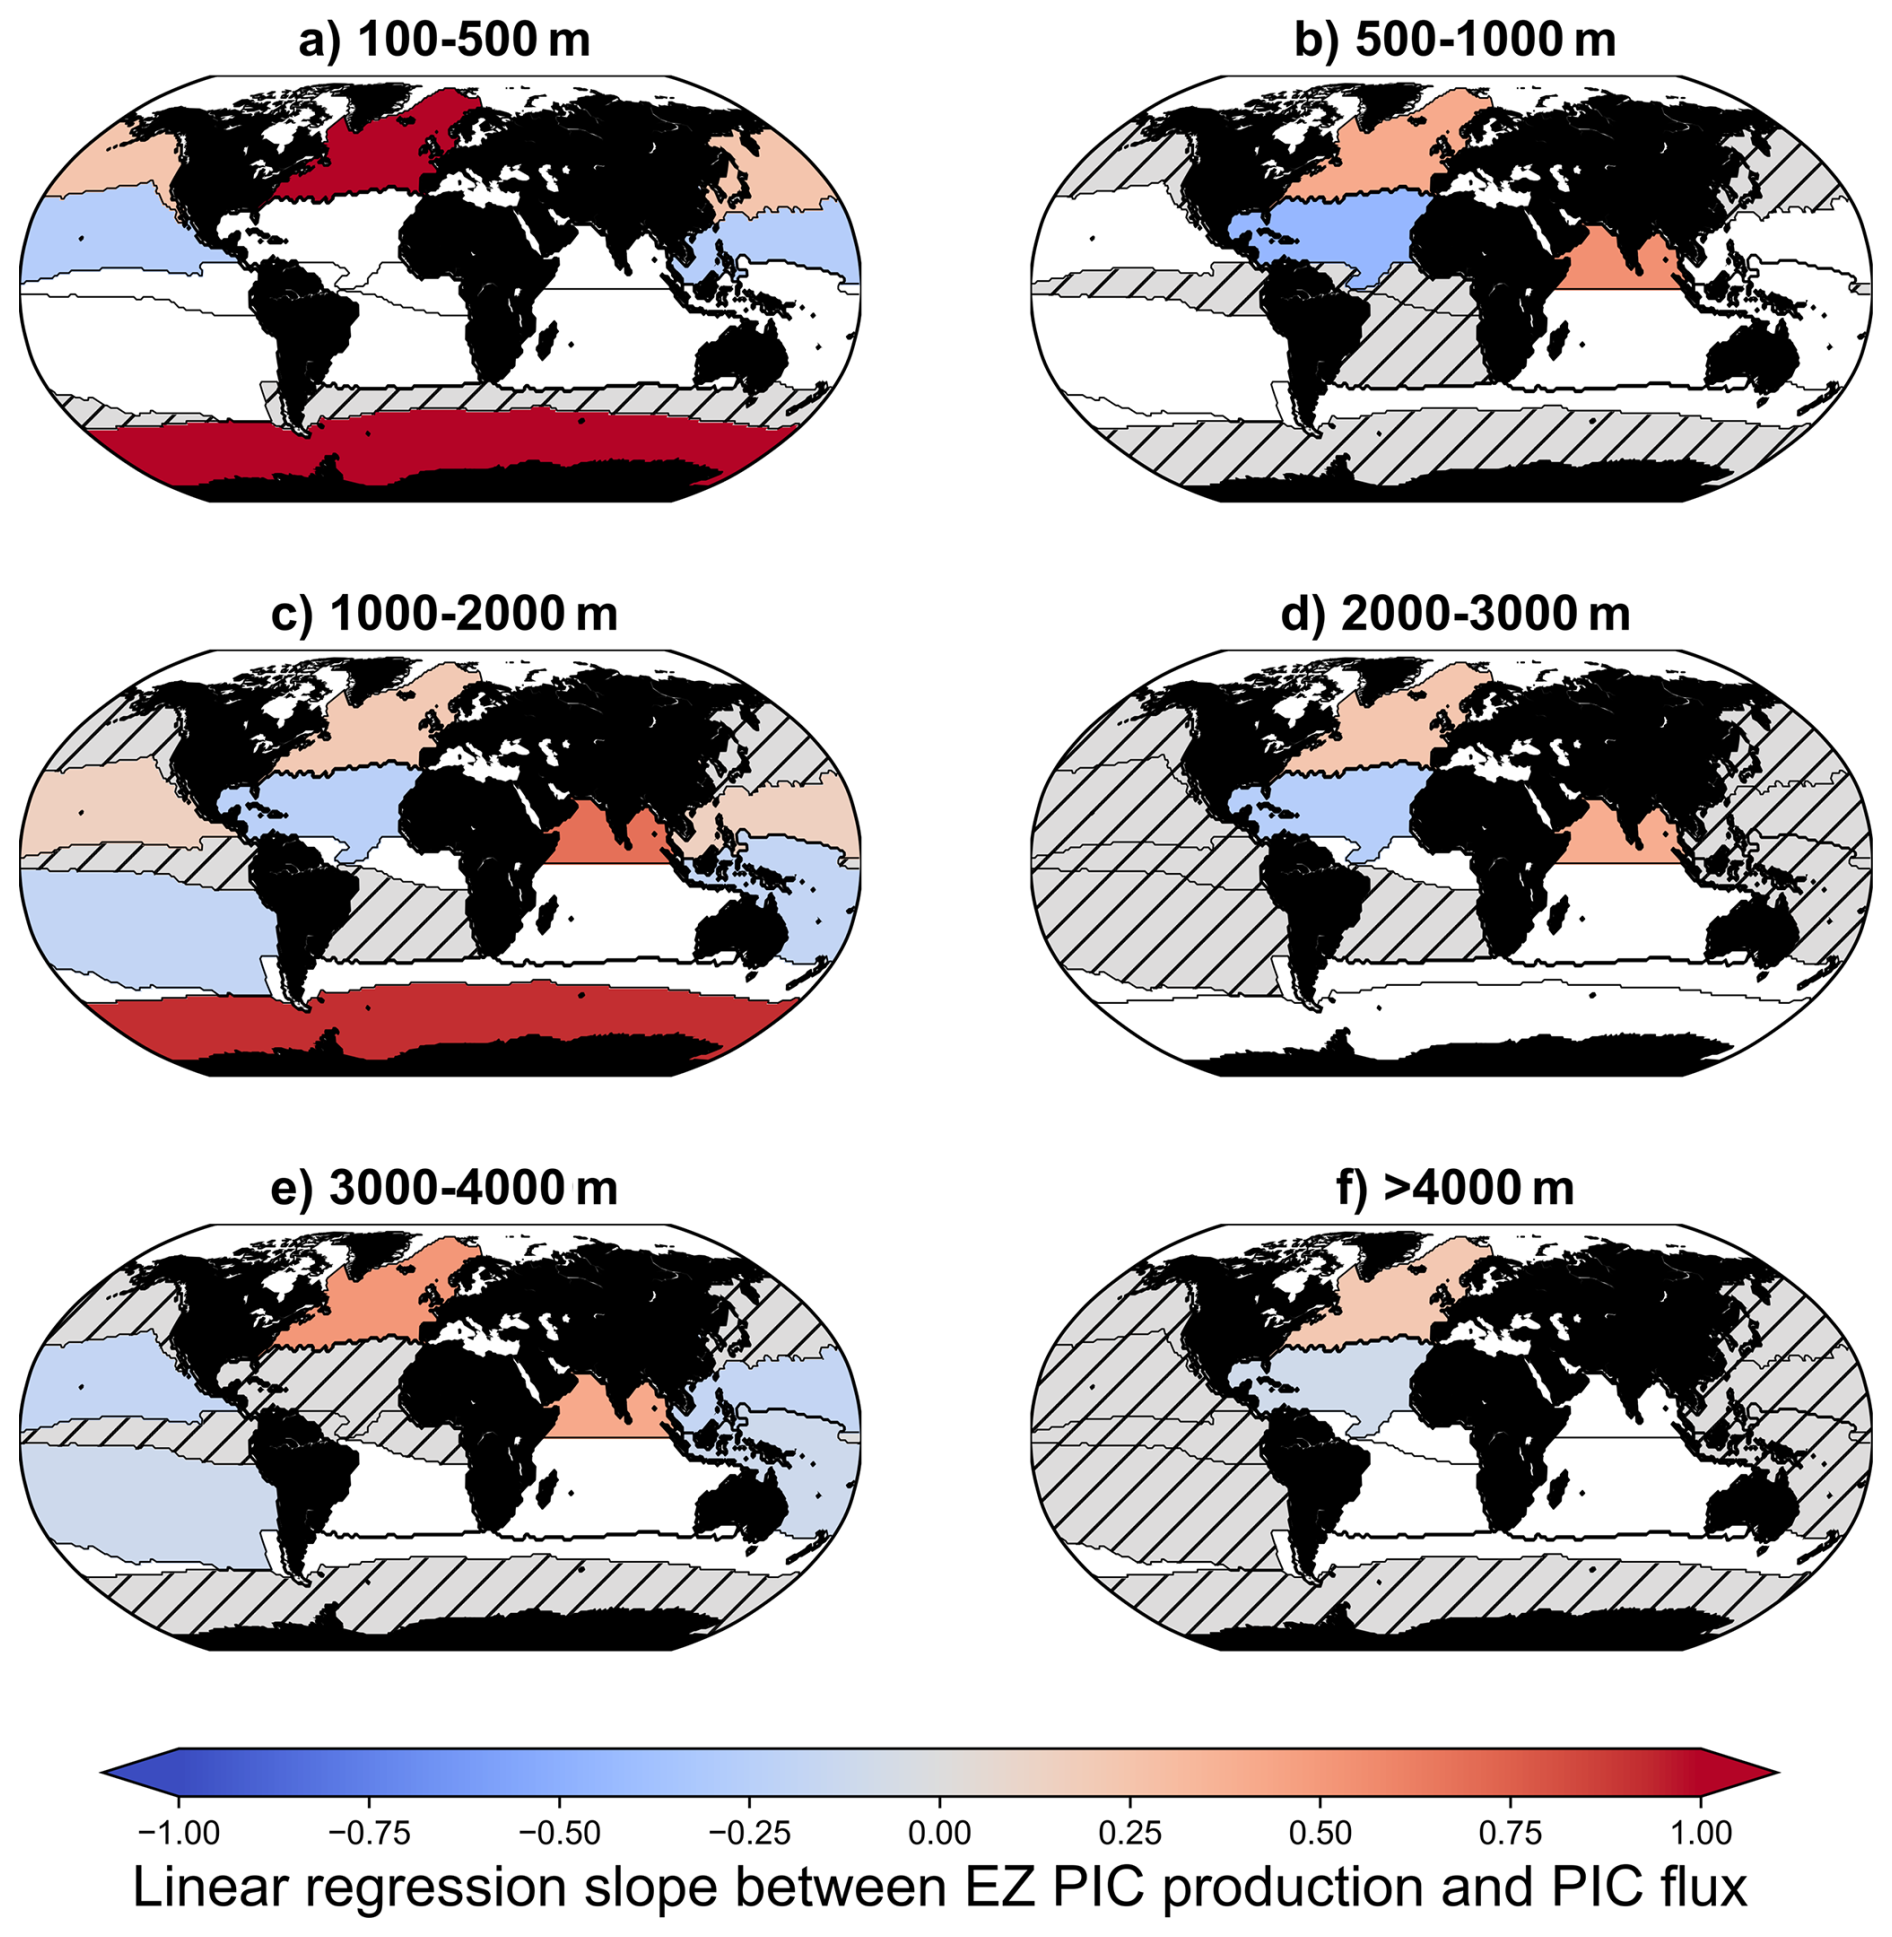
Figure 6Map of linear regression slope between EZ PIC production and PIC flux according to the RECCAP2 regions and depth layers. Hatched grey areas correspond to regions and/or depths where the correlation coefficient is non-significant at a 95 % threshold (p-value < 0.05). White areas correspond to regions where no data are available.
The PIC export efficiency (PIC Eeff) corresponds to the PIC export flux divided by the EZ PIC production. A latitudinal variability trend could be overlapped to both NPP and PIC production seasonal bias (Fig. 7a). Regions above 40°, are characterized by higher PIC Eeff and lower PIC Teff compared to subtropics and equatorial areas (Fig. 7a). The higher PIC production seasonal bias in the euphotic layer coincides with higher normalized PIC Eeff, but lower PIC Teff (Fig. 7a). The model output of Nowicki et al. (2022a), estimated that the contribution to the gravitational carbon pump of zooplankton fecal pellets and sinking phytoplankton aggregates were respectively of 85 % and 15 %. When mapped of 1° by 1° grid map, zooplankton fecal pellets and sinking phytoplankton aggregates contribution are characterized by a significant latitudinal pattern (Fig. 7). The seasonality of NPP and PIC production can be overlapped with aggregates' contribution to the gravitational pump (estimated by Nowicki et al., 2022a), as shown in Fig. 7b. The contribution of fecal pellets to the export (estimated by Nowicki et al., 2022a) increases continuously from 40° to the equator, while aggregates' contribution to the export decreases. The higher contribution of fecal pellets to the export coincides with low normalized PIC Eeff, but high PIC Teff (Fig. 7b).
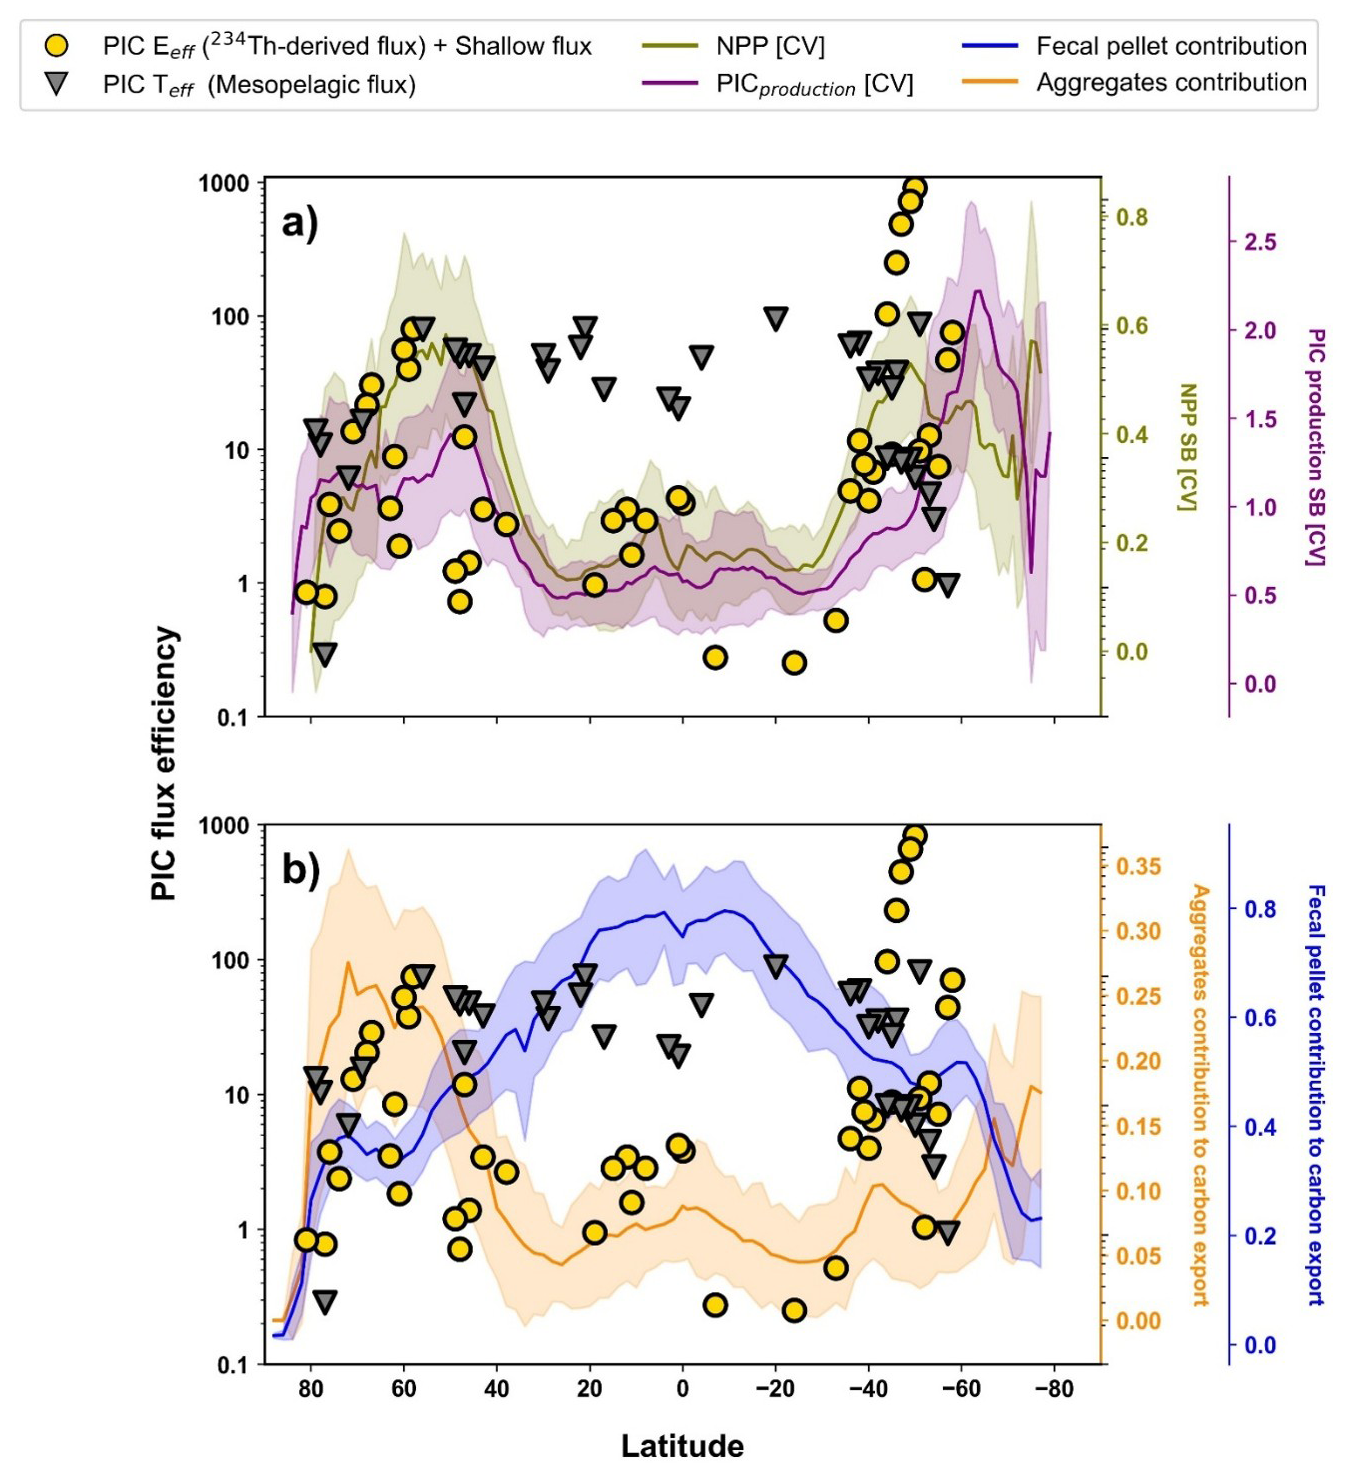
Figure 7(a) Annual PIC production seasonal bias (C.V) in purple and NPP seasonal bias (C.V) in green. Depicted in the left y-axis: The yellow circles represent the latitudinal annual mean PIC Export efficiency (PIC Eeff) from shallow sediment traps (0–100 m) and 234Th-derived flux over the latitude (x-axis). The grey triangles represent the latitudinal annual mean PIC Transfert efficiency (PIC Teff) from mesopelagic sediment traps (100–1000 m). (b) Annual Fecal pellets contribution to the total carbon export (Nowicki et al., 2022a) in blue and Annual aggregates contribution to the total carbon export (Nowicki et al., 2022a) in orange. Depicted in the left y-axis: The yellow circles represent the latitudinal annual mean PIC Export efficiency (PIC Eeff) from shallow sediment traps (0–100 m) and 234Th-derived flux over the latitude (x-axis). The grey triangles represent the latitudinal annual mean PIC Transfert efficiency (PIC Teff) from mesopelagic sediment traps (100–1000 m).
4.1 Mesopelagic PIC Flux and Ballast Effect Hypothesis
The ballast hypothesis originates from correlations between POC flux and mineral fluxes (opal and CaCO3) in deep sediment traps (Klaas and Archer, 2002). However, CaCO3 export flux in the upper ocean does not correlate with transfer efficiency (Henson et al., 2012), suggesting that CaCO3 does not significantly protect POC from degradation at mesopelagic depths. Ecosystem structure, rather than mineral ballast, might be the primary control of the biological carbon pump. Francois et al. (2002) proposed the “packaging factor” theory, suggesting that highly CaCO3-productive systems also contain organisms that produce sinking fecal pellets, which efficiently deliver organic carbon to deep waters (e.g., Nowicki et al., 2022a). In subtropical and equatorial upwelling regions, export flux is not always associated with mineral ballast (Le Moigne et al., 2014), highlighting spatial variability in biomineral inclusion and supporting the role of ecosystem structure and phytoplankton phenology. On a global scale, our results demonstrate that EZ PIC production is not correlated with PIC flux in the upper ocean. However, in specific bioregions (RECCAP2), significant correlations exist between EZ PIC production and deep PIC flux (North Atlantic, Southern Ocean, and North Indian Ocean; Fig. 6; Table S4). These observations suggest that ecosystem structure and phenology are more important than the ballast effect in controlling PIC Eeff and PIC Teff.
4.2 Taxa Contribution to Global PIC Stock and Production
Global CaCO3 production estimates remain uncertain, ranging from 0.7 to 4.7 Pg C yr−1 (Berelson et al., 2007; Buitenhuis et al., 2019; Lee, 2001). Contributions from coccolithophores, foraminifers, and pteropods vary widely. Pteropods are estimated to contribute 0.87–4.2 Pg C yr−1, representing 20 %–89 % of global CaCO3 production (Gangstø et al., 2008; Lebrato et al., 2010; Buitenhuis et al., 2019). Foraminifers contribute 0.036–0.14 Pg C yr−1, corresponding to 2 %–4 % of global CaCO3 production (Schiebel, 2002; Lebrato et al., 2010; Buitenhuis et al., 2019). Coccolithophores are estimated to account for ∼90 % of CaCO3 production (Ziveri et al., 2023; Kruijt et al., 2026). Deep sediment traps recover significant amounts of foraminifers and pteropods (Table 1; Fig. 3 in Neukermans et al., 2023), whereas coccolithophores dominate surface stocks and production. These observations remain poorly understood in terms of taxon-specific contributions and highlight the need for additional proof-of-concept and process-based studies to better quantify ecosystem-specific controls on PIC production and export. This study demonstrates that, at the global scale, coccolithophores dominate the PIC standing stock. Moreover, seasonal variability in coccolithophore production and biomass appears to play a central role in regulating PIC export efficiency (Fig. 7).
4.3 Influence of Ecosystem Structure on PIC Export
The fraction of exported phytoplankton production that is remineralized is mainly influenced by ecosystem structure, which is linked to the seasonal amplitude of NPP (Fig. 7a). Blooms of diatoms and coccolithophores (e.g., G. huxleyi), which are expected to induce intense particle sedimentation, occur mostly in regions with high annual mean NPP and large seasonal amplitudes (Fig. 7a). In contrast, nanoplankton and picoplankton dominate global production in oligotrophic areas (low latitudes) characterized by low seasonal NPP amplitude (Lima et al., 2014). The ballast effect hypothesis, driven by biomineral inclusion (calcite and biogenic silica), has long been considered a mechanism enhancing particle export efficiency (PEeff). In this study, PIC export efficiency (PIC Eeff; the proportion of PIC production exported from the surface) is generally higher north of 40° N and south of 40° S (temperate and subpolar regions). PIC transfer efficiency (PIC Teff; the proportion of exported PIC reaching the deep ocean) is higher between 40° N and 40° S (subtropical regions) and exhibits a pattern like that of zooplankton fecal pellet contributions to the gravitational pump (Fig. 7b). Considering the main particle types involved in the gravitational pump (Nowicki et al., 2022a), phytoplankton aggregates may enhance PIC Eeff, whereas zooplankton fecal pellets may enhance PIC Teff. The following sections explore the mechanisms underlying these patterns.
4.4 “Biological Gatekeeper” of the mesopelagic PIC Flux
4.4.1 Packaging Factor and Aggregate Contribution
The packaging factor theory (Francois et al., 2002) suggests that subtropical and equatorial CaCO3-rich ecosystems produce fast-sinking fecal pellets, thereby enhancing PIC export. In this study, the particle-dependent export model (Nowicki et al., 2022a; Fig. 7b) shows that fecal pellet contributions are higher in these CaCO3-rich ecosystems (subtropical and equatorial regions). However, observed PIC fluxes are lower in subtropical and equatorial regions despite higher production, challenging the hypothesis that CaCO3 packaged in fecal pellets is protected from dissolution. Opal-dominated systems (temperate and subpolar regions) exhibit high PIC fluxes, suggesting that labile aggregates may also enhance PIC transfer and export efficiency (PIC Eeff). Overall, PIC production in the euphotic layer appears to be decoupled from PIC export and transfer efficiencies (PIC Eeff and PIC Teff). Upper-ocean PIC loss is primarily attributed to biologically mediated dissolution (Morse et al., 2006; Friis et al., 2006; Buitenhuis et al., 2019; Sulpis et al., 2021; Dean et al., 2024). Although zooplankton and bacterial activity decrease with depth (Hernández-León et al., 2020), epipelagic and mesopelagic grazing still appears to contribute to PIC loss.
4.4.2 Hypothetical Processes of Biological-Mediated PIC Dissolution
Heterotrophic bacteria colonizing CaCO3 particles appear to induce minimal dissolution, suggesting a limited role in PIC loss during sinking (Bissett et al., 2011). Similarly, the increase in hydrostatic pressure experienced by G. huxleyi aggregates during sedimentation does not significantly enhance calcite dissolution (Tamburini et al., 2021). Experimental and modeling studies also show that calcite is largely preserved during zooplankton gut passage, with dissolution generally low or negligible across various species and conditions (Harris, 1994; Honjo, 1976; Roth et al., 1975; Langer et al., 2007; Jansen and Wolf-Gladrow, 2001; Antia et al., 2008; Toullec et al., 2022). Despite lower contributions of fecal pellets to the gravitational pump at high latitudes (Fig. 7b), PIC export efficiency (PIC Eeff) remains elevated in these regions (temperate and subpolar areas), suggesting that additional factors, likely related to plankton community composition and phenology, play an important role in controlling PIC preservation and export.
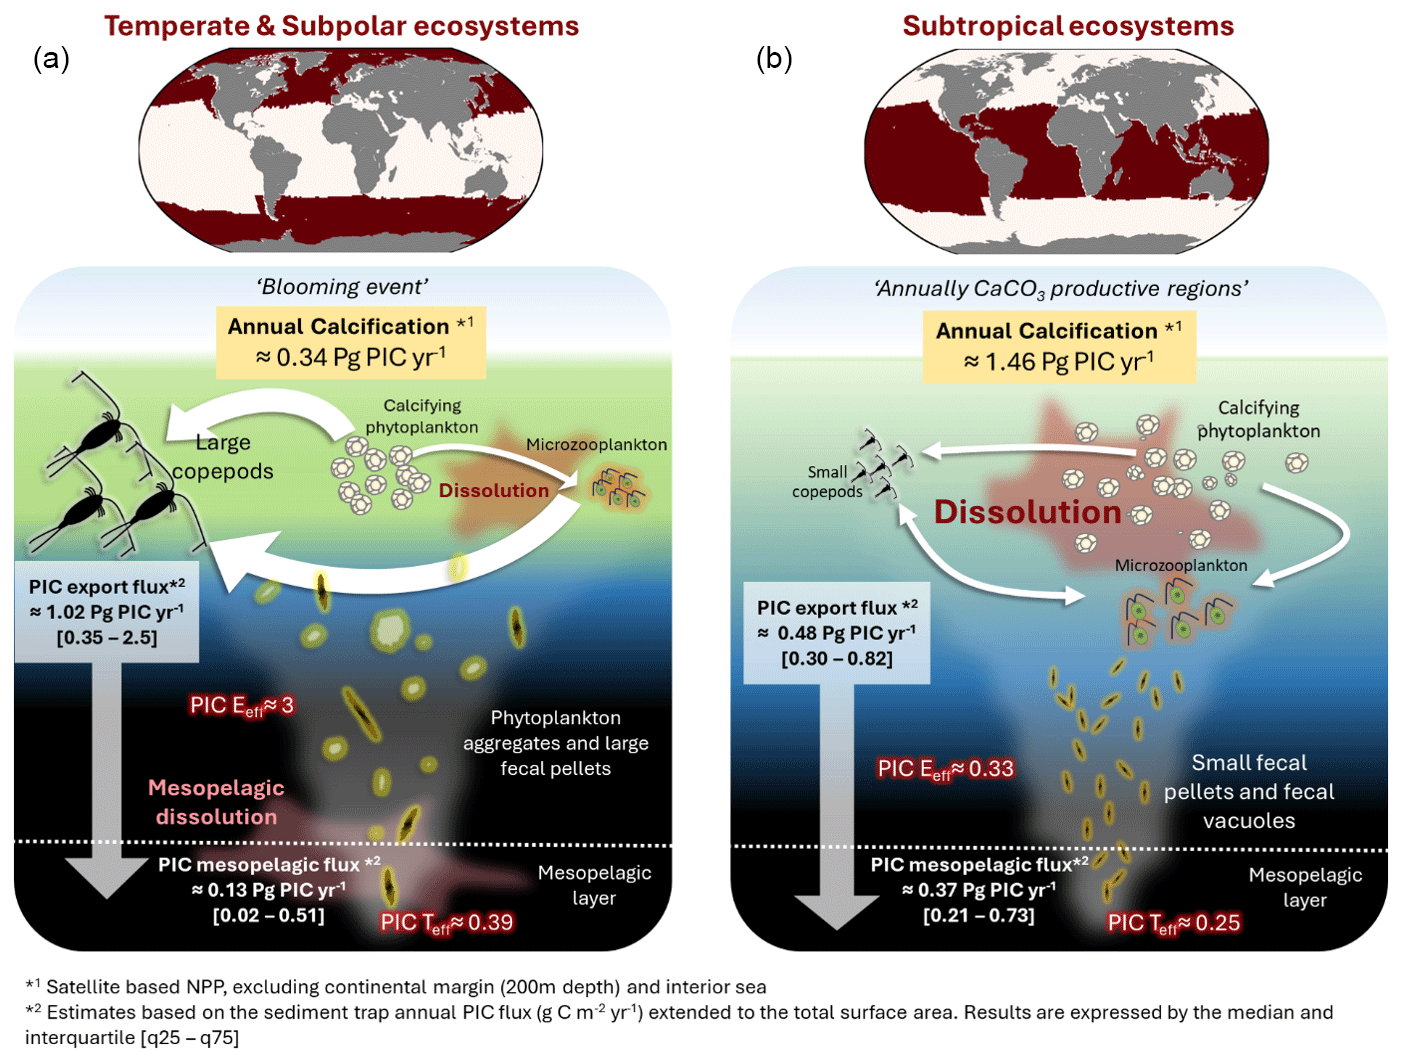
Figure 8Synthesis of the potential PIC pathway through the water column, in two distinct ecosystems: (a) Subtropical ecosystems (subtropical gyres and equatorial upwellings). (b) Temperate zone (North Atlantic, North Pacific and subpolar regions). The white arrows represent the trophic transfer between the different planktonic compartments (Predator prey), and double arrow means that both compartments could be both prey and predator each other. Small copepods correspond to individual body sizes ranging from 200 µm to 2 mm; Microzooplankton (mostly protists, <200 µm) represent the flagellates and ciliates community; Large copepods correspond to individual body sizes larger than 2 mm (mostly large calanoid). Note that microzooplankton could be heterotrophic, autotrophic or mixotrophic.
4.5 Ecosystem control on PIC flux
Microzooplankton (<200 µm) play a central role in regulating primary producer biomass and facilitating carbon export via fecal vacuoles or aggregates (McNair et al., 2021; Calbet and Landry, 2004). Their grazing intensity exhibits strong latitudinal variation, ranging from 59 % of annual primary production in temperate-polar regions to 75 % in tropical-subtropical regions (Calbet and Landry, 2004). These patterns align with the observed latitudinal distribution of PIC export efficiency (PIC Eeff) and PIC transfer efficiency (PIC Teff) (Fig. 7). In the North Atlantic, microzooplankton consume 288–589 mg C m−2 d−1 in the mixed layer during mid-summer, representing 39 %–115 % of local phytoplankton production (Burkill et al., 1993), highlighting their substantial contribution to particle processing and carbon flux. Blooming coccolithophores, such as G. huxleyi, can temporarily escape microzooplankton grazing during bloom onset through predation-avoidance traits, including colony formation, increased cell size, spines, or toxin production (Irigoien et al., 2005; Monteiro et al., 2016). Conversely, subtropical and equatorial regions, characterized by low seasonal variability in coccolithophore biomass and continuous grazing pressure, experience sustained PIC loss, possibly due to dissolution within microzooplankton vacuoles (Antia et al., 2008; Dean et al., 2024). Large zooplankton may indirectly enhance PIC preservation by suppressing microzooplankton biomass and repackaging coccoliths into fast-sinking fecal pellets (Nejstgaard et al., 1994). Indeed, a mesocosm study demonstrated that ingestion rates of the large copepod Calanus finmarchicus were similar during blooms of diatoms and G. huxleyi (Nejstgaard et al., 1994). However, C. finmarchicus biomass increased threefold more in mesocosms dominated by G. huxleyi compared to those dominated by diatoms at similar algal biomass (Nejstgaard et al., 1994). The authors suggested that, during bloom conditions, copepods preferentially graze on microzooplankton. The incorporation of coccoliths into large fecal pellets (produced by mesozooplankton) likely results from passive, non-selective feeding behavior (e.g., current feeding), rather than from selective grazing on coccolithophores. Our dataset reveals a positive correlation between PIC production and PIC flux in the North Atlantic across all depth layers (Fig. 6), emphasizing the role of zooplankton-mediated carbon transfer (Hernández-León et al., 2020). Zooplankton functional traits vary among bioregions (Benedetti et al., 2023): temperate and subpolar regions are dominated by large, detritivorous or omnivorous copepods that feed passively (current- or cruise-feeders; Fig. 5 in Benedetti et al., 2023), whereas subtropical and equatorial regions are dominated by smaller, carnivorous copepods that feed actively (ambush- or current-ambush-feeders). Grazing by these distinct functional groups shapes phytoplankton biomass and community structure, ultimately influencing the efficiency and depth of PIC export (Le Quéré et al., 2016; Vallina et al., 2014; Fig. 8). The present study suggests that, in temperate and subpolar ecosystems, large copepods may enhance PIC export efficiency in two ways: (1) by repackaging coccoliths into fecal pellets through passive current feeding; and (2) by exerting strong grazing pressure on microzooplankton, thereby indirectly reducing CaCO3-mediated dissolution within microzooplankton vacuoles (Dean et al., 2024; Fig. 8). In contrast, marine snow aggregates may create microenvironments that promote PIC dissolution in the mesopelagic layer, potentially explaining the observed decrease from PIC Eeff to PIC Teff in temperate ecosystems (Fig. 8). Subtropical regions, on the other hand, exhibit continuous grazing, efficient nutrient recycling, and more complex food webs. Microzooplankton strongly regulate primary producer biomass and particulate organic carbon transfer, a fraction of which may subsequently be exported as fecal pellets or aggregates (McNair et al., 2021). This ecological context may favor CaCO3-mediated dissolution within microzooplankton vacuoles (Fig. 8), potentially reducing PIC export efficiency (PIC Eeff).
This study integrates the main conceptual frameworks currently proposed in the field to interpret the observed patterns in PIC export efficiency (PIC Eeff) and biologically mediated CaCO3 dissolution. Our results highlight that variability in PIC Eeff and the mechanisms regulating CaCO3 dissolution remain insufficiently constrained, particularly across contrasting biogeographical regimes. These findings underscore the need for targeted proof-of-concept and process-based studies to better quantify ecosystem-specific controls on PIC export. Improving this mechanistic understanding is essential for refining predictions of the oceanic carbon cycle under ongoing environmental changes.
In this study, the “packaging factor” theory is proposed as an important driver of the discrepancy between estimated PIC production and export flux across distinct oceanic regions. Despite the PIC POC production ratio being twice as high in subtropical regions compared to temperate and subpolar regions, PIC export efficiency (PIC Eeff) is estimated to be tenfold lower and PIC transfer efficiency (PIC Teff) 1.5-fold lower. Our results suggest that zooplankton functional diversity and biogeography may explain the contrasting patterns of CaCO3 export efficiency, through differences in dissolution and preservation within particles. Such processes could substantially contribute to total downward carbon export and associated nutrient fluxes. However, only a limited number of experimental studies have directly demonstrated the effect of zooplankton functional diversity on CaCO3 dissolution. To test and refine the hypothesis proposed here, there is a strong need for experimental data and in situ observations addressing both mesozooplankton and microzooplankton grazing dynamics and CaCO3 fluxes.
In the context of surface ocean warming and acidification, phytoplankton losses due to microzooplankton grazing in eutrophic waters are expected to increase (Chen et al., 2012), potentially attenuating the carbonate pump in temperate regions. In addition, POC export is unlikely to respond uniformly across high-latitude regions to future changes in ballast availability, which may also affect the biological carbon pump. Data compilations and model outputs indicate that coccolithophores tend to become less calcified relative to growth under increasing CO2 concentrations (Krumhardt et al., 2017, 2019). End-of-century CO2 projections suggest an approximately 11 % decline in global oceanic calcification relative to preindustrial levels (Krumhardt et al., 2019). Such changes in surface ocean dynamics are expected to alter the future balance of surface alkalinity and CO2 exchange between the ocean and atmosphere (Planchat et al., 2024; Tyrrell, 2008; Volk and Hoffert, 1985).
The author confirms that the data and code supporting the findings of this study are available at https://github.com/JordanToullec/egusphere-2025-1108_script (last access: 25 February 2025; https://doi.org/10.5281/zenodo.21033101, Toullec, 2026a), https://github.com/JordanToullec/EGUSPHERE-2025-1108_Datasets (last access: 25 February 2025, Toullec, 2026b) and its Supplement.
The supplement related to this article is available online at https://doi.org/10.5194/bg-23-4361-2026-supplement.
The contact author has declared that none of the authors has any competing interests.
Publisher's note: Copernicus Publications remains neutral with regard to jurisdictional claims made in the text, published maps, institutional affiliations, or any other geographical representation in this paper. The authors bear the ultimate responsibility for providing appropriate place names. Views expressed in the text are those of the authors and do not necessarily reflect the views of the publisher.
The author sincerely thanks the anonymous referees for the time dedicated to reviewing this manuscript, especially regarding the English language editing.
Jordan Toullec worked on this study while he was a post-doctorate fellow funded by CARBOCEAN ERC project: ERC-StG2019-853516. Jordan Toullec is now a post-doctorate fellow funded by CLIMArcTIC PPR project: “Océan et Climat” Défi 2: Intensifier les recherches dans des océans polaires en pleine mutation et aux enjeux géostratégiques majeurs.
This paper was edited by Carolin Löscher and reviewed by two anonymous referees.
Armstrong, R. A., Lee, C., Hedges, J. I., Honjo, S., and Wakeham, S. G. A new, mechanistic model for organic carbon fluxes in the ocean based on the quantitative association of POC with ballast minerals, Deep-Sea Res. Pt. II, 49, 219–236. 2001
Antia, A. N., Suffrian, K., Holste, L., Müller, M. N., Nejstgaard, J. C., Simonelli, P., Carotenuto, Y., and Putzeys, S.: Dissolution of coccolithophorid calcite by microzooplankton and copepod grazing, Biogeosciences Discuss., 5, 1–23, https://doi.org/10.5194/bgd-5-1-2008, 2008.
Antoine, D. and Morel, A.: Oceanic primary production: 1. Adaptation of a spectral light-photosynthesis model in view of application to satellite chlorophyll observations, Global Biogeochem. Cy., 10, 43–55, https://doi.org/10.1029/95GB02831, 1996.
Balch, W. M. and Mitchell, C.: Remote sensing algorithms for particulate inorganic carbon (PIC) and the global cycle of PIC, Earth-Sci. Rev., 239, 104363, https://doi.org/10.1016/j.earscirev.2023.104363, 2023.
Balch, W. M., Kilpatrick, K. A., Holligan, P., Harbour, D., and Fernandez, E.: The 1991 coccolithophore bloom in the central North Atlantic. 2. Relating optics to coccolith concentration, Limnol. Oceanogr., 41, 1684–1696, https://doi.org/10.4319/lo.1996.41.8.1684, 1996.
Balch, W. M., Gordon, H. R., Bowler, B. C., Drapeau, D. T., and Booth, E. S.: Calcium carbonate measurements in the surface global ocean based on Moderate-Resolution Imaging Spectroradiometer data, J. Geophys. Res.-Oceans, 110, https://doi.org/10.1029/2004JC002560, 2005.
Balch, W. M., Drapeau, D. T., Bowler, B. C., Lyczskowski, E., Booth, E. S., and Alley, D.: The contribution of coccolithophores to the optical and inorganic carbon budgets during the Southern Ocean Gas Exchange Experiment: New evidence in support of the “Great Calcite Belt” hypothesis, J. Geophys. Res.-Oceans, 116, https://doi.org/10.1029/2011JC006941, 2011.
Balch, W. M., Bowler, B. C., Drapeau, D. T., Lubelczyk, L. C., and Lyczkowski, E.: Vertical Distributions of Coccolithophores, PIC, POC, Biogenic Silica, and Chlorophyll a Throughout the Global Ocean, Global Biogeochem. Cy., 32, 2–17, https://doi.org/10.1002/2016GB005614, 2018.
Barton, A. D., Pershing, A. J., Litchman, E., Record, N. R., Edwards, K. F., Finkel, Z. V., Kiørboe, T., and Ward, B. A.: The biogeography of marine plankton traits, Ecol. Lett., 16, 522–534, https://doi.org/10.1111/ele.12063, 2013.
Bednaršek, N., Možina, J., Vogt, M., O'Brien, C., and Tarling, G. A.: The global distribution of pteropods and their contribution to carbonate and carbon biomass in the modern ocean, Earth Syst. Sci. Data, 4, 167–186, https://doi.org/10.5194/essd-4-167-2012, 2012.
Benedetti, F., Wydler, J., and Vogt, M.: Copepod functional traits and groups show divergent biogeographies in the global ocean, J. Biogeogr., 50, 8–22, https://doi.org/10.1111/jbi.14512, 2023.
Berelson, W. M., Balch, W. M., Najjar, R., Feely, R. A., Sabine, C., and Lee, K.: Relating estimates of CaCO3 production, export, and dissolution in the water column to measurements of CaCO3 rain into sediment traps and dissolution on the sea floor: A revised global carbonate budget, Global Biogeochem. Cy., 21, https://doi.org/10.1029/2006GB002803, 2007.
Bissett, A., Neu, T. R., and de Beer, D.: Dissolution of Calcite in the Twilight Zone: Bacterial Control of Dissolution of Sinking Planktonic Carbonates Is Unlikely, PLOS ONE, 6, e26404, https://doi.org/10.1371/journal.pone.0026404, 2011.
Brown, C. W. and Yoder, J. A.: Coccolithophorid blooms in the global ocean, J. Geophys. Res.-Oceans, 99, 7467–7482, 1994.
Buitenhuis, E. T., Le Quéré, C., Bednaršek, N., and Schiebel, R.: Large Contribution of Pteropods to Shallow CaCO3 Export, Global Biogeochem. Cy., 33, 458–468, https://doi.org/10.1029/2018GB006110, 2019.
Burkill, P. H., Edwards, E. S., John, A. W. G., and Sleigh, M. A.: Microzooplankton and their herbivorous activity in the northeastern Atlantic Ocean, Deep-Sea Res. Pt II, 40, 479–493, https://doi.org/10.1016/0967-0645(93)90028-L, 1993.
Buesseler, K. O., Lamborg, C. H., Boyd, P. W., Lam, P. J., Trull, T. W., Bidigare, R. R., Bishop, J. K. B., Casciotti, K. L., Dehairs, Elskens, M., Honda, M., Karl, D. M., Siegel, D. A., Silver, M. W., Steinberg, D. K. Valdes, J., Van Mooy, B., and Wilson, S.: Revisiting carbon flux through the ocean's twilight zone, Science, 316, 567–570, 2007.
Calbet, A. and Landry, M. R.: Phytoplankton growth, microzooplankton grazing, and carbon cycling in marine systems, Limnol. Oceanogr., 49, 51–57, https://doi.org/10.4319/lo.2004.49.1.0051, 2004.
Chaabane, S., de Garidel-Thoron, T., Meilland, J., Roche, R. E., de Nooijer, L. J., Brummer, G.-J. A., Kucera, M., and Thibodeau, B.: Migrating is not enough for modern planktonic foraminifera in a changing ocean, Nature, 636, 390–396, https://doi.org/10.1038/s41586-024-08191-5, 2024.
Chaffron, S., Delage, E., Budinich, M., Vintache, D., Henry, N., Nef, C., Ardyna, M., Zayed, A. A., Junger, P. C., Galand, P. E., Lovejoy, C., Murray, A. E., Sarmento, H., Tara Oceans coordinators, Acinas, S. G., Babin, M., Iudicone, D., Jaillon, O., Karsenti, E., Wincker, P., Karp-Boss, L., Sullivan, M. B., Bowler, C., de Vargas, C., and Eveillard, D.: Environmental vulnerability of the global ocean epipelagic plankton community interactome, Science Advances, 7, eabg1921, https://doi.org/10.1126/sciadv.abg1921, 2021.
Chen, B., Landry, M. R., Huang, B., and Liu, H.: Does warming enhance the effect of microzooplankton grazing on marine phytoplankton in the ocean?, Limnol. Oceanogr., 57, 519–526, https://doi.org/10.4319/lo.2012.57.2.0519, 2012.
Clements, D. J., Yang, S., Weber, T., McDonnell, A. M. P., Kiko, R., Stemmann, L., and Bianchi, D.: New Estimate of Organic Carbon Export From Optical Measurements Reveals the Role of Particle Size Distribution and Export Horizon, Global Biogeochem. Cy., 37, e2022GB007633, https://doi.org/10.1029/2022GB007633, 2023.
Copernicus Marine Service: Global Ocean Colour (Copernicus-GlobColour), Bio-Geo-Chemical, L4 (monthly and interpolated) from Satellite Observations (1997–ongoing), Copernicus Marine Service [data set], https://doi.org/10.48670/moi-00281, 2024.
Dean, C. L., Harvey, E. L., Johnson, M. D., and Subhas, A. V.: Microzooplankton grazing on the coccolithophore Emiliania huxleyi and its role in the global calcium carbonate cycle, Science Advances, 10, eadr5453, https://doi.org/10.1126/sciadv.adr5453, 2024.
Feely, R. A., Sabine, C. L., Lee, K., Millero, F. J., Lamb, M. F., Greeley, D., Bullister, J. L., Key, R. M., Peng, T.-H., Kozyr, A., Ono, T., and Wong, C. S.: In situ calcium carbonate dissolution in the Pacific Ocean, Global Biogeochem. Cy., 16, 1144, https://doi.org/10.1029/2002GB001866, 2002.
Francois, R., Honjo, S., Krishfield, R., and Manganini, S.: Factors controlling the flux of organic carbon to the bathypelagic zone of the ocean, Global Biogeochem. Cy., 16, 34-1–34–20, https://doi.org/10.1029/2001GB001722, 2002.
Friis, K., Najjar, R. G., Follows, M. J., and Dutkiewicz, S.: Possible overestimation of shallow-depth calcium carbonate dissolution in the ocean, Global Biogeochem. Cy., https://doi.org/10.1029/2006gb002727, 2006.
Gangstø, R., Gehlen, M., Schneider, B., Bopp, L., Aumont, O., and Joos, F.: Modeling the marine aragonite cycle: changes under rising carbon dioxide and its role in shallow water CaCO3 dissolution, Biogeosciences, 5, 1057–1072, https://doi.org/10.5194/bg-5-1057-2008, 2008.
Guerreiro, C. V., Baumann, K. H., Brummer, G. J. A., Valente, A., Fischer, G., Ziveri, P., Vanda, B., and Stuut, J. B. W.: Carbonate fluxes by coccolithophore species between NW Africa and the Caribbean: Implications for the biological carbon pump, Limnol. Oceanogr., 66, 3190–3208, 2021.
Harris, R. P.: Zooplankton grazing on the coccolithophore Emiliania huxleyi and its role in inorganic carbon flux, Mar. Biol., 119, 431–439, https://doi.org/10.1007/BF00347540, 1994.
Hauck, J., Gruber, N., Ishii, M., and Müller, J. D. and the RECCAP2 ocean chapter leads: Constraining regional and global ocean carbon fluxes in RECCAP2, EGU General Assembly 2023, Vienna, Austria, 24–28 Apr 2023, EGU23-12786, https://doi.org/10.5194/egusphere-egu23-12786, 2023.
Henson, S., Le Moigne, F., and Giering, S.: Drivers of carbon export efficiency in the global ocean, Global Biogeochem. Cy., 33, 891–903, 2019.
Henson, S. A., Sanders, R., and Madsen, E.: Global patterns in efficiency of particulate organic carbon export and transfer to the deep ocean: Export and transfer efficiency, Global Biogeochem. Cy., 26, https://doi.org/10.1029/2011GB004099, 2012.
Hernández-León, S., Koppelmann, R., Fraile-Nuez, E., Bode, A., Mompeán, C., Irigoien, X., Olivar, M. P., Echevarría, F., Fernández de Puelles, M. L., González-Gordillo, J. I., Cózar, A., Acuña, J. L., Agustí, S., and Duarte, C. M.: Large deep-sea zooplankton biomass mirrors primary production in the global ocean, Nat. Commun., 11, 6048, https://doi.org/10.1038/s41467-020-19875-7, 2020.
Holligan, P. M., Fernández, E., Aiken, J., Balch, W. M., Boyd, P., Burkill, P. H., Finch, M., Groom, S. B., Malin, G., Muller, K., Purdie, D. A., Robinson, C., Trees, C. C., Turner, S. M., and van der Wal, P.: A biogeochemical study of the coccolithophore, Emiliania huxleyi, in the North Atlantic, Global Biogeochem. Cy., 7, 879–900, https://doi.org/10.1029/93GB01731, 1993.
Honjo, S.: Coccoliths: Production, transportation and sedimentation, Mar. Micropaleontol., 1, 65–79, https://doi.org/10.1016/0377-8398(76)90005-0, 1976.
Hopkins, J. and Balch, W. M.: A New Approach to Estimating Coccolithophore Calcification Rates From Space, J. Geophys. Res.-Biogeo., 123, 1447–1459, https://doi.org/10.1002/2017JG004235, 2018.
Hopkins, J., Henson, S. A., Painter, S. C., Tyrrell, T., and Poulton, A. J. Phenological characteristics of global coccolithophore blooms, Global Biogeochem. Cy., 29, 239–253, 2015.
Hopkins, J., Henson, S. A., Poulton, A. J., and Balch, W. M.: Regional characteristics of the temporal variability in the global particulate inorganic carbon inventory, Global Biogeochem. Cy., 33, 1328–1338, https://doi.org/10.1029/2019GB006300, 2019
Huang, Y. and Fassbender, A. J.: Biological production of distinct carbon pools drives particle export efficiency in the Southern Ocean, Geophys. Res. Lett., 51, 12, e2023GL107511, https://doi.org/10.1029/2023GL107511, 2024.
Irigoien, X., Flynn, K. J., and Harris, R. P.: Phytoplankton blooms: a `loophole' in microzooplankton grazing impact?, J. Plankton Res., 27, 313–321, https://doi.org/10.1093/plankt/fbi011, 2005.
Iversen, M. H. and Ploug, H.: Ballast minerals and the sinking carbon flux in the ocean: carbon-specific respiration rates and sinking velocity of marine snow aggregates, Biogeosciences, 7, 2613–2624, https://doi.org/10.5194/bg-7-2613-2010, 2010.
Jansen, H. and Wolf-Gladrow, D.: Carbonate dissolution in copepod guts: a numerical model, Mar. Ecol. Prog. Ser., 221, 199–207, https://doi.org/10.3354/meps221199, 2001.
Kaneko, H., Endo, H., Henry, N., Berney, C., Mahé, F., Poulain, J., Labadie, K., Beluche, O., El Hourany, R., Chaffron, S., Wincker, P., Nakamura, R., Karp-Boss, L., Boss, E., Chris Bowler, de Vargas, C., Tomii, K., and Ogata, H.: Predicting global distributions of eukaryotic plankton communities from satellite data, ISME Commun., 3, 1–9, https://doi.org/10.1038/s43705-023-00308-7, 2023.
Klaas, C. and Archer, D. E.: Association of sinking organic matter with various types of mineral ballast in the deep sea: Implications for the rain ratio, Global Biogeochem. Cy., 16, 63-1–63-14, https://doi.org/10.1029/2001GB001765, 2002.
Knecht, N. S., Benedetti, F., Elizondo, U. H., Bednaršek, N., Chaabane, S., de Weerd, C., Peijnenburg, K. T. C. A., Schiebel, R., and Vogt, M.: The impact of zooplankton calcifiers on the marine carbon cycle, Global Biogeochem. Cy., e2022GB007685, https://doi.org/10.1029/2022GB007685, 2023.
Kruijt, A. L., van Dijk, R., Sulpis, O., Beaufort, L., Lassus, G., Brummer, G.-J., van der Burg, A. D., Cala, B. A., Ourradi, Y., Peijnenburg, K. T. C. A., Humphreys, M. P., Chaabane, S., Sluijs, A., and Middelburg, J. J.: The contributions of various calcifying plankton to the South Atlantic calcium carbonate stock, Biogeosciences, 23, 531–563, https://doi.org/10.5194/bg-23-531-2026, 2026.
Krumhardt, K. M., Lovenduski, N. S., Iglesias-Rodriguez, M. D., and Kleypas, J. A.: Coccolithophore growth and calcification in a changing ocean, Prog. Oceanogr., 159, 276–295, https://doi.org/10.1016/j.pocean.2017.10.007, 2017.
Krumhardt, K. M., Lovenduski, N. S., Long, M. C., Lévy, M., Lindsay, K., Moore, J. K., and Nissen, C. Coccolithophore growth and calcification in an acidified ocean: Insights from community Earth system model simulations, J. Adv. Model. Earth Sy., 11, 1418–1437, 2019.
Kwon, E. Y., Dunne, J. P., and Lee, K. Biological export production controls upper ocean calcium carbonate dissolution and CO2 buffer capacity, Science Advances, 10, eadl0779, https://doi.org/10.1126/sciadv.adl0779, 2024.
Lacour, L., Llort, J., Briggs, N., Strutton, P. G., and Boyd, P. W.: Seasonality of downward carbon export in the Pacific Southern Ocean revealed by multi-year robotic observations, Nat. Commun., 14, 1278, https://doi.org/10.1038/s41467-023-36954-7, 2023.
Langer, G., Nehrke, G., and Jansen, S.: Dissolution of Calcidiscus leptoporus coccoliths in copepod guts? A morphological study, Mar. Ecol. Prog. Ser., 331, 139–146, https://doi.org/10.3354/meps331139, 2007.
Lalli, C. M. and Gilmer, R. W. Pelagic snails: the biology of holoplanktonic gastropod mollusks, Stanford University Press, https://doi.org/10.1515/9781503623088, 1989.
Laurenceau-Cornec, E. C., Le Moigne, F. A. C., Gallinari, M., Moriceau, B., Toullec, J., Iversen, M. H., Engel, A., and De La Rocha, C. L.: New guidelines for the application of Stokes' models to the sinking velocity of marine aggregates, Limnol. Oceanogr., 65, 1264–1285, https://doi.org/10.1002/lno.11388, 2020.
Lebrato, M., Iglesias-Rodríguez, D., Feely, R. A., Greeley, D., Jones, D. O. B., Suarez-Bosche, N., Lampitt, R. S., Cartes, J. E., Green, D. R. H., and Alker, B.: Global contribution of echinoderms to the marine carbon cycle: CaCO3 budget and benthic compartments, Ecol. Monogr., 80, 441–467, https://doi.org/10.1890/09-0553.1, 2010.
Lee, K.: Global net community production estimated from the annual cycle of surface water total dissolved inorganic carbon, Limnol. Oceanogr., 46, 1287–1297, https://doi.org/10.4319/lo.2001.46.6.1287, 2001.
Le Moigne, F. A. C., Pabortsava, K., Marcinko, C. L. J., Martin, P., and Sanders, R. J.: Where is mineral ballast important for surface export of particulate organic carbon in the ocean?, Geophys. Res. Lett., 41, 8460–8468, https://doi.org/10.1002/2014GL061678, 2014.
Le Quéré, C., Buitenhuis, E. T., Moriarty, R., Alvain, S., Aumont, O., Bopp, L., Chollet, S., Enright, C., Franklin, D. J., Geider, R. J., Harrison, S. P., Hirst, A. G., Larsen, S., Legendre, L., Platt, T., Prentice, I. C., Rivkin, R. B., Sailley, S., Sathyendranath, S., Stephens, N., Vogt, M., and Vallina, S. M.: Role of zooplankton dynamics for Southern Ocean phytoplankton biomass and global biogeochemical cycles, Biogeosciences, 13, 4111–4133, https://doi.org/10.5194/bg-13-4111-2016, 2016.
Lima, I. D., Lam, P. J., and Doney, S. C.: Dynamics of particulate organic carbon flux in a global ocean model, Biogeosciences, 11, 1177–1198, https://doi.org/10.5194/bg-11-1177-2014, 2014.
McNair, H. M., Morison, F., Graff, J. R., Rynearson, T. A., and Menden-Deuer, S.: Microzooplankton grazing constrains pathways of carbon export in the subarctic North Pacific, Limnol Oceanogr, 66, 2697–2711, https://doi.org/10.1002/lno.11783, 2021.
Milliman, J. D., Troy, P. J., Balch, W. M., Adams, A. K., Li, Y.-H., and Mackenzie, F. T.: Biologically mediated dissolution of calcium carbonate above the chemical lysocline?, Deep-Sea Res. Pt. I, 46, 1653–1669, https://doi.org/10.1016/S0967-0637(99)00034-5, 1999.
Monteiro, F. M., Bach, L. T., Brownlee, C., Bown, P., Rickaby, R. E. M., Poulton, A. J., Tyrrell, T., Beaufort, L., Dutkiewicz, S., Gibbs, S., Gutowska, M. A., Lee, R., Riebesell, U., Young, J., and Ridgwell, A.: Why marine phytoplankton calcify, Science Advances, 2, e1501822, https://doi.org/10.1126/sciadv.1501822, 2016.
Morse, J. W., Andersson, A. J., and Mackenzie, F. T. Initial responses of carbonate-rich shelf sediments to rising atmospheric pCO2 and “ocean acidification”: role of high Mg-calcites, Geochim. Cosmochim. Ac., 70, 5814–5830, 2006.
Nejstgaard, J. C., Witte, H. J., van der Wal, P., and Jacobsen, A.: Copepod grazing during a mesocosm study of an Emiliania huxleyi (Prymnesiophyceae) bloom, Sarsia, 79, 369–377, https://doi.org/10.1080/00364827.1994.10413568, 1994.
Neukermans, G., Bach, L. T., Butterley, A., Sun, Q., Claustre, H., and Fournier, G. R.: Quantitative and mechanistic understanding of the open ocean carbonate pump – perspectives for remote sensing and autonomous in situ observation, Earth-Sci. Rev., 104359, https://doi.org/10.1016/j.earscirev.2023.104359, 2023.
Nowicki, M., DeVries, T., and Siegel, D. A.: Quantifying the Carbon Export and Sequestration Pathways of the Ocean's Biological Carbon Pump, Global Biogeochem. Cy., 36, e2021GB007083, https://doi.org/10.1029/2021GB007083, 2022a.
Nowicki, M., DeVries, T., and Siegel, D.: Ocean Biological Carbon Pump Model Output, figshare [data set], https://doi.org/10.6084/m9.figshare.19074521, 2022b.
Passow, U. and Carlson, C.: The biological pump in a high CO2 world, Mar. Ecol. Prog. Ser., 470, 249–271, https://doi.org/10.3354/meps09985, 2012.
Picard, T., Gula, J., Fablet, R., Collin, J., and Mémery, L.: Predicting particle catchment areas of deep-ocean sediment traps using machine learning, Ocean Sci., 20, 1149–1165, https://doi.org/10.5194/os-20-1149-2024, 2024.
Picard, T., Baker, C. A., Gula, J., Fablet, R., Mémery, L., and Lampitt, R.: Estimating the variability of deep-ocean particle flux collected by sediment traps using satellite data and machine learning, Biogeosciences, 22, 4309–4331, https://doi.org/10.5194/bg-22-4309-2025, 2025.
Pilskaln, C. H. and Honjo, S.: The Fecal Pellet fraction of biogeochemical particle fluxes to the deep sea, Global Biogeochem. Cy., 1, 31–48, https://doi.org/10.1029/GB001i001p00031, 1987.
Planchat, A., Kwiatkowski, L., Bopp, L., Torres, O., Christian, J. R., Butenschön, M., Lovato, T., Séférian, R., Chamberlain, M. A., Aumont, O., Watanabe, M., Yamamoto, A., Yool, A., Ilyina, T., Tsujino, H., Krumhardt, K. M., Schwinger, J., Tjiputra, J., Dunne, J. P., and Stock, C.: The representation of alkalinity and the carbonate pump from CMIP5 to CMIP6 Earth system models and implications for the carbon cycle, Biogeosciences, 20, 1195–1257, https://doi.org/10.5194/bg-20-1195-2023, 2023.
Planchat, A., Bopp, L., Kwiatkowski, L., and Torres, O.: The carbonate pump feedback on alkalinity and the carbon cycle in the 21st century and beyond, Earth Syst. Dynam., 15, 565–588, https://doi.org/10.5194/esd-15-565-2024, 2024.
Poulton, A. J., Adey, T. R., Balch, W. M., and Holligan, P. M. Relating coccolithophore calcification rates to phytoplankton community dynamics: Regional differences and implications for carbon export, Deep-Sea Res. Pt. II, 54, 538–557, 2007.
Poulton, A. J., Stinchcombe, M. C., Achterberg, E. P., Bakker, D. C. E., Dumousseaud, C., Lawson, H. E., Lee, G. A., Richier, S., Suggett, D. J., and Young, J. R.: Coccolithophores on the north-west European shelf: calcification rates and environmental controls, Biogeosciences, 11, 3919–3940, https://doi.org/10.5194/bg-11-3919-2014, 2014.
Renforth, P. and Henderson, G.: Assessing ocean alkalinity for carbon sequestration, Rev. Geophys., 55, 636–674, 2017.
Ricour, F., Guidi, L., Gehlen, M., DeVries, T., and Legendre, L.: Century-scale carbon sequestration flux throughout the ocean by the biological pump, Nat. Geosci., 1–9, https://doi.org/10.1038/s41561-023-01318-9, 2023.
Roth, P. H., Mullin, M. M., and Berger, W. H.: Coccolith Sedimentation by Fecal Pellets: Laboratory Experiments and Field Observations, Geol. Soc. Am. Bull., 86, 1079, https://doi.org/10.1130/0016-7606(1975)86<1079:CSBFPL>2.0.CO;2, 1975.
Ryan-Keogh, T. J., Thomalla, S. J., Chang, N., and Moalusi, T.: A new global oceanic multi-model net primary productivity data product, Earth Syst. Sci. Data, 15, 4829–4848, https://doi.org/10.5194/essd-15-4829-2023, 2023.
Savoye, N., Benitez-Nelson, C., Burd, A. B., Cochran, J. K., Charette, M., Buesseler, K. O., Jackson, G. A., Roy-Barman, M., Schmidt, S., and Elskens, M.: 234Th sorption and export models in the water column: A review, Mar. Chem., 100, 234–249, https://doi.org/10.1016/j.marchem.2005.10.014, 2006.
Schiebel, R. and Movellan, A.: First-order estimate of the planktic foraminifer biomass in the modern ocean, Earth Syst. Sci. Data, 4, 75–89, https://doi.org/10.5194/essd-4-75-2012, 2012.
Schiebel, R.: Planktic foraminiferal sedimentation and the marine calcite budget, Global Biogeochem. Cy., 16, 1065, https://doi.org/10.1029/2001GB001459, 2002.
Sulpis, O., Jeansson, E., Dinauer, A., Lauvset, S. K., and Middelburg, J. J.: Calcium carbonate dissolution patterns in the ocean, Nat. Geosci., 14, 423–428, https://doi.org/10.1038/s41561-021-00743-y, 2021.
Tamburini, C., Garel, M., Barani, A., Boeuf, D., Bonin, P., Bhairy, N., Guasco, S., Jacquet, S., Le Moigne, F. A. C., Panagiotopoulos, C., Riou, V., Veloso, S., Santinelli, C., and Armougom, F.: Increasing Hydrostatic Pressure Impacts the Prokaryotic Diversity during Emiliania huxleyi Aggregates Degradation, Water, 13, 2616, https://doi.org/10.3390/w13192616, 2021.
Thuiller, W., Pollock, L. J., Gueguen, M., and Münkemüller, T.: From species distributions to meta-communities, Ecol. Lett., 18, 1321–1328, https://doi.org/10.1111/ele.12526, 2015.
Toullec, J.: JordanToullec/EGUSPHERE-2025-1108_Datasets: EGUSPHERE-2025-4395_Datasets (EGUSPHERE-2025-4395-Dataset), Zenodo [data set], https://doi.org/10.5281/zenodo.21033101, 2026a.
Toullec, J.: JordanToullec/egusphere-2025-1108_script: EGUSPHERE-2025-4395-Script (EGUSPHERE-2025-4395-Script), Zenodo [code], https://doi.org/10.5281/zenodo.21033186, 2026b.
Toullec, J., Delegrange, A., Perruchon, A., Duong, G., Cornille, V., Brutier, L., and Hermoso, M.: Copepod Feeding Responses to Changes in Coccolithophore Size and Carbon Content, J. Mar. Sci. Eng., 10, 1807, https://doi.org/10.3390/jmse10121807, 2022.
Tyrrell, T.: Calcium carbonate cycling in future oceans and its influence on future climates, J. Plankton Res., 30, 141–156, 2008.
Tyrrell, T. and Merico, A.: Emiliania huxleyi: bloom observations and the conditions that induce them, in: Coccolithophores: From Molecular Processes to Global Impact, edited by: Thierstein, H. R. and Young, J. R., Springer, Berlin, Heidelberg, 75–97, https://doi.org/10.1007/978-3-662-06278-4_4, 2004.
Vallina, S. M., Follows, M. J., Dutkiewicz, S., Montoya, J. M., Cermeno, P., and Loreau, M.: Global relationship between phytoplankton diversity and productivity in the ocean, Nat. Commun., 5, 4299, https://doi.org/10.1038/ncomms5299, 2014.
Volk, T. and Hoffert, M.I.: Ocean Carbon Pumps: Analysis of Relative Strengths and Efficiencies in Ocean-Driven Atmospheric CO2 Changes. In The Carbon Cycle and Atmospheric CO2: Natural Variations Archean to Present, edited by: Sundquist, E. T. and Broecker, W. S., https://doi.org/10.1029/GM032p0099, 1985.
Wang, W.-L., Fu, W., Le Moigne, F. A. C., Letscher, R. T., Liu, Y., Tang, J.-M., and Primeau, F. W.: Biological carbon pump estimate based on multidecadal hydrographic data, Nature, 1–7, https://doi.org/10.1038/s41586-023-06772-4, 2023.
Weber, T., Cram, J. A., Leung, S. W., DeVries, T., and Deutsch, C. Deep ocean nutrients imply large latitudinal variation in particle transfer efficiency, P. Natl. Acad. Sci. USA, 113, 8606–8611, 2016.
Ziveri, P., Langer, G., Chaabane, S., de Vries, J., Gray, W. R., Keul, N., Hatton, I. A., Manno, C., Norris, R., Pallacks, S., Young, J. R., Schiebel, R., Zarkogiannis, S., Anglada-Ortiz, G., Bianco, S., de Garidel-Thoron, T., Grelaud, M., Lucas, A., Probert, I., and Mortyn, P. G.: Calcifying plankton: From biomineralization to global change, Science, 390, https://doi.org/10.1126/science.adq8520, 2025.
Ziveri, P., Gray, W. R., Anglada-Ortiz, G., Manno, C., Grelaud, M., Incarbona, A., Rae, J. W. B., Subhas, A. V., Pallacks, S., White, A., Adkins, J. F., and Berelson, W.: Pelagic calcium carbonate production and shallow dissolution in the North Pacific Ocean, Nat. Commun., 14, 1–14, https://doi.org/10.1038/s41467-023-36177-w, 2023.