the Creative Commons Attribution 4.0 License.
the Creative Commons Attribution 4.0 License.
 | 19 Jan 2026
Spatiotemporal variability and environmental controls on aquatic methane emissions in an Arctic permafrost catchment
Michael W. Thayne
Karl Kemper
Christian Wille
Aram Kalhori
Understanding spatiotemporal dynamics and drivers of methane (CH4) fluxes from rapidly changing permafrost regions is critical for improving our understanding of such changes. Between May and August 2023 and 2024, we measured CH4 using floating chambers in a small Arctic permafrost catchment on Disko Island, Greenland. Fluxes were derived from 707 chamber measurements using a semi-automated algorithm incorporating boosted regression trees and generalized additive models. Highest fluxes occurred in streams and along lakeshores associated with inlets. Diffusive fluxes dominated (∼ 98 % of observations), while only ∼ 1 % of chamber deployments exhibited non-linear concentration increases indicative of ebullition, while the other ∼ 1 % were attributed to uptake. Median diffusive fluxes were 5.0 nmol m−2 s−1 (−0.1 to 271.8), peaking at ice-break. Ebullition had a median of 939 nmol m−2 s−1 (5.2–14 893), but did not impact overall fluxes. Model results suggest that thaw-season CH4 fluxes were initially driven by meteorological conditions and catchment soil conditions, but shifted rapidly – within approximately one week after ice-off – to biogeochemical controls, including dissolved organic matter, oxygen saturation, and pH.
- Article
(8233 KB) - Full-text XML
-
Supplement
(1485 KB) - BibTeX
- EndNote


Permafrost regions across the Arctic store substantial amounts of carbon. Climate warming is rapidly changing permafrost regions and consequently their carbon storage dynamics, creating a critical climate feedback mechanism (Schuur et al., 2015; Miner et al., 2022). At current warming rates, models project approximately 77 % of shallow permafrost will be lost by 2100 (Fox-Kemper et al., 2021), suggesting large implications for the global carbon budget and how carbon emissions are distributed across permafrost landscapes. The underlying issue is that thawing permafrost can release previously frozen organic matter, delivering labile nutrients to soil microbes which accelerate the decomposition of soil organic carbon as a result of their metabolic processes (Schuur et al., 2015; Keskitalo et al., 2021; Olefeldt et al., 2021). Subtle changes in microbial processes in soils can enhance positive feedback mechanisms which compounds atmospheric warming. Lateral movement of water through active layer soils is a critical pathway for CH4 emissions from surface waters (Street et al., 2016; Olid et al., 2021, 2022; Fazi et al., 2021). Hydrological and catchment system dynamics in particular play a critical role in distributing dissolved carbon throughout permafrost environments. Catchment systems, such as thermokarst lakes and wetlands, have been shown to be “hotspots” for CH4 release, where daily emission rates between 10 and 200 mg m−2 d−1 have been reported (Walter Anthony et al., 2018; Elder et al., 2020). However, while localized high emissions have been reported, the overall contribution of Arctic and permafrost freshwater bodies to global methane budgets is fairly low at 2 %–6 % when compared to other ecoregions such as the tropics at 64 % (Bastviken et al., 2008; Saunois et al., 2025; Virkkala et al., 2024). Nonetheless, with such drastic change expected, well designed field studies exploring which processes are the most important for governing CH4 emissions from permafrost regions, are critical data sources for validating climate models and simulations (Bartsch et al., 2025).
Carbon dynamics in permafrost regions have been shown to be governed by interactions between soil, vegetation, hydrology, and atmospheric processes (Walter Anthony et al., 2012; Virkkala et al., 2024; Yuan et al., 2024; Kleber et al., 2025). Located on the central-west coast of Greenland, Qeqertarsuaq, also known as Disko Island, has become an important data point for understanding environmental interactions which govern Arctic tundra carbon dynamics. The island provides a natural laboratory for observing interactions between permafrost, vegetation, microbial activity and aquatic ecosystems (Humlum, 1998; Humlum et al., 1999; Callaghan et al., 2011; Christiansen et al., 2015; D'Imperio et al., 2017). Previous work from the study area has suggested shifting hydrology, historic permafrost thaw, nutrient cycling, and microbial activity in the active and permafrost layers as possible drivers of CH4 fluxes from surface water bodies (Zastruzny et al., 2017; Kluge et al., 2021; Stevenson et al., 2021; Juncher Jørgensen et al., 2024). These studies highlight the interconnectedness of terrestrial and aquatic ecosystems, and the effect they may have on CH4 fluxes from lakes and streams on Disko Island. There is yet to be an extensive study on CH4 fluxes from the island's lakes and streams. However, it has been suggested that permafrost thaw and warming air temperatures may have an effect on greenhouse gas fluxes (Kluge et al., 2021; Juncher Jørgensen et al., 2024). Soil warming experiments and studies of increased snow cover in winter were shown to regulate carbon fluxes through accelerated carbon turnover (Ravn et al., 2020; Xu et al., 2021). Carbon fluxes are further controlled by plant uptake and through microbial activity regulating the availability of nutrients and subsequent CH4 production (Laanbroek, 2010; Liebner et al., 2011; D'Imperio et al., 2017). Sedimentary processes in lakes promote carbon storage, whereas methanotrophic and methanogenic microbial assemblages along an upland–wetland environmental gradient regulate CH4 consumption and emission, respectively. Therefore, freshwater ecosystems play a critical role storing, producing, and emitting CH4 (Christiansen et al., 2015; Žárský et al., 2018; Stevenson et al., 2021).
The hydrology of Disko Island is strongly influenced by past volcanic activity during the Paleocene epoch. With extensive basaltic lava flows characterizing the landscape, the islands terrain is formed by the Maligât and Vaigat Formations, which are comprised of highly permeable layers of basalt interbedded with fluvial and lacustrine sediments (Westergaard-Nielsen et al., 2020; Larsen and Larsen, 2022). The high permeability of these geologic formations enables substantial subsurface flow, subsequently forming perennial water features such as warm springs. In spring, the soils which make up the active layer allow for rapid infiltration of meltwater, which laterally distributes nutrients and organic matter throughout the island's aquatic ecosystems (Westergaard-Nielsen et al., 2020). For example, during spring runoff meltwater and hillside topography was found to largely drive the distribution of nitrates from terrestrial to aquatic ecosystems (Zastruzny et al., 2017; Stevenson et al., 2021). Thus, pools of nutrients available during the growing season may vary dramatically from one year to the next. Lateral flow of snowmelt and permafrost thaw may influence CH4 fluxes due to changes in physio- and biogeochemical properties of the lakes, streams and rivers on the island (Liebner et al., 2011; Rautio et al., 2011; Walvoord and Kurylyk, 2016; Stevenson et al., 2021). Although Disko Island has discontinuous permafrost (Christiansen et al., 2015; Kluge et al., 2021), thawing can release trapped organic matter and nutrients into aquatic ecosystems, potentially affecting CH4 fluxes by providing new substrates for microbial activity (Ravn et al., 2020; Stevenson et al., 2021; Westergaard-Nielsen et al., 2020; Xu et al., 2021).
The distribution and drivers of aquatic CH4 emissions in permafrost regions remain poorly constrained, particularly across small lakes and streams which may arise as emission hotspots. Previous studies on Disko Island have highlighted the potential importance of hydrology, permafrost thaw, and microbial processes for greenhouse gas fluxes, but comprehensive spatial and seasonal assessments of CH4 are lacking. In this study we address this gap by quantifying CH4 fluxes from 707 floating chamber measurements across a permafrost-affected catchment (Sanningasup Tasia). Using boosted regression trees, we evaluate the partial effects of physiochemical water conditions, catchment soil conditions, and meteorology in regulating emissions from ice-break through the growing season. Our objective was to determine how spatial heterogeneity and seasonal dynamics shape CH4 emissions from Arctic freshwater ecosystems and to identify the key processes that control flux variability in permafrost catchments.
2.1 Study Site
Lake Sanningasup Tasia in Greenlandic, or Moræne sø in Danish, is situated between moraines in the north and east and an outlet which drains into the Red River to the west (Fig. 1). The lake is primarily fed by a large warm spring which enters the lake from the southeast, forming a wetland type ecosystem. The other inlets of the lake are primarily fed by seasonal snowmelt. The heterogeneity of the catchment provides an exemplary study site, allowing us to understand the mechanisms regulating CH4 emissions from a lake, streams, and wetland. According to a 2018 report from the University of Copenhagen, the lake has a maximum depth of 4.5 m and is generally phosphorus limited with nitrogen concentrations being seasonally variable, where concentrations during ice cover are higher than during periods of no ice cover (Westergaard-Nielsen et al., 2020). We found water temperature of the lake to range between 1.1 and 13.9 °C with a mean of 7.9 °C. To our knowledge there has never been an extensive study on the greenhouse gas fluxes from the lake and surrounding water bodies.
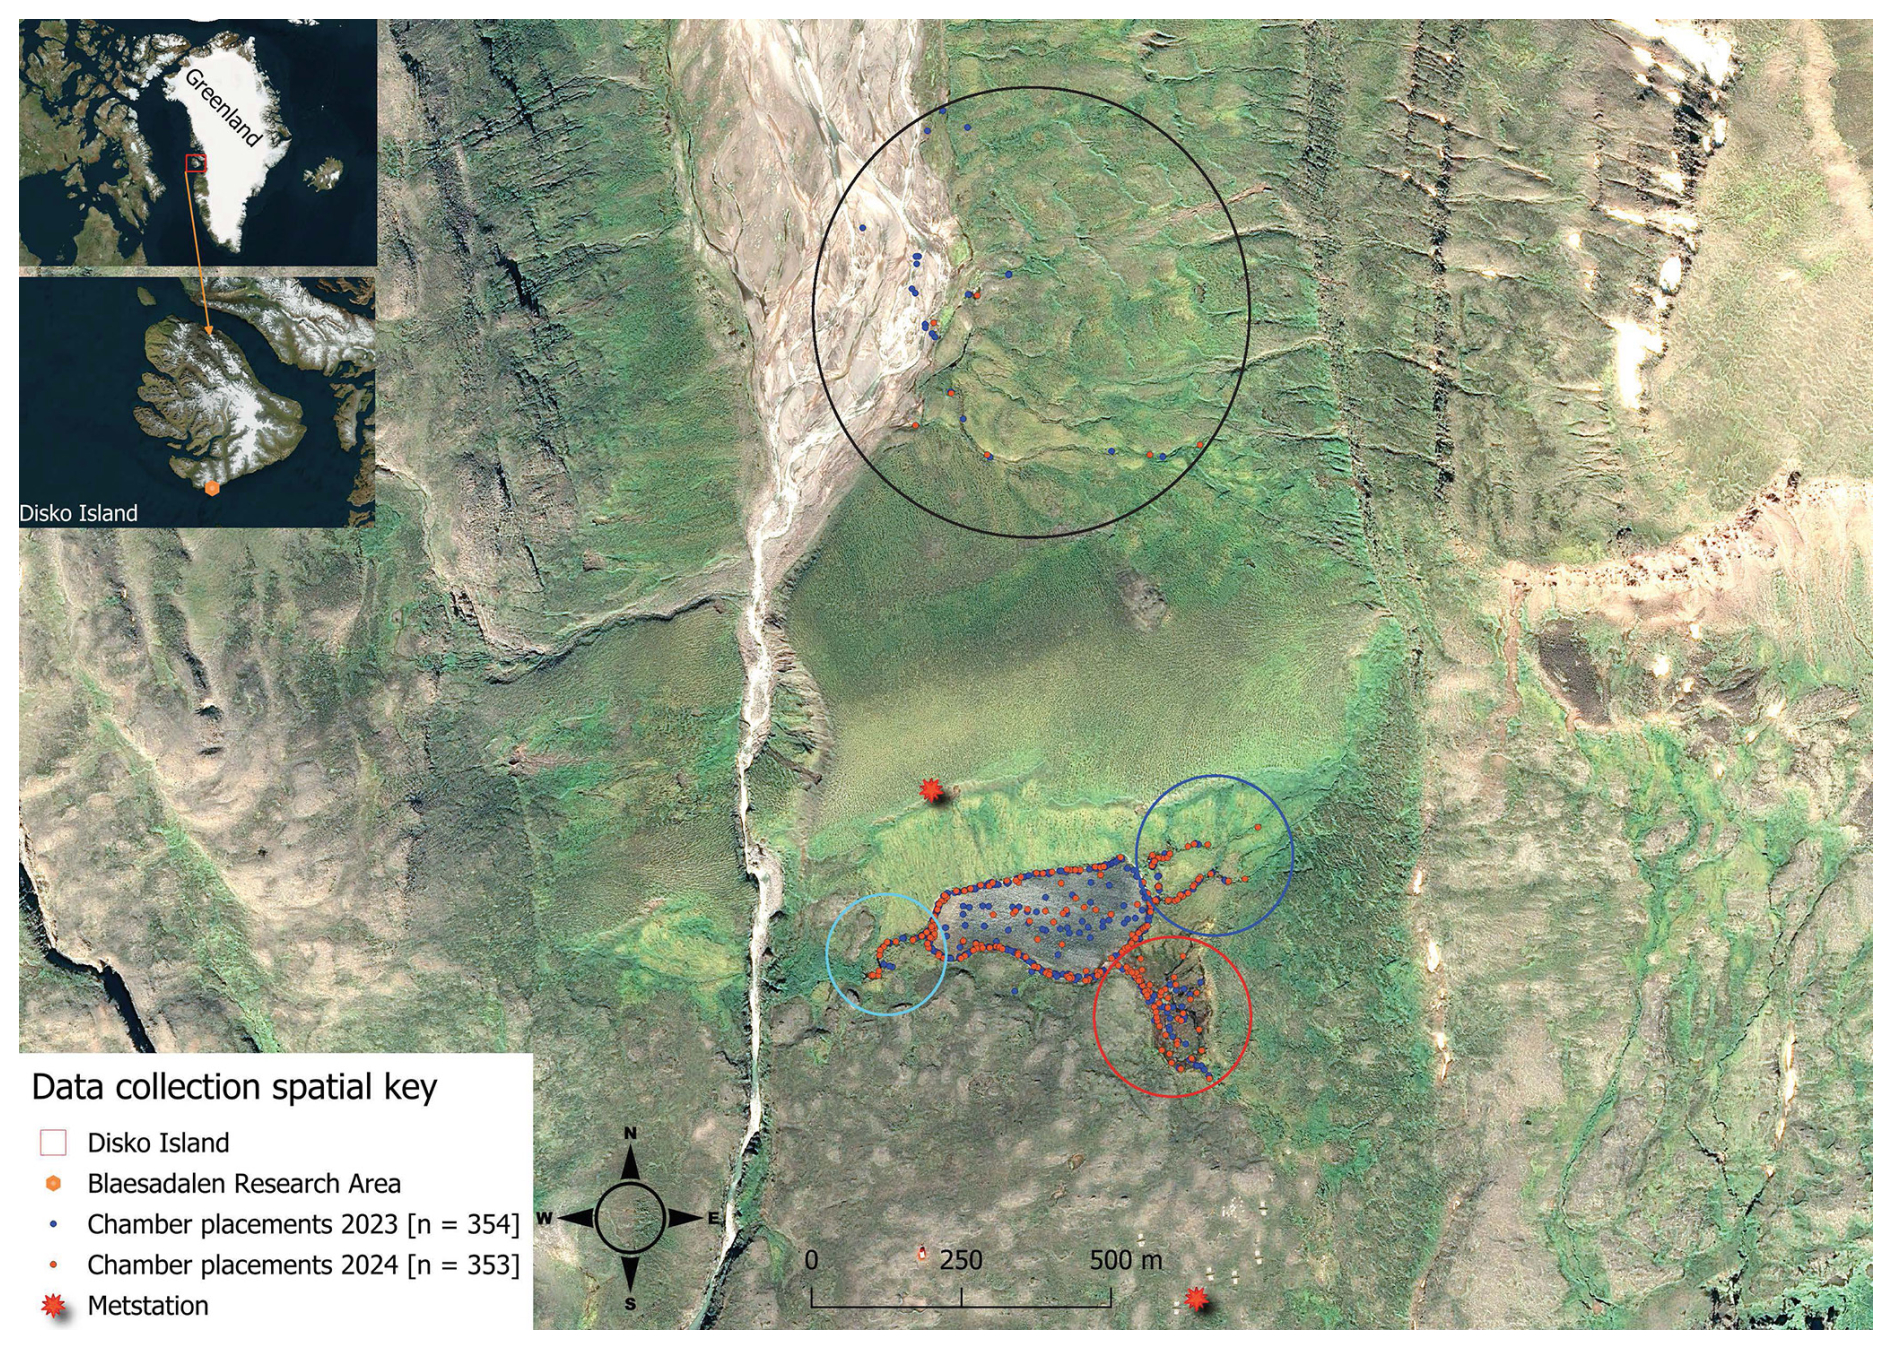
Figure 1Map showing the 707 chamber measurements (blue and brown dots). Points in the south are concentrated around Lake Sanningasup Tasia and its connected streams. The blue circle indicates streams fed by snowmelt and the turquoise circle indicates the outlet of the lake. The red circle indicates the warm spring area which forms a wetland type ecosystem. Points inside the black circle north of the lake indicate measurements taken from the Red River and its stream tributaries. Orthomosaic background image © Centre National d'Études Spatiales (CNES, 2023), Distribution Airbus DS, produced from Pléiades 1B satellite imagery.
2.2 Data Collection
We used closed floating chamber systems connected to an ABB/Los Gatos Research GLA131 Series Micro portable Gas Analyzer in 2023, and to a LI-COR® LI-7810 Trace Gas Analyzer in 2024, with the goal of capturing the spatial and temporal variability of CH4 fluxes in the catchment area. In 2023, we used a self-built cylindrical chamber made of semi-transparent plastic material with volumetric capacity of 0.016 m3 and a basal area of 0.096 m2. In 2024, we used a West Systems type C flux chamber made of stainless steel with a volumetric capacity of 0.013 m3 and a basal area of 0.07 m2. Both chambers included a fan for mixing air and a temperature sensor. The semi-transparent plastic chamber used a circular foam floater that was wrapped around the outside of the chamber, allowing 2 cm of the chamber to be below the water surface, forming a 100 % airtight seal. The West Systems chamber was inserted into a closed-cell foam floater, where the seal was created once the chamber was inserted into the floater. Despite differing chamber materials and flotation devices, median fluxes between 2023 and 2024 were identical at 5.0 nmol m−2 s−1. However, to evaluate whether changes in chamber construction between years introduced systematic bias in CH4 flux estimates, we fit a linear model using log-transformed flux as the response and chamber type, latitude, longitude, and Julian day as predictors. Chamber type was not a significant predictor (p = 0.13), and QQ plots of log-transformed fluxes across years showed no consistent deviation across the flux distribution, except at lower emission rates (Fig. S1 in the Supplement). These findings suggest that differences in chamber construction did not substantively influence the calculated fluxes. Chamber measurements were conducted on the surface of the lake and surrounding water bodies at a spatial distance of 10 to 20 m with a closure time of 10 min. The chamber and gas analyzer were connected in a closed loop, and sample air was continuously pumped through the gas analyzer. CH4 concentrations were measured with a frequency of 1 Hz. Each flux measurement was given a unique id based on its spatial location or water body type. For the lake, ids were given based on what shoreline we were measuring on. For example, if on the east shore, ids would be e1, e2, e3, … etc. The majority of flux measurements on the lake were conducted within 0.2 m from the shore. Open water measurements in the lake were made using a small boat and anchor system. CH4 concentrations in streams were measured by starting at, or near the headwaters and then taking measurements progressively downstream with consideration to the changing terrestrial vegetation and stream dynamics (i.e., fast, slow, or eddie pool). In 2023, we measured isolated meltwater pools during the thaw to represent control conditions (water not yet connected to the lake or streams). In 2024, to capture an even earlier baseline, we conducted chamber measurements on top of snow and lake ice prior to thaw onset, providing a true pre-thaw control period. Overall, we made 707 chamber measurements, representing ∼ 10–15 chamber placements taking place daily, around the lake and surrounding streams giving us an extensive view of the spatial and temporal variability of CH4 fluxes in the study area. While floating chambers isolate the headspace from light wind disturbance, increased surface turbulence may influence gas exchange in the open space of the chamber (Vachon and Prairie, 2013). Our approach captures diffusive exchange under mostly calm-water conditions (i.e., wind speed up to ∼ 4 m s−1), but we acknowledge that regional wind-driven mixing may contribute to flux variability beyond individual chamber footprints. We simultaneously measured water temperature using Truebner EC-100 RS-485 EC/Temperature sensors in 2023 and a suite of water parameters were collected in 2024 using an AquaTroll 600 water sonde (see section: Decoding Methane Drivers). Meteorological data and soil characteristics were collected from nearby meteorological stations maintained by Aarhus University which are part of the Greenland Ecosystem Monitoring Database (Greenland Ecosystem Monitoring, 2026a–c) (see section “Decoding Methane Drivers” for list of variables used).
2.3 Flux Algorithm & Ebullition Detection
In collaboration with ChatGPT 4.0, we wrote an interactive algorithm in R which leverages General Additive Models (GAM) and Boosted Regression Trees (BRT) to robustly and flexibly calculate CH4 fluxes from individual floating chamber measurements (Fig. 6). The flux calculation procedure was applied identically to individual chamber time series for both 2023 and 2024, while controlling for different the chamber constructions.
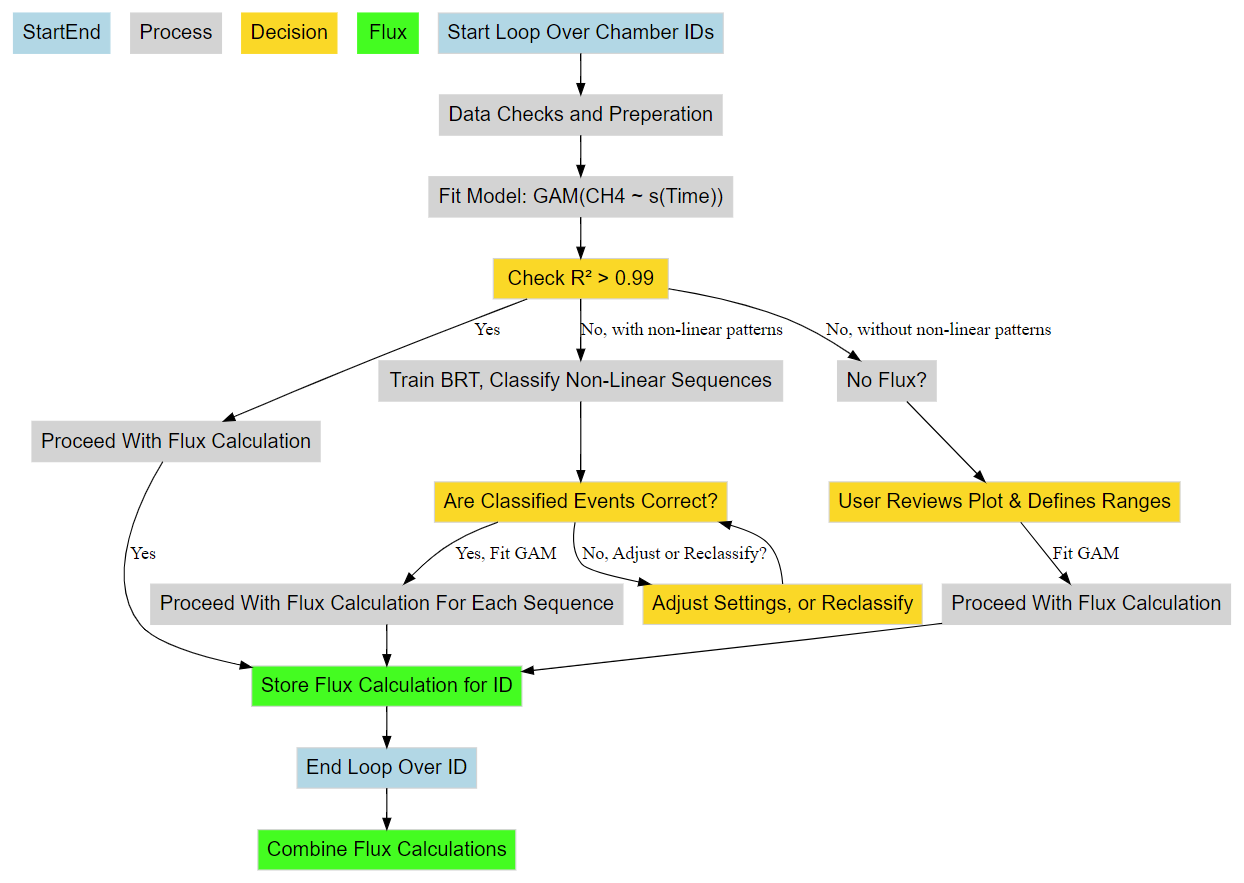
Figure 2CH4 flux calculation workflow from concentration data using predictions from GAM and BRT. Blue boxes represent the start and end of a single chamber measurement working through the algorithms processes (grey boxes) and decision logic (gold boxes). Green boxes represent the storage and combination of the results for further analysis.
Rather than fitting concentration data with linear, exponential, and/or polynomial models (Kutzbach et al., 2007; Pedersen et al., 2010; Hoffmann et al., 2017), the algorithm fits GAM, which are capable of modelling non-linear patterns without a-priori specification of the functional form of the relationship between time and concentration. However, before fitting a GAM, the concentration and accompanying data is checked and processed (Fig. 2; “Data Checks and Preparation”) as follows: The algorithm conducts a preliminary check for the required chamber parameters which are; id, ordered times of measurement, air temperature (°C), volume, area, and air pressure. In addition, air temperature is expected to be initially in Celsius, which is automatically converted to Kelvin during the processing of concentration data in preceding steps. The data is then ordered based on id and time to maintain correct chronological order of chamber measurements. CH4 is then converted from ppm to moles using Ideal Gas Law:
where P is air pressure (Pa), V is chamber volume (m3), R (8.314 J (mol K)−1) is the universal gas constant, and T is air temperature inside the chamber (K). After preliminary data checks and initial processing of the concentration data, the concentration time series is then fit to a GAM (i.e. gam (CH4,moles ∼ s (time, k = gam_knots))), where the smoothing parameter “k” is a user defined parameter named “gam_knots” which has a default value of 5. The value of “k” cannot exceed 3 times the degrees of freedom for a given concentration time series, or the algorithm defaults to fitting a linear model. The algorithm then checks the R2 value of the fitted GAM to see if it meets the default conditional value of ≥ 0.99, if so, it proceeds to calculate fluxes following these steps:
Where is the rate of change, calculated as the quotient of the predicted differences in CH4 concentration between successive time points. Flux is then calculated between successive time points by:
Where mean flux of the chamber measurement is estimated by calculating flux at each successive time step, where flux is determined by dividing by the basal area (A) of the chamber, expressed in (m2). A plot of the time series and model fit is generated and saved in the file directory defined by the user by setting the parameter “save_directory” (Figs. S1–S5). Because fluxes were derived from high-frequency (1 Hz) concentration data fitted using a GAM with a strict acceptance threshold of R2 ≥ 0.99, analytical uncertainty in the rate-of-change estimation is negligible. Conventional uncertainty propagation (e.g., based on regression slope error or replicate chambers) is not meaningful in this context because the GAM approach fits a smooth curve through hundreds of data points per deployment, effectively minimizing noise and preventing poor-quality fits from contributing to the final flux values. This ensures that the dominant source of variability in the dataset reflects true environmental heterogeneity rather than analytical error. Furthermore, because the chamber headspace was fully sealed and isolated from external turbulence, wind-induced variability – which often motivates uncertainty corrections – is mechanically removed from the flux calculation process. For these reasons, we report spatial variability (e.g., medians, ranges, and interquartile spread) rather than analytical uncertainty, as it provides a more ecologically relevant representation of flux variability across the catchment.
In the cases where the initial GAM fit does not meet the R2 ≥ 0.99 condition, the algorithm can follow two pathways (Fig. 2). Pathway (1) is a result of the algorithm having detected non-linear concentration increases using BRT, while pathway (2) the algorithm has found the chamber measurement has not met any of the conditional requirements for flux calculations, or more generally stated, there was no measurable concentration increase detected automatically. Both pathways are interactive as the user is prompted to confirm the classification of “ebullition” versus. diffusive data sequences in pathway (1), while in pathway (2) the user confirms there is indeed no concentration increase by reviewing the diagnostic plots (see Supplement and Figs. S2–S6). Once confirmed, the user initiates flux calculations by manually entering the time range of the measurement that should be fitted (Fig. 2). “Ebullition” in the context of the algorithm refers to a sudden, non-linear CH4 increases identified by the algorithm, which likely includes ebullitive events, but does not strictly infer all fluxes calculated this way were from bubbles entering the chamber.
2.4 Lake and Stream Metabolism
In 2024, we calculated the metabolic parameters net ecosystem production (NEP), gross primary production (GPP), and ecosystem respiration (ER) of oxygen for the lake and streams using dissolved oxygen (DO) collected at a 1 min frequency during chamber measurements (DO sensor accuracy: ±0.1 mg L−1; resolution 0.01 mg L−1). Including metabolic parameters as predictors in the BRT models gave us an understanding of the role microbial oxygen production plays in regulating or not CH4 emissions from water. DO saturation was adjusted using temperature-dependent solubility constants (Garcia and Gordon, 1992). Oxygen flux at the air-water interface was determined using wind derived gas exchange coefficients and adjusted for water temperature (Cole and Caraco, 1998). NEP was calculated as the rate of change in DO concentration over each chamber deployment, adjusted for air-water exchange (Hall and Madinger, 2018; Noss et al., 2018). GPP and ER were partitioned from NEP by applying a threshold of 200 µmol m−2 s−1 photosynthetically active radiation (PAR), which distinguishes intervals with effective photosynthesis from those with negligible light-driven production, despite continuous daylight during Arctic summer. Aggregating each chamber DO measurement into 1 min intervals, we calculated mean NEP, GPP, and ER for each chamber placement (Winslow et al., 2016). While this methodology is sound for the lake, there is some caveats in relation to stream metabolism. Because we are using a model which assumes wind driven gas exchange for small streams, we likely underestimate gas exchange in parts of the streams where turbulence from streambed roughness dominates. Nonetheless, the approach captures broadly the metabolic trends in lake and stream metabolism observed in other Arctic and Boreal waterbodies (Mulholland et al., 2001; Rocher-Ros et al., 2021; Ayala-Borda et al., 2024; Klaus et al., 2022; Myrstener et al., 2021) and is useful for comparing fluxes across aquatic biomes.
2.5 Spatial Flux Evaluation
We uploaded as a spatial layer in QGIS version 3.40.1 (QGIS Development Team, 2025) an orthomosaic image produced by Airbus satellite Pléiades 1B and the chamber placements as points with their associated flux estimates. We spatially analyzed the CH4 fluxes by creating bi-weekly emission heatmaps using the Kernal Density Estimation (KDE) algorithm in QGIS. The use of KDE allowed us to smooth across discrete chamber measurements, yielding an intuitive continuous surface representation of CH4 flux hotspots and their evolution through time (Fig. 2). We set the radius to between 30–35 m to allow some connectivity between points which allows for a smooth representation of any environmental gradients that might be captured. We used the default method using a quartic kernel shape weighted by the flux calculated for each chamber placement. While “ebullitive” fluxes were not considered in further statistical analysis (i.e., in the BRT), those fluxes are depicted in the resulting heatmaps. Overall, using KDE allowed for an intuitive interpretation of the seasonal and spatial development of flux hotspots in the research area.
We additionally compared daily CH4 emissions from Sanningasup Tasia catchment relative to other Arctic-Boreal Lake classes compiled in the Boreal-Arctic Wetland and Lake Dataset (Kuhn et al., 2021a; Olefeldt et al., 2021). A Kruskal-Wallis test was performed to determine significant differences (p < 0.05) in the log transformed daily fluxes from Sanningasup Tasia (n = 48) and its streams (n = 35) relative to broader biome-scale fluxes from Small Peat Lakes (n = 50), Medium Peat Lakes (n = 36), Large Lakes (n = 10), and Small Yedoma Lakes (n = 7). We then performed pairwise Wilcoxon rank-sum tests with Benjamini-Hochberg adjustment for multiple comparisons to highlight specific contrasts between Sanningasup Tasia catchment and the other lake classes. Conducting this provides an understanding of how Sanningasup Tasia catchment emissions compares to other Arctic waterbody types.
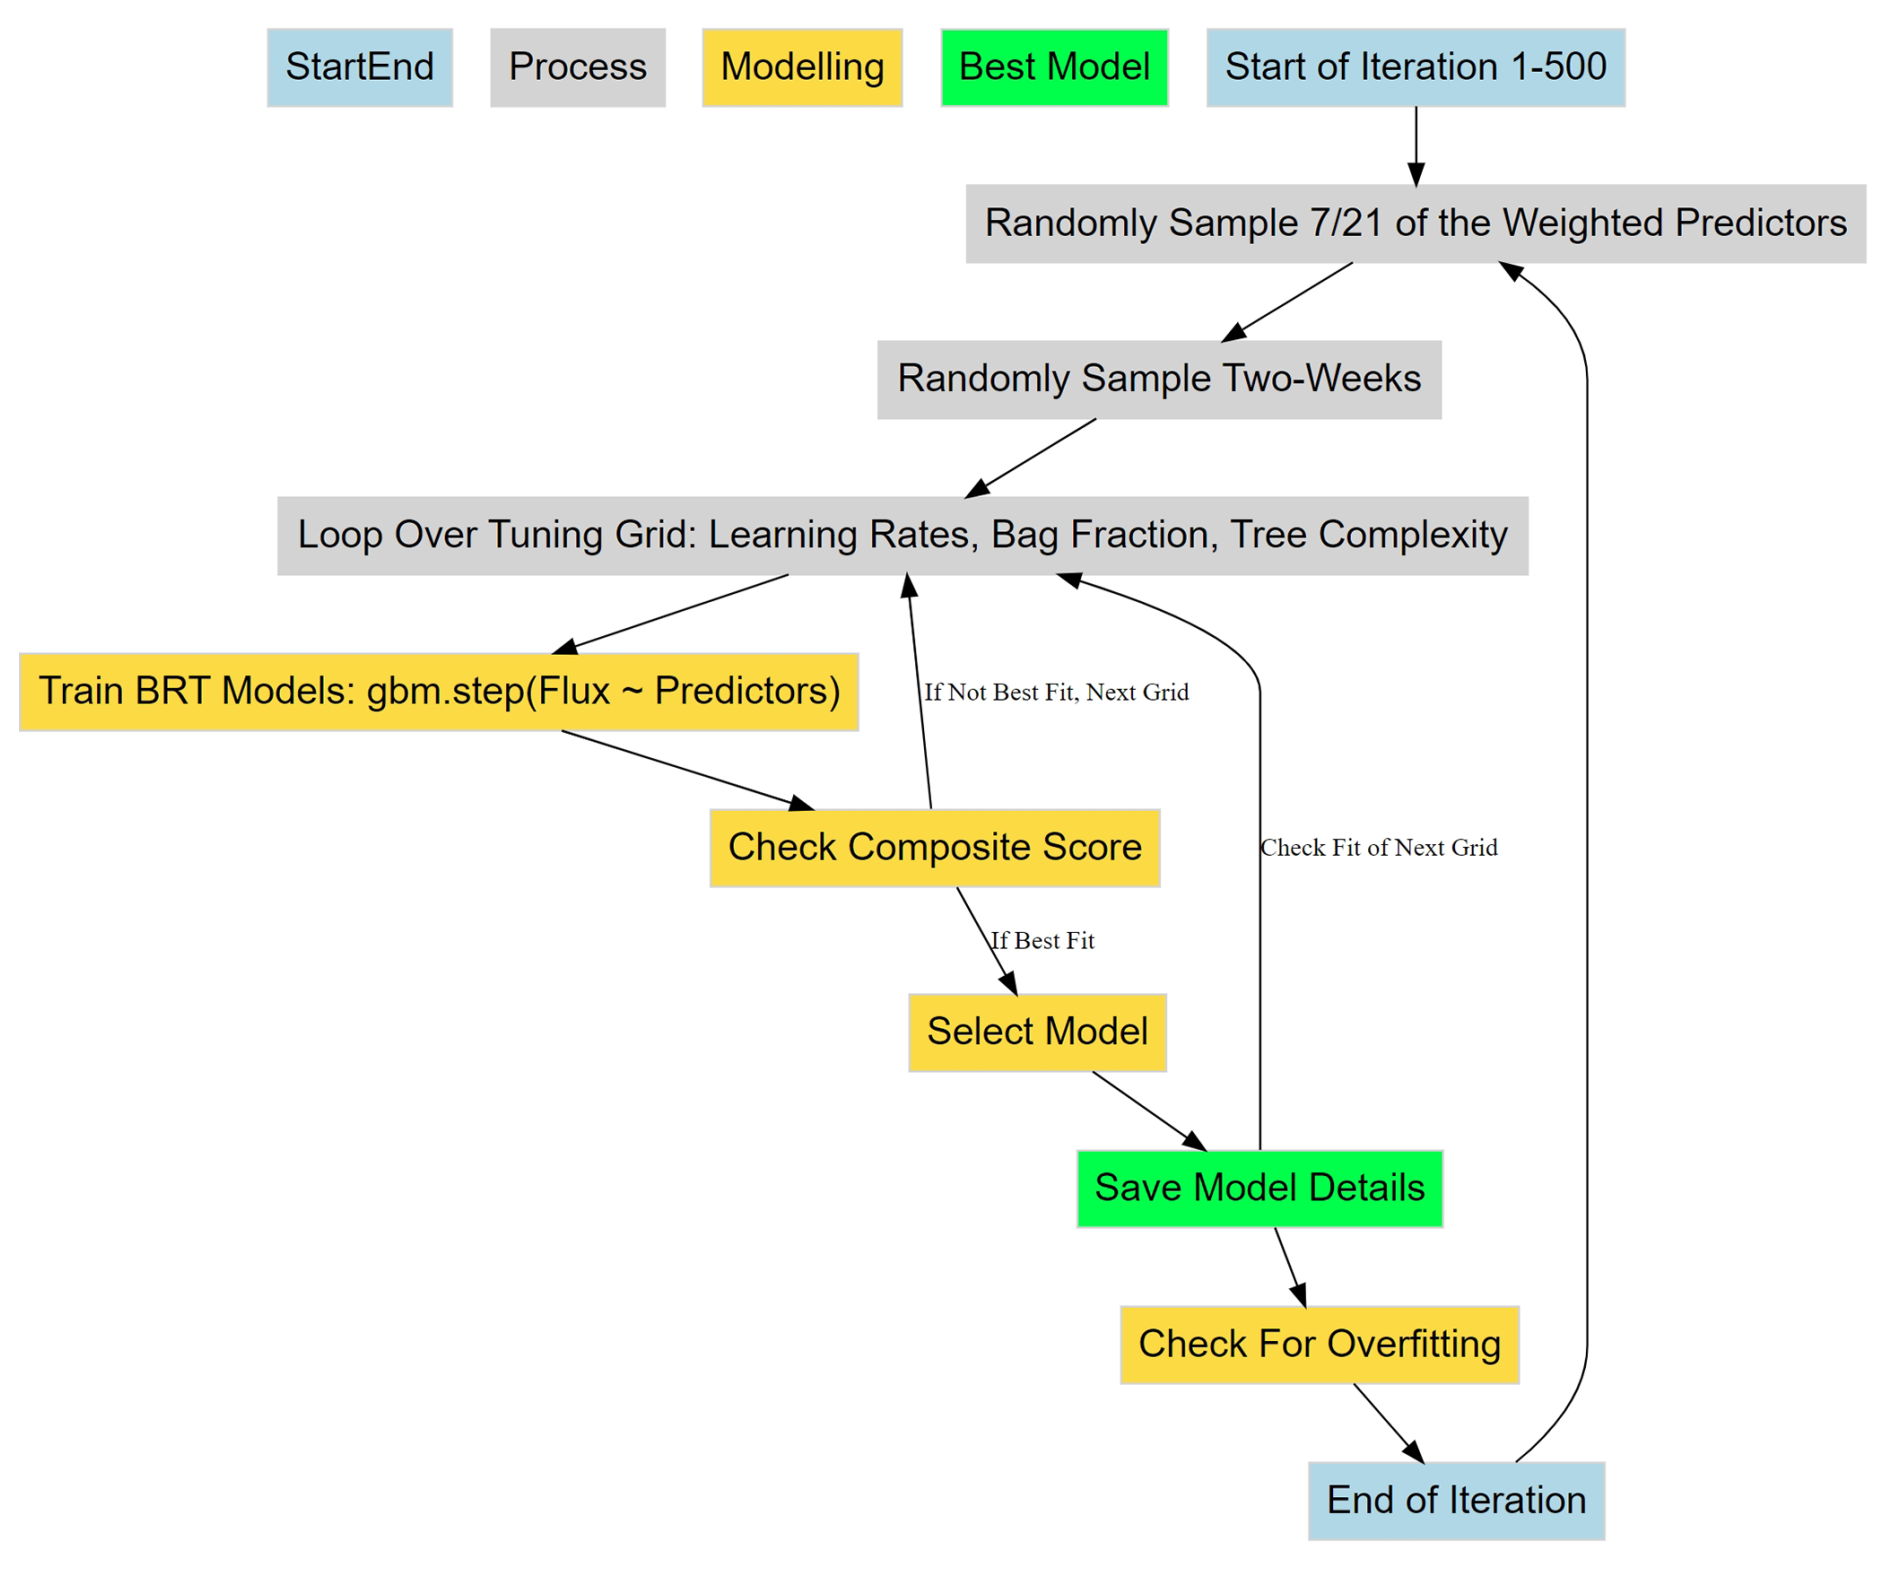
Figure 3Workflow of the iterative randomized process for selecting the best BRT for predicting diffusive CH4 fluxes using various environmental predictors. Blue boxes represent the start and end of a single iteration through an index of weighted predictors, time periods, and tuning grid (grey boxes). Yellow boxes represent the model selection logic, while the green box represents the storage of flux predictions and selected model details for the included predictors and two-week sub-sample of chamber measurements.
2.6 Decoding Methane Drivers
To determine important drivers and their partial effects on diffusive CH4 fluxes, we trained BRT with physicochemical water parameters, catchment soil temperatures, catchment soil moisture, surface air temperatures, local meteorology, and Julian day (Fig. 3). Considering we only collected water temperature in 2023, we used flux data from 2024 for training the BRT. We have focused on diffusive fluxes due to the unpredictability of fluxes when “ebullitive” processes were considered in the models. The diffusive fluxes give us a detailed view of environmental controls shaping CH4 fluxes coming from the catchment. To characterize fluxes we assembled a comprehensive set of predictors including; (a) aquatic variables measured in-situ with a water sonde at each chamber deployment (e.g., Conductivity (µS cm−1), pH, redox potential (mV), dissolved oxygen (mg L−1), oxygen saturation (%), water temperature (°C), and fluorescent dissolved organic matter (FDOM; RFU)) (Fig. S7), (b) catchment soil characteristics collected at nearby climate stations (e.g., soil volumetric water content at 10 cm and soil temperature at 40 cm), and (c) meteorological variables collected from a nearby climate station (e.g., Surface air temperature at 2 cm (°C), Air temperature (°C), relative humidity (%), air pressure (mbar), precipitation (mm), PAR (µmol m−2 s−1), and mean wind speed (m s−1) and direction (°)). Lake water levels (mm) were included to characterize the effect of changing hydrologic conditions and its influence on lake CH4 fluxes. Although water depth was recorded during chamber deployments using the AquaTroll 600, it was not included as a predictor in the BRT models. In shallow Arctic lakes like Sanningasup Tasia (< 4.5 m), CH4 is primarily sediment-derived, with deeper zones more likely to promote oxidation or dilution due to greater oxygen exposure (Bogard et al., 2014; Bulínová et al., 2025; Emerson et al., 2021; Li et al., 2020). Shoreline fluxes often dominate due to anoxic, vegetated sediments, while interior zones tend to suppress emissions (Thompson et al., 2016; Kyzivat et al., 2022; Rasilo et al., 2015). We therefore prioritized biogeochemical water column predictors – FDOM, dissolved oxygen saturation, and GPP – over depth (Christiansen et al., 2015; Singleton et al., 2018), and explicitly captured depth gradients via boat-based chamber deployments across the lake interior. Catchment soil characteristics were included to capture the hydrogeological conditions surrounding the catchment. We used catchment soil temperature at 40 cm to represent subsurface active-layer conditions that influence deeper thermal dynamics, groundwater inflow, and delayed soil heat retention through the thaw season. Soil volumetric water content (VWC) at 10 cm was included to gain an understanding if dryer, or wetter catchment conditions effect surface water CH4 fluxes, and to act as a substitute for water level in the lake early in the season as these two share a Pearson's correlation of r = 0.93. Additionally, we used VWC at 10 cm depth because it was the most complete and continuous dataset across the measurement depths, and highly correlated with VWC at 20, 30 and 40 cm. To reduce multicollinearity amongst the predictors, we set up weighting for random feature selection by calculating the average absolute Pearson correlations between predictors and assigning weights inversely proportional to the correlations, resulting in higher weights given to predictors with decreased collinearity and thus more likely to be included as a predictor.
Using the “gbm.step” algorithm from the R package “dismo” version 1.3.14 (Elith et al., 2008; Hijmans et al., 2023), we iteratively attempted to fit 500 BRT with a subset of randomly sampled two-week time series of flux calculations and 7 of the 21 weighted predictors. Each two weeks must have at least 90 observations, or the date range is buffered on either end of the time series to meet the minimum observation requirement. The algorithm uses 10-fold cross-validation to minimize overfitting the models (Elith et al., 2008). If a randomly sampled two weeks did not meet the minimum required observation of 90, the time series was buffered on both ends of the date range to meet the minimum required observations. BRT were optimized using a grid search where hyperparameters such as learning rate (0.001, 0.002, 0.003, 0.004, 0.005), tree complexity (1, 3, 5, 7), and bag fraction (0.30, 0.40, 0.50), were tuned for each model fit. While bag fraction values in the range of 0.5–0.8 are more commonly used, a lower bag fraction increases stochasticity in tree construction, which helps reduce overfitting – especially important for modeling noisy and highly non-linear CH4 flux data. This conservative approach favors identifying robust general patterns rather than fitting noise or outliers. Variable monotonicity was handled dynamically for each subset of predictors using Spearman's rank correlation. Monotonicity for categorical variables was set to zero, while positive correlations were given a +1 and negative correlations were given a −1. The model with the best composite score was selected for each iteration. The composite score was calculated by adding together the standardized cross-validation error, standardized correlation error, and the cross-validation correlation. The model was finally saved after checking for over fitting by taking the difference between cross validated mean deviance and training mean deviance and dividing the difference by training mean deviance. Because the inherently noisy nature of ecological data, we allowed for 40 % difference between cross validated predictions and training data. We further calculated the percent deviance explained for each BRT model using the formula: % deviance explained = 100 × ((null deviance − residual deviance) null deviance), where the null deviance represents the deviance of a model using only the mean response, and the residual deviance is from the fitted BRT model. Each fitted model and its metadata were saved for further analysis. This modelling structure ensures robustness against outliers and ensures data integrity through dynamically handling monotonicity and applying overfitting constraints. Furthermore, the structure ensures robust predictions of fluxes by accounting for multi-collinearity amongst predictors and flux heterogeneity throughout the season.
To visualize the results of the models, we plotted partial dependence two ways. First, we extracted partial dependence information for understanding model structure, i.e., those predictors and interactions which were used to split trees and decrease cross validated prediction error. In addition, we made isolated predictions for each environmental feature in the model by holding all other predictors at their median to gain a more mechanistic understanding of which conditions and/or processes are directly affecting CH4 fluxes. The two ways of visualizing partial dependence give us an ecological understanding of how integrated direct and indirect effects regulate fluxes from the catchment, but also how individual variables and/or processes regulate fluxes from the water surfaces, respectively. All visualizations were generated using the R package “ggplot2” version 3.5.0 (Wickham, 2016), and the package “DiagrammeR” version 1.0.11 for flowcharts (Iannone and Roy, 2024).
3.1 Overview
Methane fluxes from permafrost affected catchments are influenced by a complex interplay between climatological, hydrogeological, and biogeochemical processes. This study highlights the transient nature of CH4 fluxes from a permafrost catchment in west central Greenland and the partial effects of physiochemical water conditions, local meteorology and catchment conditions (Figs. 4–7). CH4 emissions from the catchment were variable across water conditions, with streams exhibiting the highest emissions (Fig. 4). In comparison to the global coverage of the Boreal-Arctic Wetland and Lake Dataset (Olefeldt et al., 2021), besides small peat lakes, daily fluxes from Sanningasup Tasia at 8.3 mg m−2 d−1 were mostly comparable to other permafrost waterbodies across the Arctic-Boreal region, which ranges between 3.8–5.4 mg m−2 d−1 (Fig. 4). Highlighting the importance of emissions from small streams, Sanningasup Tasia streams showed significantly higher daily fluxes (18.2 mg m−2 d−1) than all inland water body classes, except Yedoma lakes (43.7 mg m−2 d−1). Our results indicate that CH4 fluxes were seasonally variable and controls on fluxes shifted from hydroclimatic factors during colder periods to biogeochemical processes as the catchment warmed and increased in productivity (Figs. 3–4 and A1). The seasonal thaw of annual snow and ice accumulation in the two study years varied in timing and duration due to 2023 staying anomalously snowy until the beginning of July, where in 2024 the number of snow free days aligned with historical records. In 2023, our initial chamber measurements between 3–15 July captured peak median fluxes at 8.9 nmol m−2 s−1 just as the ice began to break on the lake. In an effort to capture similar conditions in 2024, we used an index of historical snow free days on the island which led to us capturing median fluxes of 0.18 nmol m−2 s−1 between 24 May –5 June atop ice and snow. Peak median fluxes of 8.1 nmol m−2 s−1 in 2024, were comparable to 2023, but occurred a month earlier between 11–19 June. As runoff water receded and the catchment warmed, growing season commenced in conjunction with steadily decreasing median fluxes between 3.9 and 4.5 nmol m−2 s−1. This study further provides methods to disentangle important drivers and their partial effects on CH4 fluxes using BRT (Figs. 3–4). In general, CH4 fluxes were strongly dependent on discrete oxic-anoxic aquatic environments under the chamber (Figs. 4 and A1). This research emphasizes the importance of integrating field measurements with GIS-based spatial analysis to monitor CH4 fluxes in permafrost catchments. It further drives home the importance of seasonal transition periods in predicting fluxes from Arctic waterbodies.
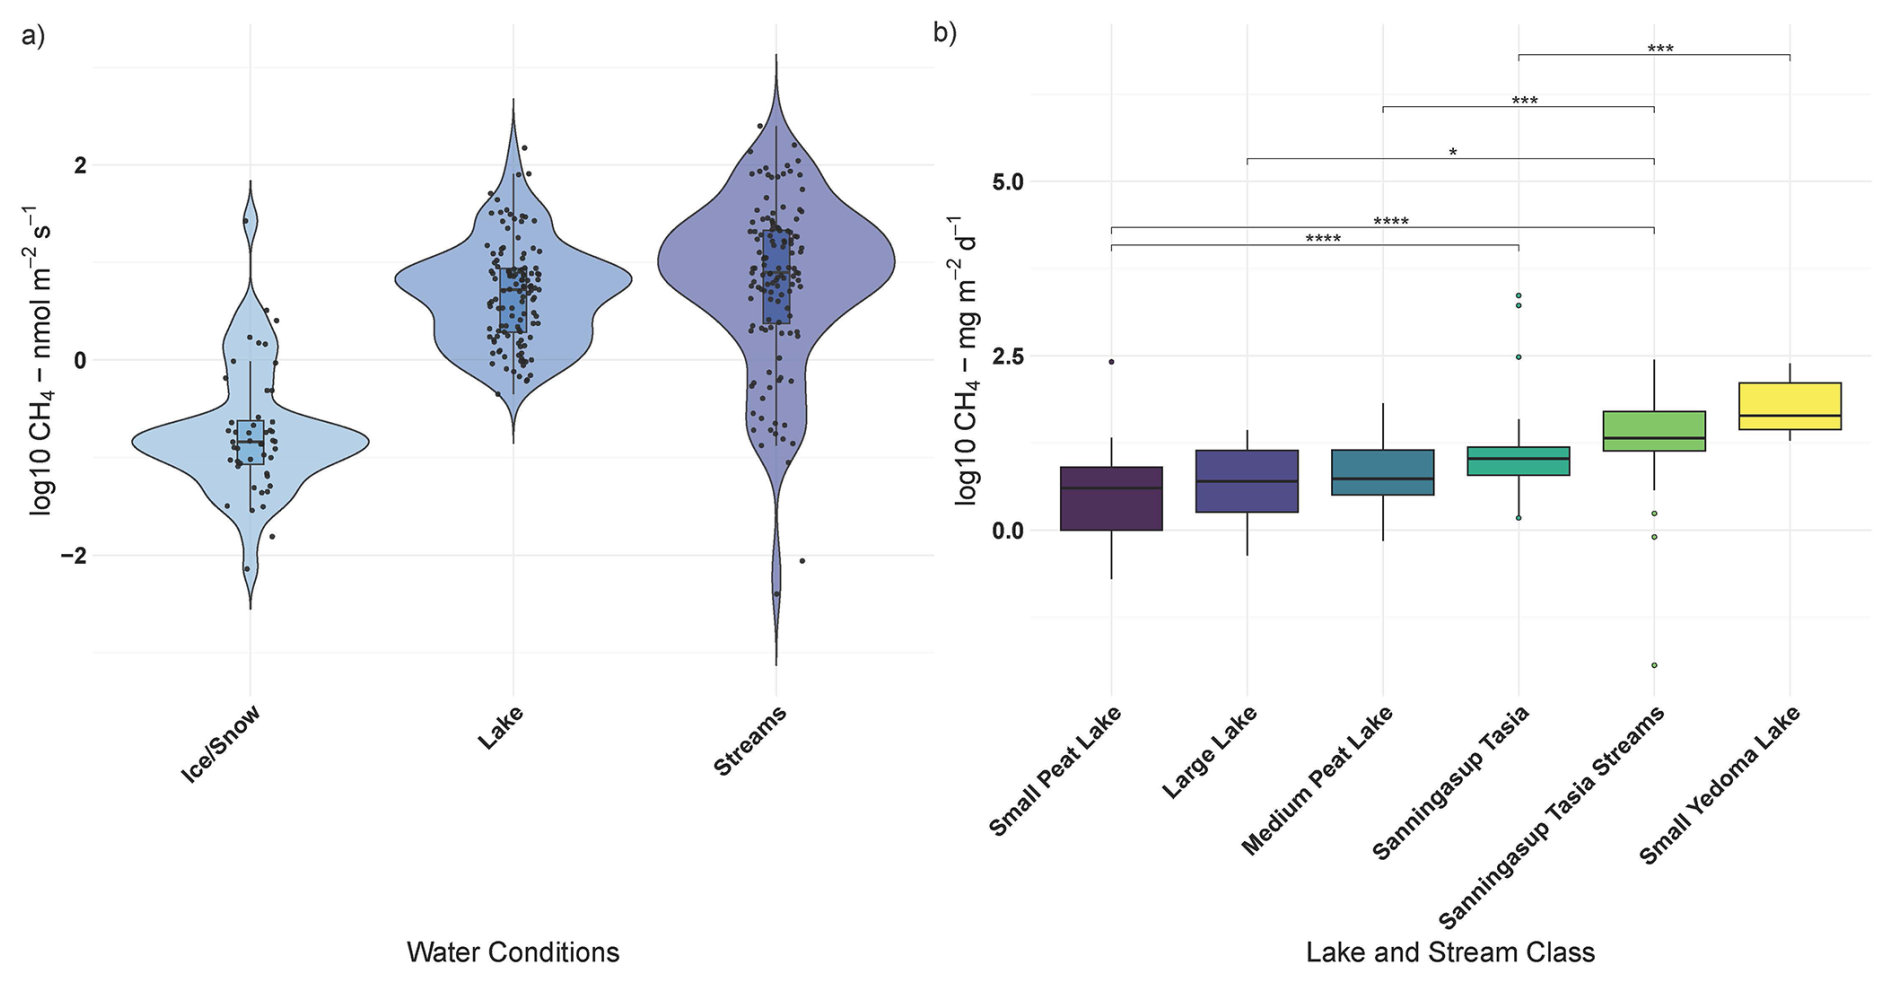
Figure 4Panel (a) shows log transformed CH4 fluxes across the different catchment water conditions during 2024 field season and panel (b) compares log transformed daily CH4 fluxes (y axis) between Sanningasup Tasia catchment and other permafrost waterbodies (Kuhn et al., 2021a) across the Arctic-boreal region. Connecting brackets and stars show, for example, that Sanningasup Tasia had significantly (p < 0.05) higher daily emissions when compared to Small Peat Lakes, while daily emissions from Sanningasup Tasia Streams were significantly higher than all lake classes except Yedoma Lakes.
3.2 Spatial and Temporal Evolution of Methane Fluxes
In both 2023 and 2024, spatial and temporal evolution of fluxes occurred somewhat heterogeneously in the catchment, but generally “hotspots” occurred in the streams and where they enter the lake (Fig. 5a–b, e–f). Despite different time periods of the thaw, fluxes in the catchment in both years followed a similar trajectory, with peak fluxes occurring post thaw and decreasing through the growing season. In 2023, snow persisted anomalously late into the summer season, and soil temperatures were the coldest recorded in a 6-year record (Fig. S8). We found that local climate and catchment soil characteristics were at times, (i.e., during the thaw season and towards the peak of growing season) more important than water temperature in predicting 2023 fluxes, suggesting catchment contributions to surface waters plays an indirect role in CH4 fluxes (Fig. S9). While water temperature was found to be relatively important in both years, catchment CH4 fluxes in 2024 suggest the system is more driven by variability in dissolved organic matter and microbial production of oxygen (Figs. 4–7 and A1).
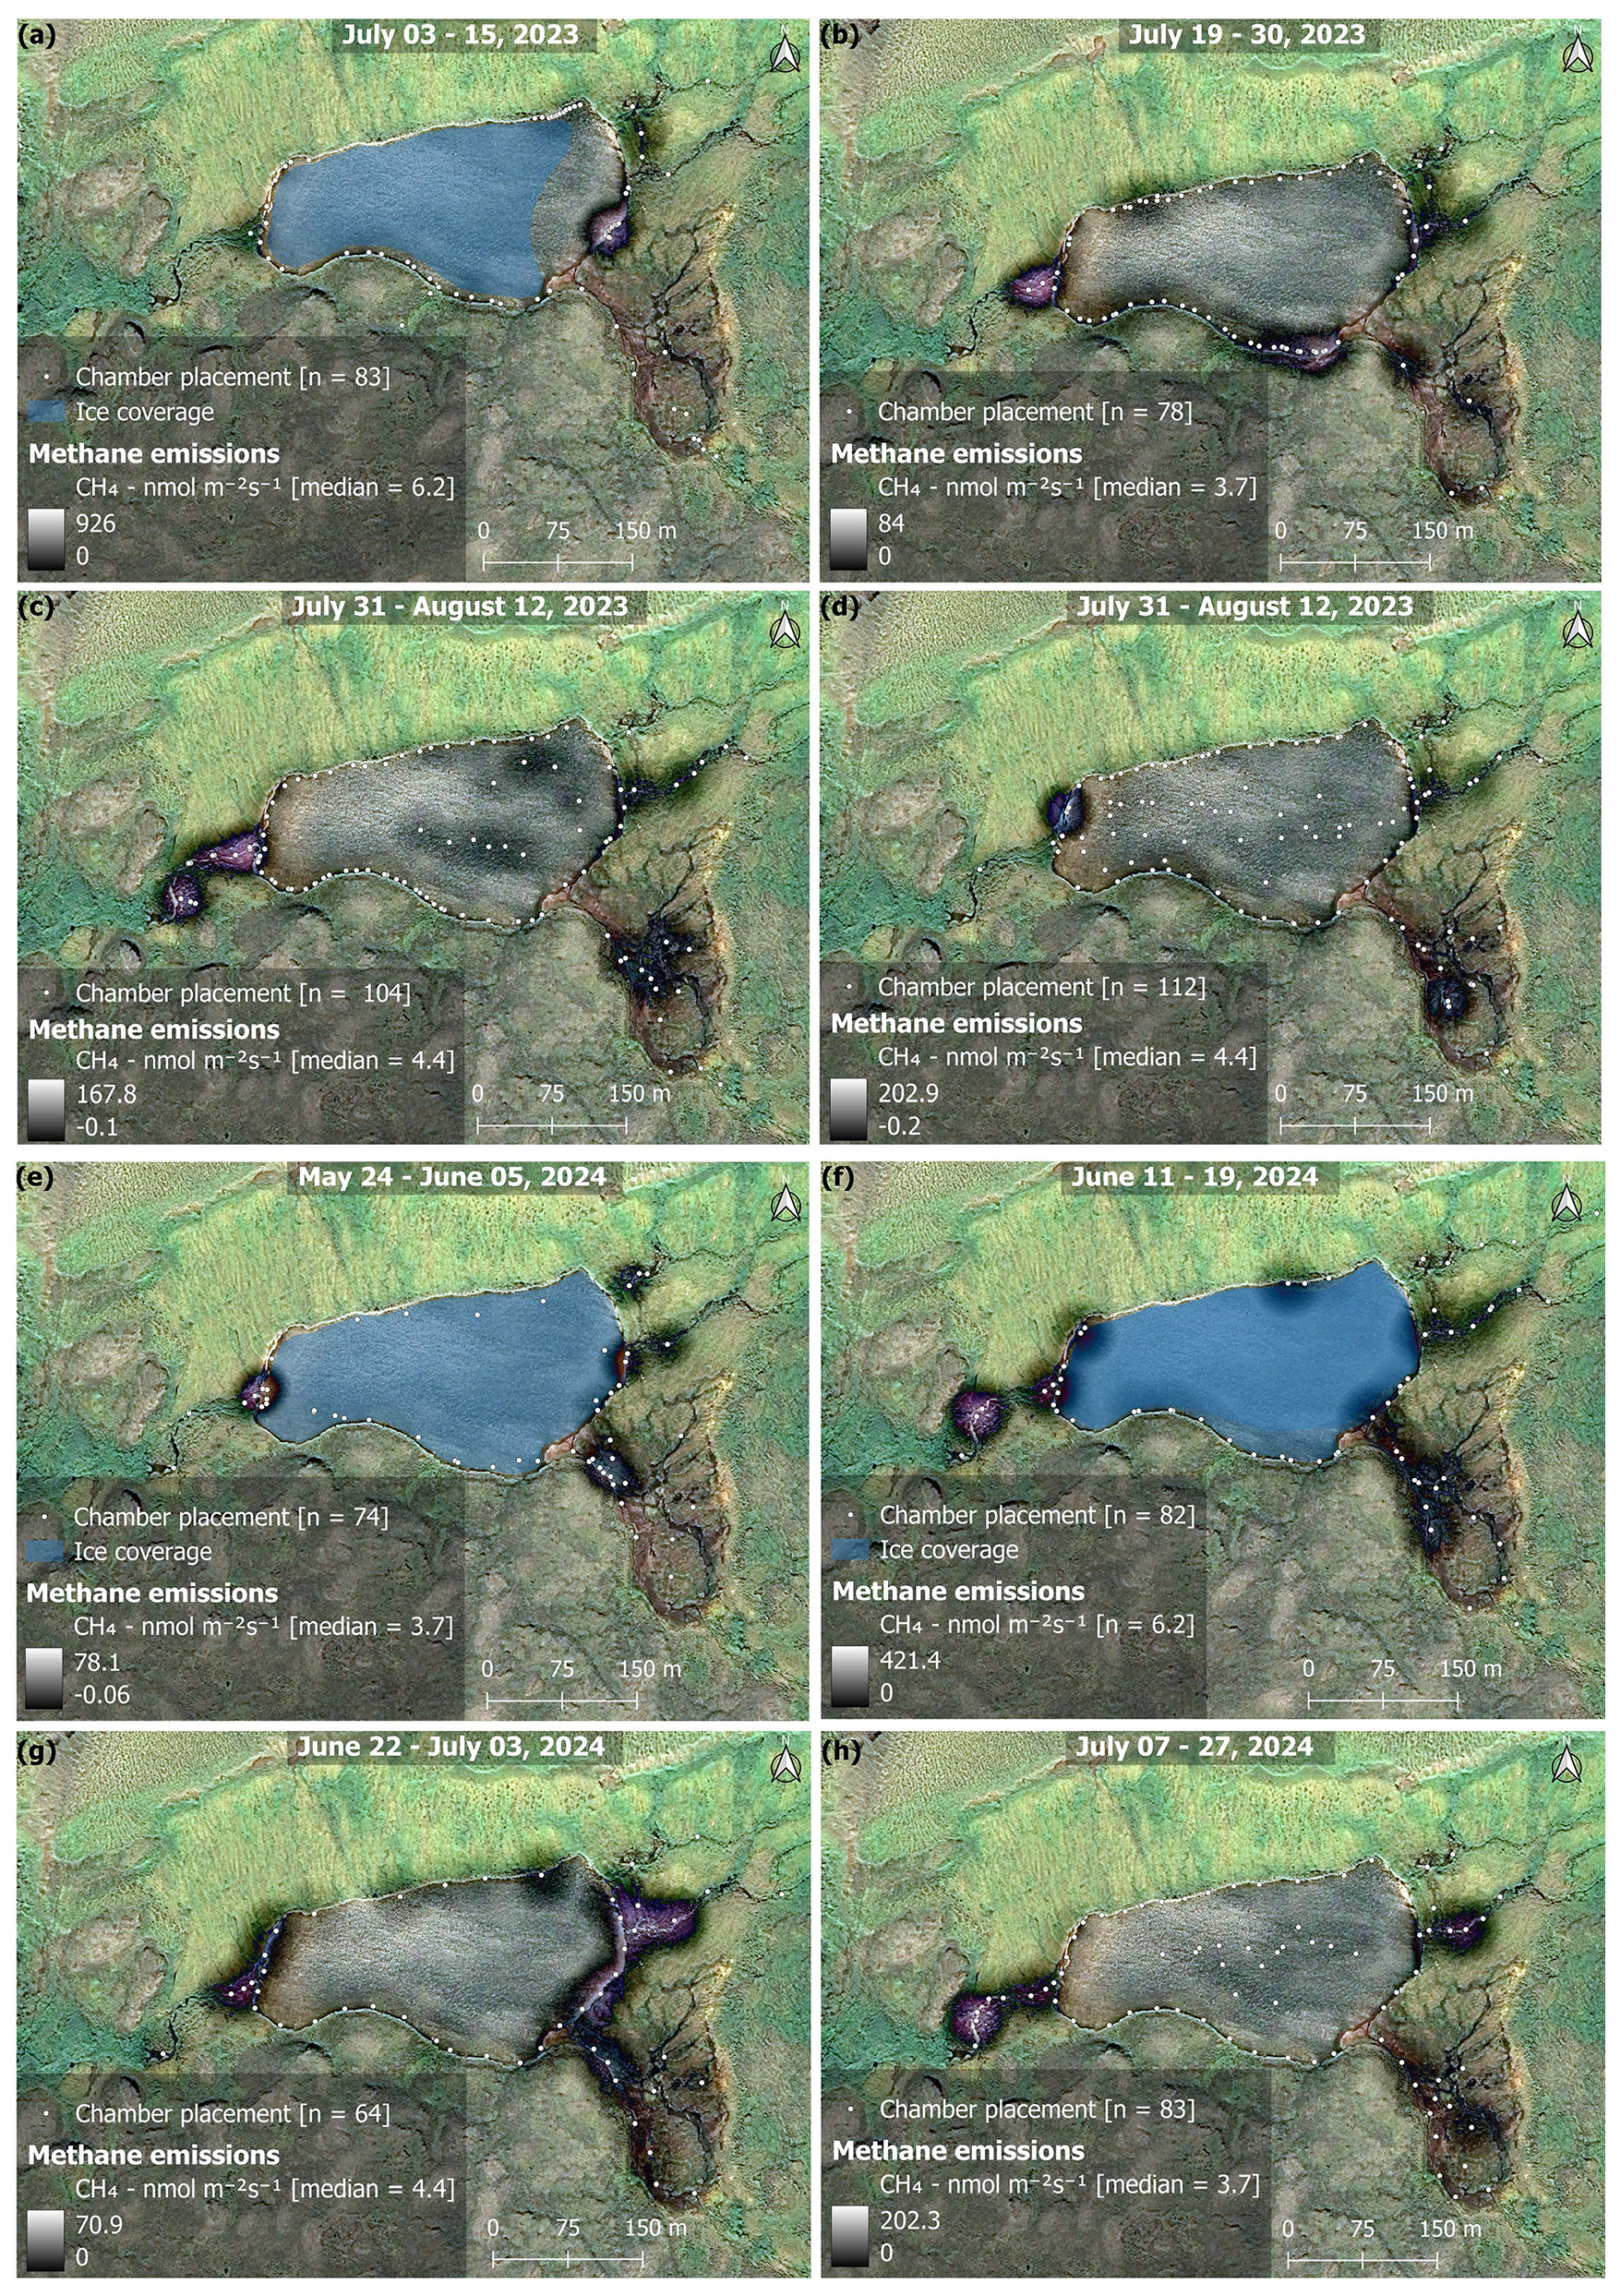
Figure 5Maps showing the bi-weekly spatial evolution of CH4 emissions during 2023 (a–d) and 2024 (e–h). The time period covered in each map is given at the top of each map. Whiter colors represent areas of high emissions, while darker, or no color represent areas of lower, or no emissions (see color bars in map legends). Areas outside of the water were not measured and are artifacts from the KDE mapping algorithm interacting with the image (i.e., purple color = no data). Each white point on the map represents the placement of the floating chamber. Orthomosaic background image © CNES (2023), Distribution Airbus DS, produced from Pléiades 1B satellite imagery.
The main inlet to the lake is a warm spring with median temperatures of 7.4 °C and tended to be a persistent location throughout the season for increased CH4 fluxes. The warm spring area in the southeast is a complex area where a perennial spring bubbles out of the ground forming a perennial tributary to the lake. However, the spring seeps out along the base of the hillslope to the east, subsequently forming a peat fen environment (Fig. 5). The eastern most inlets are fed by meltwater flowing through the vadose zone, but also served as a persistent location for increased CH4 fluxes. Fluxes from inlet streams followed along an upland-wetland environmental gradient, where fluxes at the headwaters of streams were generally close to 0, or slightly taking up CH4, but steadily increased as steeper upland slopes gave way to more gradual water saturated slopes and pooling sediments. This is consistent with previous work on the island showing CH4 fluxes association with soil microbial assemblages shifting from methanotrophic to methanogenic along an upland-wetland gradient, respectively (Christiansen et al., 2015). Additionally, the catchment serves as micro-topography previously described as an area of snowmelt retention, and subsequently an area of nutrient and/or dissolved organic matter pooling (Westergaard-Nielsen et al., 2020), which has an impact on CH4 fluxes throughout the season (Fig. 7). While high fluxes were recorded along the shore and in the open water of the lake, fluxes tended to be patchy and decreased moving away from the inlet streams (Figs. 5 and S10). However, as soon as the lake water flowed to the outlet, fluxes increased substantially. As the summer season progressed, CH4 fluxes declined across most of the catchment, becoming largely confined to the warm spring inlet and the eastern inlet streams (Fig. 5). Field observations of late-season fluxes in 2024, found decreased fluxes were associated with submerged filamentous green algae in stream channels, while assemblages of iron-oxidizing bacteria on the stream banks were associated with increased fluxes, (Fig. A2). The spatial and temporal evolution of fluxes was driven by seasonally shifting environmental conditions.
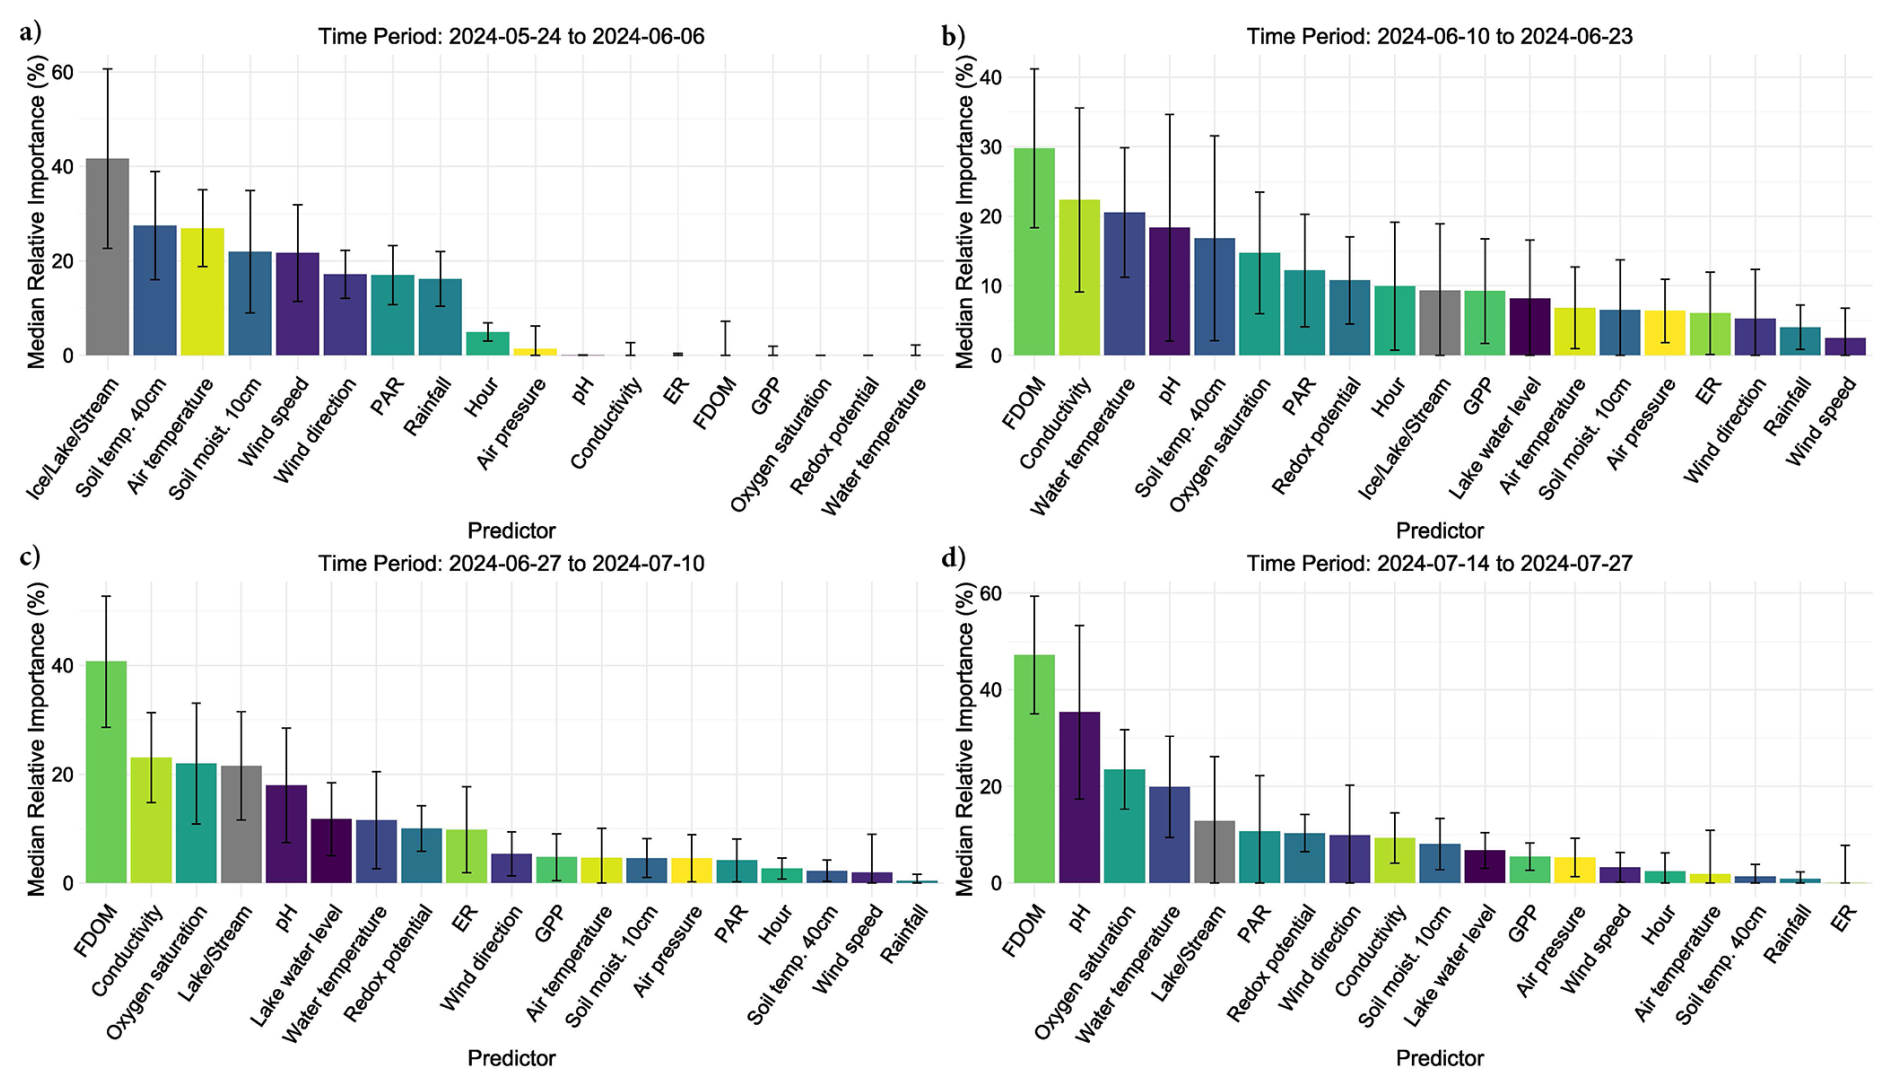
Figure 6Bar charts show the relative importance of environmental conditions predicting diffusive CH4 fluxes using bar-plots and standard error bars. Each predictor variable is on the x-axis, while its percent importance for its inclusion in a fitted BRT is given on the y-axis where the standard error bars represent variability in importance based on presence or absence in a given model. Each bar color represents a distinct environmental condition.
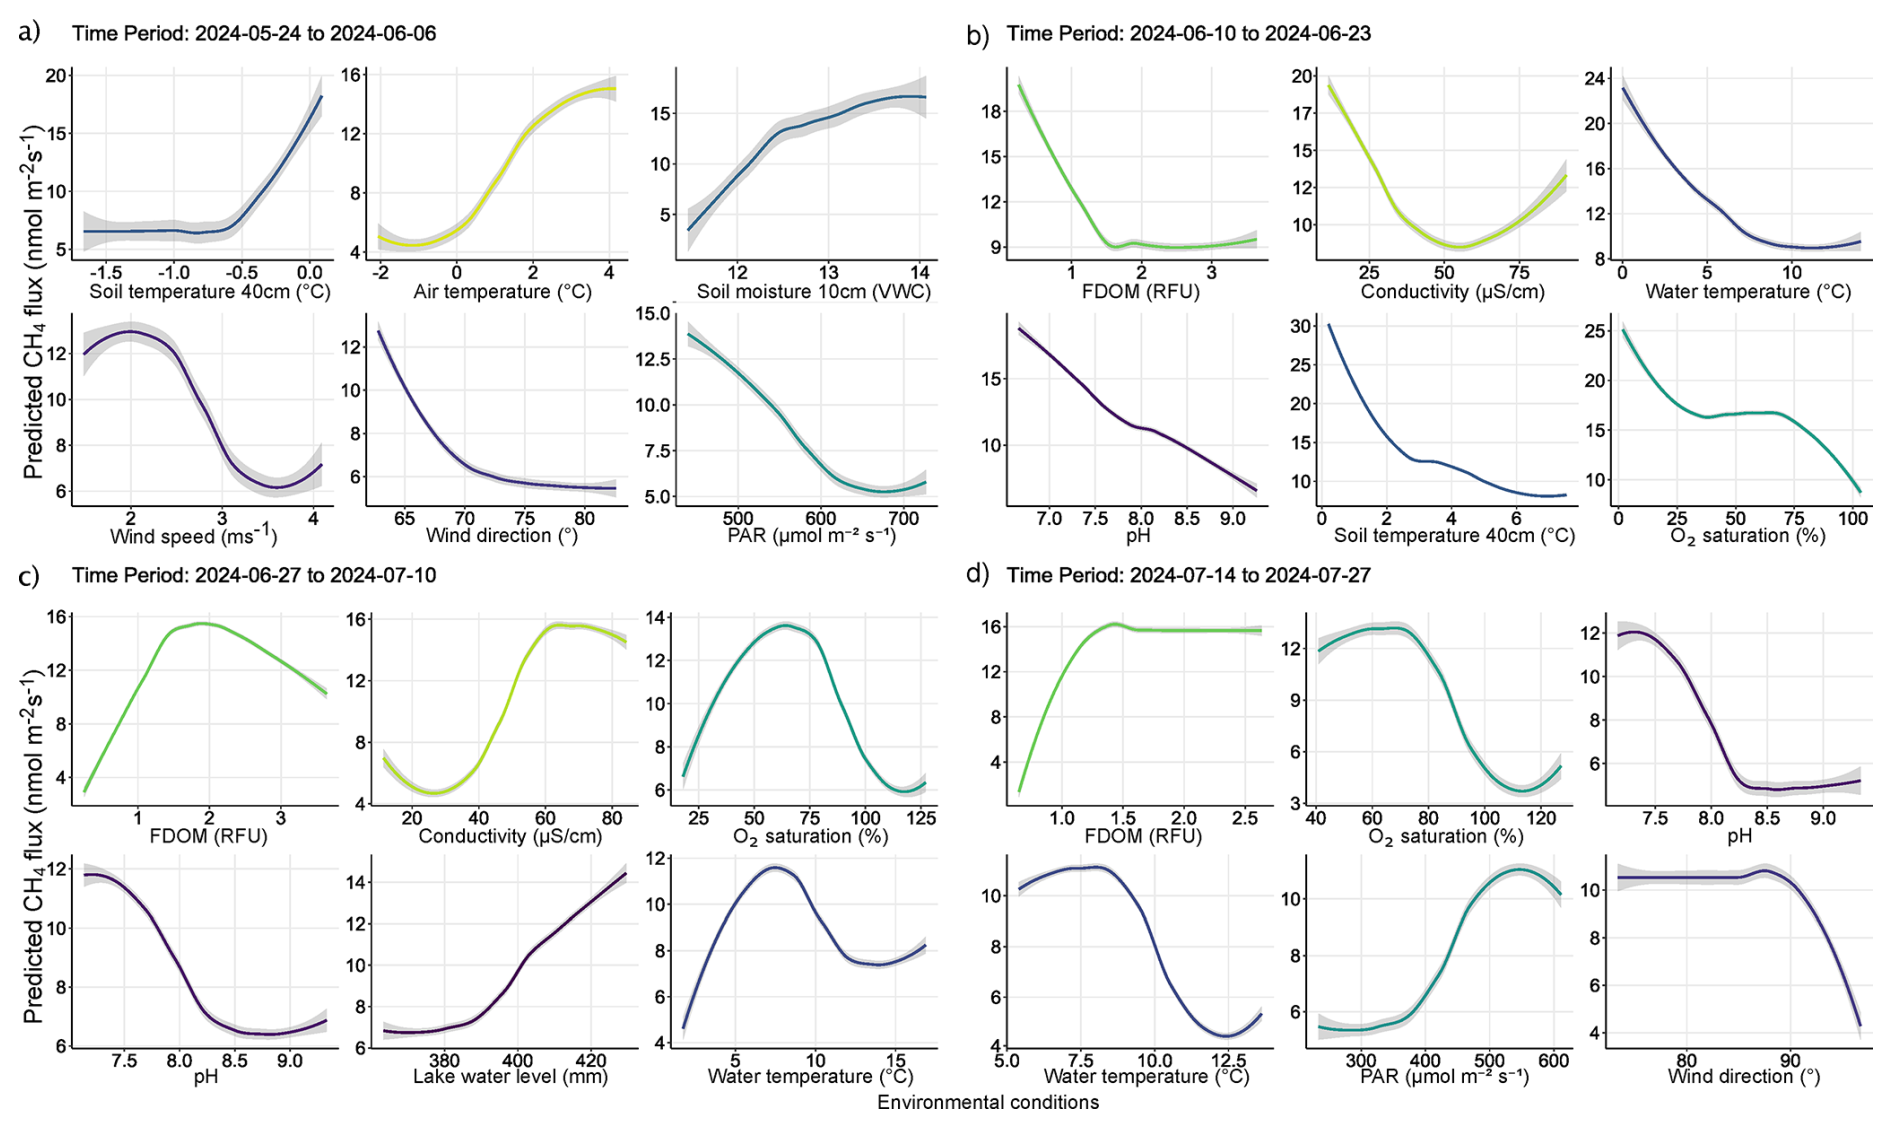
Figure 7Partial dependency plots illustrating the indirect and direct marginal effects of various environmental conditions predicting diffusive CH4 fluxes. Each panel displays the effect of a numerical predictor used during model training to predict CH4 fluxes. Although some predictors may not have been directly involved in regulating fluxes from water surfaces, their evaluation reveals the relationship between water column conditions and catchment processes regulating CH4 fluxes. The figures are ordered by importance in each time period and the colors correspond to those seen in Fig. 6. The colored lines represent the result of a fitted general additive model (y∼s(x)) and thus a smooth representation across the 321 fitted BRT models. The grey shaded area around the line represents ±SE (0.02–0.2). Each predictor and its numerical range are given on the x-axis, while predicted fluxes are given on the y-axis.
3.3 Boosted Regression Tree Results
Out of 500 iterations, 321 BRT were fit, and showed good alignment and consistently performed well in cross-validation, with a correlation median of 0.40 between observed and predicted values, and a median deviance standard error of 131. Between 8.4 % and 62.4 % with a median of 27.3 % of the CH4 flux variability was explained by the various models and included environmental conditions, suggesting a substantial proportion of CH4 fluxes were explained by the environmental conditions included. The calculated root mean squared error (RMSE), which reflects the average magnitude in prediction error of the BRT, ranged between 6.5 to 28 nmol m−2 s−1, with a median of 13.7 nmol m−2 s−1. The summary statistics reflect models that performed reliably and with fairly good accuracy in predicting diffusive CH4 fluxes from the catchment in 2024. The models predicted shifting relative importance (Fig. 6) and partial effects of the various environmental conditions throughout the season (Fig. 7). The magnitude of CH4 fluxes predicted by the BRT models were strongly influenced by localized biogeochemical conditions within the water column based on whether the flux was originating from the lake, stream, or if it was influenced by ice or snow (Figs. 4–7 and A1a–d). Visualizing partial dependence of predictors important for model structure, revealed integrated ecological effects between local meteorology, catchment conditions and physiochemical water conditions (Fig. 7). However, isolated direct marginal effects of the various environmental conditions suggest fluxes from water surfaces are directly regulated via biochemical processes associated with GPP and ER of oxygen (Fig. A1b–d).
3.3.1 Spring Thaw Phase: Peak Fluxes Driven by Hydrological and Climatic Controls
The spring thaw phase marks a shift in catchment conditions, where a frozen landscape gives way to thaw season and hydro-connectivity between land and water is strong (Fig. 5c–d, g–h). In the spring thaw phase, initial peak fluxes of CH4 were primarily dependent on increasing rainfall, changing wind conditions, warming air and soil temperatures, and increased soil moisture content, while low dissolved organic matter (i.e., FDOM) indicated increased fluxes (Figs. 6a–b and 7a–b). Soil moisture was found to have a Pearson's r = 0.93 with lake water levels, suggesting the lake levels are strongly connected to snowmelt and groundwater hydrology (Fig. S11). The distribution of nutrients on the island has been shown to be linked to snowmelt and hill slope topography (Westergaard-Nielsen et al., 2020), which is likely playing a role during the early part of the season, but especially later in the year as DOM, a proxy for nutrients, becomes the primary limiting factor in predicting higher fluxes (Fig. 7b–c) (Olid et al., 2021, 2022). The processes driving CH4 fluxes from water surfaces is likely two-fold.
As snowfall turned to rain, the thawing of soils accelerated and water content in the active layer increased, potentially driving peak emissions via the lateral mobilization of dissolved CH4 toward surface waters (Fig. 7a–b) (Walter Anthony et al., 2012; Neumann et al., 2019; Olid et al., 2022). However, as the thaw progressed, contributions to fluxes from catchment soils decreased as the upper layers began to dry and lake water levels reached their maximum (Fig. 7b–c). DOM serves as a critical substrate for both CH4 production and oxidation, particularly in permafrost-influenced regions where thawing can release large amounts of particulate matter (Keskitalo et al., 2021; Bouranis et al., 2025). Anaerobic conditions in water saturated soils and low oxygenated waters may have further driven fluxes during the thaw period as methanogenic microbial communities rapidly consumed incoming labile organic compounds (Neumann et al., 2019; Stevenson et al., 2021). However, as the thaw progressed, the lake briefly shifted to net-autotrophy (Fig. S6), marking an important shift from hydroclimatic controls on fluxes, to a patchwork of biochemical transport pathways and barriers (Figs. 7b–d and A1b–d). During this transition, increased GPP and the resulting oxygen saturation in the lake and streams enhance methanotrophic activity, thereby promoting methane oxidation and reducing net CH4 emissions (Figs. 7b–c and A1b–c). The central role of oxygen availability and active methanotroph communities in regulating methane fluxes during Arctic thaw has been demonstrated in both tundra landscapes and permafrost mires (Christiansen et al., 2015; Graef et al., 2011; Singleton et al., 2018). As oxygen production increases, greater amounts of oxygen become available to support methanotrophic activity in the water column. Methanotrophic activity is likely represented in the observed reduction of CH4 fluxes during periods of decreased ER (i.e., when oxygen consumption is elevated, Fig. A1c), as higher oxygen availability enhances aerobic methane oxidation (Fig. 7c). However, the streams remain net heterotrophic despite increasing GPP and ER during this time period, therefore providing a more suitable environment for CH4 production and flux (Fig. S6). Thus, the lake and streams reflect distinct ecosystems for the production and flux of CH4, where the lake being an overall methane source, has a greater tendency to oxidize CH4 following the thaw, while the streams follow along a low-to-high flux gradient as the slope flattens and soils become saturated (Westergaard-Nielsen et al., 2020; Stevenson et al., 2021).
3.3.2 Growing Season: Oxic-Anoxic Transport Pathways and Barriers
Early in the growing season the lake and streams enter into a transition phase, where peak fluxes become increasingly dependent on biochemical pathways related to DOM availability, conductivity, oxygen saturation and pH (Fig. 7c). DOM is the limiting factor late in the season where higher fluxes are increasingly dependent on water column conditions with greater levels of DOM (Figs. 6c–d and 7c–d). CH4 fluxes during this time period were strongly associated with indicators of microbial activity forming oxic-anoxic transport barriers, or pathways, respectively. For example, microbial activity in anoxic sediments maybe producing CH4, but whether it is diffused to the atmosphere is directly affected by the micro-conditions of the water column (e.g., DOM, conductivity, pH, and/or GPP/oxygen saturation), either forming an oxidative barrier, or an anoxic pathway (Figs. 7c–d and A1). For example, groundwater transport of CH4 from anoxic sediments to oxygen-rich streams may result in water with high concentrations of both. While some of the CH4 is likely oxidized during transport, it can be that both are respired at turbulent sections of the stream, which were the highest fluxes observed from the streams and during this phase of the season (Street et al., 2016; Neumann et al., 2019; Olid et al., 2022; Kleber et al., 2025).
Fluxes are further affected by water conditions either favoring methanogenic, or methanotrophic activity (Conrad, 2007; Cunada et al., 2021; Emerson et al., 2021). pH levels near neutral likely indicate water conditions favorable to methanogenesis at the sediment-water interface, while increasing alkalinity may reduce methanogenic and/or favor increased methanotrophic activity as growing season progresses (Fig. 7c–d). For example, during growing season micro-pH and oxygen saturation conditions in the lake and streams are influenced by the ever-increasing presence of macrophytes, mosses and plankton, which tend to drive pH and oxygen levels higher (Liebner et al., 2011; Cunada et al., 2021). Here we show that increasing pH and oxygen saturation, as a result of primary production, create an aerobic environment that favors methanotrophic activity, thereby driving CH4 emissions down through the growing season (Figs. 7c–d, A1). Declines in oxygen saturation driven by microbial respiration can create anoxic conditions that enableCH4 emissions from sediment to surface waters (Conrad, 2007; Michel et al., 2010; Street et al., 2016; Cheng et al., 2024). Such a mechanism likely explains the formation of flux hotspots associated with decomposing iron-oxidizing bacterial mats along stream banks (Fig. A2) (Wallenius et al., 2021; Cheng et al., 2024). In the case of the bacterial mats, we observed fluxes were highest in the streams where bacterial assemblages had become exposed to the atmosphere and were decomposing in stagnant water (Fig. A2), which may suggest that the decomposition of the bacteria was releasing dissolved organic substrates in a low-oxygen environment already primed for methanogenic activity (Wallenius et al., 2021; Cheng et al., 2024). This idea is supported late in the season when increased CH4 emissions become dependent on niche environments where moderate levels of dissolved organic matter (FDOM) and low oxygenated water predict higher fluxes (Figs. 7d and A1d). However, submerged bacterial mats along with filamentous green algae the presence of macrophytes and/or mosses in the lake and streams, were associated with lower fluxes, suggesting they form oxidative barriers for CH4 fluxes from the sediment when submerged (Figs. 7d and A1d) (Heilman and Carlton, 2001; Laanbroek, 2010; Liebner et al., 2011; Esposito et al., 2023). The submerged, or not status of bacterial assemblages' points to an interesting feedback mechanism between CH4 fluxes and dropping water levels creating variability in emission pathways. Similar oxidation processes have been shown in relation to submerged brown mosses in other Arctic tundra ecosystems (Žárský et al., 2018). Overall, these results highlight the broader importance of fine-scale biogeochemical dynamics shaping CH4 fluxes from a permafrost catchment and provide an important data point in an uncertain region of the world.
This research provides a temporally resolved catchment scale CH4 flux analysis across different waterbody types and conditions – lake, streams, and ice/snow-covered surfaces – subsequently describing important biogeochemical and climatic controls on emissions. Often lost in temporally coarse assessments is a detailed understanding of seasonal transitions in processes related to CH4 fluxes and environmental control mechanisms. Leveraging BRT to fit hundreds of randomized models and visualizing the direct, and indirect controls on CH4 fluxes reveals variability in how, for example, DOM and/or water temperature affect fluxes differently as the Arctic summer progresses. We presented an approach which captures ecosystem-scale effects, but furthermore describes isolated mechanistic effects related to, for example, GPP, revealing that primary productivity plays a critical role in regulating CH4 emissions from permafrost affected waterbodies. This work contributes to understanding carbon feedback mechanisms in a region where process-level knowledge is needed to scale global models simulating CH4 emissions from permafrost affected waterbodies.
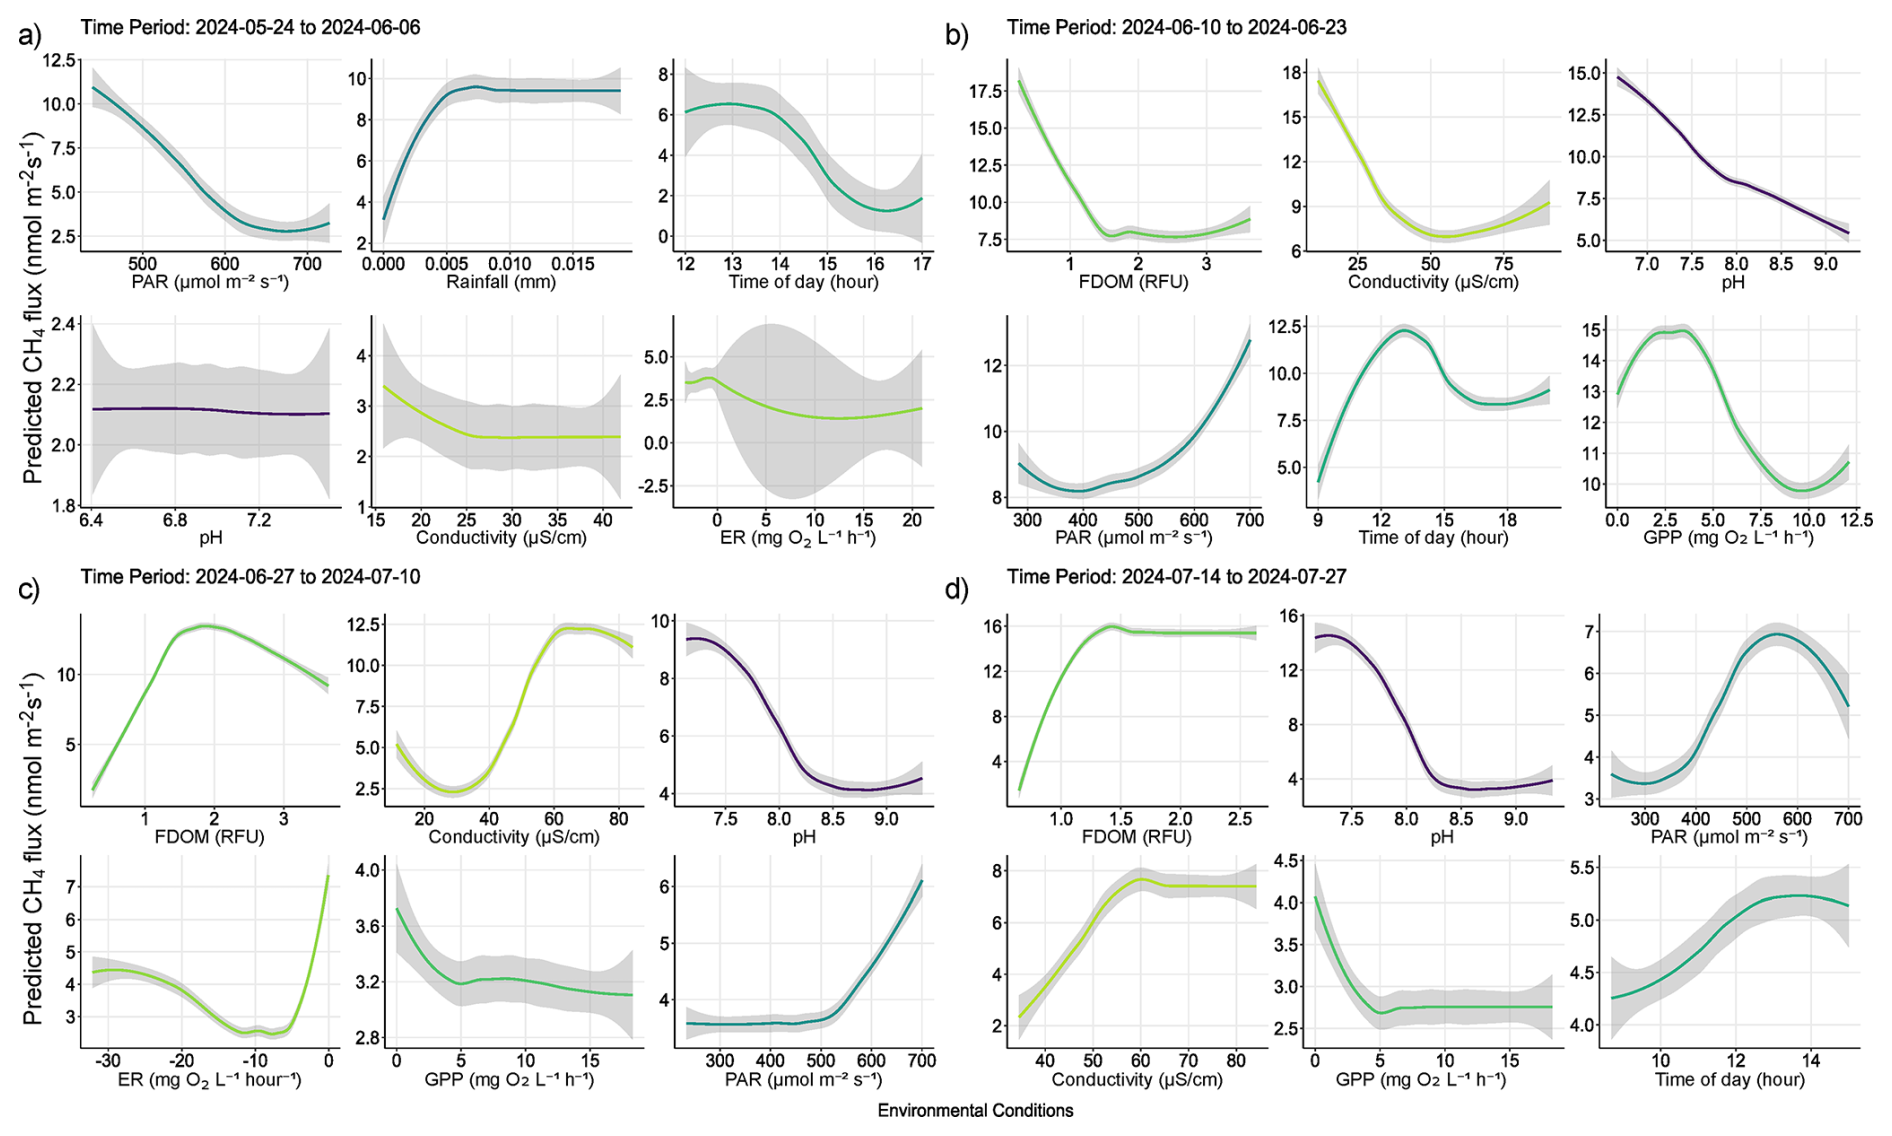
Figure A1Partial dependency plots illustrating predicted marginal effects of meteorological, and biochemical water conditions predicting diffusive CH4 fluxes. Each figure represents the direct marginal effect on CH4 fluxes when all other predictors are held at their median, therefore giving a more mechanistic understanding of those conditions and processes regulating fluxes from water surfaces. The figures are ordered by importance in each time period and colors correspond to those seen in Fig. 6 of the main text. The colored lines represent the result of a fitted general additive model (y∼s(x)) and thus a smooth representation across the 321 fitted BRT models. Each predictor and its numerical range are given on the x-axis, while predicted fluxes are given on the y-axis.
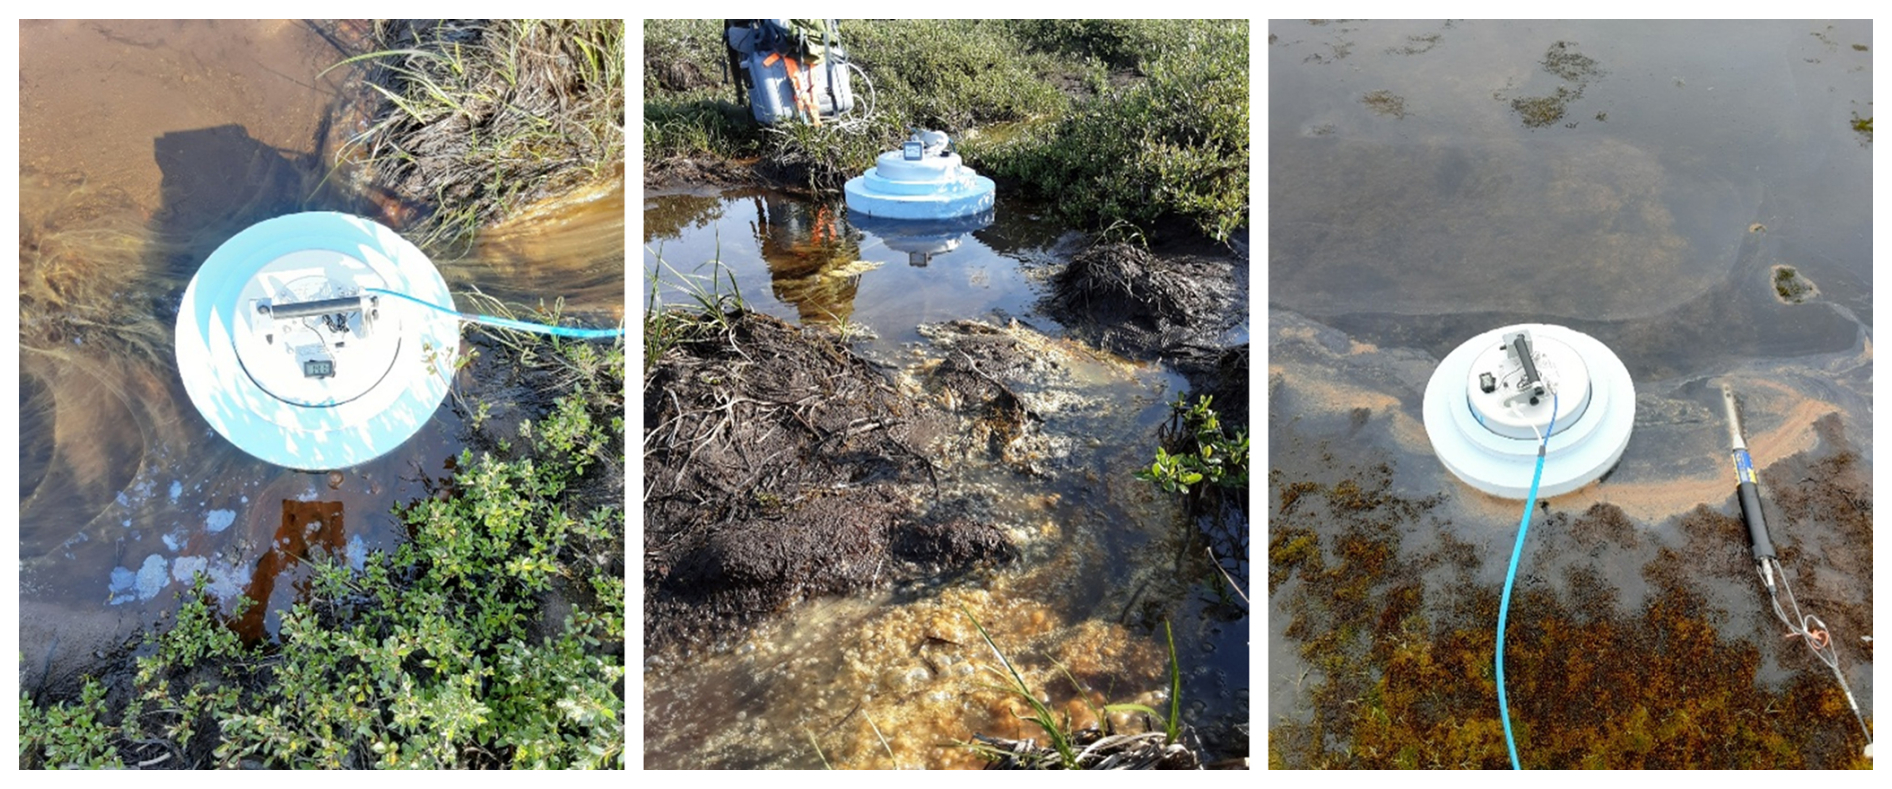
Figure A2Image showing the various microbial forms encountered and found to influence CH4 fluxes from the catchment area. In the photo on the far left we can see gas film on the water surface which was associated with submerged iron-oxidizing microbial assemblages, i.e. similar to what is shown in the middle photo, however exposed to the atmosphere in lower water levels. The photo on the right shows a brown alga which formed in the warm spring area southeast of the lake. In all cases, increased fluxes were generally encountered when measuring atop the middle and right microbial assemblages.
The fluxCH4 R code is openly available via Zenodo at https://doi.org/10.5281/zenodo.18241611 (Thayne, 2026) and developed on GitHub (https://github.com/mthayne527/fluxCH4, last access: 15 January 2026).
Meteorlogical can be accessed here: https://doi.org/10.17897/FEGK-0632 (Greenland Ecosystem Monitoring, 2026a), and soil data here: https://doi.org/10.17897/6G78-P793 (Greenland Ecosystem Monitoring, 2026b), https://doi.org/10.17897/9N7Z-GA63 (Greenland Ecosystem Monitoring, 2026c), and can be accessed via the Greenland Ecosystem Monitoring website: https://data.g-e-m.dk/datasets?theme=climate (last access: 8 April 2024). BAWLD circum-Arctic waterbody dataset can be found here: https://doi.org/10.18739/A2DN3ZX1R (Kuhn et al., 2021b, a). Water chemistry and chamber data can be requested from Torsten Sachs at Helmholtz Centre for Geosciences in Potsdam, Germany (GFZ).
The supplement related to this article is available online at https://doi.org/10.5194/bg-23-477-2026-supplement.
MWT collected, compiled and analyzed data, and wrote the manuscript. KK contributed to collecting, compiling, and analyzing data and writing parts of the manuscript. CW contributed to methodological guidance and providing feedback and writing parts of the manuscript. AK contributed to providing comments, feedback, and guidance on interpreting results and writing various parts of the manuscript. TS contributed to collecting data, providing comments, feedback, and guidance on interpreting results and writing the manuscript.
The contact author has declared that none of the authors has any competing interests.
Publisher's note: Copernicus Publications remains neutral with regard to jurisdictional claims made in the text, published maps, institutional affiliations, or any other geographical representation in this paper. The authors bear the ultimate responsibility for providing appropriate place names. Views expressed in the text are those of the authors and do not necessarily reflect the views of the publisher.
This research is part of the MOMENT project which is funded by the Federal Ministry of Research, Technology and Space (BMFTR) under grant number 03F0931E. We acknowledge the community of Qeqertarsuaq, Greenland for allowing us to research their land and water. We acknowledge the help received from all of the partners of the MOMENT project, with a specific acknowledgment for Selina Undeutsch and Prof. Dr. Lars Kutzbach from the University of Hamburg. We acknowledge Dr. Evan Wilcox for collecting water level from the lake during the 2024 field season. We would acknowledge the University of Copenhagen and the Arctic Station team for providing an environment for conducting this research. We acknowledge the work of the Greenland Ecosystem Monitoring network and specifically Charlotte Sigsgaard for her help in getting meteorological and soil data. ChatGPT models 4.1 and 5 were used to edit parts of the manuscript.
This research has been supported by the Bundesministerium für Bildung, Wissenschaft, Forschung und Technologie (grant no. 03F0931E).
The article processing charges for this open-access publication were covered by the GFZ Helmholtz Centre for Geosciences.
This paper was edited by Huixiang Xie and reviewed by two anonymous referees.
Ayala-Borda, P., Bogard, M. J., Grosbois, G., Prėskienis, V., Culp, J. M., Power, M., and Rautio, M.: Dominance of net autotrophy in arid landscape low relief polar lakes, Nunavut, Canada, Global Change Biology, 30, e17193, https://doi.org/10.1111/gcb.17193, 2024.
Bartsch, A., Gay, B. A., Schüttemeyer, D., Malina, E., Miner, K. R., Grosse, G., Fix, A., Tamminen, J., Bösch, H., Parker, R. J., Rautiainen, K., Hashemi, J., and Miller, C. E.: Advancing the Arctic Methane Permafrost Challenge (AMPAC) with future satellite missions, IEEE J. Sel. Top. Appl. Earth Obs. Remote Sens., 15, 1234–1245, https://doi.org/10.1109/JSTARS.2025.3538897, 2025.
Bastviken, D., Cole, J. J., Pace, M. L., and van de-Bogert, M. C.: Fates of methane from different lake habitats: Connecting whole-lake budgets and CH4 emissions, J. Geophys. Res.-Biogeosci., 113, G02024, https://doi.org/10.1029/2007JG000608, 2008.
Bogard, M. J., del Giorgio, P. A., Boutet, L., Chaves, M. C. G., Prairie, Y. T., Merante, A., and Derry, A. M.: Oxic water column methanogenesis as a major component of aquatic CH4 fluxes, Nat. Commun., 5, 5350, https://doi.org/10.1038/ncomms6350, 2014.
Bouranis, J. A., McGivern, B. B., Makke, G., Jurgensen, S. K., Bosman, S. H., Stemple, B., Chanton, J. P., Wrighton, K. C., and Tfaily, M. M.: Metabolic redox coupling controls methane production in permafrost-affected peatlands through organic matter quality-dependent energy allocation, Glob. Change Biol., 31, e70390, https://doi.org/10.1111/gcb.70390, 2025.
Bulínová, M., Schomacker, A., Kjellman, S. E., Gudasz, C., Olid, C., Rydberg, J., Panieri, G., Hodson, A., van der Bilt, W. G. M., Røthe, T. O., Bindler, R., and Rouillard, A.: Increased ecosystem productivity boosts methane production in Arctic lake sediments, J. Geophys. Res.-Biogeosci., 130, e2024JG008508, https://doi.org/10.1029/2024JG008508, 2025.
Callaghan, T. V., Christensen, T. R., and Jantze, E. J.: Plant and vegetation dynamics on Disko island, west Greenland: Snapshots separated by over 40 years, Ambio, 40, 6, https://doi.org/10.1007/s13280-011-0169-x, 2011.
Cheng, S., Meng, F., Wang, Y., Zhang, J., and Zhang, L.: The potential linkage between sediment oxygen demand and microbes and its contribution to the dissolved oxygen depletion in the Gan River, Front. Microbiol., 15, 1413447, https://doi.org/10.3389/fmicb.2024.1413447, 2024.
Christiansen, J. R., Romero, A. J. B., Jørgensen, N. O. G., Glaring, M. A., Jørgensen, C. J., Berg, L. K., and Elberling, B.: Methane fluxes and the functional groups of methanotrophs and methanogens in a young Arctic landscape on Disko Island, West Greenland, Biogeochemistry, 122, https://doi.org/10.1007/s10533-014-0026-7, 2015.
Cole, J. J. and Caraco, N. F.: Atmospheric exchange of carbon dioxide in a low-wind oligotrophic lake measured by the addition of SF6, Limnol. Oceanogr., 43, https://doi.org/10.4319/lo.1998.43.4.0647, 1998.
Conrad, R.: Microbial ecology of methanogens and methanotrophs, Adv. Agron., 96, https://doi.org/10.1016/S0065-2113(07)96005-8, 2007.
Cunada, C. L., Lesack, L. F. W., Tank, S. E., and Hesslein, R. H.: Methane flux dynamics among CO2-absorbing and thermokarst lakes of a great Arctic delta, Biogeochemistry, 156, 25–39, https://doi.org/10.1007/s10533-021-00853-0, 2021.
D'Imperio, L., Nielsen, C. S., Westergaard-Nielsen, A., Michelsen, A., and Elberling, B.: Methane oxidation in contrasting soil types: responses to experimental warming with implication for landscape-integrated CH4 budget, Glob. Change Biol., 23, https://doi.org/10.1111/gcb.13400, 2017.
Elder, C. D., Thompson, D. R., Thorpe, A. K., Hanke, P., Walter Anthony, K. M., and Miller, C. E.: Airborne mapping reveals emergent power law of Arctic methane emissions, Geophys. Res. Lett., 47, https://doi.org/10.1029/2019GL085707, 2020.
Elith, J., Leathwick, J. R., and Hastie, T.: A working guide to boosted regression trees, J. Anim. Ecol., 77, https://doi.org/10.1111/j.1365-2656.2008.01390.x, 2008.
Emerson, J. B., Varner, R. K., Wik, M., Parks, D. H., Neumann, R. B., Johnson, J. E., Singleton, C. M., Woodcroft, B. J., Tollerson, R., Owusu-Dommey, A., Binder, M., Freitas, N. L., Crill, P. M., Saleska, S. R., Tyson, G. W., and Rich, V. I.: Diverse sediment microbiota shape methane emission temperature sensitivity in Arctic lakes, Nat. Commun., 12, 5815, https://doi.org/10.1038/s41467-021-25983-9, 2021.
Esposito, C., Nijman, T. P. A., Veraart, A. J., Audet, J., Levi, E. E., Lauridsen, T. L., and Davidson, T. A.: Activity and abundance of methane-oxidizing bacteria on plants in experimental lakes subjected to different nutrient and warming treatments, Aquat. Bot., 185, https://doi.org/10.1016/j.aquabot.2022.103610, 2023.
Fazi, S., Amalfitano, S., Venturi, S., Pacini, N., Vazquez, E., Olaka, L. A., Tassi, F., Crognale, S., Herzsprung, P., Lechtenfeld, O. J., Cabassi, J., Capecchiacci, F., Rossetti, S., Yakimov, M. M., Vaselli, O., Harper, D. M., and Butturini, A.: High concentrations of dissolved biogenic methane associated with cyanobacterial blooms in East African lake surface water, Commun. Biol., 4, https://doi.org/10.1038/s42003-021-02365-x, 2021.
Fox-Kemper, B., Hewitt, H. T., Xiao, C., Aðalgeirsdóttir, G., Drijfhout, S. S., Edwards, T. L., Golledge, N. R., Hemer, M., Kopp, R. E., Krinner, G., Mix, A., Notz, D., Nowicki, S., Nurhati, I. S., Ruiz, L., Sallée, J.-B., Slangen, A. B. A., and Yu, Y.: Chapter 9: Ocean, cryosphere and sea level change, in: Climate Change 2021: The Physical Science Basis. Contribution of Working Group I to the Sixth Assessment Report of the Intergovernmental Panel on Climate Change, Cambridge University Press, 1211–1362, https://doi.org/10.1017/9781009157896.011, 2021.
Garcia, H. E. and Gordon, L. I.: Oxygen solubility in seawater: Better fitting equations, Limnol. Oceanogr., 37, https://doi.org/10.4319/lo.1992.37.6.1307, 1992.
Graef, C., Hestnes, A. G., Svenning, M. M., and Frenzel, P.: The active methanotrophic community in a wetland from the High Arctic, Environ. Microbiol. Rep., 3, https://doi.org/10.1111/j.1758-2229.2010.00237.x, 2011.
Greenland Ecosystem Monitoring: GeoBasis Disko – Meteorology – AWS3-Meteorology (Version 1.0), Greenland Ecosystem Monitoring [data set], https://doi.org/10.17897/FEGK-0632, 2026a.
Greenland Ecosystem Monitoring: GeoBasis Disko – Soil – AWS3-SoilMoisture (Version 1.0), Greenland Ecosystem Monitoring [data set], https://doi.org/10.17897/6G78-P793, 2026b.
Greenland Ecosystem Monitoring: GeoBasis Disko – Soil – T1-SoilTemperature (Version 1.0), Greenland Ecosystem Monitoring [data set], https://doi.org/10.17897/9N7Z-GA63, 2026c.
Hall Jr., R. O. and Madinger, H. L.: Use of argon to measure gas exchange in turbulent mountain streams, Biogeosciences, 15, 3085–3092, https://doi.org/10.5194/bg-15-3085-2018, 2018.
Heilman, M. A. and Carlton, R. G.: Methane oxidation associated with submersed vascular macrophytes and its impact on plant diffusive methane flux, Biogeochemistry, 52, 207–224, https://doi.org/10.1023/A:1006427712846, 2001.
Hijmans, R. J., Phillips, S., Leathwick, J., and Elith, J.: dismo: Species Distribution Modeling, R package version 1.3-14, Comprehensive R Archive Network (CRAN) [code], https://doi.org/10.32614/CRAN.package.dismo, 2023.
Hoffmann, M., Schulz-Hanke, M., Garcia Alba, J., Jurisch, N., Hagemann, U., Sachs, T., Sommer, M., and Augustin, J.: A simple calculation algorithm to separate high-resolution CH4 flux measurements into ebullition- and diffusion-derived components, Atmos. Meas. Tech., 10, 109–118, https://doi.org/10.5194/amt-10-109-2017, 2017.
Humlum, O.: Active layer thermal regime 1991–1996 at Qeqertarsuaq, Disko Island, Central West Greenland, Arct. Alp. Res., 30, https://doi.org/10.2307/1551977, 1998.
Humlum, O., Hansen, B. U., and Nielsen, N.: Meteorological observations 1998 at the arctic station, Qeqertarsuaq (69°15′N), Central West Greenland, Geogr. Tidsskr., 99, https://doi.org/10.1080/00167223.1999.10649428, 1999.
Iannone, R. and Roy, O.: DiagrammeR: Graph/Network Visualization, R package version 1.0.11, Comprehensive R Archive Network (CRAN) [code], https://doi.org/10.32614/CRAN.package.DiagrammeR, 2024.
Juncher Jørgensen, C., Schlaikjær Mariager, T., and Riis Christiansen, J.: Spatial variation of net methane uptake in Arctic and subarctic drylands of Canada and Greenland, Geoderma, 443, https://doi.org/10.1016/j.geoderma.2024.116815, 2024.
Keskitalo, K. H., Bröder, L., Shakil, S., Zolkos, S., Tank, S. E., van Dongen, B. E., Tesi, T., Haghipour, N., Eglinton, T. I., Kokelj, S. V., and Vonk, J. E.: Downstream evolution of particulate organic matter composition from permafrost thaw slumps, Front. Earth Sci., 9, https://doi.org/10.3389/feart.2021.642675, 2021.
Klaus, M., Verheijen, H. A., Karlsson, J., and Seekell, D. A.: Depth and basin shape constrain ecosystem metabolism in lakes dominated by benthic primary producers, Limnol. Oceanogr., 67, 2763–2778, https://doi.org/10.1002/lno.12236, 2022.
Kleber, G. E., Magerl, L., Turchyn, A. V., Schloemer, S., Trimmer, M., Zhu, Y., and Hodson, A.: Proglacial methane emissions driven by meltwater and groundwater flushing in a high-Arctic glacial catchment, Biogeosciences, 22, 659–674, https://doi.org/10.5194/bg-22-659-2025, 2025.
Kluge, M., Wauthy, M., Clemmensen, K. E., Wurzbacher, C., Hawkes, J. A., Einarsdottir, K., Rautio, M., Stenlid, J., and Peura, S.: Declining fungal diversity in Arctic freshwaters along a permafrost thaw gradient, Glob. Change Biol., 27, https://doi.org/10.1111/gcb.15852, 2021.
Kuhn, M. A., Varner, R. K., Bastviken, D., Crill, P., MacIntyre, S., Turetsky, M., Walter Anthony, K., McGuire, A. D., and Olefeldt, D.: BAWLD-CH4: a comprehensive dataset of methane fluxes from boreal and arctic ecosystems, Earth Syst. Sci. Data, 13, 5151–5189, https://doi.org/10.5194/essd-13-5151-2021, 2021a.
Kuhn, M., Varner, R. K., Bastviken, D., Crill, P., MacIntyre, S., Turetsky, M., Walter Anthony, K., McGuire, D., and Olefeldt, D.: BAWLD-CH4: Methane Fluxes from Boreal and Arctic Ecosystems, Arctic Data Center [data set], https://doi.org/10.18739/A2DN3ZX1R, 2021b.
Kutzbach, L., Schneider, J., Sachs, T., Giebels, M., Nykänen, H., Shurpali, N. J., Martikainen, P. J., Alm, J., and Wilmking, M.: CO2 flux determination by closed-chamber methods can be seriously biased by inappropriate application of linear regression, Biogeosciences, 4, 1005–1025, https://doi.org/10.5194/bg-4-1005-2007, 2007.
Kyzivat, E. D., Smith, L. C., Garcia-Tigreros, F., Huang, C., Wang, C., Langhorst, T., Fayne, J. V., Harlan, M. E., Ishitsuka, Y., Feng, D., Dolan, W., Pitcher, L. H., Wickland, K. P., Dornblaser, M. M., Striegl, R. G., Pavelsky, T. M., Butman, D. E., and Gleason, C. J.: The importance of lake emergent aquatic vegetation for estimating Arctic–Boreal methane emissions, J. Geophys. Res.-Biogeosci., 127, e2021JG006635, https://doi.org/10.1029/2021JG006635, 2022.
Laanbroek, H. J.: Methane emission from natural wetlands: Interplay between emergent macrophytes and soil microbial processes: A mini-review, Ann. Bot., 105, https://doi.org/10.1093/aob/mcp201, 2010.
Larsen, J. G. and Larsen, L. M.: Lithostratigraphy, geology and geochemistry of the Tertiary volcanic rocks on Svartenhuk Halvø and adjoining areas, West Greenland, GEUS Bull., 50, https://doi.org/10.34194/geusb.v50.8295, 2022.
Li, M., Peng, C., Zhu, Q., Zhou, X., Yang, G., Song, X., and Zhang, K.: The significant contribution of lake depth in regulating global lake diffusive methane emissions, Water Res., 172, 115465, https://doi.org/10.1016/j.watres.2020.115465, 2020.
Liebner, S., Zeyer, J., Wagner, D., Schubert, C., Pfeiffer, E. M., and Knoblauch, C.: Methane oxidation associated with submerged brown mosses reduces methane emissions from Siberian polygonal tundra, J. Ecol., 99, https://doi.org/10.1111/j.1365-2745.2011.01823.x, 2011.
Michel, G., Tonon, T., Scornet, D., Cock, J. M., and Kloareg, B.: Central and storage carbon metabolism of the brown alga Ectocarpus siliculosus: Insights into the origin and evolution of storage carbohydrates in eukaryotes, New Phytol., 188, https://doi.org/10.1111/j.1469-8137.2010.03345.x, 2010.
Miner, K. R., Turetsky, M. R., Malina, E., Bartsch, A., Tamminen, J., McGuire, A. D., Fix, A., Sweeney, C., Elder, C. D., and Miller, C. E.: Permafrost carbon emissions in a changing Arctic, Nat. Rev. Earth Environ., 3, https://doi.org/10.1038/s43017-021-00230-3, 2022.
Mulholland, P. J., Fellows, C. S., Tank, J. L., Grimm, N. B., Webster, J. R., Hamilton, S. K., Martí, E., Ashkenas, L., Bowden, W. B., Dodds, W. K., Mcdowell, W. H., Paul, M. J., and Peterson, B. J.: Inter-biome comparison of factors controlling stream metabolism, Freshw. Biol., 46, https://doi.org/10.1046/j.1365-2427.2001.00773.x, 2001.
Myrstener, M., Sponseller, R. A., Bergström, A. K., and Giesler, R.: Organic carbon availability regulates aquatic metabolism in a boreal stream network across land-use settings, Freshw. Biol., 66, 1899–1911, https://doi.org/10.1111/fwb.13793, 2021.
Neumann, R. B., Moorberg, C. J., Lundquist, J. D., Turner, J. C., Waldrop, M. P., McFarland, J. W., Euskirchen, E. S., Edgar, C. W., and Turetsky, M. R.: Warming effects of spring rainfall increase methane emissions from thawing permafrost, Geophys. Res. Lett., 46, https://doi.org/10.1029/2018GL081274, 2019.
Noss, C., Bodmer, P., Koca, K., and Lorke, A.: Flow and turbulence driven water surface roughness and gas exchange velocity in streams, E3S Web Conf., 40, 05018, https://doi.org/10.1051/e3sconf/20184005018, 2018.
Olefeldt, D., Hovemyr, M., Kuhn, M. A., Bastviken, D., Bohn, T. J., Connolly, J., Crill, P., Euskirchen, E. S., Finkelstein, S. A., Genet, H., Grosse, G., Harris, L. I., Heffernan, L., Helbig, M., Hugelius, G., Hutchins, R., Juutinen, S., Lara, M. J., Malhotra, A., Manies, K., McGuire, A. D., Natali, S. M., O'Donnell, J. A., Parmentier, F.-J. W., Räsänen, A., Schädel, C., Sonnentag, O., Strack, M., Tank, S. E., Treat, C., Varner, R. K., Virtanen, T., Warren, R. K., and Watts, J. D.: The Boreal–Arctic Wetland and Lake Dataset (BAWLD), Earth Syst. Sci. Data, 13, 5127–5149, https://doi.org/10.5194/essd-13-5127-2021, 2021.
Olid, C., Zannella, A., and Lau, D. C. P.: The role of methane transport from the active layer in sustaining methane emissions and food chains in subarctic ponds, J. Geophys. Res.-Biogeosci., 126, https://doi.org/10.1029/2020JG005810, 2021.
Olid, C., Rodellas, V., Rocher-Ros, G., Garcia-Orellana, J., Diego-Feliu, M., Alorda-Kleinglass, A., Bastviken, D., and Karlsson, J.: Groundwater discharge as a driver of methane emissions from Arctic lakes, Nat. Commun., 13, https://doi.org/10.1038/s41467-022-31219-1, 2022.
Pedersen, A. R., Petersen, S. O., and Schelde, K.: A comprehensive approach to soil-atmosphere trace-gas flux estimation with static chambers, Eur. J. Soil Sci., 61, https://doi.org/10.1111/j.1365-2389.2010.01291.x, 2010.
QGIS Development Team: QGIS Geographic Information System, Open Source Geospatial Foundation Project, https://qgis.org (last access: 20 November 2025), 2025.
Rasilo, T., Prairie, Y. T., and del Giorgio, P. A.: Large-scale patterns in summer diffusive CH4 fluxes across boreal lakes, and contribution to diffusive carbon emissions, Glob. Change Biol., 21, 1124–1139, https://doi.org/10.1111/gcb.12741, 2015.
Rautio, M., Dufresne, F., Laurion, I., Bonilla, S., Vincent, W. F., and Christoffersen, K. S.: Shallow freshwater ecosystems of the circumpolar Arctic, Ecoscience, 18, https://doi.org/10.2980/18-3-3463, 2011.
Ravn, N. R., Elberling, B., and Michelsen, A.: Arctic soil carbon turnover controlled by experimental snow addition, summer warming and shrub removal, Soil Biol. Biochem., 142, https://doi.org/10.1016/j.soilbio.2019.107698, 2020.
Rocher-Ros, G., Harms, T. K., Sponseller, R. A., Väisänen, M., Mörth, C.-M., and Giesler, R.: Metabolism overrides photo-oxidation in CO2 dynamics of Arctic permafrost streams, Limnology and Oceanography, 66, S169–S181, https://doi.org/10.1002/lno.11564, 2021.
Saunois, M., Martinez, A., Poulter, B., Zhang, Z., Raymond, P. A., Regnier, P., Canadell, J. G., Jackson, R. B., Patra, P. K., Bousquet, P., Ciais, P., Dlugokencky, E. J., Lan, X., Allen, G. H., Bastviken, D., Beerling, D. J., Belikov, D. A., Blake, D. R., Castaldi, S., Crippa, M., Deemer, B. R., Dennison, F., Etiope, G., Gedney, N., Höglund-Isaksson, L., Holgerson, M. A., Hopcroft, P. O., Hugelius, G., Ito, A., Jain, A. K., Janardanan, R., Johnson, M. S., Kleinen, T., Krummel, P. B., Lauerwald, R., Li, T., Liu, X., McDonald, K. C., Melton, J. R., Mühle, J., Müller, J., Murguia-Flores, F., Niwa, Y., Noce, S., Pan, S., Parker, R. J., Peng, C., Ramonet, M., Riley, W. J., Rocher-Ros, G., Rosentreter, J. A., Sasakawa, M., Segers, A., Smith, S. J., Stanley, E. H., Thanwerdas, J., Tian, H., Tsuruta, A., Tubiello, F. N., Weber, T. S., van der Werf, G. R., Worthy, D. E. J., Xi, Y., Yoshida, Y., Zhang, W., Zheng, B., Zhu, Q., Zhu, Q., and Zhuang, Q.: Global Methane Budget 2000–2020, Earth Syst. Sci. Data, 17, 1873–1958, https://doi.org/10.5194/essd-17-1873-2025, 2025.
Schuur, E. A. G., McGuire, A. D., Schädel, C., Grosse, G., Harden, J. W., Hayes, D. J., Hugelius, G., Koven, C. D., Kuhry, P., Lawrence, D. M., Natali, S. M., Olefeldt, D., Romanovsky, V. E., Schaefer, K., Turetsky, M. R., Treat, C. C., and Vonk, J. E.: Climate change and the permafrost carbon feedback, Nature, 520, https://doi.org/10.1038/nature14338, 2015.
Singleton, C. M., McCalley, C. K., Woodcroft, B. J., Boyd, J. A., Evans, P. N., Hodgkins, S. B., Chanton, J. P., Frolking, S., Crill, P. M., Saleska, S. R., Rich, V. I., and Tyson, G. W.: Methanotrophy across a natural permafrost thaw environment, ISME J., 12, https://doi.org/10.1038/s41396-018-0065-5, 2018.
Stevenson, M. A., McGowan, S., Pearson, E. J., Swann, G. E. A., Leng, M. J., Jones, V. J., Bailey, J. J., Huang, X., and Whiteford, E.: Anthropocene climate warming enhances autochthonous carbon cycling in an upland Arctic lake, Disko Island, West Greenland, Biogeosciences, 18, 2465–2485, https://doi.org/10.5194/bg-18-2465-2021, 2021.
Street, L. E., Dean, J. F., Billett, M. F., Baxter, R., Dinsmore, K. J., Lessels, J. S., Subke, J. A., Tetzlaff, D., and Wookey, P. A.: Redox dynamics in the active layer of an Arctic headwater catchment; examining the potential for transfer of dissolved methane from soils to stream water, J. Geophys. Res.-Biogeosci., 121, https://doi.org/10.1002/2016JG003387, 2016.
Thayne, M.: mthayne527/fluxCH4: fluxCH4 v1.0.1 (Gas_Flux_Algorithm_v1.0.1), Zenodo [code], https://doi.org/10.5281/zenodo.18241611, 2026.
Thompson, H. A., White, J. R., Pratt, L. M., and Sauer, P. E.: Spatial variation in flux, δ13C and δ2H of methane in a small Arctic lake with fringing wetland in western Greenland, Biogeochemistry, 131, 17–33, https://doi.org/10.1007/s10533-016-0261-1, 2016.
Vachon, D. and Prairie, Y. T.: The ecosystem size and shape dependence of gas transfer velocity versus wind speed relationships in lakes, Can. J. Fish. Aquat. Sci., 70, 1757–1764, https://doi.org/10.1139/cjfas-2013-0241, 2013.
Virkkala, A.-M., Niittynen, P., Kemppinen, J., Marushchak, M. E., Voigt, C., Hensgens, G., Kerttula, J., Happonen, K., Tyystjärvi, V., Biasi, C., Hultman, J., Rinne, J., and Luoto, M.: High-resolution spatial patterns and drivers of terrestrial ecosystem carbon dioxide, methane, and nitrous oxide fluxes in the tundra, Biogeosciences, 21, 335–355, https://doi.org/10.5194/bg-21-335-2024, 2024.
Wallenius, A. J., Dalcin Martins, P., Slomp, C. P., and Jetten, M. S. M.: Anthropogenic and environmental constraints on the microbial methane cycle in coastal sediments, Front. Microbiol., 12, https://doi.org/10.3389/fmicb.2021.631621, 2021.
Walter Anthony, K., Schneider von Deimling, T., Nitze, I., Frolking, S., Emond, A., Daanen, R., Anthony, P., Lindgren, P., Jones, B., and Grosse, G.: 21st-century modeled permafrost carbon emissions accelerated by abrupt thaw beneath lakes, Nat. Commun., 9, https://doi.org/10.1038/s41467-018-05738-9, 2018.
Walter Anthony, K. M., Anthony, P., Grosse, G., and Chanton, J.: Geologic methane seeps along boundaries of Arctic permafrost thaw and melting glaciers, Nat. Geosci., 5, https://doi.org/10.1038/ngeo1480, 2012.
Walvoord, M. A. and Kurylyk, B. L.: Hydrologic impacts of thawing permafrost – A review, Vadose Zone J., 15, https://doi.org/10.2136/vzj2016.01.0010, 2016.
Westergaard-Nielsen, A., Balstrøm, T., Treier, U. A., Normand, S., and Elberling, B.: Estimating meltwater retention and associated nitrate redistribution during snowmelt in an Arctic tundra landscape, Environ. Res. Lett., 15, https://doi.org/10.1088/1748-9326/ab57b1, 2020.
Wickham, H.: ggplot2: Elegant Graphics for Data Analysis, Springer-Verlag, New York, https://doi.org/10.1007/978-3-319-24277-4, 2016.
Winslow, L. A., Zwart, J. A., Batt, R. D., Dugan, H. A., Woolway, R. I., Corman, J. R., Hanson, P. C., and Read, J. S.: LakeMetabolizer: an R package for estimating lake metabolism from free-water oxygen using diverse statistical models, Inland Waters, 6, https://doi.org/10.1080/IW-6.4.883, 2016.
Xu, W., Lambæk, A., Holm, S. S., Furbo-Halken, A., Elberling, B., and Ambus, P. L.: Effects of experimental fire in combination with climate warming on greenhouse gas fluxes in Arctic tundra soils, Sci. Total Environ., 795, https://doi.org/10.1016/j.scitotenv.2021.148847, 2021.
Yuan, K., Li, F., McNicol, G., Chen, M., Hoyt, A., Knox, S., Riley, W. J., Jackson, R., and Zhu, Q.: Boreal–Arctic wetland methane emissions modulated by warming and vegetation activity, Nat. Clim. Change, 14, https://doi.org/10.1038/s41558-024-01933-3, 2024.
Žárský, J. D., Kohler, T. J., Yde, J. C., Falteisek, L., Lamarche-Gagnon, G., Hawkings, J. R., Hatton, J. E., and Stibal, M.: Prokaryotic assemblages in suspended and subglacial sediments within a glacierized catchment on Qeqertarsuaq (Disko Island), west Greenland, FEMS Microbiol. Ecol., 94, https://doi.org/10.1093/femsec/fiy100, 2018.
Zastruzny, S. F., Elberling, B., Nielsen, L., and Jensen, K. H.: Water flow in the active layer along an arctic slope – An investigation based on a field campaign and model simulations, The Cryosphere Discuss. [preprint], https://doi.org/10.5194/tc-2017-97, in review, 2017.