
the Creative Commons Attribution 4.0 License.
the Creative Commons Attribution 4.0 License.
 | 10 Jul 2026
New insights into the primary production and the structure of the phytoplankton community in the South Indian Ocean using size fractionation experiments
Valentin Deteix
Céline Ridame
Céline Dimier
Claire Lo Monaco
Aline Tribollet
Frédéric Planchon
As part of the South Indian Ocean CARBon fluxes from the surface to the mesopelagic twilight zone (SOCARB) project, the phytoplankton biomass and net primary production (NPP), along with the biomass of phytoplankton chemotaxonomic groups, were assessed during late austral summer 2023 in contrasting biogeochemical areas: the oligotrophic subtropical waters of the South Indian Ocean, High Nutrient Low Chlorophyll (HNLC) waters, and the highly productive waters in the vicinity of Kerguelen Islands in the Southern Ocean. A size fractionation approach was performed to characterize the size structure of primary production and phytoplankton chemotaxonomic groups biomass in three size classes: picophytoplankton (<3 µm), nanophytoplankton (3–20 µm), and microphytoplankton (>20 µm). Across the study area, NPP was dominated by microphytoplankton (56 % ± 21 %) while total chlorophyll a (TChl a) was sustained by nano- (40 % ± 11 %) and microphytoplankton (37 % ± 18 %), notably by nanophytoplankton haptophytes and microphytoplankton diatoms. Our results highlighted the spatial variability of NPP and TChl a size structures, mainly driven by temperature and macronutrients (N, P). In the Subtropical and Subantarctic zones, NPP was dominated by nano- and microphytoplankton while TChl a was sustained by pico- and nanophytoplankton with a diversified community (cyanobacteria, haptophytes, chlorophytes, pelagophytes). Conversely in the Polar Frontal and Antarctic zones, NPP and TChl a were dominated by nano- and microphytoplankton with a less diversified community (diatoms, haptophytes). The coupling of pigment-based chemotaxonomy with size fractionation reveals new insights into the size-specific distribution of phytoplankton chemotaxonomic groups, challenging traditional functional type approaches on the bulk fraction and highlighting the presence of key groups such as diatoms and haptophytes across all three size classes. Our results also underline the intra-zonal variability of NPP and TChl a through bottom-up processes, such as cyclonic eddy in the Subtropical zone or Si-depleted water mass intrusion in the Polar Frontal zone. Focusing on the links between NPP and TChl a size structure across the study area, NPP was mainly driven by the biomass of nano- and microphytoplankton, more specifically by the biomass of nano- and microphytoplankton diatoms, haptophytes and dinoflagellates. This study paves the way for a better understanding of phytoplankton productivity and community size structure, which could contribute to a more detailed knowledge on their role in the biological carbon pump.
- Article
(6463 KB) - Full-text XML
-
Supplement
(1659 KB) - BibTeX
- EndNote


One of the main challenges in marine biogeochemistry is to understand the impact of factors controlling the efficiency of the soft tissue pump, or so-called “biological carbon pump” (BCP). Among these factors, the intensity of net primary production (NPP) and the structure of phytoplankton communities are known to play key roles in biogeochemical fluxes involved in the BCP and depend on the chemicophysical conditions of the ocean. More specifically, the taxonomic composition and the size structure of phytoplankton communities can affect significantly the intensity and fate of NPP by controlling the photosynthetic CO2 uptake efficiency (e.g. Cermeño et al., 2005), the transfer of NPP through either microbial trophic pathway or higher trophic levels (e.g. Marañón, 2009) and the carbon export and sequestration in the deep ocean (e.g. Guidi et al., 2009). For instance, phytoplankton communities dominated by large cells are expected to contribute greatly to organic carbon export through their faster sinking velocity rates and more efficient transfer towards higher trophic levels compared to phytoplankton communities dominated by smaller cells (Legendre and Le Fèvre, 1989; Wassmann, 1998). Also, particulate organic carbon export may be enhanced when phytoplankton communities are dominated by biomineralizing organisms, as mineral ballast increases particle sinking rates (Armstrong et al., 2001; Klaas and Archer, 2002). Therefore, considering phytoplankton as a single generic variable is insufficient for fully understanding the BCP. To tackle this issue, a common approach is to assess phytoplankton in size classes, either through size fractionation experiments to quantify size structure and its associated fluxes such as NPP (e.g. Froneman et al., 2001; Marañón et al., 2001) or from phytoplankton functional type approaches used to estimate phytoplankton size structure from bulk measurements (e.g. Uitz et al., 2006; Hirata et al., 2011).
The South Indian Ocean, including the Indian sector of the Southern Ocean, is a unique oceanic region with contrasting biogeochemical features. Since the first monitoring measurements of air-sea CO2 fluxes in this region carried out by Metzl et al. (1995), the Southern Ocean, south of the Subtropical Front (STF), is known to be a net CO2 sink (Takahashi et al., 2009; Hauck et al., 2023). It is characterized by High Nutrient Low Chlorophyll (HNLC) conditions, with low phytoplankton biomass (<0.5 mg m−3) despite high macronutrients concentrations (NOx () and dissolved inorganic phosphorus (DIP)). This paradox is explained by limitations of the phytoplankton growth by micronutrients, especially iron (Fe) (Martin, 1990; Martin et al., 1990) or manganese (Mn) (Browning et al., 2021; Hawco et al., 2022) and by secondary limiting factors such as light, water column stability and grazing pressure (Moore and Abbott, 2000). Furthermore, the Southern Ocean is characterized by the Antarctic Circumpolar Current (ACC), a massive eastward flowing current driven by westerly winds, that divides the region into several hydrographic zones defined by specific water masses and fronts (Nowlin and Klinck, 1986). The Antarctic Zone (AZ), south of the Polar Front (PF), exhibits typical HNLC conditions (Minas and Minas, 1992). The Polar Frontal Zone (PFZ), between the PF and the Subantarctic Front (SAF), and the Subantarctic Zone (SAZ), between the SAF and the STF, display high NOx and DIP concentrations but low dissolved silicon (DSi) concentrations (usually <5 µmol L−1), in contrast to HNLC waters of the AZ (usually >20 µmol L−1), resulting in High Nutrient Low Silicon Low Chlorophyll (HN-LSi-LC) conditions (Nelson et al., 2001; Sarmiento et al., 2004). The STF delineates the boundary between the Southern Ocean and the Subtropical Zone (STZ) of the South Indian Ocean, which is characterized by Low Nutrient Low Chlorophyll (LNLC) conditions (McClain et al., 2004) and acts as a CO2 source during austral summer (Sarma et al., 2023).
While the contrasting physical and biogeochemical regimes in the South Indian Ocean exert a strong bottom-up control on phytoplankton biomass, composition and productivity (Hörstmann et al., 2021; Hayward et al., 2024), most of this knowledge is restricted to the surface layer. By contrast, much less is known about these phytoplankton characteristics throughout the euphotic layer, especially as these features were mostly determined from bulk measurements. Moreover, previous field studies conducted in the South Indian Ocean investigating phytoplankton composition and size structure within the euphotic layer have primarily focused on high productivity regions – i.e. areas in the vicinity of subantarctic islands – where enhanced surface NPP results from natural Fe fertilization (Blain et al., 2007; Pollard et al., 2009; Holmes et al., 2020) such as Crozet Islands (Seeyave et al., 2007), Kerguelen Islands (Uitz et al., 2009; Irion et al., 2020), and Heard and McDonald Islands (Wojtasiewicz et al., 2019). By contrast, the vast low productivity regions with LNLC, HN-LSi-LC and HNLC conditions have received considerably less attention, despite covering the majority of the South Indian Ocean. While some studies have provided relevant insights into phytoplankton biomass and composition in the upper water column using pigment chemotaxonomy tools (Schlüter et al., 2011; Mendes et al., 2015; Latasa et al., 2023), data remain scarce, particularly concerning NPP (Leblanc et al., 2002; Jasmine et al., 2009; Gandhi et al., 2012).
The SOCARB (South Indian Ocean CARBon fluxes from the surface to the mesopelagic twilight zone) cruise took place during the late austral summer of 2023. SOCARB aims to provide key metrics to characterize the BCP components and the associated fluxes of organic carbon, from the euphotic layer to the base of the mesopelagic zone in the South Indian Ocean. SOCARB was implemented as part of the long-term monitoring program OISO (Océan Indien Service d'Observations), involved since 1998 in the long-term monitoring of oceanic CO2 parameters in the South Indian Ocean (Metzl and Lo Monaco, 1998; https://doi.org/10.18142/228). This opportunity allowed us to investigate phytoplankton NPP, biomass and community size structure, along with their respective size structures across contrasting biogeochemical regions of the South Indian Ocean. The first objective was to describe the size structure (pico-, nano- and microphytoplankton) of (i) the net primary production, (ii) the phytoplankton biomass (total chlorophyll a) and (iii) the biomass of phytoplankton chemotaxonomic groups. The second objective was to assess their vertical and spatial variability in relation to the environmental conditions. The third objective was to determine whether NPP is determined by the size structure of the phytoplankton biomass and/or by the size structure of the biomass of specific phytoplankton chemotaxonomic groups.
2.1 Cruise transect – Sampling Strategy
Our study was part of the MD240 / OISO33-SOCARB cruise (Lo Monaco et al., 2023) on board the R/V Marion Dufresne II, conducted in the South Indian and Southern Oceans during austral summer, from 23 January to 28 February 2023. SOCARB experiments were conducted at twelve stations in contrasting biogeochemical regions (Fig. 1), including the oligotrophic subtropical gyre of the South Indian Ocean characterised by LNLC conditions, open ocean regions exhibiting HNLC or HN-LSi-LC characteristics, and bloom areas near Subantarctic islands such as the Crozet Islands and Kerguelen Plateau, both renowned for being naturally iron-fertilized regions (Blain et al., 2007; Pollard et al., 2009).
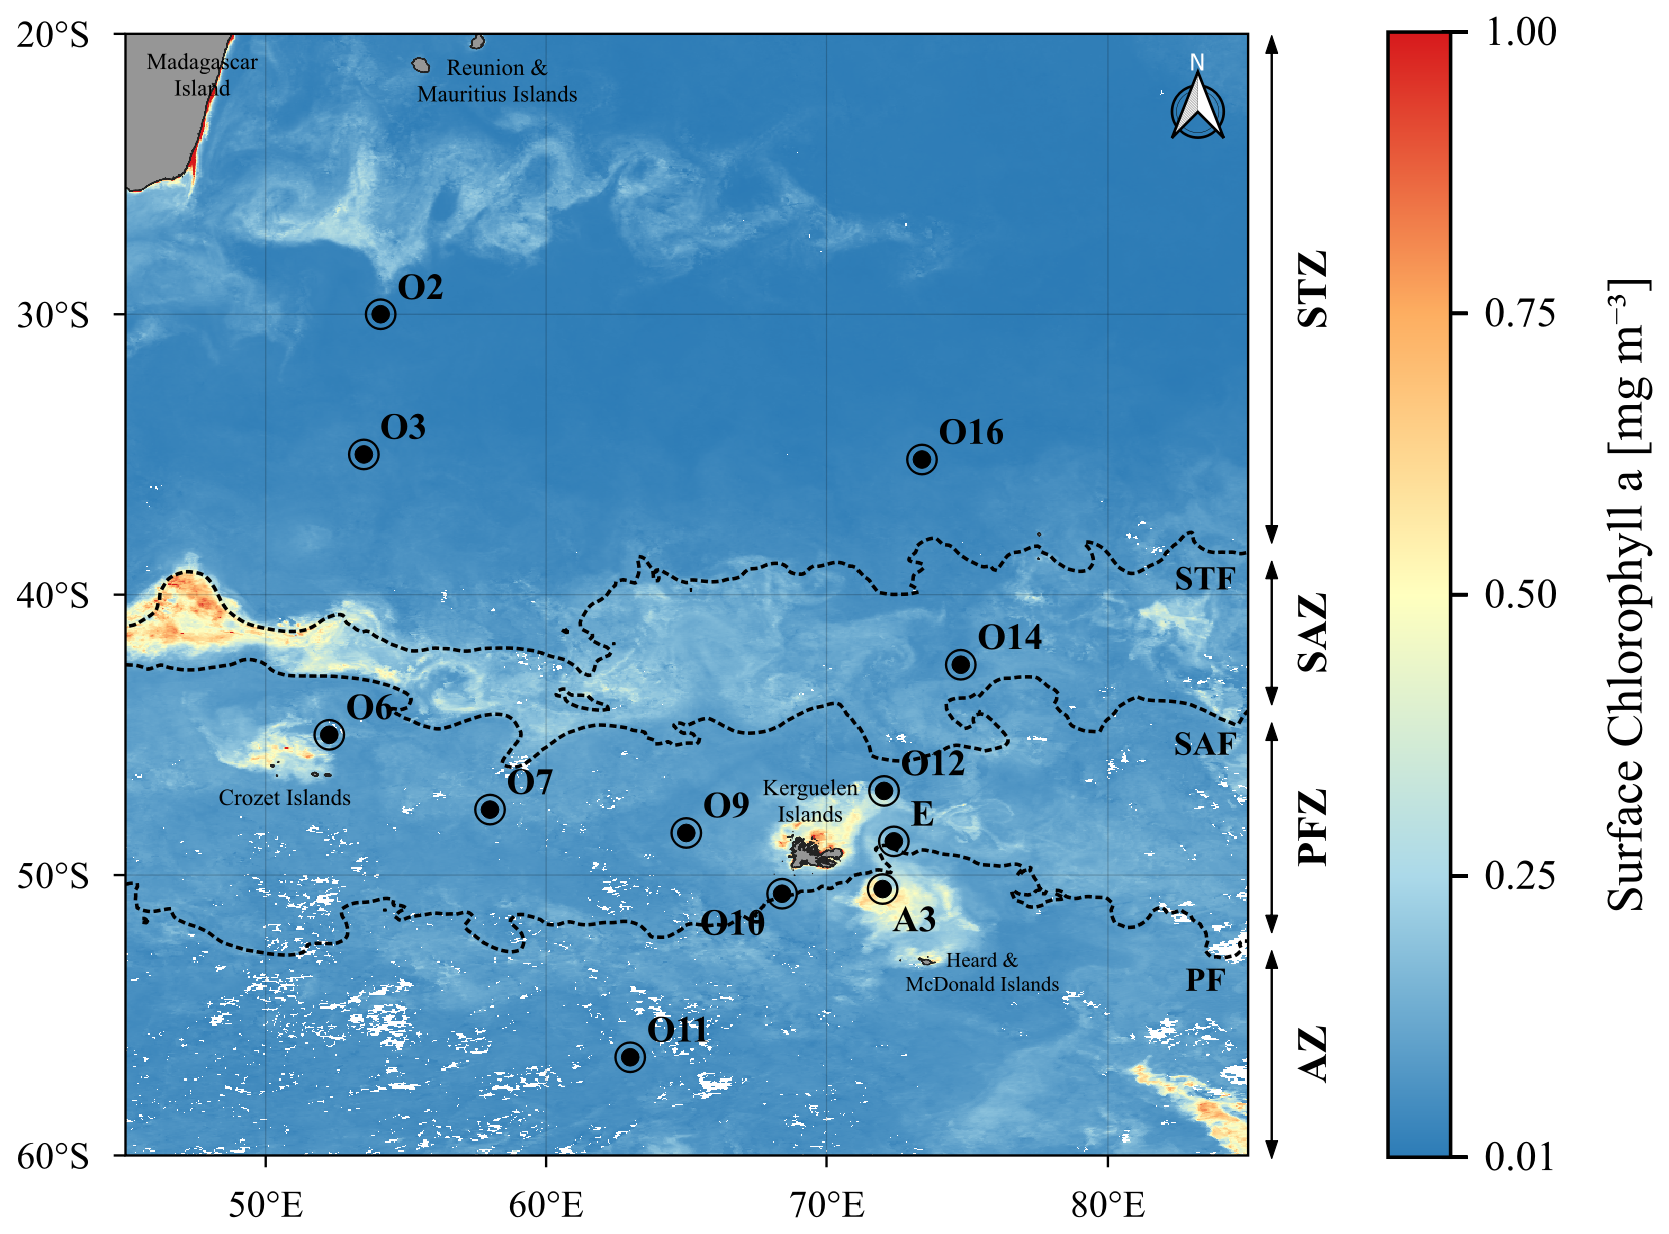
Figure 1Map of the OISO33-SOCARB study area showing the location of the stations from this study, overlying the satellite-derived surface chlorophyll a concentration averaged over February 2023 (MODIS L3 product). The dotted lines indicate the positions of the main fronts determined from satellite-derived surface temperature averaged over February 2023 (CMEMS L4 product): STF, Subtropical Front (18 °C); SAF, Subantarctic Front (13 °C); PF, Polar Front (4.5 °C).
Seawater was collected using a CTD (Sea-Bird SBE 911 Plus) mounted on a rosette equipped with 24 Niskin bottles (12 L, General Oceanics, Inc.). Samples for phytoplankton primary production and pigments were collected at six depths, between the surface (∼10 m) and 200 m maximum. Sampling depths were determined from the fluorescence downcast profiles during the CTD measurements acquisition, to best describe the fluorescence profile and its gradients, such as subsurface chlorophyll maximum (SCM) (Appendix A).
2.2 Size fractionated primary production
All materials were acid-washed (HCl Suprapur 32 %) following trace metal clean procedures (Cutter et al., 2017), and polycarbonate bottles were rinsed three times before sampling with the collected seawater. For NPP, 2.3 L of unfiltered seawater was collected for the total fraction and 5.5 L for the size fractions. Prefiltration was performed using 20 and 3 µm filter cartridge (Sartorius) under pressurised filtration units. For each prefiltration, bottles were rinsed three times with the seawater filtrates, and 2.3 L of respectively <20 and <3 µm seawater filtrates were collected. This size fractionation approach enabled us to determine the contributions of the three phytoplankton size classes: picophytoplankton (<3 µm), nanophytoplankton (3–20 µm), and microphytoplankton (>20 µm) (Sieburth et al., 1978; Vaulot et al., 2008). NPP rates were determined using the 13C tracer addition method (Hama et al., 1983; Ridame et al., 2022) in the total, <20 and <3 µm fractions. After prefiltration, 1 mL of NaH13CO3 (99 %; Eurisotop) was added to the bottles to obtain a final 13C enrichment of ∼10 %. Each bottle was thoroughly homogenized before incubation for 24 h in on-deck containers with circulating seawater. To simulate an irradiance level as close as possible to the sampled depth, blue filters with several sets of blue neutral density filters were used (LEE Filters: 75 %, 54.4 %, 36 %, 19.3 %, 10.4 %, 5.6 %, 2.7 % and 1 % attenuation). After 24 h incubation, 2.3 L was vacuum filtered (<200 mbar) onto pre-combusted (450 °C) 25 mm GF/F filters (Whatman™ glass microfiber) and stored at −20 °C. Filters were dried at 40 °C for 48 h before analysis at the Alysés analytical platform (IRD-SU, Bondy, France). In addition, 2.3 L of surface and SCM seawaters were immediately filtered after collection onto pre-combusted GF/F filters to determine natural concentration and isotopic signature of particulate organic carbon (POC). POC and 13C isotopic ratio were quantified using an online continuous flow elemental analyser (EA, Thermo Fisher Scientific Inc. Flash 2000 HT) coupled with an isotopic ratio mass spectrometer (IRMS, Thermo Fisher Scientific Inc. Delta V Advantage via a ConFlow IV interface). For each sample, POC was higher than the experimental detection limit of 0.42 µmol C, defined as three times the standard deviation of the blanks. The mean natural 13C signature was 1.081 at. % ± 0.002 at. % (n=24), with no significant differences between surface and SCM values (Student test: , p=0.88). The atom% excess of the dissolved inorganic carbon (DIC) was calculated by using DIC concentrations measured at the SNAPO-CO2 analytical platform (LOCEAN-IPSL, Paris, France, Metzl et al., 2025). Volumetric NPP is expressed as a flux in .
2.3 Size fractionated phytoplankton pigments
The size fractionation filtration procedure was the same as described for the NPP (see Sect. 2.2). For pigments, 2.3 L of unfiltered seawater was directly filtered onto GF/F filters for the total fraction, and 3.5 L of <20 and <3 µm seawater filtrates were filtered onto GF/F filters. The filters were placed in cryotubes, flash-frozen in liquid nitrogen and stored at −80 °C until analysis at the SAPIGH analytical platform (IMEV, Villefranche-sur-Mer, France). Filters were extracted during 2 h in 3 mL HPLC-grade methanol (100 %) containing an internal standard (Vitamin E acetate, Sigma), sonicated once and then clarified by vacuum filtration through GF/F filters. Extracts analysis was carried out within 24 h after extraction using an Agilent Technologies Inc. 1200 series HPLC system. The general procedure for HPLC pigment analysis, identification and quantification is described in Ras et al. (2008). Volumetric pigment concentrations are expressed as stocks in mg m−3. This method allows the detection of 26 separate pigments with low detection limits (≤0.0002 mg m−3). Pigments include chlorophyll a (Chl a) and divinyl chlorophyll a (DVChl a), whose sum of the concentrations is referred to as total chlorophyll a (TChl a), an indicator of the phytoplankton biomass. Pigments also include various accessory pigments, some of which can be used as biomarkers of phytoplankton taxonomic groups (Higgins et al., 2011). In this study, the following eleven accessory pigments were further used to study the TChl a biomass of the phytoplankton chemotaxonomic groups: fucoxanthin (Fuco), peridinin (Peri), 19′-hexanoyloxyfucoxanthin (Hex-fuco), 19′-butanoyloxyfucoxanthin (But-fuco), alloxanthin (Allo), chlorophyll b (Chl b), zeaxanthin (Zea), neoxanthin (Neo), lutein (Lut), violaxanthin (Viola), and DVChl a.
2.4 Biomass of the phytoplankton chemotaxonomic groups
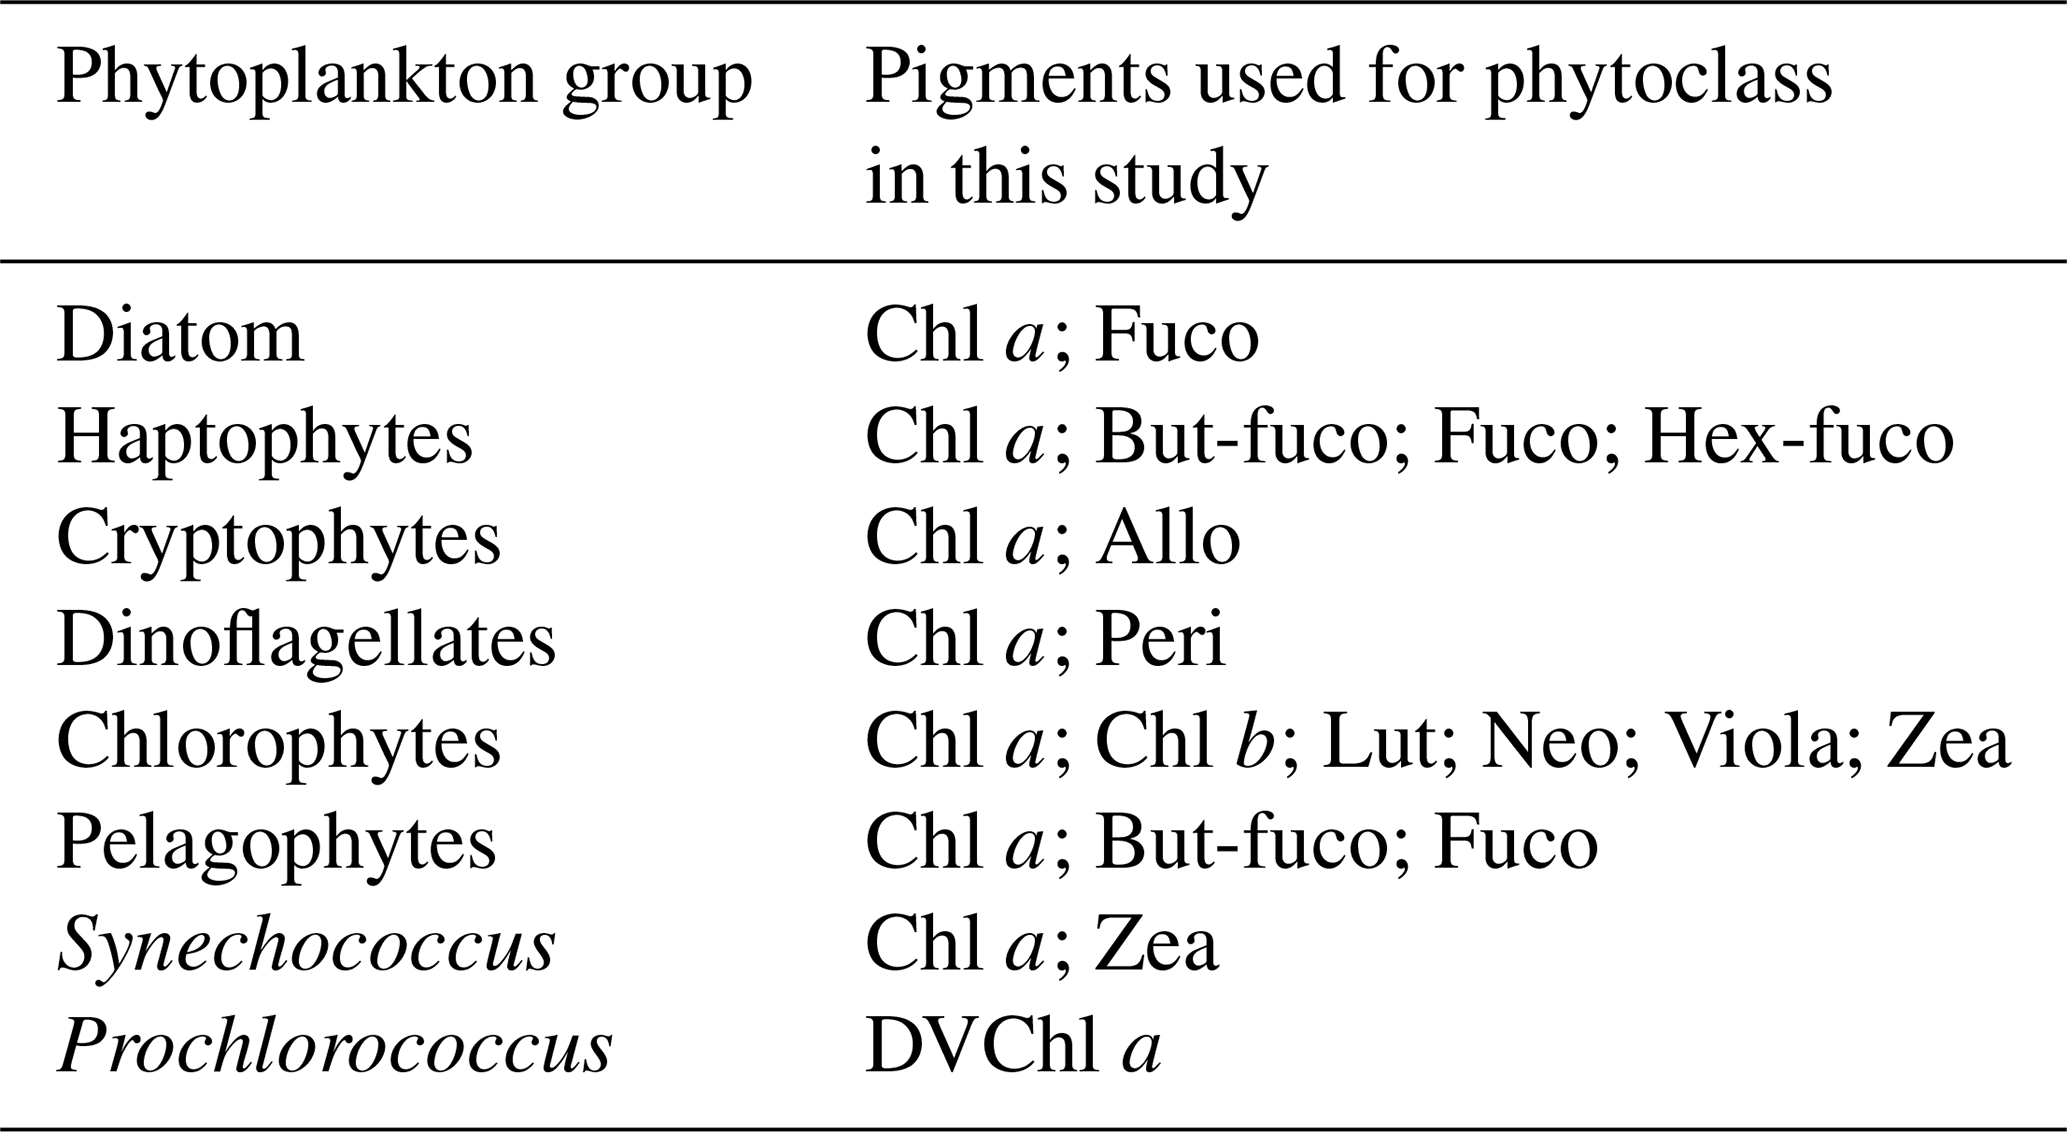
To estimate the Chl a biomass of different phytoplankton chemotaxonomic groups from pigment concentrations measured in the sizes classes, we used the open-source R package phytoclass (v.2.0.0; https://cran.r-project.org/package=phytoclass, last access: 22 June 2026), following the procedure described in Hayward et al. (2023). Compared to the commonly used CHEMTAX algorithm (Mackey et al., 1996), the phytoclass algorithm improves the accuracy of the phytoplankton group biomass estimates, and removes the need for initial assumptions about their pigment : Chl a ratios (Hayward et al., 2023). Briefly, datasets were first clustered based on their pigment : Chl a ratios, then loaded into phytoclass set with an iteration of 500, a step of 0.009 and 7 phytoplankton chemotaxonomic groups: diatoms, haptophytes, cryptophytes, dinoflagellates, chlorophytes, pelagophytes and Synechococcus. After phytoclass analyses, an 8th taxonomic group, Prochlorococcus, was added by using DVChl a, which was summed with Chl a to obtain the TChl a biomass of phytoplankton community. The attribution of the pigments to the phytoplankton chemotaxonomic groups in presented in Table 1.
Table 1Phytoplankton chemotaxonomic groups and associated pigments computed with phytoclass in this study.
2.5 Ancillary supporting data
The depth of the surface mixed layer (ZSML), defined as the depth at which the density anomaly (σ, kg m−3) differed by 0.03 kg m−3 from the 10 m σ value (de Boyer Montégut et al., 2004), was determined from the CTD downcast profiles. The depth of the euphotic layer (ZEL) was determined from the downcast profiles of photosynthetically active radiation (PAR, 400–700 nm, Biospherical Instruments Inc. QCP 2350) and from the surface reference measurements (Biospherical Instruments Inc. QCR 2200). Here, we defined two ZEL: ZEL1 % corresponding to the depth at which PAR is reduced to 1 % of its surface value (Morel and Berthon, 1989), and ZEL0.01 % representing the depth at which PAR is reduced to 0.01 % of its surface value. ZEL0.01 % was subsequently used for the integration of biogeochemical parameters (see Sect. 2.6 and Sect. S1 in the Supplement).
Macronutrients samples were collected at fixed depths, and bottles were rinsed three times before sampling with the collected seawater. 30 mL of seawater were filtered through 0.4 µm filters and poisoned with 100 µL saturated HgCl2 to stop biological activity, and stored at 4 °C until analysis at the IMAGO analytical platform (IRD, Plouzané, France). NOx, DIP and DSi were analysed by colorimetry using a segmented flow analyser (SEAL Analytical Inc. AA500) following the protocol from Aminot and Kérouel (2007). The detection limits were 0.1 µm for NOx, 0.05 µm for DIP and 0.03 µm for DSi. Accuracy was checked with certified reference material for nutrients in seawater (KANSO Technos Co.) within 1.4 % for NOx and DIP and 1.7 % for DSi.
2.6 Computations, statistical analyses and numerical tools
In this study, the size structure of primary production and pigments – including the biomass with TChl a – was determined from the bulk and size-fractionated measurements (<3 and <20 µm). Picophytoplankton (<3 µm) NPP and pigments were obtained directly from the <3 µm fraction. Nanophytoplankton (3–20 µm) NPP and pigments were obtained by subtracting the <20 µm fraction from the <3 µm fraction. Microphytoplankton (>20 µm) NPP and pigments were obtained by subtracting the total fraction from the <20 µm fraction. To best represent the data within the productive layer, biogeochemical parameters in this study were integrated from the surface (0 m) down to the ZEL0.01 %, as previous studies have reported significant primary production below the ZEL1 % (e.g. Cavagna et al., 2015). The detailed explanation for the choice of the ZEL0.01 % is presented in the Supplement (Sects. S1 and S2; Tables S1 and S2; Fig. S1). Values at 0 m were extrapolated from those at the first sampled depth (∼10 m). Integrated NPP are expressed thereafter in , while integrated pigment concentrations and integrated biomass of phytoplankton chemotaxonomic groups are expressed in mg m−2.
For each size-fractionated parameter (e.g. NPP, TChl a, phytoplankton chemotaxonomic group biomass), the relative contributions of each size class averaged across the study area were compared using a one-way ANOVA followed by a post-hoc Tukey test. When normality and homoscedasticity assumptions were not respected, a Kruskal–Wallis test was applied followed by a post-hoc Dunn test. Spearman's rank correlations were performed to assess statistical relationships between biogeochemical parameters based on the volumetric data, as not all volumetric datasets met the normality and homoscedasticity assumptions. Principal component analysis (PCA) was performed on the volumetric dataset (n=72) to explore the relationships between environmental parameters (explanatory variables) and net primary production as well as phytoplankton chemotaxonomic groups biomass (supplementary descriptors). The initial explanatory variables were potential temperature, salinity, σ, dissolved oxygen, PAR, DIC, NOx, DIP, DSi, ZSML and ZEL0.01 %. Prior to the analysis, explanatory variables and supplementary descriptors were standardized (vegan::deconstand() function). Furthermore, collinearity among explanatory variables was assessed using a Spearman correlogram (Fig. S2 in the Supplement). Potential temperature was strongly correlated with σ (), dissolved oxygen () and DIC (); among these variables, potential temperature was retained, as it is a key driver of water mass structure and biological activity. NOx and DIP were also highly correlated (ρ=0.98), and only NOx was retained. After this selection, potential temperature and salinity displayed a variance inflation factor (VIF) >20 (vegan::vif.cca() function); salinity was discarded in favour of temperature. Final explanatory variables were potential temperature, PAR, NOx, DSi, ZSML and ZEL0.01 %. All variables displayed VIF values <10, except for NOx (14).
All statistical analyses were conducted in the programming environment R 4.4.2 (R Core Team, 2024). The package tidyverse (v2.0.0; Wickham et al., 2019) was used for data manipulation; oce (v1.8.3; Kelley and Richards, 2024) for trapezoidal integration computations; stats (v4.4.2; R Core Team, 2024), rstatix (v0.7.2; Kassambara, 2023) and corrplot (v0.95; Wei and Simko, 2024) for statistical analyses; FactoMineR (v2.12; Lê et al., 2008) and vegan (v2.6.10; Oksanen et al., 2025) for multivariate analyses.
3.1 Hydrographic and biogeochemical features of the study area
The OISO33-SOCARB transect crossed the three main hydrographic fronts (STF, SAF and PF) which divided the study area into four hydrographic zones (Fig. 1). Located near the PF, stations O10 and E were attributed to the AZ, as the temperature minimum at 200 m reached 2 °C for O10 and was <2 °C for E (Belkin and Gordon, 1996). A detailed analysis of the fronts position is presented in the Supplement (Sect. S3).
The study area can be further subdivided into distinct biogeochemical regions, with contrasting surface TChl a and nutrient concentrations in the surface mixed layer (SML) (Table 2). In the STZ, stations O2, O3 and O16 exhibited LNLC conditions, with very low surface TChl a. The NOxDIP ratios in the SML were notably lower than the Redfield ratio of 161 (Redfield, 1958), indicating a relative deficiency of NOx with respect to DIP for phytoplankton nutritional requirements, and thus suggesting a potential NOx limitation of the phytoplankton activity (Geisen et al., 2022). Station O11 in the AZ featured HNLC conditions, with low surface TChl a despite high macronutrient concentrations. The NOxDIP and DSiNOx ratios in the SML were close to the Redfield and Brzezinski ratios ( for diatoms =1.12 ± 0.33, Brzezinski, 1985), indicating that NOx, DIP and DSi were not limiting, and thus suggesting a potential micronutrient limitation (Geisen et al., 2022). Stations O6, O7, O9 in the PFZ and O10 in the AZ shared similar features with O11 (AZ) but exhibited lower surface DSi concentrations, leading to DSiNOx ratios notably lower than the Brzezinski ratio. These stations exhibited HN-LSi-LC conditions, indicating a potential (co-)limitation by Si (Pondaven et al., 2000). Station O14 stood out from the latter HN-LSi-LC stations, exhibiting lower NOx, DIP and DSi concentrations in the SML along with NOxDIP and DSiNOx ratios below the Redfield and Brzezinski ratios. Stations O12, E and A3, located in the naturally Fe-fertilized Kerguelen bloom (Blain et al., 2008; Quéroué et al., 2015), exhibited the highest surface TChl a and a DSiNOx ratio in the SML lower than the Brzezinski ratio, indicating a potential (co-)limitation by Si (Geisen et al., 2022). These stations were grouped into a region hereafter referred to as “Kerguelen bloom” (KER), which differed from the offshore stations in the PFZ (O6, O7, O9) and AZ (O11, O10) (Table 2).
Table 2Metadata, hydrological and biogeochemical features for the SOCARB stations. Stations were grouped according to their hydrographic zone and biogeochemical region. Region assignment was based on surface TChl a, nutrient concentrations and molar ratios (mean ± SD) in surface mixed layer (SML).
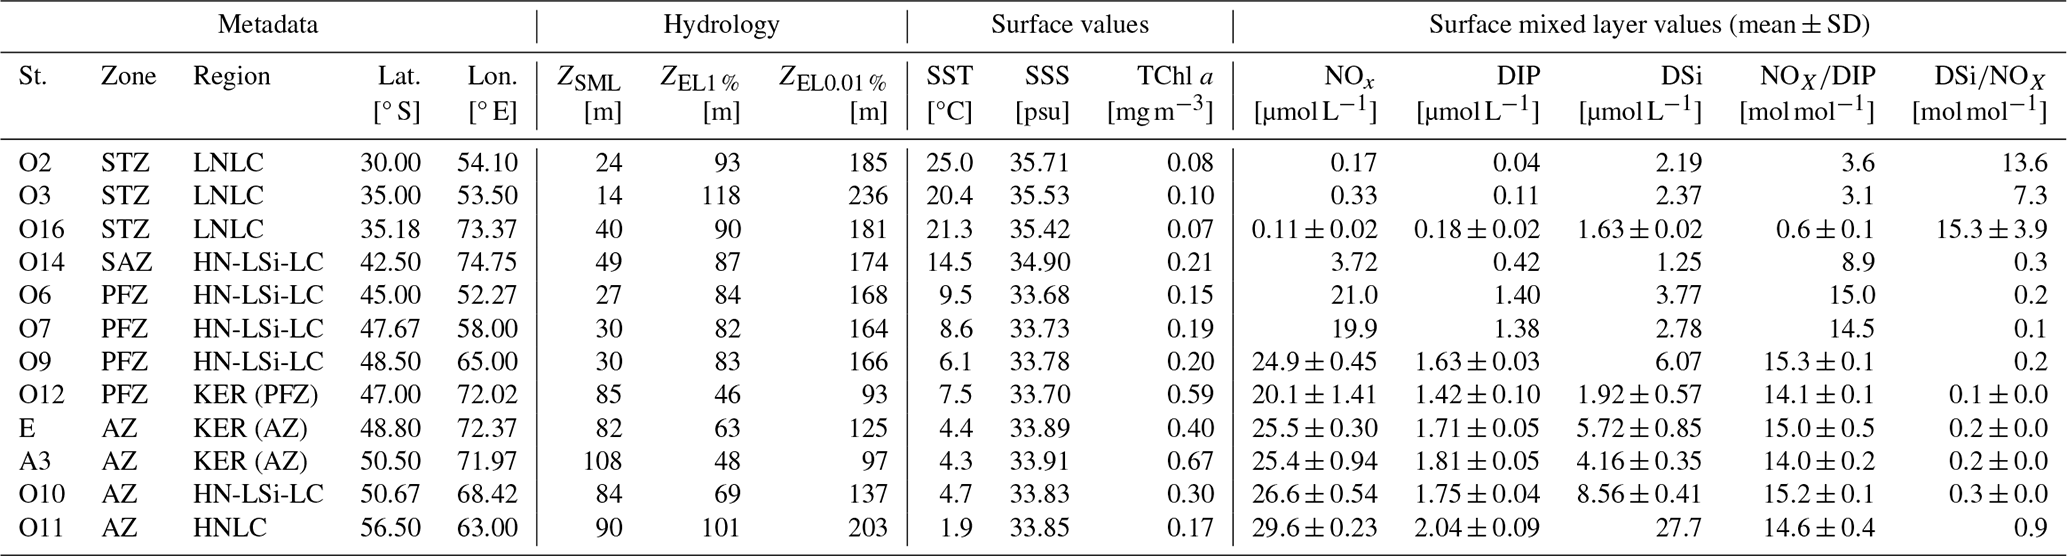
STZ, Subtropical Zone; SAZ, Subantarctic Zone; PFZ, Polar Frontal Zone; AZ, Antarctic Zone; KER, Kerguelen bloom; SST, Sea Surface Temperature; SSS, Sea Surface Salinity; TChl a, total chlorophyll a; ; DIP, dissolved inorganic phosphorus; DSi, dissolved silicon.
3.2 Synoptic view of the distribution of phytoplankton biomass and primary production
3.2.1 Vertical distribution of TChl a and NPP
The mean TChl a profiles of the total fraction (TChl aTOTAL) and the size classes (TChl aPICO, TChl aNANO, TChl aMICRO) are presented in Fig. 2a–e for each hydrological zone, and in Fig. A1 (Appendix A) for all stations. Across all zones, the depth of SCM (ZSCM) of TChl aTOTALoccurred between 60 and 100 m and was usually below the ZSML, except in the KER region where the SCM was located above the ZSML. For all zones, the ZSCM was similar for the total fraction and the size classes, except in the KER region where the ZSCM for TChl aMICRO peaked around 40 m while the ZSCM of TChl aNANO was deeper (between 60 and 80 m). Despite vertical variations in TChl a, the TChl a size structure – i.e. the relative contributions of each size class to TChl aTOTAL – remained unchanged with depth for all zones (not shown).
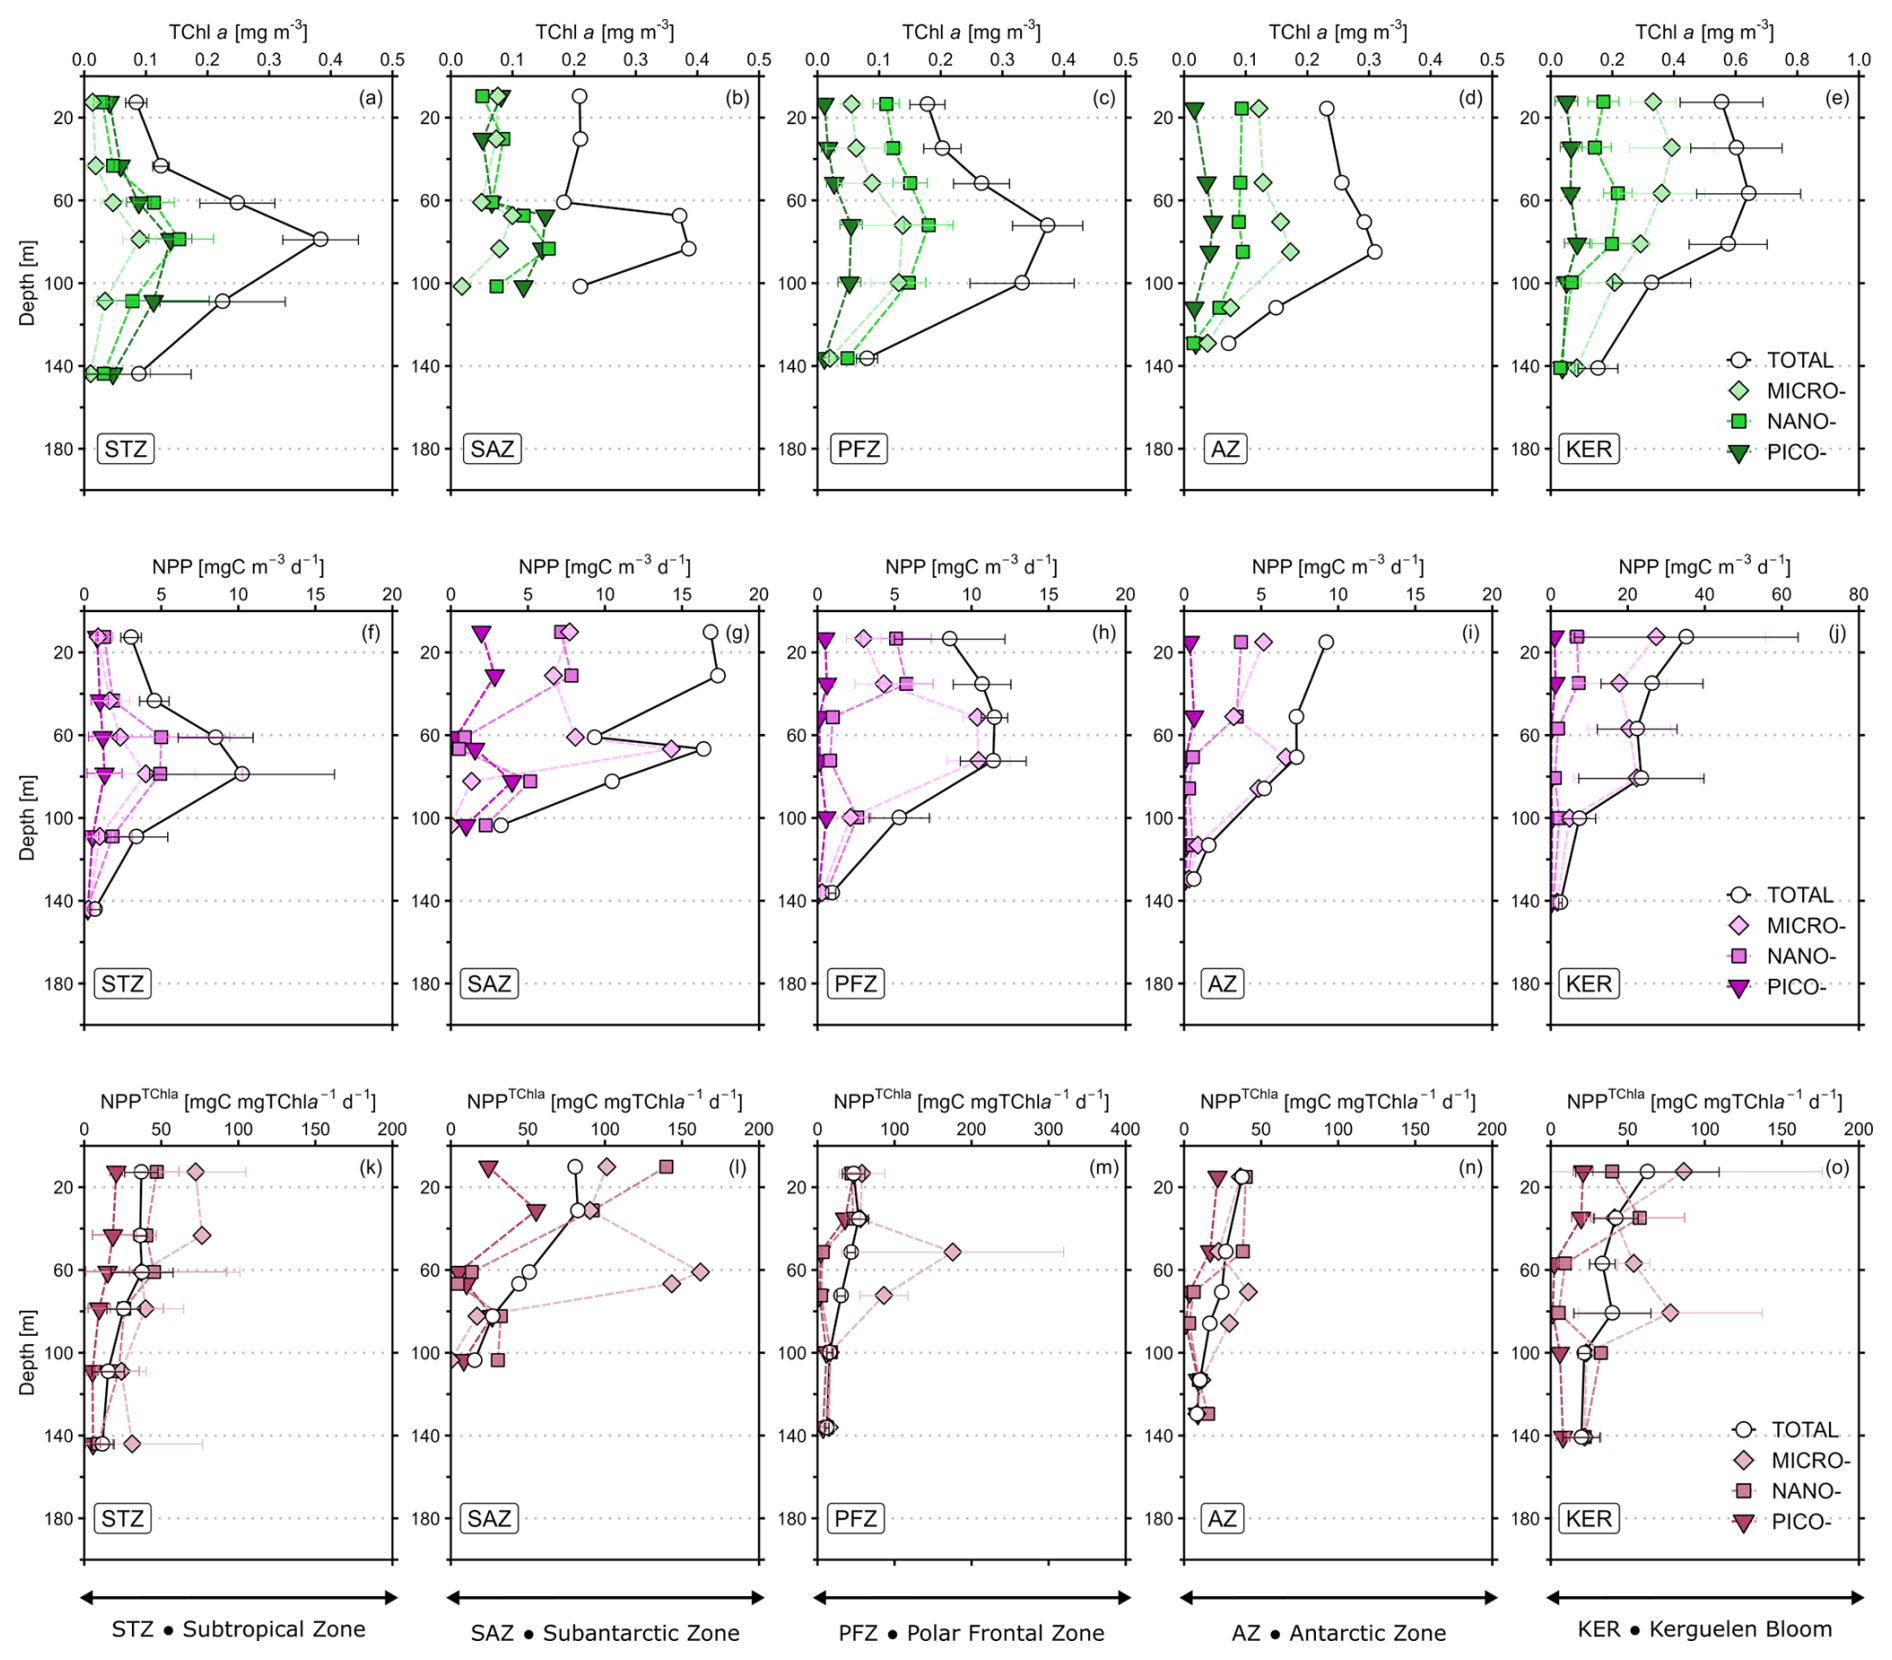
Figure 2Mean vertical profiles of (a–e) total chlorophyll a (TChl a), (f–j) net primary production, (k–o) TChl a-normalised primary production (NPPTChl a) for the five hydrographic zones in the study area: Subtropical zone (STZ: a, f, k, n=3), Subantarctic zone (SAZ: b, g, l, n=1), Polar Frontal zone (PFZ: c, h, m, n=3), Antarctic zone (AZ: d, i, n, n=2) and Kerguelen bloom (KER: e, j, o, n=3). Values are mean ± SD (or mean value only when n<3). Note the differences in scale for KER for TChl a and NPP, and in PFZ for NPPTChl a. All the profiles for every station are presented in Appendix A: Fig. A1 for TChl a, Fig. A2 for NPP and Fig. A3 for PPTChl a.
As for TChl a, the mean NPP profiles of the total fraction (NPPTOTAL) and the size classes (NPPPICO, NPPNANO, NPPMICRO) are presented in Fig. 2f–j for each zone and displayed in Fig. A2 (Appendix A) for all stations. Here, the subsurface NPP maximums were not as marked as the SCM. Moreover, the subsurface NPP maximums coincided with SCM in the STZ and PFZ. Contrary to TChl a, the NPP size structure – i.e. the relative contributions of each size class to NPPTOTAL – was heterogeneous with depth (not shown). In the STZ, surface NPP was evenly distributed in each size class, while subsurface NPP maximum was dominated by nanophytoplankton at O2 and O3, and by microphytoplankton at O16 (Fig. A2). In the SAZ, PFZ and AZ, surface NPP was mainly supported by nano- and microphytoplankton, while subsurface NPP maximum was dominated by microphytoplankton. In the KER region, NPP was mainly dominated by microphytoplankton. By normalizing NPP to TChl a, we calculated NPPTChl a (in ) which can reflect photosynthesis efficiency under given environmental conditions (e.g. light/nutrient availability; Cermeño et al., 2005). NPP was maximal in the first 50 m at all zones – except at O3 and O6 where it peaked below the SML – and decreased with depth (Fig. 2k–o; Fig. A3). Interestingly when considering the size classes, NPP often peaked at depth across all zones and coincided with minima in NPP and NPP, except in the STZ.
3.2.2 Spatial distribution of TChl a and NPP
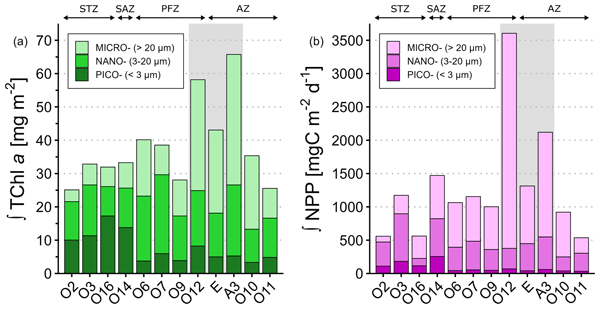
Integrated TChl aTOTAL over the ZEL0.01 % ranged from 25.1 mg m−2 at O2 (STZ) to 65.7 mg m−2 at A3 (KER) (Fig. 3a). Stations in the KER region displayed the highest TChl aTOTAL (55.7 ± 11.6 mg m−2), while the remaining stations exhibited lower TChl aTOTAL (32.3 ± 5.3 mg m−2). Across the study area, nano- and microphytoplankton contributed the most to TChl aTOTAL and represented respectively 40 % ± 11 % and 37 % ± 18 % of TChl aTOTAL (Table S3 in the Supplement). It is noteworthy that the picophytoplankton relative contribution to TChl aTOTAL (23 % ± 16 %) was significantly lower than those of nano- and microphytoplankton (p<0.05). In the STZ and SAZ, integrated TChl aTOTAL was similar and dominated by both pico- and nanophytoplankton, which contributed to 42 % ± 8 % and 39 % ± 9 % respectively. In the offshore PFZ and AZ, integrated TChl aTOTAL was similar and dominated by the biomass of nano- (46 % ± 12 %) and microphytoplankton (40 % ± 14 %). In the KER region, microphytoplankton biomass contributed the most to integrated TChl aTOTAL (58 % ± 1 %). Furthermore, the integrated TChl a size structure also varied within specific hydrographic zones. For instance, in the PFZ, integrated TChl a at O7 was dominated by nanophytoplankton (61 %) while the main contributors at O6 and O9 were nano- (48 %) and micro- (40 %) (Table S3).
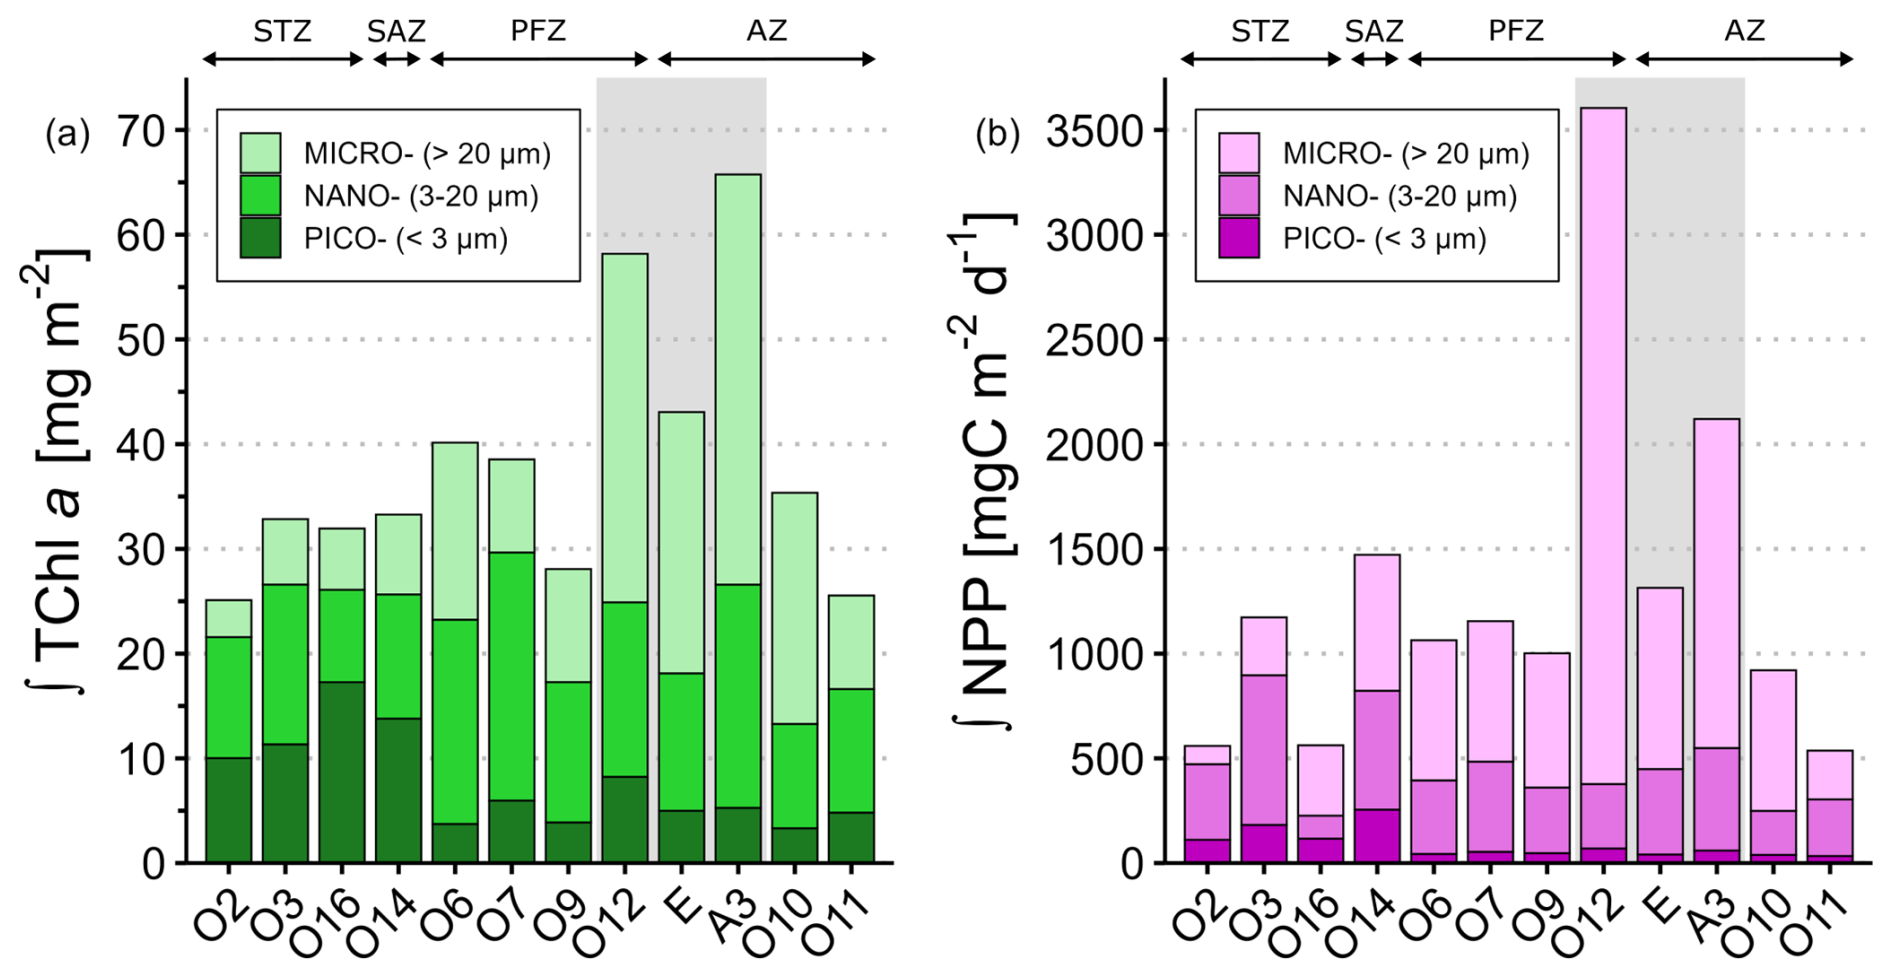
Figure 3Spatial distribution of the phytoplankton size classes for (a) integrated total chlorophyll a (∫TChl a) and (b) integrated net primary production (∫NPP) over the ZEL0.01 %. The relative contributions values for ∫TChl a and ∫NPP are detailed in Table S3. Stations were grouped according to their hydrographic zone and biogeochemical region. The grey box covers the stations located in the Kerguelen region. STZ, Subtropical Zone; SAZ, Subantarctic Zone; PFZ, Polar Frontal Zone; AZ, Antarctic Zone.
The lowest integrated NPPTOTAL over the ZEL0.01 % were observed at O11 (AZ), O16 and O2 (STZ) (553 ± 14 ), while the highest values were recorded at A3 (2120 ) and O12 (3605 ) in KER (Fig. 3b). Such differences highlighted the greater variability of NPPTOTAL during SOCARB compared to TChl aTOTAL, with a factor of 6.7 for NPPTOTAL versus 2.7 for TChl aTOTAL. In particular in the STZ, integrated NPPTOTAL at O3 was twice higher than at O2 and O16 (Fig. 3b). Across the study area, microphytoplankton was the main contributor to NPPTOTAL (56 % ± 21 %), followed by nano- (35 % ± 17 %) and picophytoplankton (9 % ± 7 %) (Table S3). The relative contributions of each size class to NPPTOTAL were significantly different from each other (p<0.05). The NPP size structure remained homogeneous within the PFZ, AZ and KER region, where microphytoplankton contributed the most to integrated NPPTOTAL (66 % ± 13 %), except at O11 where nano- and microphytoplankton accounted respectively for 50 % and 43 %. The STZ was the sole zone with notable heterogeneity: while nanophytoplankton dominated at the western stations O2 and O3 (mean contribution of 63 %), microphytoplankton was the main contributor to integrated NPPTOTAL at the eastern station O16 (60 %).
Across the global study area, correlations between the total fraction and each size class were significant for both TChl a and NPP (Table 3). TChl aTOTAL exhibited the strongest correlations with TChl aMICRO (ρ=0.87) and TChl aNANO (ρ=0.80), while NPPTOTAL was most strongly correlated with NPPMICRO (ρ=0.86). When comparing the hydrographic zones, both TChl a and NPP correlations revealed a clear spatial variability. In the STZ, the total fraction displayed the highest correlations with pico- and nanophytoplankton, while in the PFZ, AZ and KER region it correlated most strongly with nano- and microphytoplankton. NPPTOTAL was significantly correlated with TChl a for each size class over the global study area, with the strongest correlations found with TChl aNANO (ρ=0.76) and TChl aMICRO (ρ=0.70). When comparing the hydrographic zones, TChl aPICO had a significant impact on NPPTOTAL only in the STZ, while TChl aNANO and TChl aMICRO had a significant impact on NPPTOTAL in each hydrographic zone. The SAZ was the sole exception, as no significative correlations were found between NPPTOTAL and TChl a in any size class, likely due to the small number of samples.
Table 3Spearman's rank correlation coefficients of volumetric TChl a and NPP for the different size classes (total, pico-, nano- and micro-) in the global study area and within the different zones. Significant results are presented in bold font.
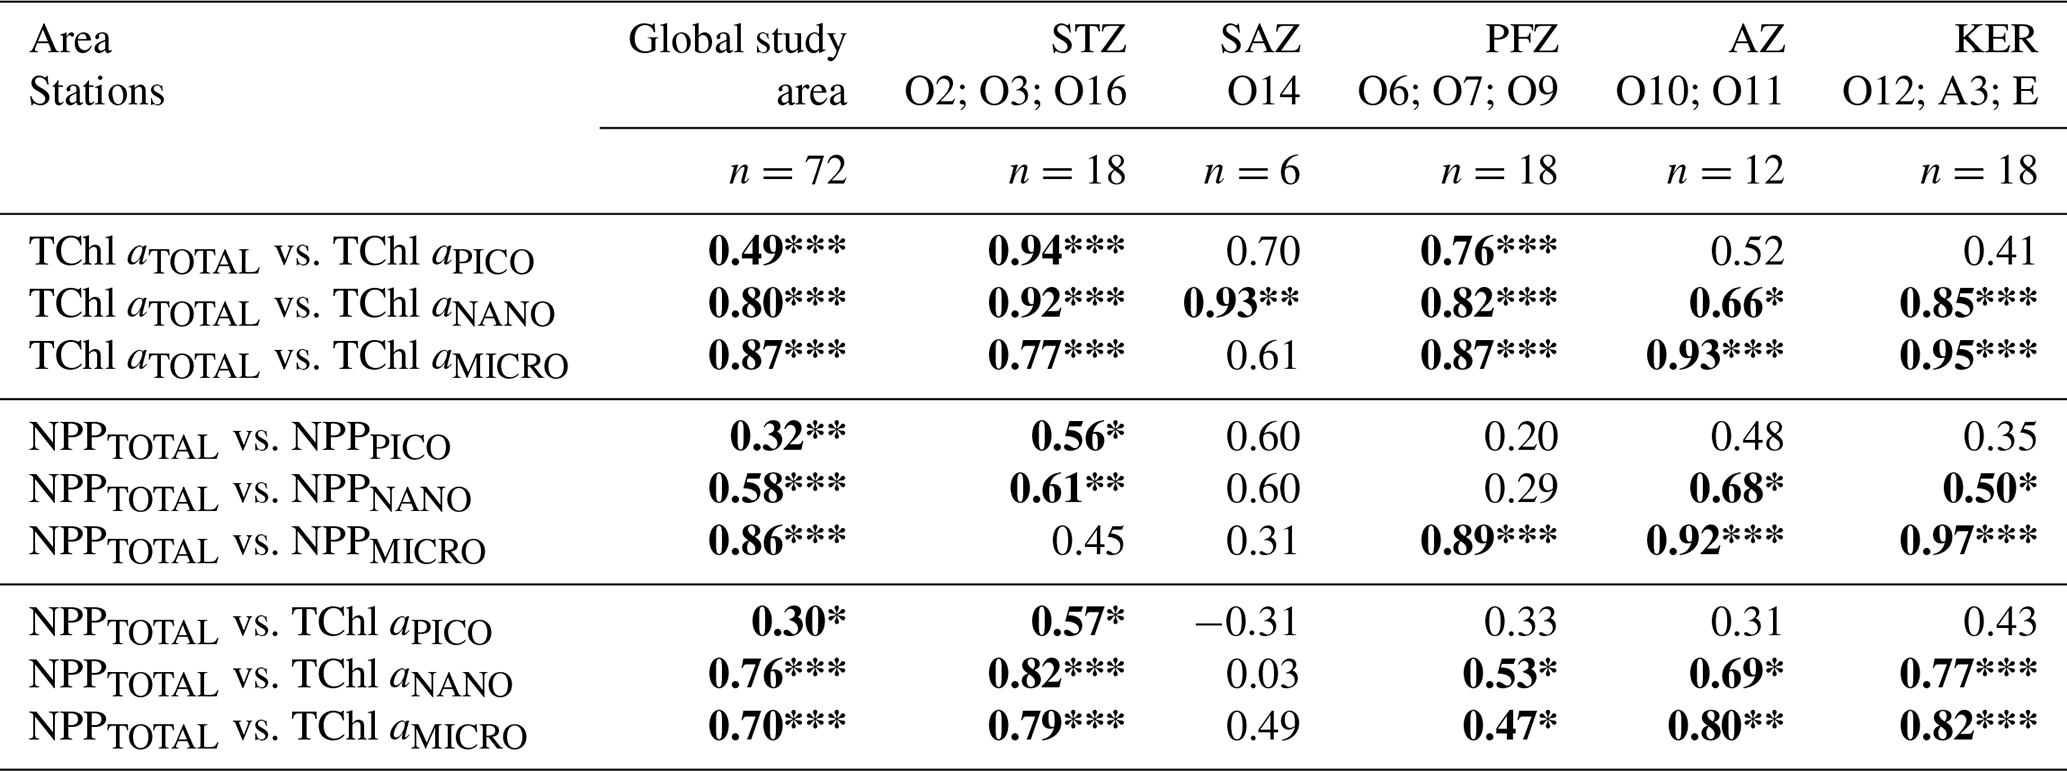
Significance level: * for <0.05; ** for <0.01; *** for <0.001. STZ, Subtropical Zone; SAZ, Subantarctic Zone; PFZ, Polar Frontal Zone; AZ, Antarctic Zone; KER, Kerguelen region.
3.3 In-depth description of the distribution of the phytoplankton community
The concentrations and relative contributions of the 8 main accessory pigments (Fuco, Peri, Hex-fuco, But-fuco, Allo, Chl b, Zea and DVChl a) integrated over the ZEL0.01 % for the total fraction and the size classes are presented in the Supplement (Table S4; Fig. S3).
3.3.1 Insights into the biomass and size structure of phytoplankton chemotaxonomic groups across the study area
Over the study area, the main contributors to integrated TChl aTOTAL were microphytoplankton diatoms (20 % ± 18 %) followed by nanophytoplankton haptophytes (19 % ± 7 %) and microphytoplankton haptophytes (14 % ± 11 %; Table S5 in the Supplement). Focusing on the contributions of phytoplankton chemotaxonomic groups biomass to integrated TChl a for each size class (Fig. 4a), haptophytes stood out in the three size classes, constituting the dominant and ubiquitous group among all size classes across the study area (Fig. 4a). Focusing on the contributions of each size class to the biomass of the chemotaxonomic groups averaged over the study area (Fig. 4b), each chemotaxonomic group was distributed among each size class with contrasting relative contributions. Diatoms biomass was mostly associated with the microphytoplankton, accounting for 67 % ± 21 % of total diatom biomass. Haptophytes, cryptophytes and chlorophytes biomass were mostly found in the nanophytoplankton, while dinoflagellates biomass was distributed evenly and almost exclusively in the nano- and microphytoplankton (Fig. 4b). Pelagophytes biomass was mainly found in the picophytoplankton, yet nano- and microphytoplankton contributions to total pelagophytes biomass remained notable. As expected, cyanobacteria (Prochlorococcus and Synechococcus) biomass was mainly distributed in the picophytoplankton, however a small fraction (<3.5 %) was also detected in the nano- and microphytoplankton biomass (Fig. 4a and b).
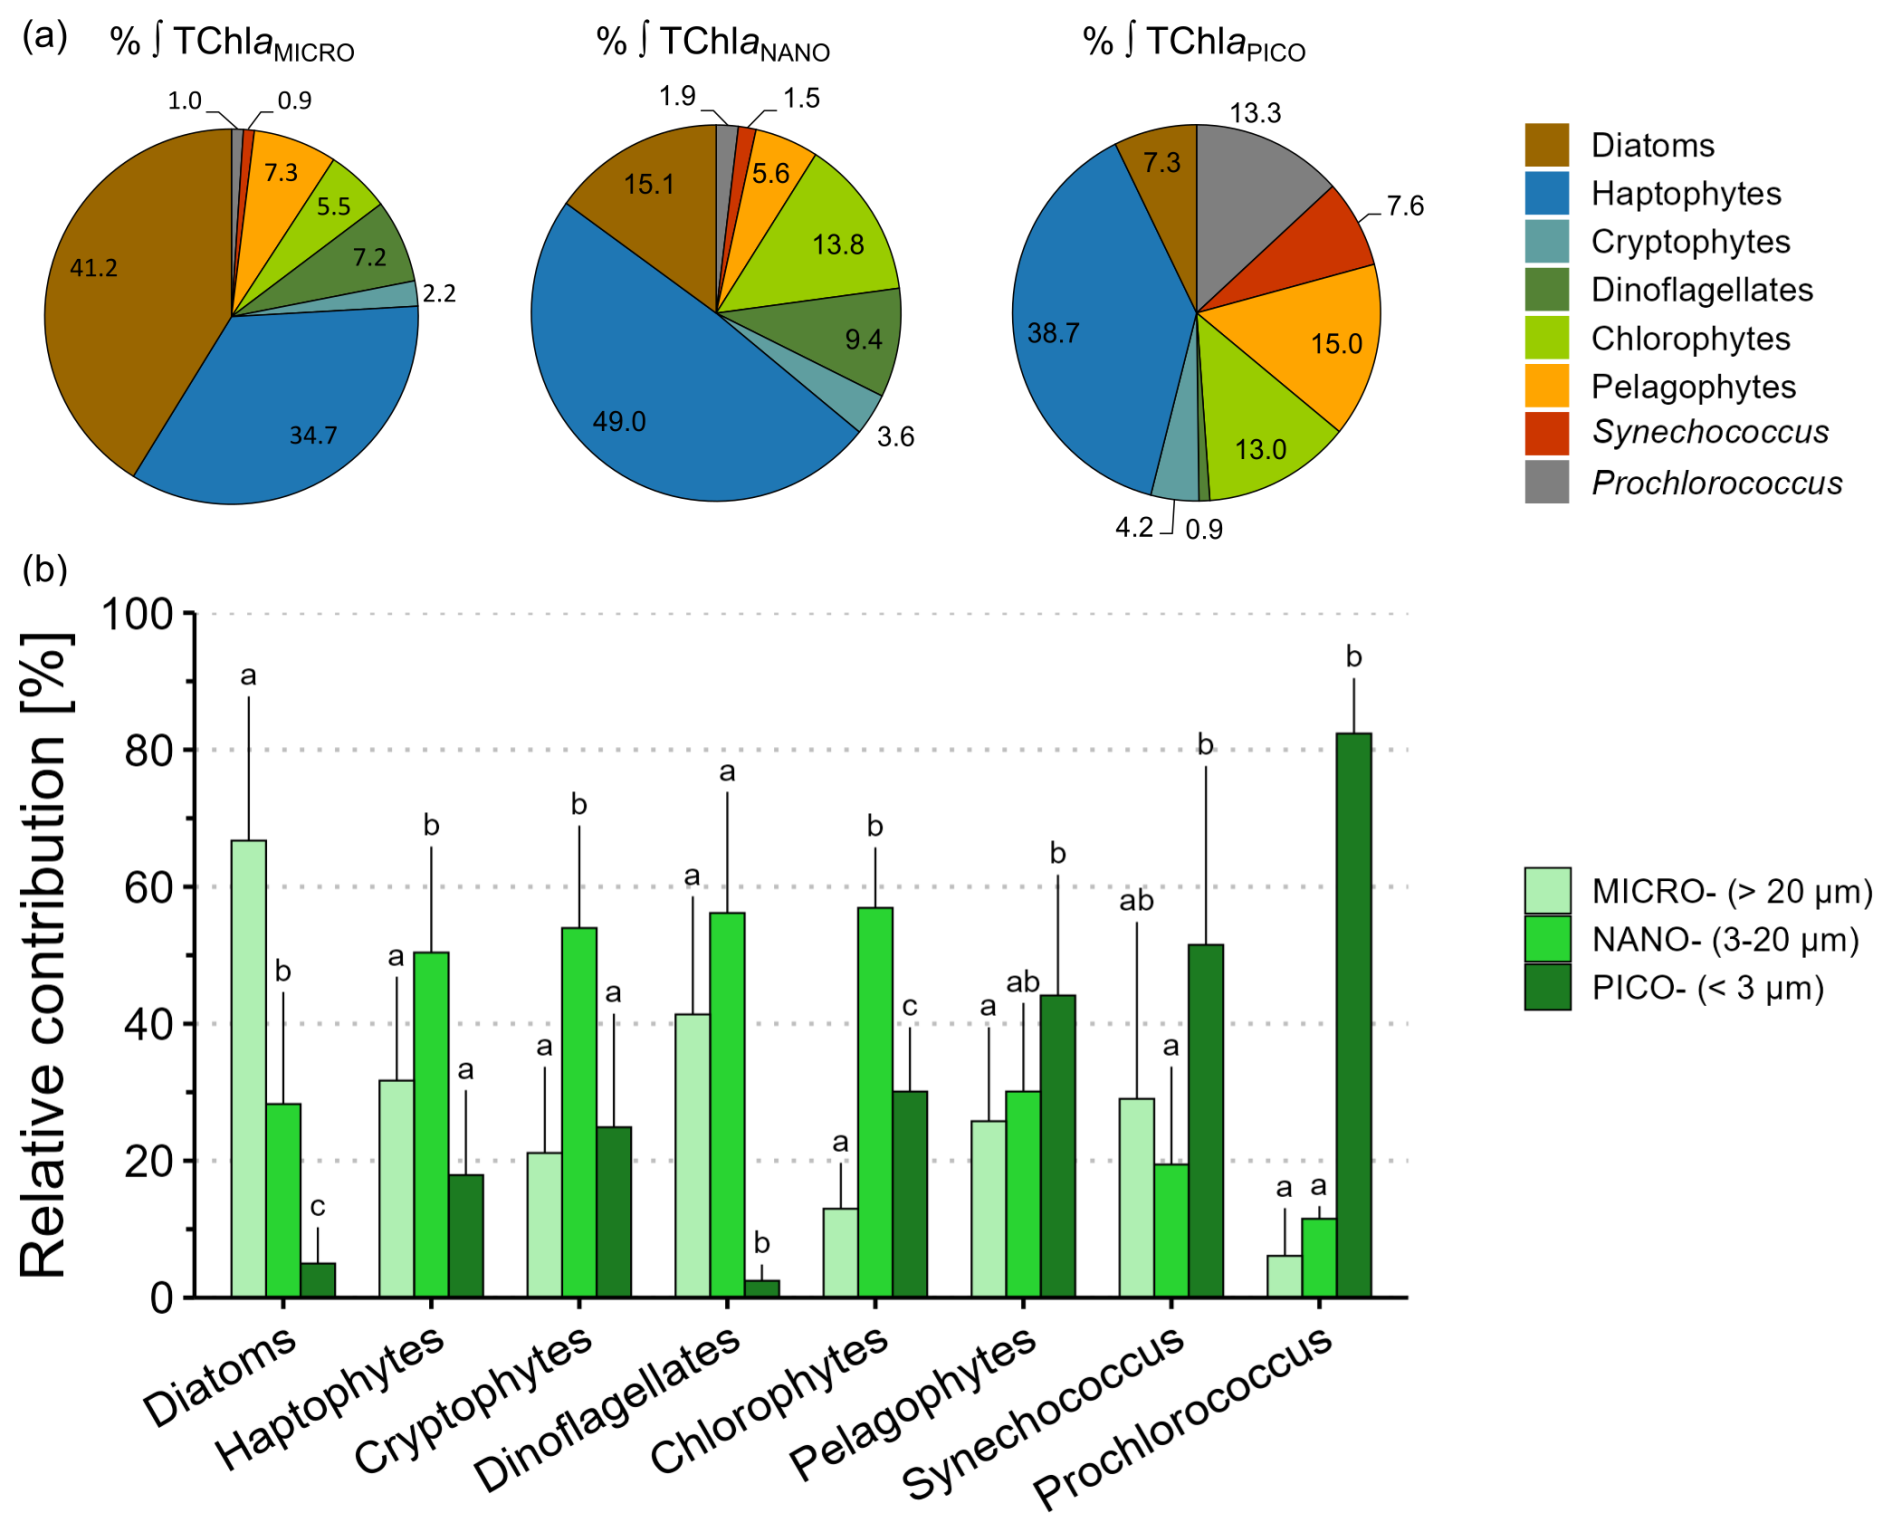
Figure 4Insights into the size structure of phytoplankton chemotaxonomic groups using integrated biomass over the ZEL0.01 % across the global study area (n=12). (a) Circular diagrams of average relative contributions (%) of phytoplankton chemotaxonomic groups to integrated TChl a for the micro-, the nano- and the picophytoplankton size classes. (b) Barplots of average relative contributions (%) of the size classes to the biomass of each phytoplankton chemotaxonomic group. Vertical bars indicate mean relative contribution + SD. Within a given group, mean relative contribution that are not significantly different (p≥0.05) are labelled with the same letter. Note that Prochlorococcus data in the barplots were computed from the STZ and SAZ (n=4), i.e. only where Prochlorococcus biomass was detected.
3.3.2 Spatial distribution of integrated phytoplankton chemotaxonomic groups biomass
In the STZ, where integrated TChl aTOTAL was dominated by pico- (43 % ± 10 %) and nanophytoplankton (40 % ± 11 %), TChl aPICO was dominated by cyanobacteria (70 % ± 13 %) whereas TChl aNANO was mainly sustained by haptophytes (43 % ± 4 %) and chlorophytes (20 % ± 9 %) (Fig. 5e and f). In the SAZ, despite similar TChl a size structure compared to STZ, TChl aPICO was mainly driven by haptophytes (32 %) and pelagophytes (30 %) while TChl aNANO was mainly sustained by chlorophytes (43 %) and haptophtyes (30 %). In the offshore PFZ and AZ where integrated TChl aTOTAL was dominated by nano- (46 % ± 12 %) and microphytoplankton (40 % ± 14 %), TChl aNANO was firstly sustained by haptophytes (58 % ± 5 %) followed by diatoms (19 % ± 8 %), whereas TChl aMICRO was firstly driven by diatoms (55 % ± 19 %) followed by haptophytes (29 % ± 10 %) (Fig. 5d and e). In the KER region where TChl aTOTAL was dominated by microphytoplankton (58 % ± 1 %), TChl aMICRO was dominated by diatoms and haptophytes whose relative contributions were respectively 54 % ± 9 % and 35 % ± 2 % (Fig. 5d).
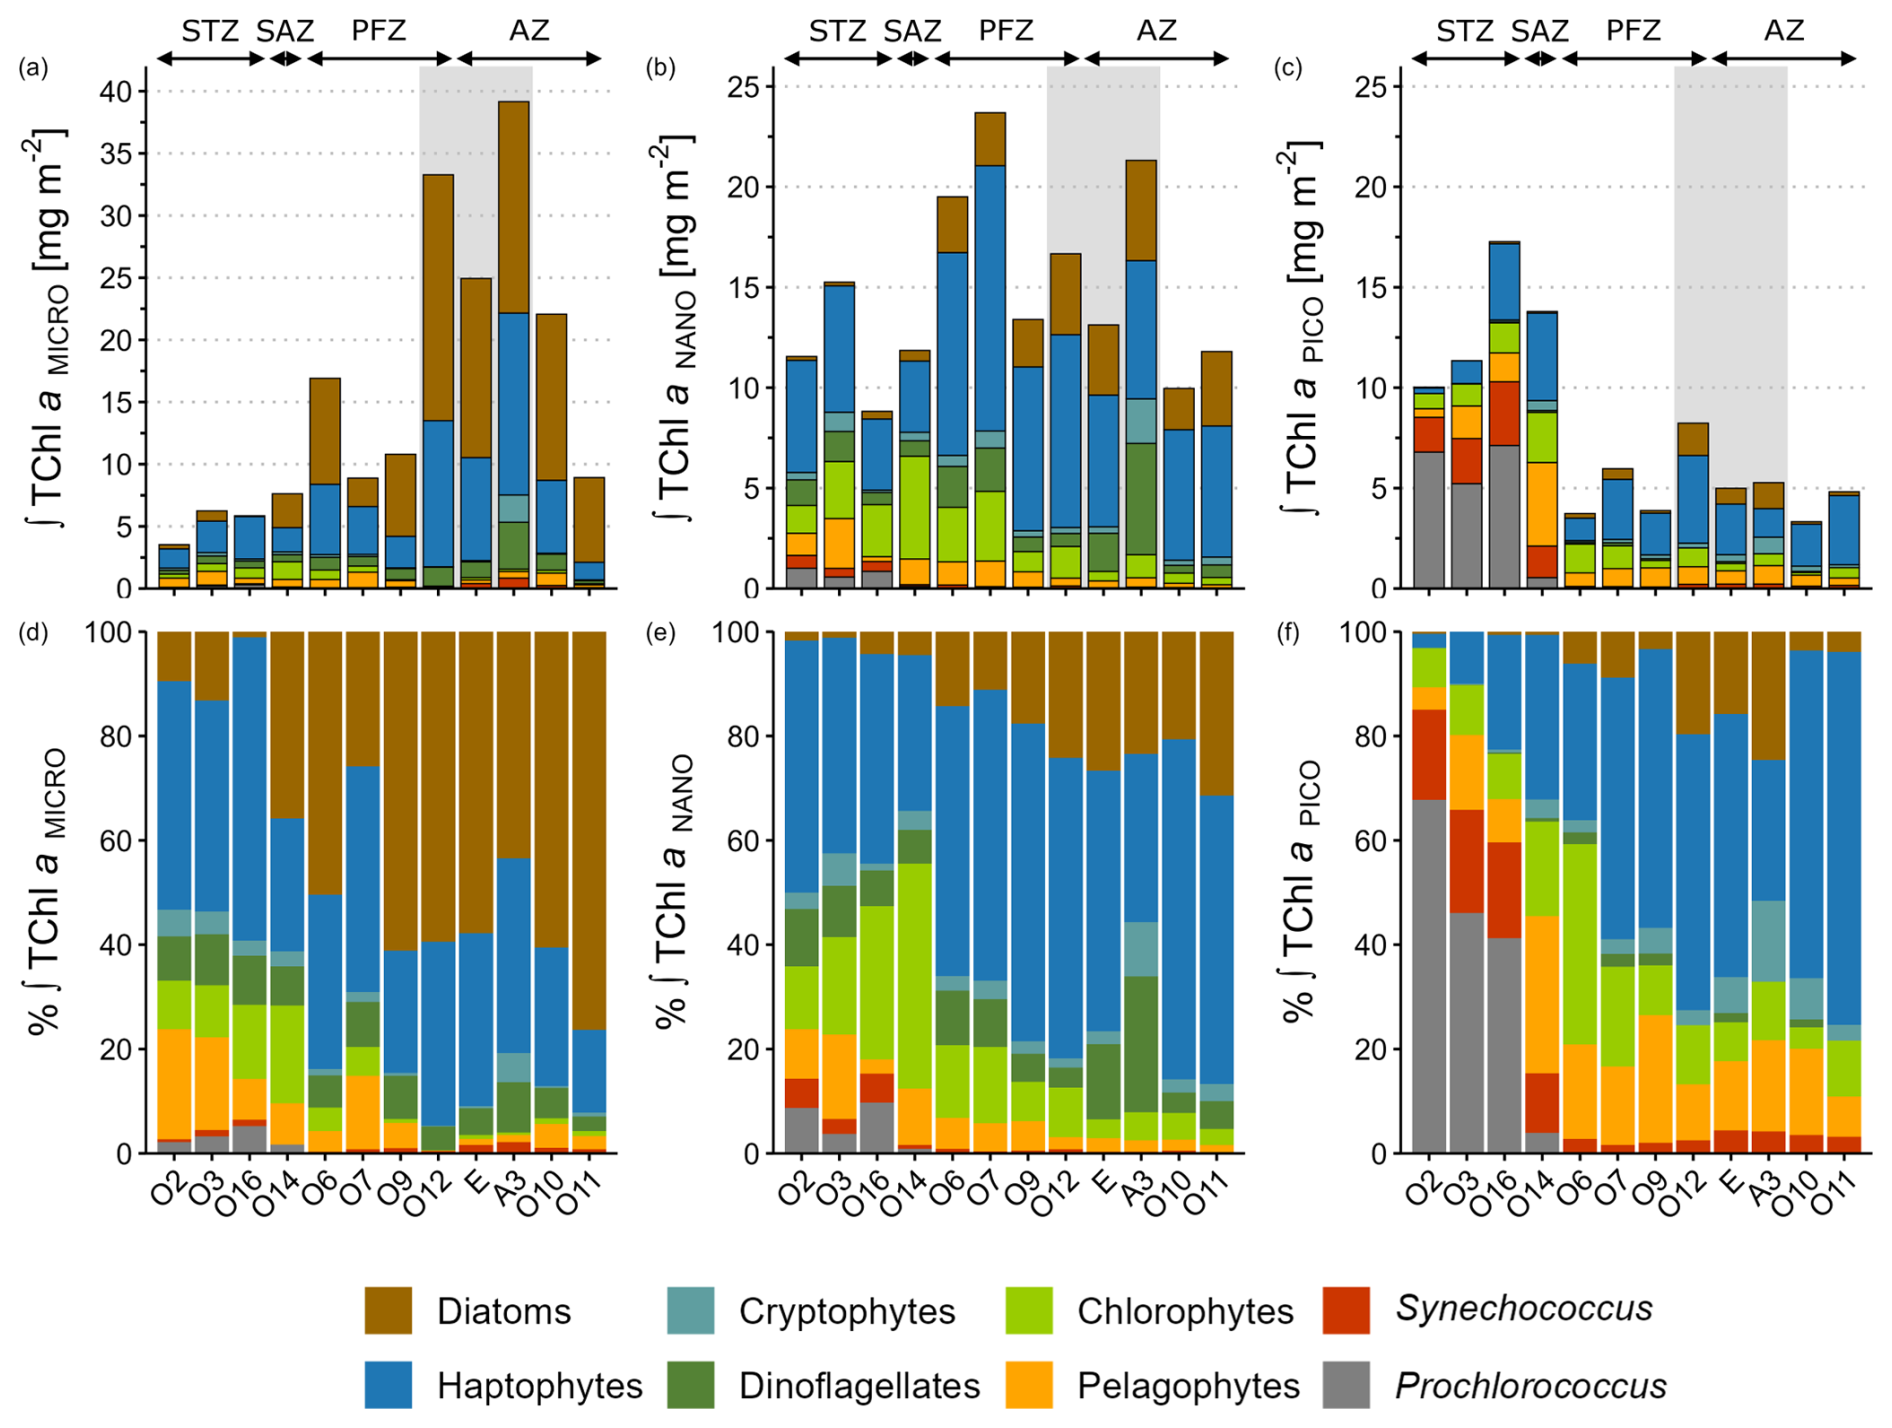
Figure 5Spatial distribution of phytoplankton taxonomic groups of (a–c) integrated TChl a and (d–f) relative contribution to integrated TChl a over the ZEL0.01 % for the micro- (a, d), the nano- (b, e) and the picophytoplankton (c, f) size classes. Mind the scale differences of TChl a for the microphytoplankton compared to nano- and pico-. Stations were grouped according to their hydrographic zone and biogeochemical region. The grey box covers the stations located in the Kerguelen region. STZ, Subtropical Zone; SAZ, Subantarctic Zone; PFZ, Polar Frontal Zone; AZ, Antarctic Zone.
The size structure of phytoplankton chemotaxonomic groups biomass shifted within each size class across the study area. The microphytoplankton community shifted from haptophyte dominance in the STZ (48 % ± 9 % of TChl aMICRO) towards diatom dominance in the PFZ, AZ and KER (54 % ± 15 %) (Fig. 5d). Within the nanophytoplankton, chlorophytes were the secondary contributors in the STZ (20 % ± 9 % of TChl aNANO), but were replaced by diatoms in the PFZ, AZ and KER region (21 % ± 7 %) (Fig. 5e). The picophytoplankton community shifted from cyanobacteria dominance in the STZ (70 % ± 13 % of TChl aPICO) to haptophyte dominance in the PFZ and AZ (50 % ± 15 %) (Fig. 5f). This shift across the study area was also observed for the total fraction (Fig. S4 in the Supplement). Indeed, the SAZ acted as a “boundary zone” within the study area, delineating distinct community structures. North of the SAZ, the community in the STZ appeared relatively diversified, with four groups (cyanobacteria, haptophytes, chlorophytes and pelagophytes) each contributing more that 10 % to TChl aTOTAL. In contrast, south of the SAZ, the community in the PFZ, AZ and KER region appeared relatively less diversified, with only two groups (diatoms and haptophytes) contributing more than 10 % to TChl aTOTAL (Fig. S4b). In the SAZ, the community at O14 was relatively diversified, with four groups (haptophytes, chlorophytes, pelagophytes and diatoms) each contributing more than 10 % to TChl aTOTAL, alongside a marked increase in diatom biomass and a concurrent decline in cyanobacteria.
3.4 Links between the size structure of phytoplankton chemotaxonomic groups biomass and primary production
Correlation coefficients were computed between volumetric NPPTOTAL and phytoplankton chemotaxonomic groups biomass for each size class (Table 4). Across the study area, NPPTOTAL was mainly driven by the biomass of nano- and microphytoplankton (Table 3). For these two size classes, NPPTOTAL showed the highest correlation coefficients with the biomass of haptophytes, dinoflagellates and diatoms. In the STZ, NPPTOTAL was significantly correlated with TChl a in all size classes (Table 3), specifically with the TChl aPICO of cyanobacteria (Prochlorococcus and Synechococcus) and chlorophytes; with the TChl aNANO of haptophytes, dinoflagellates and chlorophytes; and with the TChl aMICRO of dinoflagellates, haptophytes and diatoms (Table 4). No significant correlations were found in the SAZ. In the PFZ, NPPTOTAL was significantly correlated with TChl aNANO and TChl aMICRO (Table 3), specifically with the TChl aNANO of diatoms, haptophytes and Synechococcus, and with the TChl aMICRO of diatoms, and negatively correlated with the TChl aMICRO of Synechococcus. In the AZ and KER region, similar correlation patterns were observed: NPPTOTAL was mainly correlated with the TChl aNANO of haptophytes and by the TChl aMICRO of haptophytes, diatoms and dinoflagellates (Table 4).
Table 4Spearman's rank correlation coefficients between volumetric NPPTOTAL and the phytoplankton chemotaxonomic groups biomass for each size class following the different zones and regions of the study area. Significant results are presented in bold font.
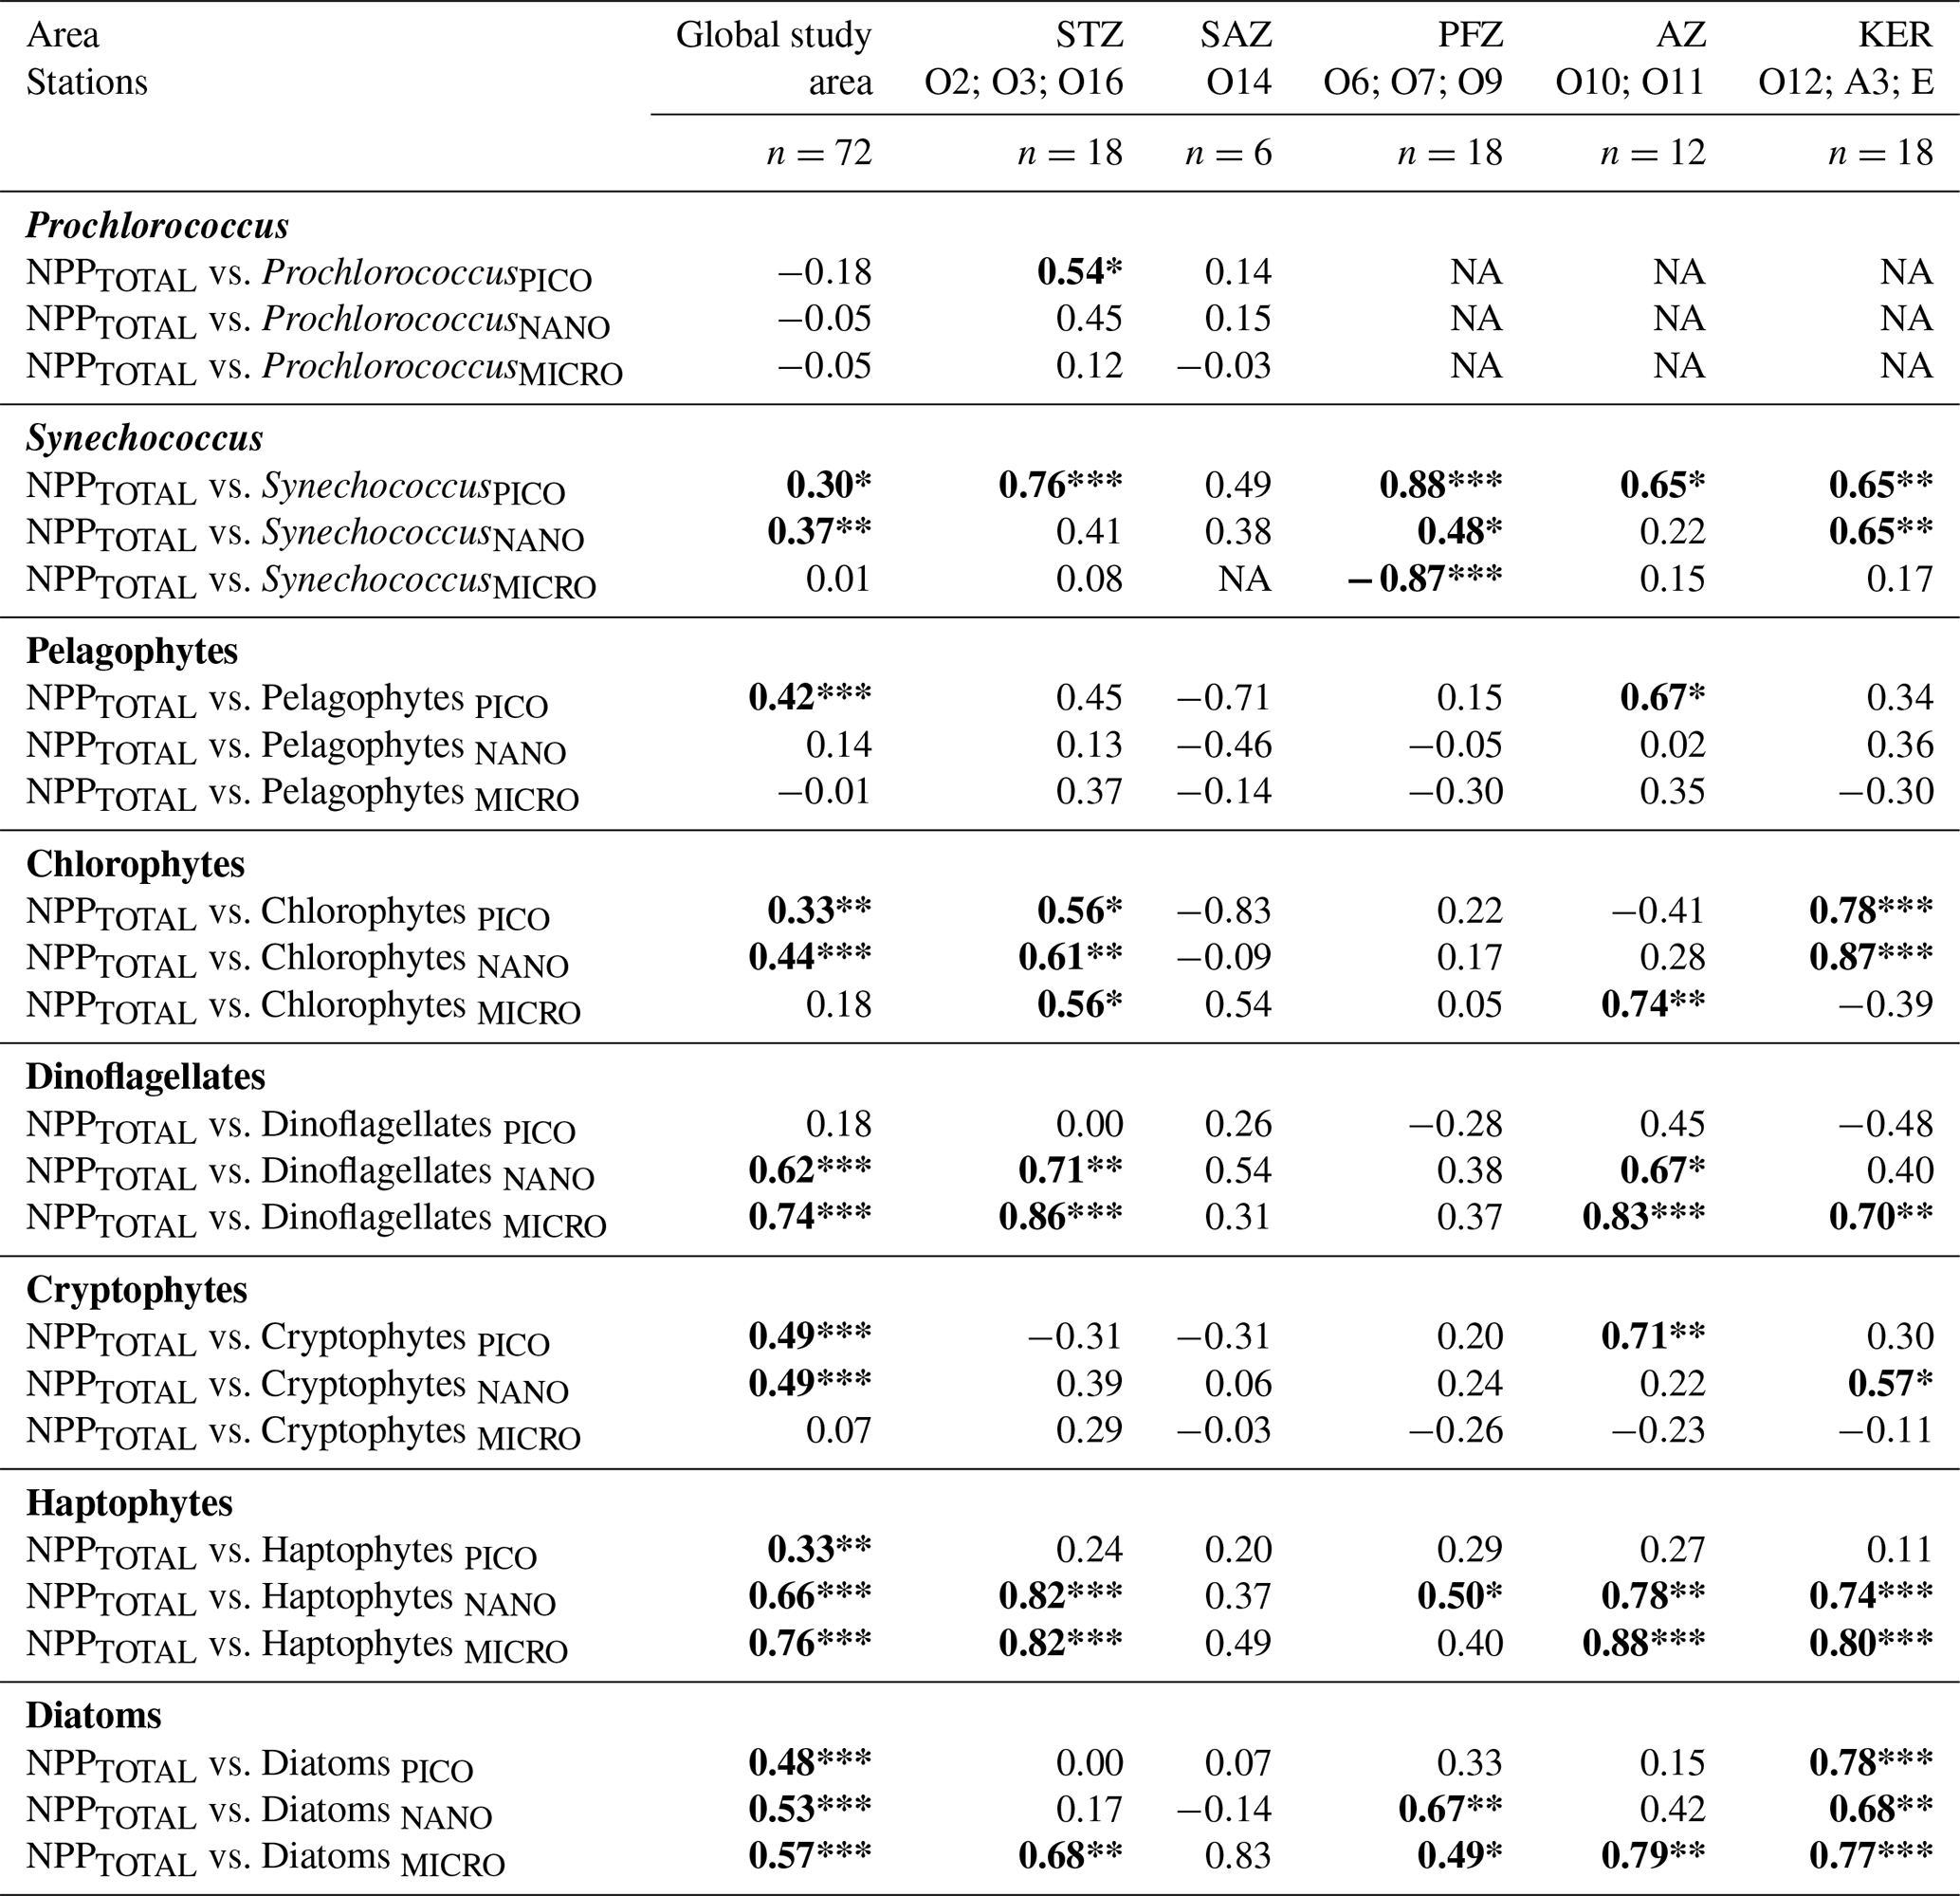
Significance level: * for <0.05; ** for <0.01; *** for <0.001. STZ, Subtropical Zone; SAZ, Subantarctic Zone; PFZ, Polar Frontal Zone; AZ, Antarctic Zone; KER, Kerguelen region. NA: not available.
4.1 Analyzing the interplay between phytoplankton biomass and productivity in relation to size structure
4.1.1 Vertical size classes decoupling of NPPTChl a
In all zones within the study area, except in the STZ, NPP peaked at depth and coincided with minima in NPP and NPP (Fig. 2k–o). These maximums could reflect the adaptability of microphytoplankton in low-light environments to take advantage from the nutrients diapycnal diffusion (Tagliabue et al., 2014). At O6, O9 (PFZ) and all stations in the AZ and KER, diatoms were the main contributor to TChl aMICRO at these NPPTChl a maximums (data not shown). Large diatoms are known to thrive in such environmental niches thanks to their high growth efficiency under low-light conditions (Fisher and Halsey, 2016), their ability to regulate buoyancy (Villareal et al., 1996) and to exploit nutrient pulses through enhanced uptake and storage (Kemp and Villareal, 2013). However, haptophytes were the main contributor to TChl aMICRO at O14 (SAZ) and O7 (PFZ), where NPP peaked. For these stations, several hypotheses could explain our results. First, haptophytes have been shown to produce transparent exopolymer particles and form microphytoplankton size aggregates (Riebesell et al., 1995; Leblanc et al., 2009). Second, some Phaeocystis species such as P. globusa or P. antarctica are haptophytes known to form microphytoplankton size colonies from nano- and picophytoplankton size single cells, in response to environmental factors such as high irradiance and iron repletion (Feng et al., 2010; Bender et al., 2018), grazing (Long et al., 2007) or NOx limitation (Riegman et al., 1992). We rule out the latter hypothesis for explaining colonies formation at O14 and O7, as they featured HN-LSi-LC conditions. Further studies are needed to evaluate the recurrent or exceptional aspect of this outstanding feature and the preceding hypotheses.
4.1.2 Overall patterns of phytoplankton biomass and productivity size structures across the study area
Across the study area, microphytoplankton was the main contributor of NPPTOTAL (56 % ± 12 %) while the main contributors to TChl aTOTAL were nano- (40 % ± 11 %) and micro- (37 % ± 18 %). At the scale of the study aree, our results in TChl a size structure are similar with previous studies conducted during the austral summer, in the South Indian Ocean using phytoplankton functional pigments approaches to the bulk fraction (Mishra et al., 2020), and in the South Atlantic and the Atlantic sector of the Southern Ocean from size-fractionation approaches (Froneman et al., 2001). However, the NPP size structure in our study differed from that of TChl a, while Froneman et al. (2001) reported that NPP displayed similar size structure with TChl a. This concerns especially the microphytoplankton, as its contribution to NPPTOTAL in our study was superior than of TChl aTOTAL. This result suggested that microphytoplankton could be more efficient in CO2 fixation than the other size classes, which corroborate with previous studies from in situ experiments (Cermeño et al., 2005) and photophysiological models (Uitz et al., 2010). More specifically, the higher microphytoplankton photosynthetic efficiencies might be associated with a higher photochemical efficiency characteristic of certain taxonomic groups such as diatoms (Cermeño et al., 2005). We support this hypothesis as microphytoplankton diatoms formed the main contributor of bulk TChl a biomass in our study, by representing 20 % of TChl aTOTAL (Table S5).
Pigment chemotaxonomy has constituted a valuable tool for estimating the contribution of phytoplankton groups to TChl aTOTAL and analysing phytoplankton communities (Higgins et al., 2011; Kramer et al., 2024). Yet its application remained limited to the bulk fraction. Our study coupling pigment chemotaxonomy with size fractionation brings novel insights to dive deeper into the size structures of the phytoplankton community and of the phytoplankton chemotaxonomic groups. To our knowledge, Rodríguez et al. (2006) and Nunes et al. (2019) are the only two studies that have applied these approaches – with CHEMTAX algorithm and two size classes (<3 and >3 µm) – to investigate phytoplankton communities in the northwestern Iberian basin and in the surface Atlantic Ocean, respectively. Consistent with these studies, our results highlight that each phytoplankton chemotaxonomic group was not strictly associated with one specific size class (Fig. 4). These results underline the limitations of phytoplankton functional type approaches used to estimate phytoplankton size structure from bulk measurements (e.g. Uitz et al., 2006; Hirata et al., 2011). For instance, diatoms and dinoflagellates, which are commonly associated with the microphytoplankton in such approaches, were also distributed in the pico- and nanophytoplankton size classes (Fig. 4). This likely reflects the presence of nanoplanktonic dinoflagellate genera such as Amphidinium, Gymnodinium, Protoperidinium and Prorocentrum which have been reported in the Indian sector of the Southern Ocean (Georges et al., 2014; Hörstmann et al., 2021; Sreerag et al., 2023). Additionally, pico- and nanoplanktonic diatom genera such as Minidiscus and Fragilariopsis, as well as bolidophytes, a eukaryotic picophytoplankton group genetically very close to diatoms and sharing a similar pigments composition (Guillou et al., 1999), have previously been observed in the South Indian and South Atlantic Oceans (Hinz et al., 2012; Leblanc et al., 2018; Nunes et al., 2019; Deteix et al., 2024). Also, the presence of haptophytes in the picophytoplankton could be attributed to some coccolithophore genera such as small Emiliana, and to other genera such as Chrysochromulina and Phaeocystis (Poulton et al., 2007; Hinz et al., 2012; Patil et al., 2017; Hörstmann et al., 2021). Notably, Nunes et al. (2019) have shown that phytoplankton functional types approaches based on bulk measurements predicted a high contribution of nano- and microphytoplankton in the Atlantic sector of the Southern Ocean, while the size fractionation approach indicated the dominance of picophytoplankton.
Furthermore, our findings revealed that Prochlorococcus, Synechococcus and chlorophytes were mainly distributed in the picophytoplankton, but were also detected in the nano- and microphytoplankton (Fig. 4). This result, also reported in previous studies (Rodríguez et al., 2006; Nunes et al., 2019), can be explained by the size fractionation methodology, as the 3 and 20 µm pore sizes may retain a part of these organisms due to aggregation and/or adhesion. In addition, the attribution of pigments like zeaxanthin – associated with Synechococcus in this study – to larger size classes may be influenced by the presence of this pigment in nanophytoplankton (e.g. UCYN-B; UCYN-A in symbiosis within nanophytoplankton haptophytes) and microphytoplankton (e.g. Trichodesmium spp.; diatom diazotroph associations) previously detected in the STZ of the South Indian Ocean (Metzl et al., 2022; Chowdhury et al., 2024) or in some diatoms under high irradiance (Lohr and Wilhelm, 1999). Thus, our result underline the importance of interpreting phytoplankton size structure data in the context of methodological constraints. The presence of picophytoplankton groups in larger size classes and the dominance of haptophytes in the picophytoplankton underscore the need for complementary validation using microscopy, flow cytometry or molecular techniques.
4.1.3 Geographical distribution of phytoplankton biomass and productivity size structures in relation with environmental factors
The size structures of integrated biomass and primary production clearly shifted between the oligotrophic subtropical waters and the Southern Ocean waters, consistent with previous studies conducted in the Indian and Atlantic sectors of the Southern Ocean (Froneman et al., 2001; Mishra et al., 2017, 2020). Result from the multivariate analysis showed that potential temperature (theta) and NOx concentration (and DIP due to its strong correlation with NOx, see Sect. 2.6) were the major factors driving the spatial variability between the different zones (Fig. 6). Indeed, temperature and NOx concentration are recognized as key factors to shape phytoplankton biomass and productivity size structures, with picophytoplankton usually prevalent in warm and oligotrophic waters (Marañón, 2009; Hörstmann et al., 2021; Berthelot et al., 2025). In our study, the TChl a and NPP size structures in the PFZ, AZ and KER were mainly sustained by nano- (TChl a: 40 % ± 12 %; NPP: 30 % ± 12 %) and microphytoplankton (TChl a: 47 % ± 14 %; NPP: 66 % ± 13 %), which were consistent with previous studies conducted in the Atlantic and Indian sectors of the Southern Ocean, encompassing both HNLC and HN-LSi-LC low-productivity waters as well as high-productivity waters near the Crozet and Kerguelen Islands (Froneman et al., 2001, 2004; Seeyave et al., 2007; Uitz et al., 2009). By contrast, the TChl a size structure in the SAZ was mainly dominated by pico- (41 %) and nanophytoplankton (36 %), consistent with observations from other sectors of the SAZ in the Atlantic (Froneman et al., 2001) and western Pacific sectors (Boyd et al., 1999; McKay et al., 2005; Gutiérrez-Rodríguez et al., 2020). Similarly, the TChl a size structure in the STZ was mainly driven by the pico- (43 % ± 10 %) and nanophytoplankton (40 % ± 10 %). To our knowledge, there is no size-fractionated data for biomass and NPP in the literature in the STZ of the South Indian Ocean. Nevertheless, our results were similar to those of Froneman et al. (2001) in the South Atlantic STZ, which reported a TChl a size structure driven by pico- (49 % ± 10 %) and nanophytoplankton (39 % ± 6 %), but differed from other studies conducted in the northern and southern subtropical Atlantic, where picophytoplankton accounted for 60 %–75 % of TChl aTOTAL (Marañón et al., 2001; Morán et al., 2004). As temperature and NOx concentrations were similar between our study and the latter, the differences in TChl a size structure between the Atlantic and the Indian basins may be attributed to factors such as regional-scale hydrodynamics and/or atmospheric inputs (Marañón, 2009). Nevertheless, Zhang et al. (2012) reported a latitudinal variability of TChl a size structure in the western Pacific, with picophytoplankton being less dominant in subtropical than in tropical regions. For all that, extensive researches are needed in the South Indian Ocean to better understand the potential factors in shaping the size structures of phytoplankton biomass and productivity, especially in the STZ.
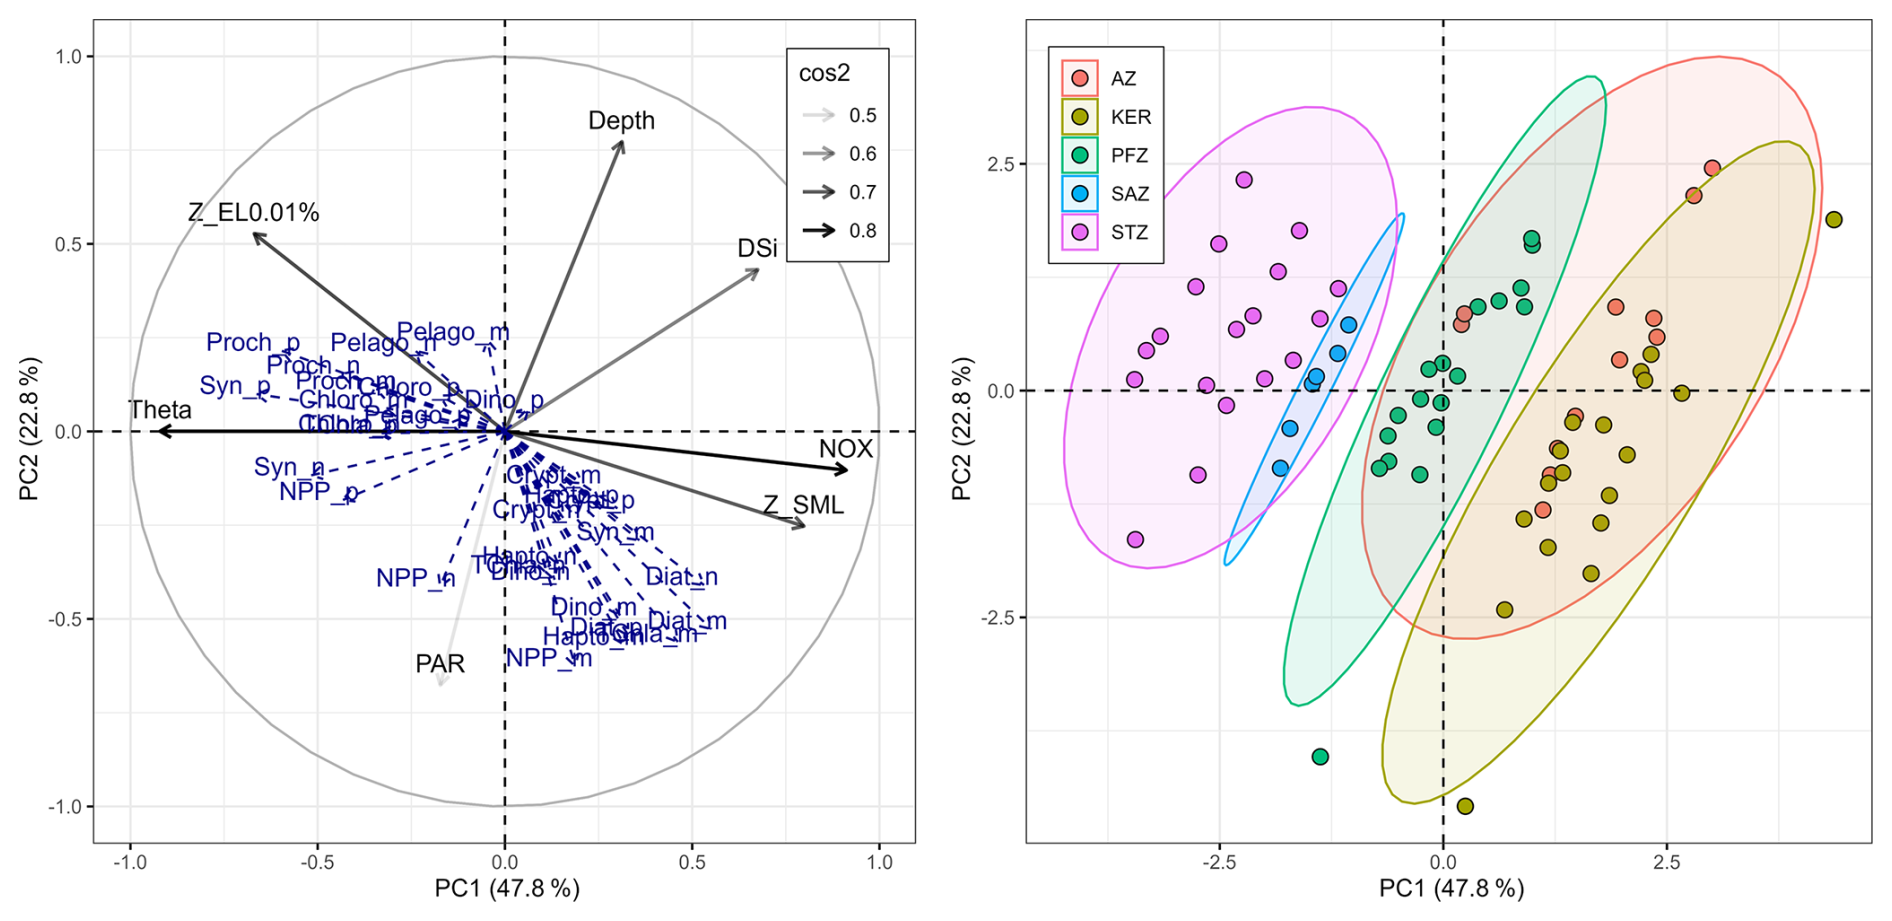
Figure 6Principal Component Analysis illustrating the relationships between explanatory variables and supplementary descriptors across the global study area. The first principal component (PC1) axis explains 47.8 % of the variance and the second principal component (PC2) axis explains 22.8 % of the variance. On the left panel, the black arrows indicate the explanatory variables (environmental factors) with their transparency defined by their cos2: the better the variables are well represented by the principal components, the higher the cos2. The blue arrows show the supplementary descriptors: NPP, TChl a and phytoplankton chemotaxonomic groups biomass in each size class. On the right panel, the colour of each point represents the zone of each sample (n=72).
Phytoplankton chemotaxonomic groups biomass also varied in association with changes in TChl a size structure. Cyanobacteria, pelagophytes and chlorophytes mainly sustained picophytoplankton in the STZ – typical for LNLC areas with low mixing – while diatoms, haptophytes and dinoflagellates mostly sustained nano- and microphytoplankton in the PFZ, AZ and KER region – typical in areas where these opportunistic taxa are particularly well suited to take advantage of excess nutrient (Figs. 5 and 6) (Schlüter et al., 2011; Leblanc et al., 2018). Possible species that may account for much of the biomass of these phytoplankton chemotaxonomic groups include: Synechococcus and Prochlorococcus for cyanobacteria; Pelagomonas, Micromonas for pelagophytes; Chloroparvula, Chloropicon for chlorophytes; Chaetoceros, Corethron, Coscinodiscus, Eucampia, Fragilariopsis, Thalassiosira for diatoms; Gephyrocapsa, Chrysochromulina, Phaeocystis for haptophytes; and, Amphidinium, Gymnodinium, Protoperidinium, Prorocentrum for dinoflagellates (Armand et al., 2008; Lasbleiz et al., 2016; Patil et al., 2017; Irion et al., 2020; Hörstmann et al., 2021; Sreerag et al., 2023, 2025; Thyssen et al., 2024). Recent studies have nevertheless underlined that some eukaryotic picophytoplankton groups, such as prasinophytes – belonging to the green algae lineage within chlorophytes – can also benefit from enhanced nutrient conditions (e.g. ammonium; Irion et al., 2020) or deep-mixing and low-light regimes in HNLC open ocean waters (Gutiérrez-Rodríguez et al., 2023). Also, when focusing on the size structure of phytoplankton chemotaxonomic groups biomass, several common features were observed between Nunes et al. (2019) in the South Atlantic Ocean and our study in the South Indian Ocean, for similar latitudes. First, we observed that haptophytes was the main and ubiquitous group within each size class across the study area; a feature also observed by Nunes et al. (2019) across the Atlantic Ocean. Second, Nunes et al. (2019) reported in the subtropical and tropical Atlantic Ocean the dominance of cyanobacteria in the picophytoplankton (70 % of TChl aPICO), and the dominance of haptophytes and dinoflagellates in the >3 µm fraction (63 % of TChl aNANO + MICRO). These results are in good agreement with ours in the STZ as cyanobacteria represented 70 % ± 13 % of TChl aPICO (Fig. 5f) and the sum of haptophytes and dinoflagellates represented 53 % ± 6 % of TChl aNANO and 57 % ± 10 % of TChl aMICRO (Fig. 5d and e). Third, we observed noteworthy contributions of diatoms to TChl aPICO in KER (20 % ± 4 %; Fig. 5f). Nunes et al. (2019) reported similar findings in the Atlantic sector of the Southern Ocean in Patagonian waters (∼40 % of TChl aPICO) and explained this result by the presence of picophytoplankton diatoms such as Minidiscus sp. and bolidophytes (see Sect. 4.1.2). Together, these findings across two ocean basins highlight the utility of combining pigment chemotaxonomy with size fractionation to reveal size-specific shifts in phytoplankton communities from subtropical to polar regions. The methodological consistency and alignment of results between these two studies offers promising avenues to refine global assessments of phytoplankton size structure and composition.
4.2 Intra-zonal variability of phytoplankton biomass and productivity
4.2.1 The Subtropical Zone
Stations O2 and O3, located in the western STZ at similar longitudes, exhibited strong differences in TChl a stocks and NPP fluxes, despite comparable size structures of TChl a and NPP. The integrated TChl aTOTAL and NPPTOTAL at O3 were respectively 31 % and 110 % higher than at O2, primarily due to increases in the nano- (TChl a: +32 %; NPP: +98 %) and microphytoplankton (TChl a: +77 %; NPP: +217 %) (Fig. 3). However, results from phytoplankton chemotaxonomic groups biomass did not display any noticeable shifts between O2 and O3 (Fig. 5). These differences were likely driven by higher nutrient contents at O3 (NOx: +115 %; DIP: +67 %; DSi: +49 %; Table S6 in the Supplement). Satellite-derived sea surface height data (GLORYS product) indicated the presence of a cyclonic eddy at O3 characterized by a shallower ZSML (Table 2) and nitracline depth than at O2 (data not shown), leading to nutrient upwelling and enhanced productivity and biomass. These hydrographic and biogeochemical features are consistent with previous observations of cyclonic eddies in the Mozambique Channel and Basin, which are characterized by a shallower ZSML and nitracline, and a deeper euphotic zone (Lamont and Barlow, 2017). Our NPP fluxes are similar to previous studies, reporting a 20 %–100 % increase in integrated NPPTOTAL in cyclonic eddies compared to non-eddy areas in the Bay of Bengal (Prasanna Kumar et al., 2007; Sarma et al., 2020), in the South Indian Ocean (Dalabehara and Sarma, 2021) and in the subtropical North Pacific Ocean (Landry et al., 2008). Moreover, Sarma et al. (2020) reported no significant differences in the NPP size structure between cyclonic eddy and non-eddy areas, which supports our findings. About TChl a, there is a lack of previous studies focusing on eddies in the Indian Ocean to compare with our dataset. Nevertheless, Vaillancourt et al. (2003) reported a similar 28 % increase of integrated TChl a in cyclonic eddy compared to non-eddy areas in the subtropical North Pacific Ocean. In addition, Beatty et al. (2025) reported, in the latter region, based on amplicon sequencing data, that protistan community composition showed no response to eddy forcing in the water column, which is consistent with our results from phytoplankton chemotaxonomic group biomass.
4.2.2 The Polar Frontal Zone
Stations O6, O7 and O9 follow a west-east transect, from the Crozet Plateau toward the northwest continental margin of Kerguelen Plateau (Fig. 1). The lower integrated TChl aTOTAL observed at O9 compared to O6 and O7 may be attributed to the island mass effect, where the persistent micronutrients supply downstream of Crozet shape phytoplankton biomass that decline with distance, as micronutrients become depleted in the SML (Graham et al., 2015; Robinson et al., 2016). Notwithstanding, the TChl a size structure at O7 differed from O6 and O9, despite similar NPPTOTAL and NPP size structure. Indeed, at O7, the microphytoplankton contribution to TChl aTOTAL was reduced while that of nano- increased (Fig. 3; Table S3). The decrease in the TChl aMICRO contribution at O7 was due to the decrease of microphytoplankton diatoms biomass by 4.3–6.2 mg m−2 compared to O6 and O9 (Fig. 5a). Conversely, the TChl aNANO contribution increase was caused by the increase of nanophytoplankton haptophytes and chlorophytes biomass by 3.9–7.5 mg m−2 in comparison to O6 and O9 (Fig. 5b). This community shift corroborated with lower integrated DSi content over the ZEL0.01 % at O7, on average 60 % lower than at O6 and O9 (Table S6). This decrease at O7 likely resulted from a low DSi surface water mass intrusion from the SAZ, leading to the growth limitation of microphytoplankton diatoms in favour of a non-silicifying nanophytoplankton community dominated by haptophytes. This transect is known to be influenced by the southern branch of the SAF current (Park et al., 1993), especially around 55–58° E where a signal of higher SST and lower fCO2 has been previously observed (Poisson et al., 1993; Leseurre et al., 2022). Indeed, underway continuous measurements during SOCARB recorded an SST increase and fCO2 decrease between Crozet and O7 around 54–56° E (data not shown).
4.2.3 The Antarctic Zone and the Kerguelen bloom area
The HN-LSi-LC station O10, located southwest of the Kerguelen plateau, and the KER stations (A3, E and O12), exhibited similar NPP size structure, with a dominance of the microphytoplankton (75 % ± 10 %), although NPPTOTAL was approximately 2.5 times higher at the KER stations (Fig. 3b, Table S3). Likewise, the TChl a size structure at O10 and the KER stations was similar, with a dominance of microphytoplankton (59 % ± 2 %) mainly sustained by diatoms, although TChl aTOTAL was approximately 1.6 times higher at the KER stations (Figs. 3a and 5d, Table S3). No major differences were observed in the chemotaxonomic biomass structure – except a slightly higher contribution of pelagophytes in the TChl aMICRO at O10 compared to the KER stations (Fig. 5d). In contrast, the offshore HNLC station O11 displayed distinct size structures relative to the other stations. Both NPPTOTAL and TChl aTOTALwere dominated by nanophytoplankton (mainly haptophytes and diatoms) with respective contributions of 50 % and 57 %. In addition, both NPPTOTAL and TChl aTOTAL at O11 were lower than those measured at station O10. Our results are consistent with the study by Uitz et al. (2009), conducted during the austral summer, which reported a dominance of microphytoplankton (mainly diatoms) in the Fe-fertilized waters of the Kerguelen Plateau and an increasing contribution of nanophytoplankton at offshore HNLC stations.
We now compare the southeastern and northeastern blooms in KER, at stations A3 and O12, respectively. The highest integrated TChl a and NPP at A3 and O12 reflected the well-documented natural Fe fertilization. Despite sharing similar TChl a and NPP size structures, integrated NPP displayed variability, as integrated NPPTOTAL at A3 was 70 % lower compared to O12 (Fig. 3). This difference may not be attributed to the phenology, as satellite-derived surface TChl a (MODIS product) did not highlight major differences neither in the timing, nor in the magnitude of phytoplankton biomass (Fig. S5 in the Supplement). Previous studies raised potential factors in explaining the spatial variability in integrated NPP in iron-fertilized areas, such as Si concentrations, phytoplankton community shifts, grazing pressure or light-mixing regime (e.g. Seeyave et al., 2007). First, A3 and O12 exhibited DSiNOx ratios in the SML lower than the Brzezinski ratio (Table 2), indicating a potential Si limitation; this indicates that Si availability does not explain the observed difference in NPPTOTAL. Second, phytoplankton chemotaxonomic groups biomass displayed a noticeable difference in the phytoplankton community structure at A3 compared to O12. The relative contributions of dinoflagellates and cryptophytes to integrated bulk biomass increased by 17 % – to the detriment of diatoms and haptophytes by 18 % – primarily due to increases in the nanophytoplankton (31 %) (Figs. 5 and S4). Third, to investigate the light-mixing regime, we computed the ratio of the diadinoxanthin (DD) and diatoxanthin (DT) concentrations to TChl a (). Although DD and DT have limited chemotaxonomic values, they have a photoprotective role, with concentrations that respond rapidly to changes in irradiance (Demers et al., 1991). Because most phytoplankton contain these pigments, the ratio provides useful information on the vertical mixing rates in the water column along with the light regime (Moline, 1998). The ratio at A3 was homogeneous within the SML (Fig. 7a), indicating that the vertical mixing rate was – or had recently been – faster than the photoprotective response (Moline, 1998). Our result corroborated with Uitz et al. (2009), which also studied A3 in late austral summer 2005 and underlined the lack of relationship between the bloom occurrence and the light-mixing regime previously described by Park et al. (2008). In contrary, the ratio at O12 decreased with depth within the SML (Fig. 7b), implying that the vertical mixing rate was – or had recently been – slower than the photoprotective response (Moline, 1998). Therefore, the variability in integrated NPPTOTAL between A3 and O12 could result from contrasting phytoplankton communities and/or light-mixing regimes. Our results highlighted the heterogeneous distribution of phytoplankton communities within the nano- and microphytoplankton size classes in similar productive regimes around the Kerguelen Plateau in late austral summer, which was previously raised only during austral spring by Lasbleiz et al. (2014).
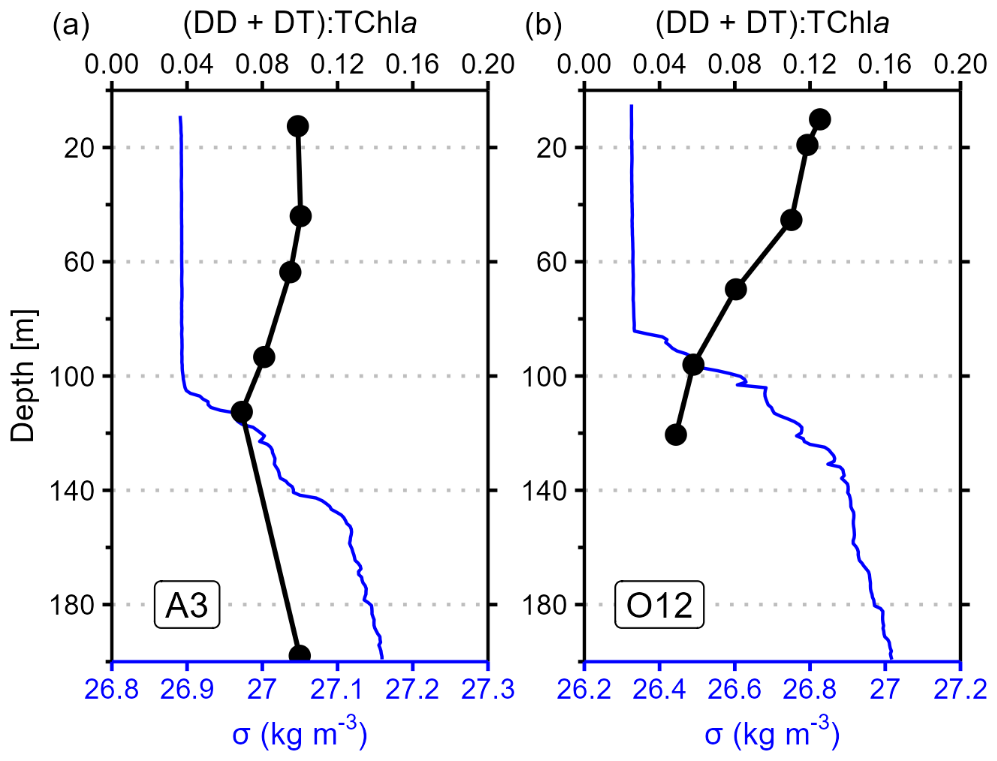
Figure 7Vertical profiles of photoacclimatation index () in black and anomaly density (σ) in blue for stations A3 (a) and O12 (b).
4.3 Influence of the phytoplankton biomass size structure on NPP
Previously, we demonstrated firstly that NPPTOTAL was mainly determined by the biomass of nano- and microphytoplankton across the study area, more specifically in the PFZ, AZ and KER region (Table 3), and highlighting their key role in driving NPPTOTAL in the South Indian Ocean. Our results are in line with previous studies conducted during austral summer where microphytoplankton biomass drove primary production in iron-fertilised areas, and both nano- and micro- biomass were the drivers of primary production in iron-depleted areas (Froneman et al., 2001, 2004; Korb et al., 2005; Seeyave et al., 2007; Uitz et al., 2009; Shiomoto et al., 2023). However, these studies investigating the relationships between NPP and TChl a size structure focused on the Southern Ocean, especially in geographically restricted region (Seeyave et al., 2007; Uitz et al., 2009) or in areas outside the Indian Sector (Froneman et al., 2001, 2004; Korb et al., 2005). While Shiomoto et al. (2023) brings a substantial contribution in the Indian sector of the Southern Ocean south of 60° S, our study extends these researches northwards of the South Indian Ocean, up to the SAZ and STZ. Non-significative correlations in the SAZ between NPPTOTAL and TChl a size structure were likely due to the small sample number (n=6), thus limiting any interpretation. Nevertheless, our study showed in the STZ that even though phytoplankton biomass size structure was mainly described by the pico- and nanophytoplankton, the biomass of each size class would play a significant role in driving NPPTOTAL (Table 3), including the microphytoplankton despite its small contribution to TChl aTOTAL (17 % ± 3 %; Table S3). These results contrast with previous studies in subtropical domains suggesting that NPPTOTAL was mainly determined by the biomass of pico- and nanophytoplankton (Froneman et al., 2001; Marañón et al., 2001).
Coupling between NPP and phytoplankton community size structure provides an in-depth comprehension of the main phytoplanktonic contributors on the conditioning of NPP. Among the previous studies, Seeyave et al. (2007) and Uitz et al. (2009) investigated the relationships between NPP and phytoplankton community size structure from pigments concentrations. This involves assumptions of the phytoplankton chemotaxonomic affiliation, because certain pigments are major components in many taxa (Higgins et al., 2011). To address this gap, Takao et al. (2012) used satellite data to estimate the spatiotemporal distribution of NPP and four phytoplankton chemotaxonomic groups biomass (Prochlorococcus, Synechococcus, haptophytes and diatoms), from the STZ to the AZ over 1997–2007. Our study including in situ data coupled with the size fractionation approach provides a refined perspective on the phytoplankton community size structure. For instance, among the biomass of nano- and microphytoplankton which drove NPPTOTAL in the global study area, the biomass of haptophytes, dinoflagellates and diatoms displayed the highest correlations with NPPTOTAL (Table 4), highlighting the key roles of these chemotaxonomic groups in driving NPPTOTAL in the South Indian Ocean. Moreover, the significant correlations of NPPTOTAL with diatoms and haptophytes biomass for the nano- and microphytoplankton found in the PFZ, AZ and KER are consistent with the latter studies, but our size fractionation approach underlines the heterogeneity of the relationships in between these zones for each size class (Table 4). Furthermore, while Takao et al. (2012) restricted their study to only four phytoplankton groups biomass due to the limits of the satellite approach, our results showed additional relationships of NPPTOTAL with the biomass of secondary phytoplankton groups in the AZ and KER such as chlorophytes, dinoflagellates and cryptophytes. Therefore, our findings contribute to a better understanding of the role of phytoplankton community size structure in modulating primary production in the South Indian Ocean, highlighting that NPP was influenced by the phytoplankton size structure and was not necessarily driven by a single dominant phytoplankton group within a given zone.
Nevertheless, the relationship between NPP and phytoplankton TChl a biomass size structure should be interpreted with caution, as it is influenced by ecological and physiological factors such as the carbon to TChl a ratio (C : TChl a) and the growth rates. For instance, C : TChl a ratio in phytoplankton varies with temperature, irradiance and the degree of nutrient limitation, being the lowest under high temperature, low irradiance and nutrient-replete conditions (Geider, 1987; Geider et al., 1997; Jakobsen and Markager, 2016; Landry et al., 2022). Moreover, the C : TChl a ratio depends on cell size and taxonomy, with larger cells having higher C : TChl a ratio than smaller cells (e.g. Geider, 1987; Yingling et al., 2025). Consequently, observed correlations between size-fractionated TChl a biomass and NPP may be partly influenced by differences in the C : TChl a ratio among size classes and taxa. Similarly, growth rate displays taxonomic dependence, with diatoms, cryptophytes and chlorophytes exhibiting higher rates than dinoflagellates, haptophytes and pelagophytes in the Southern Ocean (e.g. Latasa et al., 2014; Gutiérrez-Rodríguez et al., 2023). As a result, high growth rates can lead to elevated NPP even when TChl a is low, while slow-growing taxa may accumulate TChl a without contributing proportionally to NPP (Behrenfeld et al., 2005). Consequently, additional field studies using the size fractionation approach combined with measurements of C : TChl a ratios and growth rates across size classes and phytoplankton groups are needed to improve our understanding on the influence of phytoplankton biomass size structure on NPP, especially in the SAZ and STZ where NPP and phytoplankton data remain sparse.
Using a size fractionation approach, the size structures of phytoplankton algal biomass and primary production were assessed in the South Indian Ocean – including the Indian Sector of the Southern Oceans – during the austral summer 2023, to describe their spatial variability and study the links between primary production and phytoplankton biomass size structure. Across the study area, integrated TChl a size structure was mainly described by the nano- and microphytoplankton size classes, while integrated NPP size structure was dominated by the micro- size class. Furthermore, TChl a size structure exhibited a greater spatial variability compared to NPP size structure. Using the novel pigment chemotaxonomy tool phytoclass (Hayward et al., 2023) coupled with the size fractionation approach, we determined that haptophytes were the main and ubiquitous group in each size class in the South Indian Ocean, and that the remaining phytoplankton community shifted within each size class across the study area. On the one hand, integrated TChl a in the STZ was described by pico- and nanophytoplankton, more specifically composed of cyanobacteria (Prochlorococcus and Synechococcus) in the pico- and of haptophytes and chlorophytes in the nanophytoplankton. On the other hand, integrated TChl a in the PFZ and AZ was described by nano- and microphytoplankton and featured a community dominated by diatoms and haptophytes. Our results also underline the intra-zonal variability of phytoplankton biomass and productivity through bottom-up processes, such as the occurrence of a cyclonic eddy in the STZ or the intrusion of a DSi-depleted water mass in the PFZ. When focusing on the links between NPP and TChl a size structure, we demonstrated that NPPTOTAL was mainly determined by the biomass of nano- and microphytoplankton across the study area, more specifically by the biomass of haptophytes, dinoflagellates and diatoms within these size classes. When deciphering these relationships within each zone, our results not only were consistent from previous studies, but also exhibited additional relationships with secondary phytoplankton groups, which could not be identified before due to limitations of previous methodologies.
This study paves the way for a better comprehension of the primary production and phytoplankton community size structure in the South Indian Ocean, as the size fractionation approach allows to better quantify the impact of the structure and dynamics of the phytoplankton community and their role in the BCP. Furthermore, the concordant results of phytoplankton community size structures between Nunes et al. (2019) in the South Atlantic Ocean and this study in the South Indian Ocean using similar approaches provide promising perspectives in refining the size structure of phytoplankton community at a global scale. In this way, we strongly encourage the marine biogeochemical community, if possible, to use the size fractionation approach to evaluate the phytoplankton community and its associated fluxes. Complementary to SOCARB, these data will be coupled in future works with cytometry and DNA metabarcoding data, to address a more detailed taxonomic description of the phytoplankton community, such as evaluating the spatial variability of the community within the haptophytes, which were found in this study to be the main and ubiquitous group in the South Indian Ocean.
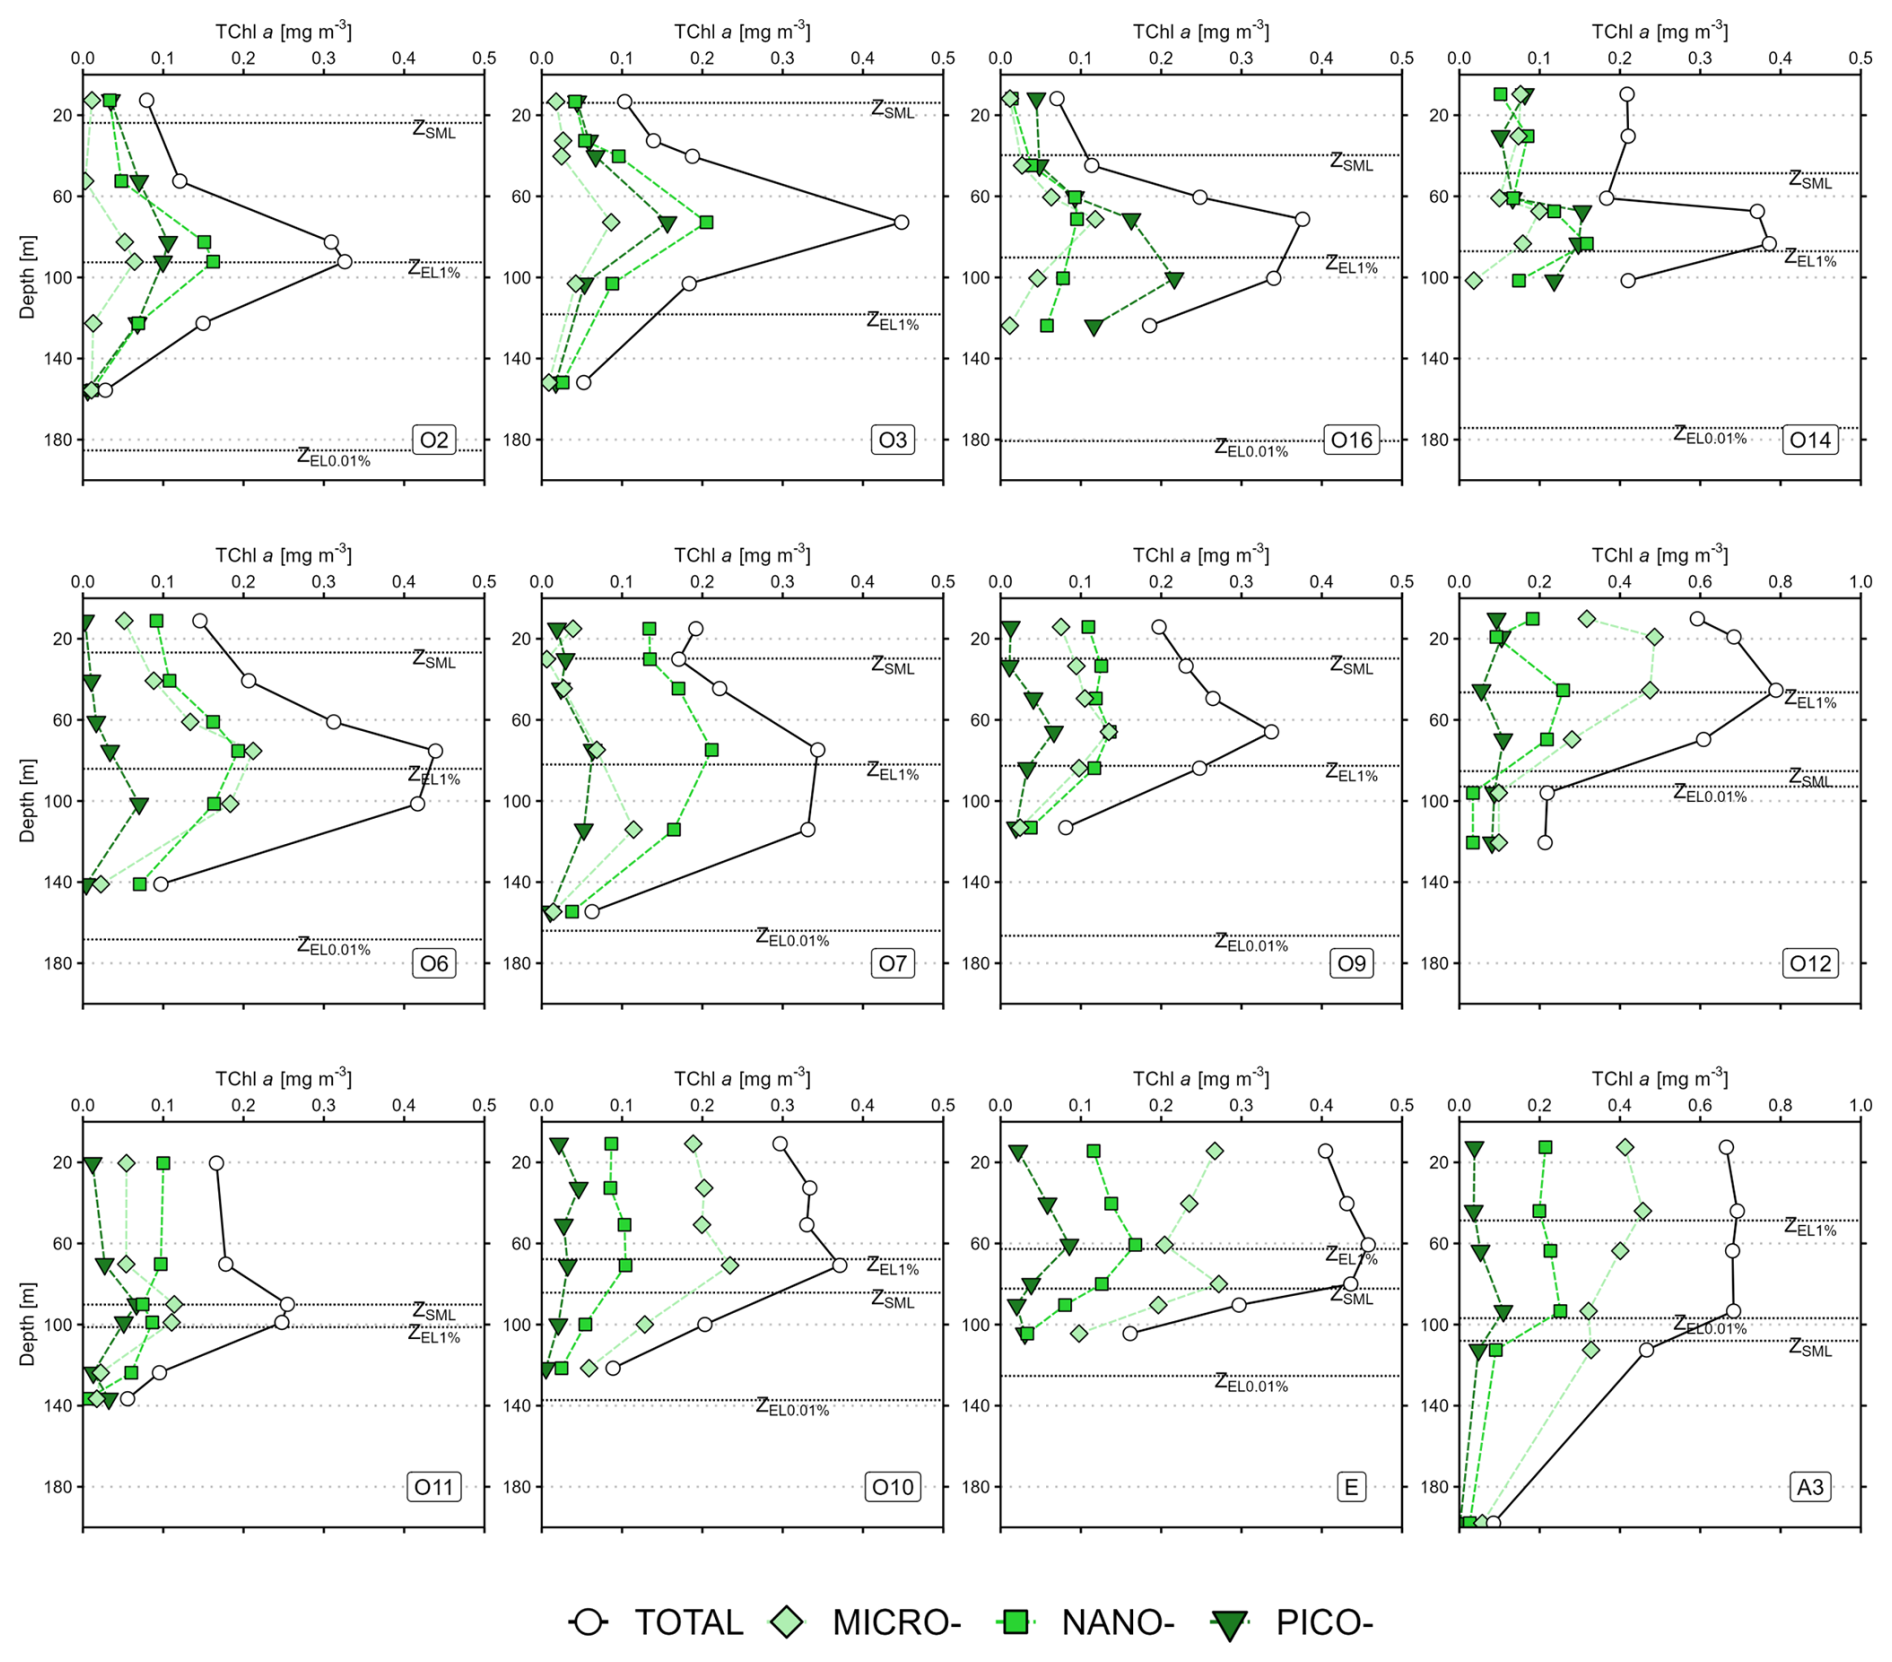
Figure A1Vertical profiles of total chlorophyll a (TChl a) at the SOCARB stations. Mind the scale differences at O12 and A3. The dashed lines represent the depth of the mixed layer (ZSML), the depth of the 1 % euphotic layer (ZEL1 %) and the depth of the 0.01 % euphotic layer (ZEL0.01 %).
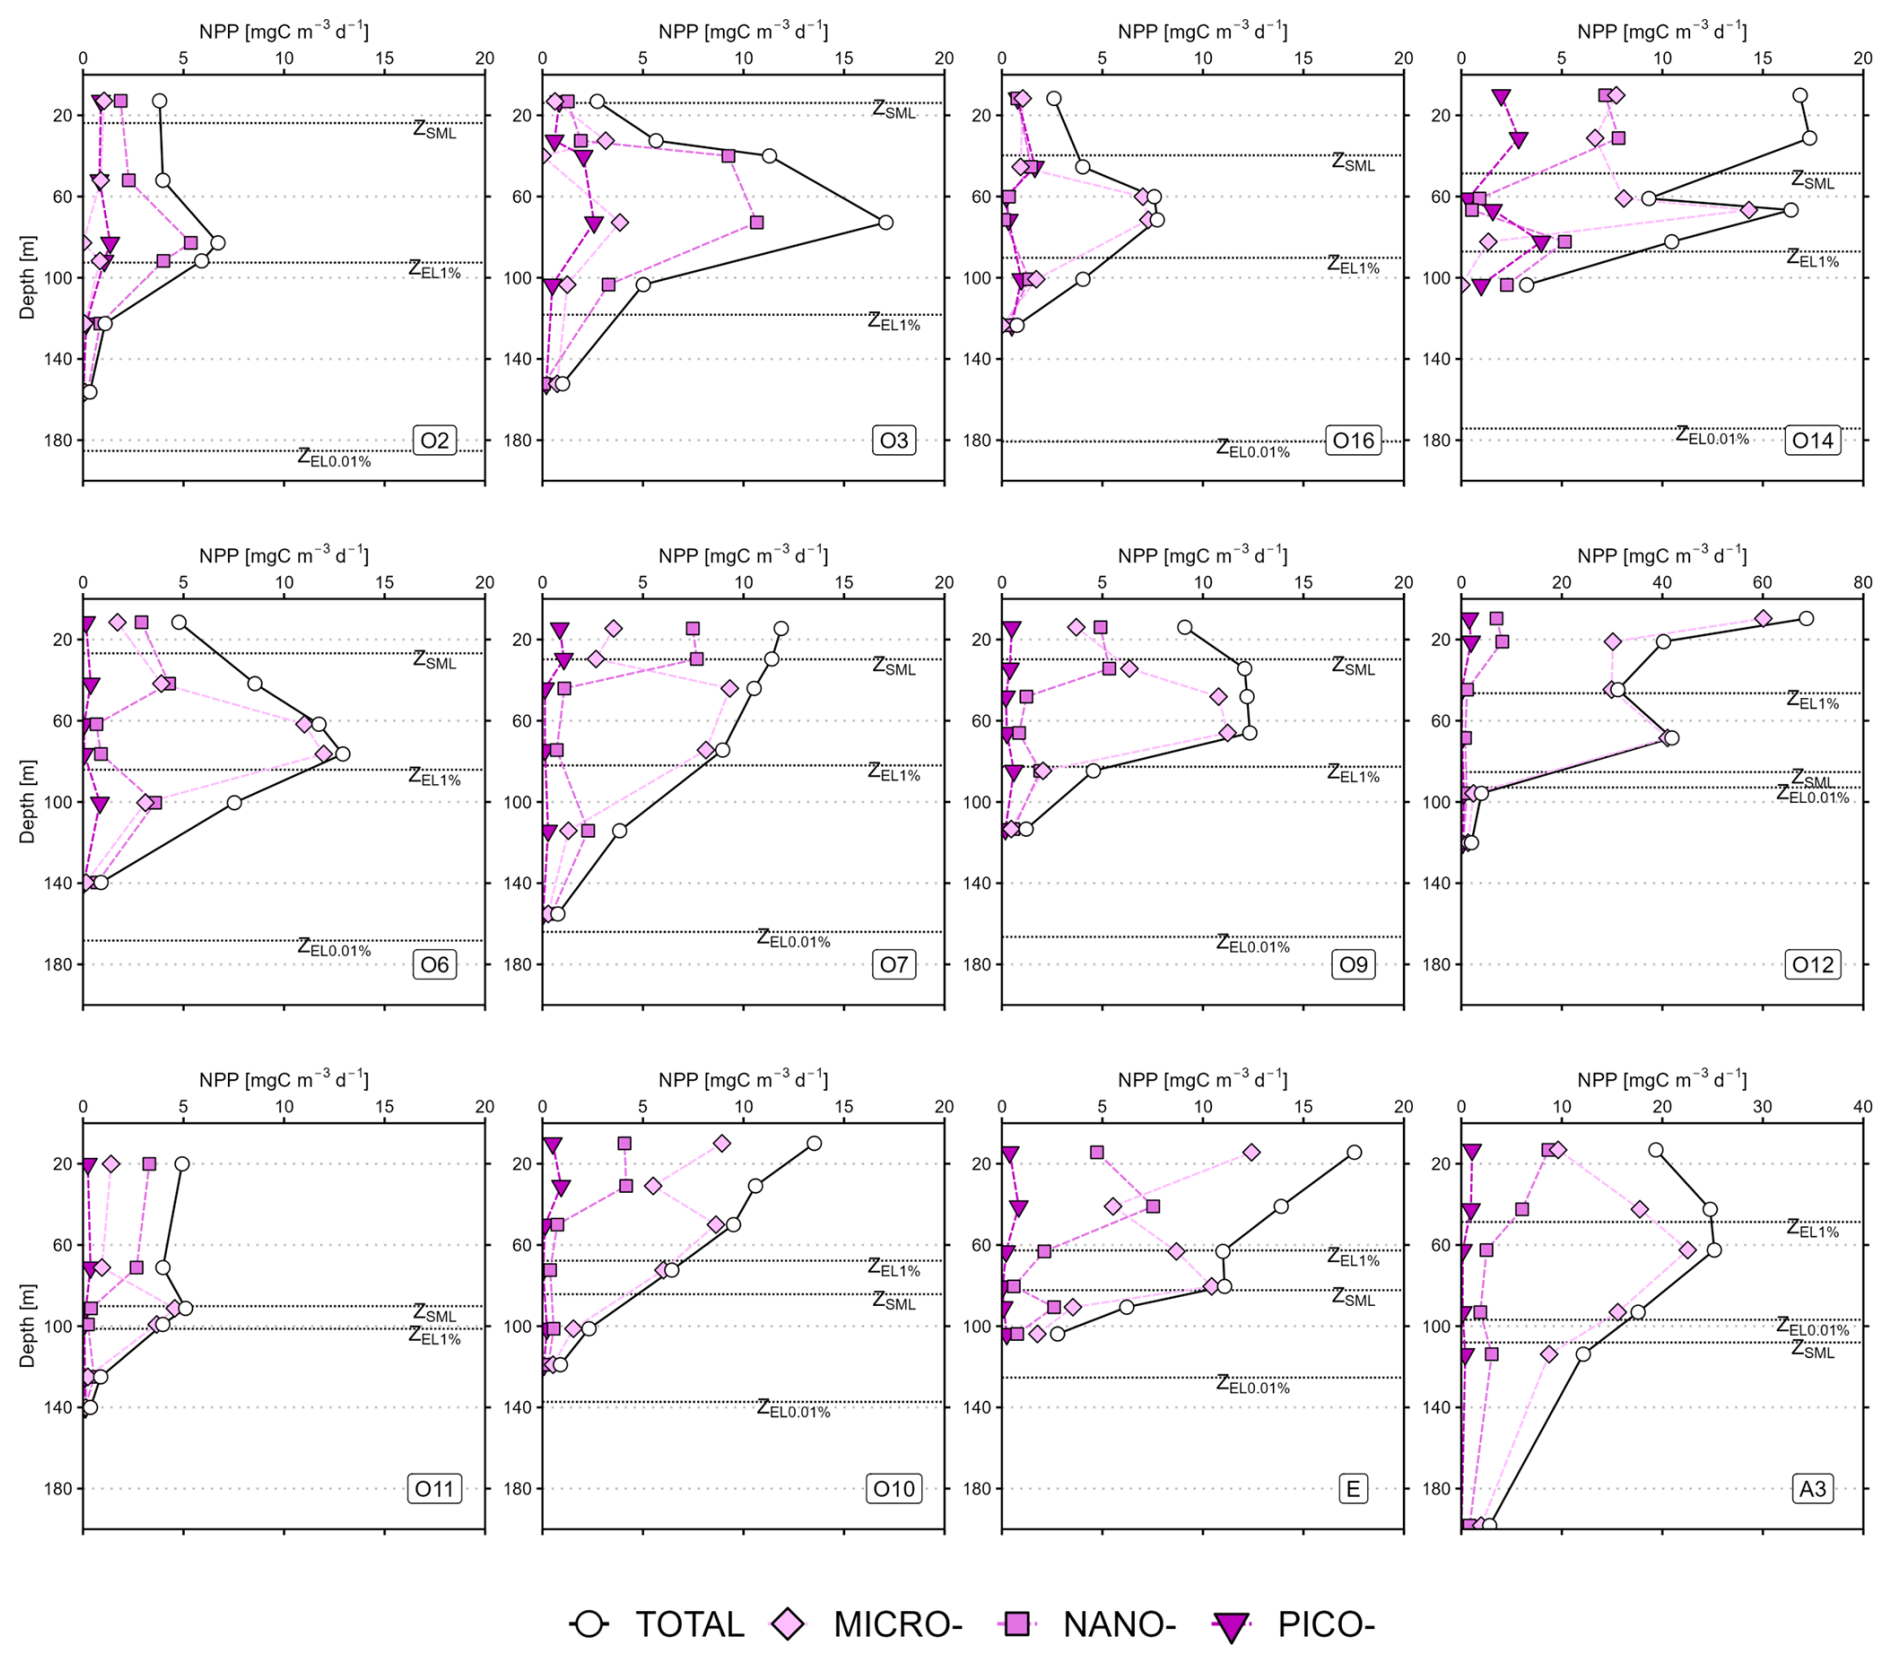
Figure A2Vertical profiles of net primary production (NPP) for the SOCARB stations. Mind the scale differences at O12 and A3. The dashed lines represent the depth of the mixed layer (ZSML), the depth of the 1 % euphotic layer (ZEL1 %) and the depth of the 0.01 % euphotic layer (ZEL0.01 %).
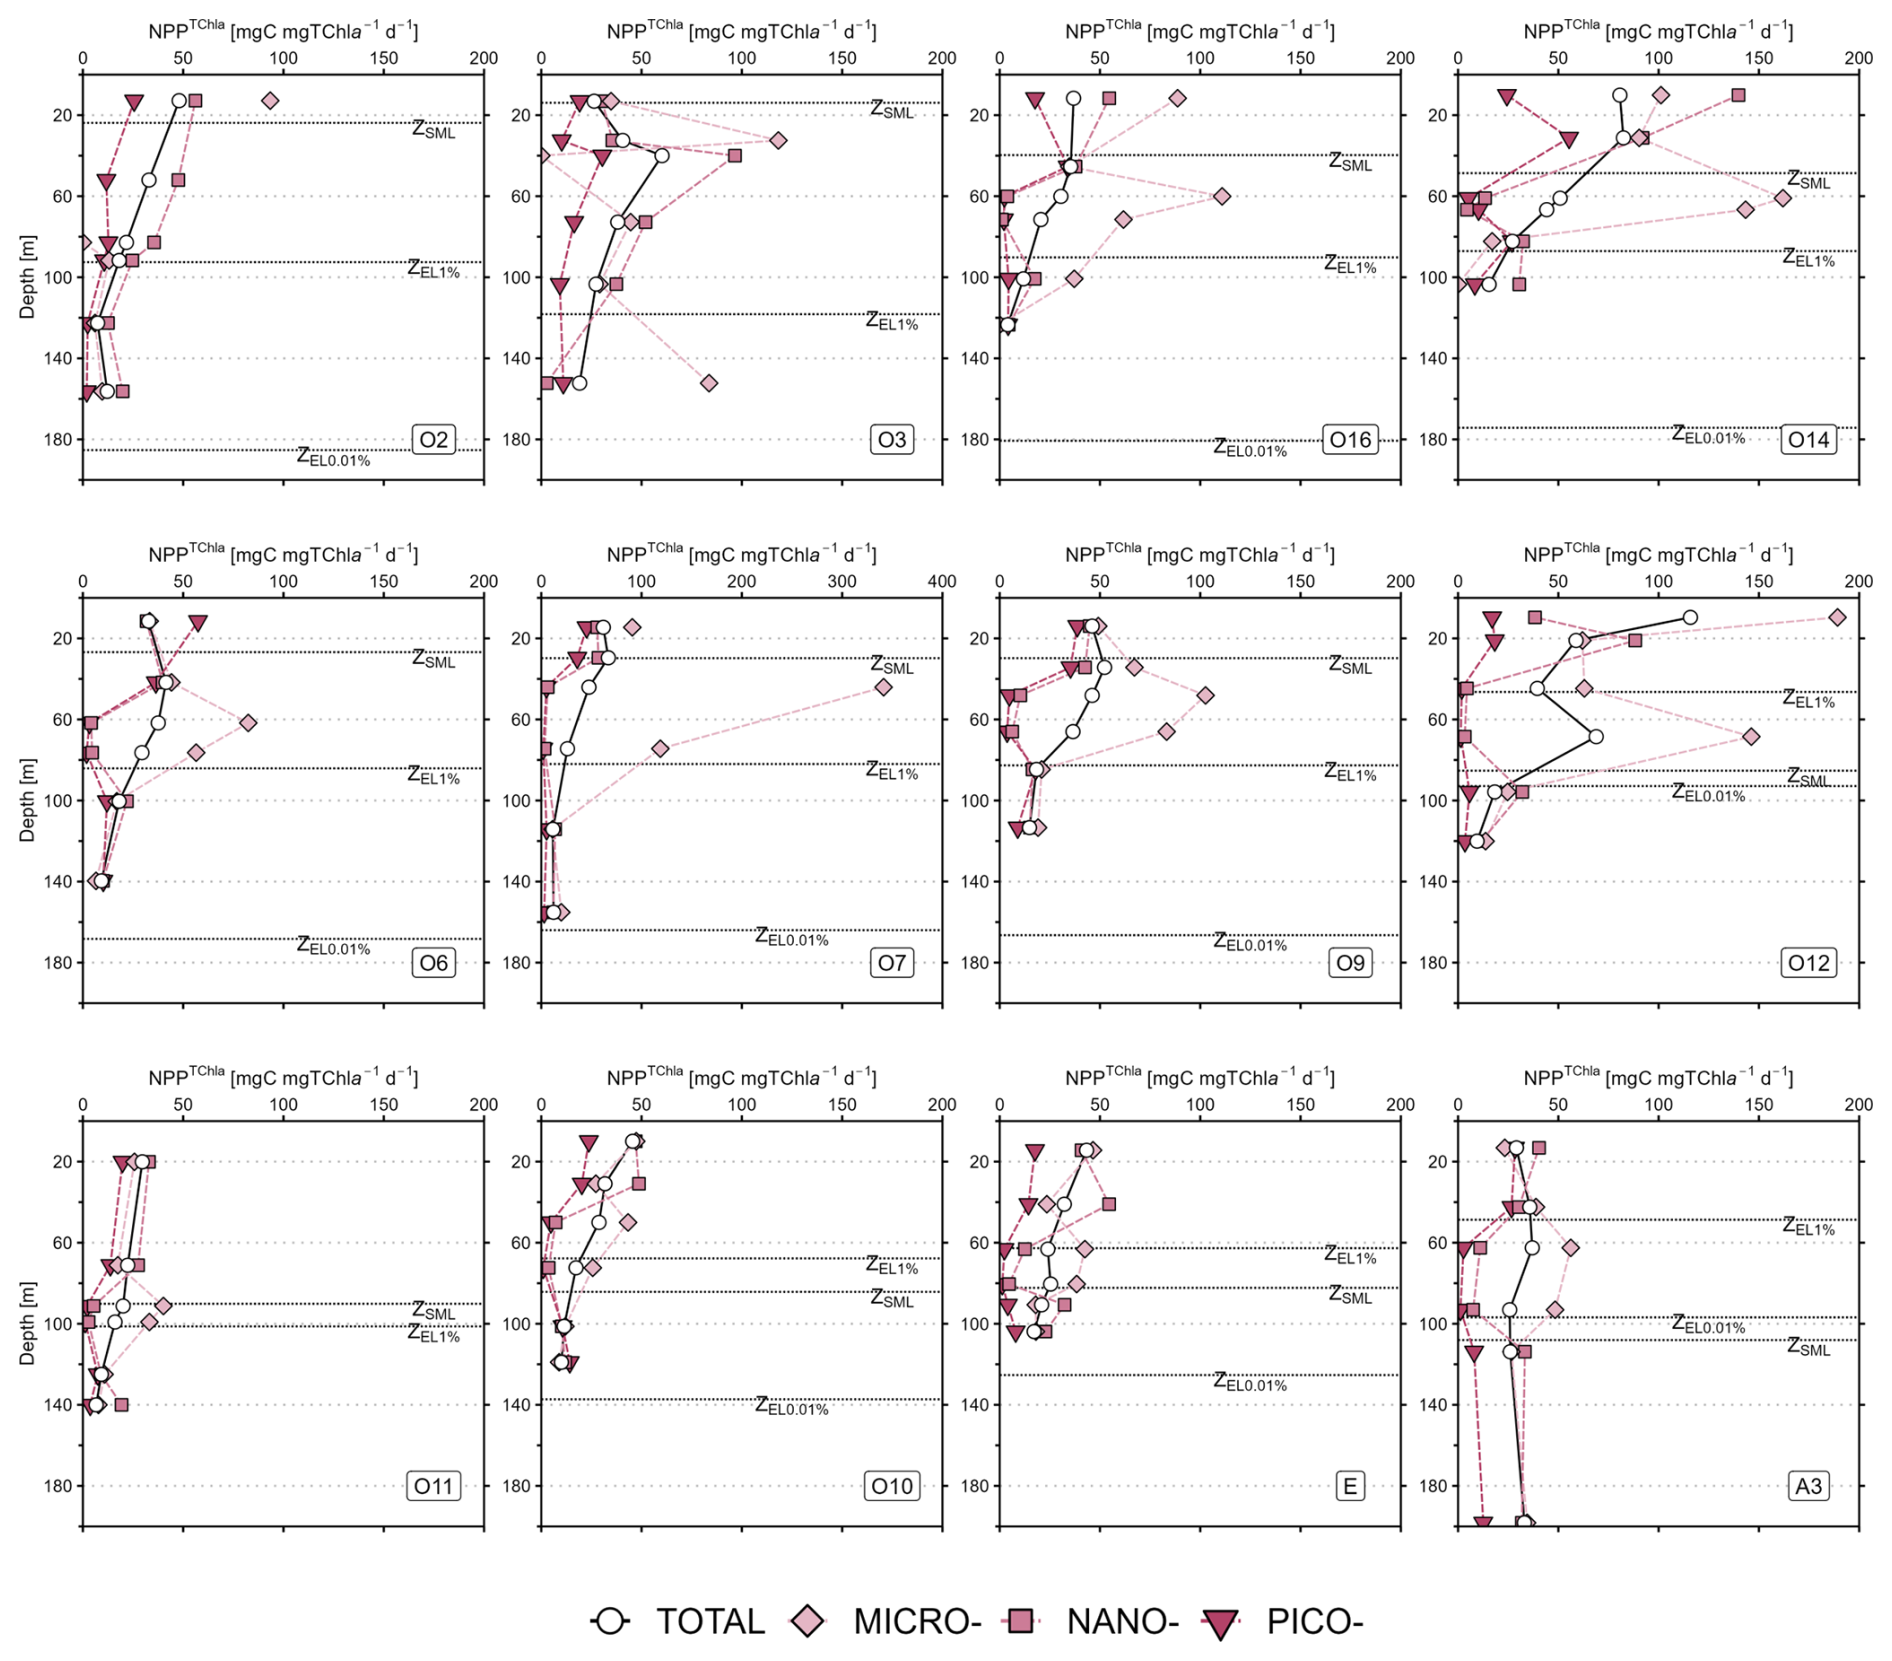
Figure A3Vertical profiles of TChl a-normalised net primary production (NPPTChl a) for the SOCARB stations. Mind the scale differences at O7. The dashed lines represent the depth of the mixed layer (ZSML), the depth of the 1 % euphotic layer (ZEL1 %) and the depth of the 0.01 % euphotic layer (ZEL0.01 %).
All size-fractionated phytoplankton NPP, biomass and pigments data, either volumetric or integrated over the euphotic layer 0.01 %, are available in the SEANOE database via the following address: https://doi.org/10.17882/114546 (Deteix et al., 2026).
The supplement related to this article is available online at https://doi.org/10.5194/bg-23-4793-2026-supplement.
VD: Formal analysis, investigation, methodology, validation, visualization, writing – original draft. CR: Conceptualization, formal analysis, funding acquisition, investigation, methodology, supervision, validation, visualization, writing – review and editing. CD: Investigation, methodology, writing – review and editing. CLM: Funding acquisition, investigation, project administration, writing – review and editing. AT: Supervision. FP: Funding acquisition, investigation, project administration, writing – review and editing.
The contact author has declared that none of the authors has any competing interests.
Publisher's note: Copernicus Publications remains neutral with regard to jurisdictional claims made in the text, published maps, institutional affiliations, or any other geographical representation in this paper. The authors bear the ultimate responsibility for providing appropriate place names. Views expressed in the text are those of the authors and do not necessarily reflect the views of the publisher.
The authors would like to thank the captain C. Souffre and the crew of the R/V Marion Dufresne II for their expertise and assistance on board; Fanny Kaczmar for managing clean laboratory and trace metal clean procedures before the cruise; the OISO-33 on board team for nutrients and DIC sampling, and the first DIC analyses on board; Jonathan Fin for DIC analyses at the SNAPO-CO2 analytical platform (LOCEAN-IPSL); Magloire Mandeng-Yogo and Fethiye Cetin for IR-MS analyses at the Alysés analytical platform (IRD-SU); Eva Delcamp for pigments analyses at the SAPIGH analytical platform (IMEV); the IMAGO analytical platform (IRD) for nutrients analyses. We also thank Nicolas Metzl for his relevant comments on the draft manuscript. Finally, the authors would like to thank Andres Gutiérrez Rodríguez and an anonymous reviewer for providing constructive and relevant comments that helped to improve this manuscript. This work was part of the PhD's degree research of V. Deteix.
The SOCARB program was supported by the French Research program of INSU-CNRS LEFE-CYBER (Les Enveloppes Fluides de l'Environnement – Cycles biogéochimiques, environnement et ressources), the ISblue project, Interdisciplinary graduate school for the blue planet (ANR-17-EURE-0015) and co-funded by a grant from the French government under the program “Investissements d'Avenir” embedded in France 2030. The OISO program was supported by the French institutes INSU (Institut National des Sciences de l'Univers), IPEV (Institut Polaire Paul-Émile Victor) and OSU Ecce-Terra (Sorbonne Université), and the French program SOERE/Great-Gases.
This paper was edited by Emilio Marañón and reviewed by Andres Gutiérrez Rodríguez and one anonymous referee.
Aminot, A. and Kérouel, R. (Eds.): Dosage automatique des nutriments dans les eaux marines: méthodes en flux continu, Quae Ifremer, ISBN 978-2-7592-0023-8, 2007.
Armand, L. K., Cornet-Barthaux, V., Mosseri, J., and Quéguiner, B.: Late summer diatom biomass and community structure on and around the naturally iron-fertilised Kerguelen Plateau in the Southern Ocean, Deep-Sea Res. Pt. II, 55, 653–676, https://doi.org/10.1016/j.dsr2.2007.12.031, 2008.
Armstrong, R. A., Lee, C., Hedges, J. I., Honjo, S., and Wakeham, S. G.: A new, mechanistic model for organic carbon fluxes in the ocean based on the quantitative association of POC with ballast minerals, Deep-Sea Res. Pt. II, 49, 219–236, https://doi.org/10.1016/S0967-0645(01)00101-1, 2001.
Beatty, J. L., Stewart, B. P., Mesrop, L. Y., DeLong, E. F., Karl, D. M., and Caron, D. A.: Eddy dipole differentially influences particle-associated and water column protistan community composition, Limnol. Oceanogr., 70, 817–832, https://doi.org/10.1002/lno.12785, 2025.
Behrenfeld, M. J., Boss, E., Siegel, D. A., and Shea, D. M.: Carbon-based ocean productivity and phytoplankton physiology from space, Global Biogeochem. Cy., 19, https://doi.org/10.1029/2004GB002299, 2005.
Belkin, I. M. and Gordon, A. L.: Southern Ocean fronts from the Greenwich meridian to Tasmania, J. Geophys. Res.-Oceans, 101, 3675–3696, https://doi.org/10.1029/95JC02750, 1996.
Bender, S. J., Moran, D. M., McIlvin, M. R., Zheng, H., McCrow, J. P., Badger, J., DiTullio, G. R., Allen, A. E., and Saito, M. A.: Colony formation in Phaeocystis antarctica: connecting molecular mechanisms with iron biogeochemistry, Biogeosciences, 15, 4923–4942, https://doi.org/10.5194/bg-15-4923-2018, 2018.
Berthelot, H., Zukowska, J., Henry, N., Noël, C., Thyssen, M., Leblanc, K., Planquette, H., Maguer, J.-F., Pepperkok, R., de Vargas, C., and Cassar, N.: Nitrogen concentration shapes the size structure and the functional diversity of phytoplankton communities in the southern Indian Ocean, ISME Commun., 5, ycaf195, https://doi.org/10.1093/ismeco/ycaf195, 2025.
Blain, S., Quéguiner, B., Armand, L., Belviso, S., Bombled, B., Bopp, L., Bowie, A., Brunet, C., Brussaard, C., Carlotti, F., Christaki, U., Corbière, A., Durand, I., Ebersbach, F., Fuda, J.-L., Garcia, N., Gerringa, L., Griffiths, B., Guigue, C., Guillerm, C., Jacquet, S., Jeandel, C., Laan, P., Lefèvre, D., Lo Monaco, C., Malits, A., Mosseri, J., Obernosterer, I., Park, Y.-H., Picheral, M., Pondaven, P., Remenyi, T., Sandroni, V., Sarthou, G., Savoye, N., Scouarnec, L., Souhaut, M., Thuiller, D., Timmermans, K., Trull, T., Uitz, J., van Beek, P., Veldhuis, M., Vincent, D., Viollier, E., Vong, L., and Wagener, T.: Effect of natural iron fertilization on carbon sequestration in the Southern Ocean, Nature, 446, 1070–1074, https://doi.org/10.1038/nature05700, 2007.
Blain, S., Sarthou, G., and Laan, P.: Distribution of dissolved iron during the natural iron-fertilization experiment KEOPS (Kerguelen Plateau, Southern Ocean), Deep-Sea Res. Pt. II, 55, 594–605, https://doi.org/10.1016/j.dsr2.2007.12.028, 2008.
Boyd, P., LaRoche, J., Gall, M., Frew, R., and McKay, R. M. L.: Role of iron, light, and silicate in controlling algal biomass in subantarctic waters SE of New Zealand, J. Geophys. Res.-Oceans, 104, 13395–13408, https://doi.org/10.1029/1999JC900009, 1999.
Browning, T. J., Achterberg, E. P., Engel, A., and Mawji, E.: Manganese co-limitation of phytoplankton growth and major nutrient drawdown in the Southern Ocean, Nat. Commun., 12, 884, https://doi.org/10.1038/s41467-021-21122-6, 2021.
Brzezinski, M. A.: The ratio of marine diatoms: interspecific variability and the effect of some environmental variables, J. Phycol., 21, 347–357, https://doi.org/10.1111/j.0022-3646.1985.00347.x, 1985.
Cavagna, A. J., Fripiat, F., Elskens, M., Mangion, P., Chirurgien, L., Closset, I., Lasbleiz, M., Florez-Leiva, L., Cardinal, D., Leblanc, K., Fernandez, C., Lefèvre, D., Oriol, L., Blain, S., Quéguiner, B., and Dehairs, F.: Production regime and associated N cycling in the vicinity of Kerguelen Island, Southern Ocean, Biogeosciences, 12, 6515–6528, https://doi.org/10.5194/bg-12-6515-2015, 2015.
Cermeño, P., Estévez-Blanco, P., Marañón, E., and Fernóndez, E.: Maximum photosynthetic efficiency of size-fractionated phytoplankton assessed by 14C uptake and fast repetition rate fluorometry, Limnol. Oceanogr., 50, 1438–1446, https://doi.org/10.4319/lo.2005.50.5.1438, 2005.
Chowdhury, S., Berthelot, H., Baudet, C., González-Santana, D., Reeder, C. F., L'Helguen, S., Maguer, J.-F., Löscher, C. R., Singh, A., Blain, S., Cassar, N., Bonnet, S., Planquette, H., and Benavides, M.: Fronts divide diazotroph communities in the Southern Indian Ocean, FEMS Microbiol. Ecol., 100, fiae095, https://doi.org/10.1093/femsec/fiae095, 2024.
Cutter, G., Casciotti, K., Croot, P., Geibert, W., Heimbürger, L.-E., Lohan, M., Planquette, H., and van de Flierdt, T.: Sampling and Sample-handling Protocols for GEOTRACES Cruises, Version 3, August 2017, https://doi.org/10.25607/OBP-2, 2017.
Dalabehara, H. B. and Sarma, V. V. S. S.: Physical forcing controls spatial variability in primary production in the Indian Ocean, Deep-Sea Res. Pt. II, 183, 104906, https://doi.org/10.1016/j.dsr2.2020.104906, 2021.
de Boyer Montégut, C., Madec, G., Fischer, A. S., Lazar, A., and Iudicone, D.: Mixed layer depth over the global ocean: An examination of profile data and a profile-based climatology, J. Geophys. Res.-Oceans, 109, https://doi.org/10.1029/2004JC002378, 2004.
Demers, S., Roy, S., Gagnon, R., and Vignault, C.: Rapid light-induced changes in cell fluorescence and in xanthophyll-cycle pigments of Alexandrium excavatum (Dinophyceae) and Thalassiosira pseudonana (Bacillariophyceae): a photo-protection mechanism, Mar. Ecol. Prog. Ser., 76, 185–193, 1991.
Deteix, V., Cotard, E., Caquineau, S., Landing, W. M., Planchon, F., Ryan-Keogh, T., and Cardinal, D.: Biogenic and lithogenic silicon along the GEOTRACES south West Indian Ocean section (SWINGS-GS02) and the islands mass effect on regional Si biogeochemical cycle, Mar. Chem., 263–264, 104412, https://doi.org/10.1016/j.marchem.2024.104412, 2024.
Deteix, V., Ridame, C., Dimier, C., Lo Monaco, C., Tribollet, A., and Planchon, F.: Size-fractionated phytoplankton net primary production, biomass and pigments in the South Indian and Southern Oceans (OISO33-SOCARB), SEANOE [data set], https://doi.org/10.17882/114546, 2026.
Feng, Y., Hare, C. E., Rose, J. M., Handy, S. M., DiTullio, G. R., Lee, P. A., Smith, W. O., Peloquin, J., Tozzi, S., Sun, J., Zhang, Y., Dunbar, R. B., Long, M. C., Sohst, B., Lohan, M., and Hutchins, D. A.: Interactive effects of iron, irradiance and CO2 on Ross Sea phytoplankton, Deep-Sea Res. Pt. I, 57, 368–383, https://doi.org/10.1016/j.dsr.2009.10.013, 2010.
Fisher, N. L. and Halsey, K. H.: Mechanisms that increase the growth efficiency of diatoms in low light, Photosynth. Res., 129, 183–197, https://doi.org/10.1007/s11120-016-0282-6, 2016.
Froneman, P. W., Laubscher, R. K., and Mcquaid, C. D.: Size-fractionated Primary Production in the South Atlantic and Atlantic Sectors of the Southern Ocean, J. Plankton Res., 23, 611–622, https://doi.org/10.1093/plankt/23.6.611, 2001.
Froneman, P. W., Pakhomov, E. A., and Balarin, M. G.: Size-fractionated phytoplankton biomass, production and biogenic carbon flux in the eastern Atlantic sector of the Southern Ocean in late austral summer 1997–1998, Deep-Sea Res. Pt. II, 51, 2715–2729, https://doi.org/10.1016/j.dsr2.2002.09.001, 2004.
Gandhi, N., Ramesh, R., Laskar, A. H., Sheshshayee, M. S., Shetye, S., Anilkumar, N., Patil, S. M., and Mohan, R.: Zonal variability in primary production and nitrogen uptake rates in the southwestern Indian Ocean and the Southern Ocean, Deep-Sea Res. Pt. I, 67, 32–43, https://doi.org/10.1016/j.dsr.2012.05.003, 2012.
Geider, R. J.: Light and Temperature Dependence of the Carbon to Chlorophyll a Ratio in Microalgae and Cyanobacteria: Implications for Physiology and Growth of Phytoplankton, New Phytol., 106, 1–34, 1987.
Geider, R. J., MacIntyre, H. L., and Kana, T. M.: Dynamic model of phytoplankton growth and acclimation: responses of the balanced growth rate and the chlorophyll a: carbon ratio to light, nutrient-limitation and temperature, Mar. Ecol. Prog. Ser., 148, 187–200, https://doi.org/10.3354/meps148187, 1997.
Geisen, C., Ridame, C., Journet, E., Delmelle, P., Marie, D., Lo Monaco, C., Metzl, N., Ammar, R., Kombo, J., and Cardinal, D.: Phytoplanktonic response to simulated volcanic and desert dust deposition events in the South Indian and Southern Oceans, Limnol. Oceanogr., 67, 1537–1553, https://doi.org/10.1002/lno.12100, 2022.
Georges, C., Monchy, S., Genitsaris, S., and Christaki, U.: Protist community composition during early phytoplankton blooms in the naturally iron-fertilized Kerguelen area (Southern Ocean), Biogeosciences, 11, 5847–5863, https://doi.org/10.5194/bg-11-5847-2014, 2014.
Graham, R. M., De Boer, A. M., van Sebille, E., Kohfeld, K. E., and Schlosser, C.: Inferring source regions and supply mechanisms of iron in the Southern Ocean from satellite chlorophyll data, Deep-Sea Res. Pt. I, 104, 9–25, https://doi.org/10.1016/j.dsr.2015.05.007, 2015.
Guidi, L., Stemmann, L., Jackson, G. A., Ibanez, F., Claustre, H., Legendre, L., Picheral, M., and Gorskya, G.: Effects of phytoplankton community on production, size, and export of large aggregates: A world-ocean analysis, Limnol. Oceanogr., 54, 1951–1963, https://doi.org/10.4319/lo.2009.54.6.1951, 2009.
Guillou, L., Chrétiennot-Dinet, M.-J., Medlin, L. K., Claustre, H., Goër, S. L., and Vaulot, D.: Bolidomonas: A New Genus with Two Species Belonging to a New Algal Class, the Bolidophyceae (heterokonta), J. Phycol., 35, 368–381, https://doi.org/10.1046/j.1529-8817.1999.3520368.x, 1999.
Gutiérrez-Rodríguez, A., Safi, K., Fernández, D., Forcén-Vázquez, A., Gourvil, P., Hoffmann, L., Pinkerton, M., Sutton, P., and Nodder, S. D.: Decoupling Between Phytoplankton Growth and Microzooplankton Grazing Enhances Productivity in Subantarctic Waters on Campbell Plateau, Southeast of New Zealand, J. Geophys. Res.-Oceans, 125, e2019JC015550, https://doi.org/10.1029/2019JC015550, 2020.
Gutiérrez-Rodríguez, A., Latasa, M., Safi, K., Pinkerton, M. H., and Nodder, S. D.: Decoupled growth and grazing rates of diatoms and green algae drive increased phytoplankton productivity on HNLC sub-Antarctic plateaux, Limnology and Oceanography Letters, 8, 896–905, https://doi.org/10.1002/lol2.10355, 2023.
Hama, T., Miyazaki, T., Ogawa, Y., Iwakuma, T., Takahashi, M., Otsuki, A., and Ichimura, S.: Measurement of photosynthetic production of a marine phytoplankton population using a stable 13C isotope, Mar. Biol., 73, 31–36, https://doi.org/10.1007/BF00396282, 1983.
Hauck, J., Gregor, L., Nissen, C., Patara, L., Hague, M., Mongwe, P., Bushinsky, S., Doney, S. C., Gruber, N., Le Quéré, C., Manizza, M., Mazloff, M., Monteiro, P. M. S., and Terhaar, J.: The Southern Ocean Carbon Cycle 1985–2018: Mean, Seasonal Cycle, Trends, and Storage, Global Biogeochem. Cy., 37, e2023GB007848, https://doi.org/10.1029/2023GB007848, 2023.
Hawco, N. J., Tagliabue, A., and Twining, B. S.: Manganese Limitation of Phytoplankton Physiology and Productivity in the Southern Ocean, Global Biogeochem. Cy., 36, e2022GB007382, https://doi.org/10.1029/2022GB007382, 2022.
Hayward, A., Pinkerton, M. H., and Gutierrez-Rodriguez, A.: phytoclass: A pigment-based chemotaxonomic method to determine the biomass of phytoplankton classes, Limnol. Oceanogr.-Meth., 21, 220–241, https://doi.org/10.1002/lom3.10541, 2023.
Hayward, A., Pinkerton, M. H., Wright, S. W., Gutiérrez-Rodriguez, A., and Law, C. S.: Twenty-six years of phytoplankton pigments reveal a circumpolar Class Divide around the Southern Ocean, Commun. Earth Environ., 5, 1–7, https://doi.org/10.1038/s43247-024-01261-6, 2024.
Higgins, H. W., Wright, S., and Schluter, L.: Quantitative interpretation of chemotaxonomic pigment data, in: Phytoplankton Pigments: Characterization, Chemo-Taxonomy and Applications in Oceanography, edited by: Roy, S., Llewellyn, C., Egeland, E. S., and Johnsen, G., Cambridge University Press, 257–313, ISBN 978-1-107-00066-7, 2011.
Hinz, D. J., Poulton, A. J., Nielsdóttir, M. C., Steigenberger, S., Korb, R. E., Achterberg, E. P., and Bibby, T. S.: Comparative seasonal biogeography of mineralising nannoplankton in the Scotia Sea: Emiliania huxleyi, Fragilariopsis spp. and Tetraparma pelagica, Deep-Sea Res. Pt. II, 59–60, 57–66, https://doi.org/10.1016/j.dsr2.2011.09.002, 2012.
Hirata, T., Hardman-Mountford, N. J., Brewin, R. J. W., Aiken, J., Barlow, R., Suzuki, K., Isada, T., Howell, E., Hashioka, T., Noguchi-Aita, M., and Yamanaka, Y.: Synoptic relationships between surface Chlorophyll-a and diagnostic pigments specific to phytoplankton functional types, Biogeosciences, 8, 311–327, https://doi.org/10.5194/bg-8-311-2011, 2011.
Holmes, T. M., Wuttig, K., Chase, Z., Schallenberg, C., van der Merwe, P., Townsend, A. T., and Bowie, A. R.: Glacial and Hydrothermal Sources of Dissolved Iron (II) in Southern Ocean Waters Surrounding Heard and McDonald Islands, J. Geophys. Res.-Oceans, 125, e2020JC016286, https://doi.org/10.1029/2020JC016286, 2020.
Hörstmann, C., Raes, E. J., Buttigieg, P. L., Lo Monaco, C., John, U., and Waite, A. M.: Hydrographic fronts shape productivity, nitrogen fixation, and microbial community composition in the southern Indian Ocean and the Southern Ocean, Biogeosciences, 18, 3733–3749, https://doi.org/10.5194/bg-18-3733-2021, 2021.
Irion, S., Jardillier, L., Sassenhagen, I., and Christaki, U.: Marked spatiotemporal variations in small phytoplankton structure in contrasted waters of the Southern Ocean (Kerguelen area), Limnol. Oceanogr., 65, 2835–2852, https://doi.org/10.1002/lno.11555, 2020.
Jakobsen, H. H. and Markager, S.: Carbon-to-chlorophyll ratio for phytoplankton in temperate coastal waters: Seasonal patterns and relationship to nutrients, Limnol. Oceanogr., 61, 1853–1868, https://doi.org/10.1002/lno.10338, 2016.
Jasmine, P., Muraleedharan, K. R., Madhu, N. V., Devi, C. R. A., Alagarsamy, R., Achuthankutty, C. T., Jayan, Z., Sanjeevan, V. N., and Sahayak, S.: Hydrographic and productivity characteristics along 45° E longitude in the southwestern Indian Ocean and Southern Ocean during austral summer 2004, Mar. Ecol. Prog. Ser., 389, 97–116, https://doi.org/10.3354/meps08126, 2009.
Kassambara, A.: rstatix: Pipe-Friendly Framework for Basic Statistical Tests. R package version 0.7.2, https://CRAN.R-project.org/package=rstatix (last access: 22 June 2026), 2023.
Kelley, D. and Richards, C.: oce: Analysis of Oceanographic Data. R package version 1.8-3, https://CRAN.R-project.org/package=oce (last access: 22 June 2026), 2024.
Kemp, A. E. S. and Villareal, T. A.: High diatom production and export in stratified waters – A potential negative feedback to global warming, Prog. Oceanogr., 119, 4–23, https://doi.org/10.1016/j.pocean.2013.06.004, 2013.
Klaas, C. and Archer, D. E.: Association of sinking organic matter with various types of mineral ballast in the deep sea: Implications for the rain ratio, Global Biogeochem. Cy., 16, 63-1–63-14, https://doi.org/10.1029/2001GB001765, 2002.
Korb, R. E., Whitehouse, M. J., Thorpe, S. E., and Gordon, M.: Primary production across the Scotia Sea in relation to the physico-chemical environment, J. Marine Syst., 57, 231–249, https://doi.org/10.1016/j.jmarsys.2005.04.009, 2005.
Kramer, S. J., Bolaños, L. M., Catlett, D., Chase, A. P., Behrenfeld, M. J., Boss, E. S., Crockford, E. T., Giovannoni, S. J., Graff, J. R., Haëntjens, N., Karp-Boss, L., Peacock, E. E., Roesler, C. S., Sosik, H. M., and Siegel, D. A.: Toward a synthesis of phytoplankton community composition methods for global-scale application, Limnol. Oceanogr.-Meth., 22, 217–240, https://doi.org/10.1002/lom3.10602, 2024.
Lamont, T. and Barlow, R.: Contrasting hydrography and phytoplankton distribution in the upper layers of cyclonic eddies in the Mozambique Basin and Mozambique Channel, Afr. J. Mar. Sci., 39, 293–306, https://doi.org/10.2989/1814232X.2017.1367722, 2017.
Landry, M. R., Brown, S. L., Rii, Y. M., Selph, K. E., Bidigare, R. R., Yang, E. J., and Simmons, M. P.: Depth-stratified phytoplankton dynamics in Cyclone Opal, a subtropical mesoscale eddy, Deep-Sea Res. Pt. II, 55, 1348–1359, https://doi.org/10.1016/j.dsr2.2008.02.001, 2008.
Landry, M. R., Hood, R. R., Davies, C. H., Selph, K. E., Antoine, D., Carl, M. C., and Beckley, L. E.: Microbial community biomass, production and grazing along 110° E in the eastern Indian Ocean, Deep-Sea Res. Pt. II, 202, 105134, https://doi.org/10.1016/j.dsr2.2022.105134, 2022.
Lasbleiz, M., Leblanc, K., Blain, S., Ras, J., Cornet-Barthaux, V., Hélias Nunige, S., and Quéguiner, B.: Pigments, elemental composition (C, N, P, and Si), and stoichiometry of particulate matter in the naturally iron fertilized region of Kerguelen in the Southern Ocean, Biogeosciences, 11, 5931–5955, https://doi.org/10.5194/bg-11-5931-2014, 2014.
Lasbleiz, M., Leblanc, K., Armand, L. K., Christaki, U., Georges, C., Obernosterer, I., and Quéguiner, B.: Composition of diatom communities and their contribution to plankton biomass in the naturally iron-fertilized region of Kerguelen in the Southern Ocean, FEMS Microbiol. Ecol., 92, fiw171, https://doi.org/10.1093/femsec/fiw171, 2016.
Latasa, M., Henjes, J., Scharek, R., Assmy, P., Röttgers, R., and Smetacek, V.: Progressive decoupling between phytoplankton growth and microzooplankton grazing during an iron-induced phytoplankton bloom in the Southern Ocean (EIFEX), Mar. Ecol. Prog. Ser., 513, 39–50, https://doi.org/10.3354/meps10937, 2014.
Latasa, M., Rodríguez, F., Agustí, S., and Estrada, M.: Distribution patterns of phytoplankton groups along isoirradiance layers in oligotrophic tropical and subtropical oceans, Prog. Oceanogr., 217, 103098, https://doi.org/10.1016/j.pocean.2023.103098, 2023.
Lê, S., Josse, J., and Husson, F.: FactoMineR: A Package for Multivariate Analysis, J. Stat. Softw., 25, 1–18, https://doi.org/10.18637/jss.v025.i01, 2008.
Leblanc, K., Quéguiner, B., Fiala, M., Blain, S., Morvan, J., and Corvaisier, R.: Particulate biogenic silica and carbon production rates and particulate matter distribution in the Indian sector of the Subantarctic Ocean, Deep-Sea Res. Pt. II, 49, 3189–3206, https://doi.org/10.1016/S0967-0645(02)00078-4, 2002.
Leblanc, K., Hare, C. E., Feng, Y., Berg, G. M., DiTullio, G. R., Neeley, A., Benner, I., Sprengel, C., Beck, A., Sanudo-Wilhelmy, S. A., Passow, U., Klinck, K., Rowe, J. M., Wilhelm, S. W., Brown, C. W., and Hutchins, D. A.: Distribution of calcifying and silicifying phytoplankton in relation to environmental and biogeochemical parameters during the late stages of the 2005 North East Atlantic Spring Bloom, Biogeosciences, 6, 2155–2179, https://doi.org/10.5194/bg-6-2155-2009, 2009.
Leblanc, K., Quéguiner, B., Diaz, F., Cornet, V., Michel-Rodriguez, M., Durrieu de Madron, X., Bowler, C., Malviya, S., Thyssen, M., Grégori, G., Rembauville, M., Grosso, O., Poulain, J., de Vargas, C., Pujo-Pay, M., and Conan, P.: Nanoplanktonic diatoms are globally overlooked but play a role in spring blooms and carbon export, Nat. Commun., 9, 953, https://doi.org/10.1038/s41467-018-03376-9, 2018.
Legendre, L. and Le Fevre, J.: Hydrodynamic control of marine phytoplankton production, in: Productivity of the Ocean: Present and Past, edited by: Berger, W. H., Smetacek, V., and Wefer, G., Wiley, New York, ISBN 978-0471922469, 1989.
Leseurre, C., Lo Monaco, C., Reverdin, G., Metzl, N., Fin, J., Mignon, C., and Benito, L.: Summer trends and drivers of sea surface fCO2 and pH changes observed in the southern Indian Ocean over the last two decades (1998–2019), Biogeosciences, 19, 2599–2625, https://doi.org/10.5194/bg-19-2599-2022, 2022.
Lo Monaco, C., Metzl, N., and Planchon, F.: OISO-33 cruise, R/V Marion Dufresne, https://doi.org/10.17600/18002420, 2023.
Lohr, M. and Wilhelm, C.: Algae displaying the diadinoxanthin cycle also possess the violaxanthin cycle, P. Natl. Acad. Sci. USA, 96, 8784–8789, https://doi.org/10.1073/pnas.96.15.8784, 1999.
Long, J. D., Smalley, G. W., Barsby, T., Anderson, J. T., and Hay, M. E.: Chemical cues induce consumer-specific defenses in a bloom-forming marine phytoplankton, P. Natl. Acad. Sci. USA, 104, 10512–10517, https://doi.org/10.1073/pnas.0611600104, 2007.
Mackey, M., Mackey, D., Higgins, H., and Wright, S.: CHEMTAX – a program for estimating class abundances from chemical markers: application to HPLC measurements of phytoplankton, Mar. Ecol. Prog. Ser., 144, 265–283, https://doi.org/10.3354/meps144265, 1996.
Marañón, E.: Phytoplankton size structure, in: Encyclopedia of Ocean Sciences, 2nd edn., edited by: Steele, J. H., Turekian, K., and Thorpe, S. A., Academic Press, Oxford, ISBN 978-0123750440, 2009.
Marañón, E., Holligan, P. M., Barciela, R., González, N., Mouriño, B., Pazó, M. J., and Varela, M.: Patterns of phytoplankton size structure and productivity in contrasting open-ocean environments, Mar. Ecol. Prog. Ser., 216, 43–56, https://doi.org/10.3354/meps216043, 2001.
Martin, J. H.: Glacial-interglacial CO2 change: The Iron Hypothesis, Paleoceanography, 5, 1–13, https://doi.org/10.1029/PA005i001p00001, 1990.
Martin, J. H., Fitzwater, S. E., and Gordon, R. M.: Iron deficiency limits phytoplankton growth in Antarctic waters, Global Biogeochem. Cy., 4, 5–12, https://doi.org/10.1029/GB004i001p00005, 1990.
McClain, C. R., Signorini, S. R., and Christian, J. R.: Subtropical gyre variability observed by ocean-color satellites, Deep-Sea Res. Pt. II, 51, 281–301, https://doi.org/10.1016/j.dsr2.2003.08.002, 2004.
McKay, R. M. L., Wilhelm, S. W., Hall, J., Hutchins, D. A., Al-Rshaidat, M. M. D., Mioni, C. E., Pickmere, S., Porta, D., and Boyd, P. W.: Impact of phytoplankton on the biogeochemical cycling of iron in subantarctic waters southeast of New Zealand during FeCycle, Global Biogeochem. Cy., 19, https://doi.org/10.1029/2005GB002482, 2005.
Mendes, C. R. B., Kerr, R., Tavano, V. M., Cavalheiro, F. A., Garcia, C. A. E., Dessai, D. R. G., and Anilkumar, N.: Cross-front phytoplankton pigments and chemotaxonomic groups in the Indian sector of the Southern Ocean, Deep-Sea Res. Pt. II, 118, 221–232, https://doi.org/10.1016/j.dsr2.2015.01.003, 2015.
Metzl, N. and Lo Monaco, C.: OISO-Océan Indien Service d'Observation, https://doi.org/10.18142/228, 1998.
Metzl, N., Poisson, A., Louanchi, F., Brunet, C., Schauer, B., and Bres, B.: Spatio-temporal distributions of air-sea fluxes of CO2 in the Indian and Antarctic oceans, Tellus B, 47, 56–69, https://doi.org/10.1034/j.1600-0889.47.issue1.7.x, 1995.
Metzl, N., Lo Monaco, C., Leseurre, C., Ridame, C., Fin, J., Mignon, C., Gehlen, M., and Chau, T. T. T.: The impact of the South-East Madagascar Bloom on the oceanic CO2 sink, Biogeosciences, 19, 1451–1468, https://doi.org/10.5194/bg-19-1451-2022, 2022.
Metzl, N., Fin, J., Lo Monaco, C., Mignon, C., Alliouane, S., Bombled, B., Boutin, J., Bozec, Y., Comeau, S., Conan, P., Coppola, L., Cuet, P., Ferreira, E., Gattuso, J.-P., Gazeau, F., Goyet, C., Grossteffan, E., Lansard, B., Lefèvre, D., Lefèvre, N., Leseurre, C., Petton, S., Pujo-Pay, M., Rabouille, C., Reverdin, G., Ridame, C., Rimmelin-Maury, P., Ternon, J.-F., Touratier, F., Tribollet, A., Wagener, T., and Wimart-Rousseau, C.: An updated synthesis of ocean total alkalinity and dissolved inorganic carbon measurements from 1993 to 2023: the dataset, Earth Syst. Sci. Data, 17, 1075–1100, https://doi.org/10.5194/essd-17-1075-2025, 2025.
Minas, H. and Minas, M.: Net community production in high nutrient-low chlorophyll waters of the tropical and antarctic oceans – grazing vs. iron hypothesis, Oceanol. Acta, 15, 145–162, 1992.
Mishra, R. K., Jena, B., Anilkumar, N. P., and Sinha, R. K.: Shifting of phytoplankton community in the frontal regions of Indian Ocean sector of the Southern Ocean using in situ and satellite data, J. Appl. Remote Sens., 11, 016019, https://doi.org/10.1117/1.JRS.11.016019, 2017.
Mishra, R. K., Naik, R. K., Venkataramana, V., Jena, B., AnilKumar, N., Soares, M. A., Sarkar, A., and Singh, A.: Phytoplankton biomass and community composition in the frontal zones of Southern Ocean, Deep-Sea Res. Pt. II, 178, 104799, https://doi.org/10.1016/j.dsr2.2020.104799, 2020.
Moline, M. A.: Photoadaptive response during the development of a coustal Antarctic diatom bloom and relationship to water column stability, Limnol. Oceanogr., 43, 146–153, https://doi.org/10.4319/lo.1998.43.1.0146, 1998.
Moore, J. K. and Abbott, M. R.: Phytoplankton chlorophyll distributions and primary production in the Southern Ocean, J. Geophys. Res.-Oceans, 105, 28709–28722, https://doi.org/10.1029/1999JC000043, 2000.
Morán, X. A. G., Fernández, E., and Pérez, V.: Size-fractionated primary production, bacterial production and net community production in subtropical and tropical domains of the oligotrophic NE Atlantic in autumn, Mar. Ecol. Prog. Ser., 274, 17–29, https://doi.org/10.3354/meps274017, 2004.
Morel, A. and Berthon, J.-F.: Surface pigments, algal biomass profiles, and potential production of the euphotic layer: Relationships reinvestigated in view of remote-sensing applications, Limnol. Oceanogr., 34, 1545–1562, https://doi.org/10.4319/lo.1989.34.8.1545, 1989.
Nelson, D. M., Brzezinski, M. A., Sigmon, D. E., and Franck, V. M.: A seasonal progression of Si limitation in the Pacific sector of the Southern Ocean, Deep-Sea Res. Pt. II, 48, 3973–3995, https://doi.org/10.1016/S0967-0645(01)00076-5, 2001.
Nowlin, W. D. and Klinck, J. M.: The physics of the Antarctic Circumpolar Current, Rev. Geophys., 24, 469–491, https://doi.org/10.1029/RG024i003p00469, 1986.
Nunes, S., Perez, G. L., Latasa, M., Zamanillo, M., Delgado, M., Ortega-Retuerta, E., Marrasé, C., Simó, R., and Estrada, M.: Size fractionation, chemotaxonomic groups and bio-optical properties of phytoplankton along a transect from the Mediterranean Sea to the SW Atlantic Ocean, Sci. Mar., 83, 87–109, https://doi.org/10.3989/scimar.04866.10A, 2019.
Oksanen, J., Simpson, G., Blanchet, F., Kindt, R., Legendre, P., Minchin, P., O'Hara, R., Solymos, P., Stevens, M., Szoecs, E., Wagner, H., Barbour, M., Bedward, M., Bolker, B., Borcard, D., Borman, T., Carvalho, G., Chirico, M., De Caceres, M., Durand, S., Evangelista, H., FitzJohn, R., Friendly, M., Furneaux, B., Hannigan, G., Hill, M., Lahti, L., Martino, C., McGlinn, D., Ouellette, M., Ribeiro Cunha, E., Smith, T., Stier, A., Ter Braak, C., and Weedon, J.: vegan: Community Ecology Package. R package version 2.8-0, https://vegandevs.github.io/vegan/ (last access: 22 June 2026), 2025.
Park, Y.-H., Gamberoni, L., and Charriaud, E.: Frontal structure, water masses, and circulation in the Crozet Basin, J. Geophys. Res.-Oceans, 98, 12361–12385, https://doi.org/10.1029/93JC00938, 1993.
Park, Y.-H., Fuda, J.-L., Durand, I., and Naveira Garabato, A. C.: Internal tides and vertical mixing over the Kerguelen Plateau, Deep-Sea Res. Pt. II, 55, 582–593, https://doi.org/10.1016/j.dsr2.2007.12.027, 2008.
Patil, S. M., Mohan, R., Shetye, S. S., Gazi, S., Baumann, K.-H., and Jafar, S.: Biogeographic distribution of extant Coccolithophores in the Indian sector of the Southern Ocean, Mar. Micropaleontol., 137, 16–30, https://doi.org/10.1016/j.marmicro.2017.08.002, 2017.
Poisson, A., Metzl, N., Brunet, C., Schauer, B., Bres, B., Ruiz-Pino, D., and Louanchi, F.: Variability of sources and sinks of CO2 in the western Indian and southern oceans during the year 1991, J. Geophys. Res.-Oceans, 98, 22759–22778, https://doi.org/10.1029/93JC02501, 1993.
Pollard, R. T., Salter, I., Sanders, R. J., Lucas, M. I., Moore, C. M., Mills, R. A., Statham, P. J., Allen, J. T., Baker, A. R., Bakker, D. C. E., Charette, M. A., Fielding, S., Fones, G. R., French, M., Hickman, A. E., Holland, R. J., Hughes, J. A., Jickells, T. D., Lampitt, R. S., Morris, P. J., Nédélec, F. H., Nielsdóttir, M., Planquette, H., Popova, E. E., Poulton, A. J., Read, J. F., Seeyave, S., Smith, T., Stinchcombe, M., Taylor, S., Thomalla, S., Venables, H. J., Williamson, R., and Zubkov, M. V.: Southern Ocean deep-water carbon export enhanced by natural iron fertilization, Nature, 457, 577–580, https://doi.org/10.1038/nature07716, 2009.
Pondaven, P., Ruiz-Pino, D., Fravalo, C., Tréguer, P., and Jeandel, C.: Interannual variability of Si and N cycles at the time-series station KERFIX between 1990 and 1995 – a 1-D modelling study, Deep-Sea Res. Pt. I, 47, 223–257, https://doi.org/10.1016/S0967-0637(99)00053-9, 2000.
Poulton, A. J., Moore, C. M., Seeyave, S., Lucas, M. I., Fielding, S., and Ward, P.: Phytoplankton community composition around the Crozet Plateau, with emphasis on diatoms and Phaeocystis, Deep-Sea Res. Pt. II, 54, 2085–2105, https://doi.org/10.1016/j.dsr2.2007.06.005, 2007.
Prasanna Kumar, S., Nuncio, M., Ramaiah, N., Sardesai, S., Narvekar, J., Fernandes, V., and Paul, J. T.: Eddy-mediated biological productivity in the Bay of Bengal during fall and spring intermonsoons, Deep-Sea Res. Pt. I, 54, 1619–1640, https://doi.org/10.1016/j.dsr.2007.06.002, 2007.
Quéroué, F., Sarthou, G., Planquette, H. F., Bucciarelli, E., Chever, F., van der Merwe, P., Lannuzel, D., Townsend, A. T., Cheize, M., Blain, S., d'Ovidio, F., and Bowie, A. R.: High variability in dissolved iron concentrations in the vicinity of the Kerguelen Islands (Southern Ocean), Biogeosciences, 12, 3869–3883, https://doi.org/10.5194/bg-12-3869-2015, 2015.
R Core Team: R: A Language and Environment for Statistical Computing. R Foundation for Statistical Computing, Vienna, Austria, https://www.R-project.org/ (last access: 22 June 2026), 2024.
Ras, J., Claustre, H., and Uitz, J.: Spatial variability of phytoplankton pigment distributions in the Subtropical South Pacific Ocean: comparison between in situ and predicted data, Biogeosciences, 5, 353–369, https://doi.org/10.5194/bg-5-353-2008, 2008.
Redfield, A. C.: The Biological Control of Chemical Factors in the Environment, Am. Sci., 46, 205–221, 1958.
Ridame, C., Dinasquet, J., Hallstrøm, S., Bigeard, E., Riemann, L., Van Wambeke, F., Bressac, M., Pulido-Villena, E., Taillandier, V., Gazeau, F., Tovar-Sanchez, A., Baudoux, A.-C., and Guieu, C.: N2 fixation in the Mediterranean Sea related to the composition of the diazotrophic community and impact of dust under present and future environmental conditions, Biogeosciences, 19, 415–435, https://doi.org/10.5194/bg-19-415-2022, 2022.
Riebesell, U., Reigstad, M., Wassmann, P., Noji, T., and Passow, U.: On the trophic fate of Phaeocystis pouchetii (hariot): VI. Significance of Phaeocystis-derived mucus for vertical flux, Neth. J. Sea Res., 33, 193–203, https://doi.org/10.1016/0077-7579(95)90006-3, 1995.
Riegman, R., Noordeloos, A. A. M., and Cadée, G. C.: Phaeocystis blooms and eutrophication of the continental coastal zones of the North Sea, Mar. Biol., 112, 479–484, https://doi.org/10.1007/BF00356293, 1992.
Robinson, J., Popova, E. E., Srokosz, M. A., and Yool, A.: A tale of three islands: Downstream natural iron fertilization in the Southern Ocean, J. Geophys. Res.-Oceans, 121, 3350–3371, https://doi.org/10.1002/2015JC011319, 2016.
Rodríguez, F., Garrido, J. L., Crespo, B. G., Arbones, B., and Figueiras, F. G.: Size-fractionated phytoplankton pigment groups in the NW Iberian upwelling system: impact of the Iberian Poleward Current, Mar. Ecol. Prog. Ser., 323, 59–73, https://doi.org/10.3354/meps323059, 2006.
Sarma, V. V. S. S., Chopra, M., Rao, D. N., Priya, M. M. R., Rajula, G. R., Lakshmi, D. S. R., and Rao, V. D.: Role of eddies on controlling total and size-fractionated primary production in the Bay of Bengal, Cont. Shelf Res., 204, 104186, https://doi.org/10.1016/j.csr.2020.104186, 2020.
Sarma, V. V. S. S., Sridevi, B., Metzl, N., Patra, P. K., Lachkar, Z., Chakraborty, K., Goyet, C., Levy, M., Mehari, M., and Chandra, N.: Air-Sea Fluxes of CO2 in the Indian Ocean Between 1985 and 2018: A Synthesis Based on Observation-Based Surface CO2, Hindcast and Atmospheric Inversion Models, Global Biogeochem. Cy., 37, e2023GB007694, https://doi.org/10.1029/2023GB007694, 2023.
Sarmiento, J. L., Gruber, N., Brzezinski, M. A., and Dunne, J. P.: High-latitude controls of thermocline nutrients and low latitude biological productivity, Nature, 427, 56–60, https://doi.org/10.1038/nature02127, 2004.
Schlüter, L., Henriksen, P., Nielsen, T. G., and Jakobsen, H. H.: Phytoplankton composition and biomass across the southern Indian Ocean, Deep-Sea Res. Pt. I, 58, 546–556, https://doi.org/10.1016/j.dsr.2011.02.007, 2011.
Seeyave, S., Lucas, M. I., Moore, C. M., and Poulton, A. J.: Phytoplankton productivity and community structure in the vicinity of the Crozet Plateau during austral summer 2004/2005, Deep-Sea Res. Pt. II, 54, 2020–2044, https://doi.org/10.1016/j.dsr2.2007.06.010, 2007.
Shiomoto, A., Sasaki, H., and Nomura, D.: Size-fractionated phytoplankton biomass and primary production in the eastern Indian sector of the Southern Ocean in the austral summer 2018/2019, Prog. Oceanogr., 218, 103119, https://doi.org/10.1016/j.pocean.2023.103119, 2023.
Sieburth, J. McN., Smetacek, V., and Lenz, J.: Pelagic ecosystem structure: Heterotrophic compartments of the plankton and their relationship to plankton size fractions, Limnol. Oceanogr., 23, 1256–1263, https://doi.org/10.4319/lo.1978.23.6.1256, 1978.
Sreerag, A., Mishra, R. K., Naik, R. K., Venkataramana, V., Soares, M. A., Mahale, R., Anilkumar, N., and Gauns, M.: Plankton diversity and dynamics in the upper surface of the Indian sector of the Southern Ocean ecosystem and biogeochemical processes, Regional Studies in Marine Science, 65, 103095, https://doi.org/10.1016/j.rsma.2023.103095, 2023.
Sreerag, A., Mishra, R. K., Soares, M. A., Venkataramana, V., and Mohan, R.: Biophysical and chemical factors governing picophytoplankton succession in the Indian sector of the Southern Ocean during austral summer, Antarct. Sci., 1–10, https://doi.org/10.1017/S0954102025100382, 2025.
Tagliabue, A., Sallée, J.-B., Bowie, A. R., Lévy, M., Swart, S., and Boyd, P. W.: Surface-water iron supplies in the Southern Ocean sustained by deep winter mixing, Nat. Geosci., 7, 314–320, https://doi.org/10.1038/ngeo2101, 2014.
Takahashi, T., Sutherland, S. C., Wanninkhof, R., Sweeney, C., Feely, R. A., Chipman, D. W., Hales, B., Friederich, G., Chavez, F., Sabine, C., Watson, A., Bakker, D. C. E., Schuster, U., Metzl, N., Yoshikawa-Inoue, H., Ishii, M., Midorikawa, T., Nojiri, Y., Körtzinger, A., Steinhoff, T., Hoppema, M., Olafsson, J., Arnarson, T. S., Tilbrook, B., Johannessen, T., Olsen, A., Bellerby, R., Wong, C. S., Delille, B., Bates, N. R., and de Baar, H. J. W.: Climatological mean and decadal change in surface ocean pCO2, and net sea–air CO2 flux over the global oceans, Deep-Sea Res. Pt. II, 56, 554–577, https://doi.org/10.1016/j.dsr2.2008.12.009, 2009.
Takao, S., Hirawake, T., Wright, S. W., and Suzuki, K.: Variations of net primary productivity and phytoplankton community composition in the Indian sector of the Southern Ocean as estimated from ocean color remote sensing data, Biogeosciences, 9, 3875–3890, https://doi.org/10.5194/bg-9-3875-2012, 2012.
Thyssen, M., Gest, L., Izard, L., Fuchs, R., Leblanc, K., Alvain, S., Kolasinski, J., and Tulet, P.: MAP-IO (Marion Dusfresne Atmospheric Program – Indian Ocean) flow cytometry, SEANOE, https://doi.org/10.17882/89505, 2024.
Uitz, J., Claustre, H., Morel, A., and Hooker, S. B.: Vertical distribution of phytoplankton communities in open ocean: An assessment based on surface chlorophyll, J. Geophys. Res.-Oceans, 111, https://doi.org/10.1029/2005JC003207, 2006.
Uitz, J., Claustre, H., Griffiths, F. B., Ras, J., Garcia, N., and Sandroni, V.: A phytoplankton class-specific primary production model applied to the Kerguelen Islands region (Southern Ocean), Deep-Sea Res. Pt. I, 56, 541–560, https://doi.org/10.1016/j.dsr.2008.11.006, 2009.
Uitz, J., Claustre, H., Gentili, B., and Stramski, D.: Phytoplankton class-specific primary production in the world's oceans: Seasonal and interannual variability from satellite observations, Global Biogeochem. Cy., 24, https://doi.org/10.1029/2009GB003680, 2010.
Vaillancourt, R. D., Marra, J., Seki, M. P., Parsons, M. L., and Bidigare, R. R.: Impact of a cyclonic eddy on phytoplankton community structure and photosynthetic competency in the subtropical North Pacific Ocean, Deep-Sea Res. Pt. I, 50, 829–847, https://doi.org/10.1016/S0967-0637(03)00059-1, 2003.
Vaulot, D., Eikrem, W., Viprey, M., and Moreau, H.: The diversity of small eukaryotic phytoplankton (≤3 µm) in marine ecosystems, FEMS Microbiol. Rev., 32, 795–820, https://doi.org/10.1111/j.1574-6976.2008.00121.x, 2008.
Villareal, T. A., Woods, S., Moore, J. K., and CulverRymsza, K.: Vertical migration of Rhizosolenia mats and their significance to fluxes in the central North Pacific gyre, J. Plankton Res., 18, 1103–1121, https://doi.org/10.1093/plankt/18.7.1103, 1996.
Wassmann, P.: Retention versus export food chains: processes controlling sinking loss from marine pelagic systems, in: Eutrophication in Planktonic Ecosystems: Food Web Dynamics and Elemental Cycling, Developments in Hydrobiology, vol. 127, edited by: Tamminen, T. and Kuosa, H., Springer, Dordrecht, https://doi.org/10.1007/978-94-017-1493-8_3, 1998.
Wei, T. and Simko, V.: R package “corrplot”: Visualization of a Correlation Matrix (Version 0.95), https://github.com/taiyun/corrplot (last access: 22 June 2026), 2024.
Wickham, H., Averick, M., Bryan, J., Chang, W., McGowan, L. D., François, R., Grolemund, G., Hayes, A., Henry, L., Hester, J., Kuhn, M., Pedersen, T. L., Miller, E., Bache, S. M., Müller, K., Ooms, J., Robinson, D., Seidel, D. P., Spinu, V., Takahashi, K., Vaughan, D., Wilke, C., Woo, K., and Yutani, H.: Welcome to the tidyverse, Journal of Open Source Software, 4, 1686, https://doi.org/10.21105/joss.01686, 2019.
Wojtasiewicz, B., Trull, T. W., Clementson, L., Davies, D. M., Patten, N. L., Schallenberg, C., and Hardman-Mountford, N. J.: Factors Controlling the Lack of Phytoplankton Biomass in Naturally Iron Fertilized Waters Near Heard and McDonald Islands in the Southern Ocean, Front. Mar. Sci., 6, https://doi.org/10.3389/fmars.2019.00531, 2019.
Yingling, N., Selph, K. E., Décima, M., Safi, K. A., Gutiérrez-Rodríguez, A., Fender, C. K., and Stukel, M. R.: Investigating plankton size spectra, biomass, abundance, and community composition in the Subtropical Convergence Front in the Southern Ocean, Front. Mar. Sci., 12, https://doi.org/10.3389/fmars.2025.1465125, 2025.
Zhang, D., Wang, C., Liu, Z., Xu, X., Wang, X., and Zhou, Y.: Spatial and temporal variability and size fractionation of chlorophyll a in the tropical and subtropical Pacific Ocean, Acta Oceanol. Sin., 31, 120–131, https://doi.org/10.1007/s13131-012-0212-1, 2012.
- Abstract
- Introduction
- Materials and Methods
- Results
- Discussion
- Conclusion
- Appendix A: Vertical profiles of TChl a, NPP and TChl a-normalized NPP for all SOCARB stations
- Data availability
- Author contributions
- Competing interests
- Disclaimer
- Acknowledgements
- Financial support
- Review statement
- References
- Supplement
- Abstract
- Introduction
- Materials and Methods
- Results
- Discussion
- Conclusion
- Appendix A: Vertical profiles of TChl a, NPP and TChl a-normalized NPP for all SOCARB stations
- Data availability
- Author contributions
- Competing interests
- Disclaimer
- Acknowledgements
- Financial support
- Review statement
- References
- Supplement