
the Creative Commons Attribution 4.0 License.
the Creative Commons Attribution 4.0 License.
 | 21 Sep 2026
Landscape- and site-scale spatial variability of blue carbon stocks and fluxes in tropical seagrass meadows

Kiah Eng Lim
Muhammad Ariq Khalingga
Pierre Taillardat
Sheryl Chan Si Ern
Lian Pin Koh
Daniel A. Friess
Seagrass meadows are emerging natural climate solutions for climate change mitigation through their high potential for organic carbon sequestration and storage, also known as blue carbon. However, the variability in current blue carbon stock and flux estimates is high, particularly at landscape scale. This knowledge gap highlights the need for evaluating blue carbon at spatial scales that are both locally robust and globally relevant. We quantified the magnitude of variability in blue carbon stocks and fluxes in tropical intertidal seagrass meadows at the site and landscape scales. We sampled within and across six intertidal seagrass meadows representing three geomorphic settings, including reef-associated settings dominated by Cymodocea spp., estuaries Halophila spp. and lagoons dominated by Thalassia spp., across Singapore. Within and across these sites, we measured soil organic carbon (Corg) stocks and greenhouse gas fluxes using the static chamber method. Tropical intertidal seagrass meadows stored 27.5±19.9 Mg Corg ha−1 (mean ± SD) in the top 0–25 cm of soil, which varied significantly within sites (min–max: 5.1–78.9 Mg Corg ha−1, n=42). Plot-level mean fluxes averaged 27.5±25.3 of CO2 (min–max: −18.6 to 82.4, n=56) and 0.5±18.2 of CH4 (min–max: −66.4 to 57.5, n=56). Mixed-effects models indicated that geomorphic setting did not explain variation in 0–25 cm stocks or in CO2 and CH4 fluxes. Sensitivity analyses for 0–100 cm stocks showed a marginal geomorphology effect for measured-only totals (p=0.074) that was not present after extrapolation to 100 cm (p=0.816). In multivariate driver models, CO2 flux was negatively associated with water temperature (p=0.011) and showed an overall geomorphology effect (p=0.027), while CH4 drivers were not resolved (all p≥0.158. Plot-level modelling further showed that CO2 decreased with increasing 0–25 cm Corg stock (p=0.044), whereas CH4 showed no association with Corg stocks (p=0.469). Overall, these results highlight strong spatial heterogeneity in tropical intertidal seagrass carbon dynamics and underscore the need for spatially and temporally explicit sampling and modelling frameworks that reflect nested spatial structure.
- Article
(1656 KB) - Full-text XML
-
Supplement
(708 KB) - BibTeX
- EndNote


Seagrass meadows have a high capacity for storing organic carbon in their sediments and are widely recognised as blue carbon ecosystems, where conservation and restoration are used to protect and enhance these sediment carbon stocks as a nature-based solutions for climate-change mitigation (Unsworth et al., 2022; Duarte et al., 2025; do Amaral Camara Lima et al., 2023). Yet seagrasses globally face a high risk of degradation, which could lead to ∼1154 Tg CO2 emissions with a social cost of USD 213 billion (Krause et al., 2025a). Therefore, there is a global interest in incorporating the conservation and restoration of seagrass meadows into climate change mitigation schemes and policies, such as a country's Nationally Determined Contribution (NDC) to the Paris Agreement and associated Nationally Appropriate Mitigation Actions (NAMAs) (Macreadie et al., 2021). However, policies and management decisions should be guided by a robust evidence base, including credible estimates of the extent, drivers and patterns of organic carbon storage (Dahl et al., 2025).
Although knowledge and understanding of the magnitude and drivers of variation in organic carbon (Corg) storage in seagrass meadows has greatly increased recently at the global scale (Gomis et al., 2025; Krause et al., 2025a), there are still challenges in quantifying blue carbon at site-specific or landscape scales, which is a mosaic of habitats with unique surrounding biophysical environment, hindering global efforts to establish them as reliable natural climate solutions (Williamson et al., 2022; Stankovic et al., 2023). Variability in seagrass Corg and carbon budgets is driven by biotic and abiotic factors at various spatial scales (Krause et al., 2025a; Gomis et al., 2025; Mazarrasa et al., 2021; Mazarrasa et al., 2023). At the intra-site scale, extrapolating standard 100 cm Corg stocks from shallower cores is a major caveat, potentially leading to 1.5- to 10-fold overestimation (Dahl et al., 2025; Stankovic et al., 2023; Krause et al., 2025a). Local or site-scale variability of Corg is generally attributed to grain size (Miyajima et al., 2015), species composition (Gomis et al., 2025), the contribution of sources of organic matter, i.e. autochthonous and allochthonous (Ricart et al., 2020; Serrano et al., 2019), water depth, and hydrodynamic energy, (Lavery et al., 2013; Ndhlovu et al., 2024; York et al., 2018). However, our understanding of how these factors scale to broader landscape contexts remains incomplete.
At larger landscape scales, the coastal geomorphic setting has emerged as a key control on seagrass Corg variability (Kennedy et al., 2022; Mazarrasa et al., 2021); however, it is not known how the geomorphic setting would influence GHG emissions from seagrasses. Estuarine meadows generally inhabit the intertidal interface and shallower depths, receive large inputs of terrigenous organic material, and experience low hydrodynamic energy, creating a depositional environment (Ricart et al., 2020), potentially facilitating high accumulation of allochthonous carbon (Capece et al., 2025). Sheltered coastal settings – such as lagoons or back-reef meadows – can maintain higher surface-soil Corg due to reduced sediment resuspension and wave energy (Guerra-Vargas et al., 2020; Alemu et al., 2022). However, the same anoxic conditions and high organic matter inputs in seagrasses that promote high Corg burial and sequestration can also favour the production and emission of greenhouse gases such as methane (CH4) (Rosentreter et al., 2021). Seagrass meadows generally emit negligible to moderate CH4 fluxes (Asplund et al., 2022; Burkholz et al., 2020), although emissions of the higher magnitudes sometimes reported are more commonly associated with patchy seagrass cover associated with disturbed settings than with mature natural meadows (Halim et al., 2024). Because CH4 flux magnitude is linked with geomorphic setting and its surrounding environmental controls such as organic matter loading, fine-sediment (mud) content, and electron acceptor availability – estuarine and sheltered lagoonal meadows, where Corg stocks are potentially higher, may also sustain conditions more conducive to methanogenesis than exposed or reef-associated settings. We note, however, that robustly assessing the climatic significance of these fluxes requires sustained accounting over the ecosystem lifetime e.g., 20- to 100-year Global Warming Potential horizons rather than comparisons of instantaneous flux magnitudes (Neubauer and Megonigal, 2015). Kirwan et al. (2023) proposed that GHG emissions in coastal wetlands would be governed by local-scale factors such as plant productivity and electron acceptor availability and linked environmental controls compared to landscape-scale geomorphic processes, yet this hypothesis has not been explicitly tested across geomorphic settings in seagrass meadows.
Here, we explore the spatial variability in carbon stocks and fluxes across seagrass meadows of different geomorphic settings in Singapore. We hypothesised that geomorphic settings such as reef-associated settings, estuaries and lagoonal settings would shape soil organic carbon and GHG emissions in tropical seagrass meadows, and a higher soil Corg would be associated with higher GHG fluxes under these geomorphic types. Here, we use “landscape scale” to refer to a mosaic of seagrass meadows distributed across different geomorphic settings (reef-associated, lagoonal, and estuarine) within Singapore, where larger-scale drivers of stocks and fluxes such as temperature and precipitation are held constant. We ask (1) what is the magnitude of soil organic carbon stocks and GHG emissions (CO2 and CH4) of tropical seagrass meadows, (2) How do organic carbon and GHG fluxes vary across spatial scales encompassing local (within‐site, across sites) and landscape (geomorphic settings) levels, and (3) are patterns in organic carbon storage associated with GHG fluxes, and which environmental parameters define these associations?
2.1 Site description
The study was conducted on six mature natural intertidal seagrass meadows (except Eagle Bay, a reclaimed lagoonal site) across the tropical island state of Singapore (Fig. 1). The climate of the area is humid tropical; therefore, temperature does not vary much throughout the year, with the highest average monthly temperature of 28.8 °C during May and the lowest average monthly temperature of 26.8 °C during December and January (Meteorological Service Singapore, 2024). Mean annual rainfall is 2113 mm (1991–2024), with two monsoon periods during June–September and December–early March separated by inter-monsoon seasons in late March–May and October–November.
The seagrass meadows in this study are found in the lower intertidal zone and experience a diurnal tidal cycle, such that they are only briefly exposed during low tide (<0.7 m, tidal range >2.5 m) and remain fully submerged during high tide. We selected six intertidal meadows representing three geomorphic classes (McKenzie et al., 2016): reef-associated (Cyrene Reef, Labrador Nature Reserve; dominated by Cymodocea spp.), lagoonal (Tanah Merah, Eagle Bay; dominated by Thalassia spp.), and estuarine (Chek Jawa, Changi Beach Park, dominated by Halophila spp., Fig. 1). Table S1 in the Supplement summarises seagrass species composition and cover by site.
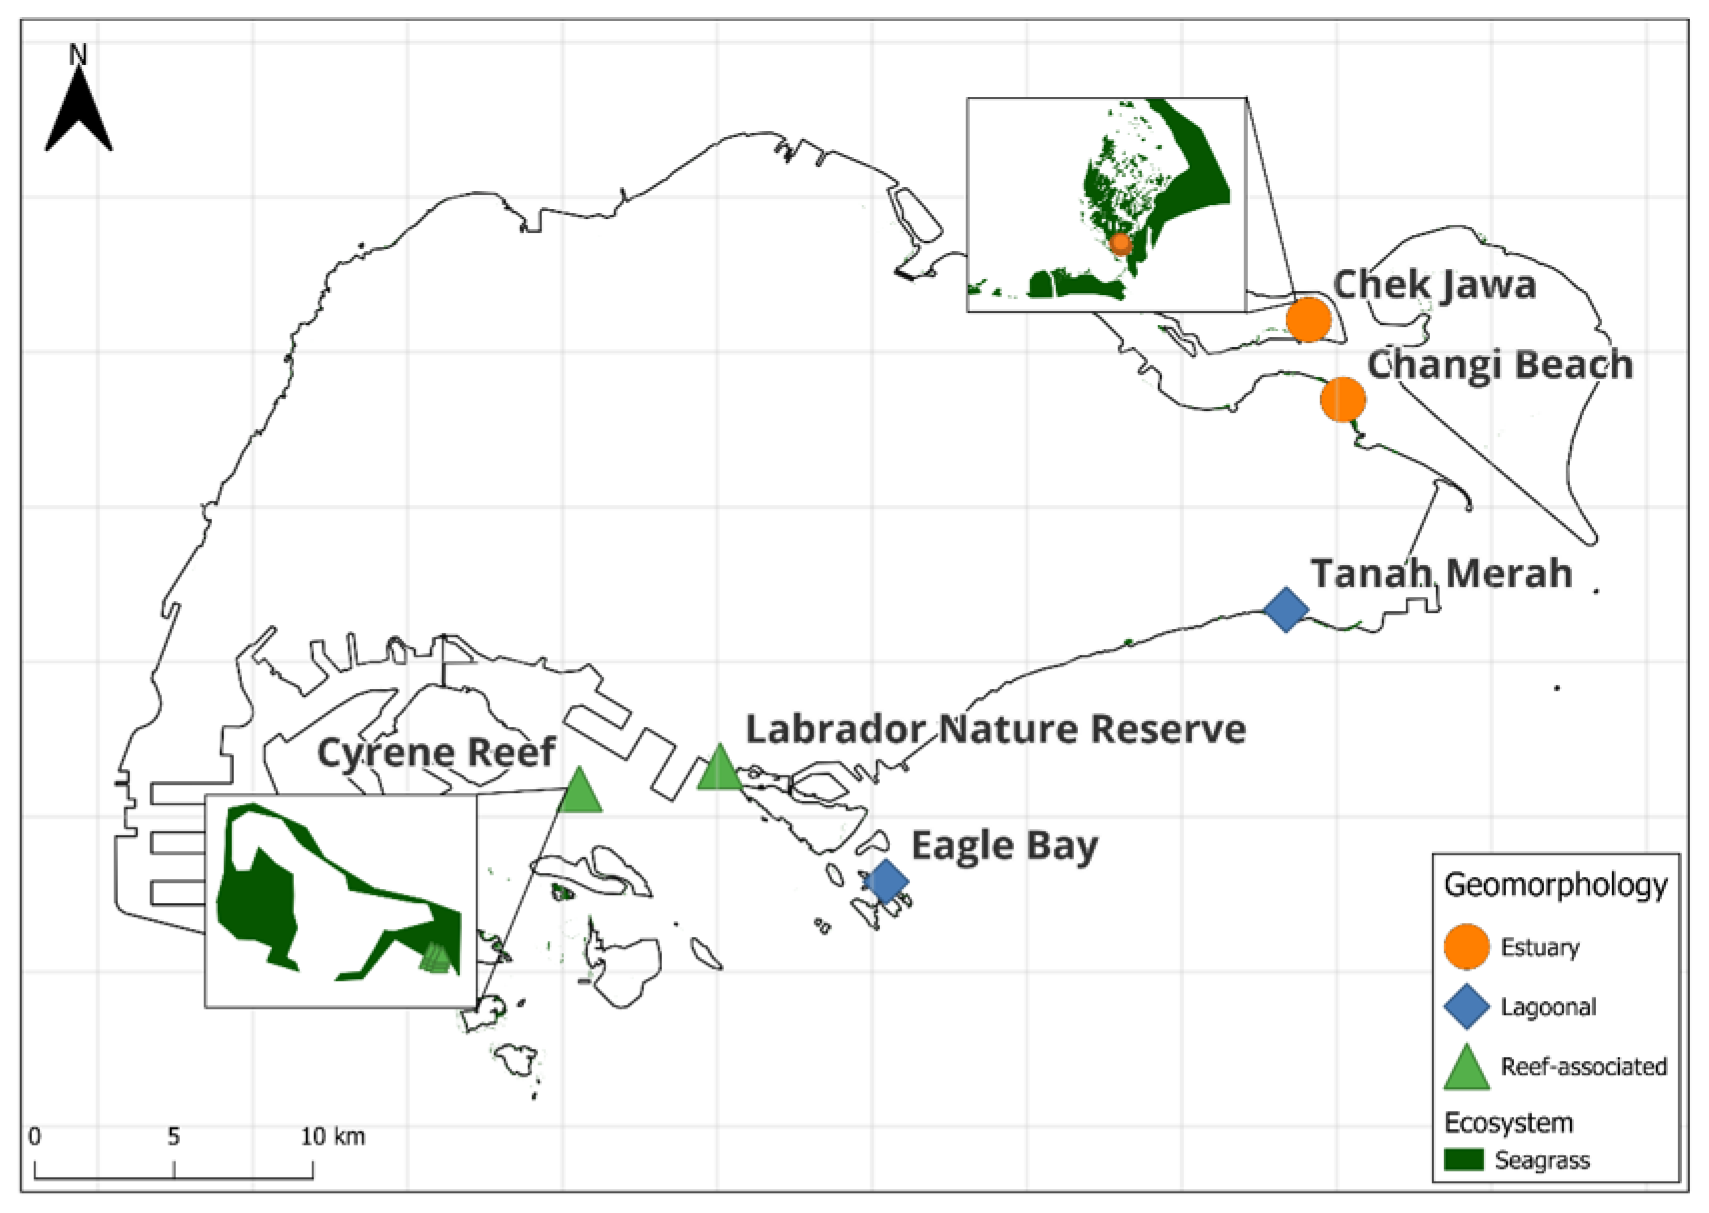
Figure 1Locations of study sites across estuarine, lagoonal, and reef-associated geomorphic settings in Singapore (orange circles: estuarine; blue diamonds: lagoonal; green triangles: reef-associated). Seagrass extent across Singapore is shown on the main map but is barely visible owing to its limited areal cover; inset maps therefore show seagrass meadow boundaries (Tan et al., 2022) at higher resolution for the two largest studied meadows, Chek Jawa and Cyrene Reef.
2.2 Field sampling design
We collected field data during low tide from October 2022 to May 2024 and targeted the same time of the day and season for consistency and to avoid seasonal variations affecting GHG fluxes. We selected the sampling months when Singapore's climate is generally consistent with an average monthly temperature of 27.5–28.8 °C and average monthly rainfall of 150–160 mm (Meteorological Service Singapore, 2024). At each site, 3–5 transects (30 m length treated as within-site sampling units) were laid parallel to shore at approximately similar tidal exposure and elevations, >5 m apart, positioned to encompass the meadow extent following visual assessment. Three 1 m × 1 m plots were established along each transect at 5, 15, and 25 m. Where transects could not capture site heterogeneity, additional random plots were sampled within the meadow to improve coverage.
2.3 Carbon stocks
To quantify sediment carbon stocks, we collected 9–15 replicate sediment cores per site using a gouge auger (5.08 cm internal diameter) to 1 m depth or refusal. Because the upper 20–50 cm typically exhibits the strongest gradients in carbon content (Howard et al., 2014) due to the influence of the vegetation rooting zone, the top 50 cm was sectioned at 5 cm increments. Each core was divided into 11 sections: 0–5, 5–10, 10–15, 15–20, 20–25, 25–30, 30–35, 35–40, 40–45, 45–50, and 50–100 cm. We used 5 cm increments in the upper 50 cm to capture steep near-surface gradients commonly observed in seagrass sediments (Howard et al., 2014). Below 50 cm, we used a coarser interval (50–100 cm) due to expected lower variation in carbon stocks at depth (Phang et al., 2015). Core compaction during extraction was minimal (<10 %). Sediment was transported to the laboratory and dried at 60 °C to a constant mass. Dry bulk density (g dry weight cm−3) was calculated as dry mass divided by the in-situ sample volume (Howard et al., 2014). A subsample was ground and homogenised, then fumigated overnight with 0.1 M HCl to remove inorganic carbon, dried, weighed, encapsulated in tin, and analysed for total organic carbon (Corg, %) using an organic carbon analyser. Carbon stocks (Mg Corg ha−1) were calculated following Howard et al. (2014), integrating section-specific Corg, dry bulk density, and layer thickness. We recorded core refusal depth (cm) during sampling and treated refusal depth as an informative sediment property reflecting sediment deposit thickness. Of the 62 cores collected, 25 (40.3 %) reached 100 cm depth based on refusal depth. To ensure comparable depth coverage across sites, primary inference for 0–25 cm stocks were restricted to cores that reached ≥25 cm depth (“complete-to-25” cores; n=42). We report 0–100 cm stocks as secondary sensitivity estimates (measured-only and extrapolated-to-100 cm), clearly labelled. For cores shorter than 100 cm, we extrapolated linearly from the deepest measured interval to 100 cm. For sediment texture, dried subsamples were disaggregated, sieved at 2 mm to remove coarse fragments (shells, pebbles), dispersed in deionised water, and analysed with a laser diffraction particle size analyser (Horiba LA, 350). Sediment texture was characterised using the mud fraction (% mud) measured for each depth interval; for modelling we summarised mud fraction as the mean % mud within 0–25 cm at the core level (stock models) and at the plot level (flux driver models).
2.4 Sediment-air greenhouse gas fluxes
We used opaque (dark) static chambers to quantify sediment–air CO2 and CH4 fluxes during low tide exposure representing sediment respiration/production, rather than net ecosystem exchange that would include photosynthetic uptake. Chamber collars (PVC, internal diameter 15 cm) were inserted ∼5 cm into the sediment. We minimised disturbance by careful insertion and waiting for a 20 min equilibration period before T0 sampling based on our observations from a previous study (Iram et al., 2022). Chambers were rigid PVC with an enclosed headspace height of 30 cm. Lids were sealed using rubber bands and inspected sealing surface carefully to rule out leaks. Measurements were conducted once for each site between 10:00 and 17:00 SST (Singapore Standard Time) to minimise diel variability. Within each plot, three chambers were deployed at random positions and sealed with rubber bands Headspace gas was sampled by syringe at 0, 20, 40, and 60 min and transferred to 15 mL pre-evacuated glass vials (Labco, High Wycombe, UK). Concentrations were measured in the laboratory using a cavity ring-down spectrometer (Picarro G220-i). Fluxes (surface-area-normalised) were calculated from the linear rate of change in headspace concentration over time, corrected for chamber volume, surface area, ambient temperature and pressure via the ideal gas law. Flux estimates were retained when linear fits met r2≥0.8 () and non-linear estimates were excluded.
2.5 Environmental parameters
At each plot, we measured surface sediment temperature (°C) at the top 5 cm depth using an Electronic 4-in-1 soil meter. Sediment redox potential (mV), pH, salinity (psu), surface water temperature (°C), conductivity (mS cm−1) and dissolved oxygen (%) were measured using a multiparameter Hanna® pH/ORP sensor (HI769819X) immediately adjacent to chambers during low tide, allowing readings to stabilise for 5 min. Air temperature (°C) inside each chamber was measured using a Hobo® Pendant MX Tem. All sensors were calibrated following the manufacturer's guidelines before each field campaign.
2.6 Data Analysis
All analyses were conducted in R (R Core Team, 2026) using lme4 (Bates et al., 2015) and lmerTest (Kuznetsova et al., 2017) for linear mixed-effects models (LMMs) and emmeans (Lenth and Piaskowski, 2026) for estimated marginal means. The primary stock response was 0–25 cm plot-level measured-only Corg stock restricted to 0–25 cm cores. Geomorphic setting effects on 0–25 cm stocks were tested using: Stock geomorphology + (1 | site/transect).
Fluxes were analysed on the raw scale using Gaussian LMMs; negative fluxes were retained. CO2 geomorphology-only models used plots nested within transects nested within sites (1 | site/transect/plot). For CH4, the fully nested model was singular; therefore, the geomorphology-only inference used a stable structure (1 | site/plot). Fixed effects were tested using Type III tests with Satterthwaite denominator degrees of freedom (lmerTest).
To assess environmental controls on fluxes, we fit multivariate driver models including standardised (z-scored) predictors of redox, salinity, pH, water temperature, dissolved oxygen, and mud fraction (mean mud % in 0–25 cm), plus geomorphology. Conductivity was treated as redundant with salinity and was not included simultaneously. Pairwise comparisons among geomorphic classes and among sites were computed using Tukey-adjusted contrasts from estimated marginal means (emmeans); outputs are provided in the Supplement. We quantified how variability was distributed across spatial scales by extracting variance components from the fitted mixed models and expressing each component as a percentage of total variance (Table S2). We additionally explored an expanded within-site stock driver model including depth-resolved sediment properties (0–25 cm mud fraction and dry bulk density) and plot-level mean environmental covariates (salinity, redox, pH, temperature, dissolved oxygen), with predictors centred within site to separate within-site from between-site effects (Table S2). Table S2 provides full site-level variability outputs, including contrasts/EMMs with letters and N, refusal depth summaries, and variance partitioning.
2.7 Methodological limitations
We acknowledge methodological limitations due to logistical constraints. First, while we targeted high-resolution spatial replication within sites of ≤15 soil cores and 27 chambers per site, gas flux measurements are limited in temporal replication e.g., diel/seasonal variability and high-tide conditions and tidal range variability among sites were not sampled therefore the effect of driver responses which often operate on temporal scales such as salinity may constraint results. As such, we limit data reporting to per hr, not per day or per year. Second, below 50 cm depth we used a coarser core interval (50–100 cm) to prioritise replication, which may smooth fine-scale variability at depth and therefore interpretation of deep-layer estimates should be treated accordingly. However, based on prior measurements of seagrass meadows and other intertidal ecosystems in Singapore, we do not anticipate substantial variation in carbons stocks at lower depths (Phang et al., 2015). Third, chamber collars were inserted shortly before measurements due to access constraints during short low-tide windows; despite a 20 min equilibration period, some disturbance effects may remain. Fourth, we acknowledge that low-tide dark-chamber fluxes may differ under high-tide inundation due to altered oxidation/transport conditions; however, in this study, we are interested in sediment-air fluxes, rather than sediment-water fluxes.
3.1 Soil carbon stocks and fluxes in tropical seagrass meadows
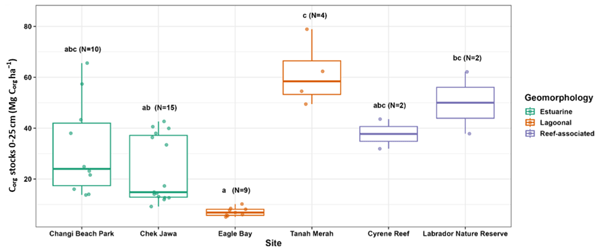
We standardised soil organic carbon (Corg) stocks to 0–25 cm as the primary reporting depth because 25 cm was the maximum common measured depth across sites. Across all cores, 0–25 cm Corg stocks averaged 27.5±19.9 Mg Corg ha−1 (mean ± SD; range 5.1–78.9; n=42 cores; Fig. 2). Seagrasses had plot-level mean CO2 fluxes of 27.5±25.7 (Range: −18.6 to 82.4 , n=54 plots, Fig. 3) and CH4 fluxes of 0.5±18.2 (Range: −66.4 to 57.5 , n=54 plots; Fig. 4) for all measured sites.
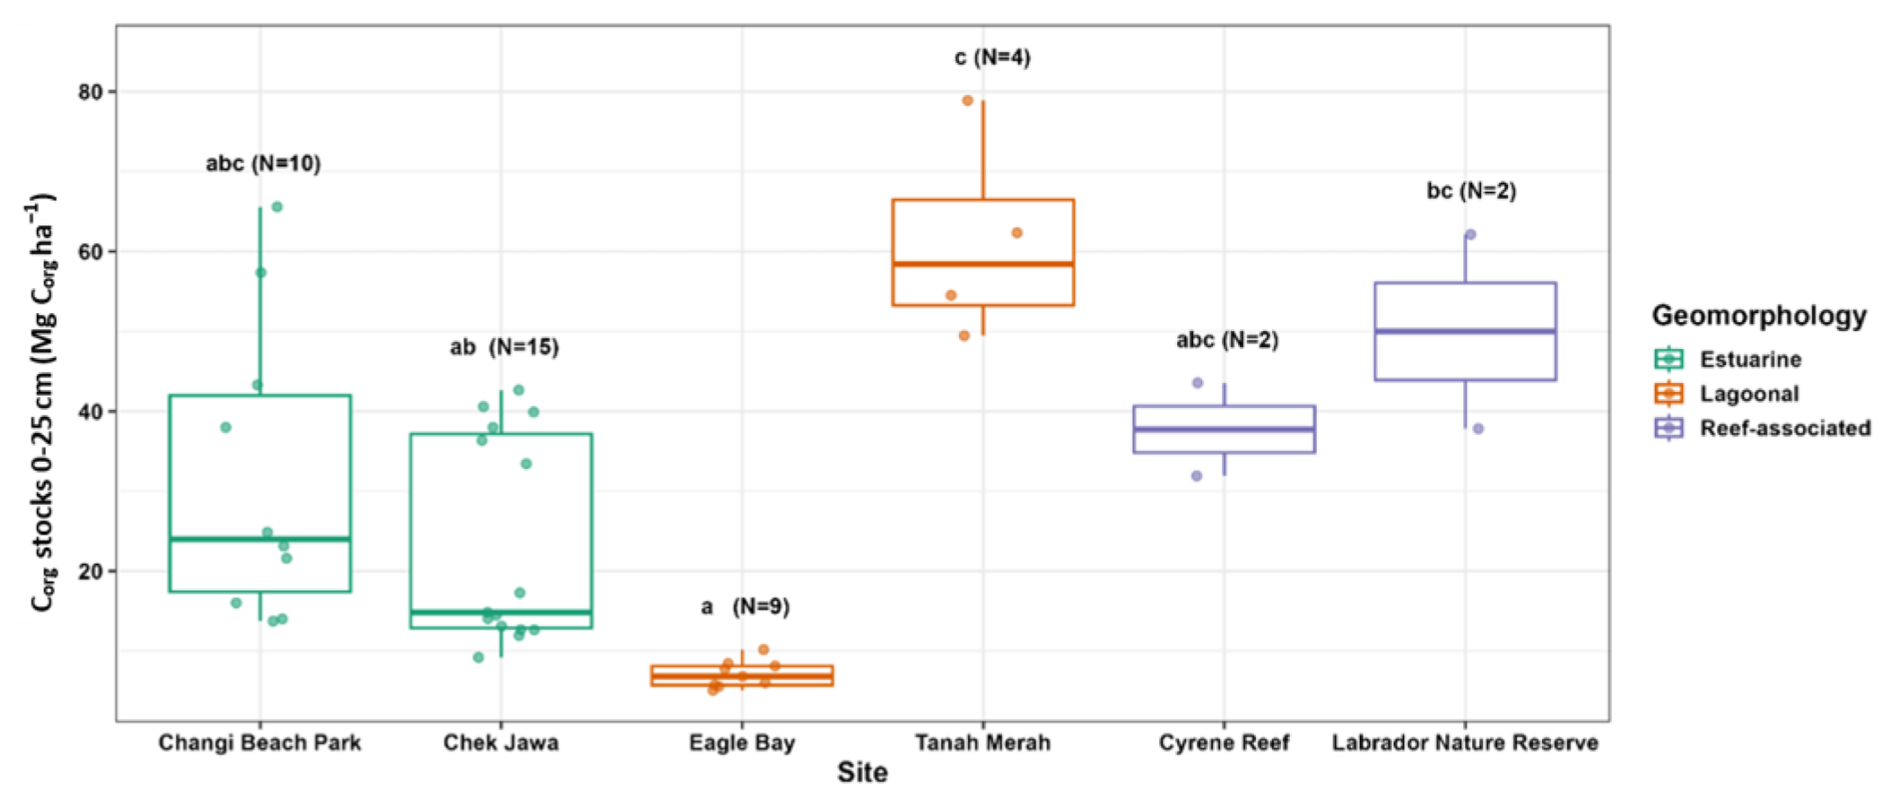
Figure 2Measured only 0–25 cm soil organic carbon stocks (Mg Corg ha−1) across sites, restricted to the cores reaching ≥25 cm depth. Boxplots show medians and interquartile ranges; points show individual cores, coloured by geomorphology. Letters above sites indicate Tukey-adjusted differences in site estimated marginal means (emmeans; α=0.05); sites sharing a letter are not significantly different. N indicates the number of 0–25 cm cores per site.
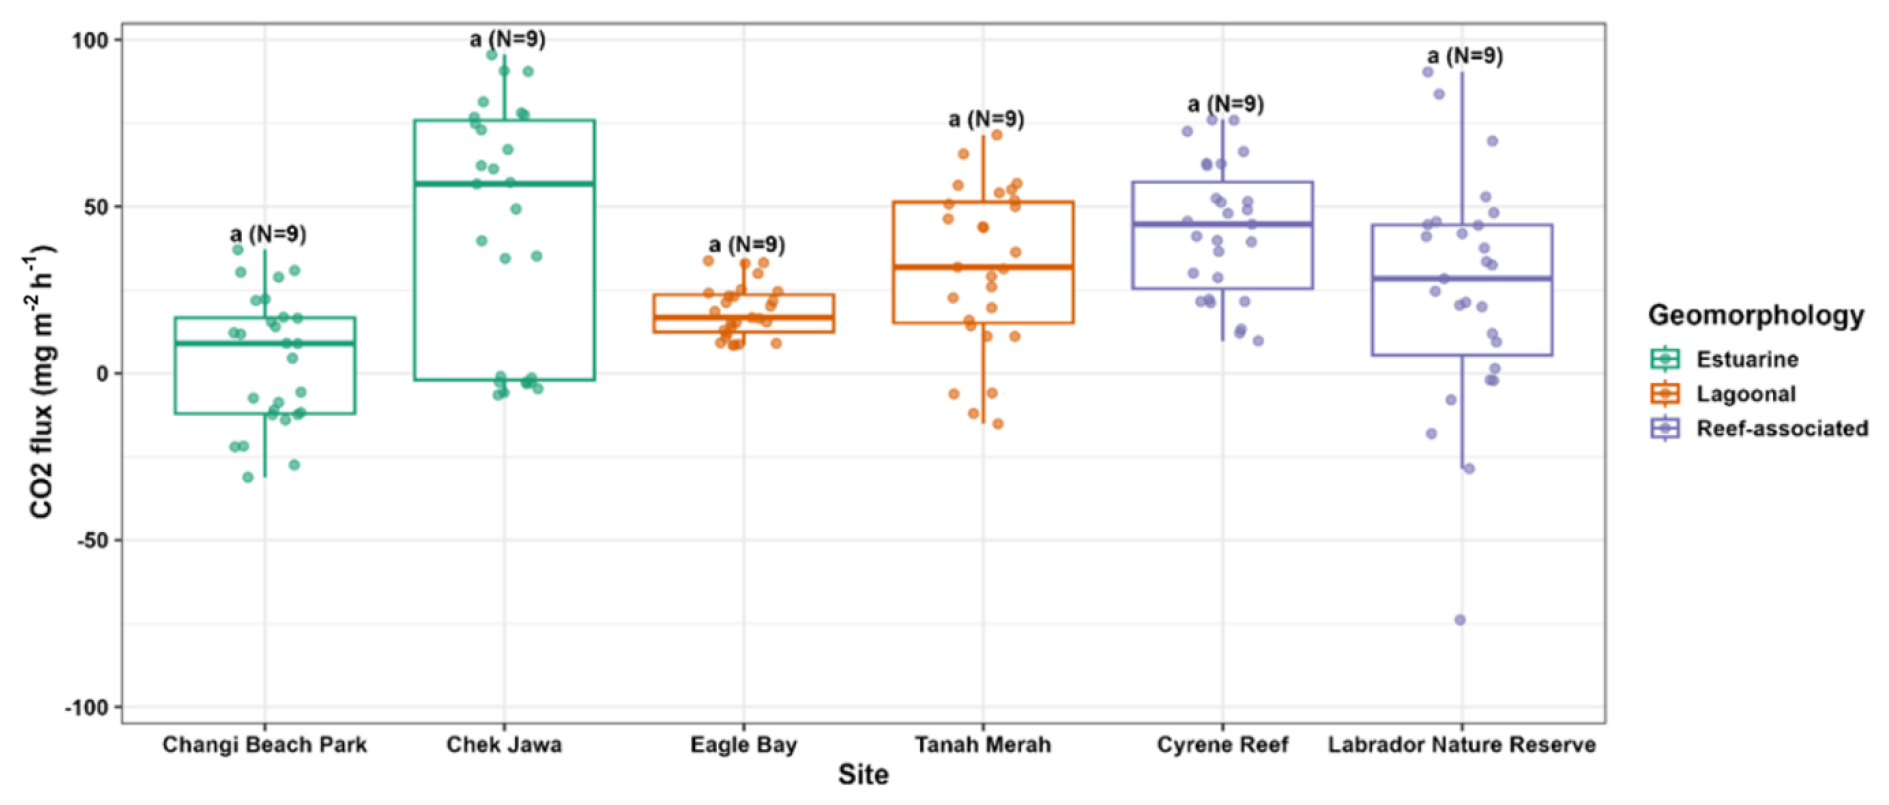
Figure 3Sediment–air CO2 flux (mg m−2 h−1) across sites during low-tide exposure (dark chambers). Boxplots show chamber-level flux distributions; points show individual chambers, coloured by geomorphology. The y axis limits are symmetric (± max(|CO2|) across all chambers) to aid cross-site comparison. Letters above sites indicate Tukey-adjusted differences in site estimated marginal means from the site mixed model (emmeans; α=0.05); sites sharing a letter are not significantly different. N indicates the number of plots contributing flux measurements at each site.
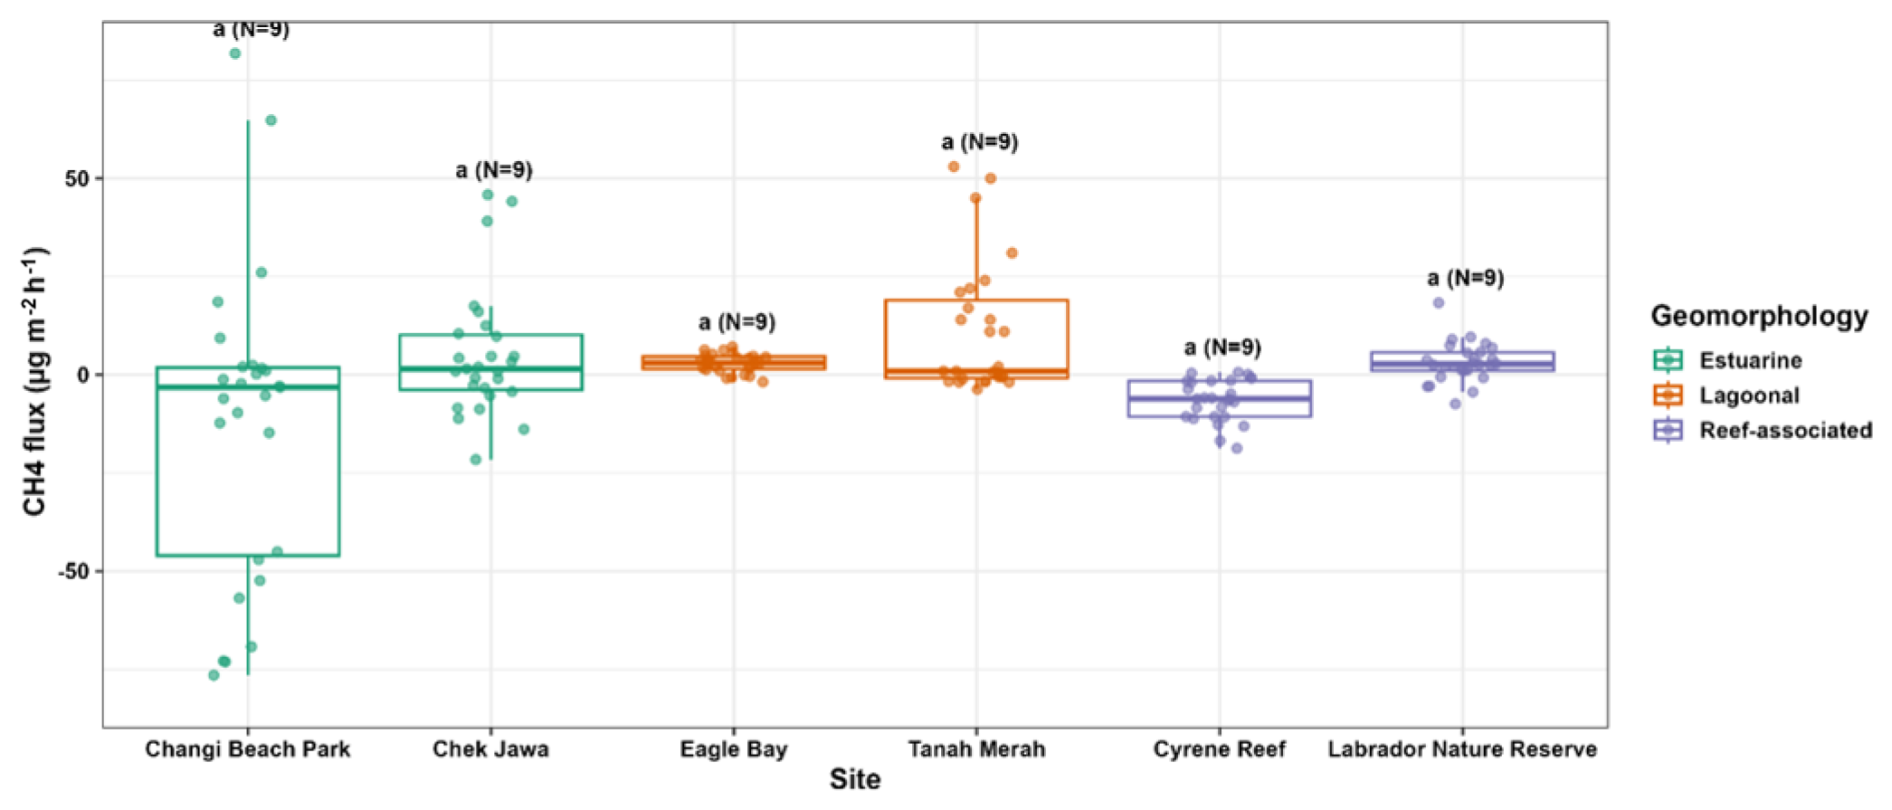
Figure 4Sediment–air CH4 flux () across sites during low-tide exposure (dark chambers). Boxplots show chamber-level flux distributions; points show individual chambers, coloured by geomorphology. The y axis limits are symmetric (± max(|CH4|) across all chambers) to aid cross-site comparison. Letters above sites indicate Tukey-adjusted differences in site estimated marginal means from the site mixed model (emmeans; α=0.05); sites sharing a letter are not significantly different. N indicates the number of plots contributing flux measurements at each site.
3.2 Spatial variability in seagrass soil carbon stocks and fluxes
Mixed-effects models accounting for the nested sampling design showed no evidence of differences among geomorphic settings in 0–25 cm stocks (Fig. 2; Type III Satterthwaite test: , p=0.796). CO2 and CH4 fluxes also did not differ among geomorphic settings in geomorphology-only models (CO2, , p=0.844; CH4, , p=0.513).
Sensitivity analyses for 0–100 cm stocks indicated a marginal geomorphology effect for measured-only totals (, p=0.074), but no effect after extrapolating all cores to 100 cm (, p=0.816). Refusal depth differed strongly among geomorphic settings (Table S2). Estuarine cores reached much greater depths (mean 97±15.3 cm, n=26) than lagoonal cores (mean 31.6±10.7 cm; n=18) and reef-associated cores (mean 18.7±8.2 cm; n=18). In a mixed-effects model with site as a random intercept, refusal depth differed significantly among geomorphic settings, with lagoonal (estimate −65 cm; p=0.003) and reef-associated (estimate cm; p=0.002) cores being shallower than estuarine cores (Table S2). Overall, 25 of 62 cores (40.3 %) reached 100 cm depth (Table S2).
Variance partitioning indicated strong scale dependence in variability (Table S2): 0–25 cm stocks were dominated by site-level variance (72.30 %), with additional variance among transects within sites (7.61 %) and residual variance (20.09 %). CO2variance was distributed across plot (16.96 %), transect (29.03 %), site (22.50 %) and residual (31.50 %) components, whereas CH4 variance was concentrated at the plot scale (60.76 %) with smaller site (10.99 %) and residual (28.25 %) components.
3.3 Relationship between carbon stocks and fluxes and environmental parameters
Among tested sediment properties for 0–25 cm, mud % ranged from 2.5 % to 97.9 % and dry bulk density was 0.8 to 1.7 g cm−3 (see site and geomorphology level details in Table S3 and Fig. S1 in the Supplement). Across all sites, redox ranged from −91.6 to 156.7 mV, pH from 6.9 to 7.8, salinity from 22.4 to 31.3 psu, surface water temperature from 27.4 to 30.1 °C, conductivity from 33.4 to 48 mS cm−1 and dissolved oxygen from 34.9 % to 97.7 % (see site and geomorphology level details in Table S4 and Fig. S2).
To explore drivers of site-dominated variability in 0–25 cm stocks, we fit an expanded plot-level mixed model including depth-resolved sediment properties (0–25 cm mud fraction and dry bulk density) and plot-mean environmental covariates (salinity, redox, pH, water temperature, dissolved oxygen). Predictors were centred within site (within-site effects) and transects were modelled as random intercepts nested within sites. None of the tested predictors were significant at α=0.05 (all p≥0.073); dissolved oxygen p=0.073, and salinity (p=0.099 were marginal (Table S2; StockDrv_Expanded sheets).
In the multivariate CO2 driver model, geomorphology showed an overall effect (Type III Satterthwaite test: , p=0.027). Adjusted EMMs showed that estuarine settings had significantly higher baseline sediment-surface CO2 emissions (38.2±6.4 ) than lagoonal (22.1±5.1 ) and reef-associated settings (20.4±5.8 ; Tukey-adjusted p=0.038). These elevated estuarine emissions were associated with higher near-surface mud fractions and lower dissolved oxygen during low-tide exposure, while CO2 fluxes across all settings declined significantly with increasing water temperature (, p=0.011). Water temperature was a significant negative predictor (Type III Satterthwaite test: , p=0.011 while dissolved oxygen was marginal (p=0.081). Redox, salinity, pH, and mud fraction were not significant (all p>0.158). Tukey-adjusted pairwise contrasts are reported in Table S2. A sensitivity model removing the site random intercept produced an identical likelihood (likelihood-ratio test p=1.0 and slightly improved AIC (1467.866 vs. 1469.866), indicating robust fixed-effect inference (Table S2).
In the multivariate CH4 driver model, no predictors were significant, including Corg (p=0.298), redox (p=0.703), salinity (p=0.262 and mud % (p=0.158). To evaluate stock–flux relationships at a consistent spatial scale, we compared plot-level 0–25 cm Corg stocks (Mg Corg ha−1) with plot-mean GHG fluxes. In a linear mixed model with site as a random intercept, plot-mean CO2 flux decreased significantly with increasing plot-level Corg stock (, p=0.044; Fig. 5a), whereas plot-mean CH4 flux showed no detectable association (, p=0.469; Fig. 5b). Geomorphology contrasts were not significant for both CO2 and CH4 (all p≥0.399).
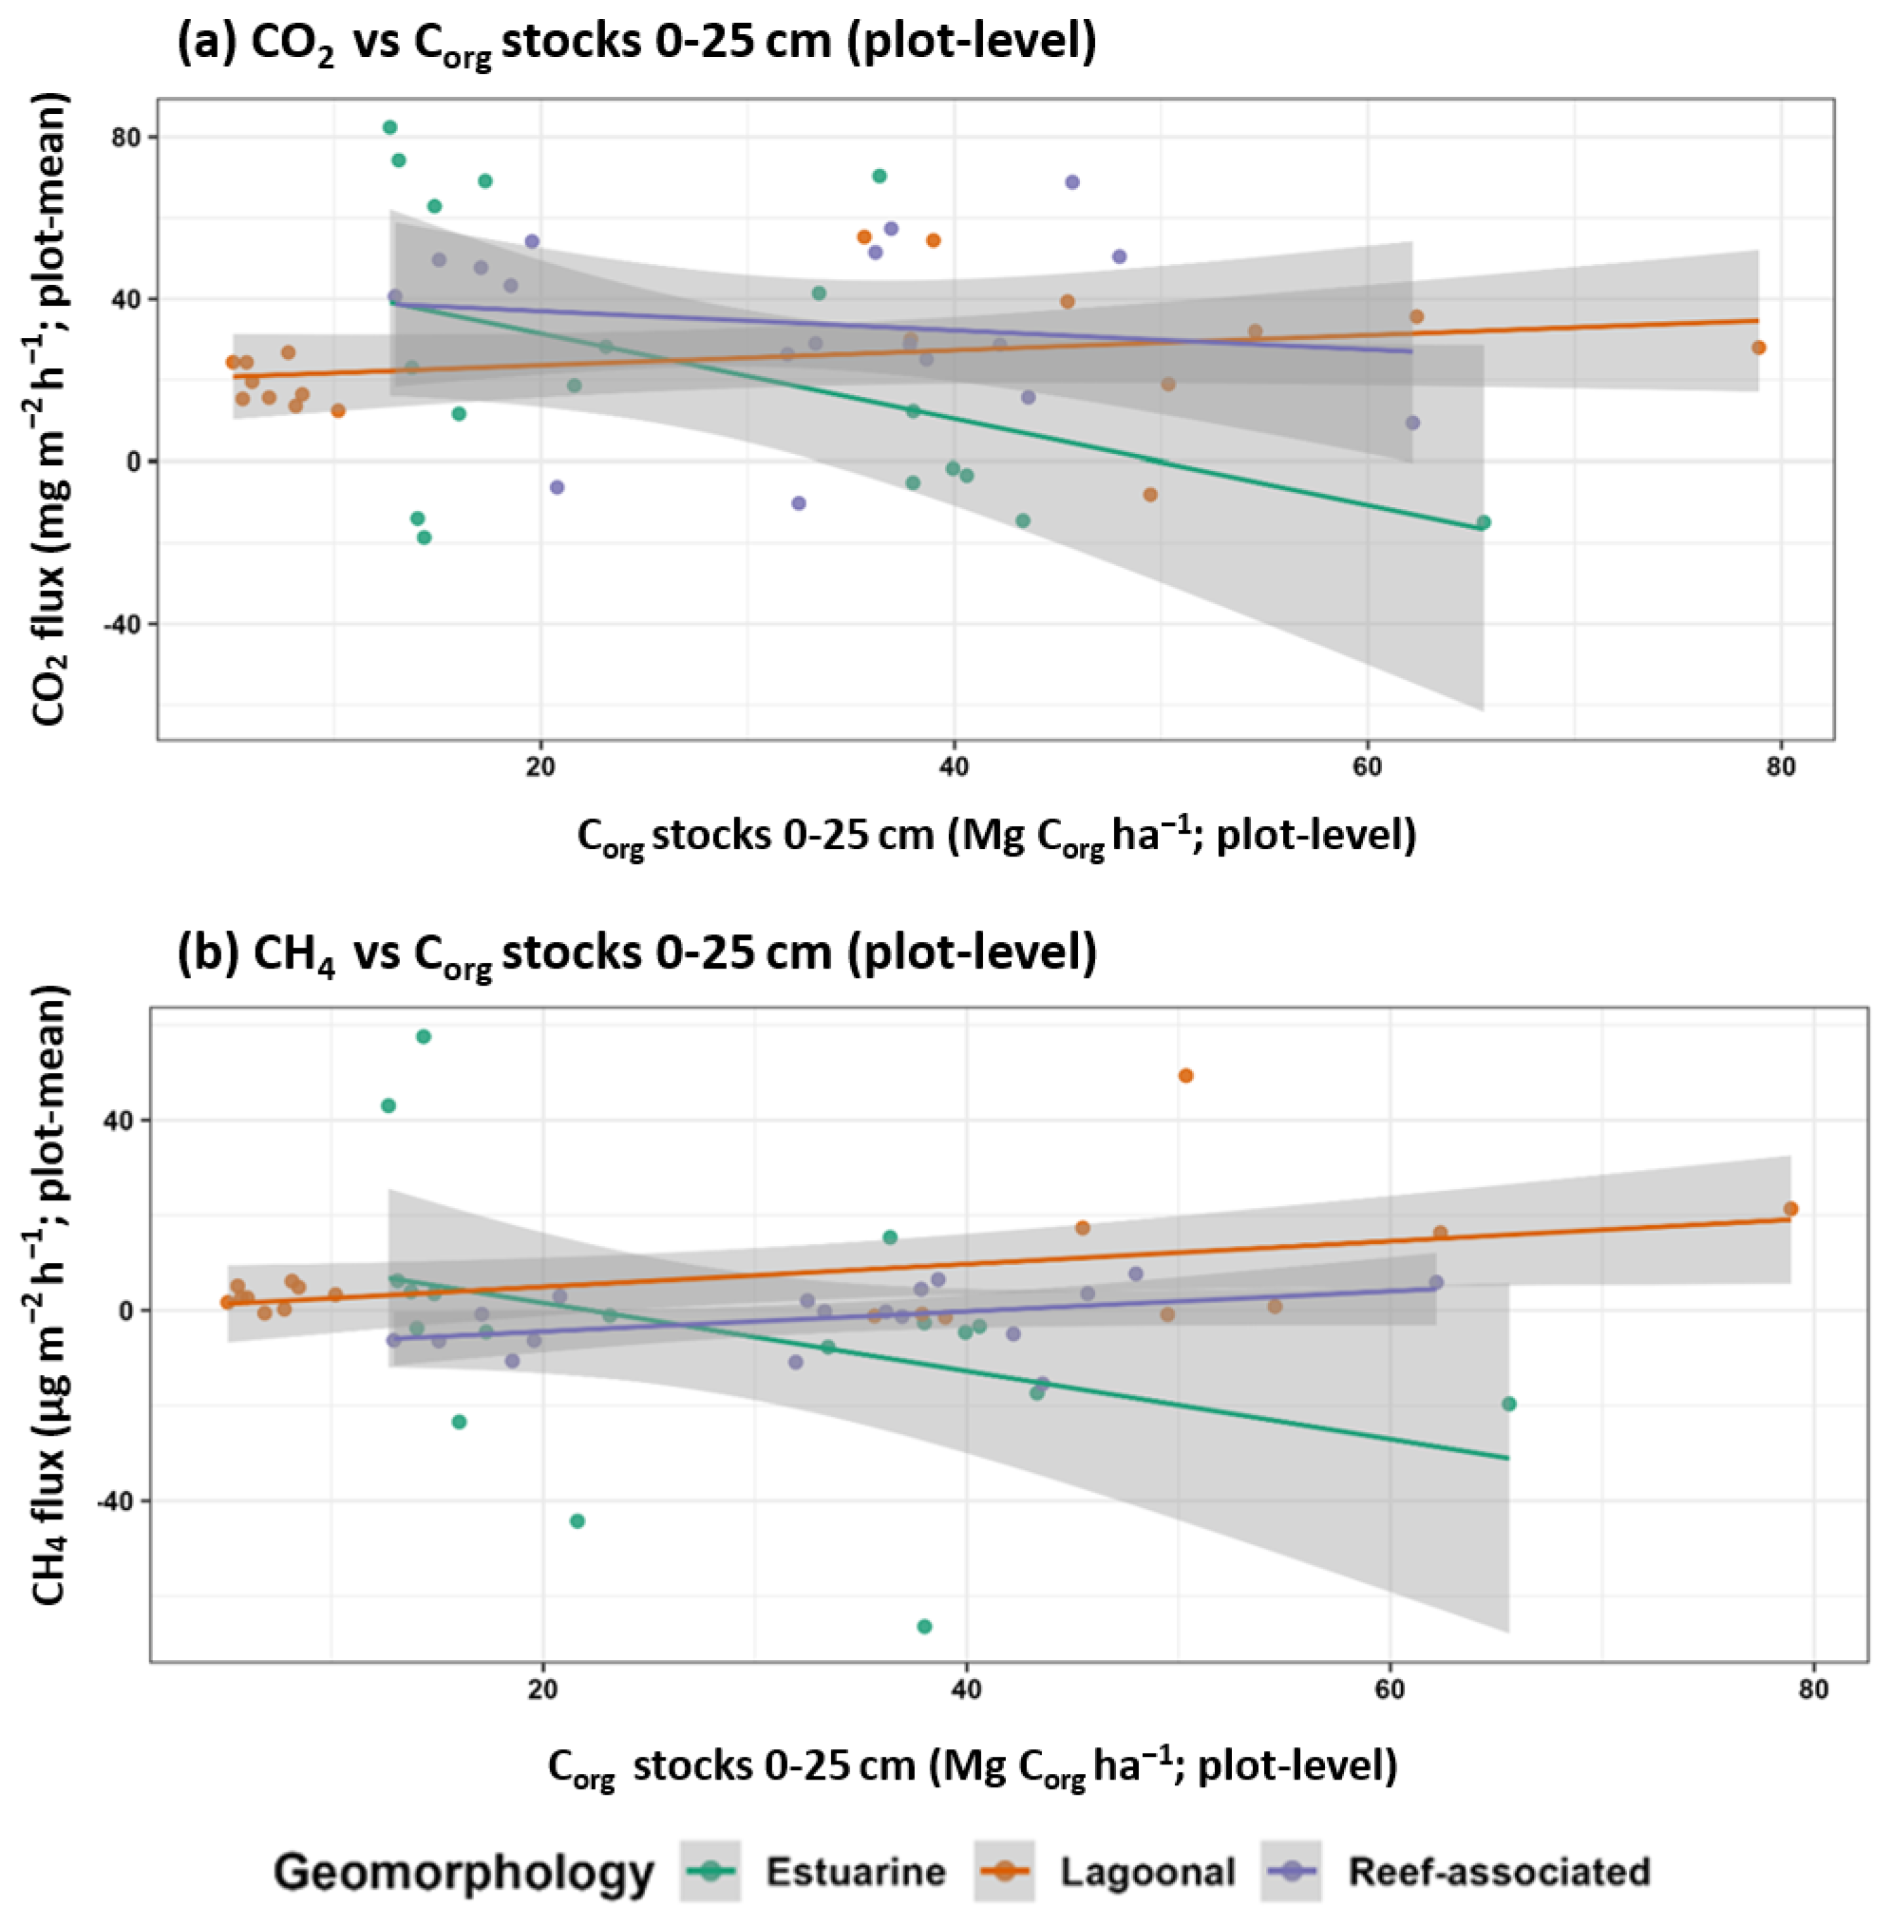
Figure 5Relationships between measured 0–25 cm Corg stocks (plot-level) and plot-mean greenhouse gas fluxes. Panel (a) shows CO2 versus 0–25 cm Corg stock; panel (b) shows CH4 versus 0–25 cm Corg stock. Points represent plots coloured by geomorphology; lines show linear fits with 95 % confidence bands. Statistical inference is based on mixed-effects models that included geomorphology as a fixed effect and a random intercept for site.
This study shows that tropical intertidal seagrass meadows in Singapore function as an important but highly spatially variable component of the coastal carbon cycle. This study quantifies near-surface (0–25 cm) soil organic carbon stocks and low-tide sediment–air CO2 and CH4 fluxes across six intertidal seagrass meadows in Singapore. Using a measured only 25 cm definition for near-surface stocks, geomorphology did not explain variation in 0–25 cm Corg stocks in mixed-effects models. Similarly, geomorphology-only models detected no setting differences in greenhouse gas fluxes (CO2 and CH4). However, in the multivariate CO2 driver model that accounted for covarying environmental conditions (including temperature, oxygen and sediment texture), geomorphology showed an overall effect by structuring environmental gradients. Estuarine meadows promoted higher respiration than lagoonal and reef-associated settings through the combined influence of finer sediment texture (% mud) and lower surface-water oxygenation. This suggests that geomorphic settings may influence CO2 flux indirectly through linked environmental gradients even when differences are not detectable in simpler setting-only tests. Our results highlight the necessity of spatially explicit carbon accounting that distinguishes between the drivers of storage and emissions to value these ecosystems in climate mitigation frameworks.
4.1 Soil carbon stocks and fluxes of tropical seagrass meadows in Singapore
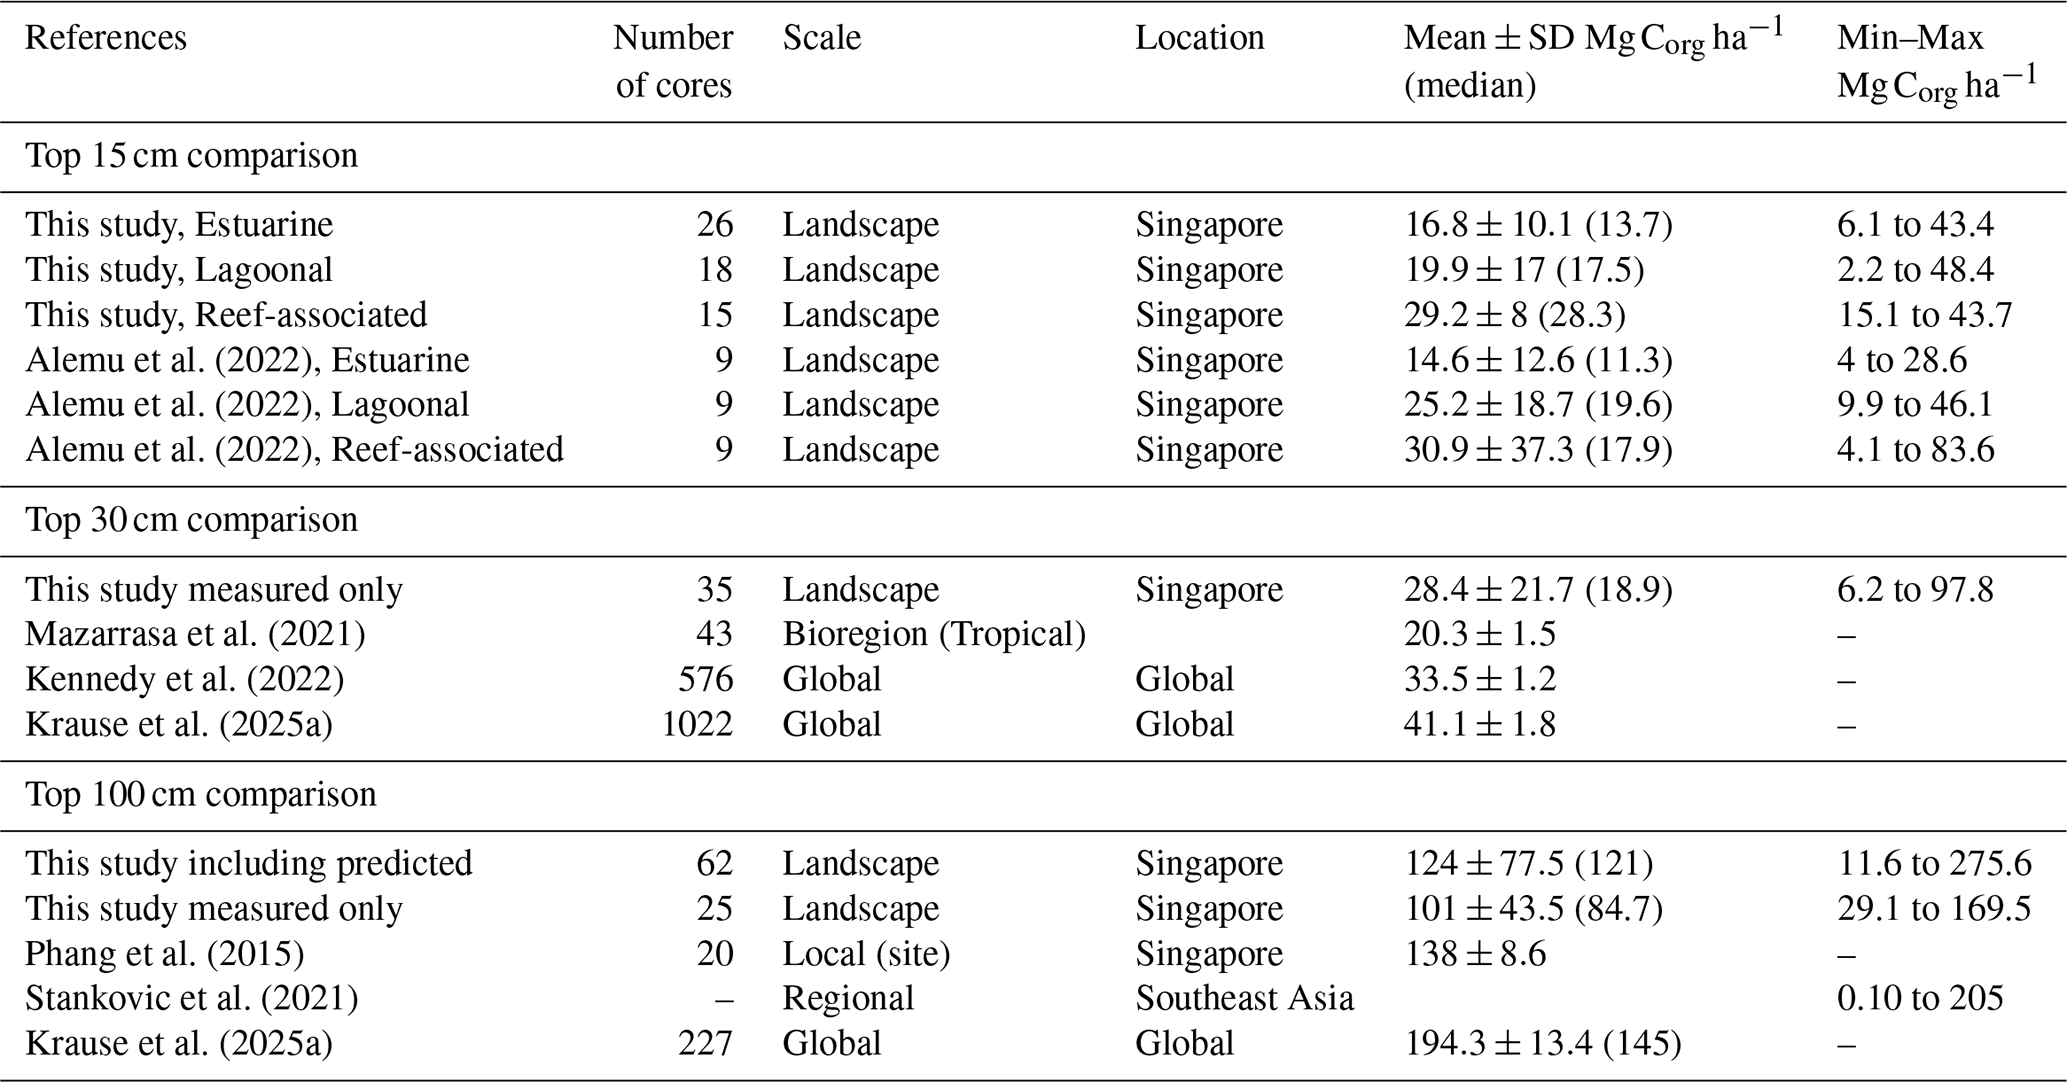
Our soil organic carbon stocks for the top 15 and 30 cm fall within the ranges reported for local and global seagrass meadows (Table 1). Although our measured 100 cm soil organic carbon stocks are almost half of those reported for global seagrass meadows, they are consistent with those reported for the Halophila genus globally (Krause et al., 2025a). These findings situate intertidal seagrass meadows of Singapore as low to moderate carbon stores. The fluxes of CO2 measured in this study are within the range of 5 to 920 , reported for seagrasses in South and Southeast Asia (Stankovic et al., 2023; Zheng et al., 2023). An important observation from this study was the presence of negative fluxes from dark chambers, which had not been reported previously for seagrasses. However, this has been observed in other coastal ecosystems and linked to the presence of microbiota that can respire in the absence of light through novel metabolic pathway. This microbiota included acetogens, chemosynthetic microbes able to sequester CO2 in dark conditions linked to chemoautotrophic pathways, in which chemolithoautotrophs and acetogens fix inorganic carbon without light via the Calvin-Benson-Bassham (CBB) and Wood–Ljungdahl pathway (Rodriguez et al., 2025). The potential presence of similar chemosynthetic microbes in the seagrass ecosystem suggests a yet unconstrained mechanism of CO2 sequestration. Plot-mean CH4 emissions averaged 0.5±18.2 (range −66.4 to 57.5 ; n=54 plots; Fig. 4), within the lower range of reported values of sediment-water and sediment-air CH4 fluxes for tropical and temperate seagrasses in the region and globally (Asplund et al., 2022; Henriksson et al., 2024; Zheng et al., 2023). The relatively low CH4 emissions in our study likely reflect active methane consumption within sediment profiles. CH4 produced in deeper anoxic zones is efficiently oxidized before reaching the atmosphere – by aerobic methanotrophs in surface oxic layers and by anaerobic methanotrophic archaea (ANME) operating in syntrophy with sulfate-reducing bacteria in anoxic sub-surface sediments (Orphan et al., 2001). These bacterial communities may consume up to 90 % of the CH4 produced in marine sediments (Reeburgh, 2007). Our findings show that tropical seagrasses are sinks or negligible sources of CH4.
Table 1Comparison of seagrass soil carbon stocks with (15, 30 and 100 cm depth measured only unless indicated) with selected local and global estimates.
4.2 Scale-dependent variability in seagrass soil carbon stocks and fluxes
Across the primary geomorphology-only models, geomorphic setting was not a significant predictor of 0–25 cm stocks or of CO2 and CH4 fluxes. In contrast, geomorphology showed an overall effect in the multivariate CO2 driver model after accounting for covariates, indicating that geomorphology may emerge through covarying environmental conditions rather than as a standalone setting effect. This indicates that, for the measured 0–25 cm stock response and the chamber fluxes analysed here, broad geomorphic classifications explain little additional variance beyond the site and within-site structure captured by the random effects. This is contrary to previous findings where geomorphic settings appeared as a strong predictor of 0–15 cm soil Corg stocks (Alemu et al., 2022), suggesting that geomorphic gradients may not be distinct enough due to the limited number of sites for each category or the influence of geomorphology may be overwhelmed by other factors. Refusal depth provides an informative indicator of sediment deposit thickness and potential capacity for deeper carbon storage. The strong geomorphology signal in refusal depth supports recommendations to report a common measured depth for primary inference in seagrass sediments and to treat deeper extrapolated estimates as sensitivity analyses. In our dataset, refusal depth patterns suggest that apparent differences in deeper (0–100 cm) stocks can partly reflect deposit thickness and sampling refusal rather than differences in near-surface carbon density alone.
Our findings highlight strong spatial variability in soil Corg stocks at the site level, which is consistent with differences in site history, disturbance, and terrestrial (allochthonous) inputs. Egale Bay, a reclaimed site with intensive recreational use, exhibited the lowest Corg stocks, whereas Tanah Merah – a sandy lagoon behind coastal revetments that receives substantial terrestrial inputs via a major drain – showed the highest Corg stocks.
High intra-site variability was likely due to site-specific patchiness in seagrass cover, species composition, and microtopography and species diversity. Seagrass species composition, cover, and canopy structure can influence sediment trapping, organic matter retention, and oxygen transport to sediments, thereby affecting both Corg storage (Kennedy et al., 2022; Krause et al., 2025b) and GHG production/oxidation. Although species traits were not explicitly modelled here, differences in meadow structure within and across sites could contribute to within-site and setting heterogeneity (Krause et al., 2025a) and should be incorporated in future trait-based blue carbon assessments. In our study, for instance, although Halophila spp. was dominant at both estuarine locations, Chek Jawa had higher diversity and Corg stocks than Changi Beach Park. Consistent with their Corg storage patterns, lagoonal and reef-associated meadows supported larger, high-biomass species (Thalassia spp. and Cymodocea spp.), contrasting with the smaller, low-biomass flora of estuarine sites (Table S4). This heterogeneity underscores the importance of adequate replication in sampling design to avoid misrepresentation of local stocks (Dahl et al., 2025). Generally, reef-associated and lagoonal meadows stored substantially more carbon than estuarine sites in the upper 15 cm soil profile (Table 1), consistent with the limited hydrodynamic energy environments of reef-associated and lagoonal meadows creating depositional conditions which favour carbon storage and retention (Kennedy et al., 2022; York et al., 2018). In contrast, estuarine meadows showed lower storage, similar to patterns reported in other estuarine meadows (Carruthers et al., 2007; Alemu et al., 2022). Despite large amounts of terrestrial runoff, site-specific exposure to strong hydrodynamic energy and sediment dynamics, such as resuspension of fine sediment, may reduce net Corg stocks in estuarine sites (Mazarrasa et al., 2023). In estuarine habitats, a balance of oceanic exchange and freshwater inflows creates a gradient in temperature, salinity and light that drives high variability in seagrass communities, which can influence intra-site Corg stocks in estuarine habitats (Carruthers et al., 2007; Alemu et al., 2022).
GHG fluxes exhibited substantial fine-scale heterogeneity. CO2 variability was distributed across plot, transect, site, and residual components, while CH4 variability was concentrated primarily at the plot scale, consistent with strong micro-scale patchiness and/or measurement-scale variability within sites. Similar to soil Corg storage, CO2 and CH4 fluxes showed limited variation across geomorphic settings at the landscape scale of Singapore, which exhibits a small spatial extent of 229.6 ha (Tan et al., 2022) thus represents an intermediate landscape scale. GHG fluxes were relatively consistent, suggesting that at intermediate landscape scales, GHG dynamics may be regulated by biogeochemical processes that are not influenced by geomorphology, geomorphic gradients may not be distinct enough at this scale, or the influence of geomorphology may be overwhelmed by other factors. Kirwan et al. (2023) proposed that fluxes are largely controlled by small-scale and short-term ecological and biogeochemical dynamics. Ecological processes such as species composition, plant productivity, electron acceptor availability and oxygen transport between soil and atmosphere can govern GHG fluxes in blue carbon ecosystems (Rosentreter et al., 2021). Our findings highlight that surface 25 cm carbon stock variability cannot be explained by geomorphic setting alone, in an intermediate landscape context and fluxes can appear similar across sites because they track production and deposition rather than long-term preservation dynamics.
4.3 Patterns and environmental controls on soil carbon stocks and fluxes
Our expanded core-level mixed model found that none of the tested sediment properties (mud fraction, bulk density) or plot-level mean environmental covariates explained site-dominated variability in 0–25 cm carbon stock. Although mud fraction is suggested as a proxy for intertidal seagrass meadows carbon stocks (Serrano et al., 2016), mud % was not a significant predictor of near-surface stocks or fluxes in our models, suggesting site-scale controls and unmeasured factors, e.g., hydrodynamic regime, deposit thickness, and species-specific traits (Kennedy et al., 2022) may be more important than within-site texture gradients in this system, rather than the within-site gradients captured by the measured physicochemical variables. In the multivariate CO2 driver model, water temperature was the only significant predictor (negative effect), while mud %, redox, salinity, and pH were not significant and dissolved oxygen was marginal. The negative temperature relationship likely reflects temperature acting as a proxy for co-varying conditions (e.g., exposure/inundation state, timing within the low-tide window, or other unmeasured gradients) rather than a simple direct respiration-temperature response. For CH4, none of the standardised predictors (including Corg %, mud %, redox, and salinity) was significant in the final driver model. These findings are consistent with previous studies where none of the potential drivers of vegetated coastal ecosystems, such as salinity, organic matter or biomass etc were associated with seagrass fluxes (Al-Haj and Fulweiler, 2020). However, we note that the absence of significant CH4–salinity or CH4–conductivity relationships must be interpreted within our sampling constraints. First, Singapore's polyhaline-to-euhaline seascape (22.4–31.3 psu) lacks the low-salinity conditions under which sulfate limitation typically enhances methanogenesis; within this narrow range, salinity exerts minimal control on CH4 dynamics. Second, driver responses operate on temporal scales distinct from snapshot spatial measurements: low-tide static chambers capture instantaneous sediment–air exchange sensitive to short-term temperature and microtopography, whereas sediment carbon accumulation and microbial community structure integrate biogeochemical processes over seasonal to decadal scales. These scale mismatches may explain why classical macro-scale predictor–response relationships were absent at our intermediate landscape scale. Nonetheless, together with the variance partitioning (dominant plot-scale variance), this supports the interpretation that CH4 fluxes in these intertidal meadows are highly heterogeneous at fine spatial scales and may require additional predictors e.g., microtopography, sulfate availability, plant traits, or episodic hydrologic forcing) and/or high-resolution temporal replication to resolve robust drivers. Overall, these findings reflect the nuanced interplay between environmental parameters and biogeochemical processes at multiple spatial scales, highlighting the importance of habitat-specific factors in controlling GHG emissions and organic carbon dynamics in tropical seagrass meadows and their implications for blue carbon budgets.
This study advances understanding of tropical seagrass carbon dynamics by quantifying soil organic carbon stocks and greenhouse gas fluxes across multiple spatial scales in Singapore. We show that 0–25 cm soil Corg stocks are highly variable but do not differ among geomorphic setting in mixed effects models. Geomorphology-only models similarly show no setting differences in CO2 or CH4 fluxes. In contrast, multivariate driver modelling indicates that CO2 flux is associated with environmental gradients, with temperature as a significant predictor and an overall geomorphology effect after accounting for covariates, whereas CH4 flux drivers were not resolved with the variables included. Refusal depth differed strongly among geomorphic settings, highlighting that sediment deposit thickness varies systematically across environments and supporting the use of common-depth primary inference alongside clearly labelled deeper sensitivity estimates. These findings underscore the importance of sampling designs and analyses that reflect nested spatial structure and of jointly considering carbon storage and greenhouse gas fluxes in robust coastal carbon accounting.
Our findings contribute critical baseline data from Southeast Asia – a region of high seagrass biodiversity but limited empirical data. They also provide a methodological framework for other small island states with comparable seascapes. Importantly, our study demonstrates that while tropical seagrasses can store substantial carbon, this ecosystem function is context-dependent, shaped by site-specific factors. Accounting for such variability is essential for robust integration of seagrasses into national and global climate strategies.
Data access can be requested from the corresponding author.
The supplement related to this article is available online at https://doi.org/10.5194/bg-23-6599-2026-supplement.
LPK and DAF, funding acquisition; NI, DAF, LPK, and KEL, conceptualising; NI, KE, MAK, SCSE and PT, sampling and laboratory analysis, NI, MAK, data analysis, NI and DAF writing the first draft, and all authors contributed to the final draft.
The contact author has declared that none of the authors has any competing interests.
Any opinions, findings and conclusions or recommendations expressed in this material are those of the authors and do not reflect the views of relevant government agencies or National University of Singapore.
Publisher's note: Copernicus Publications remains neutral with regard to jurisdictional claims made in the text, published maps, institutional affiliations, or any other geographical representation in this paper. The authors bear the ultimate responsibility for providing appropriate place names. Views expressed in the text are those of the authors and do not necessarily reflect the views of the publisher.
We thank Daisuke Taira, Jamie Yeo, Tan Zu Dienle, Pavarne Shantti Sivalingam, Hao Tang and other colleagues and volunteers from the Centre for Nature-based Climate Solutions (National University of Singapore) and the Mangrove Lab (Tulane University and National University of Singapore) for their support during the work. We thank Serena Teo and Ow Yan Xiang for comments during the development of the project.
This research was supported by Temasek and partially funded by the Marine Climate Change Science Programme, National Parks Board, Singapore (grant no. NRF-MCCS21-1-1-0001).
This paper was edited by Tyler Cyronak and reviewed by two anonymous referees.
Alemu, J. B., Yaakub, S. M., Yando, E. S., San Lau, R. Y., Lim, C. C., Puah, J. Y., and Friess, D. A.: Geomorphic gradients in shallow seagrass carbon stocks, Estuar. Coast. Shelf Sci., 265, 107681, https://doi.org/10.1016/j.ecss.2021.107681, 2022.
Al-Haj, A. N. and Fulweiler, R. W.: A synthesis of methane emissions from shallow vegetated coastal ecosystems, Glob. Change Biol., 26, 2988–3005, https://doi.org/10.1111/gcb.15046, 2020.
Asplund, M. E., Bonaglia, S., Boström, C., Dahl, M., Deyanova, D., Gagnon, K., Gullström, M., Holmer, M., and Björk, M.: Methane Emissions From Nordic Seagrass Meadow Sediments, Front. Marine Sci., 8, https://doi.org/10.3389/fmars.2021.811533, 2022.
Bates, D., Mächler, M., Bolker, B., and Walker, S.: Fitting Linear Mixed-Effects Models Using lme4, J. Stat. Softw., 67, 1–48, https://doi.org/10.18637/jss.v067.i01, 2015.
Burkholz, C., Garcias-Bonet, N., and Duarte, C. M.: Warming enhances carbon dioxide and methane fluxes from Red Sea seagrass (Halophila stipulacea) sediments, Biogeosciences, 17, 1717–1730, https://doi.org/10.5194/bg-17-1717-2020, 2020.
Capece, L. R., Griffin, A. J., Ward, M. A., Ricart, A. M., Shukla, P., Lobrutto, J., and Hill, T. M.: Multi‐Scale Variability of Blue Carbon in Seagrass Sediments From Three California Estuaries, J. Geophys. Res.-Biogeo., 130, https://doi.org/10.1029/2024jg008526, 2025.
Carruthers, T. J. B., Dennison, W. C., Kendrick, G. A., Waycott, M., Walker, D. I., and Cambridge, M. L.: Seagrasses of south–west Australia: A conceptual synthesis of the world's most diverse and extensive seagrass meadows, J. Exp. Mar. Biol. Ecol., 350, 21–45, https://doi.org/10.1016/j.jembe.2007.05.036, 2007.
Dahl, M., Lavery, P. S., Mazarrasa, I., Samper-Villarreal, J., Adame, M. F., Crooks, S., Duarte, C. M., Friess, D. A., Krause-Jensen, D., Leiva-Dueñas, C., Lovelock, C. E., Macreadie, P. I., Masqué, P., Mateo, M. A., and Serrano, O.: Recommendations for strengthening blue carbon science, One Earth, 8, https://doi.org/10.1016/j.oneear.2025.101175, 2025.
do Amaral Camara Lima, M., Bergamo, T. F., Ward, R. D., and Joyce, C. B.: A review of seagrass ecosystem services: providing nature-based solutions for a changing world, Hydrobiologia, 850, 2655–2670, https://doi.org/10.1007/s10750-023-05244-0, 2023.
Duarte, C. M., Apostolaki, E. T., Serrano, O., Steckbauer, A., and Unsworth, R. K. F.: Conserving seagrass ecosystems to meet global biodiversity and climate goals, Nat. Rev. Biodiv., 1, 150–165, https://doi.org/10.1038/s44358-025-00028-x, 2025.
Gomis, E., Strydom, S., Foster, N. R., Montemayor, D., Mateo, M. A., Serrano, E., Inostroza, K., McCallum, R., Lafratta, A., Webster, C. L., O'Dea, C. M., Said, N. E., Dunham, N., Bernasconi, R., Werner, A., Vitelli, F., Puigcorbe, V., D'Cruz, A., Salinas, C., McMahon, K. M., Hyndes, G. A., Lavery, P. S., Pessarodona, A., Duarte, C. M., and Serrano, O.: Global estimates of seagrass blue carbon stocks in biomass and net primary production, Nat. Commun., 16, 9530, https://doi.org/10.1038/s41467-025-64667-6, 2025.
Guerra-Vargas, L. A., Gillis, L. G., and Mancera-Pineda, J. E.: Stronger together: do coral reefs enhance seagrass meadows “blue carbon” potential?, Front. Marine Sci., 7, 628, https://doi.org/10.3389/fmars.2020.00628, 2020.
Halim, M., Stankovic, M., and Prathep, A.: A preliminary study of carbon dioxide and methane emissions from patchy tropical seagrass meadows in Thailand, PeerJ, 12, https://doi.org/10.7717/peerj.18087, 2024.
Henriksson, L., Yau, Y. Y. Y., Majtényi‐Hill, C., Ljungberg, W., Tomer, A. S., Zhao, S., Wang, F., Cabral, A., Asplund, M., and Santos, I. R.: Drivers of Seasonal and Diel Methane Emissions From a Seagrass Ecosystem, J. Geophys. Res.-Biogeo., 129, https://doi.org/10.1029/2024jg008079, 2024.
Howard, J., Hoyt, S., Isensee, K., Telszewski, M., and Pidgeon, E.: Coastal blue Carbon: Methods for assessing carbon stocks and emissions factors in mangroves, tidal salt marshes, and seagrasses, Conservation International, Intergovernmental Oceanographic Commission of UNESCO, International Union for Conservation of Nature, Conservation International, Intergovernmental Oceanographic Commission of UNESCO, International Union for Conservation of Nature, Virginia, USA, https://doi.org/10.2307/2674772, 2014.
Iram, N., Maher, D. T., Lovelock, C. E., Baker, T., Cadier, C., and Adame, M. F.: Climate change mitigation and improvement of water quality from the restoration of a subtropical coastal wetland, Ecol. Appl., 32, e2620, https://doi.org/10.1002/eap.2620, 2022.
Kennedy, H., Pagès, J. F., Lagomasino, D., Arias‐Ortiz, A., Colarusso, P., Fourqurean, J. W., Githaiga, M. N., Howard, J. L., Krause‐Jensen, D., Kuwae, T., Lavery, P. S., Macreadie, P. I., Marbà, N., Masqué, P., Mazarrasa, I., Miyajima, T., Serrano, O., and Duarte, C. M.: Species Traits and Geomorphic Setting as Drivers of Global Soil Carbon Stocks in Seagrass Meadows, Global Biogeochem. Cy., 36, https://doi.org/10.1029/2022gb007481, 2022.
Kirwan, M. L., Megonigal, J. P., Noyce, G. L., and Smith, A. J.: Geomorphic and ecological constraints on the coastal carbon sink, Nat. Rev. Earth Environ., 4, 393–406, https://doi.org/10.1038/s43017-023-00429-6, 2023.
Krause, J. R., Cameron, C., Arias-Ortiz, A., Cifuentes-Jara, M., Crooks, S., Dahl, M., Friess, D. A., Kennedy, H., Lim, K. E., Lovelock, C. E., Marba, N., McGlathery, K. J., Oreska, M. P. J., Pidgeon, E., Serrano, O., Vanderklift, M. A., Wong, L. W., Yaakub, S. M., and Fourqurean, J. W.: Global seagrass carbon stock variability and emissions from seagrass loss, Nat. Commun., 16, 3798, https://doi.org/10.1038/s41467-025-59204-4, 2025a.
Krause, J. R., Chroeng, C., Glue, M., Mesa, L., Ngoun, T., Tak, C., Bayley, D. T. I., and Fourqurean, J. W.: The influence of seagrass traits and environmental controls on soil organic carbon stocks in Chrouy Pros Bay, Cambodia, Sci. Total Environ., 993, 180000, https://doi.org/10.1016/j.scitotenv.2025.180000, 2025b.
Kuznetsova, A., Brockhoff, P. B., and Christensen, R. H. B.: lmerTest Package: Tests in Linear Mixed Effects Models, J. Stat. Softw., 82, 1–26, https://doi.org/10.18637/jss.v082.i13, 2017.
Lavery, P. S., Mateo, M.-Á., Serrano, O., and Rozaimi, M.: Variability in the carbon storage of seagrass habitats and its implications for global estimates of blue carbon ecosystem service, PloS one, 8, e73748, https://doi.org/10.1371/journal.pone.0073748, 2013.
Lenth, R. V. and Piaskowski, J.: emmeans: Estimated Marginal Means, aka Least-Squares Means, CRAN [code], https://doi.org/10.32614/CRAN.package.emmeans, 2026.
Macreadie, P. I., Costa, M. D. P., Atwood, T. B., Friess, D. A., Kelleway, J. J., Kennedy, H., Lovelock, C. E., Serrano, O., and Duarte, C. M.: Blue carbon as a natural climate solution, Nat. Rev. Earth Environ., 2, 826–839, https://doi.org/10.1038/s43017-021-00224-1, 2021.
Mazarrasa, I., Lavery, P., Duarte, C. M., Lafratta, A., Lovelock, C. E., Macreadie, P. I., Samper‐Villarreal, J., Salinas, C., Sanders, C. J., Trevathan‐Tackett, S., Young, M., Steven, A., and Serrano, O.: Factors Determining Seagrass Blue Carbon Across Bioregions and Geomorphologies, Global Biogeochem. Cy., 35, https://doi.org/10.1029/2021gb006935, 2021.
Mazarrasa, I., Neto, J. M., Bouma, T. J., Grandjean, T., Garcia-Orellana, J., Masque, P., Recio, M., Serrano, O., Puente, A., and Juanes, J. A.: Drivers of variability in Blue Carbon stocks and burial rates across European estuarine habitats, Sci. Total Environ. 886, 163957, https://doi.org/10.1016/j.scitotenv.2023.163957, 2023.
McKenzie, L. J., Yaakub, S. M., and Yoshida, R. L.: Seagrass habitats of Singapore: environmental drivers and key processes, Raffles B. Zool., https://www.weather.gov.sg/climate-annual-climate-reports/ (last access: 24 November 2025), 2016.
Meteorological Service Singapore: 2024 Annual Climate Assessment Report, Meteorological Service Singapore, https://www.weather.gov.sg/climate-annual-climate-reports/ (last access: 24 November 2025), 2024.
Miyajima, T., Hori, M., Hamaguchi, M., Shimabukuro, H., Adachi, H., Yamano, H., and Nakaoka, M.: Geographic variability in organic carbon stock and accumulation rate in sediments of East and Southeast Asian seagrass meadows, Global Biogeochem. Cy., 29, 397–415, https://doi.org/10.1002/2014gb004979, 2015.
Ndhlovu, A., Adams, J. B., and Von der Heyden, S.: Large-scale environmental signals in seagrass blue carbon stocks are hidden by high variability at local scales, Sci. Total Environ., 921, 170917, https://doi.org/10.1016/j.scitotenv.2024.170917, 2024.
Neubauer, S. C. and Megonigal, J. P.: Moving beyond global warming potentials to quantify the climatic role of ecosystems, Ecosystems, 18, 1000–1013, 2015.
Orphan, V. J., Hinrichs, K.-U., Ussler III, W., Paull, C. K., Taylor, L., Sylva, S. P., Hayes, J. M., and DeLong, E. F.: Comparative analysis of methane-oxidizing archaea and sulfate-reducing bacteria in anoxic marine sediments, Appl. Environ. Microbiol., 67, 1922–1934, 2001.
Phang, V. X. H., Chou, L. M., and Friess, D. A.: Ecosystem carbon stocks across a tropical intertidal habitat mosaic of mangrove forest, seagrass meadow, mudflat and sandbar, Earth Surf. Process. Land., 40, 1387–1400, https://doi.org/10.1002/esp.3745, 2015.
R Core Team: R: A Language and Environment for Statistical Computing, R Foundation for Statistical Computing, Vienna, Austria, https://www.R-project.org (last access: 18 September 2026), 2026.
Reeburgh, W. S.: Oceanic methane biogeochemistry, Chem. Rev., 107, 486–513, 2007.
Ricart, A. M., York, P. H., Bryant, C. V., Rasheed, M. A., Ierodiaconou, D., and Macreadie, P. I.: High variability of Blue Carbon storage in seagrass meadows at the estuary scale, Sci. Rep., 10, 5865, https://doi.org/10.1038/s41598-020-62639-y, 2020.
Rodriguez, K., Ricci, F., Ni, G., Iram, N., Palfreyman, R., Gonzalez-Garcia, R. A., Heffernan, J., Greening, C., Adame, M. F., and Marcellin, E.: Abundant and active acetogens enhance the carbon dioxide sink of Blue Carbon ecosystems, Microbiome, 13, 207, https://doi.org/10.1186/s40168-025-02209-4, 2025.
Rosentreter, J. A., Al-Haj, A. N., Fulweiler, R. W., and Williamson, P.: Methane and Nitrous Oxide Emissions Complicate Coastal Blue Carbon Assessments, Global Biogeochem. Cy., 35, https://doi.org/10.1029/2020GB006858, 2021.
Serrano, O., Lavery, P. S., Duarte, C. M., Kendrick, G. A., Calafat, A., York, P. H., Steven, A., and Macreadie, P. I.: Can mud (silt and clay) concentration be used to predict soil organic carbon content within seagrass ecosystems?, Biogeosciences, 13, 4915–4926, https://doi.org/10.5194/bg-13-4915-2016, 2016.
Serrano, O., Lovelock, C. E., Atwood, B. T., Macreadie, P. I., Canto, R., Phinn, S., Arias-Ortiz, A., Bai, L., Baldock, J., Bedulli, C., Carnell, P., Connolly, R. M., Donaldson, P., Esteban, A., Ewers Lewis, C. J., Eyre, B. D., Hayes, M. A., Horwitz, P., Hutley, L. B., Kavazos, C. R. J., Kelleway, J. J., Kendrick, G. A., Kilminster, K., Lafratta, A., Lee, S., Lavery, P. S., Maher, D. T., Marbà, N., Masque, P., Mateo, M. A., Mount, R., Ralph, P. J., Roelfsema, C., Rozaimi, M., Ruhon, R., Salinas, C., Samper-Villarreal, J., Sanderman, J., J. Sanders, C., Santos, I., Sharples, C., Steven, A. D. L., Cannard, T., Trevathan-Tackett, S. M., and Duarte, C. M.: Australian vegetated coastal ecosystems as global hotspots for climate change mitigation, Nat. Commun., 10, https://doi.org/10.1038/s41467-019-12176-8, 2019.
Stankovic, M., Ambo-Rappe, R., Carly, F., Dangan-Galon, F., Fortes, M. D., Hossain, M. S., Kiswara, W., Van Luong, C., Minh-Thu, P., Mishra, A. K., Noiraksar, T., Nurdin, N., Panyawai, J., Rattanachot, E., Rozaimi, M., Soe Htun, U., and Prathep, A.: Quantification of blue carbon in seagrass ecosystems of Southeast Asia and their potential for climate change mitigation, Sci. Total Environ., 783, 146858, https://doi.org/10.1016/j.scitotenv.2021.146858, 2021.
Stankovic, M., Mishra, A. K., Rahayu, Y. P., Lefcheck, J., Murdiyarso, D., Friess, D. A., Corkalo, M., Vukovic, T., Vanderklift, M. A., Farooq, S. H., Gaitan-Espitia, J. D., and Prathep, A.: Blue carbon assessments of seagrass and mangrove ecosystems in South and Southeast Asia: Current progress and knowledge gaps, Sci. Total Environ., 904, 166618, https://doi.org/10.1016/j.scitotenv.2023.166618, 2023.
Tan, Y. H. J., Tham, J. K. Q., Paul, A., Rana, U., Ang, H. P., Nguyen, N. T. H., Yee, A. T. K., Leong, B. P. I., Drummond, S., and Tun, K. P. P.: Remote sensing mapping of the regeneration of coastal natural habitats in Singapore: Implications for marine conservation in tropical cities, Singapore Journal of Tropical Geography, 44, 130–148, https://doi.org/10.1111/sjtg.12454, 2022.
Unsworth, R. K. F., Cullen-Unsworth, L. C., Jones, B. L. H., and Lilley, R. J.: The planetary role of seagrass conservation, Science, 377, 609–613, https://doi.org/10.1126/science.abq6923, 2022.
Williamson, P., Gattuso, J.-P., and Pearce, C. R.: Carbon Removal Using Coastal Blue Carbon Ecosystems Is Uncertain and Unreliable , With Questionable Climatic Cost-Effectiveness, Front. Climate, 4, 1–14, https://doi.org/10.3389/fclim.2022.853666, 2022.
York, P. H., Macreadie, P. I., and Rasheed, M. A.: Blue Carbon stocks of Great Barrier Reef deep-water seagrasses, Biol. Lett., 14, 20180529, https://doi.org/10.1098/rsbl.2018.0529, 2018.
Zheng, P., Chen, G., Lan, W., Li, S., Li, M., Chen, S., An, W., Chen, J., Yu, S., and Chen, B.: Determining effect of seagrass-mediated CO2 flux on the atmospheric cooling potential of a subtropical intertidal seagrass meadow, Marine Pollut. Bull., 188, 114676, https://doi.org/10.1016/j.marpolbul.2023.114676, 2023.