
the Creative Commons Attribution 4.0 License.
the Creative Commons Attribution 4.0 License.
 | 15 Oct 2026
Norway spruce shows stronger growth sensitivity and weaker intrinsic water-use efficiency response than Scots pine under increasing water limitation in southern Finland

Eduardo Martínez-García
Helena Haakana
Juha Heikkinen
Katja T. Rinne-Garmston
Petri Kilpeläinen
Giles Young
Elina Sahlstedt
Raisa Mäkipää
Aleksi Lehtonen
Boreal forests, essential for carbon sequestration and multiple ecosystem services, are increasingly threatened by climate-induced water stress. This study investigates how increasing water limitation affects growth and intrinsic water-use efficiency (iWUE) in Scots pine (Pinus sylvestris L.) and Norway spruce (Picea abies (L.) Karst) in southern Finland from 1990 to 2022. Tree-ring data on basal area increment (BAI) and carbon isotope discrimination (Δ13C) were collected from three sites per species, with Scots pine on mineral soils and Norway spruce on organic soils and under contrasting soil moisture conditions. The tree-ring records were combined with regional growth indices (GIs) from the Finnish National Forest Inventory (NFI) to enable broader inference across soil types. Our results indicate that water limitation intensified over the past decade, with pronounced growth declines after 2016 in Norway spruce, while Scots pine exhibited smaller reductions, evident at the site level from around 2009 but not resolved in the regional GI. Δ13C analyses indicated increased stomatal regulation in Scots pine and more limited physiological adjustment in Norway spruce after 2016, consistent with rising atmospheric moisture demand. Accordingly, iWUE increased more strongly in Scots pine, whereas Norway spruce showed only modest changes despite a substantial growth decline. Interannual variability in growth and iWUE was related both to vapour pressure deficit (VPD) and to the summer water balance, but their relative importance differed between species: VPD had the larger effect per standard deviation in Scots pine, whereas Norway spruce responded to atmospheric demand and to the summer water balance to a similar degree. In Norway spruce, growth after 2016 was significantly constrained by VPD, whereas Scots pine showed comparatively buffered growth responses and stronger increases in iWUE. Soil-type effects were generally weak at the regional scale, but clearer patterns emerged along local moisture conditions. At the site level, both species tended to show greater negative post-change growth under drier conditions; however, Scots pine maintained higher mean growth on wetter sites, whereas Norway spruce showed higher mean growth under drier conditions. These contrasting growth–physiology responses indicate species-specific strategies in coping with increasing water limitation, with Norway spruce showing greater growth sensitivity and more limited physiological adjustment than Scots pine. Overall, boreal forest responses to drought appear to be structured primarily by species-specific physiological strategies, while being further modulated by local hydrological conditions. Accounting for both species differences and fine-scale variation in moisture availability will be critical for sustaining forest productivity and resilience under increasingly warm and water-limited climates in northern Europe, underscoring the need for site-adapted management that integrates species selection with local soil and moisture conditions.
- Article
(4839 KB) - Full-text XML
-
Supplement
(3991 KB) - BibTeX
- EndNote


Boreal forests cover approximately one-third of the global forest area and play a crucial role in maintaining ecosystem services and acting as significant carbon sinks (Bonan, 2008; Bradshaw et al., 2009; Gauthier et al., 2015; Pan et al., 2011; Tagesson et al., 2020). However, rising temperatures and atmospheric water demand increasingly threaten forest health by reducing tree growth and weakening the forest carbon sink, increasing susceptibility to pests and diseases, and elevating mortality rates (Allen et al., 2010; Girardin et al., 2016; IPCC, 2023; Junttila et al., 2024; Linnakoski et al., 2017a, b; Martínez-García et al., 2024; Seidl et al., 2017; Zhang et al., 2024). Increasing water limitation has therefore emerged as an important driver of forest growth decline in the boreal region over recent decades (Gao et al., 2016; Gutierrez Lopez et al., 2021; Treydte et al., 2023). However, the effects of climate on species-specific growth and water-use regulation remain unclear.
Drought events have increased in frequency, duration, and intensity across Europe (Gutierrez Lopez et al., 2021; Knutzen et al., 2025; Lehtonen and Pirinen, 2019), with pronounced impacts emerging across the boreal region (Gao et al., 2016; Schär et al., 2004; Schuldt et al., 2020). These droughts, often coinciding with elevated air temperatures (Ta), increased vapour pressure deficit (VPD), and reduced soil moisture, are expected to become more frequent under continued warming (Gao et al., 2016; Swain et al., 2025). In southern Finland, characterized by cool and moist growing conditions, the recent rise in summer Ta has led to elevated atmospheric water demand, which amplifies vegetation water stress (Grossiord et al., 2020; Novick et al., 2024; Treydte et al., 2023). Although summer precipitation has shown a modest upward trend in parts of this boreal zone, these gains are minor relative to increasing evaporative demand (Grossiord et al., 2020; Irannezhad et al., 2014). Recent eddy-covariance evidence indicates that atmospheric drought has become more frequent across northern Europe and constrains ecosystem carbon uptake over a broad range of conditions, whereas strong soil-moisture limitation remains comparatively rare and spatially localized (Peltola et al., 2026) and the strongest reductions in carbon uptake occur when atmospheric and soil drought coincide.
In southern Finland, records from the 13th Finnish National Forest Inventory (NFI-13) have documented declines in tree growth, increased canopy dieback, and elevated mortality over the past decade, consistent with increasing water limitation. The two dominant tree species, Scots pine (Pinus sylvestris L.) and Norway spruce (Picea abies (L.) Karst.), which account for approximately 40 % and 38 % of the total stem volume, respectively, have both grown below expected trajectories, with Norway spruce exhibiting larger negative deviations (Mäkinen et al., 2022; Henttonen et al., 2024; Junttila et al., 2024; Korhonen et al., 2024; Fig. S1 in the Supplement). However, despite recent advances in identifying climatic drivers of growth decline (Laudon et al., 2024; Lee et al., 2026), important uncertainties remain regarding the extent to which species-specific physiological responses mediate these patterns. Addressing this gap requires integrated analyses of growth and physiology at both regional and site scales.
Species-specific traits shape forest responses to water limitation and warming, with consequences for forest composition and resilience (Anderegg et al., 2018). In boreal forests, Scots pine and Norway spruce exhibit distinct physiological and water-use strategies under varying water limitations, reflecting their respective strategies for coping with drought (Levesque et al., 2013; Oren et al., 1999). Norway spruce generally has a shallower and less plastic root system than Scots pine, increasing its sensitivity to short-term variation in water supply (Kalliokoski et al., 2008; Schmid and Kazda, 2002). Scots pine also generally has greater photosynthetic capacity (Thum et al., 2008) and stronger stomatal sensitivity to increasing VPD than Norway spruce (Lagergren and Lindroth, 2002). Under frequent high-VPD conditions, weaker stomatal down-regulation in spruce can lead to increased water loss, lower leaf water potentials, slower cell expansion, and heightened hydraulic risk when water supply is limited (Arend et al., 2021). These differences align with observed patterns of lower drought tolerance in spruce, often seen as more substantial growth reductions under water limitation (Motte et al., 2023; Ulrich and Grossiord, 2023). Resolving these species-specific sensitivities is critical for anticipating changes in boreal forest composition and guiding adaptive management.
Intrinsic water-use efficiency (iWUE), defined as the ratio of net photosynthetic rate (A) to stomatal conductance (gs), reflects a species' ability to balance carbon gain and water loss (Farquhar et al., 1989b; Seibt et al., 2008). Differences in iWUE among species can signal variations in stomatal control, photosynthetic capacity, and water-use strategies, thereby affecting competitive interactions and influencing forest structure and dynamics (Ainsworth and Rogers, 2007; Anderegg et al., 2018). For instance, increases in iWUE above the expected increase due to increasing atmospheric CO2 generally indicate stronger stomatal regulation in response to water stress (Farquhar et al., 1982, 1989a; Kannenberg et al., 2021; Saurer et al., 2004; Szejner et al., 2018; Voelker et al., 2016). iWUE is closely related to δ13C because photosynthetic carbon isotope discrimination (Δ13C) primarily reflects the ratio of internal-to-ambient CO2 concentrations (). Since A can be expressed as the product of gs and the CO2 gradient (ca−ci), iWUE increases as decreases, leading to reduced Δ13C values. In some cases, tree species may exhibit long-term stable iWUE, reflected by a consistent increase in Δ13C associated with a proportional increase in () under increasing ca (Belmecheri et al., 2021; Guerrieri et al., 2019; Saurer et al., 2004; Voelker et al., 2016). Forest management such as thinning and fertilization can influence iWUE by enhancing photosynthetic capacity and resource availability, often resulting in increased A and higher iWUE (Brooks and Mitchell, 2011; Lehtonen et al., 2023a; Palvi et al., 2025). However, increasing iWUE does not always correspond to increased tree growth or productivity, particularly in unmanaged forests where other limiting factors may prevail (Andreu-Hayles et al., 2011; Battipaglia et al., 2013; Kannenberg et al., 2022; Walker et al., 2020).
Tree responses to water limitation can differ between organic and mineral soils due to differences in water-holding capacity, aeration, and nutrient supply. Specifically, in organic peat soils, high water retention but low oxygen in the rooting zone constrains root function. Lowering of the water table (WT) through drainage can improve aeration and promote growth, but may increase drought exposure if the WT declines too deeply (Hökkä et al., 2025; Sikström and Hökkä, 2016). In peatlands, fine-root production is concentrated in the upper 20 cm, making trees particularly sensitive to WT declines during dry periods (He et al., 2023). This effect may be more significant in well-drained peatlands, where lower WT levels can more readily induce drought stress. In contrast, mineral soils typically drain faster and retain less water than organic soils, causing surface layers to dry rapidly during warm summers, though deeper rooting is possible where soil structure and oxygen availability permit (Heiskanen and Mäkitalo, 2002; Schenk and Jackson, 2002). Topography further modulates these patterns observed in mineral soils. In particular, lowlands tend to retain moisture and risk waterlogging, whereas uplands dry more quickly and face higher evaporative demand, creating microclimatic conditions that influence tree species performance (Kemppinen et al., 2023; McNichol et al., 2024). Understanding these tree-soil interactions is essential for assessing drought sensitivity and developing targeted forest management strategies.
Southern Finland is among the regions of the country most vulnerable to increasing water limitation (Lee et al., 2026; Lehtonen and Pirinen, 2019; Fig. 1). Here, we investigate how increasing water limitations influence growth and iWUE of Scots pine and Norway spruce across mineral and organic soils under contrasting water-availability conditions in this region. To address this, we integrated site-level tree-ring analyses of basal area increment (BAI), Δ13C, and iWUE with regional growth indices (GIs) derived from the Finnish NFI data spanning 1990–2022. We related these growth and physiological responses to Ta, VPD, and Standardized Precipitation-Evapotranspiration Index (SPEI; Vicente-Serrano et al., 2010) using statistical models. We hypothesize that: (i) Recent tree growth decline is primarily driven by increasing water limitation, with stronger effects in Norway spruce. (ii) Scots pine and Norway spruce exhibit divergent iWUE responses to increasing atmospheric demand and water stress, reflecting species-specific strategies for coping with hydrological change. (iii) Tree growth and physiological responses differ between mineral and organic soils due to contrasting water availability, aeration, and nutrient dynamics.
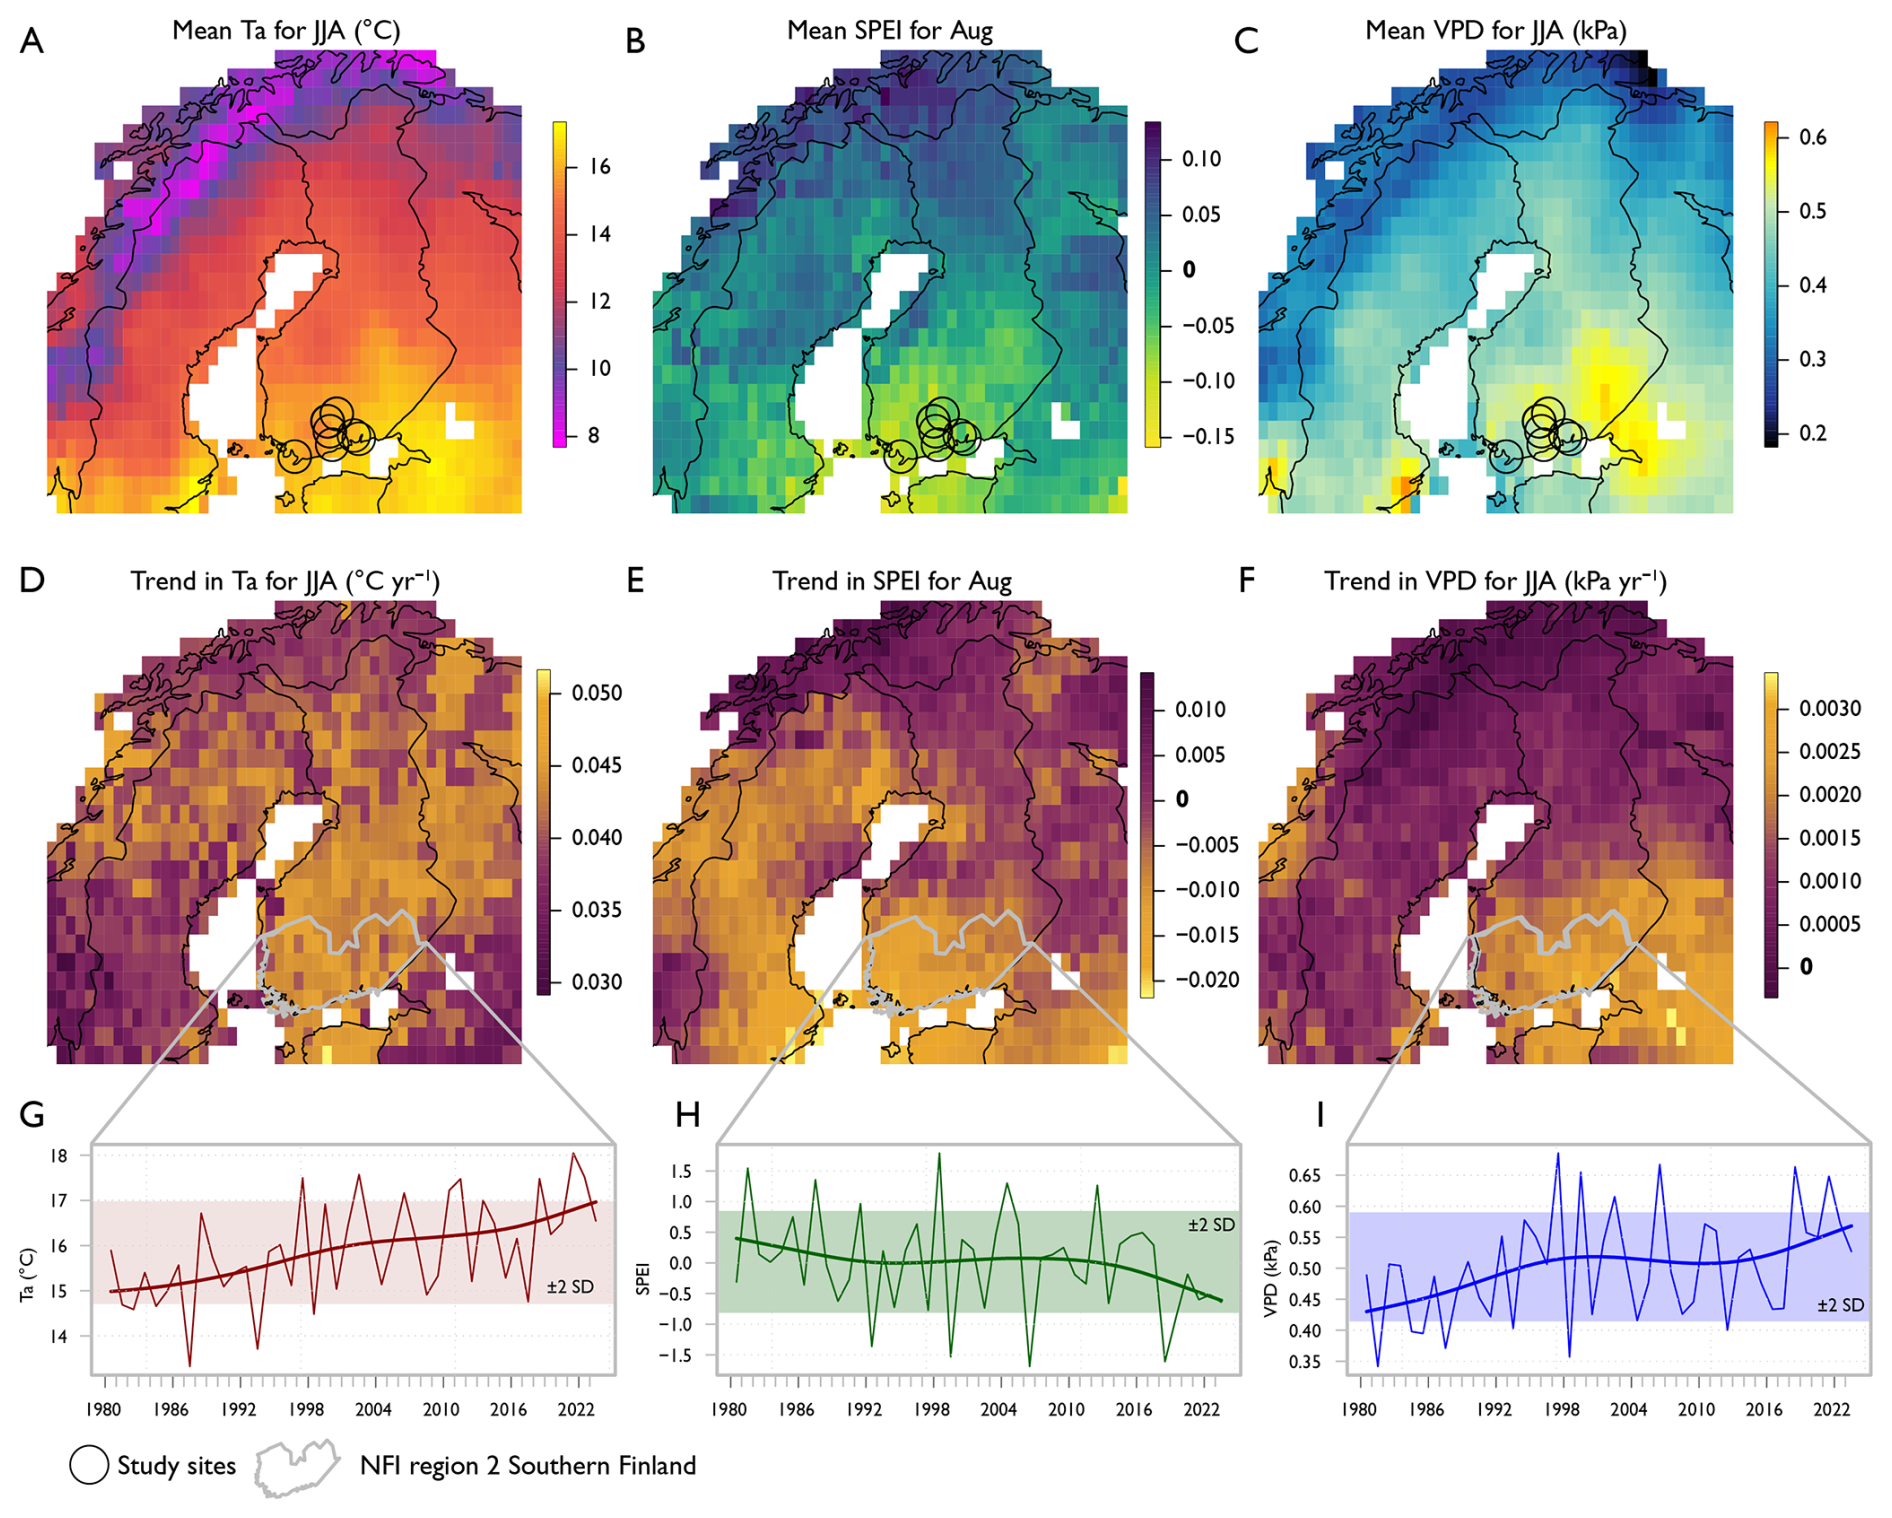
Figure 1Regional climate and multi-decadal trends in southern Finland. Data based on CRU TS data (version 4.08) for the period 1980–2023. Panels show (A) mean summer temperature (Ta) for June–August (JJA), (B) mean August standardized precipitation–evapotranspiration index (SPEI), (C) mean JJA vapor pressure deficit (VPD), (D–F) Mann-Kendall trends in JJA Ta (°C yr−1), August SPEI (unitless yr−1), and JJA VPD (kPa yr−1), respectively. Circles in panels (A)–(C) show the location of the study sites, while the polygon outlines in panels (D)–(F) corresponds to the southern Finland region as defined by the Finnish NFI. Panels (G)–(I) show the regional averaged time series (1980–2023) of Ta, SPEI, and VPD, with 30-year spline curves and the shaded area shows two standard deviations around the period mean.
Our specific research questions were: (1) How has increasing water limitation affected regional growth trends of Scots pine and Norway spruce on mineral and organic soils in southern Finland over recent decades? (2) What are the species-specific physiological responses of Scots pine and Norway spruce to contrasting soil water availability conditions in this region? (3) How do Ta, VPD, and SPEI relate to growth (BAI) and physiological traits (Δ13C, iWUE) in these species in southern Finland?
2.1 Study area
2.1.1 Land and forest cover
This study was conducted in Southern Finland (Fig. 1). This region includes 9 provinces (Uusimaa, Southwest Finland, Satakunta, Kanta-Häme, Pirkanmaa, Päijät-Häme, Kymenlaakso, South Karelia, and South Savo) covering an area of 75 222 km2. According to data from the 13th Finnish National Forest Inventory (NFI-13, 2019–2023) (Korhonen et al., 2024), 53 073 km2 (71 %) of the total region area is forestry land. This land is primarily privately owned and managed, with stands dominated by Scots pine (49 %) and Norway spruce (36 %). These tree species play a crucial role in both ecological functions and as a source of raw material for the forestry sector (Henttonen et al., 2024). Notably, on mineral soils, Scots pine dominated forests cover a larger area than those dominated by Norway spruce (20 558 versus 16 137 km2) (Korhonen et al., 2024). In contrast, on organic soils, Norway spruce dominated forests are more prevalent, covering 5298 km2, compared to 4694 km2 for Scots pine dominated forests. It is important to note that a significant proportion of the organic soils with Norway spruce and Scots pine have been drained (47 % and 85 %, respectively).
2.1.2 Regional climate
The 0.5° gridded Climatic Research Unit (CRU) Time-series (TS) data version 4.08 monthly data (Harris et al., 2020) for air temperature (Ta, °C), precipitation (P, mm), vapor pressure (VPair, in kPa), and monthly average of potential evapotranspiration (PET, mm d−1) over the period 1990–2023 was obtained using the Climate Explorer of the Royal Netherlands Meteorological Institute (KNMI) (Trouet and van Oldenborgh, 2013). Vapor pressure deficit (VPD, kPa) was estimated using Eq. (1).
Where the expression in parentheses corresponds to saturation vapor pressure (VPsat, kPa) estimated from Ta.
The PET was converted to mm per month to compute the water balance needed for the estimation of the SPEI. The water balance was computed as the difference between monthly precipitation and monthly PET. A 3-month SPEI was then computed from the water balance time series using the R package SPEI (Vicente-Serrano et al., 2010). The 3-month SPEI was selected because it captures short to medium term moisture variability relevant to tree physiological processes during the growing season. Data processing was performed in R software using the ncdf4 package for handling NetCDF data.
In this study, we selected Ta, VPD, and SPEI to represent thermal conditions, atmospheric water demand, and climatic water balance, respectively (Babst et al., 2019; Girardin et al., 2016). Ta was retained for descriptive and correlation analyses but excluded from the mixed models because of its high collinearity with VPD. The spatial distribution of Ta, SPEI, and VPD across southern Finland, along with their long-term temporal trends, reveals temperature increases of up to 0.05 °C yr−1 in certain areas (Fig. 1D, G). Concurrently, the negative trend in SPEI indicates a decline in water availability (Fig. 1E, H). In addition, VPD exhibits a similar upward trend, reflecting increased atmospheric water demand (Fig. 1F, I).
2.2 Finnish National Forest Inventory data
GIs data were used to provide a broader regional context and validate site-specific observations. The GI describes the annual variation in tree growth that is not driven by time-dependent tree or stand factors, but by environmental variability, such as climate fluctuations (Henttonen, 2000). In practice, size- and age-related growth trends and other long-term developmental changes are removed by standardizing the tree growth time series. Consequently, fluctuations in the GI reflect year-to-year variation in temperature, precipitation, soil moisture, and other environmental factors rather than intrinsic growth trends associated with stand development. An annual GI value is typically expressed as a relative deviation from the long-term average of the annual GIs, which is set at a value of 100 (Henttonen, 2000).
In this study, we estimated GIs for the period 1990–2022 separately for Scots pine and Norway spruce growing on mineral and drained organic soils in Southern Finland. Specifically, the estimation of these GIs was based on sample plot data from five consecutive Finnish NFIs, covering the period from the 9th NFI (NFI-9, 1996–2003) to the 13th NFI (NFI-13, 2019–2023). The data selection focused on southern Finland, comprising the southernmost sampling area in NFI (Korhonen et al., 2021, 2024; Tomppo et al., 2011). Radial increments, measured from tree ring increment cores from NFI temporary sample plots, were used in the GI estimation. Tree-ring cores were collected at breast height (1.3 m above the ground), and the ring widths from these samples were measured in the laboratory. Data were limited to trees from the dominant crown layer. To avoid confounding effects of forest management, samples were restricted to sites with no felling in the past five years and no drainage operations on mineral soils within the past 30 years.
GIs were then estimated using mixed linear models (Henttonen, 2000), consistent with methods applied in the Finnish NFI (e.g., Korhonen et al., 2024). A detailed description of the statistical framework used for GI estimation, including the mixed-effects model formulation, uncertainty propagation, and breakpoint sensitivity analysis, is provided in Appendix A. The NFI-based GI dataset shows a gradual decline in sample size after approximately 2005, primarily reflecting changes in the design of the Finnish NFI, including the rotating sampling scheme and the availability of historical plot and tree-core data. Consequently, earlier time periods are represented by a larger cumulative number of observations than more recent years.
2.3 Tree-ring study sites
2.3.1 Site selection and plot categorization
Three study sites per tree species (Scots pine and Norway spruce) were established in southern Finland (Fig. 1) within representative forest stands. The Scots pine sites were identified as “Solböle”, “Vastamäki”, and “Ruotsinkylä”, while the Norway spruce sites were identified as “Janakkala”, “Ränskälänkorpi”, and “Lapinjärvi”. To validate the robustness and representativeness of our sampling design, we also tested tree growth correlations between the plot-level and regional NFI data (Fig. S2).
At each site, two plots (10 m radius) were established under contrasting water availability conditions, which were classified as “dry” and “wet”, resulting in a total of 12 plots across southern Finland. This moisture categorization was based on a combination of site-specific observations. Specifically, the Scots pine plots were in different topographical contexts on mineral soils with varying susceptibility to water limitation. Plots at each site were selected using the cartographic depth-to-water (DTW) index maps (2×2 m resolution) with 0.5 ha threshold (Murphy et al., 2007), where values below 100 indicate wet conditions and high water retention capacity. Thus, the “dry” and “wet” plots were situated on forest stands on upland and lowland soils, respectively. In the case of Norway spruce plots, they were in organic soils with distinct drainage systems. Plots at each site were selected according to the ditch spacing, with the narrower the distance between ditches, the deeper the water table level and the lower the soil moisture availability (Leppä et al., 2020a).
It should be noted that the selection of sites for Scots pine on mineral soil and Norway spruce on drained organic soil was based on the dominance of the species on these soil types in southern Finland (see Sect. 2.1).
2.3.2 Soil characteristics
Soil bulk density (BD, g cm−3) was measured in both Scots pine and Norway spruce plots at 0–10 and 10–20 cm depths on three randomly selected locations within the plot. In Scots pine plots, samples were collected using a stainless-steel cylinder (5.5 cm diameter, 4.0 cm height). In Norway spruce plots, samples were collected using a stainless-steel box sampler ( cm; length × width × height). All soil samples were dried to constant mass at 105 °C for 48 h, and BD was then determined by dividing the oven-dried soil mass by the original sample volume.
Soil samples were collected next to each BD sampling point at the same depths. In Scots pine plots, samples from the organic and mineral layers at the three locations were combined into a single composite sample per layer. In Norway spruce plots, all samples were pooled into a single composite sample per plot. Total carbon (C) and nitrogen (N) concentrations (%) were measured using a TruMac CN analyser (LECO Corporation, Saint-Joseph, MI, USA).
The volume of stones (Vs, %) was estimated in the 0–30 cm only in mineral soil layer at 32 sampling locations within each Scots pine plot, following 8 transects radiating from the plot centre along the cardinal directions with 4 points per transect. Vs was then assessed using a rod penetration method (Viro, 1952). Additionally, the depth of the organic layer (Odepth, cm) was measured at each of these sampling locations.
2.3.3 Climate at the site level
For each study site, we obtained the mean daily Ta and VPair from the observational data interpolated to a 10×10 km grid covering Finland from the Finnish Meteorological Institute (FMI). The mean daily VPD was then estimated using Eq. (1), where VPD = VPsat−VPair. In addition, the 3-month SPEI was obtained from the 0.5° gridded regional SPEI dataset (see Sect. 2.1.2).
2.3.4 Tree increment core collection
Within each plot, we recorded the coordinates, diameter at breast height (DBH), total tree height (Ht, defined as the vertical distance from the base of the tree at ground level to the top of the highest living part of the crown), and tree crown base height (Hcb, defined as the vertical distance from the base of the tree at ground level to the lowest live branch) for every tree. The canopy composition was categorized by strata, quantifying the proportion of overstory, mid-story, and understory. For tree-ring analyses, 19–21 dominant and codominant trees per plot with DBH ≥ 20 cm were selected. When the required number of suitable trees was not available within the plot, additional individuals from a 5 m buffer zone surrounding the plot were included, excluding trees near drainage ditches in Norway spruce plots. From each selected tree, one 5 mm diameter increment core was extracted at DBH using an increment borer. Cores were oriented toward the pith to optimize analysis of annual tree-ring width and carbon isotope composition (δ13C). Trees were selected in apparently healthy condition: individuals showing crown dieback, stem damage, resin flow or bark-beetle entry holes were avoided at the time of coring. Damage status was not recorded systematically for each tree, so this was a field selection practice rather than a documented criterion.
2.3.5 Tree-ring preparation and analysis
Tree cores were prepared and analysed following standard dendrochronological procedures (Stokes and Smiley, 1996). Each tree core was immersed in water for at least 30 min to avoid breaking the cores, when mounted on wooden supports, and the core surface was prepared with a microtome (WSL Core Microtome; Swiss Federal Research Institute WSL, Switzerland) until the ring boundaries and wood cells were clearly visible under a binocular microscope. Then, each tree core was scanned at a resolution of 800 dpi using a colour scanner (Epson perfection v700 Photo). Finally, ring widths were measured with a precision of 0.001 mm using the WinDENDRO™ software (version Reg 2022a; Regent Instruments Inc., Quebec, Canada).
Cross-dating was performed to corroborate the calendar year assigned to each tree ring. Using standard techniques ensured the accurate assignment of calendar years to each growth ring (Stokes and Smiley, 1996). This process involved comparing ring width patterns among all samples to identify and correct any dating errors, thereby enhancing the reliability of the chronological series (Figs. S3–S14 and Tables S1–S12). All series were retained in the analyses, including those with lower correlations to the master chronology, as no evidence of cross-dating errors was detected; given the relatively short time series and the influence of natural forest dynamics, these cases are unlikely to affect the overall results.
After cross-dating, the ring-width time series were standardized and detrended to remove age-related growth trends and emphasize the environmental and climatic signals influencing growth variability (Cook, 1987). We utilized the R package dplR (Bunn, 2008, 2010) for data processing and analysis. Specifically, Regional Curve Standardization (RCS) was applied to the ring width data to construct site-specific chronologies that account for variations in growth related to tree age and size (Briffa and Melvin, 2011). This method involves creating a regional growth curve by averaging ring widths across all trees of the same cambial age, allowing us to preserve to some extent the low-frequency variability related to climatic factors and account for the age trends (Briffa and Melvin, 2011). Additionally, basal area increment (BAI, mm2 per tree per year) was estimated using the annual diameter increment per tree, using the R package dplR (Bunn, 2008, 2010). Individual-tree BAI values were converted from mm2 to m2 and scaled using site-specific tree density from each plot, thereby expressing growth on an area basis (BAI, m2 ha−1 yr−1).
2.3.6 Carbon isotope analysis (δ13C)
The δ13C analysis was performed on whole-ring samples to capture the integrated physiological signal of each annual ring. α-cellulose was extracted from the tree ring annual samples using standard chemical procedures adapted from Leavitt and Danzer (1993). From each plot, we selected five trees out of the 20 collected. The annual rings corresponding to each year were carefully sliced into small particles. To obtain sufficient and balanced masses for isotope analysis and reduce individual tree variability, the samples from the five trees were pooled for each annual ring, ensuring equal mass contribution from each tree (Belmecheri et al., 2022). Carbon isotope measurements were made on annual rings covering the period 1999–2022 at all 12 plots, giving 24 annual values per plot.
The pooled wood samples were placed on a Soxhlet with ethanol for 24 h to remove extractives. This step removes resins, oils, and other soluble substances that could interfere with the cellulose extraction. Following this, the samples underwent delignification by treatment with a sodium chlorite (NaClO2) solution, buffered with acetic acid (CH3COOH) to maintain a pH of around 4. This step was performed at 70 °C for 6 h to degrade lignin components and other secondary metabolites in the wood sample (Tarvo et al., 2010).
The delignified samples were then treated with a 17 % sodium hydroxide (NaOH) solution at room temperature for one hour to isolate α-cellulose by removing hemicelluloses (Green, 1963). After each chemical treatment, samples were thoroughly rinsed with deionized water until neutral pH was achieved. Finally, the purified α-cellulose was stabilized by treating it with a 10 % acetic acid solution to neutralize any remaining alkali, and then it was rinsed again with deionized water. The samples were freeze-dried and homogenized using an ultrasonic device prior to isotope analysis. α-cellulose was used in this study because it is a structural polymer closely derived from sugars produced during the growing season, and extracting cellulose allows for more effective homogenization when pooling samples from multiple trees, improving comparability and reliability (Belmecheri et al., 2022).
The δ13C of the α-cellulose samples were measured using an isotope ratio mass spectrometer (IRMS) at the Stable Isotope Laboratory of Luke (SILL), Natural Resources Institute Finland (Luke). Approximately 0.3 mg of each sample was weighed into tin capsules and combusted in an elemental analyser (EA) coupled to the IRMS. The results were normalized against IAEA-CH7 (−32.15 ‰) and in-house lactose and sucrose reference materials (−24.66 ‰ and −12.22 ‰, respectively), and are reported relative to the Vienna Pee Dee Belemnite (VPDB) standard. Repeat measurement of IAEA-CH3 material, run concurrently with the samples and normalized with the same scheme returns δ13C value of ‰ (mean ± standard deviation, n=18) in line with the certified value for this reference (−24.72 ‰).
2.3.7 Intrinsic water-use efficiency (iWUE)
The δ13C can be used to estimate iWUE at a variety of temporal resolution, from season (Tang et al., 2022) to multi-decadal and at spatial (leaf level to ecosystems) scales (Battipaglia et al., 2013; Gagen et al., 2011; Seibt et al., 2008). At the leaf level, the variability of δ13C in plant material represents the balance between net photosynthetic rate (A) and stomatal conductance to water vapor (gs), which both processes discriminate against 13C. This isotopic effect and coupling is mainly influenced by environmental factors such as soil water availability, atmospheric water demand, photosynthetically active radiation, and atmospheric CO2 concentrations (Belmecheri et al., 2021; Farquhar et al., 1982; Leavitt et al., 2011; Ma et al., 2023). In this study, we describe photosynthetic carbon discrimination (Δ13C) using a simplified mechanistic model that accounts for the primary factors affecting the discrimination against 13C during photosynthesis (Eqs. 2 and 3).
Where “δ13Catmosphere” is the isotopic composition from the well mixed atmospheric CO2 (Belmecheri and Lavergne, 2020) and “δ13Ccellulose” is the measured isotopic composition in cellulose from the tree rings, then Δ13C expression is:
Where “a” is the isotopic fractionation during CO2 diffusion through stomata (∼4.4 ‰), “b” is the tissue-specific isotopic fractionation associated with net fractionation caused by Rubisco and PEPC (phosphoenolpyruvate carboxylase) and post-photosynthetic fractionation factors (Cernusak and Ubierna, 2022; Ubierna et al., 2022) integrated as (∼27 ‰), and “” is the ratio of intercellular to ambient CO2 concentrations (data from Belmecheri and Lavergne, 2020). The ratio is indicative of the relation between CO2 supply to the leaves (via stomata) and CO2 demand by photosynthesis in the chloroplast. At a given water evaporative demand determined by VPD, the ratio is linked to iWUE as follows (Eqs. 4 and 5):
Where “A” is the assimilation rate, ), and “” are the stomatal conductance of CO2 and water (Ehleringer and Cerling, 1995; Farquhar et al., 1982). The iWUE represents the efficiency of carbon gain per unit of potential water loss determined by gs, and often varies with VPD, as higher VPD can lead to reduced stomatal conductance to minimize water loss (Medlyn et al., 2017).
2.4 Statistical methods
2.4.1 Post-hoc comparisons of forest stand and soil characteristics
Forest stand and soil characteristics were compared between “Dry” and “Wet” plots for each tree species. Pairwise comparisons for each variable were performed using Bonferroni-adjusted post-hoc tests to account for multiple comparisons, with significance set at p<0.05.
2.4.2 Detection of changes in the time series of regional- and site-level parameters
The time series derived from the NFI GI and site-level BAI, Δ13C, and iWUE chronologies were modelled using segmented regression models (Muggeo, 2008). This segmented regression framework enables the estimation and detection of distinct temporal trends within different time series phases. Starting from an unsegmented linear trend model, Davies's test (Davies, 2002) was applied iteratively to evaluate the significance of additional structural breakpoints until no further significant breaks were detected. This approach was applied to each chronology, resulting in species- and variable-specific breakpoint estimates. All change-point analyses used the common 1999–2022 period defined by the isotope record, allowing direct comparison among GI, BAI, Δ13C, and iWUE. Figure 2 presents the full GI record from 1990 to 2022.
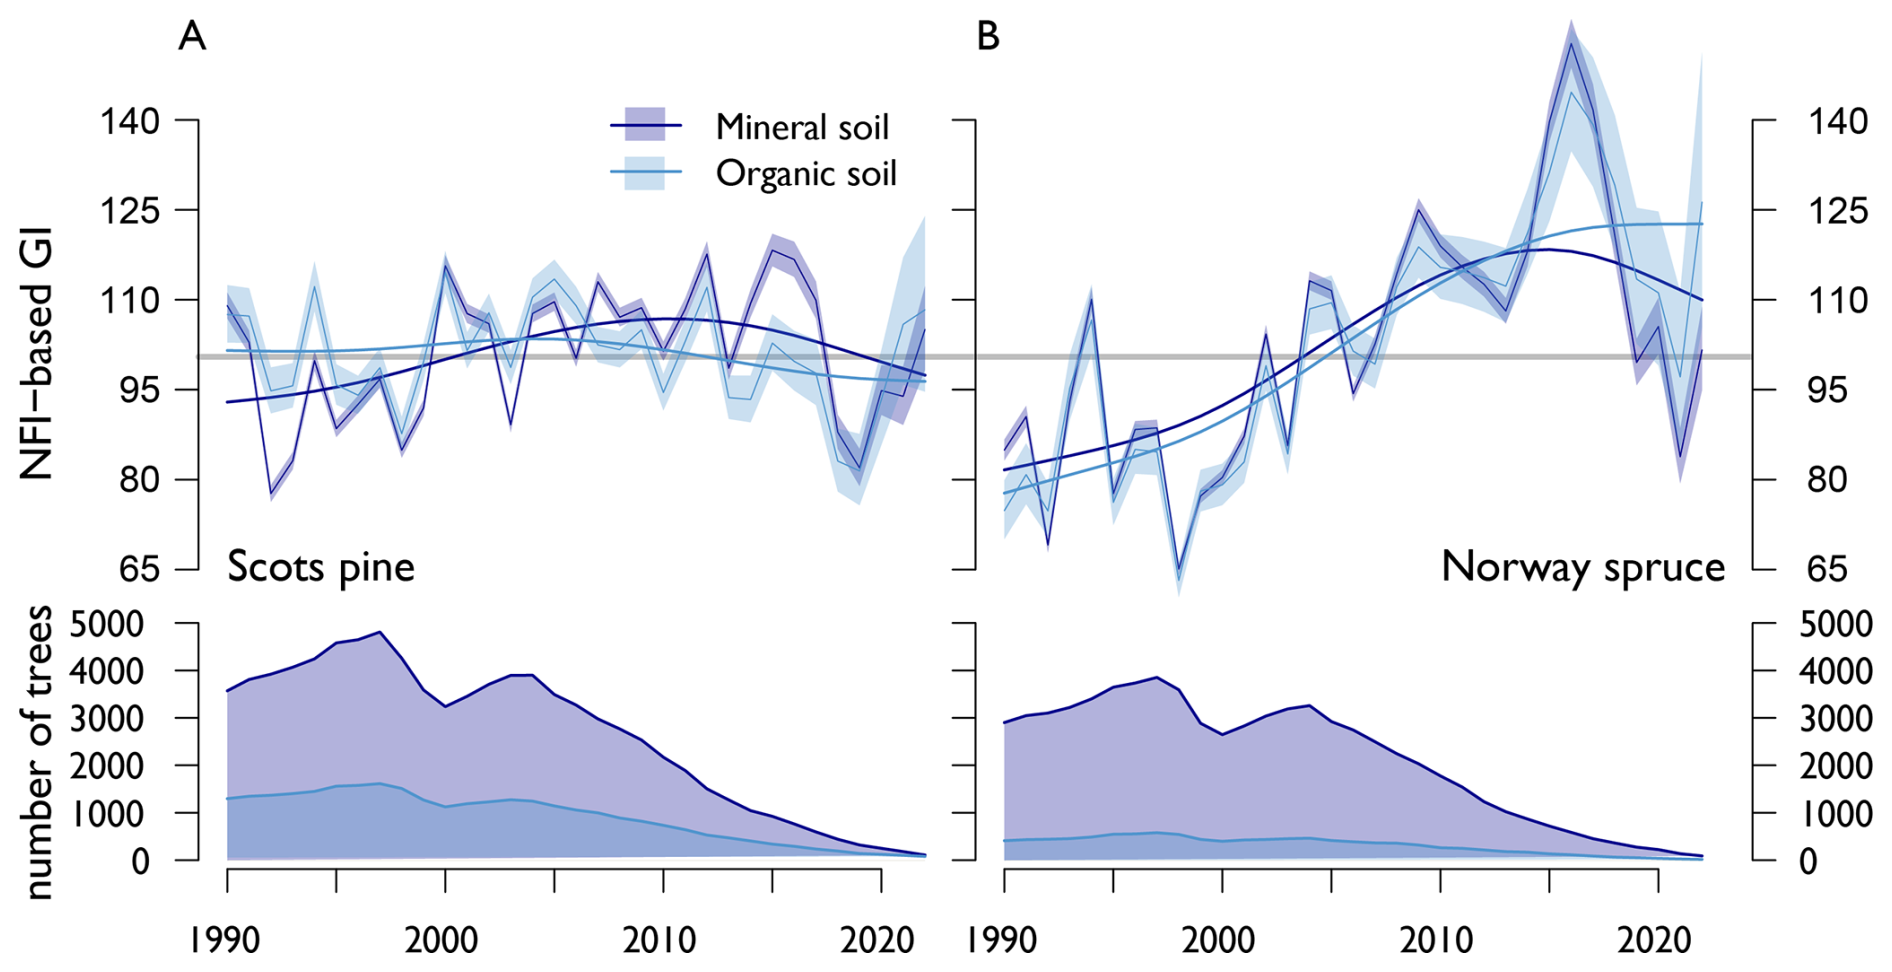
Figure 2National Forest Inventory (NFI) based tree growth patterns in southern Finland. Panels show NFI-based standardized growth index (GI) for Scots pine (A) and Norway spruce (B) from 1990 to 2022 on mineral (darkblue) and organic (lightblue) soils. The upper panels illustrate the annual variability in GI for each tree species and soil type, with thin lines depicting the mean annual values, while thick lines showing the 30-year smoothing splines to illustrate long-term trends. The lower panels show the number of trees used to derive each annual GI estimate for each tree species and soil type (see Appendix A for NFI uncertainty estimates).
Because breakpoints were not detected for every variable, common change years were used within each species to enable comparisons among soils and plot types: 2009 for Scots pine and 2016 for Norway spruce. Breakpoint results and their uncertainty are reported in Sect. 3.3 and Appendix A. The estimated marginal means treat the harmonised change years as fixed and should therefore be interpreted as conditional on those years. In contrast, breakpoint uncertainty was propagated through the segmented regressions and the mixed models in Eq. (6). Only Tables S13 and S14 use the NFI growth index and include NFI sampling uncertainty; Tables S15–S18 report site-level comparisons.
For each response and species, we fitted a model of the form response ∼ group × period × year, where group represented soil or plot type and year was centred within each period. Temporal slopes and estimated marginal means were compared among groups and periods using the emmeans package (Lenth and Piaskowski, 2017). Estimated marginal means are model-adjusted mean response values, whereas temporal slopes describe annual rates of change. Results are reported in Tables S13–S18. We distinguish between breakpoint-defined periods, based on species- and variable-specific change points estimated from segmented regression, and the common pre-2016/post-2016 periods used in linear mixed-effects models (LMMs) to facilitate direct comparisons of recent climate sensitivities between species. Accordingly, the terms “pre-change” and “post-change” refer specifically to breakpoint-defined periods, whereas “pre-2016” and “post-2016” refer to the common comparative temporal split.
2.4.3 Sensitivity of regional- and site-level parameters to environmental stressors
To evaluate the influence of the low and high frequency climate variability on inter-annual tree growth and physiology, we used both the detrended and non-detrended NFI-based GI, tree-ring variables (BAI and Δ13C), and the monthly climate indices (Ta, VPD, and SPEI). BAI and Δ13C were analysed because tree growth and physiological regulation of carbon gain relative to water loss may respond differently to climate variability and reflect different seasonal windows of sensitivity (Stockton Maxwell et al., 2020). Detrending was performed using the super smoother Friedman method implemented in the dplR package (Bunn, 2010). For each site and month, we then adjusted a simple linear model of the form of: (variable (detrended and not) ∼ Climate index (detrended and not)). We applied this simple linear model for all combinations of sites, species, and climate variables including previous fall and extracted the coefficient of determination (R2), slopes, and p-values from each model run.
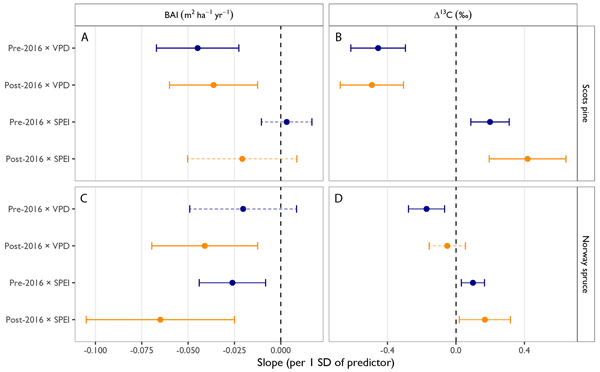
Additionally, we used linear mixed-effects models (LMMs, Eq. 6) to examine the sensitivity of tree growth and physiological responses to SPEI and VPD. Ta was excluded from the models due to its high collinearity with VPD. The analysis was conducted on BAI and Δ13C chronologies, with monthly SPEI and VPD averaged across the May-June-July (MJJ) period, which was chosen because it best captures the climatic conditions influencing the physiological processes of the study species. Climate predictors and years were centred before modelling to facilitate the interpretation of changes in intercepts and differences in predictor effects, which correspond to interaction effects across periods. For comparative analyses, a common breakpoint year (2016), identified from the segmented regression analysis (Sect. 2.4.2), was used to define pre-2016 (1999–2015) and post-2016 (2016–2022) periods for both species. This categorical period variable was included in the LMMs to test whether climate sensitivity to SPEI and VPD differed between periods, potentially reflecting intensified water limitation after 2016. Before model fitting, climate predictors and year were mean-centred by subtracting their respective means. To enable comparison between SPEI and VPD, slopes were rescaled to represent a one-standard-deviation increase in each predictor. Predictor standard deviations were calculated separately for each species over the full analysis period using plot-years with complete SPEI and VPD data (n=144 per species). This linear rescaling does not alter the fitted relationships, test statistics, or p-values. Rescaled slopes are presented in Fig. 6 and Table S20. Models were fitted separately for Scots pine and Norway spruce using the following structure:
Where yi represents either BAI or Δ13C of the ith observation, esite is a site-specific random intercept, and ϵi is a random residual error, which is assumed uncorrelated between observations. Because annual observations within a plot are temporally dependent, we modelled within-plot residuals with a first-order autoregressive process, AR (1), indexed by year. This allows residuals closer in time to be more correlated and improves precision of fixed-effect estimates under temporal dependence. Models were fitted using restricted maximum likelihood (REML). Parameters αperiod, βperiod, and γperiod, for period∈{pre-2016,post-2016}, as well as the between-site variances of random effect e and the AR(1) parameters were estimated using the lme function of the R package nlme (Pinheiro et al., 1999).
Because the split year in Eq. (6) was estimated rather than known, treating it as fixed would underestimate uncertainty in the period contrasts. We therefore propagated uncertainty in the Norway spruce breakpoint through the mixed models using the 1000 GI realizations generated for each soil type from the NFI uncertainty distribution in Appendix A (2000 draws in total). For each realization, the breakpoint nearest 2016 was used to define the pre- and post-change periods, and Eq. (6) was refitted separately for BAI and Δ13C. The fixed-effect estimates were then pooled across realizations using Rubin's rules (Rubin, 1987) with the small-sample degrees-of-freedom adjustment of Barnard and Rubin (1999). When no breakpoint was detected, the corresponding no-change model, BAI or Δ13C ∼ cSPEI + cVPD, was fitted with the same random-intercept and AR(1) structure. These realizations therefore contributed no period change to the pooled estimates, which represent model averages across breakpoint and no-breakpoint cases rather than estimates conditional on detecting a breakpoint. Breakpoints that would leave fewer than five years in either period were restricted to the nearest feasible year. We report the pooled estimates, the proportion of GI realizations in which a breakpoint was detected, and the proportion in which each model term was significant. The pooled p-value incorporates uncertainty across realizations, whereas the latter proportion indicates the stability of the inference to breakpoint uncertainty. Because the breakpoint year varies among realizations, the pre- and post-change periods also vary slightly, and the pooled variance therefore includes uncertainty in period definition as well as in the model coefficients.
To aid ecological interpretation, regression slopes were scaled relative to the observed variability of each response variable. BAI ranged from 0.14 to 1.28 m2 ha−1 yr−1 (range = 1.14), and Δ13C from 16.5 ‰ to 22.3 ‰ (range = 5.8 ‰). Effect sizes were classified consistently for both variables as small (<10 % of the observed range), moderate (10 %–50 %), and large (>50 %), corresponding to slope thresholds of <0.11, 0.11–0.57, and >0.57 m2 ha−1 yr−1 for BAI, and <0.58, 0.58–2.90, and >2.90 ‰ for Δ13C. These classes were used for interpretive purposes only and do not replace statistical inference.
3.1 NFI-based tree growth patterns in southern Finland
Our analysis of NFI-based GI data for Scots pine and Norway spruce on both mineral and organic soils over 1990–2022 provides a regional overview of tree growth variability across southern Finland (Fig. 2). For Scots pine, GI values were broadly similar between soil types during the pre-change period (1990–2008), as defined by breakpoint analysis (see Sect. 3.3.). There were no significant differences between mineral and organic soils in either temporal trends (Δslope = 0.61±0.56 yr−1, p=0.285) or mean growth levels (ΔEMM = , p=0.292) (Tables S13–S14). During the breakpoint-defined post-change period (2009–2022), GI declined on both soil types, with slightly stronger negative trends on mineral soils ( yr−1) than on organic soils ( yr−1), although this difference was not statistically significant (Δslope = yr−1, p=0.654) (Tables S13–S14). Mean GI was slightly higher on mineral soils during this period, but the difference was weak and not statistically supported (ΔEMM = 6.0±3.5, p=0.105), indicating limited divergence between soil types in both growth trajectories and average growth levels.
Propagating NFI sampling uncertainty through breakpoint detection establishes that no regional GI breakpoint is supported for Scots pine on either soil type, a breakpoint being detected in 0.9 % of 1000 GI realisations on mineral soils and 32 % on organic soils, and near 2019 rather than 2009 in the latter case (Appendix A). The 2009 partition used here is the breakpoint detected in site-level BAI at three of the six plots (Table S19), applied to the regional index as a common comparison window.
Norway spruce showed positive and similar GI trends across soil types during the breakpoint-defined pre-change period (1990–2015), with no evidence of soil-specific differences in either temporal dynamics (Δslope = yr−1, p=0.704) or mean growth levels (ΔEMM = 2.2±3.3, p=0.502) (Tables S13–S14). In the breakpoint-defined post-change period (2016–2022), GI declined sharply on both soil types, with more negative slopes on mineral soils ( yr−1) than on organic soils ( yr−1), although this difference was not statistically significant (Δslope = yr−1, p=0.245). Mean GI was somewhat higher on organic soils during this period, but soil differences remained statistically unsupported (ΔEMM = , p=0.527) (Tables S13–S14). This regional decline is well resolved by the NFI sample on mineral soils, where a breakpoint is detected in every one of 1000 GI realisations and the pooled post-breakpoint slope remains significantly negative; on organic soils the pooled slopes are of the same sign and magnitude but the sampling uncertainty is large enough that they are no longer distinguishable from zero (Appendix A, Table A2).
Overall, both species exhibited a marked reduction in GI following the breakpoint-defined post-change period, whereas soil-specific differences in both temporal trends and mean levels remained weak and statistically non-significant. Decreasing sample sizes toward the end of the study period (Fig. 2) may have increased uncertainty in late-period GI estimates, particularly because this reduction overlapped with the observed GI decline and could affect estimates of recent growth variation. Once this sampling uncertainty is propagated (Appendix A), the post-change decline in Norway spruce GI remains statistically supported on mineral soils and retains its sign and magnitude on organic soils, and in both cases its direction agrees with the independent site-level BAI analyses (see Sect. 3.2.).
3.2 Site-level patterns in tree growth and iWUE
Sample plots in Scots pine sites on mineral soils exhibited contrasting topographical conditions. Upland dry plots showed significantly higher depth-to-water index (257±78 cm) and a greater proportion of rocks (55.3 %±3.0 %) than lowland wet plots (36±4 cm and 10.7 %±6.1 %, respectively). In contrast, plots in Norway spruce sites on organic soils were characterized by distinct drainage systems, with wet plots showing significantly wider ditch spacing (65±16 m) than dry plots (46±4 m). Despite these topographical and hydrological differences, plot-level measurements indicated no significant variation in forest stand or soil characteristics between dry and wet plots within each species (Tables 1 and 2).
Table 1Forest stand characteristics for Scots pine and Norway spruce sites under “Dry” and “Wet” conditions. Td: tree density, DBH: diameter at breast height, Ht: total tree height, Hbc: tree crown base height, BA: basal area, Age: mean stand age. Values are mean ± standard deviation. For each tree species and variable, a Bonferroni-adjusted post hoc test was applied to compare differences in means between plots (p<0.05). No significant differences were identified between the “Dry” and “Wet” plots for any variable across tree species. n=3 sites per tree species and plot type.
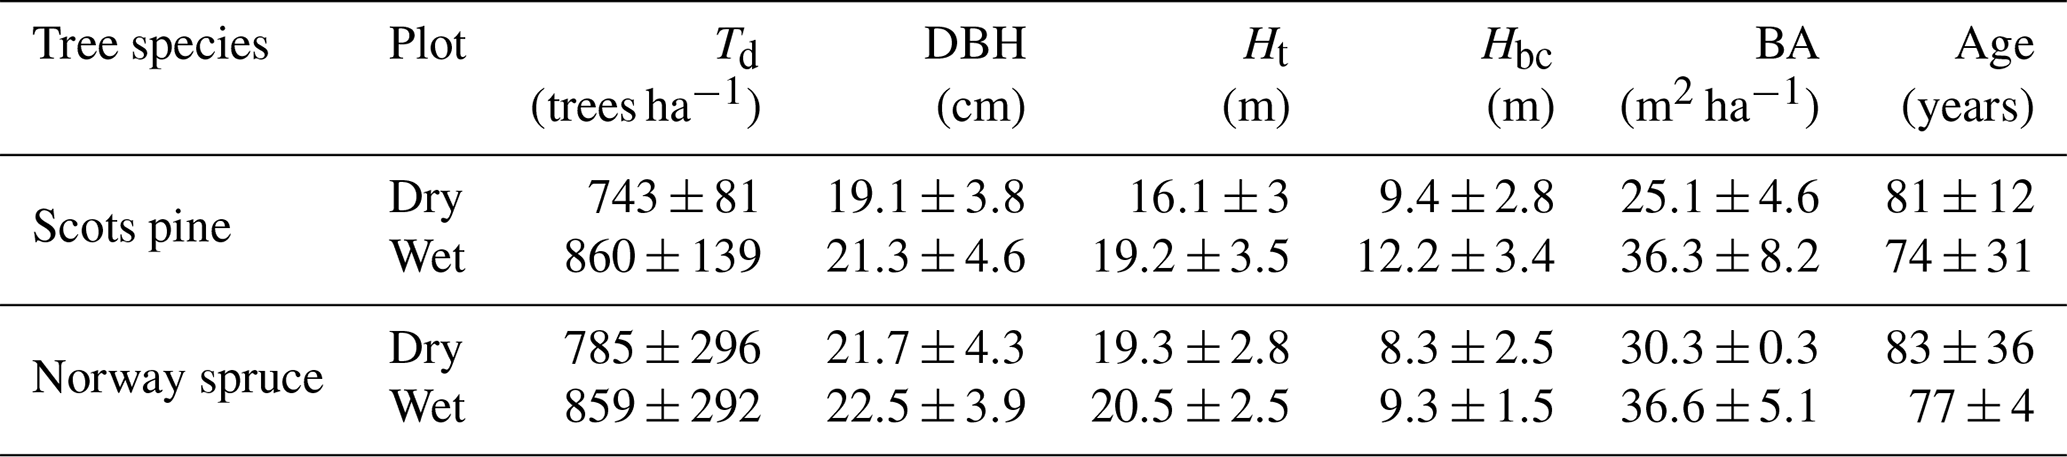
Table 2Soil characteristics at Scots pine and Norway spruce sites under “Dry” and “Wet” conditions. BD: soil bulk density, C: carbon concentration, N: nitrogen concentration, : ratio, Odepth: topsoil organic layer depth, Vs: volume of stones up to 30 cm depth. Values are mean ± standard deviation. Layer references: BD, C, N, correspond to topsoil or mineral layers as appropriate. Odepth and Vs are reported for Scots pine only; soils are organic with zero stones for Norway spruce. For each tree species and variable, a Bonferroni-adjusted post hoc test was applied to compare differences in means between plots (p<0.05). Vs differed significantly for Scots pine, while other variables showed no significant differences. n=3 sites per tree species and plot type.
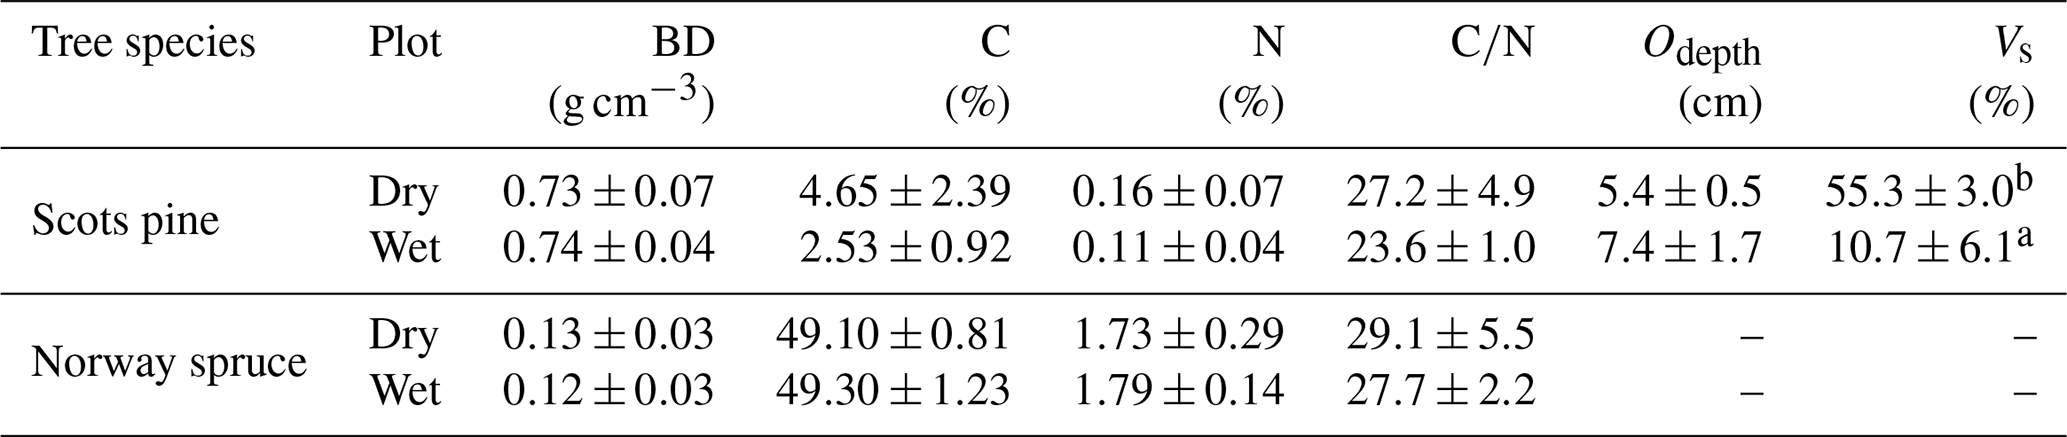
a,b Different superscript letters indicate a significant difference in mean stone volume between wet and dry Scots pine plots (Bonferroni-adjusted post hoc test, p<0.05).
From the breakpoint-defined post-change period onward (2009–2022 for Scots pine; 2016–2022 for Norway spruce), BAI showed contrasting trajectories between species and soil moisture conditions (Fig. 3A–B). In Scots pine, BAI exhibited a modest decline under dry conditions ( yr−1) and near-stable dynamics under wet conditions ( yr−1; Table S15), with consistently lower mean growth in dry compared to wet conditions (ΔEMM = −0.22 m2 ha−1 yr−1, p<0.001; Table S16). In contrast, Norway spruce showed a pronounced breakpoint-defined post-change reduction in BAI under both moisture regimes (dry: yr−1; wet: yr−1; Table S15), accompanied by a significant shift in mean growth patterns, with higher BAI in dry than wet conditions (ΔEMM = 0.211±0.047, p=0.0007; Table S16), indicating a decoupling between temporal decline and average growth levels.
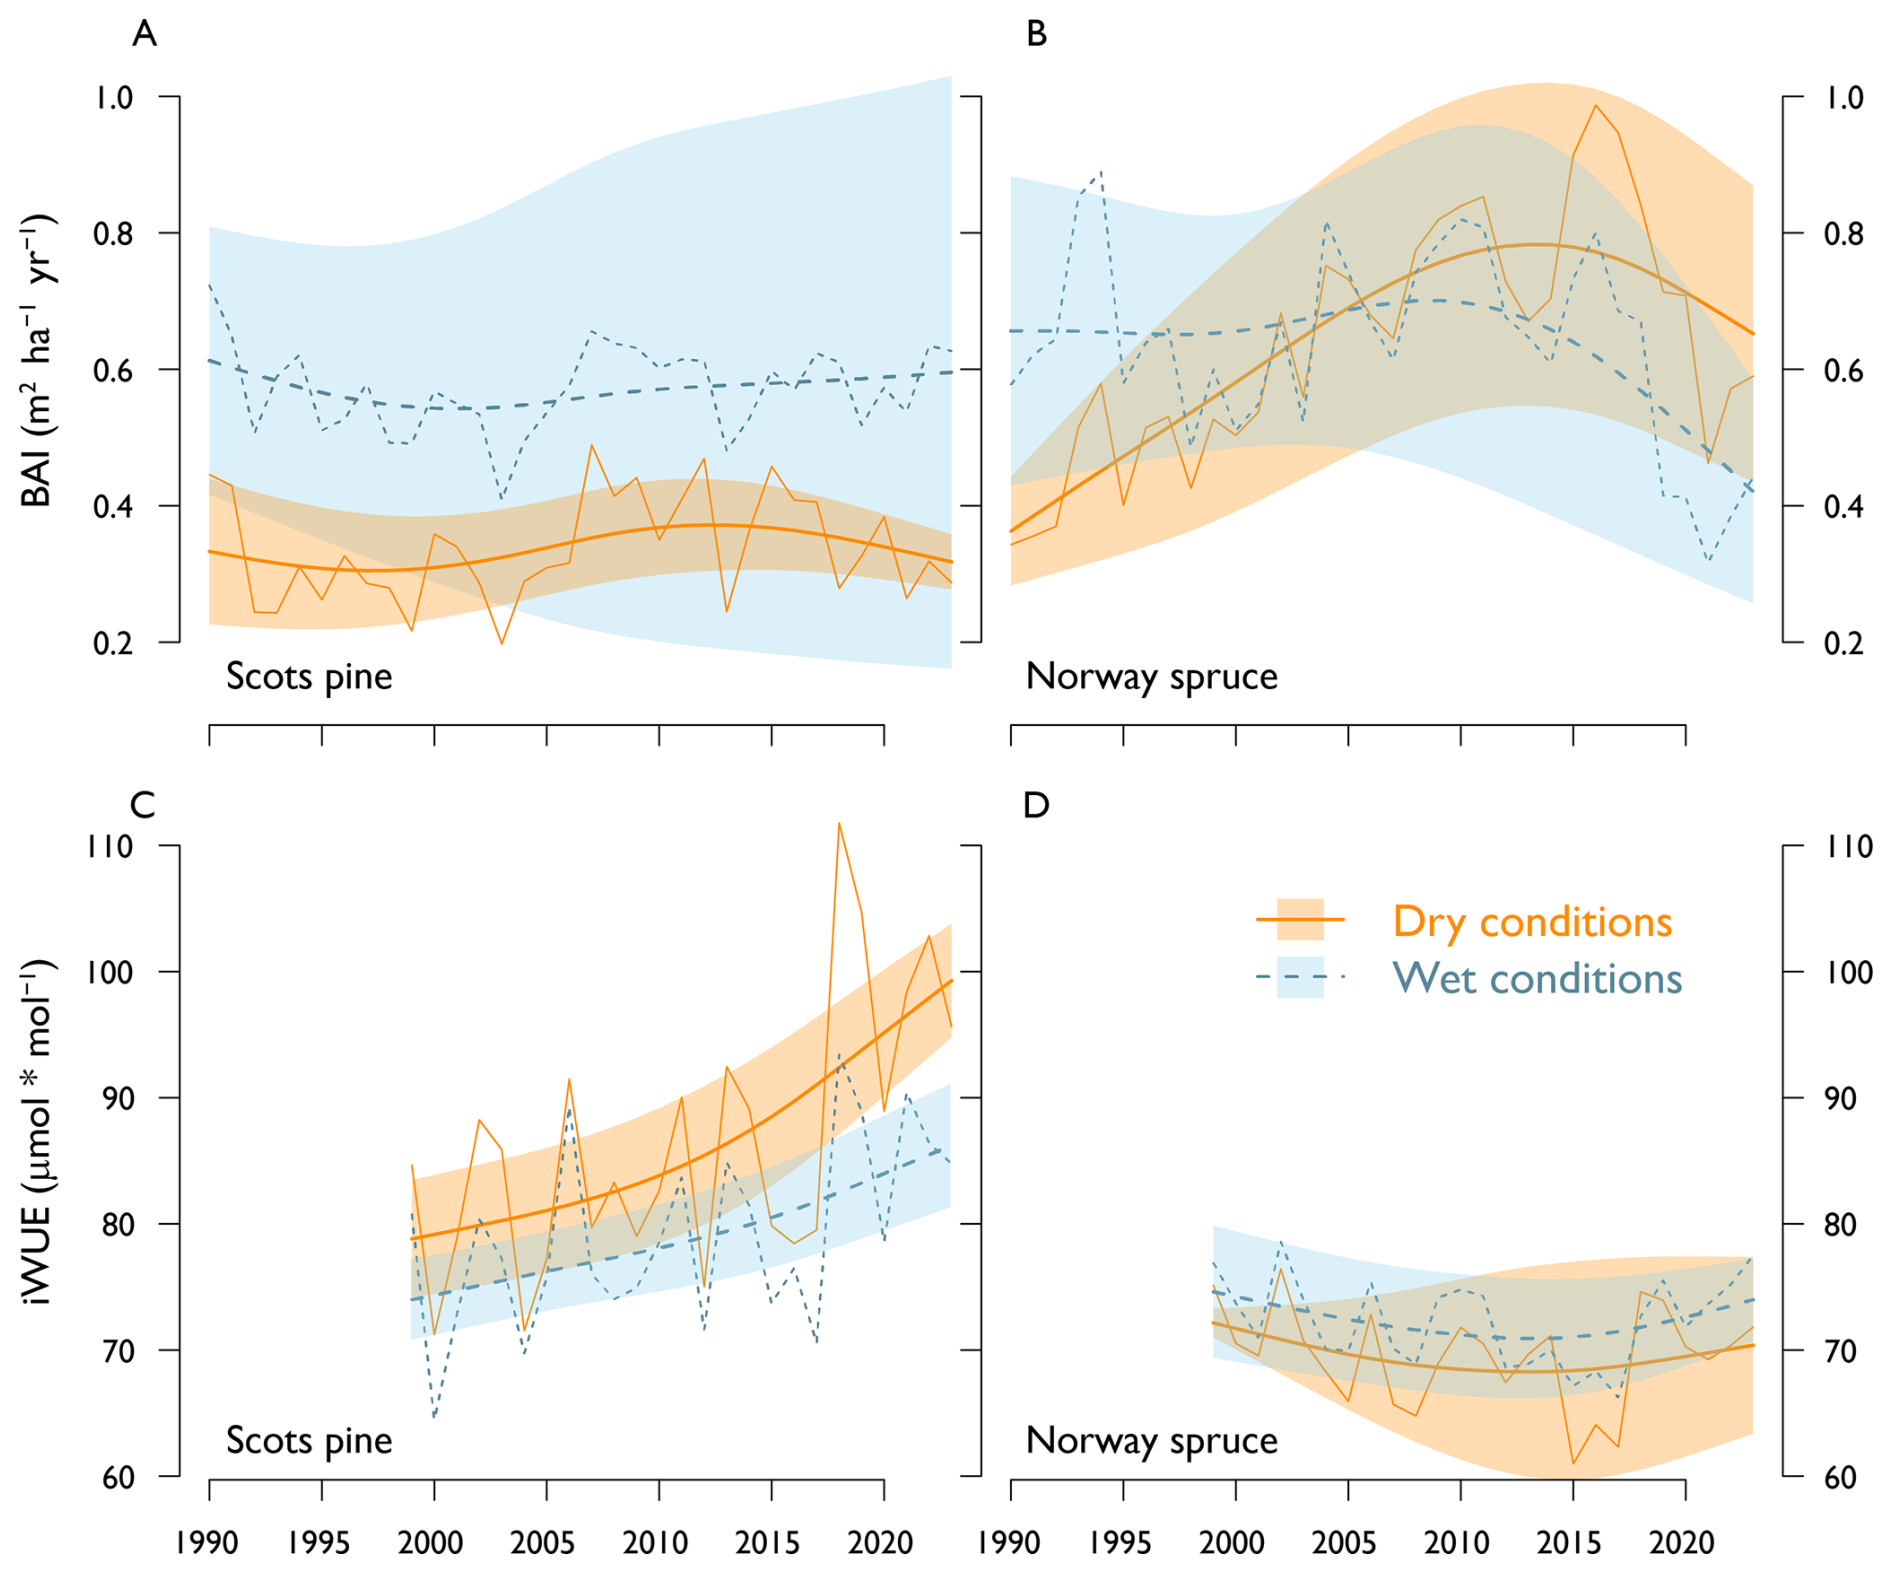
Figure 3Trends in basal area increment (BAI) and intrinsic water use efficiency (iWUE) for Scots pine and Norway spruce under “Dry” and “Wet” conditions during 1990–2022. Panels (A)–(B) show values for BAI, while panels (C)–(D) show values for iWUE. Solid and orange lines display dry conditions, while dashed and blue lines represent wet conditions. Shaded areas indicate the 90 % confidence intervals around the smoothed lines using a 30-year smoothing spline.
Responses of iWUE contrasted between species responses over the same breakpoint-defined post-change periods (Fig. 3C–D). Specifically, Scots pine exhibited a stronger increase in iWUE under dry conditions (2.160±1.510 yr−1), exceeding that under wet conditions (1.400±1.510 yr−1; Table S17), with consistently higher mean iWUE in dry relative to wet conditions (ΔEMM = 11.3±4.9 µmol mol−1, p=0.039; Table S18). This pattern suggests enhanced physiological regulation of water use under increasing atmospheric demand and moisture limitation. In contrast, Norway spruce showed more moderate and less consistent iWUE responses, with non-significant differences in temporal trends between dry and wet conditions (0.889±0.509 and 1.286±0.509 yr−1, respectively; Table S17). Mean iWUE values were slightly lower under dry conditions (69.6±1.2 µmol mol−1) than under wet conditions (72.6±1.2 µmol mol−1), although this difference was not statistically significant (ΔEMM = µmol mol−1, p=0.090; Table S18).
Overall, these results indicate contrasting post-change growth–physiology relationships between species. Norway spruce experienced a pronounced reduction in BAI under both moisture conditions, while showing only weak and variable changes in iWUE. In contrast, Scots pine maintained relatively stable growth under wet conditions but exhibited increased iWUE under dry conditions, suggesting a stronger physiological adjustment despite comparatively limited changes in growth. Temporal variability among individual sites is reflected in the spread of site-level trends (Figs. S15–S16), but the overall patterns remained consistent across the dataset.
3.3 Change-points in tree growth and iWUE over the study period
Segmented regression analysis revealed species-specific differences in the timing of changes in growth and physiological trends. (Fig. 4; Table S19). In Norway spruce, significant breakpoints were detected in all four variables, although not at every plot: in GI on both soil types, BAI at five of six plots, Δ13C at three of six plots, and iWUE at four of six plots. Most breakpoints occurred between 2015 and 2017, indicating a broadly coherent shift in growth and physiological responses. In contrast, Scots pine showed significant breakpoints only in BAI, at three of six plots in 2007, 2007, and 2011. No consistent breakpoints were detected for GI, Δ13C, or iWUE. For GI in both species, reduced sample sizes in recent years may increase uncertainty in breakpoint timing and magnitude (Appendix A).
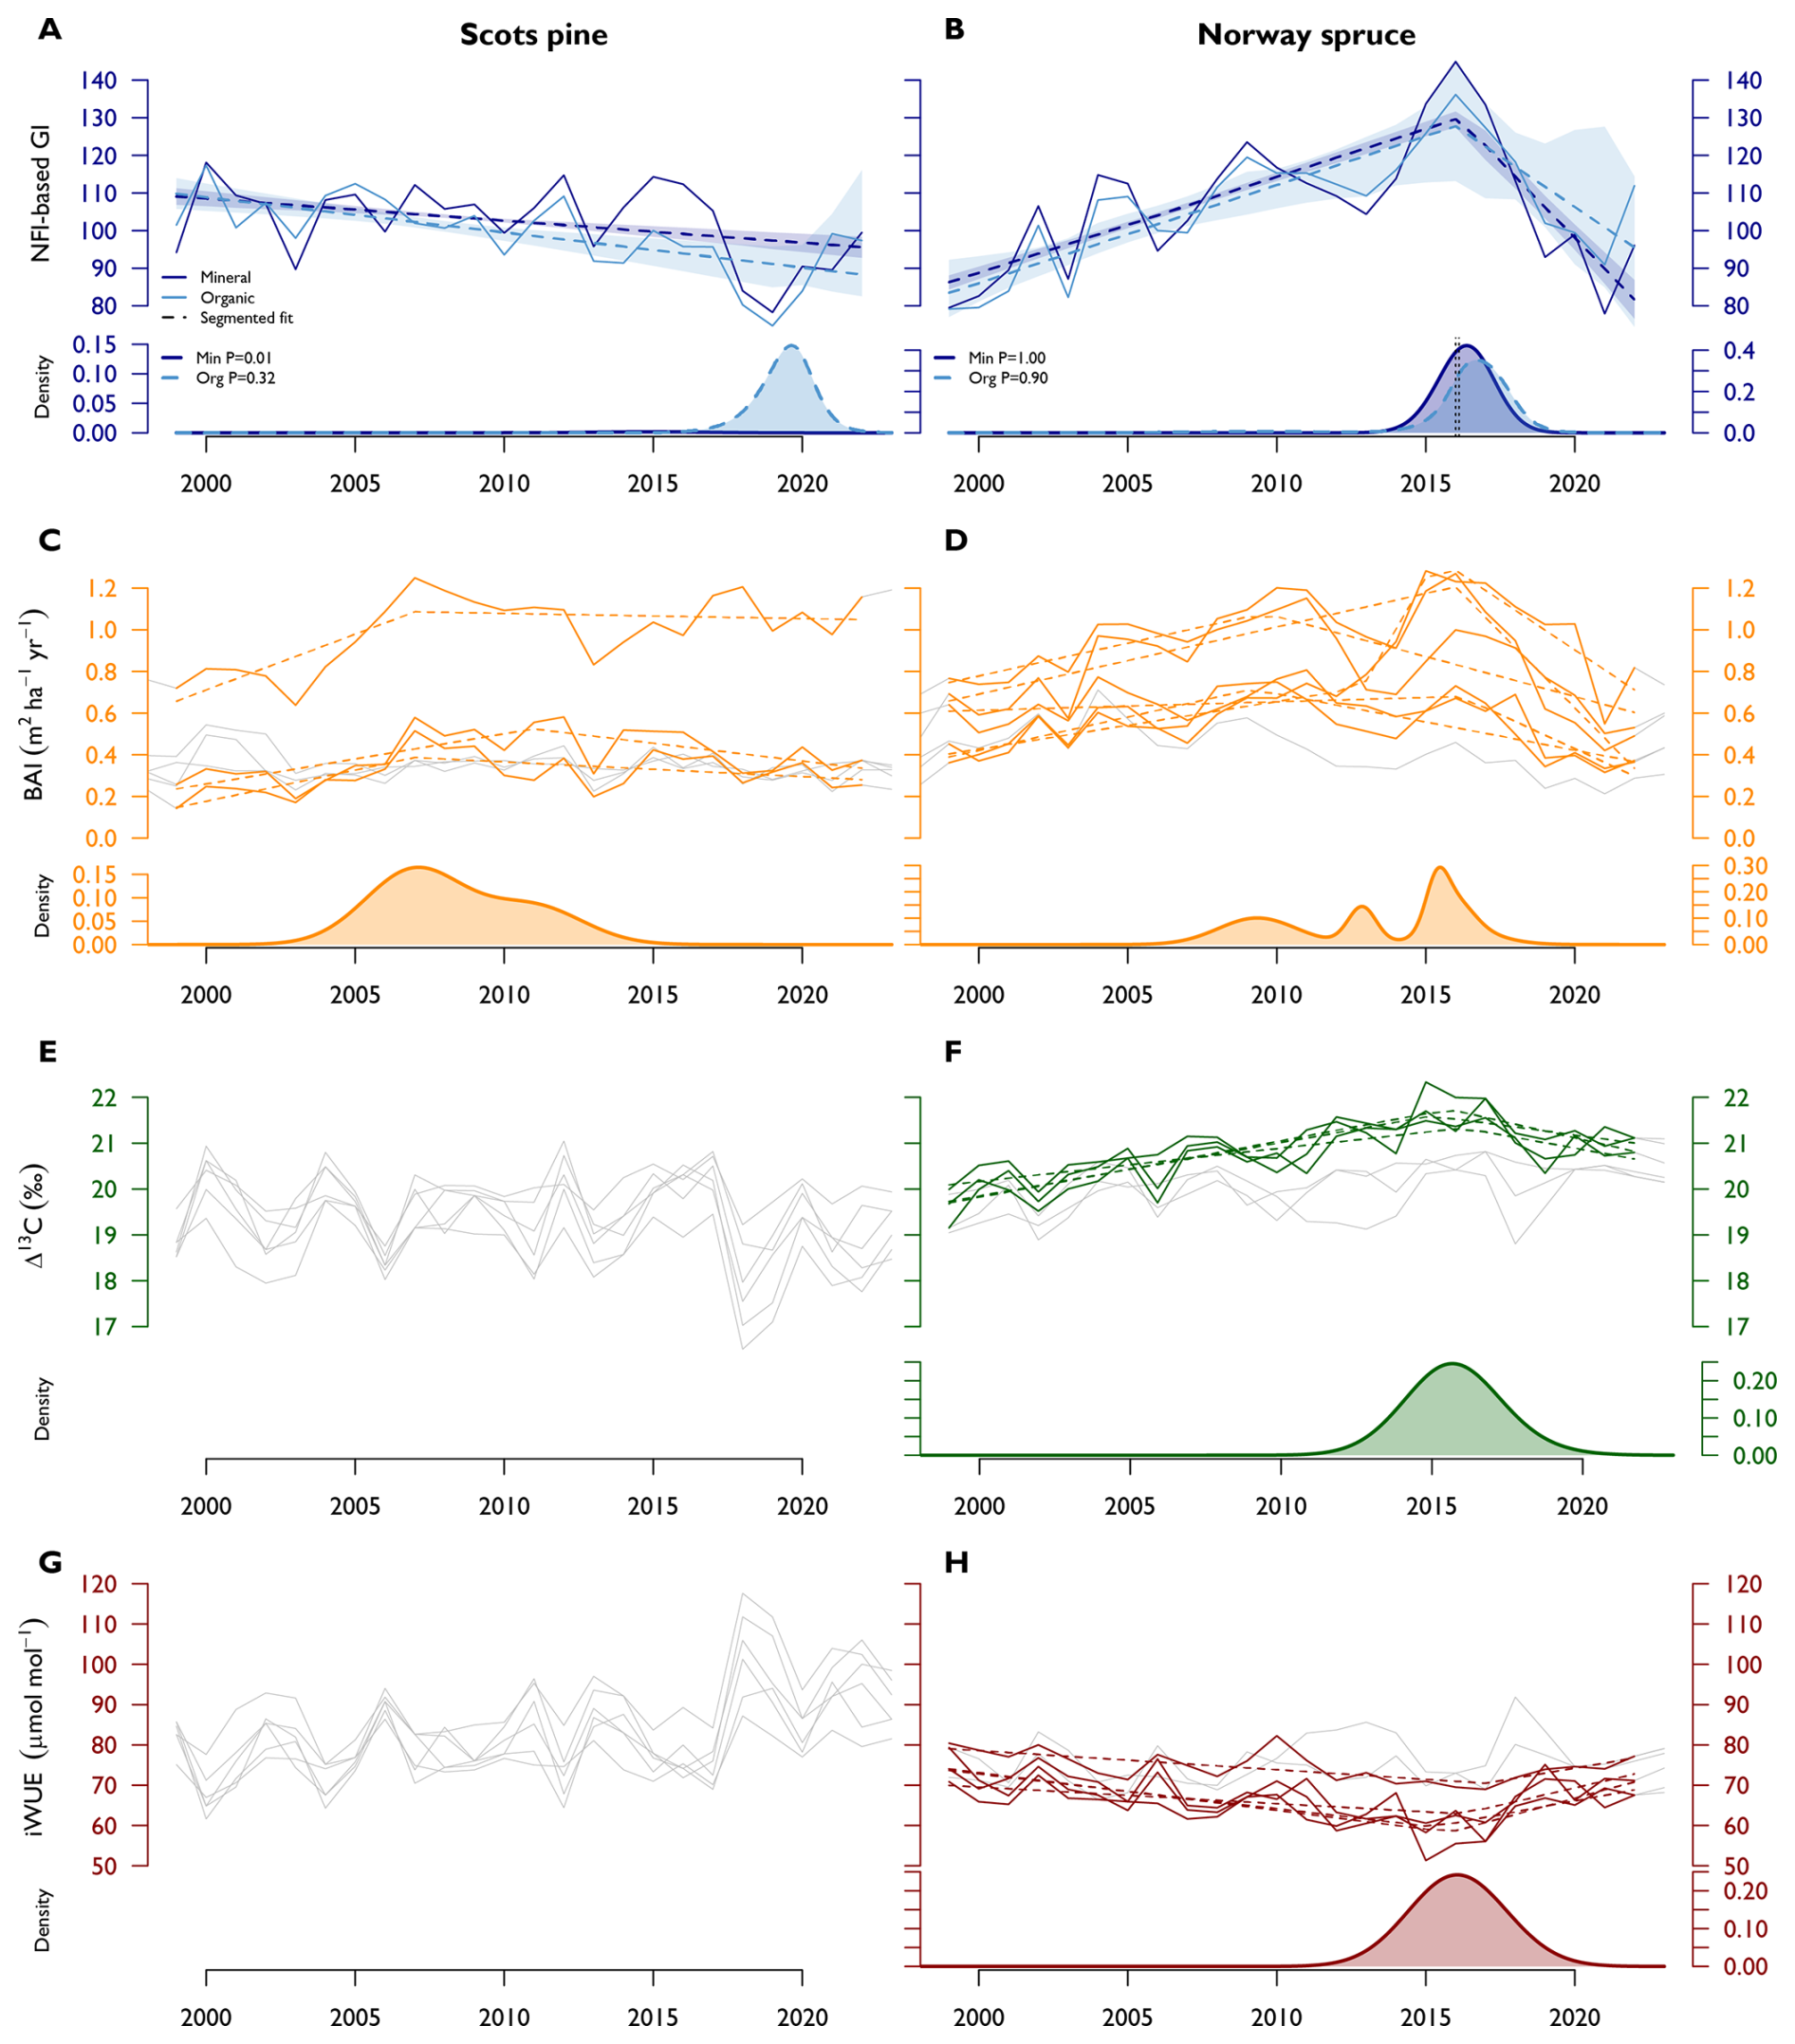
Figure 4Change-points in tree growth and water use over the study period 1999-2022. Panels show the time series for (A–B) standardized Growth Index (GI) from the Finnish National Forest Inventory (NFI), (C–D) basal area increment (BAI), (E–F), carbon isotope discrimination (Δ13C), and (G–H) intrinsic water-use efficiency (iWUE) for Scots pine (left panels) and Norway spruce (right panels). Within each panel, the grey lines represent time series in which no statistically significant detected change points were detected. In contrast, coloured lines indicate time series with one or more detected change points, while dashed lines show the corresponding segmented regression model fits. Below each time-series panel, density plots illustrate the temporal distribution of estimated change points across all time-series as probability density function (PDFs). The y-axis differs among plots because PDFs are normalized, whereas peak density values reflect the clustering of detected change points for each variable and species.
In Norway spruce, the breakpoints generally marked shifts from positive or stable trends to declining GI, BAI, and Δ13C (Fig. 4B, D, F; Table S19). The strongest and most consistent response was observed in BAI, indicating a substantial reduction in growth after 2016. Concurrent declines in GI and Δ13C further suggest that growth reductions were accompanied by shifts in physiological response.
In Scots pine, BAI breakpoints represented moderate reductions in growth rates rather than abrupt declines (Fig. 4C; Table S19). No breakpoint was detected in the observed GI series on either soil type, and the simulation analysis provided no support for a regional GI breakpoint. Thus the 2009 reference year represents a comparison point derived from site-level BAI rather than a regional change point.
Accordingly, 2016 was used for Norway spruce and 2009 for Scots pine in the within-species comparisons among soils and plot types reported in Tables S13–S18. For the subsequent LMM analysis of climate sensitivity, 2016 was used for both species to characterise post-change dynamics during 2016–2022 and enable interspecific comparison. The earlier Scots pine BAI breakpoint was not used in these models because it was not supported by the other response variables. For Norway spruce, breakpoint uncertainty was propagated by redrawing the split year from its empirical distribution in each realisation. The resulting estimates in Table 3 therefore incorporate uncertainty in breakpoint timing.
3.4 Environmental influence on tree growth and carbon isotope discrimination
Linear regression analysis (Fig. 5) illustrates how 3-month seasonal means of key climate variables, Ta, SPEI, and VPD, relate to tree-ring characteristics and NFI-based GIs. Among these, water availability (SPEI) and atmospheric demand (VPD) emerged as the strongest influential drivers. Ta showed similar temporal patterns to VPD, suggesting its effects are mediated through increased evaporative demand.
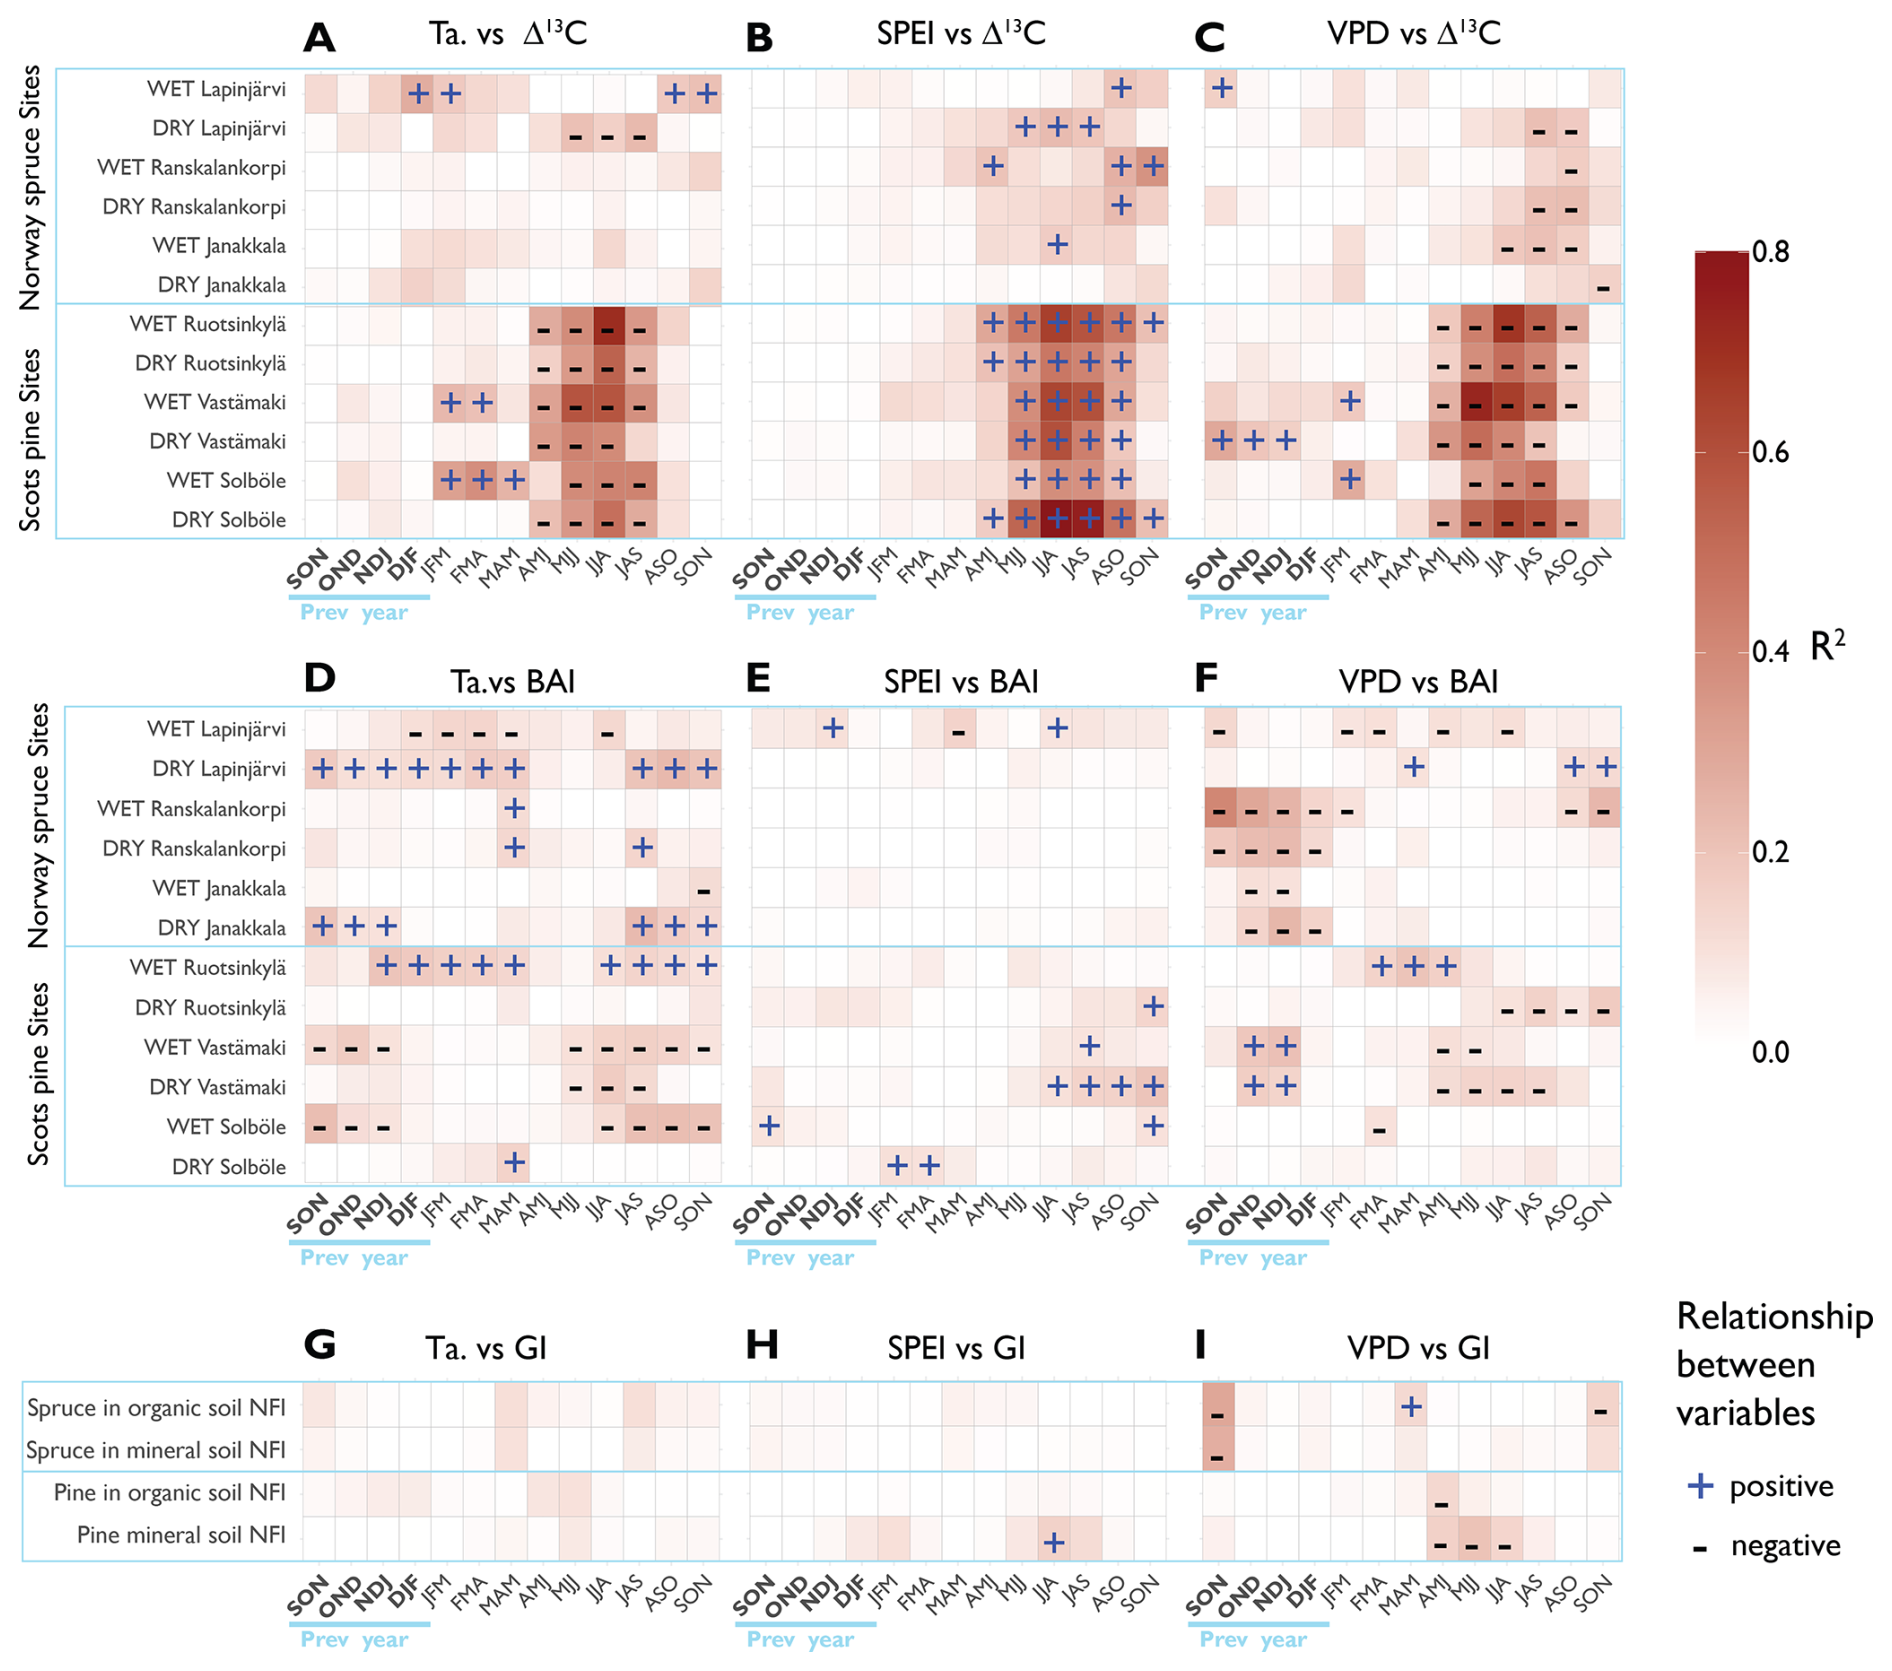
Figure 5Heatmaps showing the strength and significance of relationships between climate variables and tree growth and physiological indicators across different sites and seasonal windows (3-month periods). Panels illustrate the relationships between Ta, SPEI, and VPD with Δ13C (A–C), BAI (D–F), and regionally NFI-based GI (G–I). In all panels, the x-axes represent the 3-month periods from September of previous year to November to the current growth year, while the y-axes show site-level chronologies for Scots pine and Norway spruce (A–F), as well as regional chronologies (G–I). Colour shading represents the coefficient of determination (R2) from simple linear regressions, ranging from white (low R2) to red (high R2). Positive (+) and negative (−) signs indicate the direction and statistical significance of the relationship (p<0.05). All analyses shown in this figure were conducted on non-detrended data.
At the site level, Δ13C showed the strongest relationships with climatic variables during July–August, when low SPEI and high VPD coincided with reduced carbon isotope discrimination (Fig. 5A–C). These patterns suggest that intensified summer water stress induces greater stomatal closure, particularly in Scots pine, leading to lower Δ13C values. Ta exerted a weaker but occasionally notable influence on Δ13C, due to its indirect role in increasing VPD. This indicates that high summer Ta can further exacerbate water stress, most noticeably in Scots pine sites. In contrast, BAI but especially NFI-based GI exhibited weaker correlations with moisture and temperature variables compared to Δ13C (Fig. 5D–I).
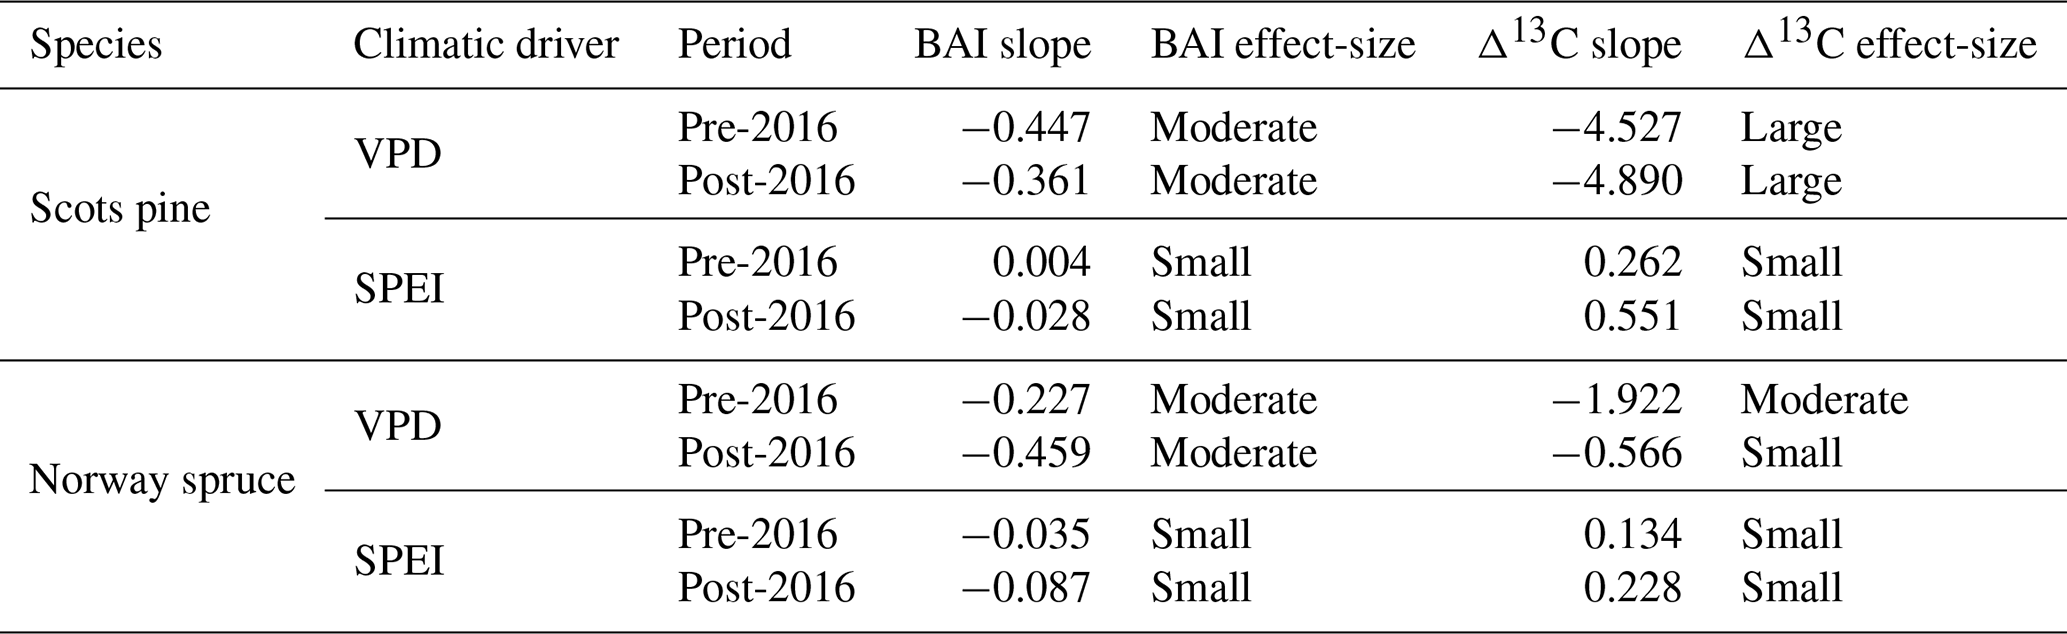
BAI in Scots pine shows minimal changes in intercepts across periods (Table 3). Growth sensitivities remain close to zero for SPEI (small effects) and are negative for VPD (moderate effects; Fig. 6A, Table 4). In contrast, Δ13C shows clearer and more consistent climate signals, with positive responses to SPEI and negative responses to VPD (Fig. 6B), with no significant differences between periods (Table 3). In terms of effect size, VPD exerts large negative effects on Δ13C, while SPEI effects remain small (Table 4). Together, these results indicate that although growth responses in Scots pine remain limited, the isotopic sensitivity to moisture stress has persisted in the post-2016 period.
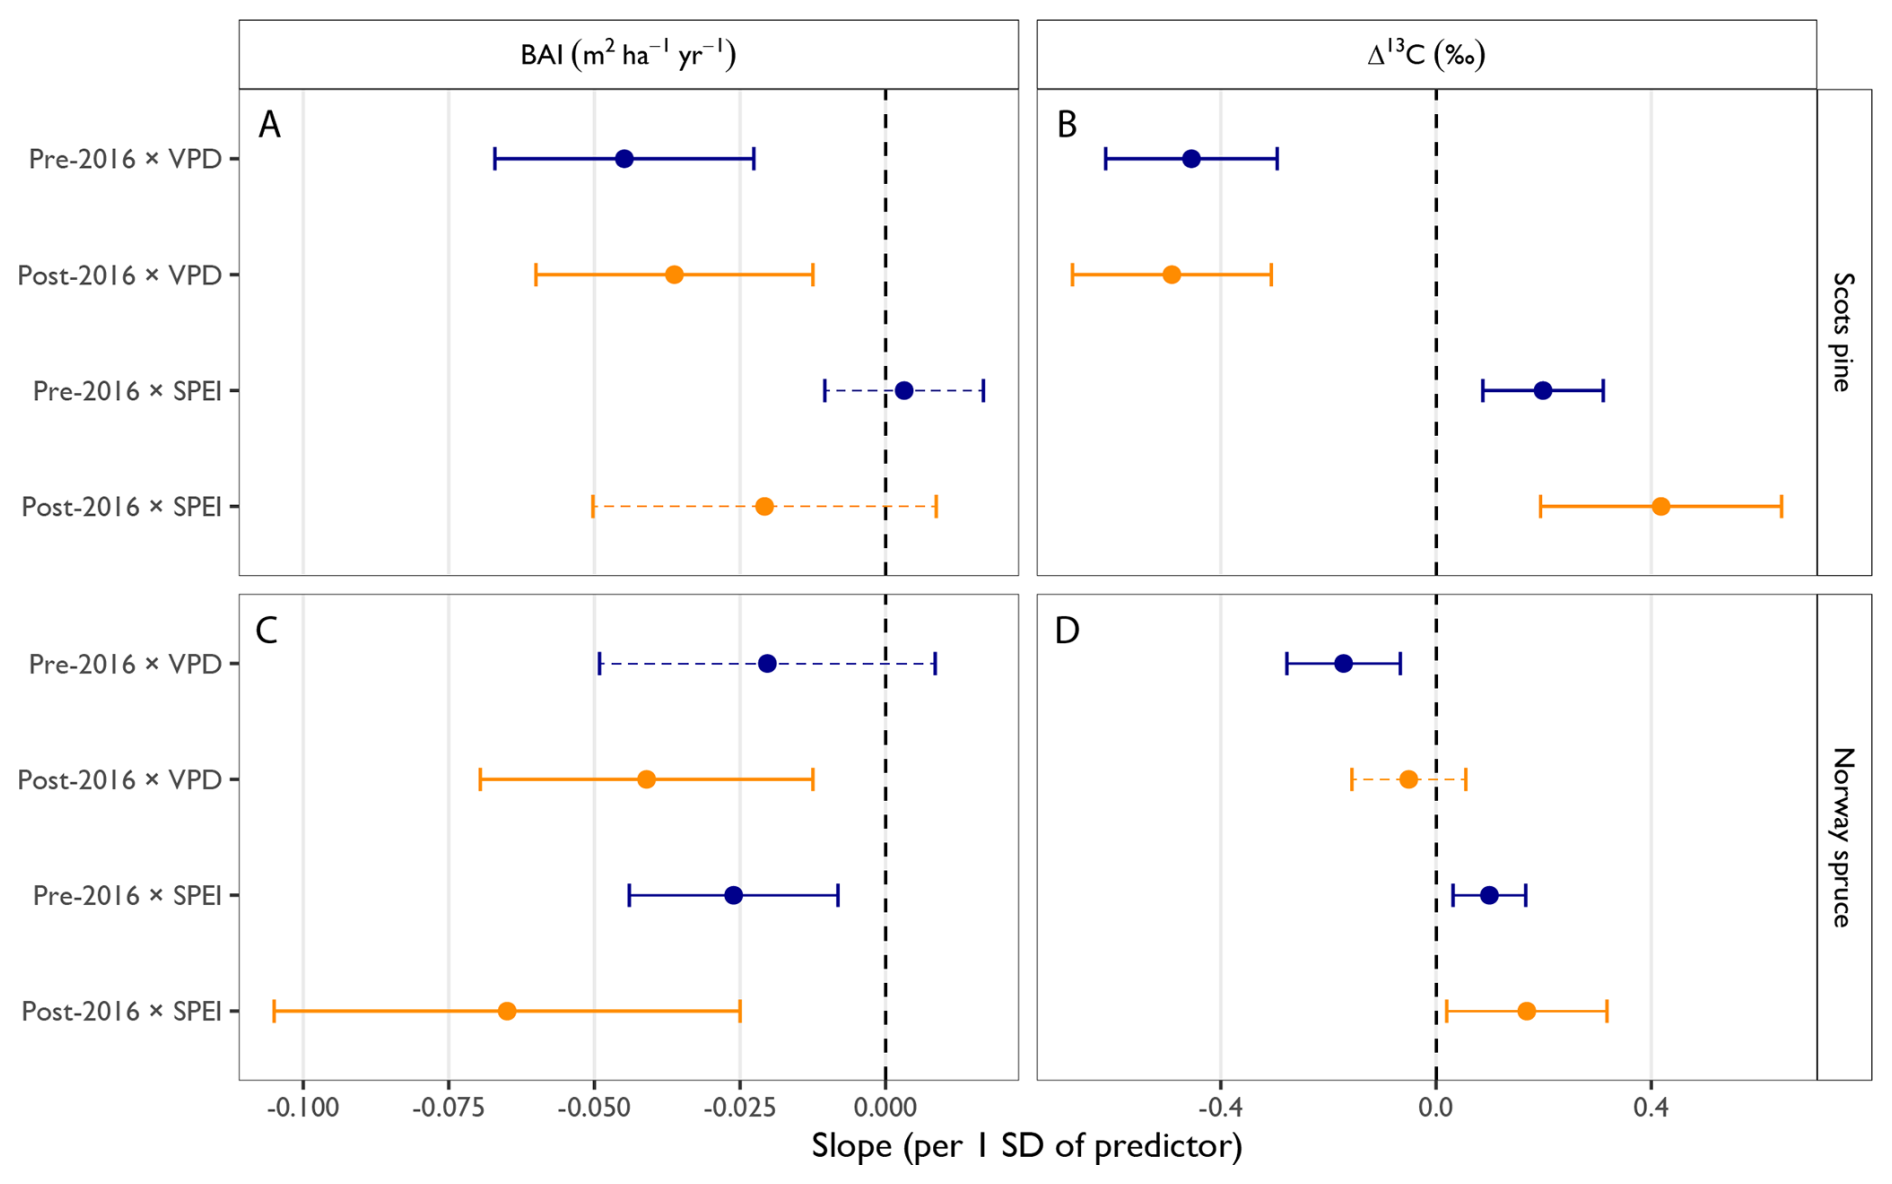
Figure 6Sensitivity of basal area increment (BAI) and carbon isotope discrimination (Δ13C) to recent changes in water limitation. Regression slopes and 95 % confidence intervals for the effects of mean May–July SPEI-3 and VPD on annual tree-ring BAI (A, C) and Δ13C (B, D) in Scots pine and Norway spruce, respectively, based on the LMMs described in Eq. (6). Because models were fitted separately for each species, slopes were rescaled to represent a one-standard-deviation increase in each predictor within the corresponding species-specific dataset. The predictor standard deviations were 0.759 for MJJ SPEI-3 and 0.100 kPa for MJJ VPD in Scots pine, and 0.741 and 0.089 kPa, respectively, in Norway spruce. Slopes therefore indicate the estimated change in BAI (m2 ha−1 yr−1) or Δ13C (‰) associated with a one-standard-deviation increase in the corresponding climate predictor. Blue and orange points represent the pre-2016 (1999–2015) and post-2016 (2016–2022) periods, respectively. Error bars denote 95 % confidence intervals. Numerical estimates are reported in Table S20.
In Norway spruce, the baseline level of Δ13C differed between periods (Δα=0.455, SE 0.146, p=0.002), whereas the baseline level of BAI did not (Δα=0.033, SE 0.051, p=0.520; Fig. 6, Table 3). VPD emerges as a clear constraint on BAI after 2016 (Fig. 6C): the post-2016 slope is negative, moderate in effect size, and significantly different from zero (Table 4), whereas the pre-2016 slope is not. The change in slope between the two periods is not itself statistically supported (Table 3), so the evidence is for a significant VPD constraint on growth after 2016 rather than for a measured increase in the strength of that constraint (Table 3 and 4). The SPEI effect on Norway spruce BAI is negative in both periods and becomes stronger after 2016 (Fig. 6), although the difference between periods is only marginal (Fig. 6C, Table 3 and 4). The corresponding effect on Δ13C is positive in both periods. For Δ13C, sensitivities to both VPD and SPEI show no significant differences between periods; in effect-size terms, VPD responses shift from moderate pre-2016 to small post-2016, while SPEI effects remain small (Table 4).
Under the May-July climate window, climate sensitivity of Norway spruce BAI becomes more pronounced after 2016, indicating enhanced growth limitation. In contrast, Scots pine Δ13C shows more prominent and consistent climate sensitivity than Norway spruce, with large responses to VPD and small responses to SPEI, while Scots pine BAI remains comparatively buffered from climatic variability (Table 4).
Propagating uncertainty in breakpoint timing through Eq. (6) (Sect. 2.4.3) preserved the signs and significance status at the 0.05 threshold of the pre-period SPEI and VPD coefficients in both species and for both response variables (Table S21). The between-period slope differences also retained their signs but remained non-significant. Although a breakpoint was detected in approximately 95 % of the pooled Norway spruce GI realisations (Appendix A), this does not establish a change in climate sensitivity. For Norway spruce, the BAI intercept shift changed sign and remained non-significant, while the Δ13C intercept shift was no longer significant when realisations without a detected breakpoint were included (p=0.079). These results support climate associations, while the period differences in SPEI and VPD slopes and the Norway spruce intercept shifts in Eq. (6) remain statistically uncertain.
Table 3Pre- and post-2016 changes in the sensitivity of the basal area increment (BAI) and carbon isotope discrimination (Δ13C) to climate variables for Scots pine and Norway spruce. Changes in model-estimated parameters for the Standardized Precipitation-Evapotranspiration Index (SPEI, β) and vapor pressure deficit (VPD, γ) for the period May–July (MJJ) based on model runs described in Eq. (6) (p<0.001 ””, 0.01 ””, 0.05,”*”, 0.1 ”.”).
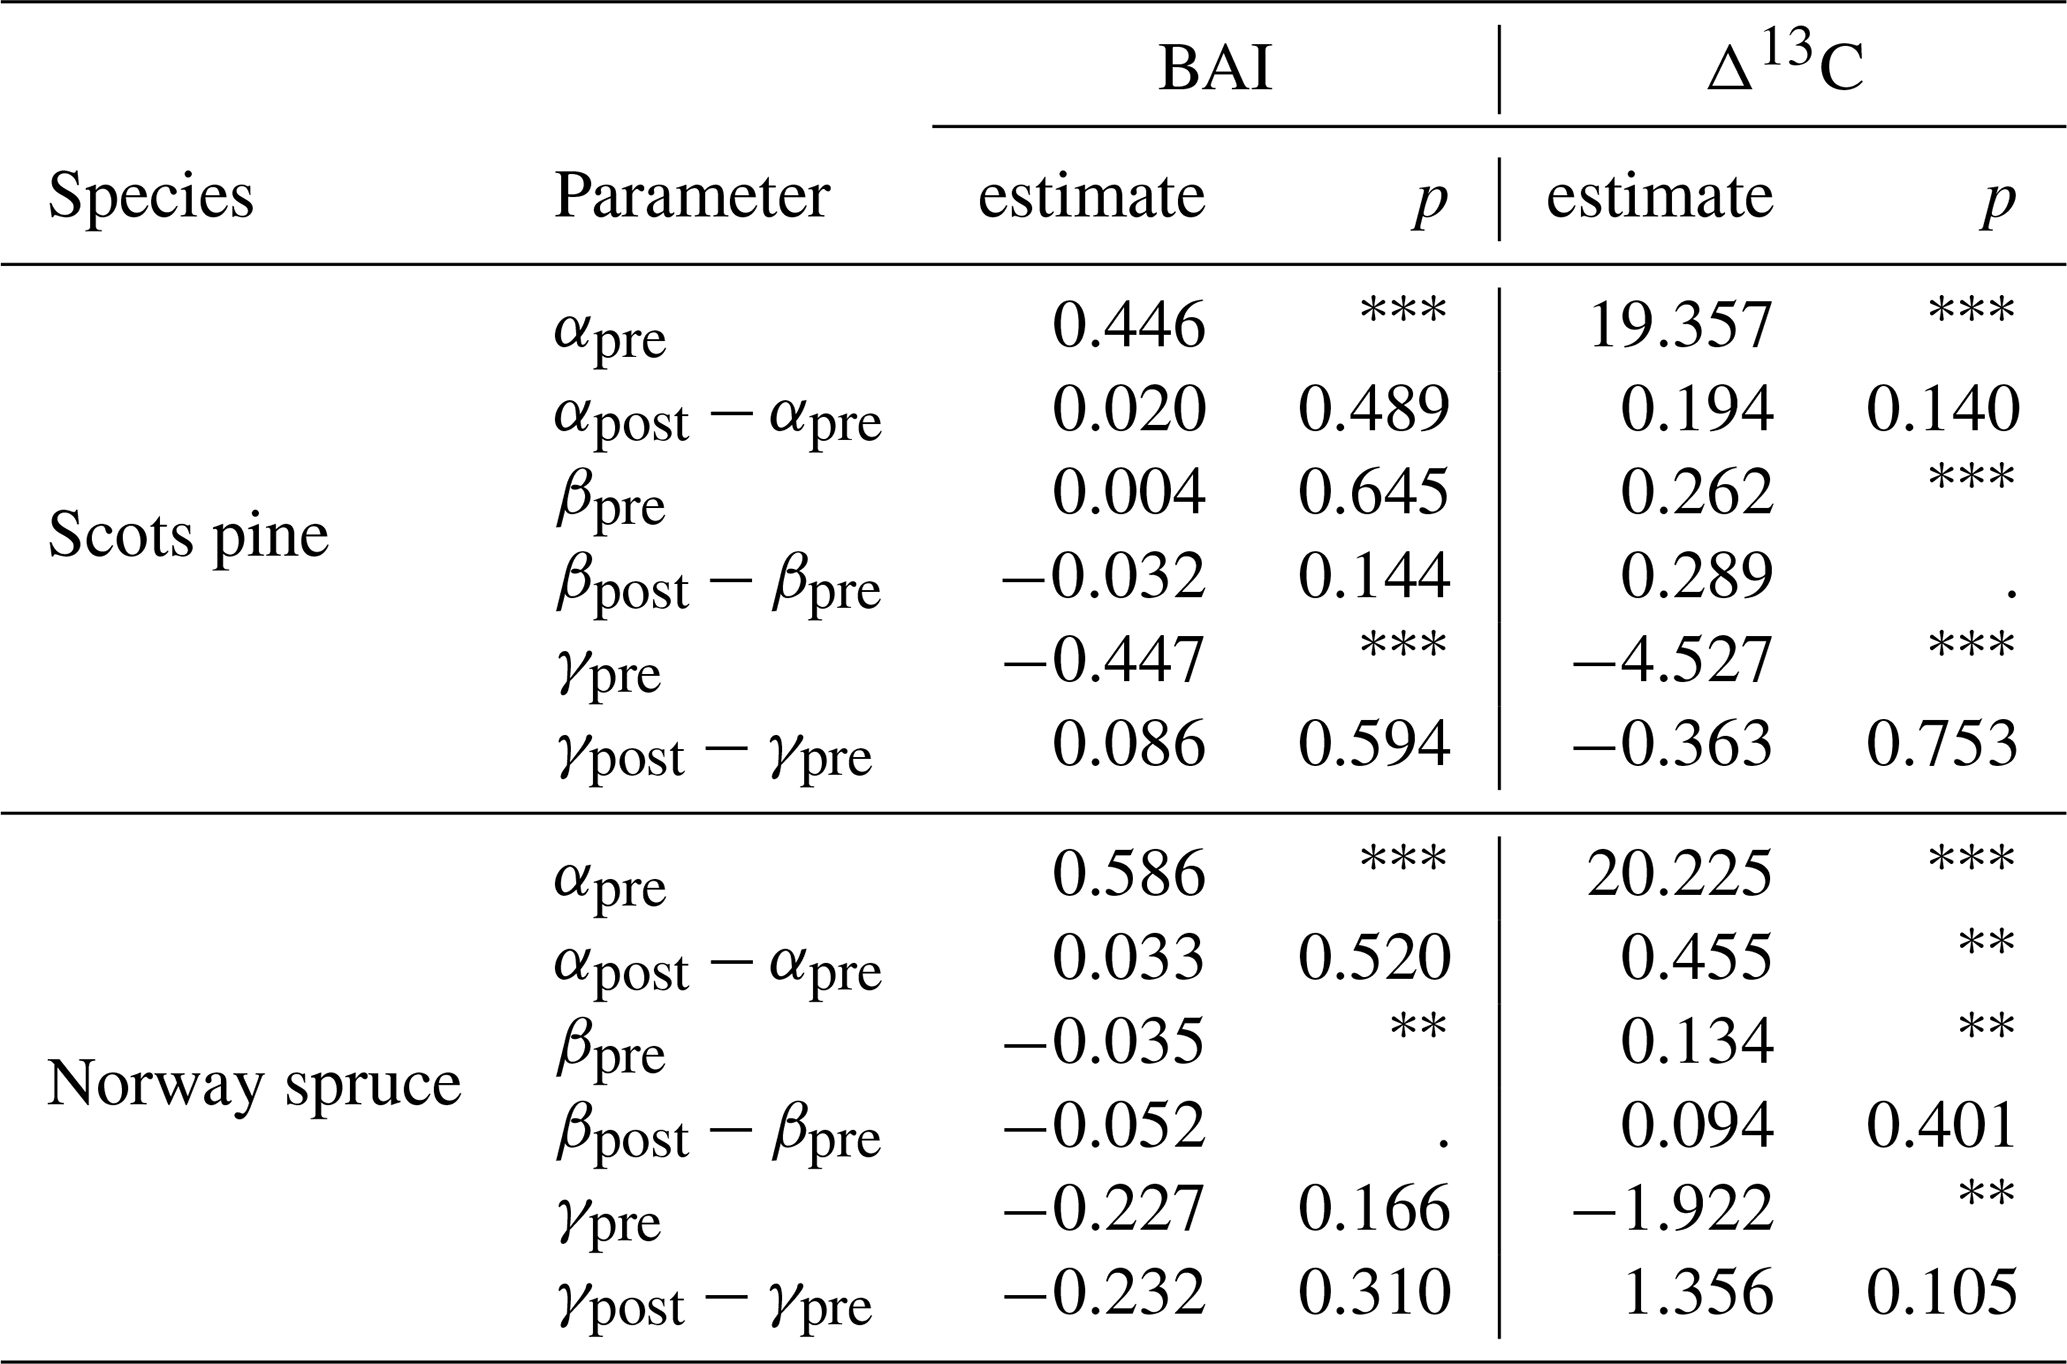
Table 4Climate sensitivity of basal area increment (BAI) and carbon isotope discrimination (Δ13C) for Scots pine and Norway spruce before and after 2016. Slopes are derived from linear mixed-effects models for atmospheric vapor pressure deficit (VPD) and the Standardized Precipitation–Evapotranspiration Index (SPEI). Effect-size classes (small, moderate, large) are defined relative to observed variability (BAI: 0.14–1.28 m2 ha−1 yr−1; Δ13C: 16.5 ‰–22.3 ‰) and represent the proportional contribution of each slope to the total observed range of variability per unit climate forcing. BAI slope = m2 ha−1 yr−1 per unit and Δ13C slope = ‰ per unit.
In this study, we combined regional GI estimates from the NFI with site-level tree-ring analyses of BAI and Δ13C to evaluate how Scots pine and Norway spruce respond to intensifying water stress across mineral and organic soils under contrasting water-availability conditions in southern Finland. Both species showed growth reductions during their breakpoint-defined post-change periods, but the magnitude and physiological response differed. Norway spruce showed particularly strong post-change declines in GI and BAI across both soil types, whereas Scots pine exhibited comparatively smaller growth reductions and maintained relatively stable growth under wet conditions. In contrast, Scots pine displayed a stronger increase in iWUE under recent dry conditions, while Norway spruce showed weaker and less consistent iWUE responses despite substantial growth decline. These contrasting growth-physiology relationships suggest species-specific differences in adjustment to ongoing shifts in increasing atmospheric moisture demand (Fig. 1), with important implications for future boreal forest dynamics, particularly in drought-prone environments such as southern Finland. Rising atmospheric dryness can induce considerable stress on boreal trees by increasing evaporative demand and reducing water availability, thereby constraining carbon uptake and growth (Adams et al., 2017; Frank et al., 2015). Consequently, species-specific differences in physiological regulation and growth sensitivity are likely to influence future forest dynamics, competitive interactions, and adaptive forest management strategies under ongoing climate change (Levesque et al., 2013).
After comparing the NFI data between soil types, the mineral and organic soils show similar temporal trends in GI (Fig. 2). Site-level analyses revealed additional contrasts associated with local moisture conditions, particularly in mean BAI and iWUE (Fig. 3), although these differences were not always statistically robust. Scots pine tended to exhibit stronger growth reductions on dry upland sites, while also showing increased iWUE, suggesting enhanced physiological adjustment under increasing water limitation. In contrast, Norway spruce showed consistent but non-significant tendencies toward stronger growth reductions on dry sites and generally higher mean BAI on dry rather than wet poorly drained sites, indicating reduced growth under wetter conditions. Its iWUE responses were weaker and differences across moisture conditions not statistically significant. These patterns indicate that local hydrological conditions may exert a stronger control on growth and physiological responses than broad mineral-versus-organic soil classifications alone.
Together, the results highlight that future forest vulnerability under climate change will likely depend on the interaction between species-specific drought sensitivity and spatial heterogeneity in soil water availability across the boreal landscape in southern Finland.
4.1 Environmental drivers on recent growth declines
The NFI data show a clear decline in GIs for both Scots pine and Norway spruce over the most recent decade (Henttonen et al., 2024; Fig. 2, Appendix A) consistent with our independent plot-based growth records (Fig. S2). Declines across species and soil types point to environmental drivers operating beyond individual sites. The period contrasts indicate changes in slopes rather than baseline levels. After propagating uncertainty in the 2016 breakpoint through the mixed models, slope contrasts retained their direction and significance class, whereas changes in the Norway spruce intercepts were not significant. The results therefore support altered climate sensitivity after 2016, but not an abrupt shift in baseline growth or Δ13C. In Norway spruce, SPEI had contrasting relationships with the two responses. Δ13C increased with SPEI in both periods, consistent with reduced stomatal limitation in wetter summers, whereas BAI decreased with SPEI, particularly after 2016. The negative BAI–SPEI relationship therefore cannot be interpreted as evidence of soil water limitation. All Norway spruce plots were on drained organic soils, where growth is also influenced by drainage and water-table dynamics that were not measured here. Evidence for an atmospheric drought constraint is clearer for VPD, which was negatively associated with growth after 2016.
Biotic damage may also have contributed to the Norway spruce decline. Drought can increase Norway spruce susceptibility to the European spruce bark beetle (Ips typographus) and associated fungi (Netherer et al., 2024), while heat, drought, and windthrow can promote outbreaks (Netherer et al., 2021). Visibly damaged trees were avoided during sampling, but damage status was not recorded, and the tree-ring data include only trees surviving until sampling. Nevertheless, a similar post-2016 shift in the independent regional NFI growth index and the concurrent change in Δ13C indicate that undetected biotic damage alone is unlikely to explain the observed pattern. However, a compounding effect of bark beetles or pathogens cannot be excluded, and survivorship bias may cause stand-level growth losses to be underestimated.
According to our observations, increased VPD is a significant driver of the recent growth decline observed in Norway spruce in southern Finland. Based on site-level data, Scots pine showed a slight decrease in growth in dry conditions during the last decade. However, in both dry and wet conditions, growth variability was accompanied by a steep increase in iWUE (Fig. 3). The large Δ13C–VPD slopes observed for Scots pine ( to −4.9 ‰ per unit VPD) indicate a strong stomatal response to atmospheric drought. However, this pronounced isotopic sensitivity, growth reductions in Scots pine remained moderate. This mismatch in sensitivities suggests that Scots pine was able to regulate water loss under high evaporative demand without a proportional reduction in radial carbon accumulation.
In contrast, Norway spruce exhibited a substantial decline in growth in both dry and wet conditions, especially after 2016, alongside relatively stable iWUE. This different mismatch suggests that growth reductions were not tightly coupled to increased stomatal regulation. Instead, the decline may reflect non-stomatal limitations to carbon accumulation, potentially associated with hydraulic stress, reduced photosynthetic capacity, or altered carbon allocation. This interpretation is consistent with the lower stomatal sensitivity to atmospheric drought reported for Norway spruce compared to pine species (Ewers et al., 2001; Oren et al., 1999).
Correlation analyses indicate that Norway spruce growth is not only sensitive to current-year VPD but also shows stronger lagged and seasonal responses to VPD, particularly in previous-year autumn conditions. This response is consistent with documented carryover effects in spruce growth (Bouriaud and Popa, 2009), and whereby structural carbohydrate dynamics and storage of assimilates link current growth to climatic conditions in previous years. In particular, autumn carbon allocation and subsequent spring depletion of stored reserves can mediate delayed responses to climatic stress such as elevated VPD. Consistently, growth responses in this species became more strongly constrained after 2016, while Δ13C–climate relationships did not show comparably strong shifts between periods, indicating a divergence between physiological response and growth limitation. This pattern points to an increasing role of cumulative stress effects or non-stomatal limitations (e.g., carbon allocation or hydraulic constraints) in controlling growth.
Declining SPEI and increasing VPD intensify physiological stress by exerting additional pressure from drier soils and a heightened atmospheric moisture demand (Allen et al., 2010, 2015; Williams et al., 2013). This process accelerates soil moisture depletion and increases drought severity (Novick et al., 2016). When expressed per standard deviation of each predictor (Table S20), SPEI and VPD showed contrasting importance between species. VPD had the larger effect across both responses and periods in Scots pine, whereas their effects were more similar in Norway spruce, with SPEI larger in three of the four comparisons. This suggests that Scots pine responses were more strongly associated with atmospheric dryness, while Norway spruce responded similarly to atmospheric demand and summer water balance. The impact of these processes is evident in the responses documented in Scots pine and Norway spruce (Fig. 6). Norway spruce showed a notable decline in growth, particularly after 2016, and was more severely impacted by rising VPD, likely due to its physiological characteristics and adaptation to colder, more humid conditions (Lagergren and Lindroth, 2002; Levesque et al., 2013; Pichler and Oberhuber, 2007; Thum et al., 2008).
Overall, our results align with broader trends observed not only in boreal forests across Fennoscandia (Henttonen et al., 2024; Junttila et al., 2024; Laudon et al., 2024), but also throughout Europe (Knutzen et al., 2025; Römer et al., 2025), where soil water limitation and increasing VPD have been linked to increased tree mortality and growth declines (Adams et al., 2017; Grossiord et al., 2020). Recent studies further indicate that the current degree of atmospheric drying is unprecedented compared to the last 400 years (Treydte et al., 2023), making these observations a regional, emerging problem that is largely driven by ongoing climate change. This intensification of water stress not only heightens the vulnerability of these forest ecosystems but also poses a severe threat to tree species with limited adaptability to arid conditions (IPCC, 2023).
Gridded climate data represent regional forcing and do not resolve plot-scale variation in hydrology and microclimate. This scale mismatch may explain why local moisture classes captured variation in BAI and iWUE not detected by the gridded predictors. SPEI should therefore be interpreted as a regional water-balance index rather than a measure of plot-level soil moisture (De Frenne et al., 2021; Lembrechts et al., 2019).
4.2 Δ13C reveals tree responses to environmental stress
Analysis of Δ13C in tree rings has shown that it offers valuable insights into the physiological adjustments of trees in response to environmental stress (Brooks et al., 1998; McDowell et al., 2003). Δ13C reflects the ratio of intercellular to atmospheric CO2 concentrations, which in turn is influenced by stomatal conductance and photosynthetic rate (Farquhar et al., 1982). Under water-limited conditions, trees close their stomata to conserve water, but stomatal regulation can vary among species, resulting in interspecies discrepancies in reduced stomatal conductance and limited CO2 uptake. This water-carbon balance, in turn, leads to changes in the Δ13C values fixed within the tree ring (Barbour and Farquhar, 2000; Francey and Farquhar, 1982).
Moreover, the observed changes in Δ13C values are indicative of adjustments in iWUE and carbon assimilation under variable water availability (Ehleringer et al., 1993). Increases in iWUE suggests that trees optimize water use by regulating stomatal aperture to balance water loss with carbon gain (Walker et al., 2020). The strong linear relationship found between Δ13C and moisture-related climate variables, even when using detrended time series, suggests that trees respond physiologically to the interannual variations in water availability and not only to the long-term trends (Figs. 5 and S17–S18).
Although detrended BAI and GI data may not show strong correlations with climate variables due to different limiting factors affecting growth (Cabon et al., 2020; Cuny et al., 2015), the physiological responses captured by Δ13C provide evidence of water stress impacting the long-term growth trends (Figs. 4, 5, and 6). This observation highlights an apparent contradiction, where growth data alone may under detect the impacts of water-related physiological stress, emphasizing the importance of integrating physiological indicators (such as Δ13C) with growth measurements to achieve a more comprehensive understanding of tree responses.
Moreover, our findings align with those of McDowell et al. (2010), who demonstrated that drought-induced mortality was related to a significant decline in growth alongside low iWUE sensitivity to water limitation. Here, “iWUE sensitivity” refers to the magnitude of the temporal trend or slope in iWUE, where a significant sensitivity indicates a steep trend, and a low sensitivity indicates a nearly flat slope (Fig. 3D). McDowell et al. (2010) observed that surviving trees experiencing water stress exhibited increased stomatal closure, leading to reduced carbon assimilation and growth, and predisposing them to higher mortality risk. However, trees that died showed a larger growth decline but lower sensitivity in iWUE. Consequently, a sharp decline in growth coupled with modest increase in iWUE, as observed in Norway spruce relative to Scots pine, suggests that Norway spruce has lower stomatal regulation (i.e., a low water regulation buffer) during periods of increasing water demand. The corresponding abrupt decline in growth is consistent with the dual pattern of growth and Δ13C observed elsewhere (McDowell et al., 2010; Wang et al., 2021), suggesting that Norway spruce may be experiencing similar physiological stress that could increase its vulnerability to mortality under continued water-limiting conditions.
Scots pine showed no significant change points in Δ13C at any plot, whereas Norway spruce shifted to declining Δ13C after 2015–2016 at three of six plots. This difference reflects contrasting temporal response patterns rather than a stronger physiological sensitivity in spruce. Scots pine exhibited a relatively consistent increase in iWUE throughout the study period, together with stronger Δ13C responses to interannual variation in VPD (−4.53 ‰ and −4.89 ‰ per unit VPD before and after 2016, against −1.92 ‰ and −0.57 ‰ in Norway spruce; Table 4), consistent with sustained stomatal regulation under increasing atmospheric water demand: the Scots pine response is gradual and persistent, so there is no structural break to detect. In contrast, Norway spruce maintained relatively stable Δ13C values for much of the record before shifting after 2015–2016, producing detectable breakpoints despite comparatively weaker iWUE responses. The post-2015 decline in Δ13C coincided with the pronounced reduction in spruce growth, indicating that temporal changes in Δ13C trajectories and climatic sensitivity represent distinct aspects of species responses to increasing drought stress. Moreover, the observed stability in Scots pine growth suggests an effective water-use strategy, enabling it to sustain growth under a long trend of declining water availability, thus avoiding abrupt changes in secondary growth. The findings indicate that Scots pine shows resilience to water limitations, maintaining growth and carbon assimilation (as seen in BAI and GI) while regulating water loss through increased iWUE.
The variations in both Δ13C and iWUE of the two species underscore their divergent strategies for coping with increasing water limitations. The use of Δ13C as a physiological indicator helps our understanding of how trees respond to climatic variability from a mechanistic angle. The value of Δ13C in interpreting tree responses to environmental stress has been demonstrated in previous studies (Brooks et al., 1998; Saurer et al., 2014), reinforcing its applicability in the present research.
4.3 Species and soil influences on tree water stress and forest management implications
Norway spruce showed stronger growth sensitivity and weaker iWUE response than Scots pine under increasing water limitation in southern Finland, highlighting important considerations for the management of these tree species in this boreal region. However, species responses also varied with site conditions, indicating that soil-water interactions modulate drought impacts at finer spatial scales.
At the regional scale, both species showed weak and non-significant tendencies toward stronger breakpoint-defined post-change growth declines on mineral soils compared with organic soils, likely reflecting lower soil water availability and reduced water retention capacity during dry periods (Launiainen et al., 2022; Zignol et al., 2025). Despite this, mean GI patterns differed between species, with Scots pine tending to maintain slightly higher values on mineral soils and Norway spruce on organic soils. Together, these results suggest that broad mineral-versus-organic soil classifications exert only a limited influence on recent growth dynamics relative to species identity and local hydrological conditions.
For Scots pine, the tendency toward slightly lower GI on organic soils may reflect hydrological constraints despite their generally high water-holding capacity. During dry periods, organic soils can experience reduced hydraulic connectivity due to surface drying and the formation of hydrophobic layers, which limit infiltration and root water uptake (Doerr et al., 2000; Hökkä et al., 2025). These processes may constrain access to near-surface water and potentially contribute to reduced growth under drought conditions. In contrast, Norway spruce exhibited slightly higher mean GI on organic soils, whereas mineral soils may expose the species to more frequent short-term water deficits due to lower water storage capacity. This vulnerability may be further exacerbated by the relatively shallow rooting system of spruce under stressful conditions, limiting access to deeper soil moisture (Kalliokoski et al., 2008; Puhe, 2003). Overall, these findings suggest that soil type alone does not exert a dominant control on post-change growth dynamics but instead may interact with species-specific traits and local hydrological conditions to modulate drought sensitivity. This highlights the importance of integrating both species-specific characteristics and fine-scale site conditions when assessing drought risk and developing adaptive forest management strategies.
Focusing on contrasting soil moisture conditions, namely upland versus lowland positions on mineral soils for Scots pine and poorly versus well-drained organic soils for Norway spruce, both species showed weak and non-significant tendencies toward stronger growth declines under drier site conditions, likely due to lower soil water availability. However, clearer differences emerged in mean responses (EMMs), particularly for Scots pine. Scots pine growing on dry upland mineral soils exhibited lower BAI but notably higher iWUE during the breakpoint-defined post-change period, indicating a physiological shift toward tighter stomatal control under greater water stress. Conversely, Scots pine on wetter lowland mineral soils displayed higher BAI and lower iWUE, consistent with more favourable growing conditions and reduced need for physiological water conservation. These divergent patterns underscore the critical role of soil moisture regimes in mediating species responses to water limitation (Bose et al., 2020; Green et al., 2019). From a forest management perspective, upland Scots pine stands may benefit from interventions such as reducing stand density, enhancing structural diversity through varied tree ages, sizes, and rooting depths, or promoting mixed-species composition to alleviate water stress and enhance resilience (Aldea et al., 2024; Hanby et al., 2025; Pardos et al., 2021). In contrast, lowland stands could be managed to optimize growth while closely monitoring soil moisture conditions for emerging drought risks. Integrating these spatially explicit strategies will be essential for sustaining Scots pine productivity and stability under intensifying climate change in southern Finland.
Norway spruce growing on poorly-drained organic soils showed lower BAI during the breakpoint-defined post-change period compared with well-drained conditions, indicating reduced growth under saturated soil conditions. Prolonged waterlogging in these soils, where roots tend to remain shallow to avoid anoxic layers, likely limited oxygen availability and impaired root functioning, nutrient uptake, and access to deeper water reserves, thereby increasing vulnerability to subsequent dry periods (Lampela et al., 2023). Consistently, trees on both soil-moisture types showed only modest increases in iWUE, highlighting a limited physiological capacity to cope with intensified water stress. Consequently, current forest management approaches in drained organic soils of southern Finland, where spruce-dominated stands are widely favoured, may require reconsideration. Promoting mixed coniferous stands could enhance ecosystem resilience, while management strategies that reduce drainage intensity and promote greater water retention in peat soils may help buffer trees against drought impacts (Hökkä et al., 2025; Pardos et al., 2021). Further, practical adjustments to silvicultural regimes in drained peatlands, such as modifying thinning regimes and/or adopting alternative final-harvesting methods including continuous-cover forestry, could reduce intra-stand competition for water by maintaining heterogeneous stand structures and lower peak resource demand compared to even-aged systems (Lehtonen et al., 2023b; Leppä et al., 2020a, b; Tikkasalo et al., 2023). Modifying drainage systems through measures like block ditching and/or partial rewetting may also improve soil water storage (Laine et al., 2011), while continuous monitoring of soil conditions is critical to inform adaptive silvicultural decisions under variable hydrological regimes (Mäkipää et al., 2024). Collectively, these strategies offer promising pathways to improve tree performance and long-term ecosystem stability in drained organic soils as climate-induced water stress intensifies.
Our findings demonstrate that forests in southern Finland are increasingly affected by water limitation, particularly during the most recent decade. Norway spruce showed a more pronounced reduction in growth following the post-2016 period, while Scots pine exhibited smaller and more gradual growth declines, evident at the site level from around 2009 but not supported in the regional growth index. In parallel, iWUE increased more steeply in Scots pine than in Norway spruce, suggesting a weaker physiological adjustment in spruce and reinforcing its greater vulnerability to rising water limitation and prolonged drought stress.
Interannual variability in both growth and iWUE was generally consistent with changes in SPEI and VPD, highlighting the pivotal role of water limitation in shaping recent growth and physiological responses. Linear mixed-effects models further confirmed that species-specific sensitivity to these hydroclimatic drivers differed, with Norway spruce showing stronger growth reductions and a significant VPD constraint on growth after 2016, while Scots pine appeared more buffered in growth and exhibited stronger increases in iWUE. Expressed per standard deviation of each predictor, VPD dominated the responses of Scots pine, whereas Norway spruce responded to atmospheric demand and to the summer water balance to a similar degree.
Tree responses to increasing water limitation were primarily structured by species, with weaker modulation by soil type and site-level moisture conditions. Across variables, soil-related differences were generally more apparent in mean values than in temporal trends. Breakpoint-defined post-change period declines in GI tended to be stronger on mineral soils for both species, although not significantly, while mean GI showed weak contrasting patterns, with Scots pine somewhat higher on mineral soils and Norway spruce on organic soils. At the site level, moisture effects were more pronounced: both species tended toward stronger growth declines under dry conditions, but Scots pine maintained higher mean BAI on wet plots, whereas Norway spruce showed higher mean BAI on dry plots, indicating reduced growth under poorly drained conditions. Patterns in iWUE further emphasized species contrasts, with Scots pine showing higher iWUE under dry conditions and Norway spruce displaying weak and non-significant responses across moisture regimes.
Taken together, our findings highlight that boreal forest responses to increasing water limitation are primarily structured by species-specific physiological strategies, while being modulated by local hydrological conditions. Accounting for both species differences and fine-scale variation in soil moisture conditions in adaptive forest management strategies will be essential for maintaining forest productivity and resilience under increasingly warm water-limited climatic conditions in northern Europe.
Growth indices (GI) were estimated based on tree-ring increment cores collected on Finnish NFI sample plots using linear mixed-effects models (Eq. A1).
where gpit is the basal area increment measured in the year t from the core of tree i on NFI sample plot p, α is the intercept term of the model, ap and bi are random plot and tree effects, respectively, and the residuals ϵpit are assume to follow an AR(1) temporal autocorrelation structure. The dots (⋯) represent model terms that are expected to explain within-year growth variability, including the impact of age, basal area and relative size of tree i, as well as site fertility class and average temperature sum at the location of plot p. Thus, terms γt are expected to capture the annual variation in log-transformed increments attributable to environmental factors such as climate variability.
The annual GI for year t was defined as:
where and is the average of all γt's.
In linear models with categorical predictors, such as year t (treated as a categorical rather than continuous variable) in this case, all parameters are not significant. This is conventionally handled by fixing the effect associated to one of the classes to zero. In this case, γt was fixed to zero for the reference year 2022. Selection of reference year has no impact on the estimated GI values, but it must be taken into account when estimating its sampling variance, as explained below.
For simplicity, let us denote the years included in the model by . As a result of fitting the linear mixed model, we obtained the estimates ( not included) and their covariance matrix Σ.
Since
where
the variance-covariance matrix of is
The non-linear transformation (Eq. A2) was handled with a Monte Carlo approach:
-
1000 realizations of parameter vector γ′ were simulated from the multivariate normal distribution with mean vector and covariance matrix Σ′,
-
the transformation was applied to each simulated γt′: , and
-
95 % confidence interval was constructed from the 0.025- and 0.975-quantiles of the 1000 simulated values of It′.
The GIs and their 95 % confidence intervals were estimated by tree species (Scots pine and Norway spruce) and soil type (mineral and organic; Fig. A1). Although the standard errors of GIs are relatively large on organic soils, especially for Norway spruce, and increase towards the end of the series due to the decreasing sample size (Fig. 2), interannual variability in them is estimated with relatively high precision (Fig. A2 left). This is explained by the strong positive error correlations of the estimate for subsequent years (Table A1) resulting from the tree-level random effects (the core from one tree contributes to several years' GIs).
The effects of GI uncertainty on breakpoint detection (Fig. 4A–B) were assessed by fitting the segmented regression models to each of the 1000 simulated GI series in the same way as to the estimated GIs (Sect. 2.4.2). Detection rates differed strongly among spp. and soil types. For Scots pine, a significant breakpoint was detected in only 9 out of 1000 simulations (0.9 %) on mineral soils and in 320 of 1000 (32 %) on organic soils, where breakpoints were detected on organic soils they clustered near 2019 (median 2019.4, 95 % range 2019.0–2020.1) rather than near 2009. For Norway spruce, every simulation on mineral soils yielded exactly one significant breakpoint (100 %; median 2016.3, 95 % range 2016.0–2016.7). On organic soils the outcome was more variable: no breakpoint in 9.7 % of simulations, one breakpoint in 43.6 %, and two breakpoints in 46.7 %, with the breakpoint nearest 2016 having a median of 2016.8 and a 95 % range of 2009.3–2017.7 (Fig. A2 right). The probability that a breakpoint exists is therefore 1.00 for Norway spruce on mineral soils and 0.90 on organic soils, against 0.01 and 0.32 for Scots pine on mineral and organic soils, respectively. The species contrast reported in Sect. 3.1 and 3.3 is thus a property of the sampling distribution of the growth index and not of any single realisation.
Two features of the procedure should be stated. First, the breakpoint search implemented for the submitted analysis stopped after two breakpoints, so simulations recorded as having two breakpoints were right-censored rather than having stopped because no further break was significant. Re-running the same simulations without this limit shows that 33.0 % of the Norway spruce organic-soil simulations in which a breakpoint is detected support three or more, and that 98.7 % of those that stopped on the limit prove to have three or more once it is removed; these simulations describe a series with several changes of slope rather than a single shift around 2016. Detection on the observed NFI series is unaffected: without the limit the procedure returns exactly one breakpoint for both Norway spruce series and none for either Scots pine series, identical to Table S19. Second, the original simulation was run without a fixed random seed, so the 1000 realisations reported here are those preserved from the original run rather than a regenerated set; a seed has been added to the archived code.
Confidence intervals for segmented regression predictions (Fig. A3) were constructed from the 0.025- and 0.975-quantiles of the pointwise predictions over the 1000 models based on the 1000 simulated GI series. For spruce on organic soils, the slope was positive in 98 % of simulations in 2015, 66 % in 2016, and 18 % in 2017.
The same 1000 realisations were carried through the segmented regressions and through Eq. (6), so that the results reported in the main text are not conditional on a single detected breakpoint. Pooling by Rubin's rules over the 1000 realisations, the Norway spruce GI trend on mineral soils is yr−1 before the breakpoint (p<0.001) and yr−1 after it (p=0.006), with a breakpoint detected in every realisation (median 2016.3). On organic soils the pooled point estimates are of the same sign and comparable magnitude ( and yr−1) but neither differs significantly from zero (p=0.48 and p=0.26), a breakpoint is detected in 90 % of realisations, and its location is less well constrained (95 % range 2009.3–2017.7); the regional decline in Norway spruce growth after 2016 is therefore resolved by the NFI sample on mineral soils, whereas on organic soils the direction of change is consistent but its magnitude is not (Table A2). Carried through Eq. (6), the pooled fixed effects retain the sign and significance class of the estimates reported in Tables 3 and 4 for both species and both response variables: for Norway spruce the SPEI effect on BAI is −0.036 (95 % CI −0.065 to −0.008, p=0.013; significant in 100 % of realisations) and the VPD effect on Δ13C is −1.84 (95 % CI −3.08 to −0.60, p=0.004; significant in 98 %), and for Scots pine the VPD effects on both BAI and Δ13C remain significant in 100 % of realisations. The shift in intercept between periods is the one quantity that does not survive: for Norway spruce BAI it changes sign relative to the fixed-2016 fit (+0.033 fixed against −0.010 pooled, p=0.911), is significant in only 30 % of realisations, and has 66 % of its variance attributable to the breakpoint location, while for Δ13C it weakens from p=0.002 to p=0.045 conditional on detection and to p=0.079 under the full model average (Table S21). A fixed-split sensitivity analysis at 2015, 2016 and 2017 gives the same picture (Table S22).
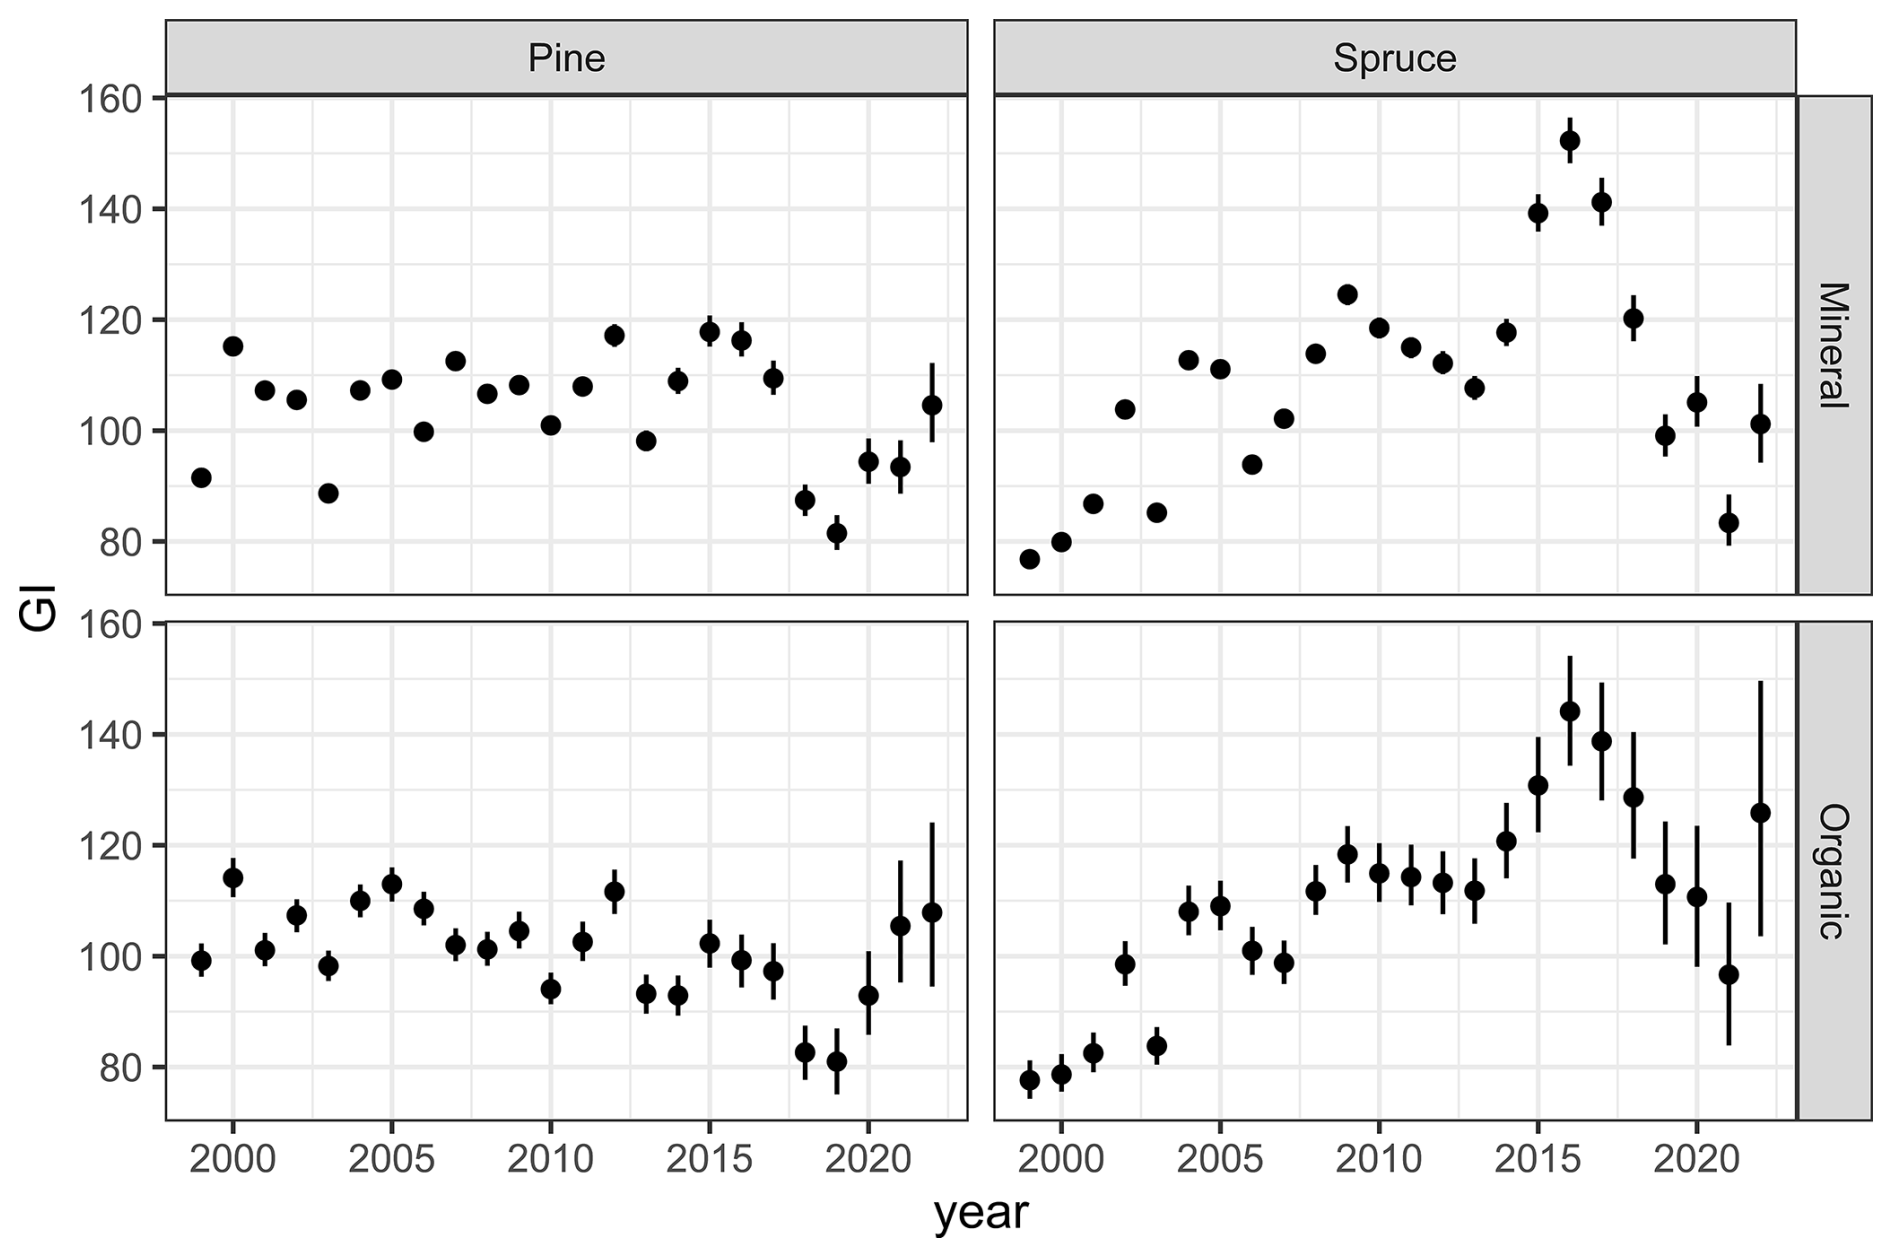
Figure A1NFI-based standardized growth index (GI) for Scots pine and Norway spruce from 1999 to 2022 on mineral and organic soils (cf. Fig. 2). Error bars represent the 95 % confidence intervals depicting the uncertainty due to NFI sampling.
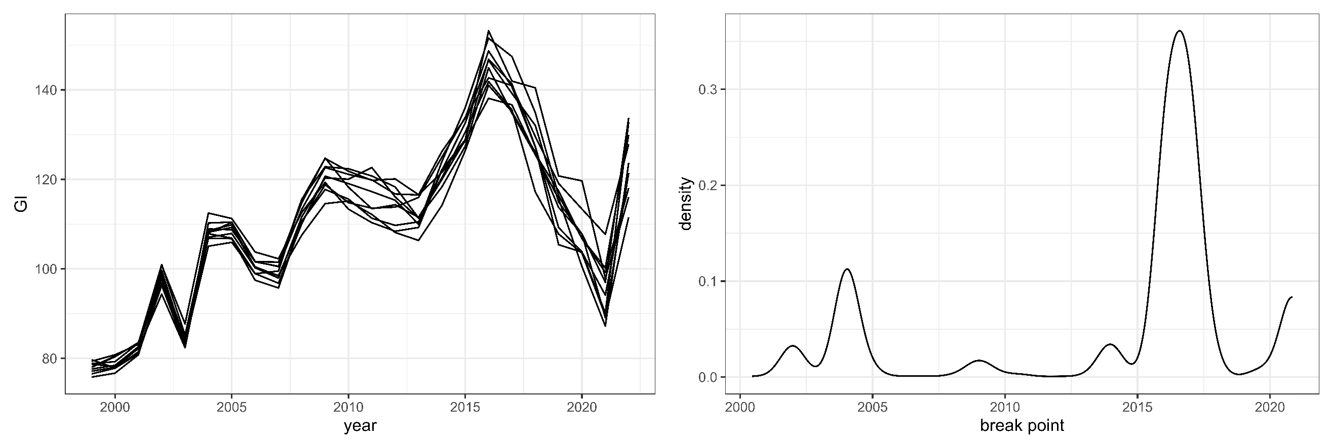
Figure A2Left: Ten realisations of GI series for Norway spruce on organic soils, simulated from the distribution determined by the NFI sampling variance and correlations of the GI estimates. Right: Relative frequencies of all break points of segmented regression models fitted to the 1000 simulations from the uncertainty distribution of GIs for spruce on organic soils.
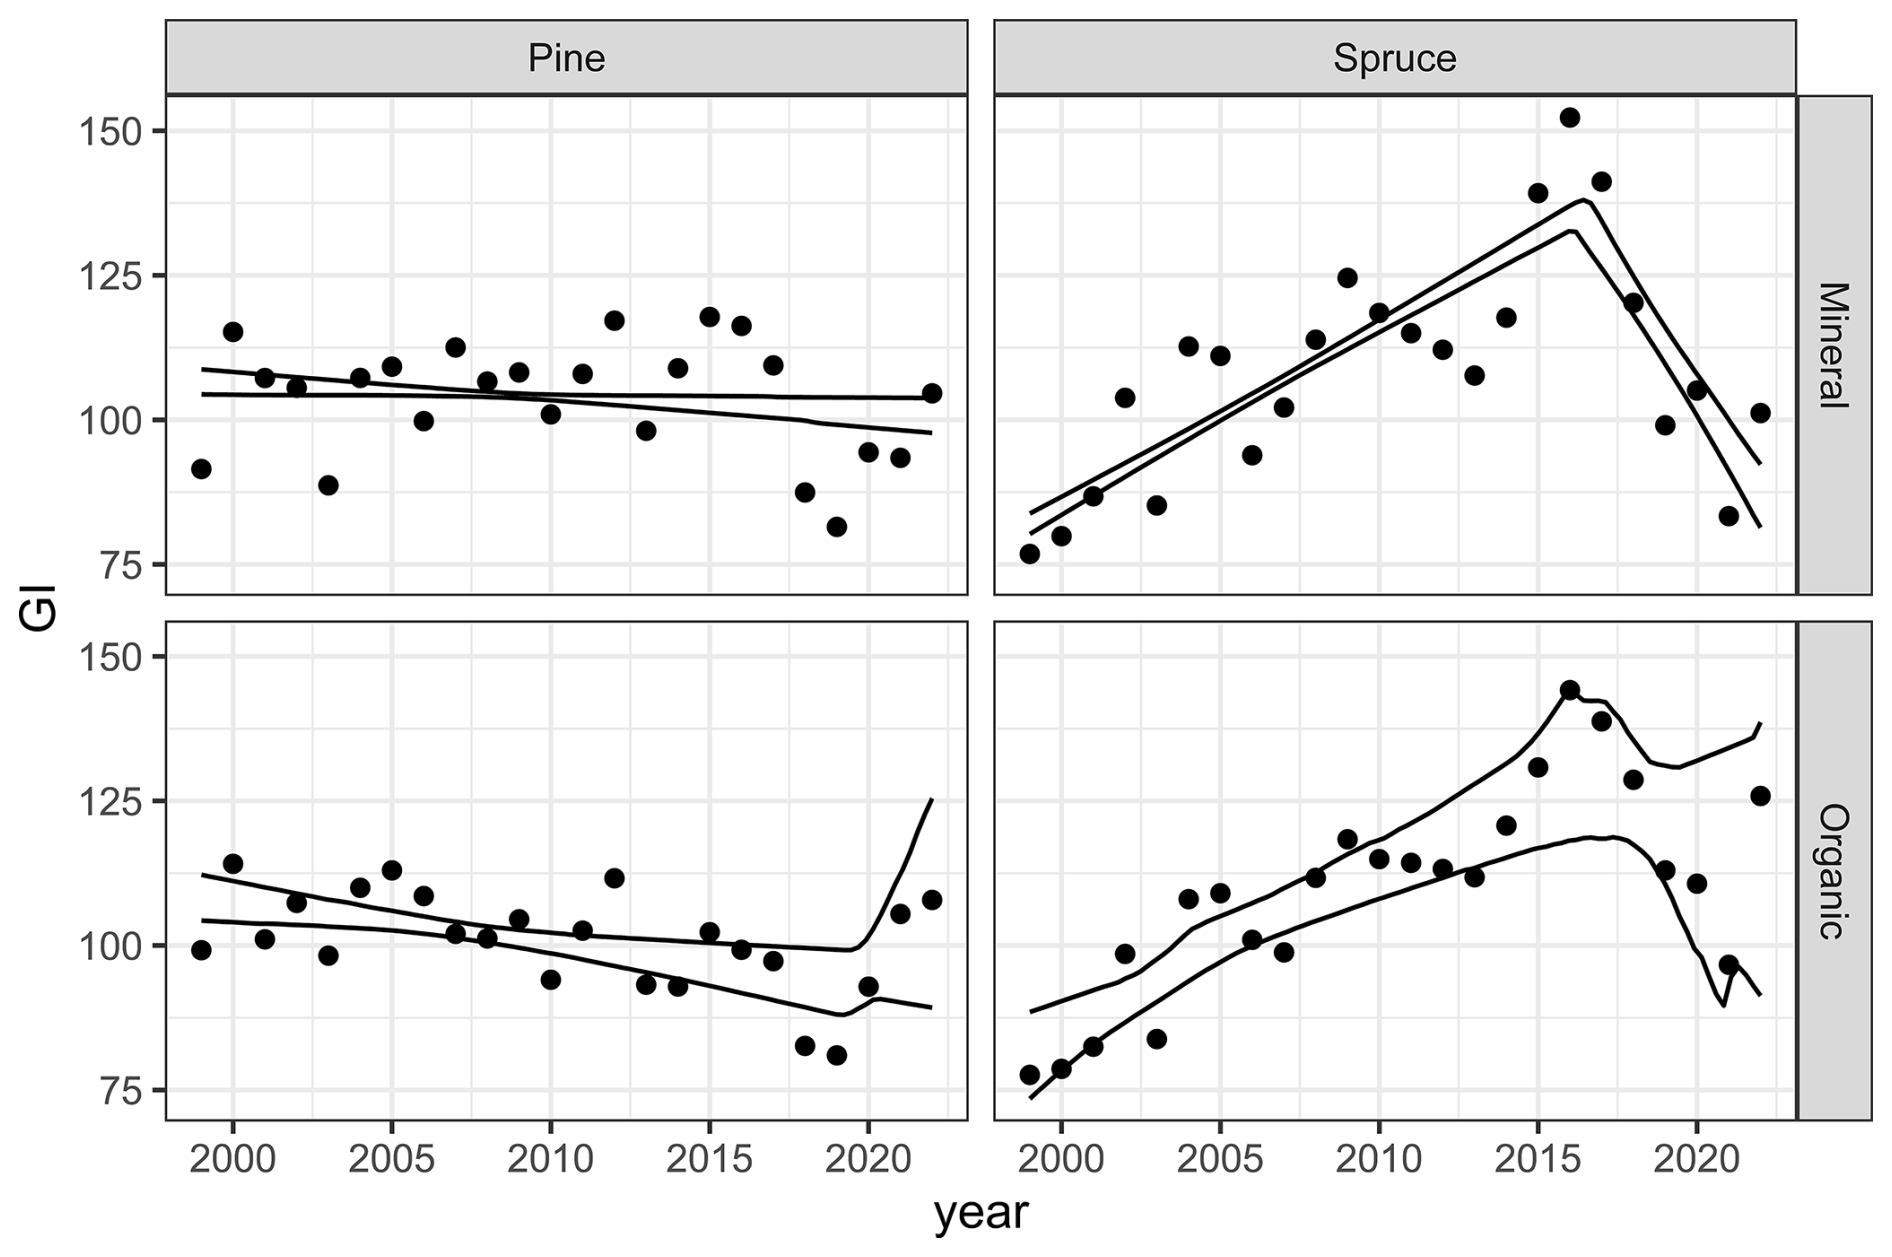
Figure A3NFI-based standardized growth index (GI) and confidence intervals (95 %) for segmented regression predictions, accounting for NFI sampling uncertainty. Points show GI; lines denote confidence intervals.
Table A1Correlation matrix of sampling errors of the GI estimates for Norway spruce on organic soils for the period 2015–2022.
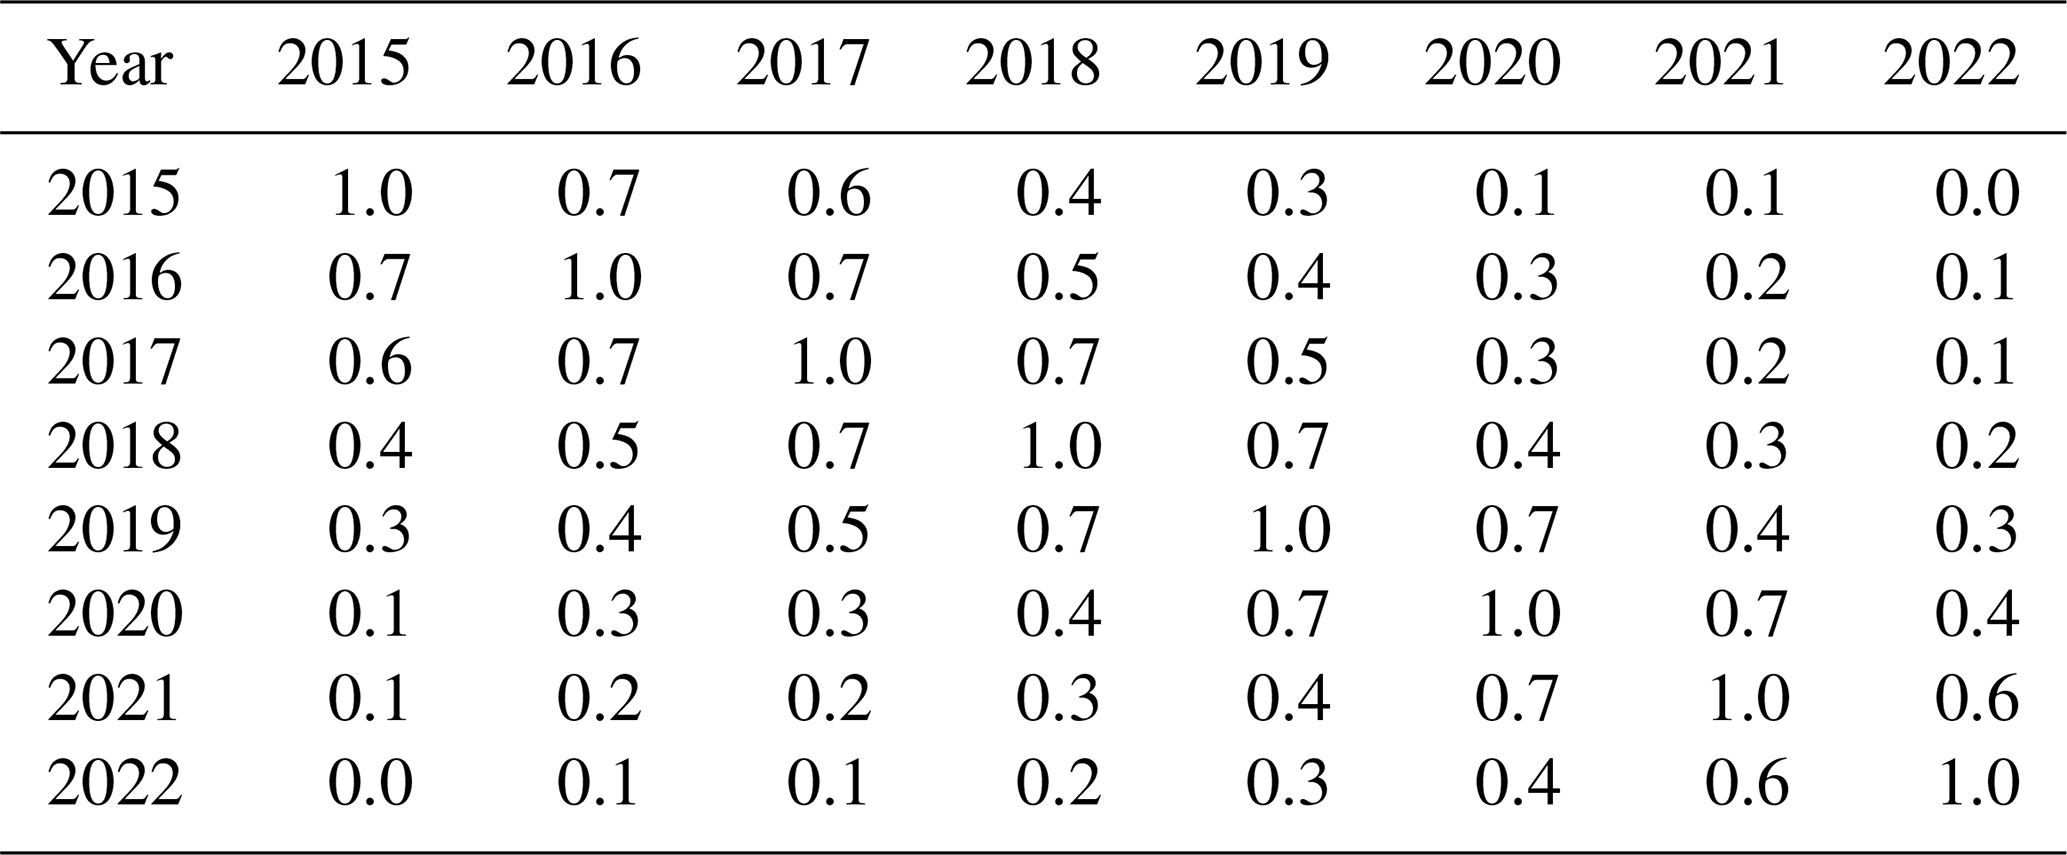
Table A2Segmented-regression estimates for the NFI growth index with NFI sampling uncertainty propagated. Each of the 1000 simulated GI series was fitted in the same way as the estimated GI (Sect. 2.4.2); slopes are pooled by Rubin's rules over the realisations in which a breakpoint (BP) was detected and located inside the 1999–2022 window. P(BP) is the proportion of the 1000 realisations yielding at least one significant breakpoint. The last column gives the number of realisations contributing to the pre- and post-breakpoint slopes; it is smaller than 1000×P(BP) where a detected breakpoint fell outside the analysis window. Post-breakpoint slopes for Scots pine rest on very short segments and few realisations and should not be interpreted as evidence of a regional trend.

BAI, Δ13C, and iWUE data analysed in the Stable Isotope Laboratory of Luke (SILL), Natural Resources Institute Finland (Luke), along with GI data from the Finnish NFI, and the R code generated in this study, are openly available in the Zenodo digital repository at https://doi.org/10.5281/zenodo.23237169 (Szejner et al., 2026).
The supplement related to this article is available online at https://doi.org/10.5194/bg-23-7223-2026-supplement.
PS: Conceptualization, Formal analysis, Investigation, Methodology, Visualization, Writing - original draft & editing. EMG: Conceptualization, Formal analysis, Investigation, Methodology, Data curation, Writing – original draft & editing. HH: Data curation, Methodology, Writing - review & editing. JH: Formal analysis, Methodology, Writing - review & editing. KTR: Writing - review & editing. PK: Data curation, Writing - review & editing. GY: Data curation, Writing - review & editing. ES: Data curation, Methodology, Writing - review & editing. RM: Writing - review & editing. AL: Conceptualization, Project administration, Resources, Writing - review & editing.
The contact author has declared that none of the authors has any competing interests.
Publisher's note: Copernicus Publications remains neutral with regard to jurisdictional claims made in the text, published maps, institutional affiliations, or any other geographical representation in this paper. The authors bear the ultimate responsibility for providing appropriate place names. Views expressed in the text are those of the authors and do not necessarily reflect the views of the publisher.
We thank the field and laboratory staff at the Natural Resources Institute Finland (Jari Ilomäki, Ari Ryynänen, Petri Salovaara, and Kati Tammela) for their assistance in field data collection and tree-core analysis.
This study was supported by the Natural Resources Institute Finland (Luke) and the Ministry of Agriculture and Forestry in Finland (Meka 2.0, grant no. VN/10860/2023-MMM-2), the European Union's Horizon Europe research and innovation programme under grant agreement no. 101084481 (FORWARDS), and NordForsk (grant no. 234152).
This paper was edited by Marcos Fernández-Martínez and reviewed by Andreas Lundgren and three anonymous referees.
Adams, H. D., Zeppel, M. J. B., Anderegg, W. R. L., Hartmann, H., Landhäusser, S. M., Tissue, D. T., Huxman, T. E., Hudson, P. J., Franz, T. E., Allen, C. D., Anderegg, L. D. L., Barron-Gafford, G. A., Beerling, D. J., Breshears, D. D., Brodribb, T. J., Bugmann, H., Cobb, R. C., Collins, A. D., Dickman, L. T., Duan, H., Ewers, B. E., Galiano, L., Galvez, D. A., Garcia-Forner, N., Gaylord, M. L., Germino, M. J., Gessler, A., Hacke, U. G., Hakamada, R., Hector, A., Jenkins, M. W., Kane, J. M., Kolb, T. E., Law, D. J., Lewis, J. D., Limousin, J. M., Love, D. M., Macalady, A. K., Martínez-Vilalta, J., Mencuccini, M., Mitchell, P. J., Muss, J. D., O'Brien, M. J., O'Grady, A. P., Pangle, R. E., Pinkard, E. A., Piper, F. I., Plaut, J. A., Pockman, W. T., Quirk, J., Reinhardt, K., Ripullone, F., Ryan, M. G., Sala, A., Sevanto, S., Sperry, J. S., Vargas, R., Vennetier, M., Way, D. A., Xu, C., Yepez, E. A., and McDowell, N. G.: A multi-species synthesis of physiological mechanisms in drought-induced tree mortality, Nat. Ecol. Evol., 1, 1285–1291, https://doi.org/10.1038/s41559-017-0248-x, 2017.
Ainsworth, E. A. and Rogers, A.: The response of photosynthesis and stomatal conductance to rising [CO2]: mechanisms and environmental interactions, Plant Cell Environ., 30, 258–270, https://doi.org/10.1111/j.1365-3040.2007.01641.x, 2007.
Aldea, J., Dahlgren, J., Holmström, E., and Löf, M.: Current and future drought vulnerability for three dominant boreal tree species, Glob. Change Biol., 30, e17079, https://doi.org/10.1111/gcb.17079, 2024.
Allen, C. D., Macalady, A. K., Chenchouni, H., Bachelet, D., McDowell, N., Vennetier, M., Kitzberger, T., Rigling, A., Breshears, D. D., Hogg, E. H., Gonzalez, P., Fensham, R., Zhang, Z., Castro, J., Demidova, N., Lim, J.-H., Allard, G., Running, S. W., Semerci, A., and Cobb, N.: A global overview of drought and heat-induced tree mortality reveals emerging climate change risks for forests, For. Ecol. Manag., 259, 660–684, https://doi.org/10.1016/j.foreco.2009.09.001, 2010.
Allen, C. D., Breshears, D. D., and McDowell, N. G.: On underestimation of global vulnerability to tree mortality and forest die-off from hotter drought in the Anthropocene, Ecosphere, 6, art129, https://doi.org/10.1890/ES15-00203.1, 2015.
Anderegg, W. R. L., Konings, A. G., Trugman, A. T., Yu, K., Bowling, D. R., Gabbitas, R., Karp, D. S., Pacala, S., Sperry, J. S., Sulman, B. N., and Zenes, N.: Hydraulic diversity of forests regulates ecosystem resilience during drought, Nature, 561, 538–541, https://doi.org/10.1038/s41586-018-0539-7, 2018.
Andreu-Hayles, L., Planells, O., Gutiérrez, E., Muntan, E., Helle, G., Anchukaitis, K. J., and Schleser, G. H.: Long tree-ring chronologies reveal 20th century increases in water-use efficiency but no enhancement of tree growth at five Iberian pine forests, Glob. Change Biol., 17, 2095–2112, https://doi.org/10.1111/j.1365-2486.2010.02373.x, 2011.
Arend, M., Link, R. M., Patthey, R., Hoch, G., Schuldt, B., and Kahmen, A.: Rapid hydraulic collapse as cause of drought-induced mortality in conifers, P. Natl. Acad. Sci. USA, 118, e2025251118, https://doi.org/10.1073/pnas.2025251118, 2021.
Babst, F., Bouriaud, O., Poulter, B., Trouet, V., Girardin, M. P., and Frank, D. C.: Twentieth century redistribution in climatic drivers of global tree growth, Sci. Adv., 5, eaat4313, https://doi.org/10.1126/sciadv.aat4313, 2019.
Barbour, M. M. and Farquhar, G. D.: Relative humidity- and ABA-induced variation in carbon and oxygen isotope ratios of cotton leaves, Plant Cell Environ., 23, 473–485, https://doi.org/10.1046/j.1365-3040.2000.00575.x, 2000.
Barnard, J. and Rubin, D.: Miscellanea. Small-sample degrees of freedom with multiple imputation, Biometrika, 86, 948–955, https://doi.org/10.1093/biomet/86.4.948, 1999.
Battipaglia, G., Saurer, M., Cherubini, P., Calfapietra, C., McCarthy, H. R., Norby, R. J., and Cotrufo, M. F.: Elevated CO2 increases tree-level intrinsic water use efficiency: insights from carbon and oxygen isotope analyses in tree rings across three forest FACE sites, New Phytol., 197, 544–554, https://doi.org/10.1111/nph.12044, 2013.
Belmecheri, S. and Lavergne, A.: Compiled records of atmospheric CO2 concentrations and stable carbon isotopes to reconstruct climate and derive plant ecophysiological indices from tree rings, Dendrochronologia, 63, 125748, https://doi.org/10.1016/j.dendro.2020.125748, 2020.
Belmecheri, S., Maxwell, R. S., Taylor, A. H., Davis, K. J., Guerrieri, R., Moore, D. J. P., and Rayback, S. A.: Precipitation alters the CO2 effect on water-use efficiency of temperate forests, Glob. Change Biol., 27, 1560–1571, https://doi.org/10.1111/gcb.15491, 2021.
Belmecheri, S., Wright, W. E., and Szejner, P.: Sample Collection and Preparation for Annual and Intra-annual Tree-Ring Isotope Chronologies, in: Stable Isotopes in Tree Rings, edited by: Siegwolf, R. T. W., Brooks, J. R., Roden, J., and Saurer, M., Tree Physiol., vol 8. Springer, Cham. 103–134, https://doi.org/10.1007/978-3-030-92698-4_4, 2022.
Bonan, G. B.: Forests and Climate Change: Forcings, Feedbacks, and the Climate Benefits of Forests, Science, 320, 1444–1449, https://doi.org/10.1126/science.1155121, 2008.
Bose, A. K., Gessler, A., Bolte, A., Bottero, A., Buras, A., Cailleret, M., Camarero, J. J., Haeni, M., Hereş, A., Hevia, A., Lévesque, M., Linares, J. C., Martinez-Vilalta, J., Matías, L., Menzel, A., Sánchez-Salguero, R., Saurer, M., Vennetier, M., Ziche, D., and Rigling, A.: Growth and resilience responses of Scots pine to extreme droughts across Europe depend on predrought growth conditions, Glob. Change Biol., 26, 4521–4537, https://doi.org/10.1111/gcb.15153, 2020.
Bouriaud, O. and Popa, I.: Comparative dendroclimatic study of Scots pine, Norway spruce, and silver fir in the Vrancea Range, Eastern Carpathian Mountains, Trees, 23, 95–106, https://doi.org/10.1007/s00468-008-0258-z, 2009.
Bradshaw, C. J. A., Warkentin, I. G., and Sodhi, N. S.: Urgent preservation of boreal carbon stocks and biodiversity, Trends Ecol. Evol., 24, 541–548, https://doi.org/10.1016/j.tree.2009.03.019, 2009.
Briffa, K. R. and Melvin, T. M.: A Closer Look at Regional Curve Standardization of Tree-Ring Records: Justification of the Need, a Warning of Some Pitfalls, and Suggested Improvements in Its Application, in: In Dendroclimatology, Springer, Dordrecht, 113–145, https://doi.org/10.1007/978-1-4020-5725-0_5, 2011.
Brooks, J. R. and Mitchell, A. K.: Interpreting tree responses to thinning and fertilization using tree-ring stable isotopes, New Phytol., 190, 770–782, https://doi.org/10.1111/j.1469-8137.2010.03627.x, 2011.
Brooks, J. R., Flanagan, L. B., and Ehleringer, J. R.: Responses of boreal conifers to climate fluctuations: indications from tree-ring widths and carbon isotope analyses, Can. J. For. Res., 28, 524–533, https://doi.org/10.1139/x98-018, 1998.
Bunn, A. G.: A dendrochronology program library in R (dplR), Dendrochronologia, 26, 115–124, https://doi.org/10.1016/j.dendro.2008.01.002, 2008.
Bunn, A. G.: Statistical and visual crossdating in R using the dplR library, Dendrochronologia, 28, 251–258, https://doi.org/10.1016/j.dendro.2009.12.001, 2010.
Cabon, A., Peters, R. L., Fonti, P., Martínez-Vilalta, J., and De Cáceres, M.: Temperature and water potential co-limit stem cambial activity along a steep elevational gradient, New Phytol., 226, 1325–1340, https://doi.org/10.1111/nph.16456, 2020.
Cernusak, L. A. and Ubierna, N.: Carbon Isotope Effects in Relation to CO2 Assimilation by Tree Canopies, in: Stable Isotopes in Tree Rings, vol. 8, edited by: Siegwolf, R. T. W., Brooks, J. R., Roden, J., and Saurer, M., Springer International Publishing, Cham, 291–310, https://doi.org/10.1007/978-3-030-92698-4_9, 2022.
Cook, E. R.: The Decomposition of Tree-Ring Series for Environmental Studies, Tree-Ring Bull., 47, 37–59, 1987.
Cuny, H. E., Rathgeber, C. B. K., Frank, D., Fonti, P., Mäkinen, H., Prislan, P., Rossi, S., del Castillo, E. M., Campelo, F., Vavrčík, H., Camarero, J. J., Bryukhanova, M. V., Jyske, T., Gričar, J., Gryc, V., De Luis, M., Vieira, J., Čufar, K., Kirdyanov, A. V., Oberhuber, W., Treml, V., Huang, J.-G., Li, X., Swidrak, I., Deslauriers, A., Liang, E., Nöjd, P., Gruber, A., Nabais, C., Morin, H., Krause, C., King, G., and Fournier, M.: Woody biomass production lags stem-girth increase by over one month in coniferous forests, Nat. Plants, 1, 15160, https://doi.org/10.1038/nplants.2015.160, 2015.
Davies, R. B.: Hypothesis Testing When a Nuisance Parameter Is Present Only under the Alternative: Linear Model Case, Biometrika, 89, 484–489, 2002.
De Frenne, P., Lenoir, J., Luoto, M., Scheffers, B. R., Zellweger, F., Aalto, J., Ashcroft, M. B., Christiansen, D. M., Decocq, G., De Pauw, K., Govaert, S., Greiser, C., Gril, E., Hampe, A., Jucker, T., Klinges, D. H., Koelemeijer, I. A., Lembrechts, J. J., Marrec, R., Meeussen, C., Ogée, J., Tyystjärvi, V., Vangansbeke, P., and Hylander, K.: Forest microclimates and climate change: Importance, drivers and future research agenda, Glob. Change Biol., 27, 2279–2297, https://doi.org/10.1111/gcb.15569, 2021.
Doerr, S. H., Shakesby, R. A., and Walsh, R. P. D.: Soil water repellency: its causes, characteristics and hydro-geomorphological significance, Earth-Sci. Rev., 51, 33–65, https://doi.org/10.1016/S0012-8252(00)00011-8, 2000.
Ehleringer, J. R. and Cerling, T. E.: Atmospheric CO2 and the ratio of intercellular to ambient CO2 concentrations in plants, Tree Physiol., 15, 105–111, https://doi.org/10.1093/treephys/15.2.105, 1995.
Ehleringer, J. R., Hall, A. E., and Farquhar, G. D.: Stable Isotopes and Plant Carbon-water Relations, Elsevier, https://doi.org/10.1016/C2009-0-03312-1, 1993.
Ewers, B. E., Oren, R., Phillips, N., Stromgren, M., and Linder, S.: Mean canopy stomatal conductance responses to water and nutrient availabilities in Picea abies and Pinus taeda, Tree Physiol., 21, 841–850, https://doi.org/10.1093/treephys/21.12-13.841, 2001.
Farquhar, G. D., Oleary, M. H., and Berry, J. A.: On the relationship between carbon isotope discrimination and the Inter-cellular carbon-dionxide concentration in leaves, Aust. J. Plant Physiol., 9, 121–137, 1982.
Farquhar, G. D., Ehleringer, J. R., and Hubick, K. T.: Carbon Isotope Discrimination and Photosynthesis, Annu. Rev. Plant Phys., 40, 503–537, https://doi.org/10.1146/annurev.pp.40.060189.002443, 1989a.
Farquhar, G. D., Hubick, K. T., Condon, A. G., and Richards, R. A.: Carbon Isotope Fractionation and Plant Water-Use Efficiency, edited by: Rundel, P. W., Ehleringer, J. R., and Nagy, K. A., Springer New York, New York, 21–40, https://doi.org/10.1007/978-1-4612-3498-2_2, 1989b.
Francey, R. and Farquhar, G.: An explanation of 13C/12C variations in tree rings, Nature, 297, 28–31, https://doi.org/10.1038/297028a0, 1982.
Frank, D. C., Poulter, B., Saurer, M., Esper, J., Huntingford, C., Helle, G., Treydte, K., Zimmermann, N. E., Schleser, G. H., Ahlström, A., Ciais, P., Friedlingstein, P., Levis, S., Lomas, M., Sitch, S., Viovy, N., Andreu-Hayles, L., Bednarz, Z., Berninger, F., Boettger, T., D`Alessandro, C. M., Daux, V., Filot, M., Grabner, M., Gutierrez, E., Haupt, M., Hilasvuori, E., Jungner, H., Kalela-Brundin, M., Krapiec, M., Leuenberger, M., Loader, N. J., Marah, H., Masson-Delmotte, V., Pazdur, A., Pawelczyk, S., Pierre, M., Planells, O., Pukiene, R., Reynolds-Henne, C. E., Rinne, K. T., Saracino, A., Sonninen, E., Stievenard, M., Switsur, V. R., Szczepanek, M., Szychowska-Krapiec, E., Todaro, L., Waterhouse, J. S., and Weigl, M.: Water-use efficiency and transpiration across European forests during the Anthropocene, Nat. Clim. Change, 5, 579–583, https://doi.org/10.1038/nclimate2614, 2015.
Gagen, M., Finsinger, W., Wagner-Cremer, F., Mccarroll, D., Loader, N. J., Robertson, I., Jalkanen, R., Young, G., and Kirchhefer, A.: Evidence of changing intrinsic water-use efficiency under rising atmospheric CO2 concentrations in Boreal Fennoscandia from subfossil leaves and tree ring δ13C ratios, Glob. Change Biol., 17, 1064–1072, https://doi.org/10.1111/j.1365-2486.2010.02273.x, 2011.
Gao, Y., Markkanen, T., Thum, T., Aurela, M., Lohila, A., Mammarella, I., Kämäräinen, M., Hagemann, S., and Aalto, T.: Assessing various drought indicators in representing summer drought in boreal forests in Finland, Hydrol. Earth Syst. Sci., 20, 175–191, https://doi.org/10.5194/hess-20-175-2016, 2016.
Gauthier, S., Bernier, P., Kuuluvainen, T., Shvidenko, A. Z., and Schepaschenko, D. G.: Boreal forest health and global change, Science, 349, 819–822, https://doi.org/10.1126/science.aaa9092, 2015.
Girardin, M. P., Hogg, E. H., Bernier, P. Y., Kurz, W. A., Guo, X. J., and Cyr, G.: Negative impacts of high temperatures on growth of black spruce forests intensify with the anticipated climate warming, Glob. Change Biol., 22, 627–643, https://doi.org/10.1111/gcb.13072, 2016.
Green, J. W.: Wood cellulose, in: Methods in Carbohydrate Chemistry, edited by: Whistler, R. L., vol. 3, New York, Academic Press, 9–21, 1963.
Green, J. K., Seneviratne, S. I., Berg, A. M., Findell, K. L., Hagemann, S., Lawrence, D. M., and Gentine, P.: Large influence of soil moisture on long-term terrestrial carbon uptake, Nature, 565, 476–479, https://doi.org/10.1038/s41586-018-0848-x, 2019.
Grossiord, C., Buckley, T. N., Cernusak, L. A., Novick, K. A., Poulter, B., Siegwolf, R. T. W., Sperry, J. S., and McDowell, N. G.: Plant responses to rising vapor pressure deficit, New Phytol., 226, 1550–1566, https://doi.org/10.1111/nph.16485, 2020.
Guerrieri, R., Belmecheri, S., Ollinger, S. V., Asbjornsen, H., Jennings, K., Xiao, J., Stocker, B. D., Martin, M., Hollinger, D. Y., Bracho-Garrillo, R., Clark, K., Dore, S., Kolb, T., William Munger, J., Novick, K., and Richardson, A. D.: Disentangling the role of photosynthesis and stomatal conductance on rising forest water-use efficiency, P. Natl. Acad. Sci. USA, 116, 16909–16914, https://doi.org/10.1073/pnas.1905912116, 2019.
Gutierrez Lopez, J., Tor-ngern, P., Oren, R., Kozii, N., Laudon, H., and Hasselquist, N. J.: How tree species, tree size, and topographical location influenced tree transpiration in northern boreal forests during the historic 2018 drought, Glob. Change Biol., 27, 3066–3078, https://doi.org/10.1111/gcb.15601, 2021.
Hanby, G., Joshi, O., and Zhai, L.: Drought impact on tree productivity: Varying roles of tree size and structural diversity in 18 woody species along gradients of slow-fast growth strategies, Agric. For. Meteorol., 369, 110592, https://doi.org/10.1016/j.agrformet.2025.110592, 2025.
Harris, I., Osborn, T. J., Jones, P., and Lister, D.: Version 4 of the CRU TS monthly high-resolution gridded multivariate climate dataset, Sci. Data, 7, 109, https://doi.org/10.1038/s41597-020-0453-3, 2020.
He, W., Mäkiranta, P., Straková, P., Ojanen, P., Penttilä, T., Bhuiyan, R., Minkkinen, K., and Laiho, R.: Fine-root production in boreal peatland forests: Effects of stand and environmental factors, For. Ecol. Manag., 550, 121503, https://doi.org/10.1016/j.foreco.2023.121503, 2023.
Heiskanen, J. and Mäkitalo, K.: Soil water-retention characteristics of Scots pine and Norway spruce forest sites in Finnish Lapland, For. Ecol. Manag., 162, 137–152, https://doi.org/10.1016/S0378-1127(01)00503-5, 2002.
Henttonen, H.: Growth Variation, in: Forest Condition in a Changing Environment, vol. 65, edited by: Mälkönen, E., Springer Netherlands, Dordrecht, 25–32, https://doi.org/10.1007/978-94-015-9373-1_3, 2000.
Henttonen, H. M., Nöjd, P., and Mäkinen, H.: Environment-induced growth changes in forests of Finland revisited – a follow-up using an extended data set from the 1960s to the 2020s, For. Ecol. Manag., 551, 121515, https://doi.org/10.1016/j.foreco.2023.121515, 2024.
Hökkä, H., Palviainen, M., Stenberg, L., Heikkinen, J., and Laurén, A.: Changing role of water table and weather conditions in diameter growth of Scots pine in drained peatlands, Can. J. For. Res., 55, 1–12, https://doi.org/10.1139/cjfr-2024-0011, 2025.
Intergovernmental Panel On Climate Change (IPCC): Climate Change 2021 – The Physical Science Basis: Working Group I Contribution to the Sixth Assessment Report of the Intergovernmental Panel on Climate Change, 1st edn., Cambridge University Press, https://doi.org/10.1017/9781009157896, 2023.
Irannezhad, M., Marttila, H., and Kløve, B.: Long-term variations and trends in precipitation in Finland: Precipitation Trends in Finland, Int. J. Climatol., 34, 3139–3153, https://doi.org/10.1002/joc.3902, 2014.
Junttila, S., Blomqvist, M., Laukkanen, V., Heinaro, E., Polvivaara, A., O'Sullivan, H., Yrttimaa, T., Vastaranta, M., and Peltola, H.: Significant increase in forest canopy mortality in boreal forests in Southeast Finland, For. Ecol. Manag., 565, 122020, https://doi.org/10.1016/j.foreco.2024.122020, 2024.
Kalliokoski, T., Nygren, P., and Sievänen, R.: Coarse root architecture of three boreal tree species growing in mixed stands, Silva Fenn., 42, https://doi.org/10.14214/sf.252, 2008.
Kannenberg, S. A., Driscoll, A. W., Szejner, P., Anderegg, W. R. L., and Ehleringer, J. R.: Rapid increases in shrubland and forest intrinsic water-use efficiency during an ongoing megadrought, P. Natl. Acad. Sci. USA, 118, e2118052118, https://doi.org/10.1073/pnas.2118052118, 2021.
Kannenberg, S. A., Cabon, A., Babst, F., Belmecheri, S., Delpierre, N., Guerrieri, R., Maxwell, J. T., Meinzer, F. C., Moore, D. J. P., Pappas, C., Ueyama, M., Ulrich, D. E. M., Voelker, S. L., Woodruff, D. R., and Anderegg, W. R. L.: Drought-induced decoupling between carbon uptake and tree growth impacts forest carbon turnover time, Agric. For. Meteorol., 322, 108996, https://doi.org/10.1016/j.agrformet.2022.108996, 2022.
Kemppinen, J., Niittynen, P., Rissanen, T., Tyystjärvi, V., Aalto, J., and Luoto, M.: Soil Moisture Variations From Boreal Forests to the Tundra, Water Resour. Res., 59, e2022WR032719, https://doi.org/10.1029/2022WR032719, 2023.
Knutzen, F., Averbeck, P., Barrasso, C., Bouwer, L. M., Gardiner, B., Grünzweig, J. M., Hänel, S., Haustein, K., Johannessen, M. R., Kollet, S., Müller, M. M., Pietikäinen, J.-P., Pietras-Couffignal, K., Pinto, J. G., Rechid, D., Rousi, E., Russo, A., Suarez-Gutierrez, L., Veit, S., Wendler, J., Xoplaki, E., and Gliksman, D.: Impacts on and damage to European forests from the 2018–2022 heat and drought events, Nat. Hazards Earth Syst. Sci., 25, 77–117, https://doi.org/10.5194/nhess-25-77-2025, 2025.
Korhonen, K., Ahola, A., Heikkinen, J., Henttonen, H., Hotanen, J.-P., Ihalainen, A., Melin, M., Pitkänen, J., Räty, M., Sirviö, M., and Strandström, M.: Forests of Finland 2014–2018 and their development 1921–2018, Silva Fenn., 55, https://doi.org/10.14214/sf.10662, 2021.
Korhonen, K. T., Räty, M., Haakana, H., Heikkinen, J., Hotanen, J.-P., Kuronen, M., and Pitkänen, J.: Forests of Finland 2019–2023 and their development 1921–2023, Silva Fenn., 58, https://doi.org/10.14214/sf.24045, 2024.
Lagergren, F. and Lindroth, A.: Transpiration response to soil moisture in pine and spruce trees in Sweden, Agric. For. Meteorol., 112, 67–85, https://doi.org/10.1016/s0168-1923(02)00060-6, 2002.
Laine, A. M., Leppälä, M., Tarvainen, O., Päätalo, M.-L., Seppänen, R., and Tolvanen, A.: Restoration of managed pine fens: effect on hydrology and vegetation: Restoration of managed pine fens, Appl. Veg. Sci., 14, 340–349, https://doi.org/10.1111/j.1654-109X.2011.01123.x, 2011.
Lampela, M., Minkkinen, K., Straková, P., Bhuiyan, R., He, W., Mäkiranta, P., Ojanen, P., Penttilä, T., and Laiho, R.: Responses of fine-root biomass and production to drying depend on wetness and site nutrient regime in boreal forested peatland, Front. For. Glob. Change, 6, 1190893, https://doi.org/10.3389/ffgc.2023.1190893, 2023.
Laudon, H., Mensah, A. A., Fridman, J., Näsholm, T., and Jämtgård, S.: Swedish forest growth decline: A consequence of climate warming?, For. Ecol. Manag., 565, 122052, https://doi.org/10.1016/j.foreco.2024.122052, 2024.
Launiainen, S., Kieloaho, A.-J., Lindroos, A.-J., Salmivaara, A., Ilvesniemi, H., and Heiskanen, J.: Water Retention Characteristics of Mineral Forest Soils in Finland: Impacts for Modeling Soil Moisture, Forests, 13, 1797, https://doi.org/10.3390/f13111797, 2022.
Leavitt, S. W. and Danzer, S. R.: Method for batch processing small wood samples to holocellulose for stable-carbon isotope analysis, Anal. Chem., 65, 87–89, https://doi.org/10.1021/ac00049a017, 1993.
Leavitt, S. W., Woodhouse, C. A., Castro, C. L., Wright, W. E., Meko, D. M., Touchan, R., Griffin, D., and Ciancarelli, B.: The North American monsoon in the U.S. Southwest: Potential for investigation with tree-ring carbon isotopes, Quat. Int., 235, 101–107, https://doi.org/10.1016/j.quaint.2010.05.006, 2011.
Lee, D., Haakana, H., Tikkasalo, O.-P., and Mäkinen, H.: Growth responses of Norway spruce to weather variation across Finland over the past 60 years, For. Ecol. Manag., 618, 123967, https://doi.org/10.1016/j.foreco.2026.123967, 2026.
Lehtonen, A., Leppä, K., Rinne-Garmston, K. T., Sahlstedt, E., Schiestl-Aalto, P., Heikkinen, J., Young, G. H. F., Korkiakoski, M., Peltoniemi, M., Sarkkola, S., Lohila, A., and Mäkipää, R.: Fast recovery of suppressed Norway spruce trees after selection harvesting on a drained peatland forest site, For. Ecol. Manag., 530, 120759, https://doi.org/10.1016/j.foreco.2022.120759, 2023a.
Lehtonen, A., Eyvindson, K., Härkönen, K., Leppä, K., Salmivaara, A., Peltoniemi, M., Salminen, O., Sarkkola, S., Launiainen, S., Ojanen, P., Räty, M., and Mäkipää, R.: Potential of continuous cover forestry on drained peatlands to increase the carbon sink in Finland, Sci. Rep., 13, 15510, https://doi.org/10.1038/s41598-023-42315-7, 2023b.
Lehtonen, I. and Pirinen, P.: 2018: An exceptionally dry thermal growing season in Finland, Ilmastokatsaus, 1, https://doi.org/10.35614/ISSN-2341-6408-IK-2019-04-RL, 2019.
Lembrechts, J. J., Nijs, I., and Lenoir, J.: Incorporating microclimate into species distribution models, Ecography, 42, 1267–1279, https://doi.org/10.1111/ecog.03947, 2019.
Lenth, R. V. and Piaskowski, J.: emmeans: Estimated Marginal Means, aka Least-Squares Means, CRAN (Comprehensive R Archive Network), https://doi.org/10.32614/CRAN.package.emmeans, 2017.
Leppä, K., Hökkä, H., Laiho, R., Launiainen, S., Lehtonen, A., Mäkipää, R., Peltoniemi, M., Saarinen, M., Sarkkola, S., and Nieminen, M.: Selection Cuttings as a Tool to Control Water Table Level in Boreal Drained Peatland Forests, Front. Earth Sci., 8, 576510, https://doi.org/10.3389/feart.2020.576510, 2020a.
Leppä, K., Korkiakoski, M., Nieminen, M., Laiho, R., Hotanen, J.-P., Kieloaho, A.-J., Korpela, L., Laurila, T., Lohila, A., Minkkinen, K., Mäkipää, R., Ojanen, P., Pearson, M., Penttilä, T., Tuovinen, J.-P., and Launiainen, S.: Vegetation controls of water and energy balance of a drained peatland forest: Responses to alternative harvesting practices, Agric. For. Meteorol., 295, 108198, https://doi.org/10.1016/j.agrformet.2020.108198, 2020b.
Levesque, M., Saurer, M., Siegwolf, R., Eilmann, B., Brang, P., Bugmann, H., and Rigling, A.: Drought response of five conifer species under contrasting water availability suggests high vulnerability of Norway spruce and European larch, Glob. Change Biol., 19, 3184–3199, https://doi.org/10.1111/gcb.12268, 2013.
Linnakoski, R., Sugano, J., Junttila, S., Pulkkinen, P., Asiegbu, F. O., and Forbes, K. M.: Effects of water availability on a forestry pathosystem: fungal strain-specific variation in disease severity, Sci. Rep., 7, 13501, https://doi.org/10.1038/s41598-017-13512-y, 2017a.
Linnakoski, R., Forbes, K. M., Wingfield, M. J., Pulkkinen, P., and Asiegbu, F. O.: Testing Projected Climate Change Conditions on the Endoconidiophora polonica/Norway spruce Pathosystem Shows Fungal Strain Specific Effects, Front. Plant Sci., 8, 883, https://doi.org/10.3389/fpls.2017.00883, 2017b.
Ma, W. T., Yu, Y. Z., Wang, X., and Gong, X. Y.: Estimation of intrinsic water-use efficiency from δ13C signature of C3 leaves: Assumptions and uncertainty, Front. Plant Sci., 13, 1037972, https://doi.org/10.3389/fpls.2022.1037972, 2023.
Mäkinen, H., Nöjd, P., and Helama, S.: Recent unexpected decline of forest growth in North Finland: examining tree-ring, climatic and reproduction data, Silva Fenn., 56, https://doi.org/10.14214/sf.10769, 2022.
Mäkipää, R., Bruun, O., Lehtonen, A., Peltoniemi, M., and Kulovesi, K.: We need targeted policy interventions in the EU to save soil carbon, Front. Environ. Sci., 12, 1354695, https://doi.org/10.3389/fenvs.2024.1354695, 2024.
Martínez-García, E., Nilsson, M. B., Laudon, H., Lundmark, T., Fransson, J. E. S., Wallerman, J., and Peichl, M.: Drought response of the boreal forest carbon sink is driven by understorey–tree composition, Nat. Geosci., 17, 197–204, https://doi.org/10.1038/s41561-024-01374-9, 2024.
McDowell, N., Brooks, J. R., Fitzgerald, S. A, and Bond, B. J.: Carbon isotope discrimination and growth response of old Pinus ponderosa trees to stand density reductions, Plant Cell Environ., 26, 631–644, https://doi.org/10.1046/j.1365-3040.2003.00999.x, 2003.
McDowell, N. G., Allen, C. D., and Marshall, L.: Growth, carbon-isotope discrimination, and drought-associated mortality across a Pinus ponderosa elevational transect, Glob. Change Biol., 16, 399–415, https://doi.org/10.1111/j.1365-2486.2009.01994.x, 2010.
McNichol, B. H., Wang, R., Hefner, A., Helzer, C., McMahon, S. M., and Russo, S. E.: Topography-driven microclimate gradients shape forest structure, diversity, and composition in a temperate refugial forest, Plant-Environ. Interact., 5, e10153, https://doi.org/10.1002/pei3.10153, 2024.
Medlyn, B. E., De Kauwe, M. G., Lin, Y.-S., Knauer, J., Duursma, R. A., Williams, C. A., Arneth, A., Clement, R., Isaac, P., Limousin, J.-M., Linderson, M.-L., Meir, P., Martin-StPaul, N., and Wingate, L.: How do leaf and ecosystem measures of water-use efficiency compare?, New Phytol., https://doi.org/10.1111/nph.14626, 2017.
Motte, F., Rötzer, T., Biber, P., Uhl, E., Pritsch, K., and Pretzsch, H.: Growth of European beech recovered faster than that of Norway spruce after a five-year experimental drought in a mixed forest stand, Trees, 37, 1695–1715, https://doi.org/10.1007/s00468-023-02453-x, 2023.
Muggeo, V. M. R.: Segmented: An R package to fit regression models with broken-line relationships, R News, 8, 20–25, 2008.
Murphy, P. N. C., Ogilvie, J., Connor, K., and Arp, P. A.: Mapping wetlands: A comparison of two different approaches for New Brunswick, Canada, Wetlands, 27, 846–854, https://doi.org/10.1672/0277-5212(2007)27[846:MWACOT]2.0.CO;2, 2007.
Netherer, S., Kandasamy, D., Jirosová, A., Kalinová, B., Schebeck, M., and Schlyter, F.: Interactions among Norway spruce, the bark beetle Ips typographus and its fungal symbionts in times of drought, J. Pest Sci., 94, 591–614, https://doi.org/10.1007/s10340-021-01341-y, 2021.
Netherer, S., Lehmanski, L., Bachlehner, A., Rosner, S., Savi, T., Schmidt, A., Huang, J., Paiva, M. R., Mateus, E., Hartmann, H., and Gershenzon, J.: Drought increases Norway spruce susceptibility to the Eurasian spruce bark beetle and its associated fungi, New Phytol., 242, 1000–1017, https://doi.org/10.1111/nph.19635, 2024.
Novick, K. A., Ficklin, D. L., Stoy, P. C., Williams, C. A., Bohrer, G., Oishi, A. C., Papuga, S. A., Blanken, P. D., Noormets, A., Sulman, B. N., Scott, R. L., Wang, L., and Phillips, R. P.: The increasing importance of atmospheric demand for ecosystem water and carbon fluxes, Nat. Clim. Change, 6, 1023–1027, https://doi.org/10.1038/nclimate3114, 2016.
Novick, K. A., Ficklin, D. L., Grossiord, C., Konings, A. G., Martínez-Vilalta, J., Sadok, W., Trugman, A. T., Williams, A. P., Wright, A. J., Abatzoglou, J. T., Dannenberg, M. P., Gentine, P., Guan, K., Johnston, M. R., Lowman, L. E. L., Moore, D. J. P., and McDowell, N. G.: The impacts of rising vapour pressure deficit in natural and managed ecosystems, Plant Cell Environ., 47, 3561–3589, https://doi.org/10.1111/pce.14846, 2024.
Oren, R., Sperry, J. S., Katul, G. G., Pataki, D. E., Ewers, B. E., Phillips, N., and Schäfer, K. V. R.: Survey and synthesis of intra- and interspecific variation in stomatal sensitivity to vapour pressure deficit, Plant Cell Environ., 22, 1515–1526, https://doi.org/10.1046/j.1365-3040.1999.00513.x, 1999.
Palvi, A., Martínez-García, E., Szejner, P., Rinne-Garmston, K. T., Young, G. H. F., Sahlstedt, E., Mäkipää, R., and Lehtonen, A.: Repeated nitrogen fertilization enhances Scots pine growth and carbon uptake without persistent long-term effects in boreal forests, Tree Physiol., tpaf053, https://doi.org/10.1093/treephys/tpaf053, 2025.
Pan, Y., Birdsey, R. A., Fang, J., Houghton, R., Kauppi, P. E., Kurz, W. A., Phillips, O. L., Shvidenko, A., Lewis, S. L., Canadell, J. G., Ciais, P., Jackson, R. B., Pacala, S. W., McGuire, A. D., Piao, S., Rautiainen, A., Sitch, S., and Hayes, D.: A Large and Persistent Carbon Sink in the World's Forests, Science, 333, 988–993, https://doi.org/10.1126/science.1201609, 2011.
Pardos, M., Del Río, M., Pretzsch, H., Jactel, H., Bielak, K., Bravo, F., Brazaitis, G., Defossez, E., Engel, M., Godvod, K., Jacobs, K., Jansone, L., Jansons, A., Morin, X., Nothdurft, A., Oreti, L., Ponette, Q., Pach, M., Riofrío, J., Ruíz-Peinado, R., Tomao, A., Uhl, E., and Calama, R.: The greater resilience of mixed forests to drought mainly depends on their composition: Analysis along a climate gradient across Europe, For. Ecol. Manag., 481, 118687, https://doi.org/10.1016/j.foreco.2020.118687, 2021.
Peltola, O., Tikkasalo, O., Nousu, J., Rinne, J., and Launiainen, S.: Impacts of Atmospheric and Soil Droughts on Carbon and Water Fluxes in Northern European Coniferous Forests: Evidence From Eddy-Covariance Data, Glob. Change Biol., 32, e70962, https://doi.org/10.1111/gcb.70962, 2026.
Pichler, P. and Oberhuber, W.: Radial growth response of coniferous forest trees in an inner Alpine environment to heat-wave in 2003, For. Ecol. Manag., 242, 688–699, https://doi.org/10.1016/j.foreco.2007.02.007, 2007.
Pinheiro, J., Bates, D., and R Core Team: nlme: Linear and Nonlinear Mixed Effects Models, R package, CRAN (Comprehensive R Archive Network), https://doi.org/10.32614/CRAN.package.nlme, 1999.
Puhe, J.: Growth and development of the root system of Norway spruce (Picea abies) in forest stands – a review, For. Ecol. Manag., 175, 253–273, https://doi.org/10.1016/S0378-1127(02)00134-2, 2003.
Römer, P., Klippel, L., Büntgen, U., and Esper, J.: Growth characteristics and drought vulnerability of southwest German spruce and pine, Eur. J. For. Res., https://doi.org/10.1007/s10342-025-01765-6, 2025.
Rubin, D. B.: Multiple Imputation for Nonresponse in Surveys, 1st edn., Wiley, https://doi.org/10.1002/9780470316696, 1987.
Saurer, M., Siegwolf, R. T. W., and Schweingruber, F. H.: Carbon isotope discrimination indicates improving water-use efficiency of trees in northern Eurasia over the last 100 years, Glob. Change Biol., 10, 2109–2120, https://doi.org/10.1111/j.1365-2486.2004.00869.x, 2004.
Saurer, M., Spahni, R., Frank, D. C., Joos, F., Leuenberger, M., Loader, N. J., McCarroll, D., Gagen, M., Poulter, B., Siegwolf, R. T. W., Andreu-Hayles, L., Boettger, T., Dorado Linan, I., Fairchild, I. J., Friedrich, M., Gutierrez, E., Haupt, M., Hilasvuori, E., Heinrich, I., Helle Gerdand Grudd, H., Jalkanen, R., Levanic, T., Linderholm, H. W., Robertson, I., Sonninen, E., Treydte, K., Waterhouse, J. S., Woodley, E. J., Wynn, P. M., and Young, G. H. F.: Spatial variability and temporal trends in water-use efficiency of European forests, Glob. Change Biol., 20, 3700–3712, https://doi.org/10.1111/gcb.12717, 2014.
Schär, C., Vidale, P. L., Lüthi, D., Frei, C., Häberli, C., Liniger, M. A., and Appenzeller, C.: The role of increasing temperature variability in European summer heatwaves, Nature, 427, 332–336, https://doi.org/10.1038/nature02300, 2004.
Schenk, H. J. and Jackson, R. B.: The Global Biogeography of Roots, Ecol. Monogr., 72, 311–328, https://doi.org/10.1890/0012-9615(2002)072[0311:TGBOR]2.0.CO;2, 2002.
Schmid, I. and Kazda, M.: Root distribution of Norway spruce in monospecific and mixed stands on different soils, For. Ecol. Manag., 159, 37–47, https://doi.org/10.1016/s0378-1127(01)00708-3, 2002.
Schuldt, B., Buras, A., Arend, M., Vitasse, Y., Beierkuhnlein, C., Damm, A., Gharun, M., Grams, T. E. E., Hauck, M., Hajek, P., Hartmann, H., Hiltbrunner, E., Hoch, G., Holloway-Phillips, M., Körner, C., Larysch, E., Lübbe, T., Nelson, D. B., Rammig, A., Rigling, A., Rose, L., Ruehr, N. K., Schumann, K., Weiser, F., Werner, C., Wohlgemuth, T., Zang, C. S., and Kahmen, A.: A first assessment of the impact of the extreme 2018 summer drought on Central European forests, Basic Appl. Ecol., 45, 86–103, https://doi.org/10.1016/j.baae.2020.04.003, 2020.
Seibt, U., Rajabi, A., Griffiths, H., and Berry, J. A.: Carbon isotopes and water use efficiency: sense and sensitivity, Oecologia, 155, 441–54, https://doi.org/10.1007/s00442-007-0932-7, 2008.
Seidl, R., Thom, D., Kautz, M., Martin-Benito, D., Peltoniemi, M., Vacchiano, G., Wild, J., Ascoli, D., Petr, M., Honkaniemi, J., Lexer, M. J., Trotsiuk, V., Mairota, P., Svoboda, M., Fabrika, M., Nagel, T. A., and Reyer, C. P. O.: Forest disturbances under climate change, Nat. Clim. Change, 7, 395–402, https://doi.org/10.1038/nclimate3303, 2017.
Sikström, U. and Hökkä, H.: Interactions between soil water conditions and forest stands in boreal forests with implications for ditch network maintenance, Silva Fenn., 50, https://doi.org/10.14214/sf.1416, 2016.
Stockton Maxwell, R., Belmecheri, S., Taylor, A. H., Davis, K. J., and Ocheltree, T. W.: Carbon isotope ratios in tree rings respond differently to climatic variations than tree-ring width in a mesic temperate forest, Agric. For. Meteorol., 288–289, https://doi.org/10.1016/j.agrformet.2020.108014, 2020.
Stokes, M. A. and Smiley, T. L.: An Introduction to Tree-Ring Dating, University of Arizona Press, Tucson, Arizona, USA., 73 pp., ISBN 978-0-8165-1680-3, 1996.
Swain, D. L., Prein, A. F., Abatzoglou, J. T., Albano, C. M., Brunner, M., Diffenbaugh, N. S., Singh, D., Skinner, C. B., and Touma, D.: Hydroclimate volatility on a warming Earth, Nat. Rev. Earth Environ., 6, 35–50, https://doi.org/10.1038/s43017-024-00624-z, 2025.
Szejner, P., Wright, W. E., Belmecheri, S., Meko, D., Leavitt, S. W., Ehleringer, J. R., and Monson, R. K.: Disentangling seasonal and interannual legacies from inferred patterns of forest water and carbon cycling using tree-ring stable isotopes, Glob. Change Biol., 24, 5332–5347, https://doi.org/10.1111/gcb.14395, 2018.
Szejner, P., Martínez-García, E., Lehtonen, A., and Haakana, H.: Norway spruce shows stronger growth sensitivity and weaker intrinsic water-use efficiency response than Scots pine under increasing water limitation in southern Finland, Zenodo [data set], https://doi.org/10.5281/zenodo.23237170, 2026.
Tagesson, T., Schurgers, G., Horion, S., Ciais, P., Tian, F., Brandt, M., Ahlström, A., Wigneron, J.-P., Ardö, J., Olin, S., Fan, L., Wu, Z., and Fensholt, R.: Recent divergence in the contributions of tropical and boreal forests to the terrestrial carbon sink, Nat. Ecol. Evol., 4, 202–209, https://doi.org/10.1038/s41559-019-1090-0, 2020.
Tang, Y., Sahlstedt, E., Young, G., Schiestl-Aalto, P., Saurer, M., Kolari, P., Jyske, T., Bäck, J., and Rinne-Garmston, K. T.: Estimating intraseasonal intrinsic water-use efficiency from high-resolution tree-ring δ13C data in boreal Scots pine forests, New Phytol., 237, 1606–1619, https://doi.org/10.1111/nph.18649, 2022.
Tarvo, V., Lehtimaa, T., Kuitunen, S., Alopaeus, V., Vuorinen, T., and Aittamaa, J.: A Model for Chlorine Dioxide Delignification of Chemical Pulp, J. Wood Chem. Technol., 30, 230–268, https://doi.org/10.1080/02773810903461476, 2010.
Thum, T., Aalto, T., Laurila, T., Aurela, M., Lindroth, A., and Vesala, T.: Assessing seasonality of biochemical CO2 exchange model parameters from micrometeorological flux observations at boreal coniferous forest, Biogeosciences, 5, 1625–1639, https://doi.org/10.5194/bg-5-1625-2008, 2008.
Tikkasalo, O.-P., Leppä, K., Launiainen, S., Peltoniemi, M., Mäkipää, R., Rinne-Garmston, K. T., Sahlstedt, E., Young, G. H. F., Bokareva, A., Lohila, A., Korkiakoski, M., Schiestl-Aalto, P., and Lehtonen, A.: Modeling the response of Norway spruce tree-ring carbon and oxygen isotopes to selection harvest on a drained peatland forest, Tree Physiol., tpad119, https://doi.org/10.1093/treephys/tpad119, 2023.
Tomppo, E., Heikkinen, J., Henttonen, H. M., Ihalainen, A., Katila, M., Mäkelä, H., Tuomainen, T., and Vainikainen, N.: Designing and Conducting a Forest Inventory – case: 9th National Forest Inventory of Finland, Springer Netherlands, Dordrecht, https://doi.org/10.1007/978-94-007-1652-0, 2011.
Treydte, K., Liu, L., Padrón, R. S., Martínez-Sancho, E., Babst, F., Frank, D. C., Gessler, A., Kahmen, A., Poulter, B., Seneviratne, S. I., Stegehuis, A. I., Wilson, R., Andreu-Hayles, L., Bale, R., Bednarz, Z., Boettger, T., Berninger, F., Büntgen, U., Daux, V., Dorado-Liñán, I., Esper, J., Friedrich, M., Gagen, M., Grabner, M., Grudd, H., Gunnarsson, B. E., Gutiérrez, E., Hafner, P., Haupt, M., Hilasvuori, E., Heinrich, I., Helle, G., Jalkanen, R., Jungner, H., Kalela-Brundin, M., Kessler, A., Kirchhefer, A., Klesse, S., Krapiec, M., Levanič, T., Leuenberger, M., Linderholm, H. W., McCarroll, D., Masson-Delmotte, V., Pawelczyk, S., Pazdur, A., Planells, O., Pukiene, R., Rinne-Garmston, K. T., Robertson, I., Saracino, A., Saurer, M., Schleser, G. H., Seftigen, K., Siegwolf, R. T. W., Sonninen, E., Stievenard, M., Szychowska-Krapiec, E., Szymaszek, M., Todaro, L., Waterhouse, J. S., Weigl-Kuska, M., Weigt, R. B., Wimmer, R., Woodley, E. J., Vitas, A., Young, G., and Loader, N. J.: Recent human-induced atmospheric drying across Europe unprecedented in the last 400 years, Nat. Geosci., https://doi.org/10.1038/s41561-023-01335-8, 2023.
Trouet, V. and van Oldenborgh, G. J.: KNMI Climate Explorer: A web-based research tool for high-resolution paleoclimatology, Tree-Ring Res., 69, 3–13, https://doi.org/10.3959/1536-1098-69.1.3, 2013.
Ubierna, N., Holloway-Phillips, M., and Farquhar, G. D.: Scaling from fluxes to organic matter: interpreting 13C isotope ratios of plant material using flux models, New Phytol., 236, 2003–2008, https://doi.org/10.1111/nph.18523, 2022.
Ulrich, D. E. M. and Grossiord, C.: Faster drought recovery in anisohydric beech compared with isohydric spruce, Tree Physiol., 43, 517–521, https://doi.org/10.1093/treephys/tpad009, 2023.
Vicente-Serrano, S. M., Beguería, S., and López-Moreno, J. I.: A multiscalar drought index sensitive to global warming: The standardized precipitation evapotranspiration index, J. Climate, 23, 1696–1718, https://doi.org/10.1175/2009JCLI2909.1, 2010.
Viro, P. J.: Kivisyyden määrittämisestä (On the determination of stoniness), Communicationes Instituti Forestalis Fenniae, 40, 1–23, https://urn.fi/URN:NBN:fi-metla-201207171072 (last access: 14 October 2026), 1952.
Voelker, S. L., Brooks, J. R., Meinzer, F. C., Anderson, R., Bader, M. K.-F. K. F., Battipaglia, G., Becklin, K. M., Beerling, D., Bert, D., Betancourt, J. L., Dawson, T. E., Domec, J.-C. C., Guyette, R. P., Körner, C., Leavitt, S. W., Linder, S., Marshall, J. D., Mildner, M., Ogée, J., Panyushkina, I., Plumpton, H. J., Pregitzer, K. S., Saurer, M., Smith, A. R., Siegwolf, R. T. W. W., Stambaugh, M. C., Talhelm, A. F., Tardif, J. C., Van de Water, P. K., Ward, J. K., and Wingate, L.: A dynamic leaf gas-exchange strategy is conserved in woody plants under changing ambient CO2: evidence from carbon isotope discrimination in paleo and CO2 enrichment studies, Glob. Change Biol., 22, 889–902, https://doi.org/10.1111/gcb.13102, 2016.
Walker, A. P., De Kauwe, M. G., Bastos, A., Belmecheri, S., Georgiou, K., Keeling, R., McMahon, S. M., Medlyn, B. E., Moore, D. J. P., Norby, R. J., Zaehle, S., Anderson-Teixeira, K. J., Battipaglia, G., Brienen, R. J. W., Cabugao, K. G., Cailleret, M., Campbell, E., Canadell, J., Ciais, P., Craig, M. E., Ellsworth, D., Farquhar, G., Fatichi, S., Fisher, J. B., Frank, D., Graven, H., Gu, L., Haverd, V., Heilman, K., Heimann, M., Hungate, B. A., Iversen, C. M., Joos, F., Jiang, M., Keenan, T. F., Knauer, J., Körner, C., Leshyk, V. O., Leuzinger, S., Liu, Y., MacBean, N., Malhi, Y., McVicar, T., Penuelas, J., Pongratz, J., Powell, A. S., Riutta, T., Sabot, M. E. B., Schleucher, J., Sitch, S., Smith, W. K., Sulman, B., Taylor, B., Terrer, C., Torn, M. S., Treseder, K., Trugman, A. T., Trumbore, S. E., van Mantgem, P. J., Voelker, S. L., Whelan, M. E., and Zuidema, P. A.: Integrating the evidence for a terrestrial carbon sink caused by increasing atmospheric CO2, New Phytol., https://doi.org/10.1111/nph.16866, 2020.
Wang, W., English, N. B., Grossiord, C., Gessler, A., Das, A. J., Stephenson, N. L., Baisan, C. H., Allen, C. D., and McDowell, N. G.: Mortality predispositions of conifers across western USA, New Phytol., 229, 831–844, https://doi.org/10.1111/nph.16864, 2021.
Williams, P. A., Allen, C. D., Macalady, A. K., Griffin, D., Woodhouse, C. A., Meko, D. M., Swetnam, T. W., Rauscher, S. A., Seager, R., Grissino-Mayer, H. D., Dean, J. S., Cook, E. R., Gangodagamage, C., Cai, M., and McDowell, N. G.: Temperature as a potent driver of regional forest drought stress and tree mortality, Nat. Clim. Change, 3, 292–297, https://doi.org/10.1038/nclimate1693, 2013.
Zhang, Y., Huang, J.-G., Wang, M., Wang, W., Deslauriers, A., Fonti, P., Liang, E., Mäkinen, H., Oberhuber, W., Rathgeber, C. B. K., Tognetti, R., Treml, V., Yang, B., Zhai, L., Antonucci, S., Buttò, V., Camarero, J. J., Campelo, F., Čufar, K., De Luis, M., Fajstavr, M., Giovannelli, A., Gričar, J., Gruber, A., Gryc, V., Güney, A., Jyske, T., Kašpar, J., King, G., Krause, C., Lemay, A., Lombardi, F., Del Castillo, E. M., Morin, H., Nabais, C., Nöjd, P., Peters, R. L., Prislan, P., Saracino, A., Shishov, V. V., Swidrak, I., Vavrčík, H., Vieira, J., Zeng, Q., and Rossi, S.: High preseason temperature variability drives convergence of xylem phenology in the Northern Hemisphere conifers, Curr. Biol., 34, 1161–1167.e3, https://doi.org/10.1016/j.cub.2024.01.039, 2024.
Zignol, F., Lidberg, W., Greiser, C., Larson, J., Hoffrén, R., and Ågren, A. M.: Controls on spatial and temporal variability of soil moisture across a heterogeneous boreal forest landscape, Hydrol. Earth Syst. Sci., 29, 5493–5513, https://doi.org/10.5194/hess-29-5493-2025, 2025.