
the Creative Commons Attribution 4.0 License.
the Creative Commons Attribution 4.0 License.
 | 22 Oct 2026
Contrasting isotopic responses of dryland and wetland plants to a century of global anthropogenic changes in nutrient cycling
Iwona Dembicz
Natalia Chojnowska
Piotr Chibowski

Anthropogenic emissions of carbon dioxide and reactive nitrogen in various forms disrupt the functioning of ecosystems around the world. In Europe, many valuable habitats, particularly wetlands and semi-natural dry grasslands, are under threat from ongoing eutrophication. However, due to contrasting water regimes, the uptake of anthropogenic nitrogen by plants in these ecosystems is different and is also interrelated with an increase in trophic level in both habitats.
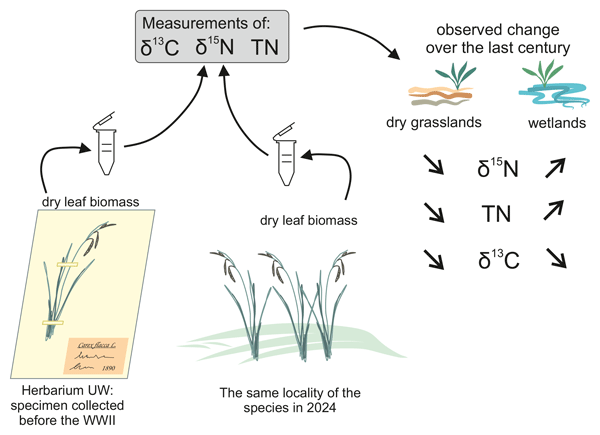
In our study, we measured the δ15N and δ13C values, as well as the total nitrogen content (TN), of 99 pairs of foliar samples collected from 14 species of vascular plants in Poland: seven wetland species and seven dry grassland species. Each pair consisted of a historical sample collected from a herbarium voucher dating from before 1939 (i.e. before artificial fertilisers were widely used in agriculture) and a contemporary sample collected in 2024 from the same species in a similar location.
We performed t tests to determine whether there were significant differences in the means of δ15N, TN and δ13C between samples from the two different habitats. Next, we calculated the differences in δ15N, TN and δ13C between the contemporary and historical samples for each pair. Using the information on date of collection of each herbarium voucher we corrected δ13C values taking into consideration changes of atmospheric δ13C due to fossil-fuel combustion (so called Suess effect). We then tested whether the difference for each species and habitat type was significantly different from zero using 90 % confidence intervals. Using multiple linear regression, we analysed the relationships between differences in δ15N and TN over time and the following factors: habitat type, the proportion of farmland in the surrounding landscape, the consumption of synthetic nitrogen fertiliser, and NOx deposition.
δ15N and TN values were lower in dry grassland species than in wetland species, in both the contemporary and historical subsets. For dry grassland species, the mean δ15N value was lower in contemporary samples than in historical ones. For wetland species, the opposite was true. The difference in δ15N values between pairs of samples was positively related to the amount of farmland in the surrounding landscape. The mean TN was higher in contemporary than in historical wetland plants, but not in dry grassland plants. The mean δ13C value, corrected for the Suess effect, was lower in contemporary samples than in historical ones. The mean difference was −0.51 ‰ for dry grassland and −3.85 ‰ for wetland species.
Our study revealed that the century of fossil fuel-derived carbon emissions, increased nitrogen input into the environment, and dominance of artificial fertilisers and combustion-derived nitrogen over biological nitrogen sources have not led to consistent responses across habitats and species. While the isotopic composition of nitrogen and carbon in plant leaves in Central Europe has undoubtedly changed, this change is highly context-dependent. Its magnitude and direction are impacted by the type of habitat and the identity and/or ecology of the species. As expected, man-made alterations appear to be more pronounced in wetland environments than in dryland habitats. Furthermore, the source of disruption may differ between the two habitat types. Specifically, wetlands are exposed to a multitude of anthropogenic nitrogen and carbon sources, whereas dry grasslands seem to be predominantly affected by changes in the composition of the atmosphere.
- Article
(2011 KB) - Full-text XML
-
Supplement
(305 KB) - BibTeX
- EndNote


Disruption to the global nitrogen and carbon cycles caused by human activities is one of the major threats to the functioning of the biosphere (Hessen et al., 1997; Richardson et al., 2023). The main source of anthropogenic carbon is the combustion of fossil fuels, which produces carbon dioxide (CO2), one of the main greenhouse gases. However, the high-temperature combustion of fossil fuels in the atmosphere (e.g. in engines of cars and trucks and in electrical power generation plants) also produces nitrogen oxides (NO and NO2), which play a role in the formation of both smog and acid rain. They also contribute to the atmospheric nitrogen deposition to the ecosystems, mostly after conversion to nitric acid HNO3 (Seinfeld and Pandis, 2006; Hertel et al., 2012). Fossil fuel combustion began on a massive scale in the Industrial Era (Pirani, 2018). Later, during the 20th century and continuing to the present day, anthropogenic nitrogen input has increased, particularly due to the invention of an efficient method of synthesising ammonium through fixation of atmospheric nitrogen N2 (Bateman and Kelly, 2007; Bodirsky et al., 2012). This process enabled the large-scale production and use of artificial fertilisers in agriculture, which was one of the foundations of the so-called Green Revolution of the 1960s (Bodirsky et al., 2012). However, excess of anthropogenic, bioavailable nitrogen input into natural ecosystems usually leads to profound changes in their productivity, biodiversity and functioning, and often cannot be easily reversed (Stevens et al., 2004; Dise et al., 2011; van Der Plas et al., 2024). Furthermore, the combined effect of increased CO2 and reactive nitrogen may have a more negative impact on biodiversity and ecosystem functioning than the effects of each factor acting alone (Bakker et al., 2024; Reich et al., 2024).
An excess of nitrogen input is a well-recognised threat to a wide range of ecosystems that are more susceptible to eutrophication, particularly aquatic habitats (Schindler, 2006), but also species-rich semi-natural grasslands in Europe (Stevens et al., 2004; Bobbink et al., 2010; Dise et al., 2011). Eutrophication in aquatic ecosystems, mainly caused by nitrogen and phosphorus, leads to uncontrolled algal or cyanobacterial blooms. These blooms can result in episodes of hypoxia (low oxygen levels), reduced light penetration, the release of toxic compounds and unpleasant odours, increased water turbidity, and alterations to biocoenoses (Schindler, 2006; Erisman et al., 2008). These changes can include the extinction of underwater plants (Qin et al., 2013) and increased fish mortality (Schindler, 2006). In grassland ecosystems, high nitrogen input may lead to changes in nutrient and water cycling, soil acidification and increased biomass production (Bobbink et al., 2010; Meier et al., 2022). Higher productivity can lead to the dominance of fast-growing, expansive species, while the production of large amounts of litter can inhibit the growth of smaller, less competitive, and often rare species (Meier et al., 2022; Chen et al., 2023). Larger biomass production and litter accumulation also reduce the amount of light reaching ground level, which usually harms germination and seedling survival (Ruprecht et al., 2010; Meier et al., 2022).
It is estimated that in 2020, the total amount of nitrogen produced globally by humans was 226 Tg N yr−1, while natural nitrogen fixation ranged from 58 to 128 Tg N yr−1 (Galloway et al., 2021). It is estimated that global consumption of artificial nitrogen fertilisers increased nearly tenfold from 11.3 Tg N yr−1 in 1961 to 108 Tg N yr−1 in 2022 (Lu and Tian, 2017; FAO, 2024). The highest use of nitrogen-based fertilisers in agriculture was among the European Union's main agricultural producers, particularly in France (1.7 million t), Poland and Germany (1.0 million t each) (Eurostat, 2025). In Poland in 2020, the average amount of pure nitrogen used in artificial fertilisers was 70.4 kg per hectare of agricultural land (GUS, 2021). As a result, Poland can be classified as one of the countries with the highest artificial fertiliser consumption per hectare of agricultural land, with fertilisation levels exceeding the EU average by about one third (Piwowar, 2022). Additionally, around 22 kg of nitrogen per hectare of Polish agricultural land is added in the form of organic fertilisers both solid and liquid ones (GUS, 2026). It is estimated that only about 30 %–50 % of the nitrogen from the fertilisers applied is taken up or assimilated by crops, with the remainder being lost through leaching, surface runoff and gaseous emissions (Lehnert et al., 2018). In addition to fertilisation, important anthropogenic sources of nitrogen include high-temperature combustion (Seinfeld and Pandis, 2006; Hertel et al., 2012) and wastewater from households, industry, and agriculture. The latter is a source of mostly organic nitrogen that impacts aquatic environments (Chen et al., 2011).
The physiology and evolutionary strategy of nitrogen uptake by plants, such as through mycorrhizae or the presence of nitrogen-fixing bacteria, influences the ratio of stable nitrogen isotopes, i.e. (δ15N). Usually, plants discriminate against 15N, resulting in lower δ15N values in plant tissue than in their N source (Dawson et al., 2002). But the main driver of variation in δ15N in plants is the type and availability of nitrogen sources and their isotopic composition (Evans, 2001). Therefore, stable isotopes are a useful tool to trace anthropogenic nitrogen input (Kendall et al., 2007; Hastings et al., 2013). There are three major sources of human-derived nitrogen with distinct δ15N signatures: (1) Synthetic fertiliser: widely used since the 1950s, produced via the Haber–Bosch process, has δ15N values close to air N2 or slightly negative (δ15N between −4 ‰–0 ‰) (Bateman and Kelly, 2007). (2) Organic nitrogen from untreated wastewater and natural fertilizers (also in the form of atmospheric deposition of agricultural NH3). Volatilisation and microbial transformations of this type of nitrogen come with strong 14N loss, giving the remaining nitrogen high δ15N values (approx. 5 ‰–20 ‰) (Bateman and Kelly, 2007). (3) Atmospheric deposition from fossil fuel combustion in power plants and engines. The δ15N of reactive nitrogen from fossil fuel combustion is generally negative but can be variable due to atmospheric transformations (Elliott et al., 2019) or soil microbial processing (Shi et al., 2014).
Nitrogen content (relative to other elements) in plant tissues is a species-specific trait, with species with competitive and ruderal strategies often being more N-rich and species which are stress-tolerant and have strongly lignified tissues being N-poor (Tilman and Wedin, 1991; Tian et al., 2019). However, it has been proven that the relative content of nitrogen in relation to other macronutrients, but also the nitrogen concentrations in the tissues, could be dependent on nitrogen availability in the environment (Palpurina et al., 2019). Moreover, under elevated CO2, the nitrogen concentration in plant tissues tends to decrease (Cotrufo et al., 1998), which can be a result of multiple mechanisms, including the simple dilution effect but also changes in root architecture (Taub and Wang, 2008).
Stable carbon isotopes (δ13C) in plant biomass can be used to assess long-term changes in carbon cycling, photosynthetic conditions, and environmental stressors affecting plant life (Cernusak et al., 2013). The carbon isotopic signatures of terrestrial plants reflect CO2 values, so studying historical samples, including plant biomass, provides evidence for the Suess effect: the progressive depletion of atmospheric 13C due to anthropogenic fossil fuel emissions. This is because the carbon returned to the atmosphere through the combustion of fossil fuels is depleted in both 13C and 14C compared to atmospheric carbon dioxide (Keeling, 1979). To disentangle the effect of fossil-fuel combustion derived variation of δ13C from other possible factors a correction for the Suess effect has to be applied (Dombrosky, 2020). On a much smaller scale, changes in CO2 concentration also affect 13C discrimination by plants (Keeling et al., 2017). Photosynthesis in general is a process strongly discriminating against 13C, but the magnitude of this discrimination depends on plant physiology and may be altered by stomatal activity: long periods of closed stomata (higher water-use efficiency) mean that the plant is using a limited CO2 pool, resulting in lesser discrimination and higher δ13C values (Seibt et al., 2008). Aquatic plants can use dissolved inorganic carbon (DIC) for photosynthesis; in fully submerged plants, it is the only carbon source. As opposed to atmospheric CO2, δ13C of DIC (and aquatic plants) undergo various site-dependent changes in both directions, depending on the source of carbon, type of water body (Pronin, 2024), water chemistry – mainly pH (Thomson et al., 2001) and abundance of DIC (Schulte et al., 2011; Chappuis et al., 2017). This variety of factors determines the final value of δ13C, making the practical use of carbon isotopes as a marker of eutrophication in wetland ecosystems comparable to the use of nitrogen isotopes (Wang et al., 2015; Heredia et al., 2022).
A couple of studies have already used historical plant material stored in herbaria to track changes in the isotopic and chemical composition of plant biomass since the 19th century (Peñuelas and Filella, 2001; McLauchlan et al., 2010; Alldred et al., 2024; Kühn et al., 2025) or even the 18th century (Peñuelas and Matamala, 1990). Some of these studies have identified similar trends; for example, a decrease in δ15N was observed in foliar samples during the 20th century, as demonstrated for prairie plants in Kansas (McLauchlan et al., 2010) and Mediterranean terrestrial plants in north and east Spain (Peñuelas and Filella, 2001). However, McLauchlan et al. (2010) indicated that the main reason for this trend was an increase in atmospheric CO2 levels (and thus stronger N-limitation) thought, Peñuelas and Filella (2001) attributed it to higher anthropogenic nitrogen input into ecosystems. Furthermore, McLauchlan et al. (2010) found that leaf nitrogen content decreased over the 20th century, while Kühn et al. (2025) observed an opposite trend in vascular plants from mesic grasslands and crop fields in Germany, a country with a similar, to our study area, intensive and crop-based agricultural sector (Eurostat, 2025). It is also worth noting that most of the aforementioned studies focused on terrestrial habitats, while recent study by Alldred et al. (2024) also found herbarium vouchers of macroalgae to be a very promising source of information in studying past biogeochemical trends in water environments.
To date, no studies have attempted to compare at the same time different habitat types that may be exposed to varying levels of anthropogenic nitrogen. Similarly, no studies have analysed the correlation between the magnitude of change and local land use factors. Considering the above discrepancies and gaps in knowledge, we formulated the following hypotheses to verify in our study:
-
Wetland plants and dry grassland plants exhibit different patterns of shifts in stable isotope composition.
-
Effects of eutrophication are more visible in wetlands, especially in submerged species, which show a drop in δ13C and an increase in δ15N.
-
TN in plant leaves increased over the last century.
-
The change in TN and δ15N is correlated with the proportion of agricultural areas' consumption of artificial nitrogen fertilisers in agriculture, and the atmospheric nitrogen deposition in the modern landscape.
-
δ13C of dry grassland plants decreased by about 1.5 ‰ over the last century due to the Suess effect.
2.1 Selection of species and specimens for analyses
For our study, we selected species that had to be represented by well-preserved and well-developed herbarium vouchers in the Herbarium of the Faculty of Biology, University of Warsaw (WA). Those herbarium vouchers should be collected before 1939, so before the artificial fertilisers became widespread in Central Europe (Merta-Staszczak and Zwyrzykowska-Wodzińska, 2017; Tian et al., 2022), from at least six locations that could be linked to contemporary occurrences of the species. We considered a species to be currently present at a given location (i.e. appropriate to the location of the herbarium specimen): (i) if we had personally observed the species there in the last decade, (ii) if we could identify patches of potential habitat of the species on ortophotographs (available at https://www.geoportal.gov.pl/, last access: 15 September 2024), or (iii) if we found observations of the species reported in recent botanical literature or in iNaturalist (https://www.inaturalist.org/, last access: 15 September 2024).
To reduce the impact of various potential nitrogen sources on the chemical composition of plant biomass, we excluded species that fix nitrogen via symbiotic bacteria. We chose plant species from taxa which are known to be non-mycorrhizal (Caryophyllaceae, Brassicaceae, Hydrocharitacae, Potamogetonacea, Nymphaea alba) or weakly associated with fungi (especially in wetland habitats) and if so, mostly of AM mycorrhizal type through which they obtain rather phosphorus than nitrogen (Alismataceae, genus Carex) (George et al., 1995; Miller et al., 1999; Cornwell et al., 2001; Unger et al., 2016). All of our species were C3 plants, as patterns of excessive nitrogen acquisition and their impact on the isotopic composition of plant leaves seem to be more uniform among plants with the C3 photosynthetic type (Yao et al., 2011). Our selection included relatively common species in two habitat types: dry grasslands and wetlands (springs, lakes and rivers) (see Table 1). The stability of moisture conditions in these habitats (often deficient in grasslands and always abundant in wetlands) helped to reduce the impact of variation in water availability at the time of material collection on the results. Finally, we selected 14 vascular plant taxa, two of which were aggregations of two closely related species (Table 1).
Table 1Taxon characteristics and number of paired samples collected from historical and appropriate contemporary specimens. Species nomenclature follows World Flora Online (2025).
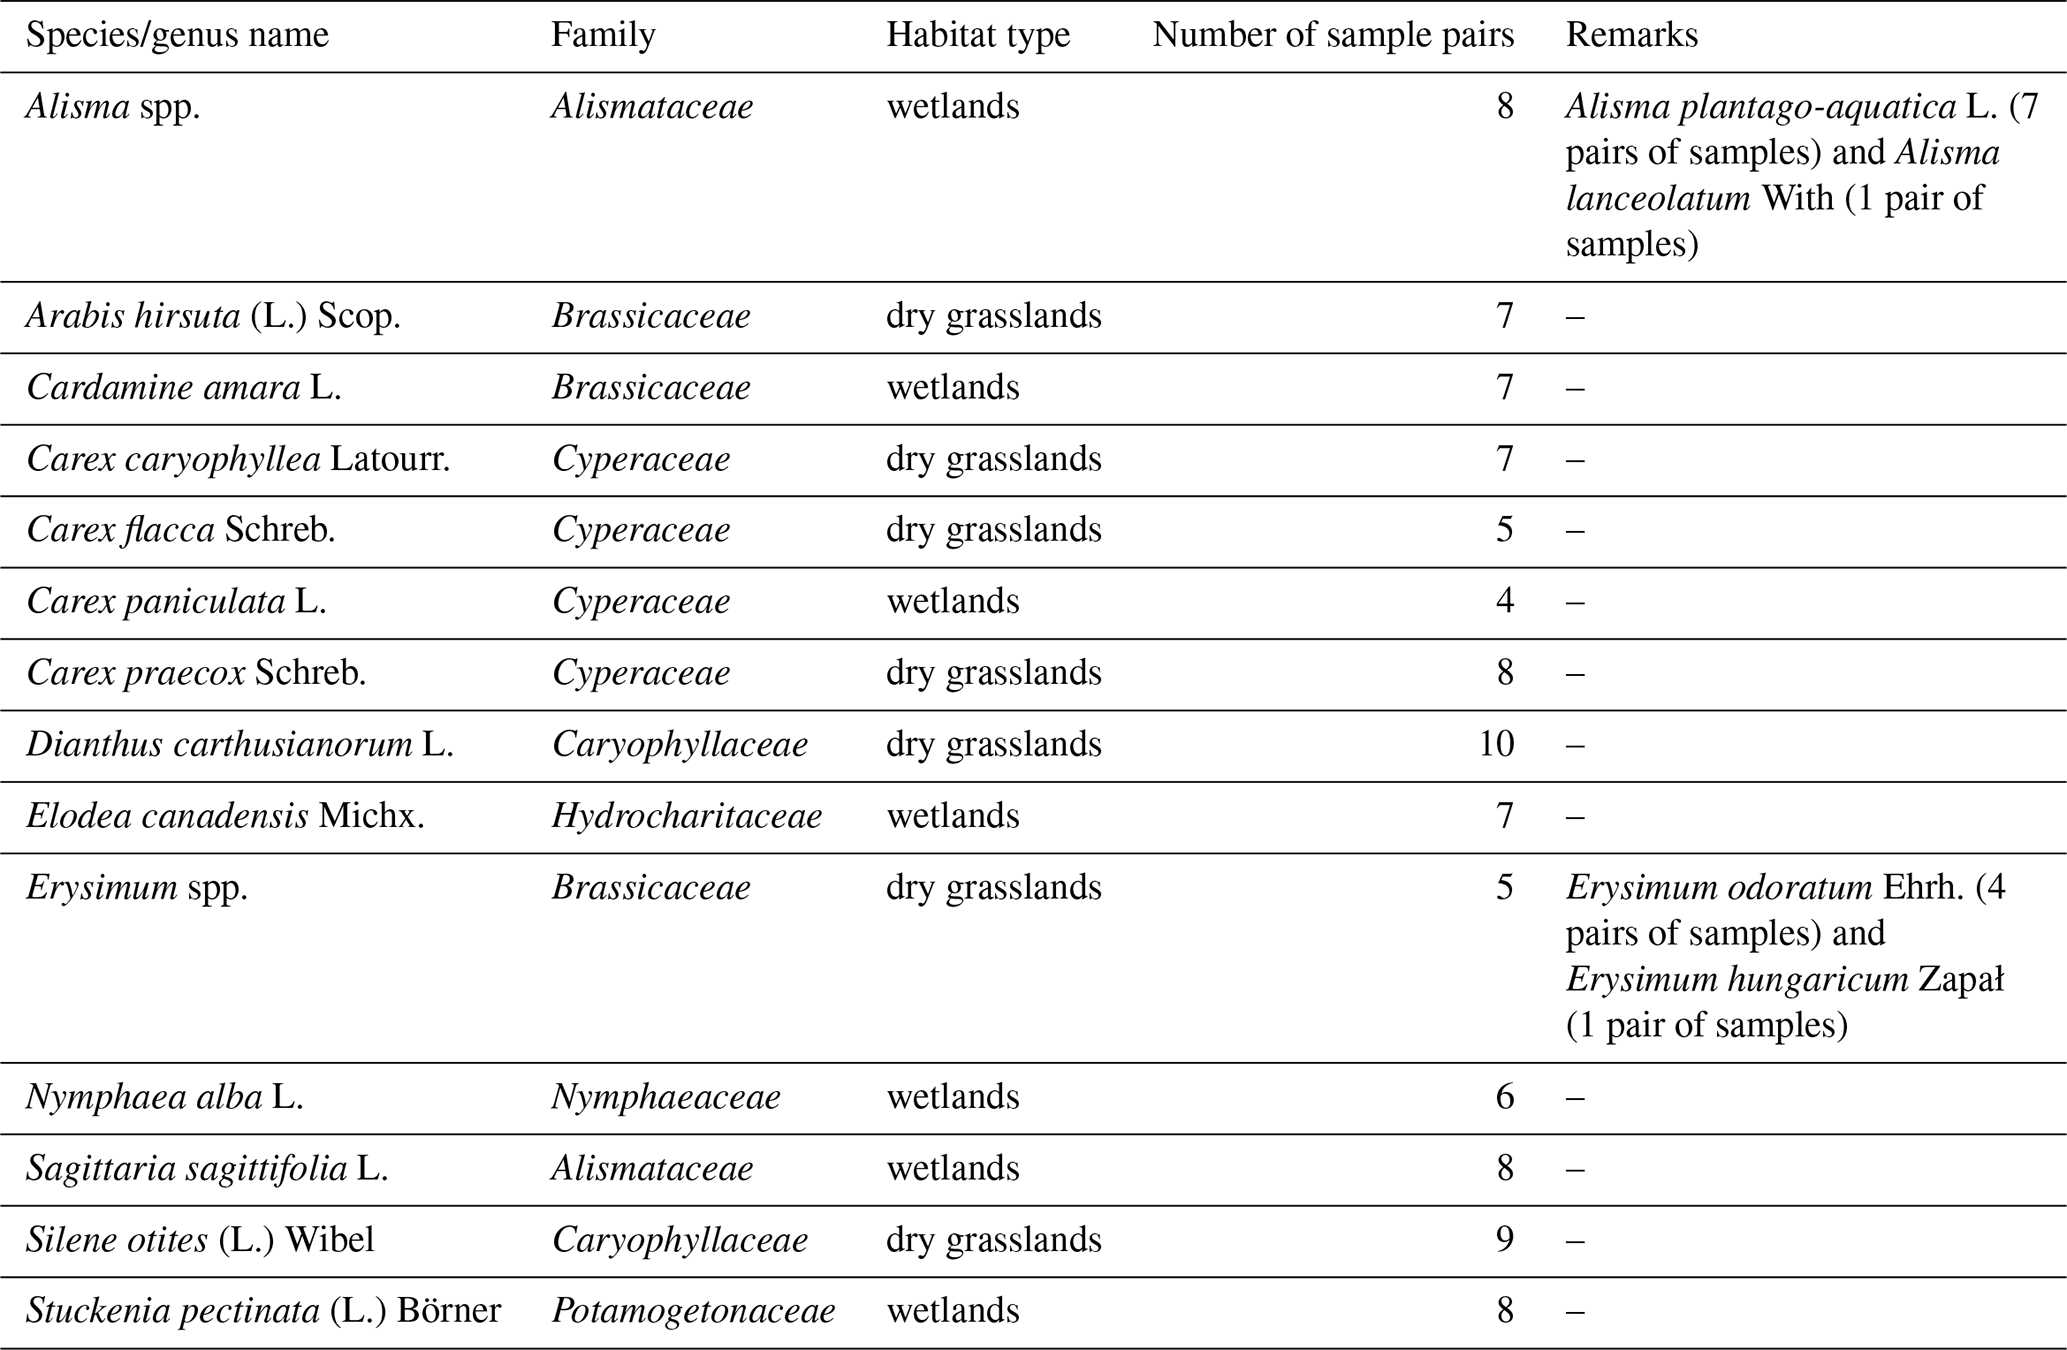
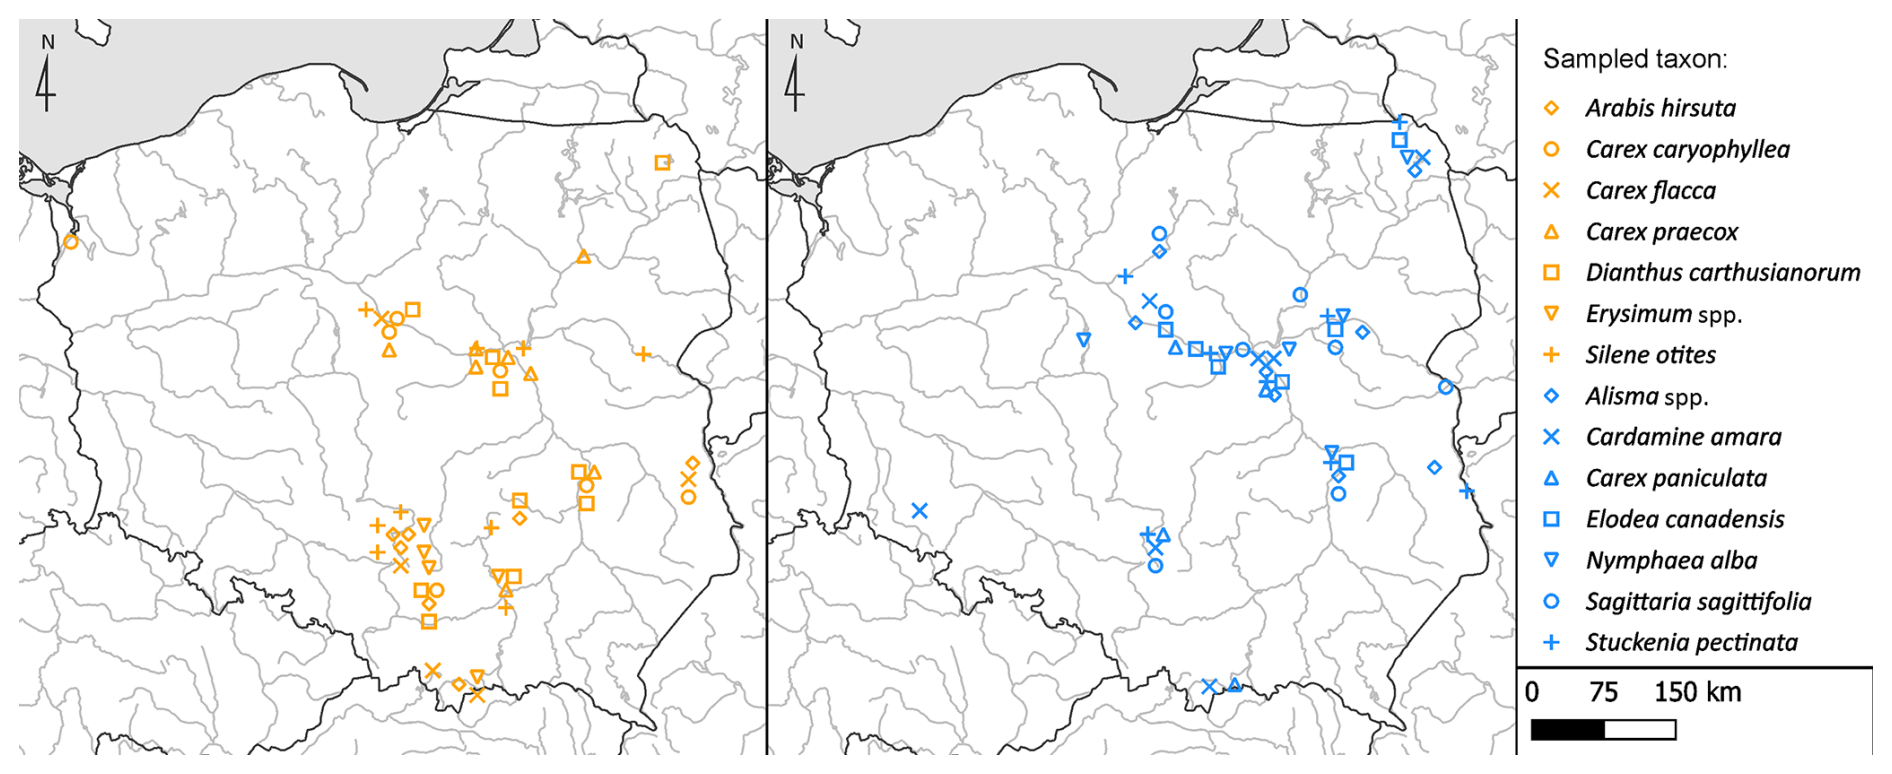
Figure 1Localities of the sampled populations of dry grassland species (on the left) and wetland species (on the right). Overlapping locations were randomly dispersed to increase visibility (spatial data source: Bohn et al., 2001–2003).
2.2 Study area
The spatial arrangement of our study was predominantly driven by the origin of the herbarium specimens of the selected species. As Warsaw was part of the Russian Empire until the First World War, most of the materials stored in the herbarium from before that period were collected within its former borders, except in the vicinity of the Tatra Mountains, which was a popular destination among botanists at that time. We excluded vouchers collected outside the current Polish borders. To avoid oversampling certain popular areas, we did not include in our study samples of the same species collected less than a few kilometres apart. Finally, majority of the selected pairs originated from the eastern half of Poland (Fig. 1). According to the Köppen-Geiger climate classification, the region predominantly has a warm temperate, fully humid climate with a warm summer (Cfb) (Kottek et al., 2006). The mean annual temperature of the sampled locations varied from 6.35 to 9.05 °C (mean 8.26 °C), while annual precipitation ranged from 496 to 1187 mm (mean 632 mm). The mean temperature of the coldest month (January) ranged from −3.75 to −0.15 °C (mean −2.01 °C), while the mean temperature of the warmest month (July) ranged from 16.15 to 19.45 °C (mean 18.67 °C) in the period 1981–2010 (Karger et al., 2017).
2.3 Sampling of plant material
Each herbarium voucher sample consisted of two to five leaf fragments collected from one or several individuals, depending on the availability of material and the state of preservation of the specimens. According to information obtained from the head of the WA Herbarium, the specimens stored there were not prepared or preserved using nitrogen-containing substances. We attempted to obtain contemporary samples in the same locality as the historical one. The accuracy of relocation was related mostly to the level of detail provided in the herbarium voucher description. If the original location description was precise (it allowed for site relocation with uncertainty less than 1 km), we searched for the species in the same location, and if we were unable to find it there, then we searched in a radius of a maximum of 10 km from the original site. However, if the description was very general (e.g. pointing to a large town), we looked for the focal species in the broader vicinity of that town in suitable habitats. The total number of samples collected was 198, comprising 99 historical samples collected between 1855 and 1938 (median 1905) and 99 contemporary samples that were paired with their respective locations. All contemporary samples were collected between April (for the early-flowering species as Arabis hirsuta and Erysimum spp.) and September (for some of the aquatic plants) of 2024. Each contemporary sample, similarly to the historical ones, consisted of two to five leaf fragments collected from several individuals per locality (Fig. 1). We selected fully developed, green and healthy plants that were mostly in the flowering or early fruiting phase. Additionally, we collected and deposited two to three specimens from most of the currently sampled populations as herbarium vouchers in the Herbarium WA for future reference.
2.4 Laboratory analyses
Fresh leaf samples were dried in 40 °C for 24 h within 1 d after collecting. In our analysis we did not perform pre-treatment of samples with acid to remove carbonates as it can affect both total nitrogen and nitrogen isotopic composition, as well as δ13C values of organic carbon (Brodie et al., 2011; Schlacher and Connolly, 2014). Most of our samples were collected from the parts of the plants growing above the water and we wanted to follow a standardized protocol for all of the samples. In our dataset we had only two submerged species which could contain CaCO3 on their surface: Stuckenia pectinata and Elodea canadensis. To investigate the possible presence of surface carbonates and their impact on our results we performed an additional check for those species, which details are described in Appendix A. The conclusions of this test were that there was no measurable effect of carbonates on the results for S. pectinata, while the possible effect on E. canadensis was minor and had no impact on the overall results or our reasoning (see Appendix A). Each sample (both fresh and historical) was homogenized by crushing in a pestle and mortar or cut into small pieces using scissors. Two subsamples were weighted into tin capsules – approx. 5 mg for quantitative analysis and 3 mg for stable isotope analysis. Total carbon and nitrogen were measured using Thermo Flash 2000 Elemental Analyzer with TCD detector. Stable carbon and nitrogen were measured in a Thermo Delta V Plus Isotope Ratio Mass Spectrometer coupled with a Flash 2000 Elemental Analyser. Stable isotope ratios are reported as δ (‰) in line with the equation:
where R is the isotopic ratio ( or ), and standard is an international reference value: atmospheric air for δ15N and Pee Dee Belemnite (PDB) for δ13C. International standards were measured for calibration and measurement precision, which were <0.1 ‰ for δ13C and < 0.2 ‰ for δ15N. We use four standards for the calibration curve (δ13C and δ15N values respectively in brackets): USGS65 (−23.29 ‰, 20.68 ‰), USGS40 (−4.52 ‰, −26.39 ‰), USGS41a (47.55 ‰, 36.55 ‰) and Urea#3a (5.89 ‰, 42.05 ‰) from Schimmelmann Research and IAEA-600 (−27.77 ‰, 1.02 ‰) for recalculation and precision assessment. A calibration curve is prepared at the beginning of each day of measurements, along with 3 IAEA-600 standards. Measurements only started if the results of all three samples do not differ to the certified values by 0.2 ‰ for δ13C and 0.1 ‰ for δ15N. Daily, about 40–60 samples were analysed. Each 10 samples a IAEA-600 standard was measured, and sample results were only included, if the standard result falls within the abovementioned threshold. In order to facilitate comparison of the samples, we corrected the values of the historical specimens for the Suess effect (Dombrosky, 2020). The obtained values of all measurements, including the uncorrected δ13C values, are available in Table S1 in the Supplement. We performed the analyses in the Laboratory of Biogeochemistry and Environmental Conservation at the University of Warsaw Biological and Chemical Research Centre (CNBCh UW).
2.5 Anthropogenic nitrogen input and land use characteristics
To assess the current levels of anthropogenic nitrogen input at the sample collection sites, we obtained data on the consumption of mineral nitrogen fertilisers per hectare of agricultural land within given municipalities in Poland from the 2020 General Agricultural Census (GUS, 2021). Moreover, we used European air quality data for the 2023 dataset (European Union, 2025) as a source of data on the NOx atmospheric deposition in the sampling locations. The dataset provides NOx concentrations for vegetation-related indicators (annual averages) at a 2 km2 grid. It combines air quality monitoring data, chemical transport model results, and other supplementary data using a regression-interpolation-merging mapping methodology (European Union, 2025).
Using GIS tools (QGIS Development Team, 2024), we calculated the proportion of agricultural land within 10 km buffers around the contemporary specimens collection sites. We used CORINE Land Cover (CLC, 2018) as a source of land-use cover data, which has a resolution of 100 m. Within each buffer size, we calculated the sum of all subcategories of Level 1 “2. Agricultural area” occurring in our study area: 2.1.1 Non-irrigated arable land, 2.2.2 Fruit trees and berry plantations, 2.3.1 Pastures, 2.4.2 Complex cultivation patterns, and 2.4.3 Land principally occupied by agriculture, with significant areas of natural vegetation. We then divided the sum by the total area of the respective buffer.
2.6 Data analysis
We performed all the statistical analyses in R ver. 4.4.2 (R Core Team, 2024), and visualisation of the results using the “ggplot2” R-package (Wickham, 2016). We used a two-sample, two-sided t test with unequal variances to see whether there were differences in the mean δ15N between samples of dry grassland and wetland plants in both the historical and contemporary specimen groups. Prior to other statistical tests, we calculated the differences in δ15N, total nitrogen content (TN) and δ13C by subtracting the measurements obtained from historical samples from those obtained from contemporary samples belonging to the same pair. We then used 90 % confidence intervals (CIs), which equals to one sided 95 % confidence of lower or higher mean, to test whether the differences were statistically significant from zero within each of the species studied, as well as within groups of species representing the two studied habitat types (dry grassland species vs. wetland species). The calculation of the CIs was done using one sample t test implemented in the “ci” function from the R-package “gmodels” (Warnes et al., 2024). To test whether differences in δ15N and TN over time were influenced by the habitat type, proportion of farmland in the surrounding area, the quantity of synthetic nitrogen fertilisers used, and the amount of NOx deposited, we employed multiple linear regression. Additionally, we performed a linear regression model of δ13C against δ15N, incorporating all the wetland plant samples studied.
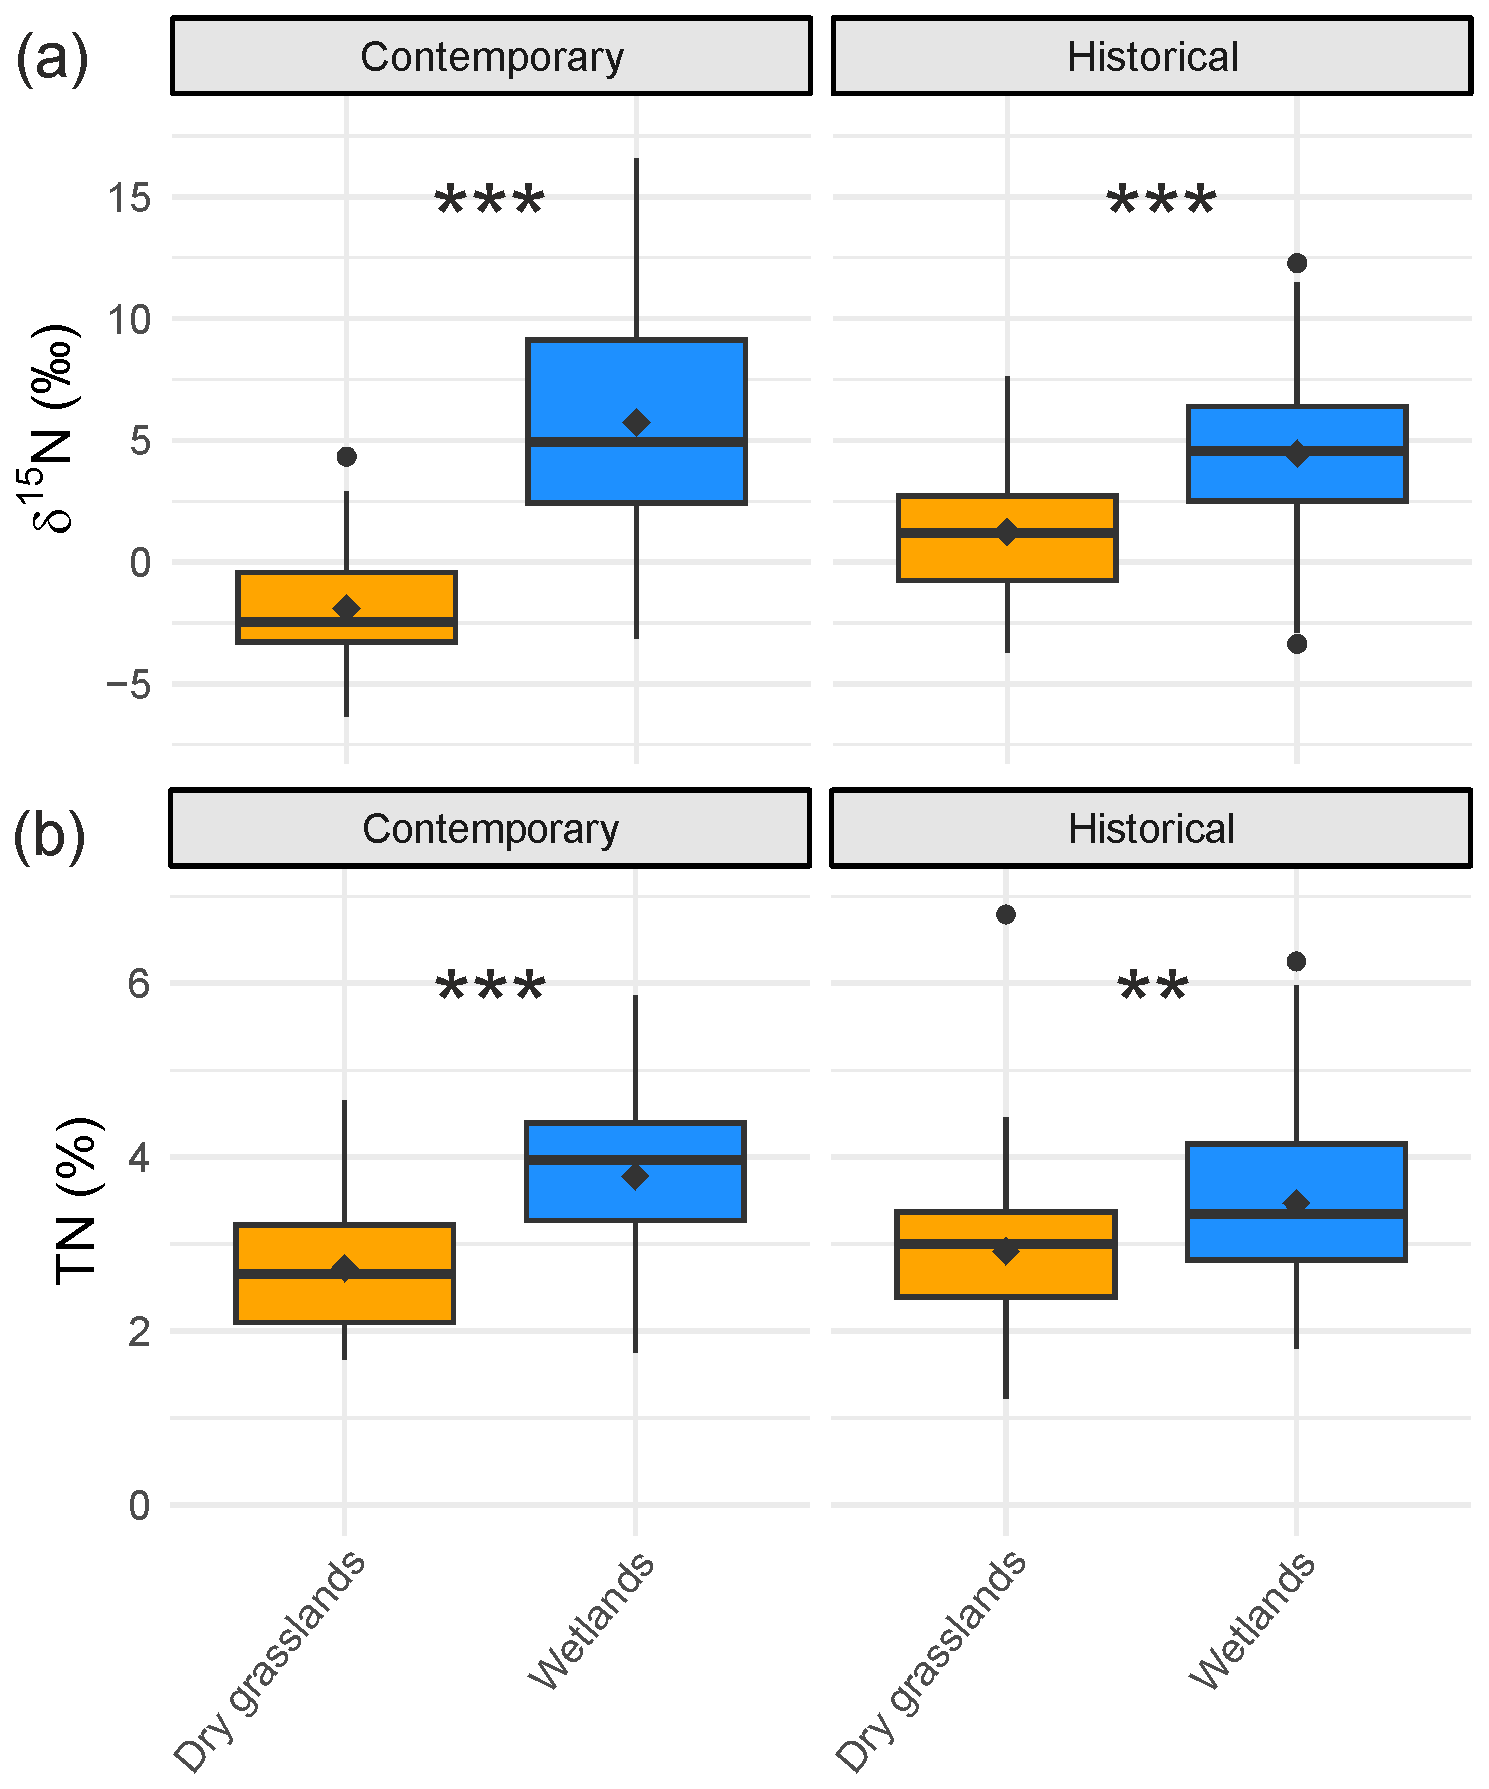
Figure 2δ15N (a) and TN (b) in historical and contemporary foliar samples from dry grassland (n=51) and wetland (n=48) plants. The asterisks represent the significance level based on a two-sample t test assuming unequal variances (** p<0.01, *** p<0.001). The boxes indicate the upper and lower quartiles, the black rhombus indicates the mean, and the line within a box indicates the median, whiskers extend from the hinges to the largest/smallest values within 1.5 times the Interquartile Range (IQR) and the points represent the samples with values outside of this range.
3.1 Nitrogen isotopes and content across habitats and species
The δ15N value was significantly lower in the foliar samples of dry grassland species than in wetland plant species, in both groups of contemporary and historical samples (see Fig. 2a). In contemporary samples, the difference between the means of plants representing the two habitat types was 3.83 ‰ (dry grassland species: mean ‰; wetland species: mean δ15N=5.73 ‰), whereas in historical samples, the difference was 3.22 ‰ (dry grassland species: mean δ15N=1.24 ‰; wetland species: mean δ15N=4.45 ‰) (Fig. 2a, for more details see Tables B1 and B4). The value of TN was also significantly lower in the foliar samples of dry grassland species than in wetland plant species, in both contemporary and historical groups of samples (Fig. 2b). In contemporary samples, the difference between the means of TN in plants representing the two habitats was 1.06 % (dry grassland species: mean TN = 2.72 %; wetland species: mean TN = 3.78 %), whereas in historical samples the difference was 0.55 % (dry grassland species: mean TN = 2.92 %; wetland species: mean TN = 3.47 %) (Fig. 2b, Tables B2 and B4).
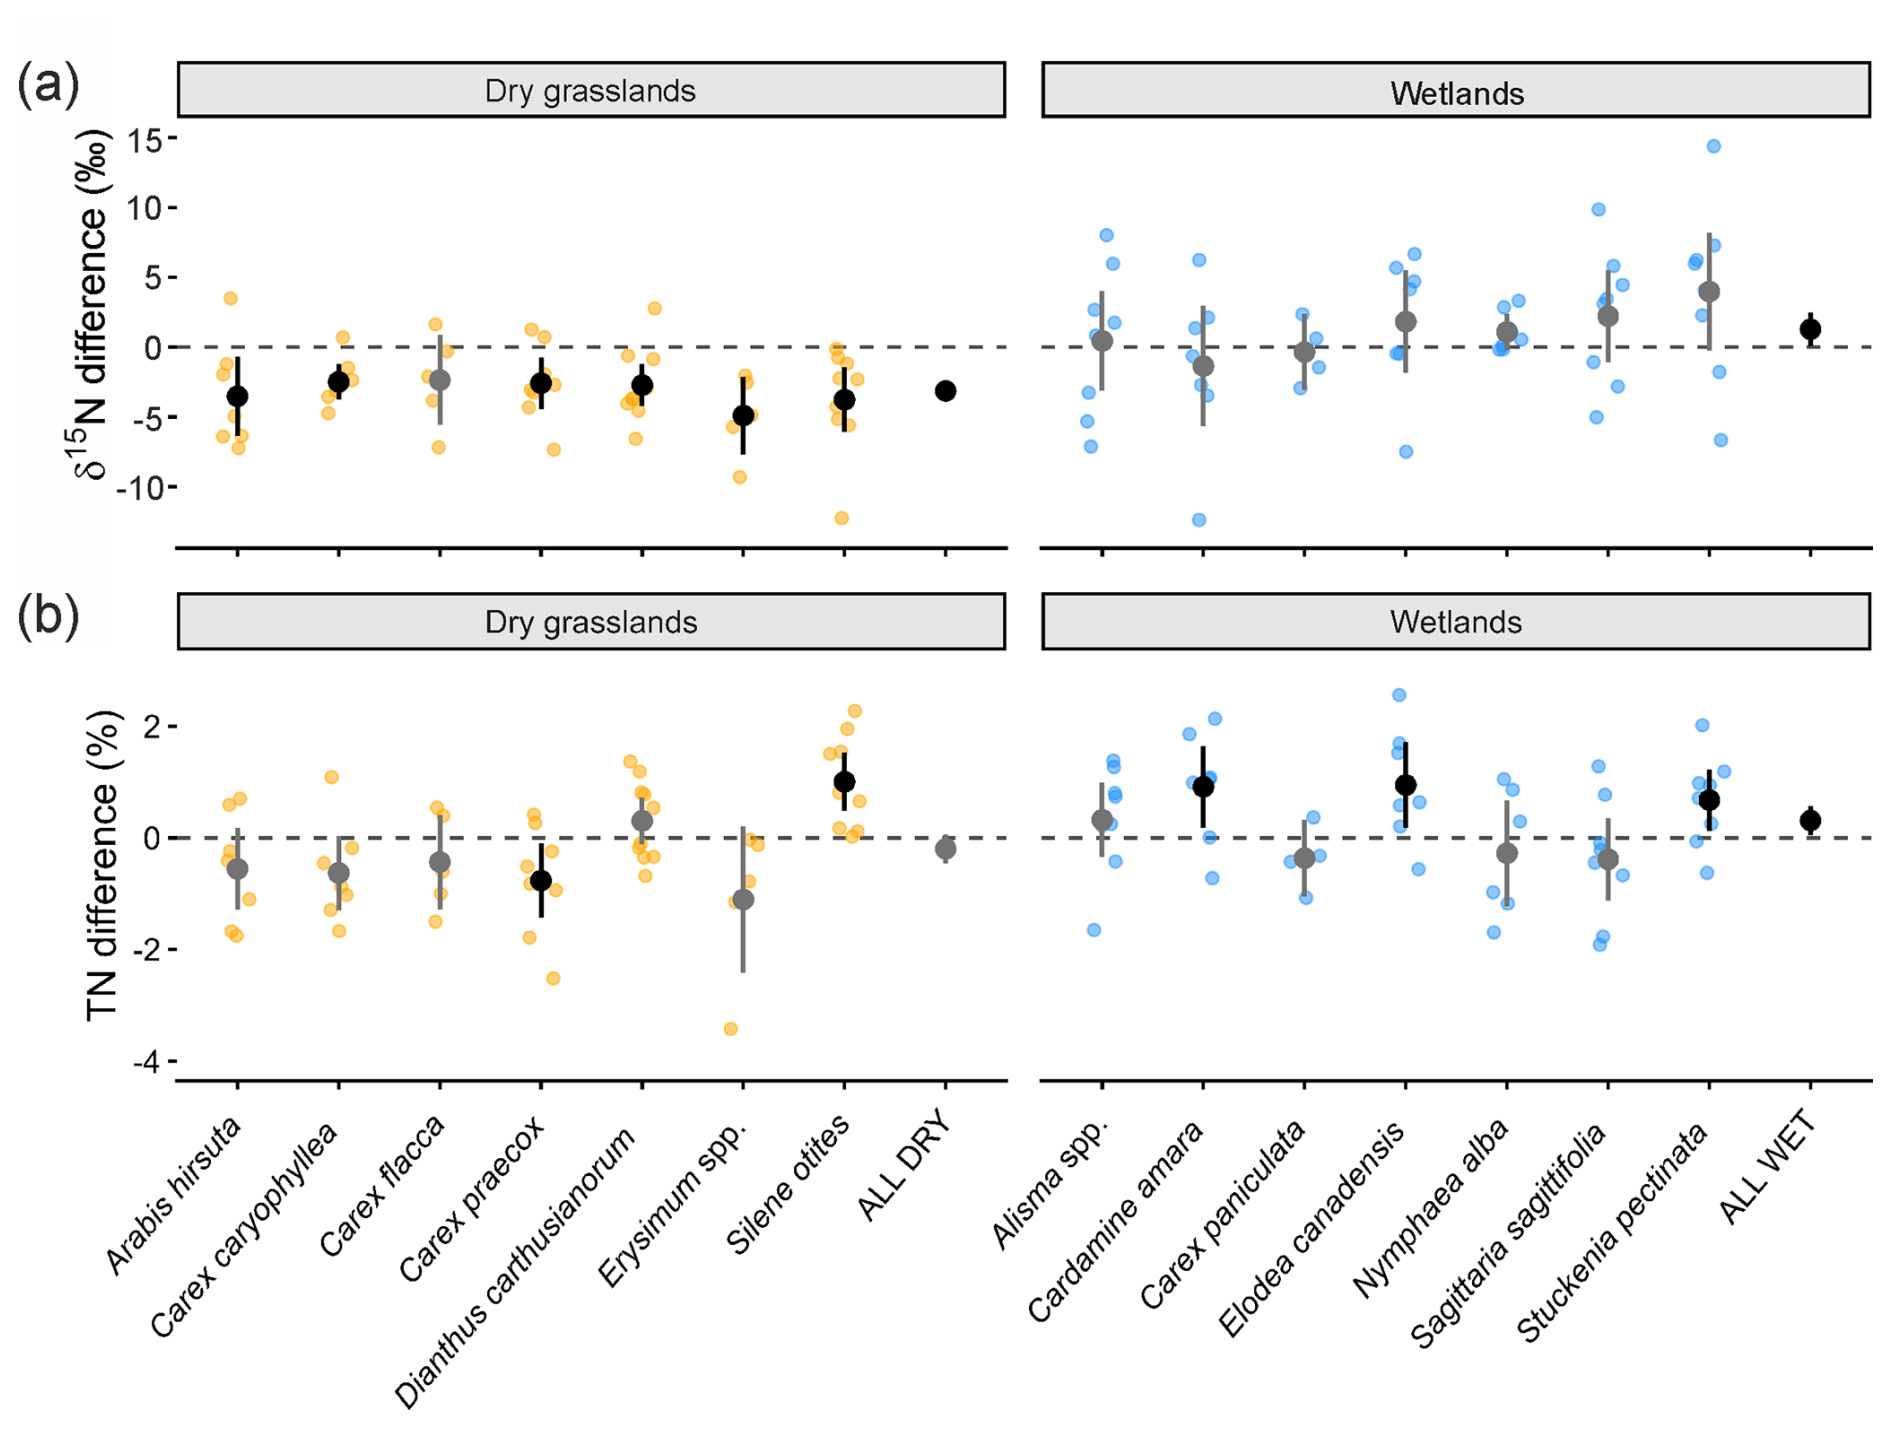
Figure 3Mean differences between the δ15N value and TN of contemporary samples and historical samples across the species and habitat types. Each observation is the difference between a contemporary and a historical sample paired with a location. The thick lines represent the 90 % confidence interval (CI) for the population mean: black for significant difference and grey for non-significant one.
In the dry grassland species, the mean δ15N value was significantly lower in the contemporary samples than in the historical ones, with a mean difference of −3.14 ‰ (Fig. 3a). The mean difference in δ15N values was lower for all species representing this habitat type, but was significant for all except one (Carex flacca) (Fig. 3a, Tables B1 and B4). In the wetland species, the mean δ15N value was significantly higher in the contemporary samples than in the historical ones, with a mean difference of 1.28 ‰. However, the difference was not significant in any of the single species representing this habitat (Fig. 3a, Table B4). We did not confirm a difference in the mean TN between contemporary and historical samples of all dry grassland species pooled together (Fig. 3b). While most species in this habitat type had a lower mean TN in contemporary samples than historical ones, this difference was only significant in Carex praecox. Two other species showed an opposite trend, but only one of these (Silene otites) had a significantly higher mean TN in contemporary samples than in historical ones (Fig. 3b, Tables B2 and B4). The mean TN was significantly higher in contemporary than in historical samples of wetland species, with a mean difference of 0.31 % (Fig. 3b, Table B4). Significantly higher mean TN was also confirmed in three species that represent this habitat type: Cardamine amara, Elodea canadensis, and Stuckenia pectinata (see Fig. 3b and Table B4). The relative mean difference of TN followed similar patterns to absolute values as shown in Fig. C1.
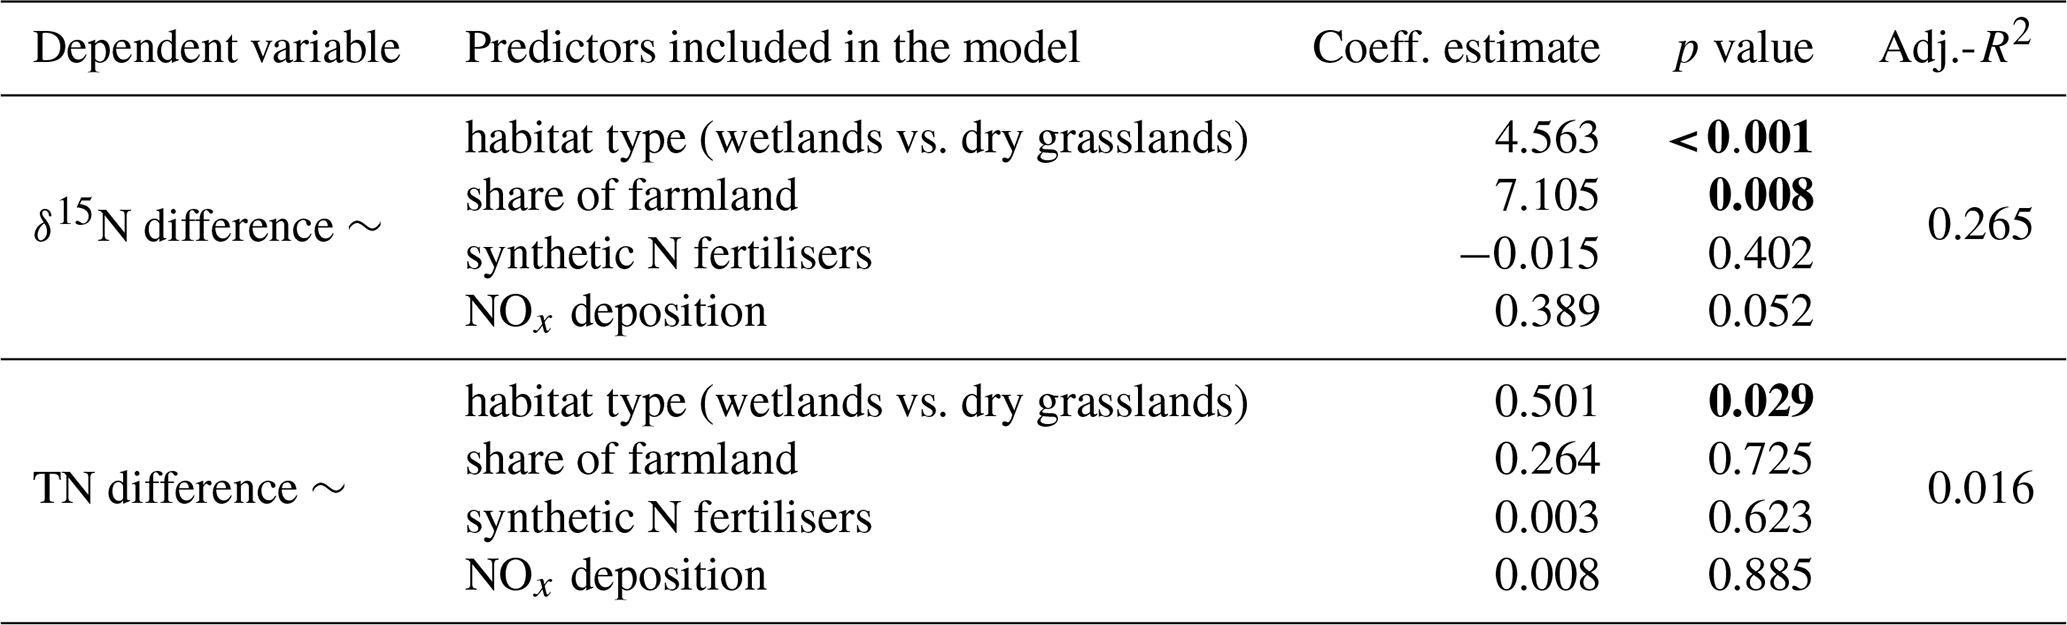
Table 2The results of the multiple linear regression models where the habitat type, the share of farmland within a 10 km radius, consumption of synthetic N fertilisers (average use in kg ha−1 per municipality), and NOx deposition were used as predictors of the difference in both δ15N and TN between contemporary and historical foliar samples paired by location. Significant p values (p<0.05) are marked in bold.
3.2 Change of differences against nitrogen input and land cover
The difference in δ15N between contemporary and historical samples paired by location was significantly higher in wetland plants than in dry grasslands and positively related to the share of farmland in a 10 km radius around the location (Table 2, for visualisation see Fig. C2). NOx deposition was also positively related with the difference in δ15N, although at a lower significance level (Table 2). Among the predictors of the difference in TN between contemporary and historical samples paired by location only the habitat type was significant, indicating higher increase in TN in case of wetland plants than in dry grassland plants (Table 2).
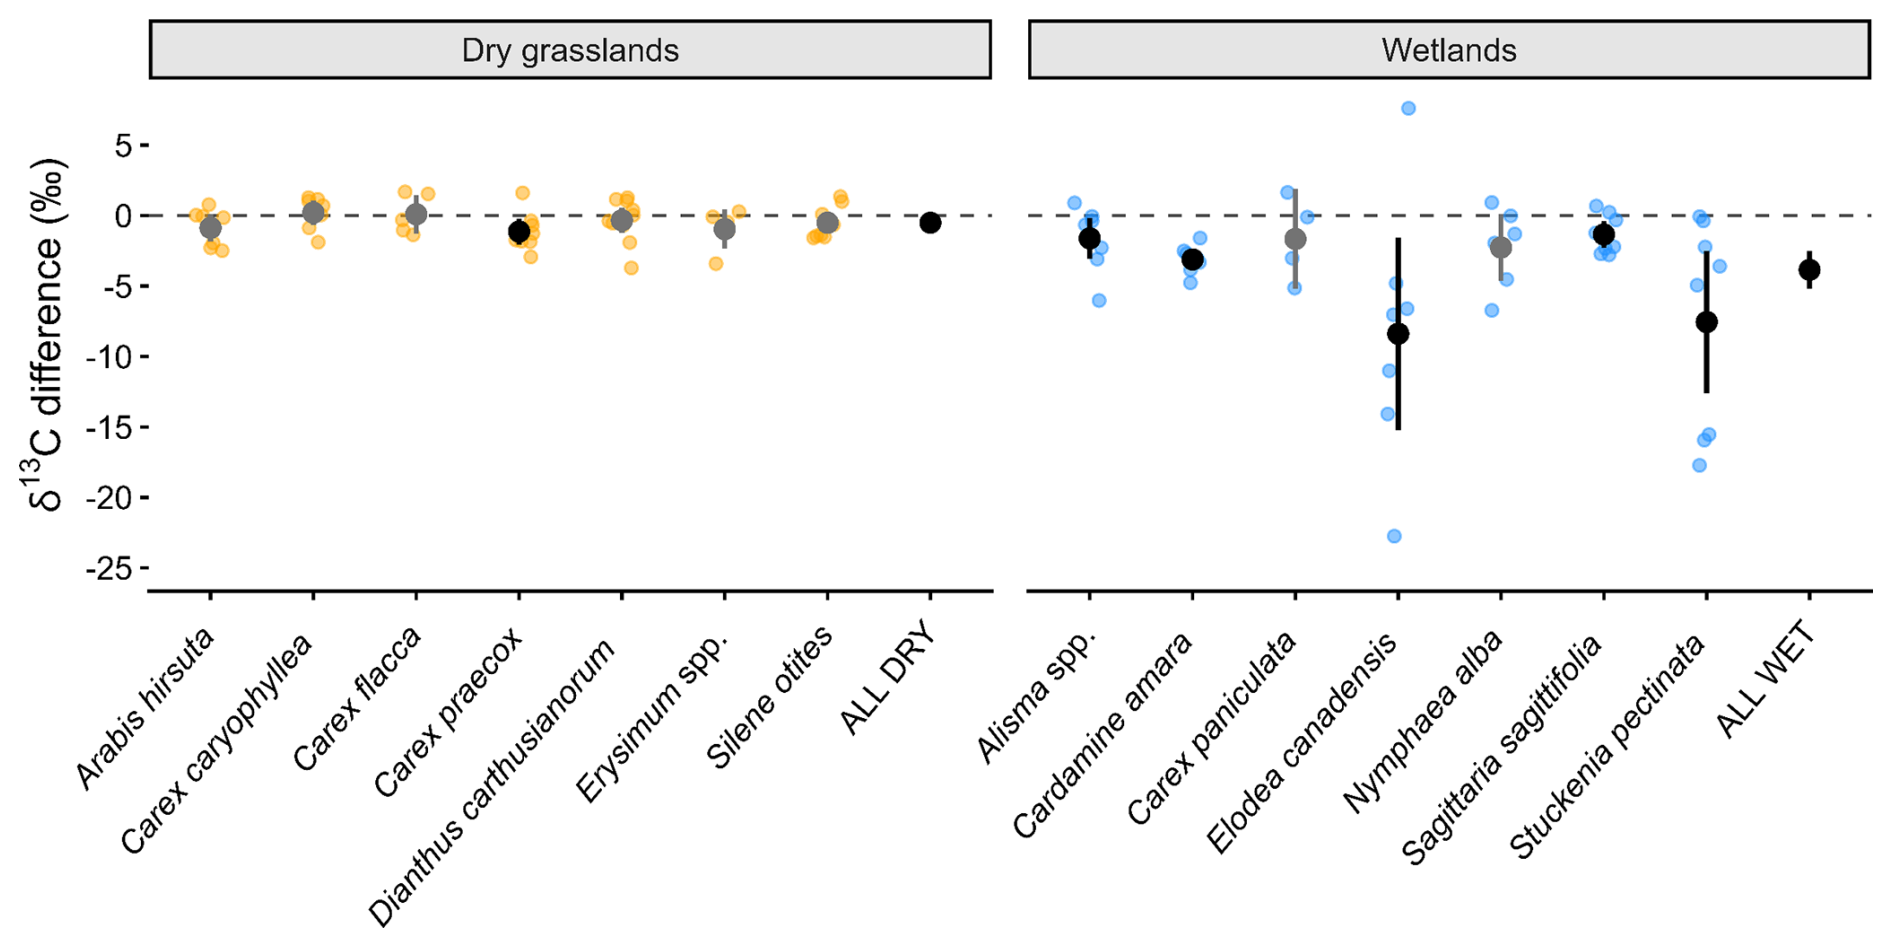
Figure 4Mean differences between the δ13C of contemporary samples and historical samples across the species and habitat types. Each observation represents the difference between contemporary and historical sample values (δ13C of contemporary sample – δ13C of historical sample) paired with a location. The thick lines are 90 % CI for the population mean: black for significant difference and grey for non-significant one. Please note that prior to the statistical analyses the historical values were corrected for the Suess effect.
3.3 Carbon isotopes across habitats and species
When samples from each habitat type were pooled, the mean δ13C value, corrected for the Suess effect, was significantly lower in contemporary samples than in historical ones. The mean difference was −0.51 ‰ for dry grassland and −3.85 ‰ for wetland species (Fig. 4). A significantly lower mean difference in δ13C, corrected for the Suess effect, was confirmed for Carex praecox among the dry grassland species and for the following five wetland species: Alisma spp., Cardamine amara, Elodea canadensis, Sagittaria sagittifolia and Stuckenia pectinata. The largest differences in the corrected δ13C values were found between contemporary and historical samples of E. canadensis and S. pectinata, with means of −8.38 ‰ and −7.55 ‰, respectively (Fig. 4, Table B4). We also found a negative correlation between the δ13C and δ15N values in these two species, but this was only significant for S. pectinata (R2=0.41, p<0.01; see Fig. C3).
4.1 Different patterns of shifts in stable isotope composition between dry grasslands and wetlands
The first hypothesis was confirmed for δ15N, as well as δ13C. In dry grassland species, we found a significant decrease in δ15N values by 3.14 ‰ on average in contemporary plant leaf leaves compared to those from the pre-Green Revolution period. This is consistent with the results obtained by other authors: McLauchlan et al. (2010) detected a long-term decrease in δ15N in leaves beginning in 1940 – in their study, δ15N values in leaves decreased on average by 4.2 ‰ (change of mean value from 3.4 ‰ to −0.8 ‰) between 1940 and 2008. Similarly, Peñuelas and Filella (2001) detected a systematic decrease in mean δ15N values between 1920–1930 and 1985–1995 by 3.32 ‰ (from 2.26 ‰ to −1.06 ‰). Peñuelas and Matamala (1990) also found a downward trend in δ15N in herbarium material. These declining trends in δ15N values over time have also been detected in other environmental records such as lake sediments (Holtgrieve et al., 2011), tree rings (Poulson et al., 1995; Bukata and Kyser, 2007) and ice cores (Freyer et al., 1996; Hastings et al., 2009). McLauchlan et al. (2010) related the decreasing trend in foliar δ15N of plants from the North American prairie with increasing concentration of CO2 in the atmosphere, leading to stronger N-limitation of primary productivity. The decrease in nitrogen availability is usually associated with a stronger decrease in δ15N values in leaves (Caldararu et al., 2022). However, when we compared changes in the total concentration of nitrogen in leaf tissues, our study did not confirm the trend of increasing nitrogen limitation resulting from the carbon fertilisation of ecosystems observed by McLauchlan et al. (2010). The decrease in the δ15N values of dry grassland plants observed in our study can be explained by several mechanisms, which are not mutually exclusive. Firstly, the cessation of free-range grazing and area of pastures in Poland over the last few decades (Radkowska and Radkowski, 2023; Sucholas et al., 2025) has caused livestock and their 15N-enriched faeces (Bateman and Kelly, 2007) to disappear from dry grasslands. In fact, the vast majority of our samples were collected from dry grasslands that, in recent years, were only mown or were undergoing secondary succession after abandonment of grazing. Secondly, and probably the most important driver, is the atmospheric deposition that has become an important source of nitrogen depleted in 15N (Hastings et al., 2009). Such reasoning was also proposed by Peñuelas and Filella (2001) to explain the declining trend in foliar δ15N of plants from dry habitats in Spain. They suggested that in dry conditions, the nitrogen pool is more dependent on atmospheric deposition than in the case of more humid and cold conditions, which promote microbial activity and organic nitrogen mineralisation. This effect may be exuberated in the recent decades by increasing temperatures which may further decrease soil water availability for microbial activity in dry grasslands, which are generally water-stressed ecosystems (Samaniego et al., 2018). Our results may indicate that these vulnerable habitats may be receiving a particularly high input of anthropogenic nitrogen via atmospheric deposition, which can reach areas that are remote from towns and farms (Holtgrieve et al., 2011).
In contrast, the δ15N values of wetland species had increased slightly compared to the pre-Green Revolution period. While confirming the first hypothesis, this also supports our second hypothesis. Such results could be explained by the dominance of nitrogen pollution derived from organic matter (with higher δ15N values) in aquatic habitats. This is due to human sewage entering surface water and groundwater (Bateman and Kelly, 2007), which can sometimes result in extremely high δ15N levels (Alldred et al., 2024). Despite significant progress in wastewater treatment in Poland in recent decades, environmental monitoring of rivers and lakes shows high levels of organic waste contamination (Szołdrowska and Smol, 2025). Our δ13C results for wetland plants (discussed below) support this explanation, as they also suggest that increased water pollution by allochtonous organic matter is probably the main driving force behind the observed changes in wetlands. In comparison with the pre-Green Revolution era, there is a possibility that the level of organic (nitrogen and carbon) pollution may be rising due to factors other than the quantity of organic fertilisers. Such factors may include the method and distribution of manure fertilisation (which was less intensive and more scattered in the past than in modern agriculture), uncontrolled sewage inputs from intensively developing settlements and tourist infrastructure close to rivers and lakes, and the runoff of peat from ploughed organic soils or drained peatlands (a fairly common phenomenon in Poland) (Krüger et al., 2015; Heredia et al., 2022). We also cannot exclude a short term trend related to disruption of artificial fertiliser markets following Russian invasion of Ukraine in 2022, which would push farmers to use more natural fertilisers in the years directly preceding our sampling. Indeed the use of artificial fertilisers decreased by 11 % in 2022 compared to 2020, and then by a further 6 % in 2023 (GUS, 2026). However, there is no data to indicate whether this was due to lower fertilisation levels or the replacement of artificial fertilisers with natural ones. In the regions studied, the ratio of nitrogen provided by artificial and natural fertilisers varies from nearly equal proportions (with slightly more organic fertiliser) in the Podlaskie region, to less than a third provided as natural fertiliser in the Lubelskie region (GUS, 2026). This pattern is probably even more complicated at smaller spatial scales, with sub-regions specialising in animal production, where manure is available and widely used, and locations where crop production dominates and artificial fertilisers are used more frequently. Alternatively, the observed pattern in wetland species could be attributed to increased runoff of artificial nitrogen fertilisers into water systems, leading to elevated nitrogen concentrations and resulting in higher rates of organic nitrogen mineralisation in water, followed by increased rates of nitrification, leading to elevated δ15N values (Diebel and Zanden, 2009). This is particularly relevant given that the use of organic fertilisers in European agriculture has remained at similar levels to those observed before the Green Revolution (Tian et al., 2022). In dry habitats, the complex microbial processes leading to 15N enrichment, as previously described for wetlands, are hampered due to water deficits; thus, the inorganic nitrogen resulting from atmospheric deposition (15N-depleted) may serve more directly as a source of that macroelement for plants.
It is worth noting that there was variation in the δ15N difference among the wetland species studied. The increase in δ15N was particularly high in the submerged species Stuckenia pectinata, which would agree with our second hypothesis, but the temporal change for this species was not statistically significant. Generally, the variation in δ15N difference within this group was greater than in dry grassland species, making statistical inference more challenging (given the relatively small number of observations). Overall, changes to wetland habitats in Poland over the last century seem to be relatively significant not only due to ongoing pollution, but also due to widespread drainage of wetlands for agricultural purposes (Janssen et al., 2016), increasingly frequent droughts leading to increased concentrations of pollutants (Szołdrowska and Smol, 2025) and rise of average water temperature following the climate change and other anthropogenic impacts (Tomalski et al., 2025). Moreover, the destruction of the wetland buffer zones due to intensification of agriculture may impede denitrification process in the catchment leading to more organic-derived nitrogen reaching directly water bodies, where our submerged plant grew (Walton et al., 2020). In many cases, finding current specimens of wetland species in the locations indicated in the herbarium vouchers was challenging or even impossible due to the disappearance of wetlands, profound changes in their trophic state, or changes to the surrounding landscape. Consequently, the sources of nitrogen and their isotopic signature may evolve in wetlands more complexly over time than in dry grasslands, making it difficult to observe general trends in this group.
4.2 Changes of total nitrogen content in plants over the last century
We found that the change in the total nitrogen content of the foliar samples varied greatly depending on the species and habitat. The increase predicted by our third hypothesis was confirmed only for wetland species. In the case of dry grassland species we observed no general trend of TN changes over time. At the species level one species, Carex praecox, showed statistically significant decline as observed by McLauchlan et al. (2010) who attributed TN decrease observed in prairie plants in Kansas to CO2 fertilisation effects and increase of water use-efficiency under elevated CO2 (especially important in dry habitats where primary productivity could be limited by drought) which could lead to increase in primary productivity and finally to productivity limitation by nitrogen. On the other hand, in our study, Silene otites showed the significantly opposite pattern, with an increase in TN, despite usually occupying habitats with extreme water deficits. Dianthus carthusianorum also had a slightly increased TN (although not significant), which may suggest a family-specific evolutionary strategy, as both species belong to the Caryophyllaceae family. On the other hand we also did not observe a general increase in foliar nitrogen content as Kühn et al. (2025). This may mean that for most of the species additional input of anthropogenic nitrogen have compensated for the increased demand for this nutrient related to the rising carbon dioxide levels but has not exceeded it as happened in probably even more overfertilised habitats studied by Kühn et al. (2025).
In the case of wetland plants there was an overall visible increase of total nitrogen content in foliar samples when contemporary plants were compared with herbaria vouchers from the pre-Green Revolution period. This trend was driven by strong and statistically significant responses in Cardamine amara, Elodea canadensis, and Stuckenia pectinata where we observed relative increases in foliar total nitrogen concentrations of more than 20 % (see Fig. C1). Those species were not standing out in the case of δ15N difference, but their δ13C difference was significantly bigger than expected from the global ambient δ13C trends. Both could point to water bodies being polluted by sewage and organic fertilisers, bringing both 15N-enriched nitrogen and 13C-enriched organic carbon, which, after mineralisation, is turned into DIC, which is utilised by those, mostly submerged, plants.
4.3 Factors influencing the patterns of change in chemical composition of plants over time
We confirmed our fourth hypothesis only for the trends in δ15N. The decline of δ15N in foliar samples was larger in areas with a lower share of farmland in the surrounding landscape. There are a number of studies that found positive correlations between the anthropogenic nitrogen load and δ15N values in diverse elements of the environment. For example, Xue et al. (2009) showed a significant positive relationship between river NO3-δ15N values and the proportion of agricultural and urban land use. Dailer et al. (2010) obtained low δ15N values in algae collected from areas with low anthropogenic influence. An increase in δ15N related to agricultural and urban areas was found in macrophytes from coastal (Kohzu et al., 2008) and river ecosystems (Pronin et al., 2025). Alternatively, our results can be attributed to the increased use of fertiliser in agriculture today compared to the past (Tian et al., 2022), regardless of whether they are organic or artificial. Intensively used agricultural land, as a result of the use of nitrogen fertilisers, manure and other agricultural practices, is characterised by increased nitrogen availability and a higher rate of nitrogen circulation, resulting in greater losses of this element through processes such as denitrification, ammonia volatilisation and nitrate leaching (Craine et al., 2009; Hall et al., 2015; Gerschlauer et al., 2019). As a result, the remaining nitrogen pool is gradually enriched with 15N, which may be reflected in high δ15N values in leaves (Gubsch et al., 2011).
4.4 Changes in δ13C over time deviate from the Suess effect
We did not fully confirm our fifth hypothesis. After applying the correction for the Suess effect, we were left with a small (0.51 ‰) but significant decrease in δ13C since historical times in dry grassland foliar samples. This is contrary to the expected reduced stomatal opening time (Seibt et al., 2008) caused by water shortage, and is hard to explain. Perhaps our results should be interpreted as signals of increased water-use efficiency in plants due to increased ambient CO2 concentrations, leading to more efficient CO2 uptake and thus lower water loss, which reduces drought stress and lowers δ13C values in plants (Medlyn et al., 2001), even though climate change is leading to more severe droughts in terms of absolute water availability, as mentioned above. The significant decrease in δ13C in wetland plants agrees with our second hypothesis. Wetland plants can show such a response to eutrophication due to two mechanisms: (1) increased nutrient availability causes higher productivity that causes plants to increase stomatal conductance (in not fully submerged plants), which leads to higher fractionation (Wang et al., 2015). The parameter strongly correlated with δ13C in most studies with such results (Chappuis et al., 2017; Wrosz et al., 2025) is total phosphorus in water. We do not have such values for our study, but we can safely assume that P has increased due to anthropogenic input. (2) An oversupply of organic matter (with “terrestrial” δ13C values) from sewage and organic fertiliser into wetlands causes intensive bacterial mineralisation. At some point, most DIC can originate from this process, thus has very low δ13C values (Hellings et al., 1999). Heredia et al. (2022) attributed the decrease in δ13C of submerged plants in an eutrophication gradient to allochtonous organic matter decomposition. Similar findings – surprisingly low δ13C values – came from the study on urban rivers in NW Poland (Pronin et al., 2025). The simultaneous response on δ13C and δ15N (Fig. C2) confirms that eutrophication is the main driver for these changes and an important factor affecting wetland ecosystems at a large scale.
The present study revealed that, whilst the isotopic composition of nitrogen and carbon in foliar samples in Central Europe has changed over the last century, this change is very context-dependent. The magnitude and direction of the observed change are impacted by both the habitat type and the species identity and/or ecology. This may be regarded as a caveat for future researchers, indicating that studies on the stable isotope composition of plants should consider both their taxonomy and ecology. Nevertheless, the anthropogenic global change has left an imprint on the isotopic composition of the flora from the habitats under study. As would be expected, the alterations appear to be more pronounced in wetland environments than in dryland habitats. It is evident that both habitat types are among the most threatened in Poland (Perzanowska and Korzeniak, 2022) and the entire European Union (Janssen et al., 2016). However, it appears that human activity has resulted in more significant alterations to biogeochemical processes in wetlands compared to dry grasslands. While the latter have also diminished in size, the functionality of the remnants appears to be less affected. Moreover, the source of this disruption may vary between the two habitat types. Specifically, wetlands are exposed to a multitude of anthropogenic nitrogen and carbon sources, while dry grasslands are predominantly affected by alterations in atmospheric composition.
To exclude the possible effect of surface carbonate contamination of the two submerged species of our dataset Stuckenia pectinata and Elodea canadensis for their δ13C values we employed a modified approach suggested by Kennedy et al. (2005). Due to the lack of visible CO2 release, we could not use this as an indicator of complete carbonate removal. This enabled us to assume a very low carbonate content, so we used a weaker acid (0.3 M) to minimise the loss of organic matter.
We weighed four aliquots from each homogenised sample into silver capsules. We then added 100 mL of 0.3 M HCl directly to two of the aliquots in the capsules. After 1 h, we dried the samples at 40 °C overnight. This process was repeated once more. We then closed all the capsules, and analysed one pair of acid-treated and control samples for total carbon and nitrogen, and the second pair for δ13C and δ15N.
The results of this test show no effect of acid treatment on δ15N and total nitrogen (TN) content, nor on δ13C for S. pectinata. The only statistically significant difference was observed in E. canadensis. However, the mean difference in δ13C between treated and untreated samples was 0.44 ‰ (90 % confidence interval: 0.141 to 0.739), whereas the mean difference observed in our study between historical and contemporary samples was −8.38 ‰ (90 % confidence interval: −15.22 to −1.55). Thus, the possible error (including its uncertainty and the uncertainty of the results) is no greater than the difference observed between contemporary and historical samples. Moreover, as we treat contemporary and historical samples of plants inhabiting similar habitats in the same way, systematic methodological error would not lead to the detection of false patterns.
Table B1Summary statistics of δ15N (values given in ‰) of the foliar samples of 14 species selected for the study, from both contemporary specimens collected in 2024 and historical specimens in the form of herbarium vouchers collected before 1939.
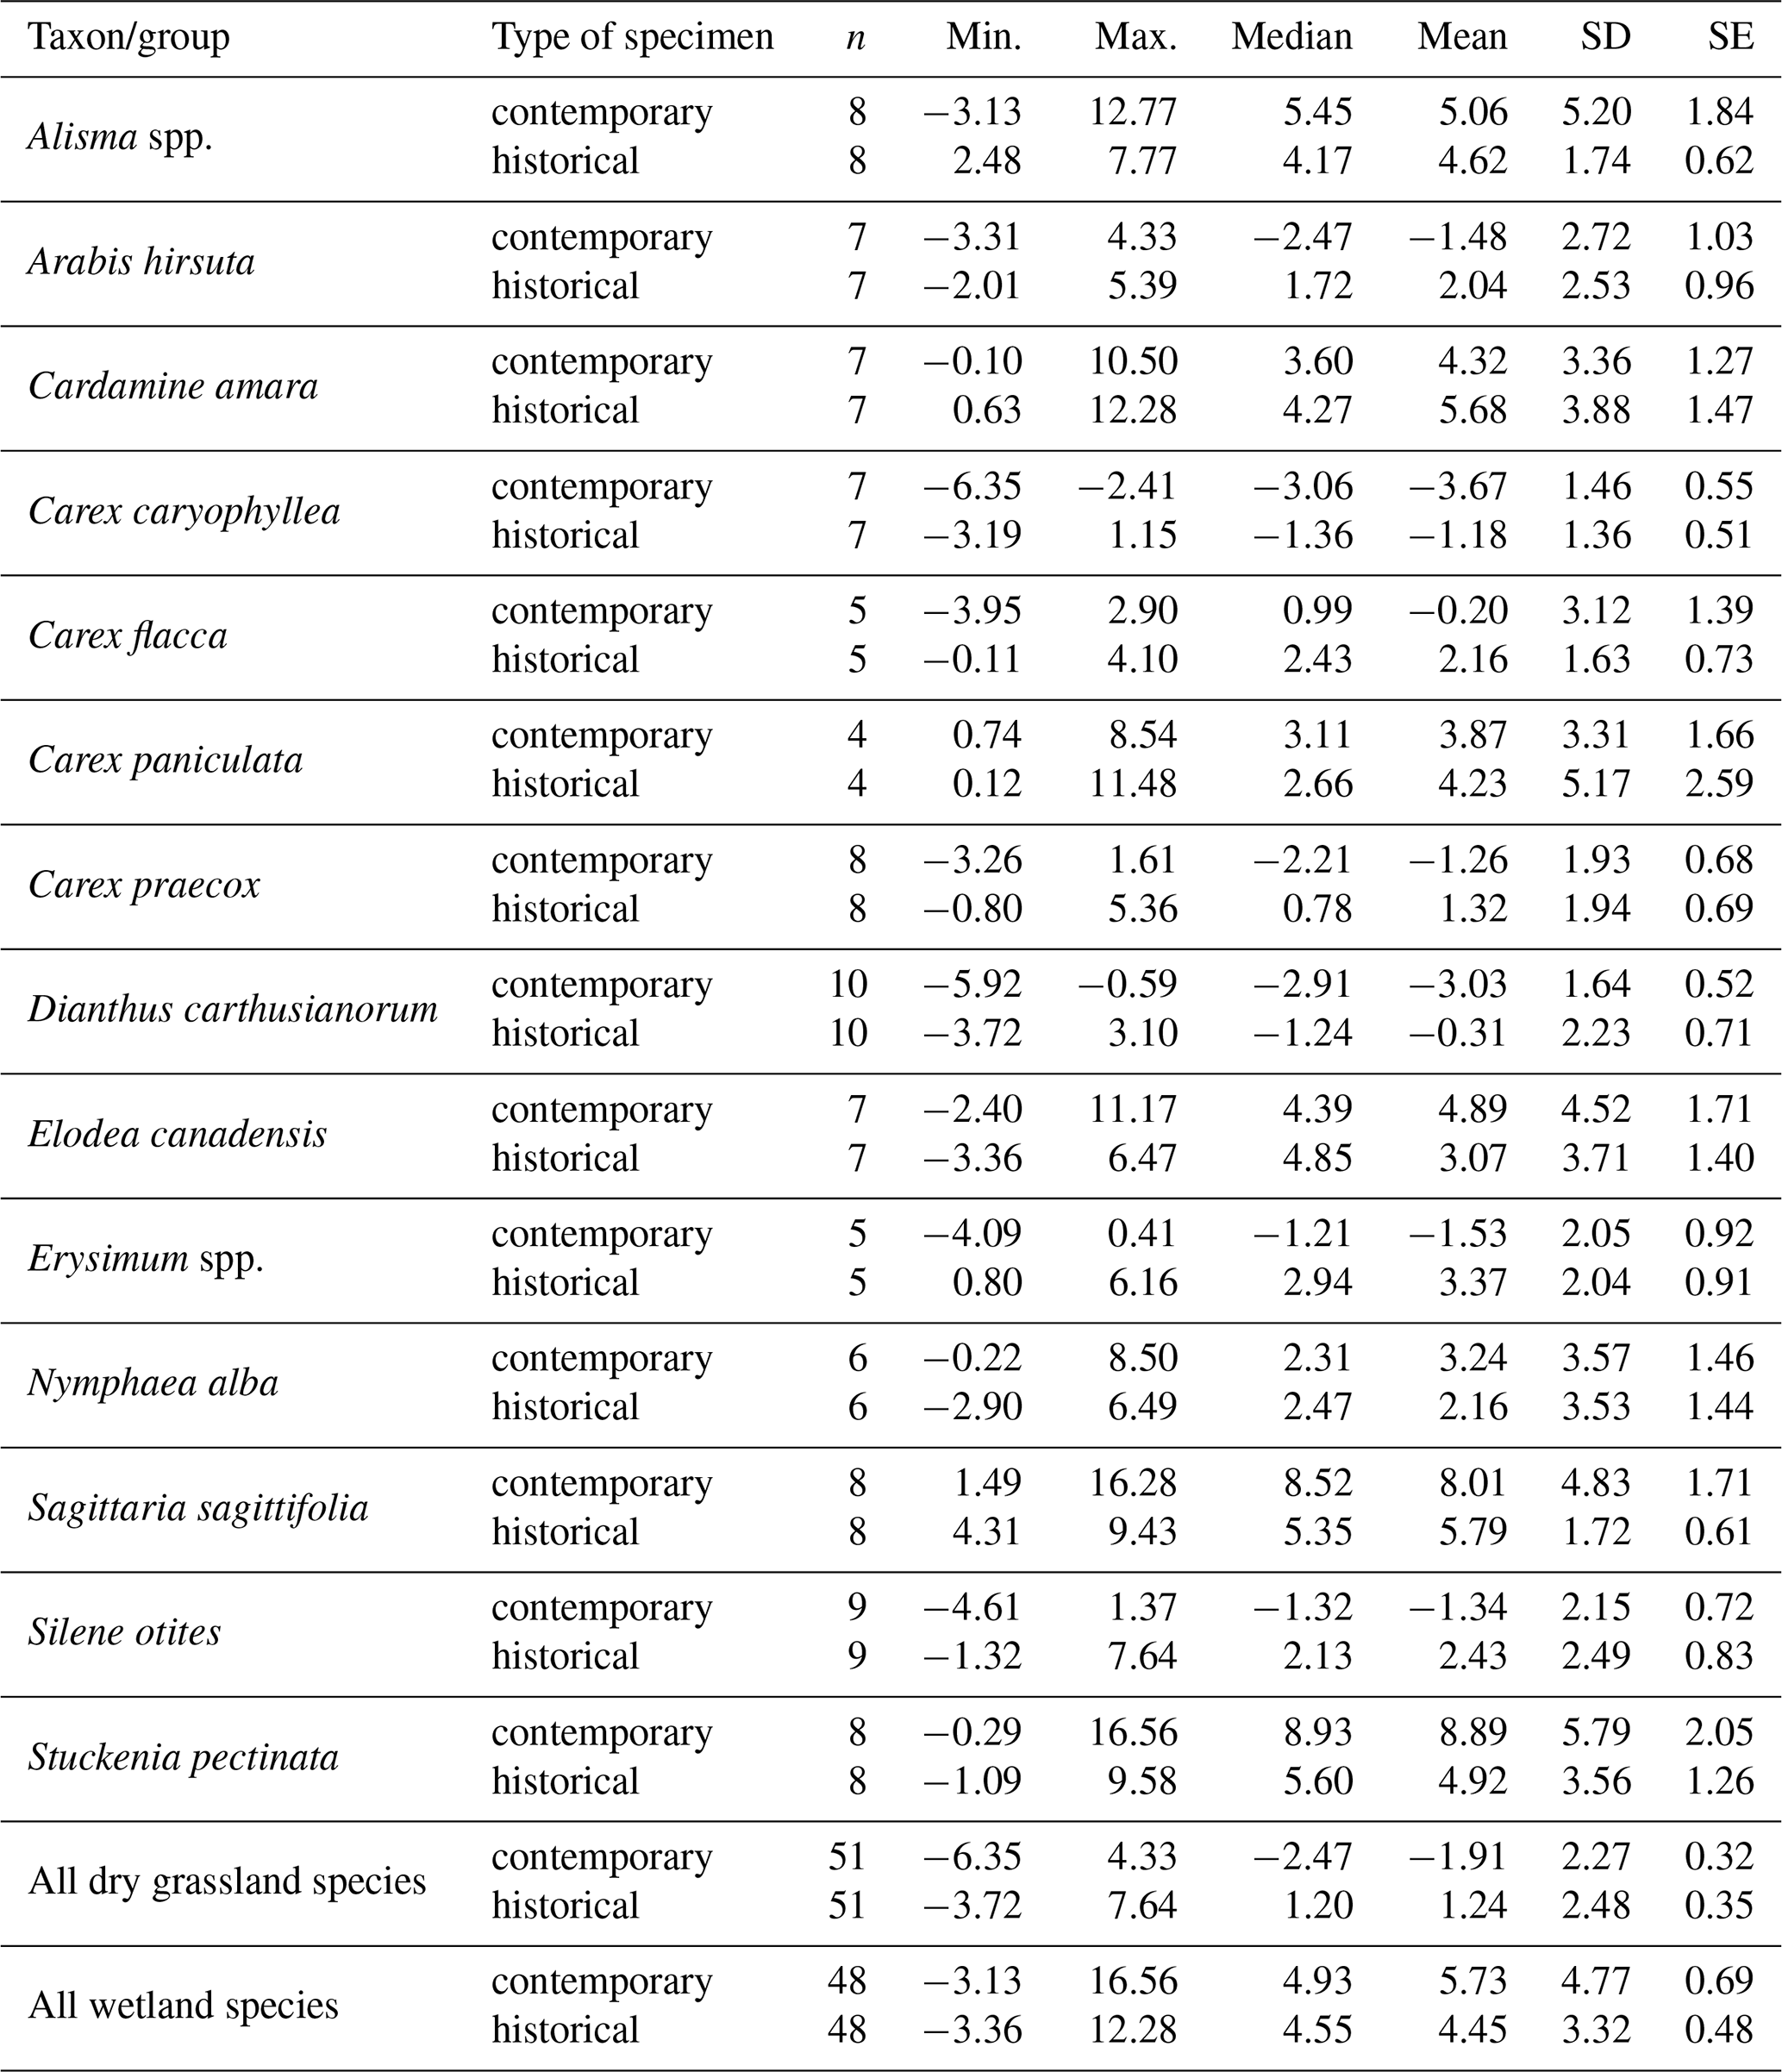
Table B2Summary statistics of total nitrogen content (TN, values given in %) in the foliar samples of 14 species selected for the study from both contemporary specimens collected in 2024 and historical specimens in the form of herbarium vouchers collected before 1939.
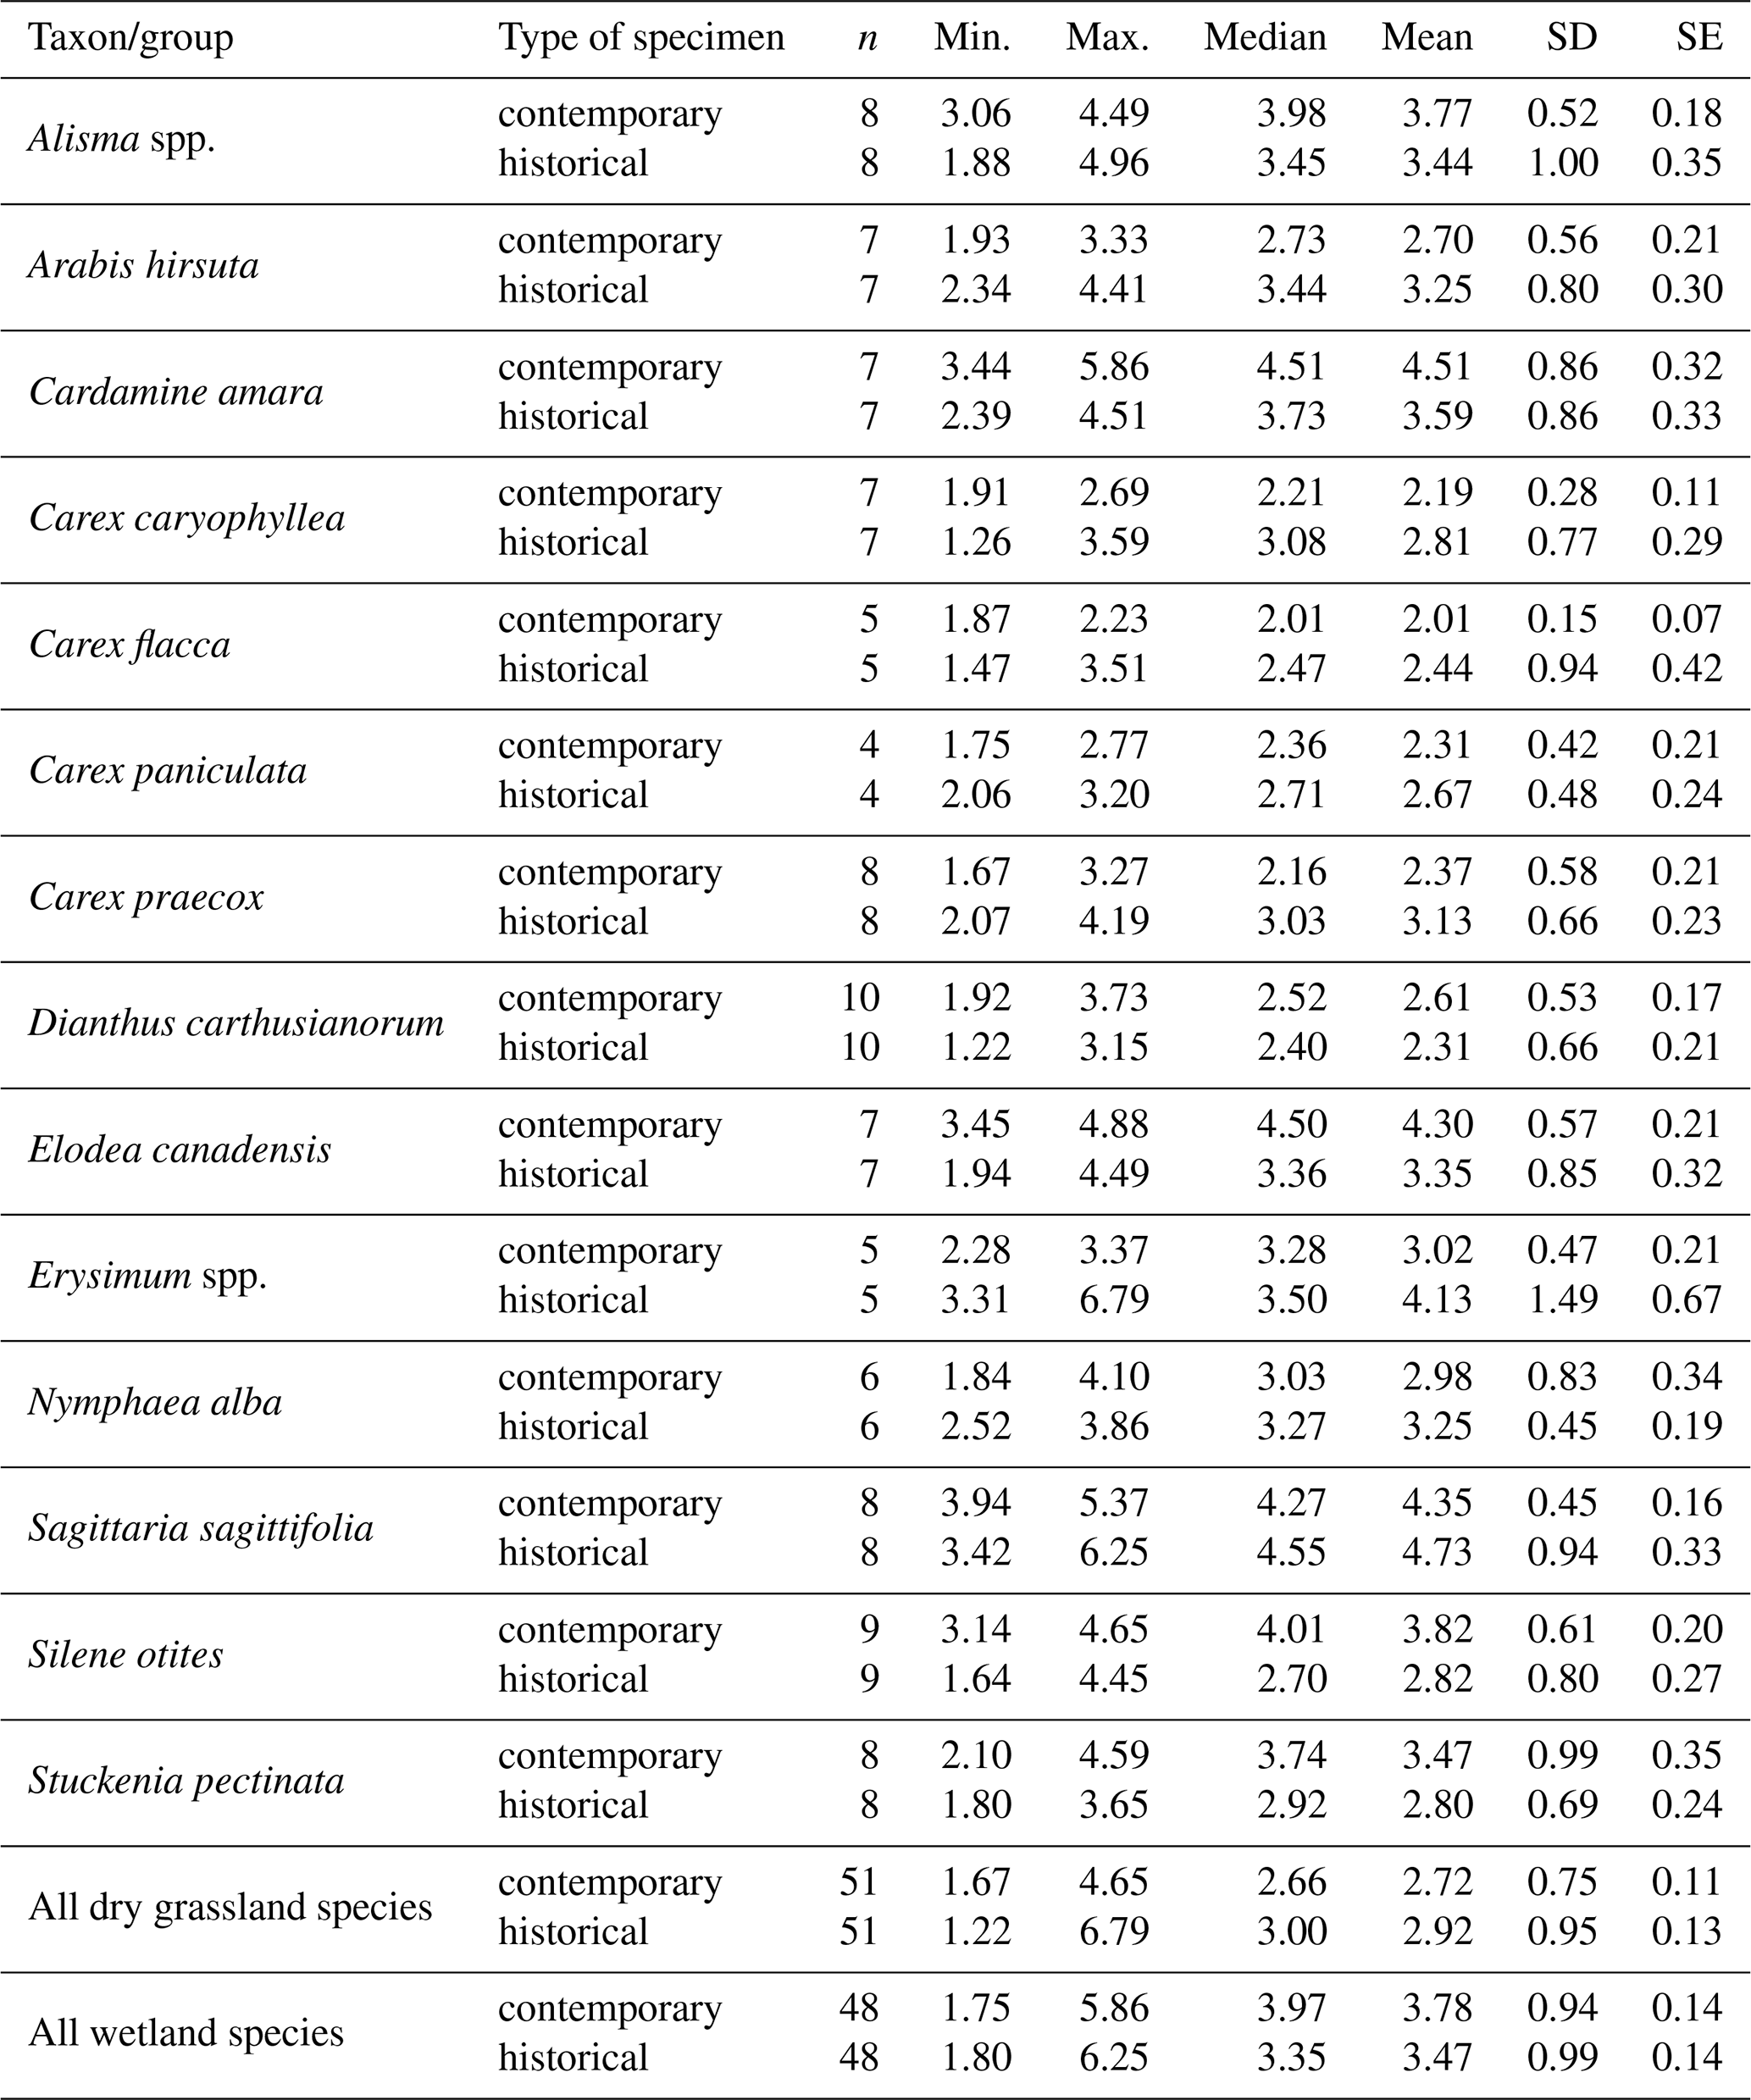
Table B3Summary statistics of δ13C (values given in ‰) of the foliar samples of 14 species selected for the study, from both contemporary specimens collected in 2024 and historical specimens in the form of herbarium vouchers collected before 1939. Please note that the historical values were corrected for the Suess effect.
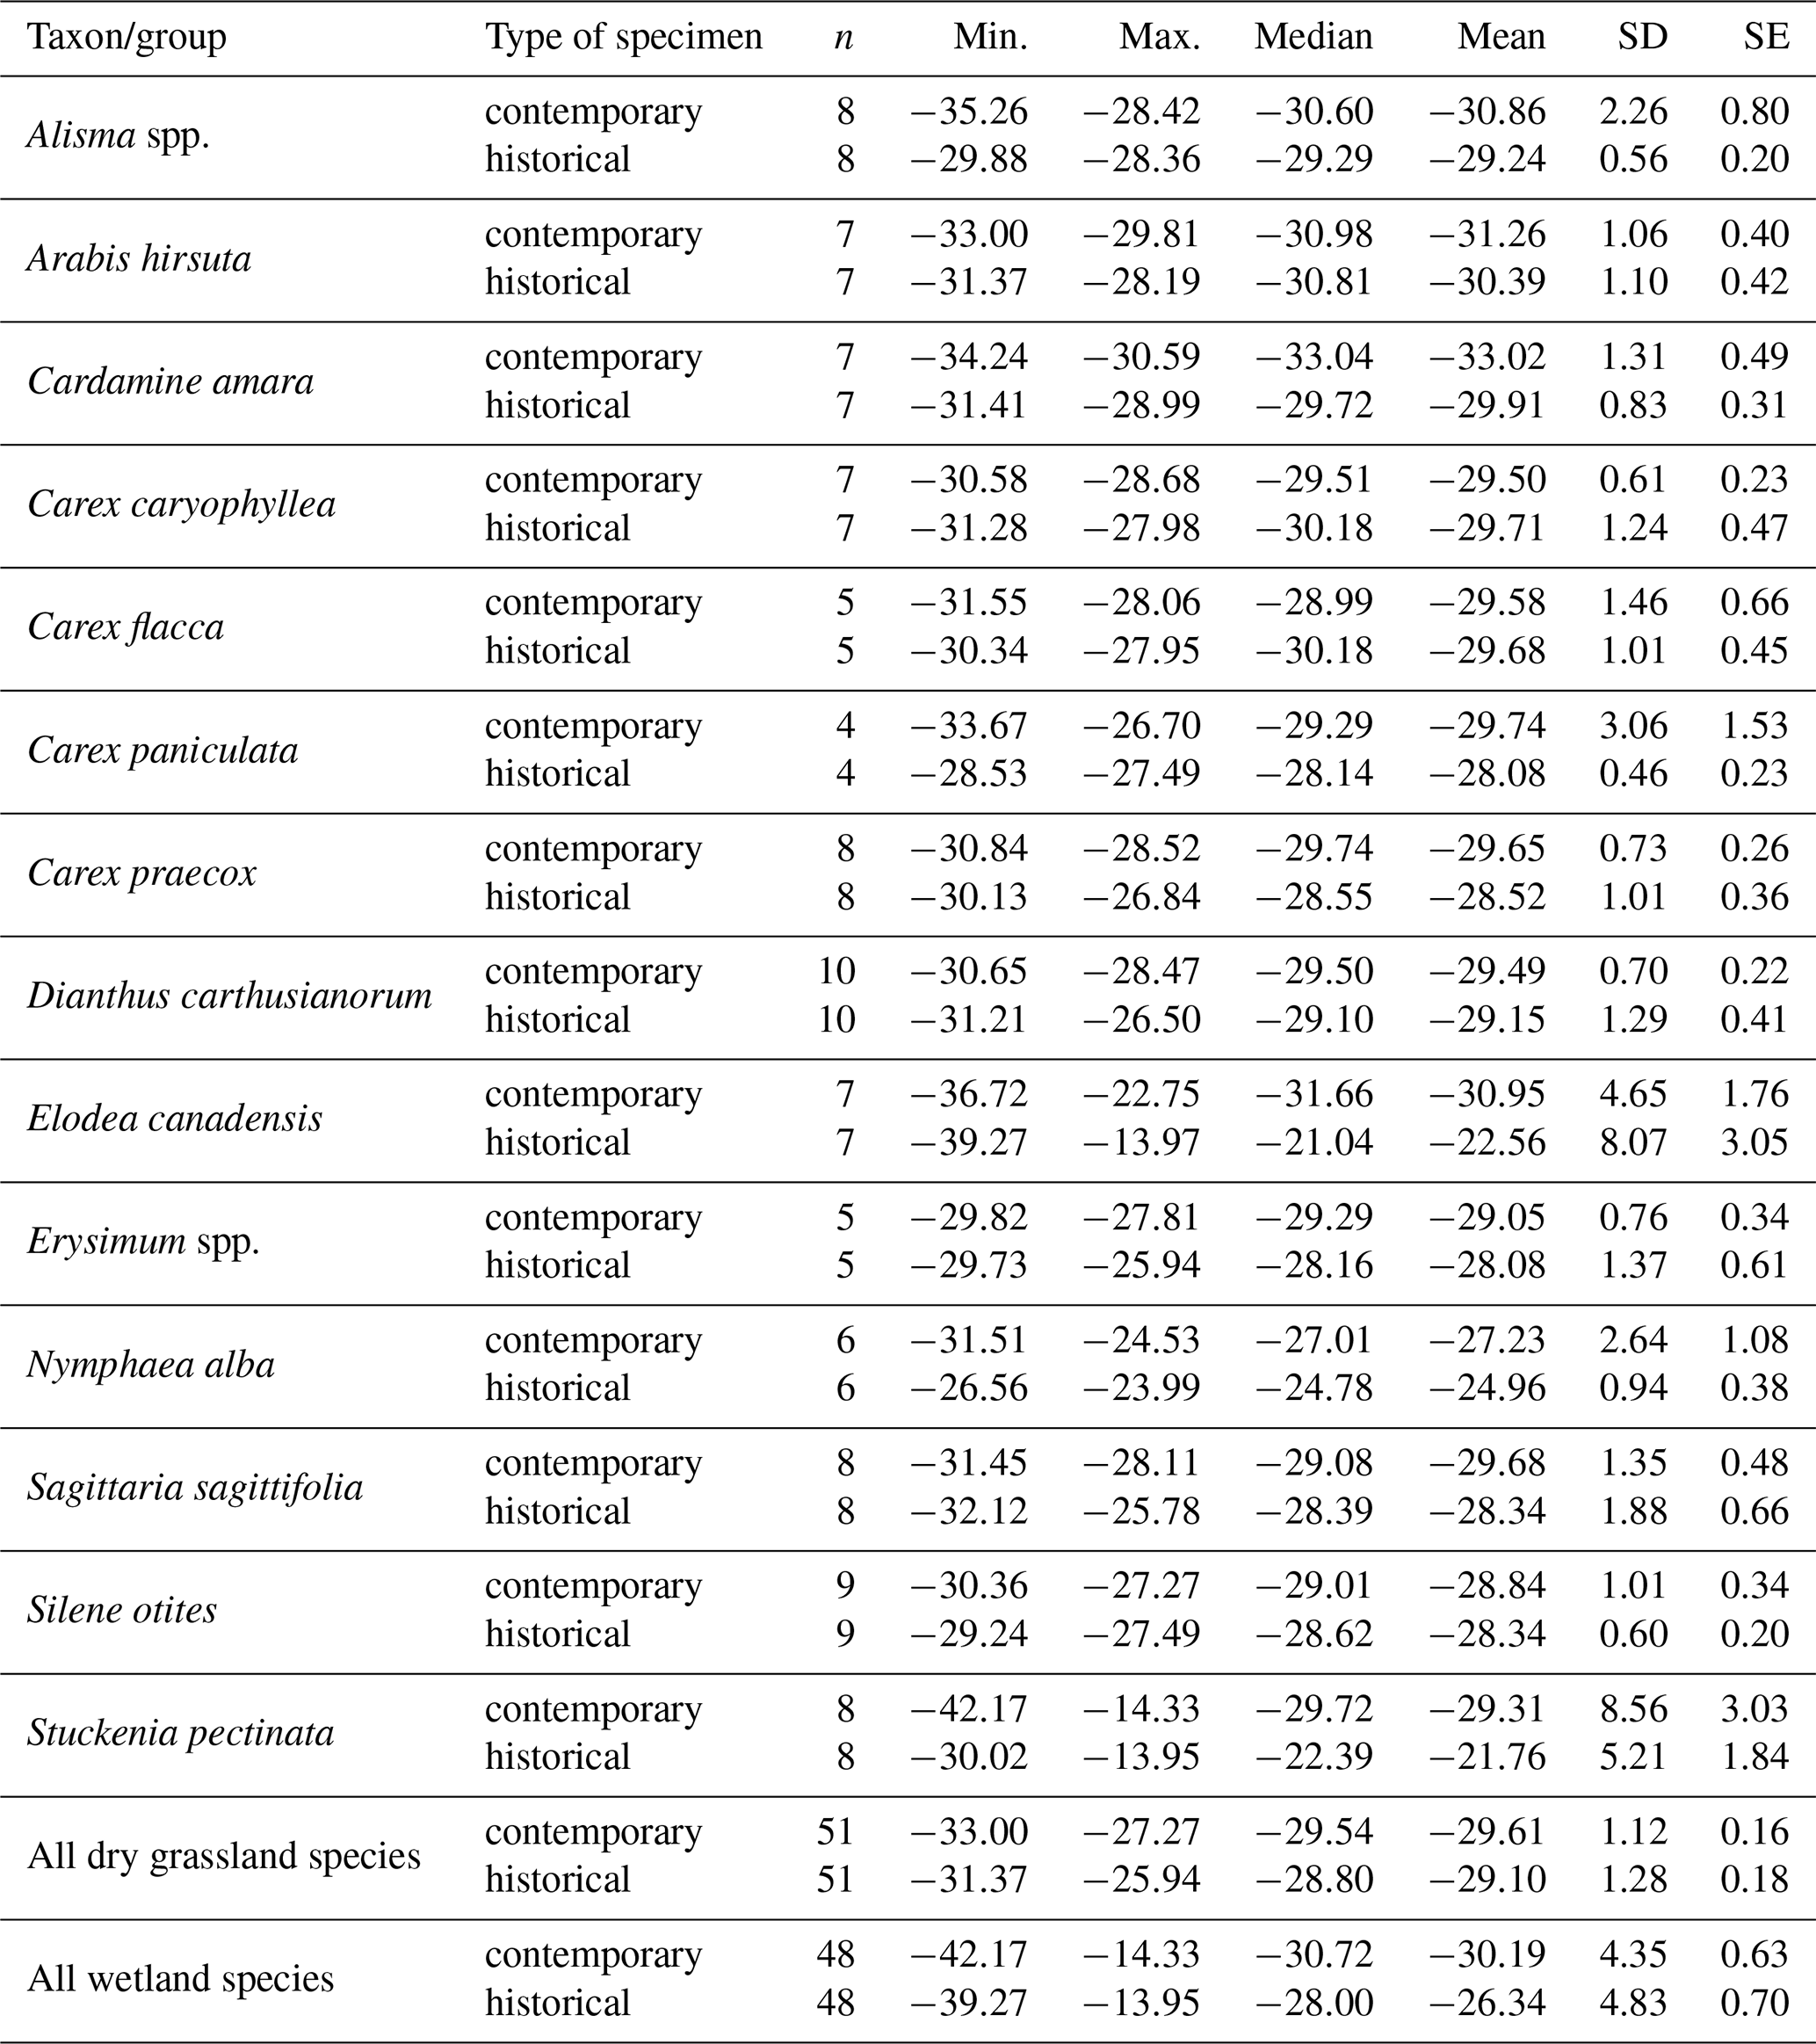
Table B4Mean differences between the δ15N, TN, and δ13C of contemporary samples and historical samples across the species and habitat types. The lower and upper 90 % confidence intervals for means were calculated using a one-sample t test. Please note that the historical values were corrected for the Suess effect prior to the calculations.
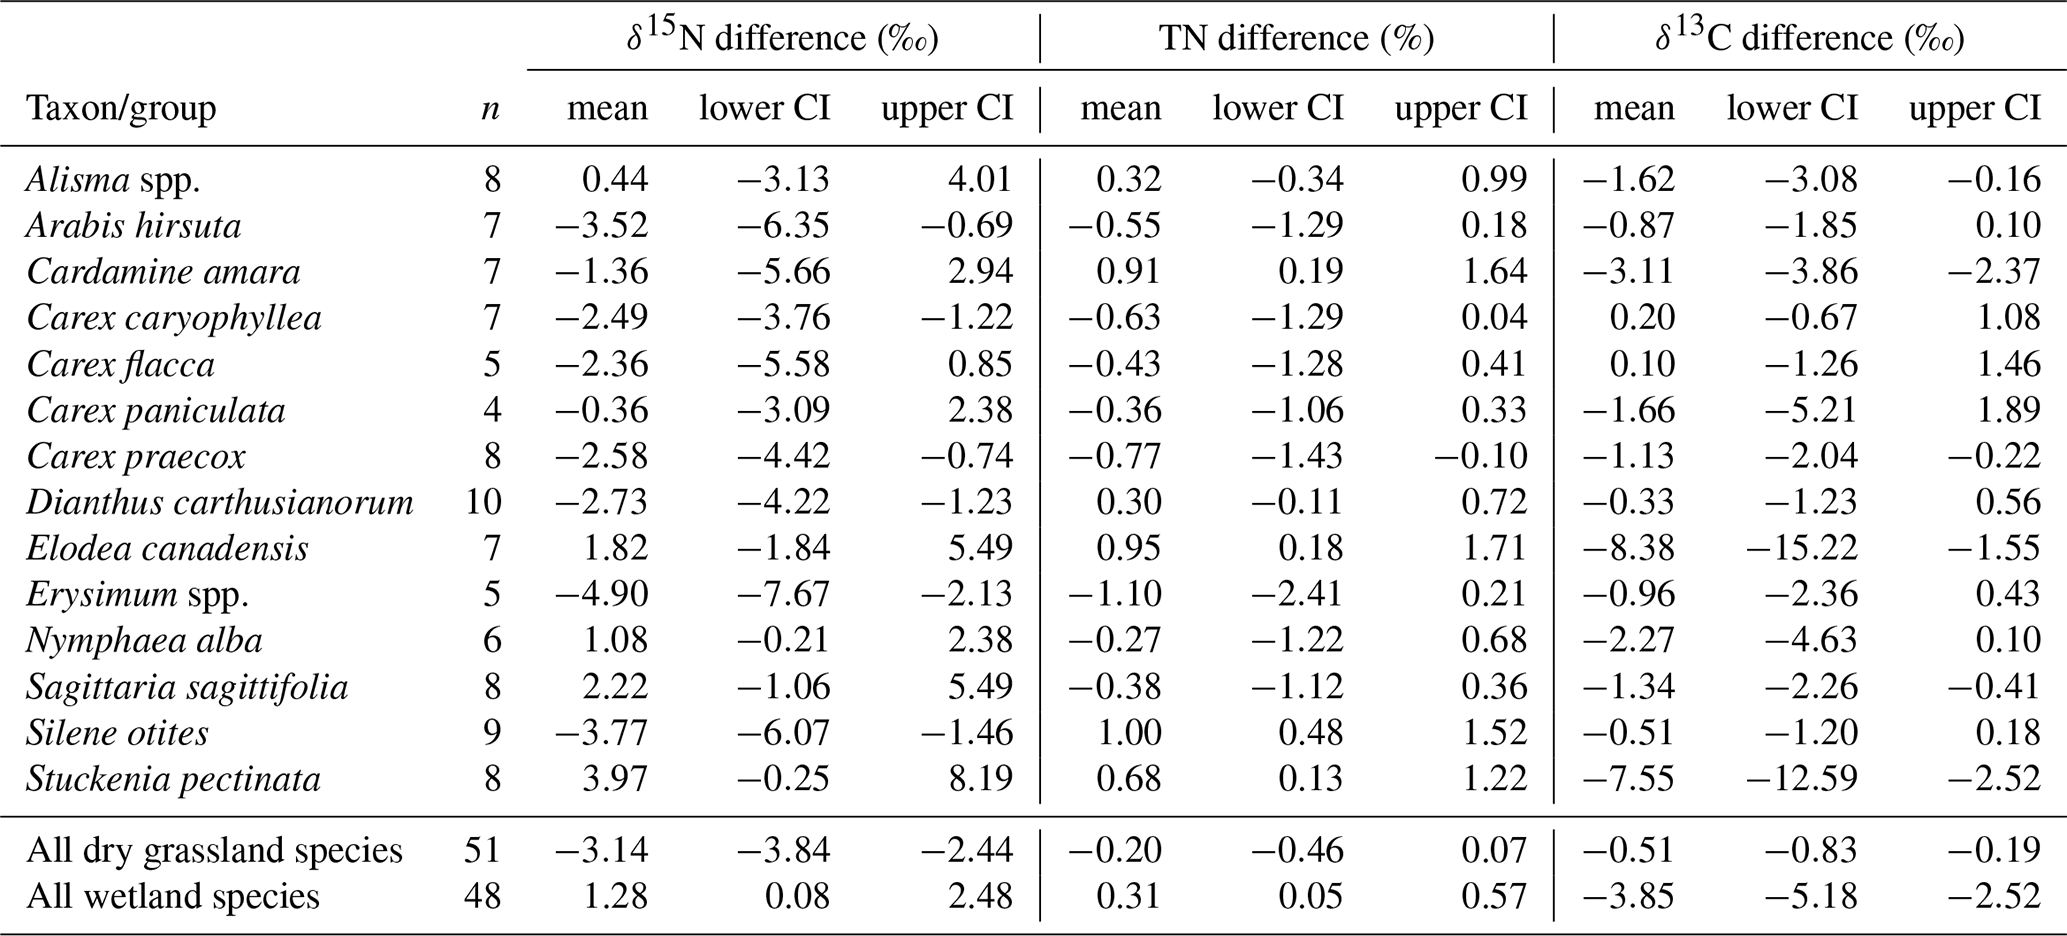
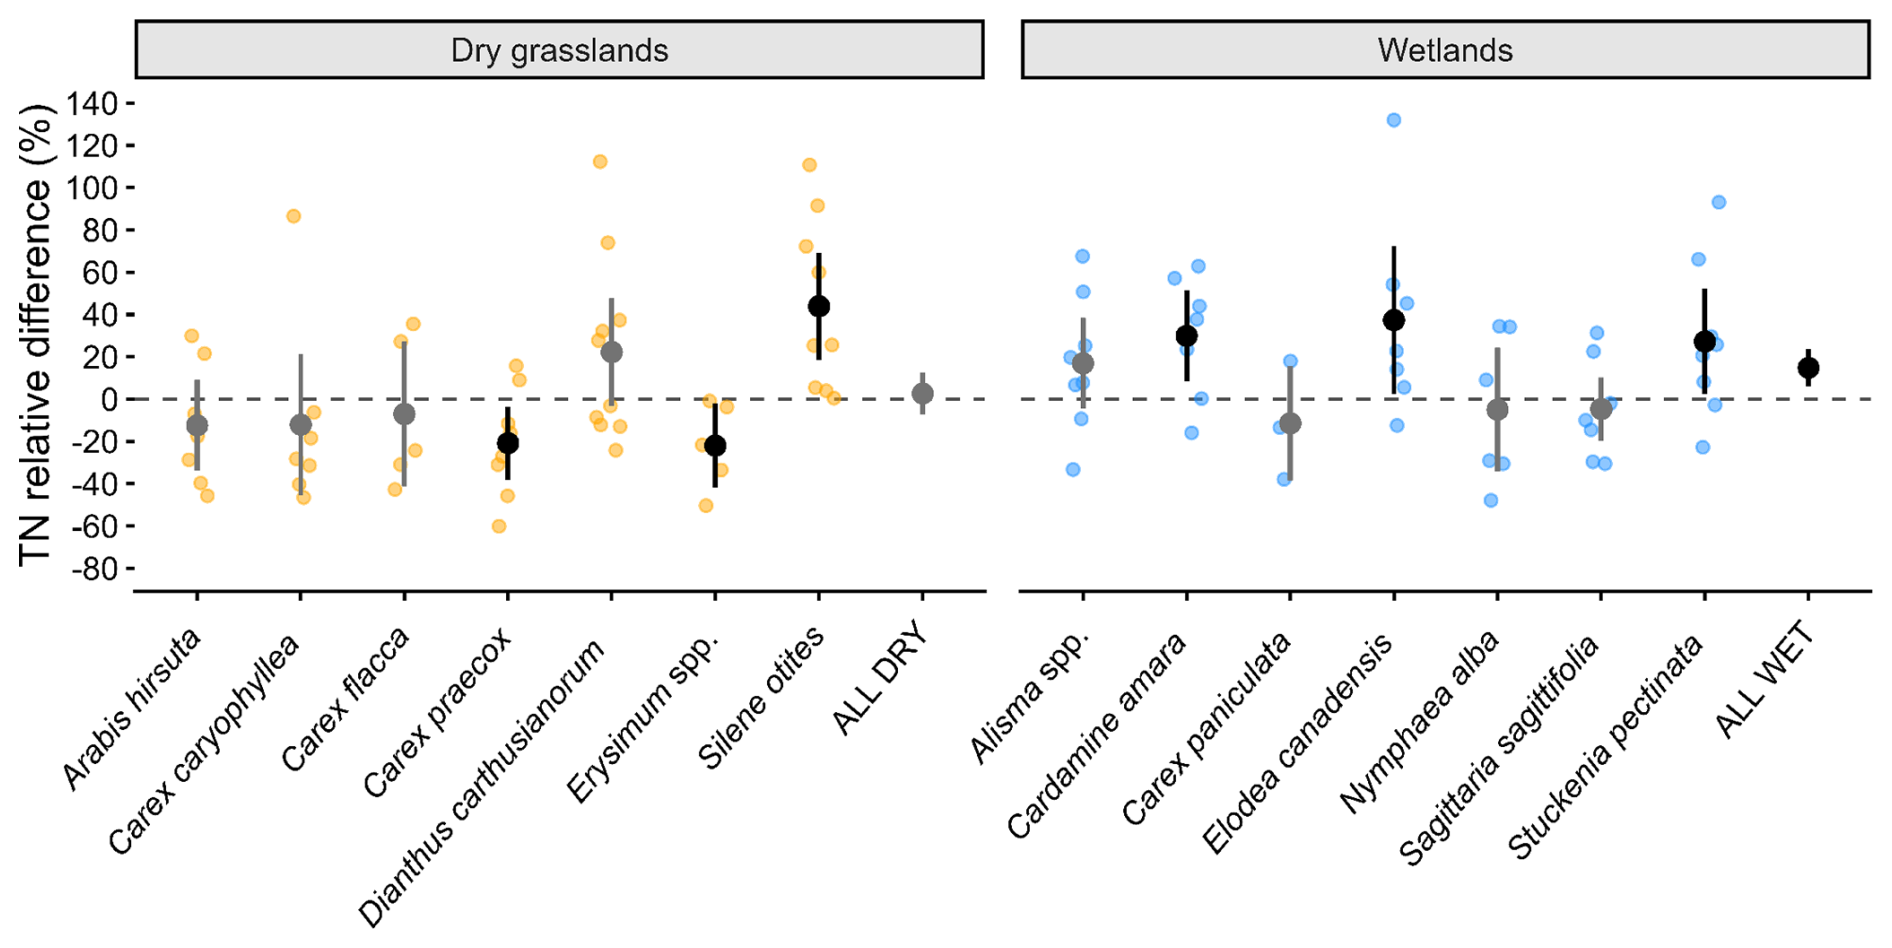
Figure C1Relative mean differences between the TN of contemporary samples and historical samples across the species and habitat types. Each observation is the difference between a contemporary and a historical sample paired with a location. The relative difference was calculated according to a formula: (TN contemporary sample − TN historical sample) TN historical sample ⋅ 100. The thick lines represent the 90 % confidence interval (CI) for the population mean: black for significant difference and grey for non-significant one.
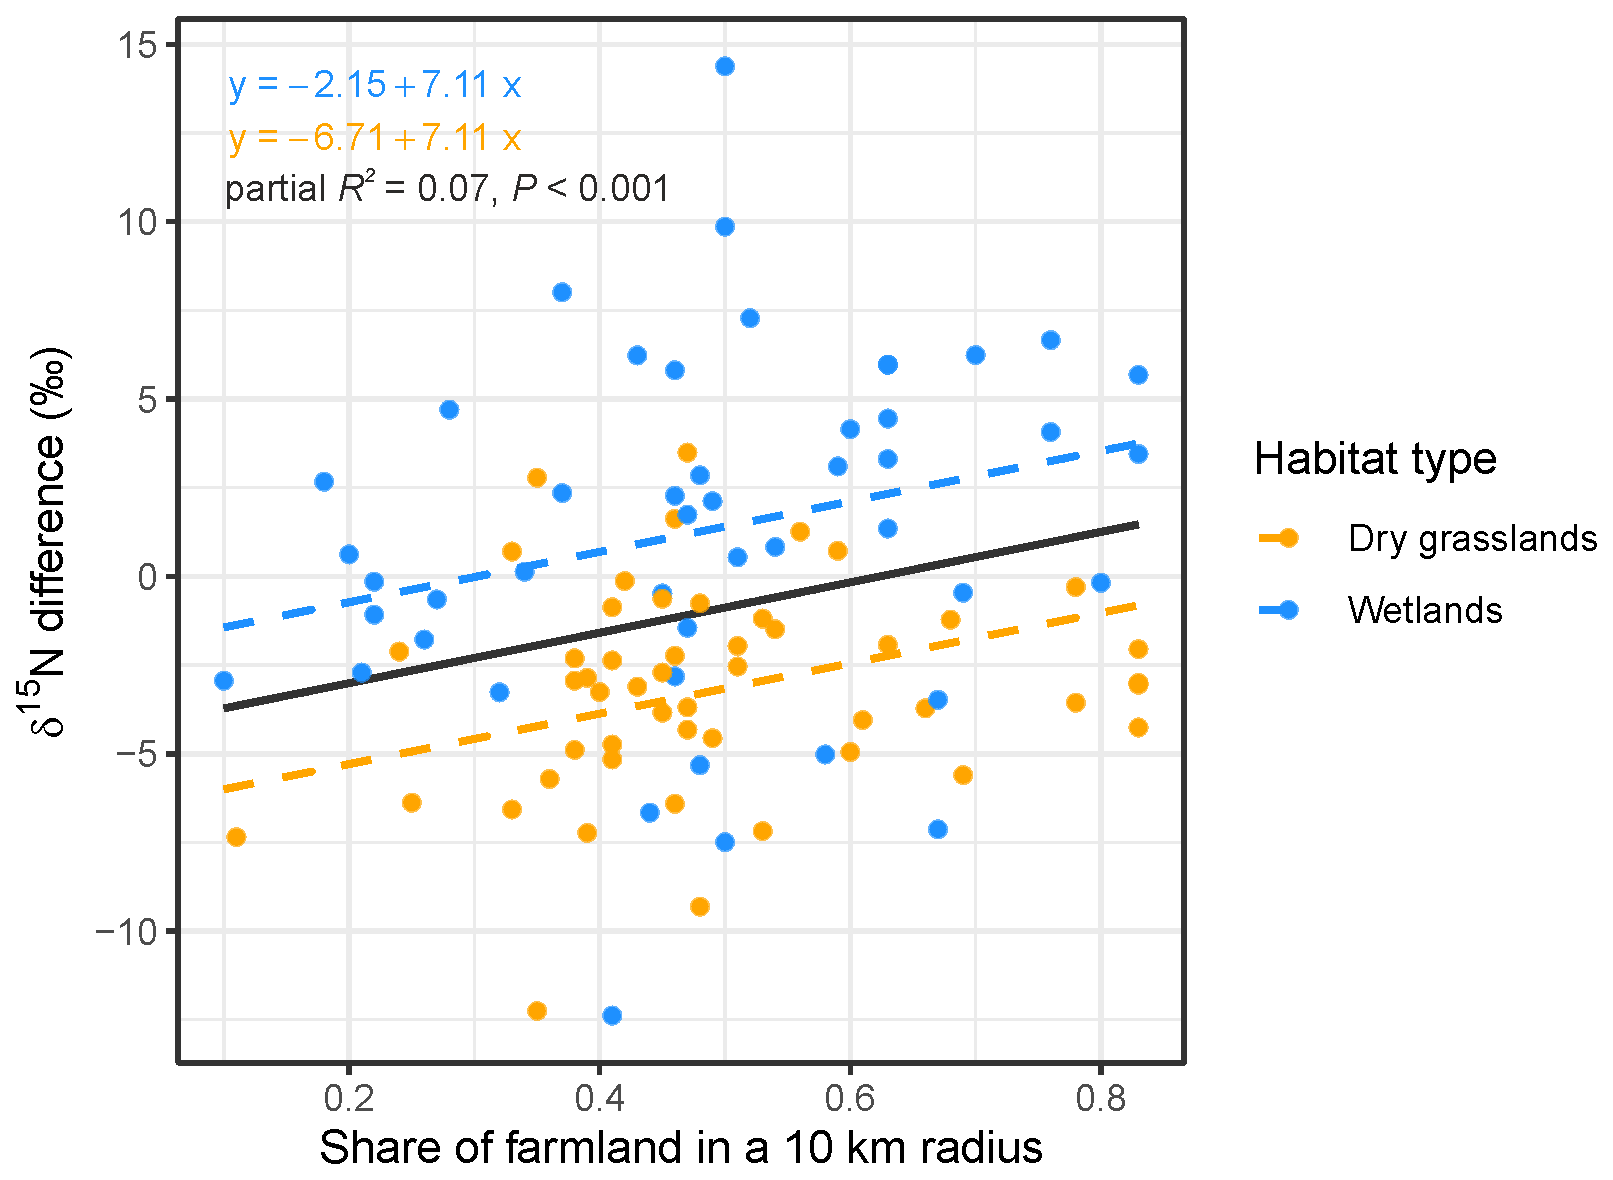
Figure C2The relationship between the proportion of farmland within a 10 km radius and the difference in δ15N between contemporary and historical foliar samples, which were paired by location. The black line represents the predicted value of the dependent variable for each value of the main independent variable, while accounting for the influence of the other independent variables. Partial R2 and p value refer to share of farmland in a 10 km radius. The dashed lines represent the regression lines for the given habitat type with their equations given with respective colours.
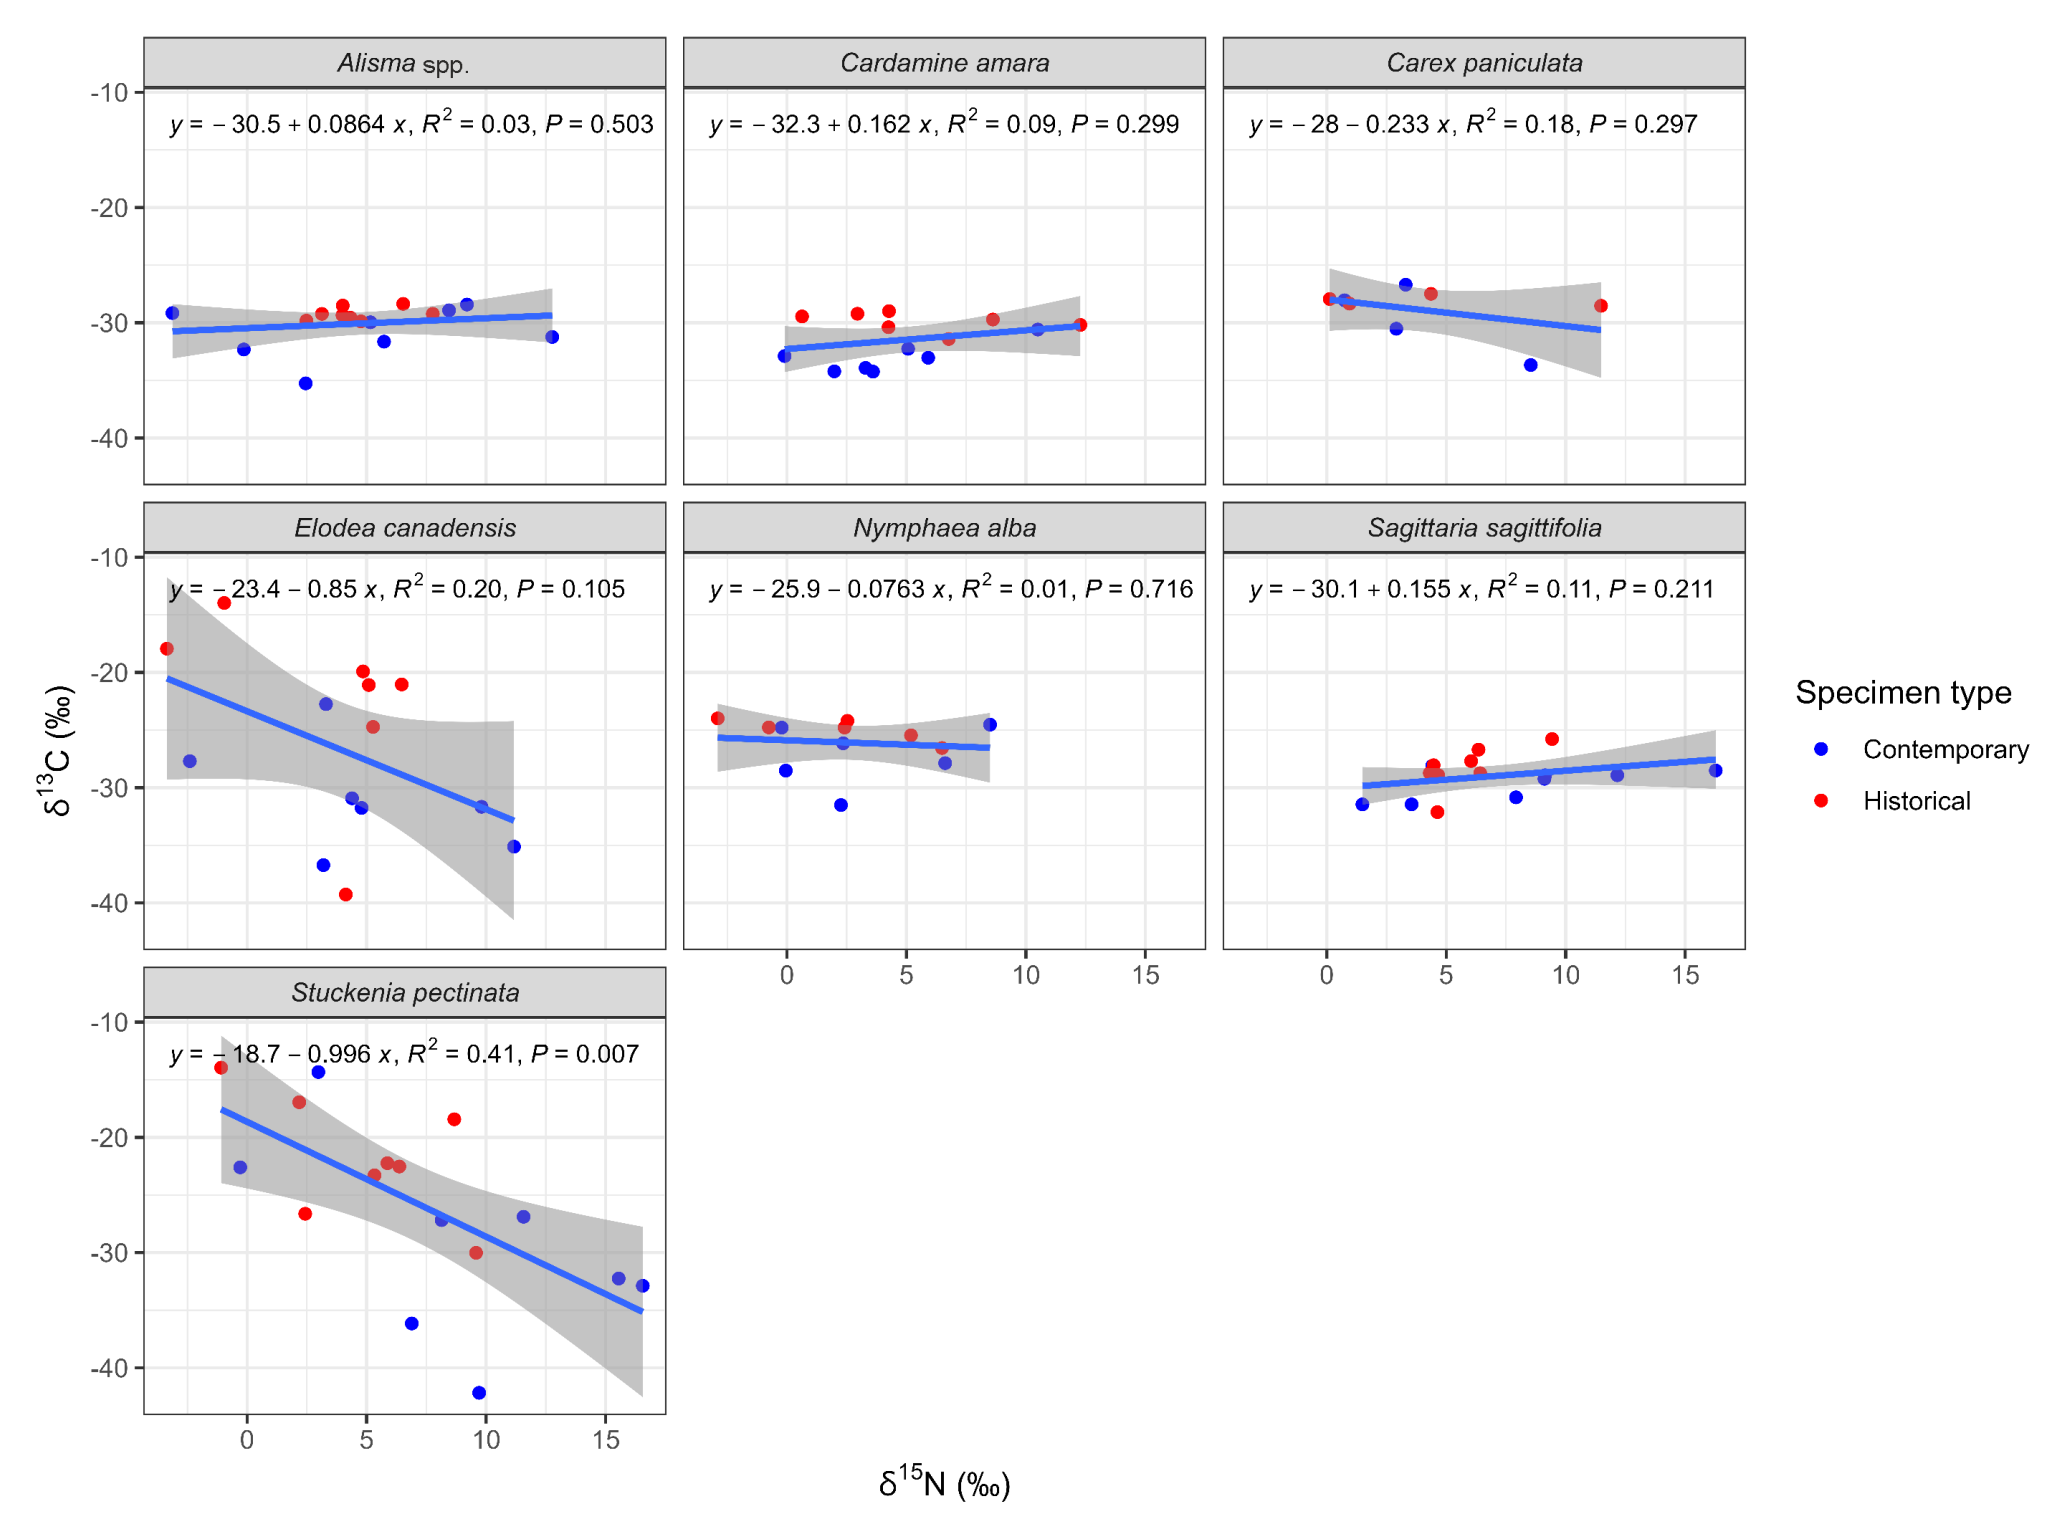
Figure C3The relationships between δ15N and δ13C in all the foliar samples studied (i.e. historical and contemporary samples combined) from seven wetland species. The blue line shows the fitted linear regression model, and the grey area shows the 95 % confidence interval.
All the data used in the study are available in the Supplement.
Table S1: List of all foliar samples and the raw data used in the analyses. The supplement related to this article is available online at https://doi.org/10.5194/bg-23-7375-2026-supplement.
ID and ŁK conceived the idea, designed, and supervised the project. ID, ŁK and NC conducted field sampling. NC and ID selected and sampled the herbarium material. PC performed the laboratory analyses. NC obtained the GIS data and prepared the final dataset. ID analysed the data and prepared the figures, besides the map, which was prepared by ŁK. Writing was led by ID, with support from all other authors.
The contact author has declared that none of the authors has any competing interests.
Publisher's note: Copernicus Publications remains neutral with regard to jurisdictional claims made in the text, published maps, institutional affiliations, or any other geographical representation in this paper. The authors bear the ultimate responsibility for providing appropriate place names. Views expressed in the text are those of the authors and do not necessarily reflect the views of the publisher.
We would like to gratefully acknowledge the Herbarium of the Faculty of Biology, University of Warsaw, for permission and assistance in collecting herbarium specimens for the study. We would also like to thank the Minister of Climate and Environment, the General and Regional Directorates of Environmental Protection and the authorities of the National Parks (Kampinos NP, Ojców NP, Świętokrzyski NP, and Wigry NP) for their permission to collect plant material from protected areas and to collect material from protected species. We are grateful to Jürgen Dengler, Jerzy Dembicz, Krzysztof Dembicz, Grzegorz Grzejszczak, Jan Kucharzyk, and Paweł Pawlikowski, for their help with field sampling.
The project was funded by the University of Warsaw within the framework of the “Excellence Initiative – Research University” programme (grant no. BOB-IDUB-622-577/2023 to I.D.).
This paper was edited by Frank Hagedorn and reviewed by two anonymous referees.
Alldred, F. C., Gröcke, D. R., Jackson, S. E., and Reid, G.: Nitrogen isotopes in herbaria document historical nitrogen sewage pollution in the Mersey Estuary, England, Environ. Sci.: Adv., 3, 676–685, https://doi.org/10.1039/D4VA00015C, 2024.
Bakker, W., Morel, T., Ozinga, W., Scheper, J., and Vergeer, P.: The relative importance of nitrogen deposition and climate change in driving plant diversity decline in roadside grasslands, Sci. Total Environ., 955, 176962, https://doi.org/10.1016/j.scitotenv.2024.176962, 2024.
Bateman, A. S. and Kelly, S. D.: Fertilizer nitrogen isotope signatures. Isot, Environ. Health Stud., 43, 237–247, https://doi.org/10.1080/10256010701550732, 2007.
Bobbink, R., Hicks, K., Galloway, J., Spranger, T., Alkemade, R., Ashmore, M., Bustamante, M., Cinderby, S., Davidson, E., Dentener, F., Emmett, B., Erisman, J., Fenn, M., Gilliam, F., Nordin, A., Pardo, L., and De Vries, W.: Global assessment of nitrogen deposition effects on terrestrial plant diversity: a synthesis, Ecol. Appl., 20, 30–59, https://doi.org/10.1890/08-1140.1, 2010.
Bodirsky, B. L., Popp, A., Weindl, I., Dietrich, J. P., Rolinski, S., Scheiffele, L., Schmitz, C., and Lotze-Campen, H.: N2O emissions from the global agricultural nitrogen cycle – current state and future scenarios, Biogeosciences, 9, 4169–4197, https://doi.org/10.5194/bg-9-4169-2012, 2012.
Bohn, U., Neuhäusl, R., Gollub, G., Hettwer, C., Neuhäuslová, Z., and Schlüter, H. (Eds.): Map of the natural vegetation of Europe, Scale 1:2 500 000, Landwirtschaftsverlag, Münster, Germany, 2000–2003.
Brodie, C. R., Leng, M. J., Casford, J. S. L., Kendrick, C. P., Lloyd, J. M., Yongqiang, Z., and Bird, M. I.: Evidence for bias in C and N concentrations and δ13C composition of terrestrial and aquatic organic materials due to pre-analysis acid preparation methods, Chem. Geol., 282, 67–83, https://doi.org/10.1016/j.chemgeo.2011.01.007, 2011.
Bukata, A. R. and Kyser, T. K.: Carbon and nitrogen isotope variations in tree-rings as records of perturbations in regional carbon and nitrogen cycles. Environ. Sci. Technol., 41, 1331–1338, https://doi.org/10.1021/es061414g, 2007.
Caldararu, S., Thum, T., Yu, L., Kern, M., Nair, R., and Zaehle, S.: Long-term ecosystem nitrogen limitation from foliar δ15N data and a land surface model, Glob. Chang. Biol., 28, 493–508, https://doi.org/10.1111/gcb.15933, 2022.
Cernusak, L. A., Ubierna, N., Winter, K., Holtum, J. A. M., Marshall, J. D., and Farquhar, G. D.: Environmental and physiological determinants of carbon isotope discrimination in terrestrial plants, New Phytol., 200, 950–965, https://doi.org/10.1111/nph.12423, 2013.
Chappuis, E., Seriñá, V., Martí, E., Ballesteros, E., and Gacia E.: Decrypting stable-isotope (δ13C and δ15N) variability in aquatic plants, Freshwater Biol., 62, 1807–1818, https://doi.org/10.1111/fwb.12996, 2017.
Chen, B., Kim, Y., and Westerhoff, P.: Occurrence and treatment of wastewater-derived organic nitrogen, Water Res., 45, 4641–4650, https://doi.org/10.1016/j.watres.2011.06.018, 2011.
Chen, Q., Wang, S., Borer, E. T., Bakker, J. D., Seabloom, E. W., Harpole, W. S., Eisenhauer, N., Lekberg, Y., Buckley, Y. M., Catford, J. A., Roscher, C., Donohue, I., Power, S. A., Daleo, P., Ebeling, A., Knops, J. M. H., Martina, J. P., Eskelinen, A., Morgan, J. W., Risch, A. C., Caldeira, M. C., Bugalho, M. N., Virtanen, R., Barrio, I. C., Niu, Y., Jentsch, A., Stevens, C. J., Gruner, D. S., MacDougall, A. S., Alberti, J., and Hautier, Y.: Multidimensional responses of grassland stability to eutrophication, Nat. Commun., 14, 6375, https://doi.org/10.1038/s41467-023-42081-0, 2023.
CLC: CORINE Land Cover – CLC 2018, https://clc.gios.gov.pl/index.php/clc-2018/udostepnianie (last access: 18 December 2024), 2018.
Cornwell, W. K., Bedford, B. L., and Chapin, C. T.: Occurrence of arbuscular mycorrhizal fungi in a phosphorus-poor wetland and mycorrhizal response to phosphorus fertilization, Am. J. Bot., 88, 1824–1829, https://doi.org/10.2307/3558359, 2001.
Cotrufo, M. F., Ineson, P., and Scott, A.: Elevated CO2 reduces the nitrogen concentration of plant tissues, Glob. Chang. Biol., 4, 43–54, https://doi.org/10.1046/j.1365-2486.1998.00101.x, 1998.
Craine, J. M., Tilman, D., Wedin, D., Reich, P., Tjoelker, M., and Knops, J.: Functional traits, productivity and effects on nitrogen cycling of 33 grassland species, Funct. Ecol., 16, 563–574, https://doi.org/10.1046/j.1365-2435.2002.00660.x, 2009.
Craine, J. M., Elmore, A. J., Aidar, M. P. M., Bustamante, M., Dawson, T. E., Hobbie, E. A., Kahmen, A., Mack, M. C., McLauchlan, K. K., Michelsen, A., Nardoto, G. B., Pardo, L. H., Peñuelas, J., Reich, P. B., Schuur, E. A. G., Stock, W. D., Templer, P. H., Virginia, R. A., Welker, J. M., and Wright, I. J.: Global patterns of foliar nitrogen isotopes and their relationships with climate, mycorrhizal fungi, foliar nutrient concentrations, and nitrogen availability, New Phytol., 183, 980–992, https://doi.org/10.1111/j.1469-8137.2009.02917.x, 2009.
Dailer, M. L., Knox, R. S., Smith, J. E., Napier, M., and Smith, C. M.: Using δ15N values in algal tissue to map locations and potential sources of anthropogenic nutrient inputs on the island of Maui, Hawai`i, USA, Mar. Pollut. Bull., 60, 655–671, https://doi.org/10.1016/j.marpolbul.2009.12.021, 2010.
Dawson, T. E., Mambelli, S., Plamboeck, A. H., Templer, P. H., and Kevin, P. T.: Stable isotopes in plant ecology, Annu. Rev. Ecol. Evol. Syst., 33, 507–559, https://doi.org/10.1146/annurev.ecolsys.33.020602.095451, 2002.
Diebel, M. W. and Zanden, M. J. V.: Nitrogen stable isotopes in streams: Effects of agricultural sources and transformations, Ecol. Appl., 19, 1127–1134, https://doi.org/10.1890/08-0327.1, 2009.
Dise, N. B., Ashmore, M., Belyazid, S., Bleeker, A., Bobbink, R., De Vries, W., Erisman, J. W., Spranger, T., Stevens, C. J., and Van Den Berg, L.: Nitrogen as a threat to European terrestrial biodiversity, in: The European Nitrogen Assessment, 1st edn., edited by: Sutton, M. A., Howard, C. M., Erisman, J. W., Billen, G., Bleeker, A., Grennfelt, P., Van Grinsven, H., and Grizzetti, B., Cambridge University Press, Cambridge, UK, 463–494, https://doi.org/10.1017/CBO9780511976988.023, 2011.
Dombrosky, J.: A ∼1000-year 13C Suess correction model for the study of past ecosystems, Holocene, 30, 474–478, https://doi.org/10.1177/0959683619887416, 2020.
Elliott, E. M., Yu, Z., Cole, A. S., and Coughlin, J. G.: Isotopic advances in understanding reactive nitrogen deposition and atmospheric processing, Sci. Total Environ., 662, 393–403, https://doi.org/10.1016/j.scitotenv.2018.12.177, 2019.
Erisman, J., Sutton, M., Galloway, J., Klimont, Z., and Winiwarter, W.: How a century of ammonia synthesis changed the world, Nat. Geosci., 1, 636–639, https://doi.org/10.1038/ngeo325, 2008.
European Union: NOx, European air quality data for 2023 (interpolated data), June 2025, European Union [data set], http://data.europa.eu/88u/dataset/a2c980b7-5632-4ff3-bf0c-b75e627339cd (last access: 10 November 2025), 2025.
Eurostat: https://ec.europa.eu/eurostat/web/products-eurostat-news/w/ddn-20250704-3 (last access: 20 September 2025), 2025.
Evans, R. D.: Physiological mechanisms influencing plant nitrogen isotope composition, Trends Plant Sci., 6, 121–126, https://doi.org/10.1016/S1360-1385(01)01889-1, 2001.
FAO: Inorganic fertilizers 2002–2022, FAOSTAT Analytical Briefs, 90, Rome, 13 pp., https://doi.org/10.4060/cd1485en, 2024.
Freyer, H. D., Kobel, K., Delmas, R. J., Kley, D., and Legrand, M. R.: First results of ratios in nitrate from alpine and polar ice cores, Tellus, 48B, 93–105, https://doi.org/10.1034/j.1600-0889.1996.00009.x, 1996.
Galloway, J. N., Bleeker, A., and Erisman, J. W.: The human creation and use of reactive nitrogen: A global and regional perspective, Annu. Rev. Environ. Resour., 46, 255–288, https://doi.org/10.1146/annurev-environ-012420-045120, 2021.
George, E., Marschner, H., and Jakobsen, I.: Role of arbuscular mycorrhizal fungi in uptake of phosphorus and nitrogen from soil, Crit. Rev. Biotechnol., 15, 257–270, https://doi.org/10.3109/07388559509147412, 1995.
Gerschlauer, F., Saiz, G., Schellenberger Costa, D., Kleyer, M., Dannenmann, M., and Kiese, R.: Stable carbon and nitrogen isotopic composition of leaves, litter, and soils of various ecosystems along an elevational and land-use gradient at Mount Kilimanjaro, Tanzania, Biogeosciences, 16, 409–424, https://doi.org/10.5194/bg-16-409-2019, 2019.
Gubsch, M., Roscher, C., Gleixner, G., Habekost, M., Lipowsky, A., Schmid, B., Schulze, E-D., Steinbeiss, S., and Buchmann, N.: Foliar and soil δ15N values reveal increased nitrogen partitioning among species in diverse grassland communities, Plant Cell Environ., 34, 895–908, https://doi.org/10.1111/j.1365-3040.2011.02287.x, 2011.
GUS: Powszechny Spis Rolny 2020, Raport z wyników [General Agricultural Census 2020. Report on the result], Central Statistical Office, Department of Agriculture, Warszawa, PL, 96 pp., 2021 (in Polish).
GUS: Central Statistical Office, Department of Agriculture, Local data bank: https://bdl.stat.gov.pl/bdl/dane/podgrup/temat (last access: 10 July 2026), 2026.
Hall, S. J., Hale, R. L., Baker, M. A., Bowling, D. R., and Ehleringer, J. R.: Riparian plant isotopes reflect anthropogenic nitrogen perturbations: robust patterns across land use gradients, Ecosphere, 6, 200, https://doi.org/10.1890/ES15-00319.1, 2015.
Hastings, M. G., Jarvis, J. C., and Steig, E. J.: Anthropogenic impacts on nitrogen isotopes of ice-core nitrate, Science, 324, 1288–1288, https://doi.org/10.1126/science.1170510, 2009.
Hastings, M. G., Casciotti, K. L., and Elliott, E. M.: Stable isotopes as tracers of anthropogenic nitrogen sources, deposition, and impacts, Elements, 9, 339–344, https://doi.org/10.2113/gselements.9.5.339, 2013.
Hellings, L., Dehairs, F., Tackx, M., Keppens, E., and Baeyens, W.: Origin and fate of organic carbon in the freshwater part of the Scheldt Estuary as traced by stable carbon isotope composition, Biogeochemistry, 47, 167–186, https://doi.org/10.1023/A:1006143827118, 1999.
Heredia, C., Guédron, S., Point, D., Perrot, V., Campillo, S., Verin, C., Espinoza, M. E., Fernandez, P., Duwig, C., and Achá D: Anthropogenic eutrophication of Lake Titicaca (Bolivia) revealed by carbon and nitrogen stable isotopes fingerprinting, Sci. Total Environ., 845, 157286, https://doi.org/10.1016/j.scitotenv.2022.157286, 2022.
Hertel, O., Skjøth, C. A., Reis, S., Bleeker, A., Harrison, R. M., Cape, J. N., Fowler, D., Skiba, U., Simpson, D., Jickells, T., Kulmala, M., Gyldenkærne, S., Sørensen, L. L., Erisman, J. W., and Sutton, M. A.: Governing processes for reactive nitrogen compounds in the European atmosphere, Biogeosciences, 9, 4921–4954, https://doi.org/10.5194/bg-9-4921-2012, 2012.
Hessen, D. O., Henriksen, A., Hindar, A., Mulder, J., Tørseth, K., and Vagstad, N.: Human impacts on the nitrogen cycle: A global problem judged from a local perspective, Ambio, 26, 321–325, 1997.
Holtgrieve, G. W., Schindler, D. E., Hobbs, W. O., Leavitt, P. R., Ward, E. J., Bunting, L., Chen, G., Finney, B. P., Gregory-Eaves, I., Holmgren, S., Lisac, M. J., Lisi, P. J., Nydick, K., Rogers, L. A., Saros, J. E., Selbie, D. T., Shapley, M. D., Walsh, P. B., and Wolfe, A. P.: A coherent signature of anthropogenic nitrogen deposition to remote watersheds of the Northern Hemisphere, Science, 334, 1545–1548, https://doi.org/10.1126/science.1212267, 2011.
Janssen, J. A. M., Rodwell, J. S., García Criado, M., Gubbay, S., Haynes, T., Nieto, A., Sanders, N., Landucci, F., Loidi, J., Ssymank, A., Tahvanainen, T., Valderrabano, M., Acosta, A., Aronsson, M., Arts, G., Attorre, F., Bergmeier, E., Bijsma, R.-J., Bioret, F., Biţă-Nicolae, C., Biurrun, I., Calix, M., Capelo, J., Čarn, A., Chytrý, M., Dengler, J., Dimopoulos, P., Essl, F., Gardfjell, H., Gigante, D., Giusso del Galdo, G. P., Hájek, M., Jansen, F., Jansen, J., Kapfer, J., Mikolajczak, A., Molina, J.A., Molnár, Z., Paternoster, D., Piernik, A., Poulin, B., Renaux, B., Schaminée, J. H. J., Šumberová, K., Toivonen, H., Tonteri, T., Tsiripidis, I., Tzonev, R., and Valachovič, M.: European red list of habitats. Part 2, Terrestrial and freshwater habitats, Publications Office of the European Union, Luxembourg, 44 pp., 2016.
Karger, D. N., Conrad, O., Böhner, J., Kawohl, T., Kreft, H., Soria-Auza, R. W., Zimmermann, N. E., Linder, H. P., and Kessler, M.: Climatologies at high resolution for the earth's land surface areas, Sci. Data, 4, 170122, https://doi.org/10.1038/sdata.2017.122, 2017.
Keeling, C. D.: The Suess effect: 13Carbon-14Carbon interrelations, Environ. Int., 2, 229–300, https://doi.org/10.1016/0160-4120(79)90005-9, 1979.
Keeling, R. F., Graven, H. D., Welp, L. R., Resplandy, L., Bi, J., Piper, S. C., Sun, Y., Bollenbacher, A., and Meijer, H. A. J.: Atmospheric evidence for a global secular increase in carbon isotopic discrimination of land photosynthesis, P. Natl. Acad. Sci. USA, 114, 10361–10366, https://doi.org/10.1073/pnas.1619240114, 2017.
Kendall, C., Elliott, E. M., and Wankel, S. D.: Tracing anthropogenic inputs of nitrogen to ecosystems, in: Stable isotopes in ecology and environmental science, edited by: Michener, R. and Lajtha, K., Wiley, Hoboken, New Jersey, U.S., 375–449, https://doi.org/10.1002/9780470691854.ch12, 2007.
Kennedy, P., Kennedy, H., and Papadimitriou, S.: The effect of acidification on the determination of organic carbon, total nitrogen and their stable isotopic composition in algae and marine sediment, Rapid Commun. Mass Spectrom., 19, 1063–1068, https://doi.org/10.1002/rcm.1889, 2005.
Kohzu, A., Miyajima, T., Tayasu, I., Yoshimizu, C., Hyodo, F., Matsui, K., Takanori, N., Wada, E., Fujita, N., and Nagata, T.: Use of stable nitrogen isotope signatures of riparian macrophytes as an indicator of anthropogenic N inputs to river ecosystems, Environ. Sci. Technol., 42, 7837–7841, https://doi.org/10.1021/es801113k, 2008.
Kottek, M., Grieser, J., Beck, C., Rudolf, B., and Rubel, F.: World map of the Köppen-Geiger climate classification updated, Meteorol. Z., 15, 259–263, https://doi.org/10.1127/0941-2948/2006/0130, 2006.
Krüger, J. P., Leifeld, J., Glatzel, S., Szidat, S., and Alewell, C.: Biogeochemical indicators of peatland degradation – a case study of a temperate bog in northern Germany, Biogeosciences, 12, 2861–2871, https://doi.org/10.5194/bg-12-2861-2015, 2015.
Kühn, P., Umazekabiri, R., Römermann, C., Bruelheide, H., and Wesche, K.: Nitrogen content of herbarium specimens from arable fields and mesic meadows reflect the intensifying agricultural management during the 20th century, J. Ecol., 11, 555–569, https://doi.org/10.1111/1365-2745.14474, 2025.
Lehnert, N., Dong, H. T., Harland, J. B., Hunt, A. P., and White, C. J.: Reversing nitrogen fixation, Nat. Rev. Chem., 2, 278–289, https://doi.org/10.1038/s41570-018-0041-7, 2018.
Lu, C. and Tian, H.: Global nitrogen and phosphorus fertilizer use for agriculture production in the past half century: shifted hot spots and nutrient imbalance, Earth Syst. Sci. Data, 9, 181–192, https://doi.org/10.5194/essd-9-181-2017, 2017.
McLauchlan, K. K., Ferguson, C. J., Wilson, I. E., Ocheltree, T. W., and Craine, J. M.: Thirteen decades of foliar isotopes indicate declining nitrogen availability in central North American grasslands, New Phytol., 187, 1135–1145, https://doi.org/10.1111/j.1469-8137.2010.03322.x, 2010.
Medlyn, B. E., Barton, C. V. M., Broadmeadow, M. S. J., Ceulemans, R., De Angelis, P., Forstreuter, M., Freeman, M., Jackson, S. B., Kellomäki, S., Laitat, E., Rey, A., Roberntz, P., Sigurdsson, B. D., Strassemeyer, J., Wang, K., Curtis, P. S., and Jarvis, P. G.: Stomatal conductance of forest species after long-term exposure to elevated CO2 concentration: a synthesis, New Phytol., 149, 247–264, https://doi.org/10.1046/j.1469-8137.2001.00028.x, 2001.
Meier, T., Hensen, I., and Partzsch, M.: Effects of nitrogen addition and above-ground biomass removal on the growth and interactions between species of xerothermic grasses, Preslia, 94, 607–629, https://doi.org/10.23855/preslia.2022.607, 2022.
Merta-Staszczak, A. and Zwyrzykowska-Wodzińska, A.: Agrochemikalia w polskim rolnictwie w latach 1945–2010 [Agrochemicals in Polish agriculture from 1945 to 2010], Przem. Chem., 96, 20–24, https://doi.org/10.15199/62.2017.2.2, 2017 (in Polish).
Miller, R. M., Smith, C. I., Jastrow, J. D., and Bever, J. D.: Mycorrhizal status of the genus Carex (Cyperaceae), Am. J. Bot., 86, 547–553, https://doi.org/10.2307/2656816, 1999.
Palpurina, S., Chytrý, M., Hölzel, N., Tichý, L., Wagner, V., Horsák, M., Axmanová, I., Hájek, M., Hájková, P., Freitag, M., Lososová, Z., Mathar, W., Tzonev, R., Danihelka, J., and Dřevojan, P.: The type of nutrient limitation affects the plant species richness–productivity relationship: Evidence from dry grasslands across Eurasia, J. Ecol., 107, 1038–1050, https://doi.org/10.1111/1365-2745.13084, 2019.
Peñuelas, J. and Filella, I.: Herbaria century record of increasing eutrophication in Spanish terrestrial ecosystems, Glob. Chang. Biol., 7, 427–433, https://doi.org/10.1046/j.1365-2486.2001.00421.x, 2001.
Peñuelas, J. and Matamala, R.: Changes in N and S leaf content, stomatal density and specific leaf area of 14 plant species during the last three centuries of CO2 increase, J. Exp. Bot., 41, 1119–1124, https://doi.org/10.1093/jxb/41.9.1119, 1990.
Perzanowska, J. and Korzeniak, J.: Red list of Natura 2000 habitat types of Poland, J. Nat. Conserv., 56, 125834, https://doi.org/10.1016/j.jnc.2020.125834, 2022.
Pirani, S.: Fossil fuels before 1950, in: Burning up: A global history of fossil fuel consumption, Pluto Press, 9–24, https://doi.org/10.2307/j.ctv4ncp7q.9, 2018.
Piwowar, A.: Consumption of mineral fertilizers in the Polish agriculture – trends and directions of changes, Agric. Res., 11, 477–487, https://doi.org/10.1007/s40003-021-00591-7, 2022.
Poulson, S. R., Chamberlain, C. P., and Friedland, A. J.:. Nitrogen isotope variation of tree rings as a potential indicator of environmental change, Chem. Geol., 125, 307–315, https://doi.org/10.1016/0009-2541(95)00097-6, 1995.
Pronin, E.: The possible use of stable carbon and nitrogen isotope signal and spectral analysis to identify habitat condition of aquatic plants, Limnol. Rev., 24, 17–29, https://doi.org/10.3390/limnolrev24010002, 2024.
Pronin, E., Wrosz, Z., Banaś, K., and Merdalski, M.: Following the Footsteps of macrophytes: Potential application of isotope signals in pollution monitoring: A case study of northern Polish rivers, Ecohydrol. Hydrobiol., 100650, https://doi.org/10.1016/j.ecohyd.2025.100650, 2025.
QGIS Development Team: QGIS Geographic Information System, Open Source Geospatial Foundation Project, http://qgis.osgeo.org (last access: 24 September 2026), 2024.
Qin, B.-Q., Gao. G., Zhu, G.-W., Zhang, Y.-L., Song, Y.-Z., Tang, Z.-M., Xu, H., and Deng, J.-M.: Lake eutrophication and its ecosystem response, Chin. Sci. Bull., 58, 961–970, https://doi.org/10.1007/s11434-012-5560-x, 2013.
Radkowska, I. and Radkowski, A.: Regenerative grazing as an element that shapes grassland ecosystem services, Rocz. Nauk. Zoot., 50, 167–178, https://doi.org/10.58146/008H-QP61, 2023.
R Core Team: R: A language and environment for statistical computing. R Foundation for Statistical Computing, Vienna, Austria, https://www.R-project.org (last access: 24 September 2026), 2024.
Reich, P. B., Mohanbabu, N., Isbell, F. Hobbie, S. E., and Butler, E. E.: High CO2 dampens then amplifies N-induced diversity loss over 24 years, Nature, 635, 370–375, https://doi.org/10.1038/s41586-024-08066-9, 2024.
Richardson, K., Steffen, W., Lucht, W., Bendtsen, J., Cornell, S. E., Donges, J. F., Drüke, M., Fetzer, I., Bala, G., von Bloh, W., Feulner, G., Fiedler, S., Gerten, D., Gleeson, T., Hofmann, M., Huiskamp, W., Kummu, M., Mohan, C., Nogués-Bravo, D., Petri, S., Porkka, M., Rahmstorf, S., Schaphoff, S., Thonicke, K., Tobian, A., Virkki, V., Wang-Erlandsson, L., Weber, L., and Rockström, J.: Earth beyond six of nine planetary boundaries, Sci. Adv., 9, eadh2458, https://doi.org/10.1126/sciadv.adh2458, 2023.
Ruprecht, E., Enyedi, M. Z., Eckstein, R. L., and Donath, T. W.: Restorative removal of plant litter and vegetation 40 years after abandonment enhances re-emergence of steppe grassland vegetation, Biol. Conserv., 143, 449–456, https://doi.org/10.1016/j.biocon.2009.11.012, 2010.
Samaniego, L., Thober, S., Kumar, R., Wanders, R., Rakovec, O., Pan, M., Zink, M., Sheffield, J., Wood, E. F., and Marx, A.: Anthropogenic warming exacerbates European soil moisture droughts, Nat. Clim. Change, 8, 421–426, https://doi.org/10.1038/s41558-018-0138-5, 2018.
Schindler, D. W.: Recent advances in the understanding and management of eutrophication, Limnol. Oceanogr., 51, 356–363, https://doi.org/10.4319/lo.2006.51.1_part_2.0356, 2006.
Schlacher, T. A. and Connolly, R. M.: Effects of acid treatment on carbon and nitrogen stable isotope ratios in ecological samples: a review and synthesis, Methods Ecol. Evol., 5, 541–550, https://doi.org/10.1111/2041-210X.12183, 2014.
Schulte, P., Van Geldern, R., Freitag, H., Karim, A., Négrel, P., Petelet-Giraud, E., Probst, A., Probst, J.-L., Telmer, K., Veizer, J., and Barth, J. A. C.: Applications of stable water and carbon isotopes in watershed research: Weathering, carbon cycling, and water balances, Earth Sci. Rev., 109, 20–31, https://doi.org/10.1016/j.earscirev.2011.07.003, 2011.
Seibt, U., Rajabi, A., Griffiths, H., and Berry, J. A.: Carbon isotopes and water use efficiency: Sense and sensitivity, Oecologia, 155, 441–454, https://doi.org/10.1007/s00442-007-0932-7, 2008.
Seinfeld, J. H. and Pandis, S. N.: Atmospheric chemistry and physics: from air pollution to climate change, 2nd rev. edn., Wiley, ISBN 978-0-471-72018-8, 2006.
Shi, J., Ohte, N., Tokuchi, N., Imamura, N., Nagayama, M., Oda, T., and Suzuki, M.: Nitrate isotopic composition reveals nitrogen deposition and transformation dynamics along the canopy–soil continuum of a suburban forest in Japan, Rapid Commun. Mass Spectrom., 28, 2539–2549, https://doi.org/10.1002/rcm.7050, 2014.
Stevens, C. J., Dise, N. B., Mountford, J. O., and Gowing, D. J.: Impact of nitrogen deposition on the species richness of grasslands, Science, 303, 1876–1879, https://doi.org/10.1126/science.1094678, 2004.
Sucholas, J., Molnár, Z., Łuczaj, Ł., Luick, R., and Poschlod, P.: Are agri-environmental schemes doing their job? Evidence from Biebrza National Park, Poland, Land Use Pol., 148, 107390, https://doi.org/10.1016/j.landusepol.2024.107390, 2025.
Szołdrowska, D. and Smol, M.: The current state of water resources in Poland – possibilities of water reuse and management by the circular economy, Desalin, Water Treat., 323, 101287, https://doi.org/10.1016/j.dwt.2025.101287, 2025.
Taub, D. R. and Wang, X.: Why are nitrogen concentrations in plant tissues lower under elevated CO2? A critical examination of the hypotheses, J. Integr. Plant Biol., 50, 1365–1374, https://doi.org/10.1111/j.1744-7909.2008.00754.x, 2008.
Thomson, S. J. J., Table, P., and Urey, H. C.: Chapter 3 stable isotope fractionation, Elsevier Oceanogr. Ser., 65, 141–250, https://doi.org/10.1016/S0422-9894(01)80004-0, 2001.
Tian, D., Kattge, J., Chen, Y., Han, W., Luo, Y., He, J., Hu, H., Tang, Z., Ma, S., Yan, Z., Lin, Q., Schmid, B., and Fang, J.: A global database of paired leaf nitrogen and phosphorus concentrations of terrestrial plants, Ecology, 100, e02812, https://doi.org/10.1002/ecy.2812, 2019.
Tian, H., Bian, Z., Shi, H., Qin, X., Pan, N., Lu, C., Pan, S., Tubiello, F. N., Chang, J., Conchedda, G., Liu, J., Mueller, N., Nishina, K., Xu, R., Yang, J., You, L., and Zhang, B.: History of anthropogenic Nitrogen inputs (HaNi) to the terrestrial biosphere: a 5 arcmin resolution annual dataset from 1860 to 2019, Earth Syst. Sci. Data, 14, 4551–4568, https://doi.org/10.5194/essd-14-4551-2022, 2022.
Tilman, D. and Wedin, D.: Plant traits and resource reduction for five grasses growing on a nitrogen gradient, Ecology, 72, 685–700, https://doi.org/10.2307/2937208, 1991.
Tomalski, P., Pius, B., Jokiel, P., and Marszelewski, W.: Changes in the thermal regime of rivers in Poland with different sizes and levels of human impact based on daily data (1961–2020), Geogr. Pol., 98, 29–52, https://doi.org/10.7163/GPol.0291, 2025.
Unger, S., Friede, M., Hundacker, J., Volkmar, K., and Beyschlaget, W..: Allocation trade-off between root and mycorrhizal surface defines nitrogen and phosphorus relations in 13 grassland species, Plant Soil, 407, 279–292, https://doi.org/10.1007/s11104-016-2994-y, 2016.
van Der Plas, F., Hautier, Y., Ceulemans, T., Alard, D., Bobbink, R., Diekmann, M., Dise, N. B., Dorland, E., Dupré, C., Gowing, D., and Stevens, C.: Atmospheric nitrogen deposition is related to plant biodiversity loss at multiple spatial scales, Glob. Chang. Biol., 30, e17445, https://doi.org/10.1111/gcb.17445, 2024.
Walton, C. R., Zak, D., Audet, J., Petersen, R. J., Lange, J., Oehmke, C., Wichtmann, W., Kreyling, J., Grygoruk, M., Jabłońska, E., Kotowski, W., Wiśniewska, M. M., Ziegler, R., and Hoffmann, C. C.: Wetland buffer zones for nitrogen and phosphorus retention: Impacts of soil type, hydrology and vegetation, Sci. Total Environ., 727, 138709, https://doi.org/10.1016/j.scitotenv.2020.138709, 2020.
Wang, J., Gu, B., Ewe, S., and Wang, Y.: Stable isotope compositions of aquatic flora as indicators of wetland eutrophication, Ecol. Eng., 83, 13–18, https://doi.org/10.1016/j.ecoleng.2015.06.007, 2015.
Warnes, G. R., Bolker, B., Lumley, T., Johnson, R. C., Jain, N., Schwartz, M., and Rogers, J.: gmodels: Various R programming tools for model fitting. R package version 2.19.1, https://CRAN.R-project.org/package=gmodels (last access: 24 September 2026), 2024.
Wickham, H.: ggplot2: Elegant graphics for data analysis, Springer-Verlag New York, 2016.
World Flora Online: http://www.worldfloraonline.org (last access: 18 April 2025), 2025.
Wrosz, Z., Banaś, K., Merdalski, M., and Pronin, E.: Stable carbon and nitrogen isotope signatures in three pondweed species – A case study of rivers and lakes in Northern Poland, Plants, 14, 2261, https://doi.org/10.3390/plants14152261, 2025.
Xue, D., Botte, J., De Baets, B., Accoe, F., Nestler, A., Taylor, P., Van Cleemput, O., Berglund, M., and Boeckx, P.: Present limitations and future prospects of stable isotope methods for nitrate source identification in surface- and groundwater, Water Res., 43, 1159–1170, https://doi.org/10.1016/j.watres.2008.12.048, 2009.
Yao, F. Y., Wang, G. A., Liu, X. J., and Song, L.: Assessment of effects of the rising atmospheric nitrogen deposition on nitrogen uptake and long-term water-use efficiency of plants using nitrogen and carbon stable isotopes, Rapid Commun. Mass Spectrom., 25, 1827–1836, https://doi.org/10.1002/rcm.5048, 2011.
- Abstract
- Introduction
- Methods
- Results
- Discussion
- Conclusions
- Appendix A: Check of the possible impact of carbonate contamination of Stuckenia pectinata and Elodea canadensis samples as well as of the acid treatment for their δ13C and δ15N values as well as total nitrogen (TN) content
- Appendix B
- Appendix C
- Data availability
- Author contributions
- Competing interests
- Disclaimer
- Acknowledgements
- Financial support
- Review statement
- References
- Supplement