
the Creative Commons Attribution 4.0 License.
the Creative Commons Attribution 4.0 License.
 | 29 Oct 2026

Impacts of shrub coverage for arctic ecosystem carbon uptake and storage
Tamara Emmerichs

Fabrice Lacroix
Victor Brovkin
Sönke Zaehle
Cheng Gong
Yu Zhu
Sofie Sjogersten
Carolina Voigt
Klaus Steenberg Larsen
Eeva-Stiina Tuittila
Although shrubs employ different water and carbon-use strategies compared to trees and are expanding rapidly across warming tundra and grassland, they are not adequately represented in global land surface models. In this study, we incorporated two types of shrubs, deciduous and evergreen, into the QUINCY nutrient-enabled terrestrial biosphere model, which features a state-of-the-art treatment of soil nutrient dynamics and carbon exchange. We investigated changes in carbon (C) fluxes and storage due to shrub cover, it's response to climate and CO2 fertilization effect, as well as the role of nitrogen availability.
With this new implementation, shrubs exhibited reasonable seasonal cycle of gross primary production (GPP) at 50 % of the Arctic study sites. The model achieved mean R2 values of 0.5 on average, when compared with field measurements and remote sensing products, which represents an improvement for evergreen shrubs compared with the old model parametrization. However, the model-measurement agreement is lower at sites with heterogeneous local vegetation, which is not captured by the model hydrology or represented by the shrub plant functional type. The modelled gross primary production of shrubs is similarly distributed compared to needleleaf evergreen forest, with no significant difference in the median. Compared to graminoids, shrubs' carbon fluxes are 40 % higher. Shrubs produce substantial above-ground biomass, albeit lower than needleleaf trees, and exhibit distinct phenological patterns. While CO2 fertilization generally benefits all plant types, shrubs appear to have particularly robust growth under elevated CO2 concentrations.
Providing the plants with unlimited nitrogen doubled gross primary production at most sites and improved the model-measurement agreement by 15 % whereas the modelled deciduous shrubs substantially reduce their nitrogen sources more than evergreen shrubs. A similar effect occurred when nitrogen and carbon contents were initialized based on permafrost profiles, which partly alleviated nitrogen limitation in the model. Overall, this study demonstrates the impact of evergreen and deciduous shrub vegetation on the Arctic carbon cycle and ongoing changes. It recommends including shrub plant functional types in global Earth system models. However, the strong nitrogen limitation of Arctic shrub productivity when using standard model parameterizations suggests that global models underestimate the Arctic's contribution to global land carbon.
- Article
(1165 KB) - Full-text XML
-
Supplement
(4646 KB) - BibTeX
- EndNote


The high latitude ecosystems north of 60° N are vulnerable to climate change. This region is warming at around three times the global rate (Giesse et al., 2024). Arctic soils contain vast amounts of organic carbon (C) in the permafrost (frozen soil). Under climate warming and the thawing of permafrost, this carbon could be released to the atmosphere as carbon dioxide or methane inducing a positive climate feedback loop (Schuur et al., 2015, 2022). An increase of atmospheric temperature prolongs the growing season and deepens the active layer, causing major shifts in vegetation growth and cover in the Arctic (Mekonnen et al., 2021, and references therein), (Liu et al., 2025).
Arctic shrub vegetation is short-statured (mostly under 2 m tall) and often prostrate, it can grow beyond the cold limits of trees due to its adaption to cold environments. Shrubs exhibit faster wood production than trees, enabling them to complete their growth within a growing season that is 20 %–50 % shorter (Treml et al., 2019; Körner, 2012), which is a key adaptation to the Arctic conditions, and intense competition for limited light and nutrients beyond the treeline. Shrubs are classified as either evergreen or deciduous species. Deciduous shrubs grow faster than evergreen species, since their small leaf mass per unit area enables them to intercept more light for a given investment of leaf C than evergreen shrubs (Parker et al., 2021; Mekonnen et al., 2018).
Heijmans et al. (2022) found that shrubs are becoming increasingly dominant in the Arctic. Current estimates suggest that they comprise approximately 40 % of the plant biomass in the Polar Arctic (Orndahl et al., 2025). The expansion rate has been estimated at around 38 % from 1982 to 2014 and 27 % from 2000 to 2020 in the high-northern latitudes, due to increased biomass in existing stands and new establishment (Chen et al., 2020; Andreu-Hayles et al., 2020; Gui et al., 2025). Studies (e.g. Meyer et al., 2021; Elmendorf et al., 2012), mainly report an enhanced coverage of tall deciduous shrubs, such as birch, willow, and alder. This process is often termed as “shrubification”. Recently, the expansion of evergreen dwarf shrubs, which are ecologically distinct from tall deciduous shrub species, has also been observed in the Arctic (Vowles and Björk, 2019). However, these vegetation changes are, however, spatially heterogeneous and are controlled by a mixture of environmental factors other than temperature, such as changes in soil wetness and plant-plant interactions (García Criado et al., 2025; Martin et al., 2022). The ability of shrubs to respond more to warming than e.g. graminoids is linked to their capacity to develop woody tissue, thereby increasing the height and width of their canopy (Bret-Harte et al., 2001, 2002).
Changes in Arctic vegetation cover trigger several feedback loops in the atmosphere. These include decreasing the albedo, thereby increasing the surface temperature, and impacting soil-plant interactions. Examples of this are deepening the active layer, higher mineralisation rates, and improving litter quality. These changes affect the ecosystem's C balance (Bonfils et al., 2012; Meyer et al., 2021; Mekonnen et al., 2021). Furthermore, shifts in Arctic vegetation potentially affect permafrost thaw by altering surface temperatures (Heijmans et al., 2022). Buckeridge et al. (2010) conclude that increased nutrient inputs via enhanced litter inputs from smaller shrub species subsequently cause an increase in the growth of tall shrub tundra species.
Field studies show that shrubs impact soil nutrient cycling in various ways, as they are associated with high leaf litter quality and quantity. This means they contain more nitrogen, which enhances decomposition rates (Martin et al., 2022; Moore et al., 2024, and references therein). This is in contrast to boreal trees. The vertical distribution of soil carbon (C) is determined by nutrition allocation, litter quality, and plant root depth; for example, shrubs store more C in deep soils than graminoids (Du et al., 2024). Besides climate, several other factors influence shrub establishment and growth. The acceleration of nutrient cycling, driven by higher soil temperatures, greater litter inputs, and greater litter turnover, has been found to play a key role in vegetation change. However, despite the importance of these processes the impact of nutrient dynamics on shrub growth and C cycling is neglected in most commonly used vegetation models (Miller and Smith, 2012).
The magnitude of the impact of the rapid shrub expansion in Arctic landscapes on the current and future Arctic C balance is uncertain. Given the importance of shrubs in these landscapes shrub plant functional types (PFTs) must be included in land-biosphere models to more accurately represent C dynamics in the heterogeneous Arctic landscapes. Accordingly, we here employ the QUINCY terrestrial biosphere model (QUantifying Interactions between terrestrial Nutrient CYcles and the climate system v1.0) (Thum et al., 2020) which includes the main features of Arctic ecosystems, such as soil C storage, nutrient limitation and vertical discretisation, to realistically simulate C dynamics in the Arctic and physical processes relevant in high latitudes (Lacroix et al., 2022). Unlike other major community land models, QUINCY represents vegetation with PFTs based on physiology rather than geography, overcoming the need for regional PFT definitions, such as boreal trees and limiting the number of parameters required to a minimum (Thum et al., 2020). To assess the effects of shrub expansion on ecosystem C dynamics across the Arctic, we implemented two shrub PFTs into QUINCY (Sect. 2.1 and 2.3). Using this new model configuration, we performed simulations that took into account coverage of three different vegetation types: boreal forest, graminoids, and shrubs. Additionally, we conducted sensitivity simulations with constant CO2, with nitrogen supply set to levels that do not limit carbon cycling, and with nutrient initialisation in the permafrost (Sect. 2.2), respectively. These simulations were conducted at 16 different Arctic sites. Through these simulations and two observational datasets (Sect. 2.4), we aimed to answer the following research-specific questions:
-
How much carbon do shrubs absorb and store, and does this align with observed data? – Sect. 3.1
-
How does the response of carbon uptake and storage in shrub-covered ecosystems differ from that in boreal forests and graminoid-dominated tundra when subjected to combined climate warming and CO2? – Sects. 3.2 and 3.2.1
-
What role does nitrogen cycling play for shrub growth and C storage, particularly in response to increased nitrogen availability from permafrost thaw? – Sect. 3.3
2.1 QUINCY model
The QUINCY terrestrial biosphere model (Thum et al., 2020) simulates the coupled carbon, nitrogen (N) and phosphorus (P), as well as water and energy cycles. It represents physical processes relevant to high latitudes, such as snow dynamics, soil freeze-thaw, and adaptive rooting depths to layers in non-frozen layers (Lacroix et al., 2022). The standard version of the model includes 12 different PFTs with flexible parameterizations for leaf characteristics, phenology, and other growth and turnover dynamics. The concept of PFTs groups all plant species into a limited number of classes, thus allowing for a much more traceable interpretation of the plant interactions (Poulter et al., 2015). The approximately 40 parameterizations representing the different plant characteristics and functionalities in QUINCY are based on plant trait databases (Kattge et al., 2020). Here, we have added additional PFTs to simulate Arctic shrubs.
In QUINCY, vegetation consists of structural pools (leaves, sapwood, heartwood, coarse roots, fine roots, and fruit) and a fast-overturning, respiring non-structural pool (labile), as well as a seasonal, non-respiring, and non-structural storage pool (reserve). The canopy comprises several layers (a multilayer canopy scheme), including separate representations of photosynthesis and canopy conductance for sunlit and shaded leaves separately within each layer. Vegetation processes as well as nutrient uptake and availability respond to local environmental conditions on a process-specific timescale, dynamically enabling a certain memory effect (Thum et al., 2020). Plants partition the required C between growth, respiration and storage, acclimatising to meteorological conditions and nutrient availability.
The soil is explicitly discretized vertically into 15 layers of increasing thickness down to a depth of 9.5 m, and this applies to soil temperature, texture, moisture, and the biogeochemical soil pools. Soil biogeochemical pools are represented by five organic pools: structural; polymeric; and woody litter; and fast and slow-degrading soil organic matter; as well as solute concentrations of ammonium (NH4), nitrate (NO3) and phosphorus (PO4). Each of these organic pools contains C, N, and P (Thum et al., 2020). The model specially accounts for the nitrogen cycle in soil by simulating nitrogen inputs through symbiotic (microbial) fixation in higher plants, as well as free-living (non-symbiotic) N fixation in all parts of the ecosystem. It also accounts for N deposition, and the transformation processes of mineralization, nitrification, and denitrification, as well as the transport between soil layers. N is always accounted for as and .
2.2 Site-level simulations setup and forcings
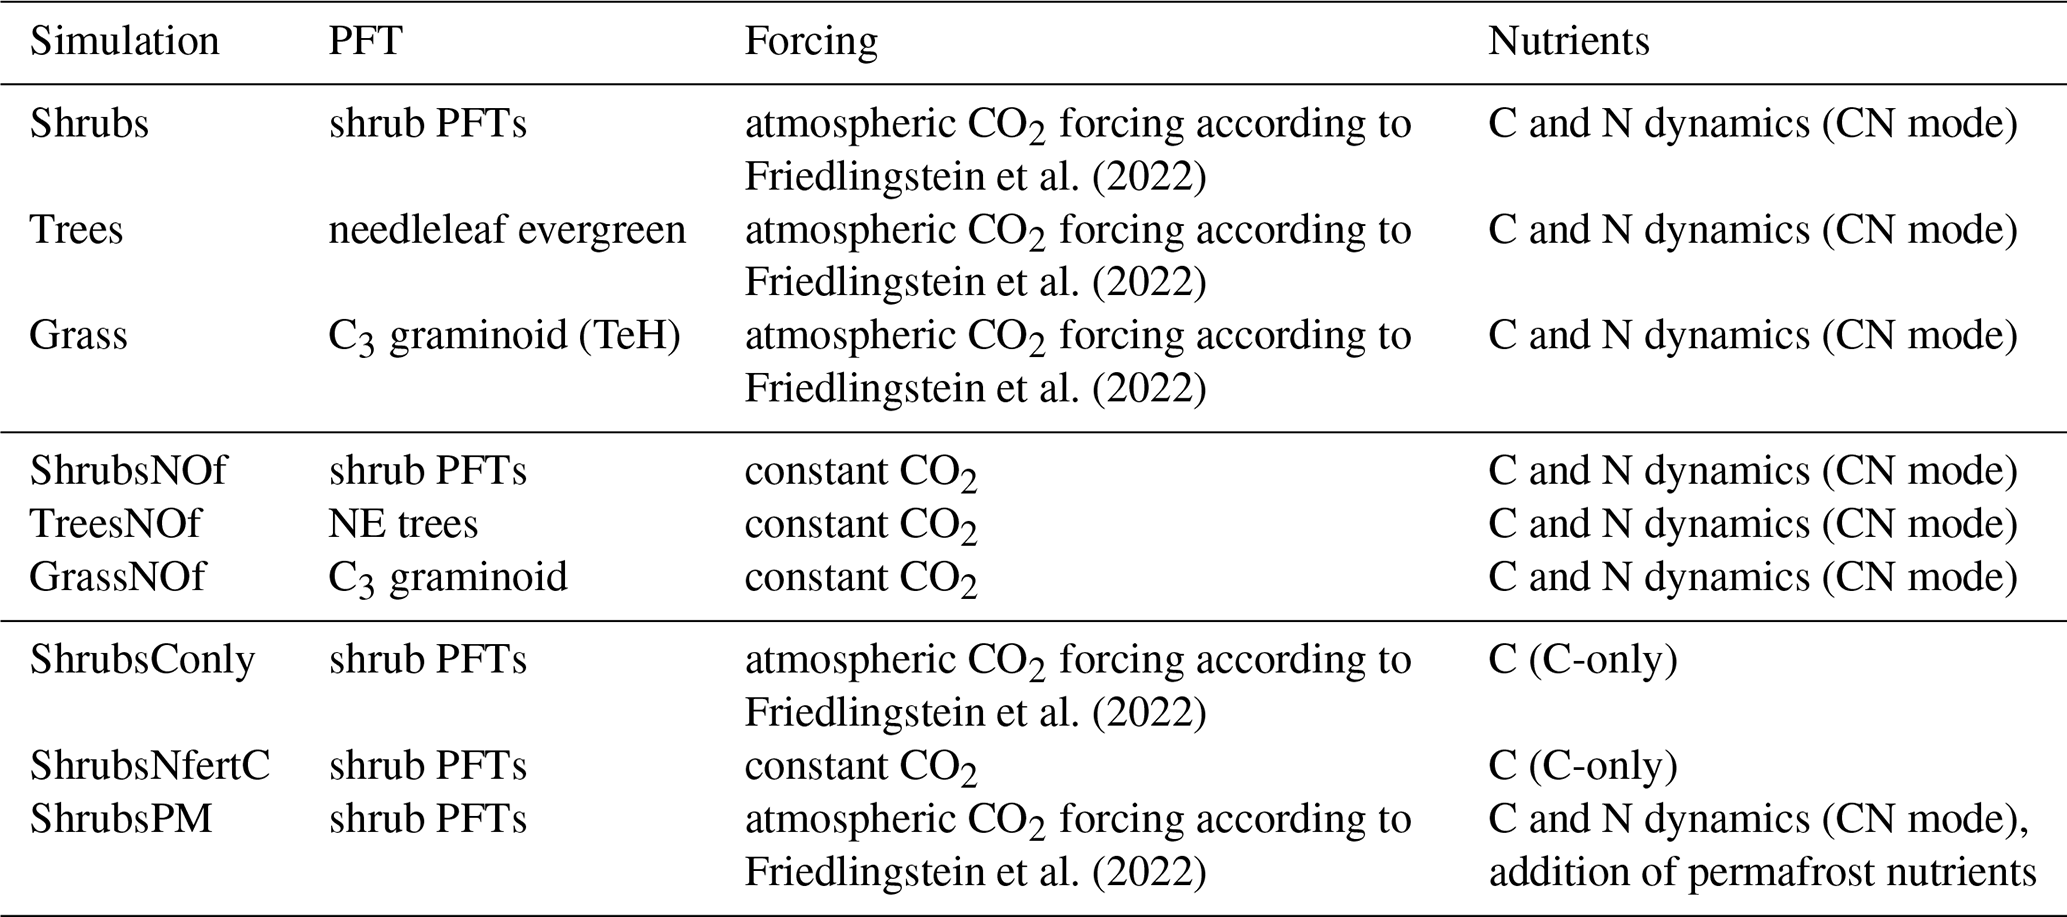
Site-level QUINCY model simulations were conducted for sixteen Arctic sites (Fig. 1 and Table S1 in the Supplement) from 1901 to 2010. Data on shrubs and GPP estimates were provided by the ABCflux dataset version 2 for these sites. In the reference simulation, each site is represented by one of the two shrub PFTs according to the vegetation reported at each site (see Table S1). The simulations include nitrogen dynamics, as mineral nitrogen is often known to limit plant growth in the Arctic (Mekonnen et al., 2018; Martin et al., 2017; Prager et al., 2017). Different model configurations were chosen to quantify the differences between ecosystems covered by graminoids and NE trees at the same sites. A second set of simulations disentangles the effects caused by climate drivers, CO2 fertilization and nutrient limitation (Table 1).
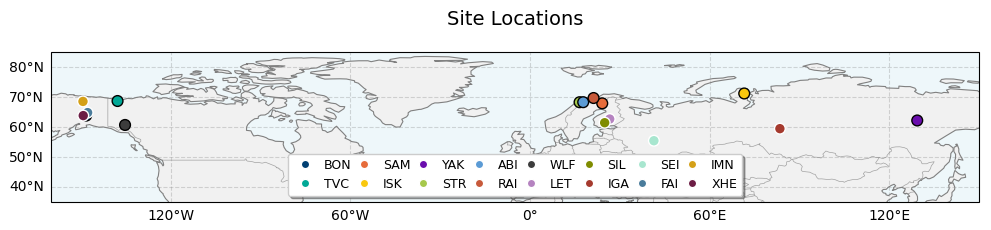
Figure 1Map of the 16 chosen stations: BON: Bonanza, US; TVC: Trail Valley Creek, CA; SAM: Sammaltunturi fell, FI; ISK: Iskoras, NO; YAK: Yakutsk, RU; STR: Stordalen, SE; ABI: Abisko, SE; RAI: Raisduoddar, NO; XHE: Neon Healy, US; WLF: Wolf Creek, CA; LET: Lettuoso, FI; SIL: Siikaneva, FI; IGA: Igarka, RU; SEI: Seida, RU; FAI: Fairbanks, US; IMN: Imnavait, US. The black edge indicates the needleleaf and the white edge the broad-leaved shrub.
The standard initialization of QUINCY does not account for the elevated levels of soil organic C and N characteristic of permafrost soils. These contents cannot be built up in a standard QUINCY spin-up either, as this would require a simulation of the type used for paleo-timescales that reproduces at least the last interglacial and glacial periods. This is neither practical for our purposes, nor feasible given the lack of the required model forcing data. In this study, we therefore adapted the initialization procedure by adjusting the C and N contents, as well as the distribution of the initialization, when a site is identified as permafrost based on the definition and methods in Palmtag et al. (2022). The permafrost distribution curve is initialized using a Weibull function with a shape parameter of 0.6 instead of 2, and the minimum relative deep permafrost concentration is set at 0.3 of the surface soil concentration according to the estimated distribution. Soil organic matter is initialized with a single permafrost content of 121 000 for the first 3 m, which is the vertically integrated average C. Permafrost nitrogen is initialized using a C:N ratio of 14. It should be noted that the applied approach does not account for spatial heterogeneity in permafrost soil content and distribution during initialization.
The meteorological forcing that drives the model is derived from the University of East Anglia Climatic Research Unit Japanese Reanalysis (CRU-JRA; Harris, 2019), which is a reanalysis of incoming solar radiation, surface temperature, humidity, precipitation, surface pressure, and surface winds. This dataset is available with a spatial resolution of 0.5°×0.5° and at a temporal resolution of 6 h. Data for our selected sites were extracted from the CRU-JRA dataset according to their geographic coordinates (Zaehle and Friend, 2010). Furthermore, the soil is represented by 15 layers, with increasing thickness down to a depth of 9.5 m. The model starts the transient simulations after a spin-up period of 1000 years using cyclic forcing data from 1901–1930. The atmospheric CO2 concentrations are prescribed according to Friedlingstein et al. (2022).
2.3 New shrub implementation
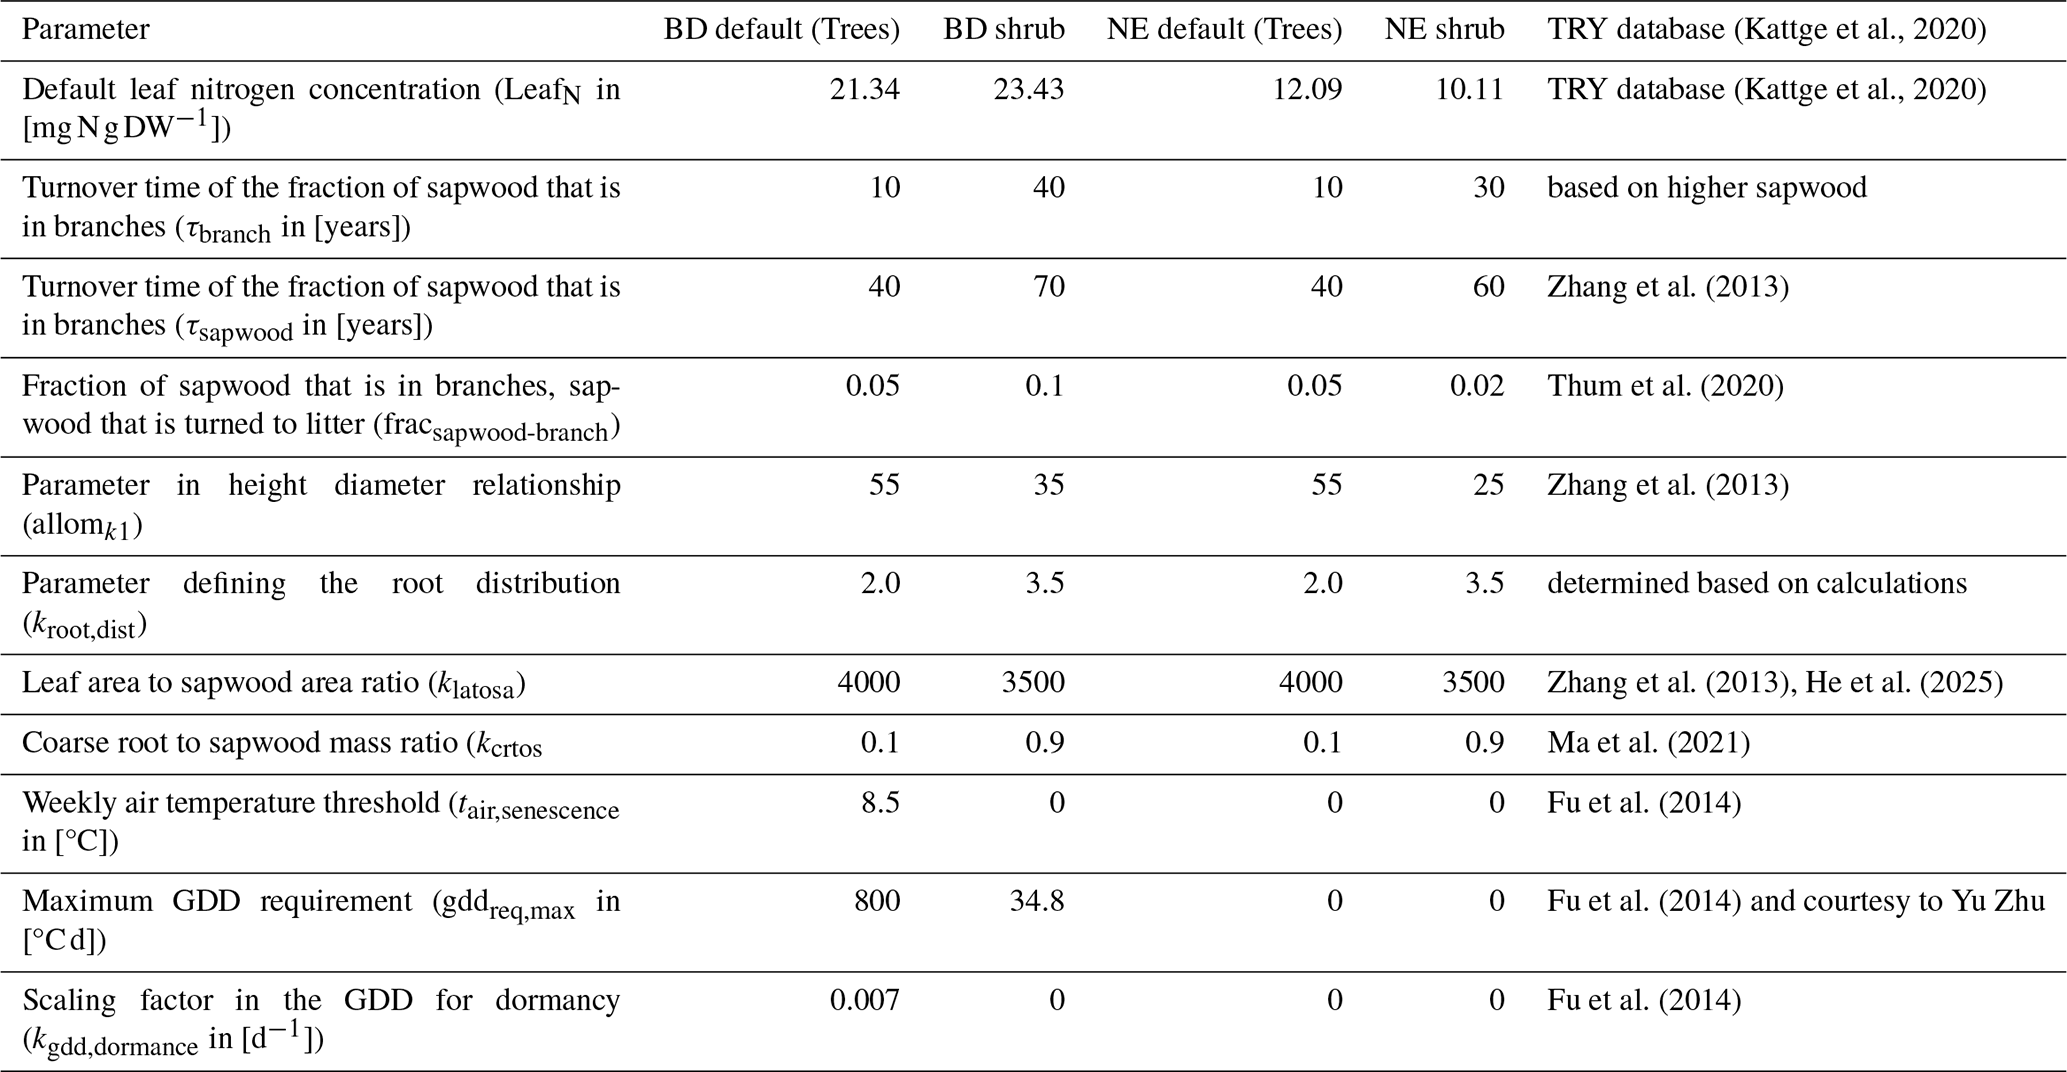
We implemented two new shrub PFTs: broadleaved deciduous (BD) and needleleaf evergreen (NE). The two shrubs are based on the respective default parametrization of the woody PFT, but due to the physiological and phenological differences important aspects concerning the initial leaf N, plant allometry, root distribution and wood turnover times are specified based on measurement studies and trait databases (e.g. TRY, Kattge et al., 2020). The new parameters are listed in Table 2.
(Kattge et al., 2020)(Kattge et al., 2020)Zhang et al. (2013)Thum et al. (2020)Zhang et al. (2013)Zhang et al. (2013)He et al. (2025)Ma et al. (2021)Fu et al. (2014)Fu et al. (2014)Fu et al. (2014)Table 2New parameters for NE and BD shrubs replacing the default needleleaf evergreen PFT. For simplicity, the latter one is referred to as “Tree”.
2.4 Observational data
The ABCfluxnet v2 data, cited in the references Virkkala et al. (2026), Leffler et al. (2026), was recently compiled to provide a dataset of in situ Arctic–boreal terrestrial ecosystem CO2 flux measurements. The synthesized GPP is given as cumulative flux densities aggregated at the monthly timescale. These methods were employed during the growing season. We selected sites where shrub growth has been observed at multiple points in time. The 16 study sites are located across the northern USA, Canada, Finland, Norway, Sweden and Siberia, as shown in Fig. 1. These sites are in wet, moist or dry tundra, fens, bogs or boreal forests and are vegetated by either a mixture of shrubs, trees and grasses or only shrubs (see Table S1). The measurements were averaged and used across different years to minimize the impact of climate variability. The data set includes eddy-covariance (EC) measurements, which generally represent a 100 m radius footprint of the measurement tower. For some sites, only chamber data exists (Table S1) which can be considered the most highly resolved, plot-scale GPP estimate of a specific vegetation/soil unit.
To further evaluate the simulated GPP, we also use data extracted from the global MODIS/Terra Level-4 products of MOD17A2H (Collection 6) (Running et al., 2015) and MOD17A2HGF (Collection 6.1) (Running and Zhao, 2021) at the site coordinates. Both products provide a cumulative eight-day composite of GPP values at a spatial resolution of 500 m and have been interpolated. GPP is estimated by applying a radiation-use efficiency framework that integrates absorbed photosynthetically active radiation (APAR) with the biome-specific radiation conversion efficiency (ε), which is constrained by meteorological stress. While the MOD17A2H product contains gaps due to the quality of the input data, the MOD17A2HGF product reduces data gaps by employing additional temporal gap-filling based on quality control flags. Both products are subject to uncertainties relating to the quality of the input data, land cover classification, and model assumptions. With a GPP time series that is more continuous in space and time, the MOD17A2HGF dataset introduces an additional source of uncertainty in the form of interpolation, which dampens the signals caused by inter-annual variability in climate or ecosystem disturbances. Extensive validation against eddy covariance measurements shows that MOD17 series products can moderately capture the interannual and seasonal variability in GPP, with R2 over 0.6 across different biomes and climate regimes (Zhu et al., 2018; Tang et al., 2015; Wang et al., 2017). We extracted GPP time series from the datasets for the different sites using the nearest neighbour approach.
3.1 Modelled vegetation productivity vs. observations
The modelled shrubs capture a reasonable monthly mean seasonal cycle of GPP at half of the validated sites (six out of twelve, with a 50 % measured seasonal cycle), when compared to the field measurements in Fig. 2. Modelling with the new NE shrub PFT improves the mean R2 value to 0.46 across nine sites, compared to the default (tree) PFT (see the dashed line in Fig. 2 and Table S2 in the Supplement). In contrast, simulations with the BD shrub (7 sites) mostly underestimate the measured seasonal cycle of GPP; the default (tree) PFT therefore agrees better with the measurements (mean R2=0.6). For further evaluation, we compared our model's GPP outputs to GPP MODIS satellite products. MODIS data is widely used to evaluate the carbon cycle in global terrestrial biosphere models and in the Coupled Model Intercomparison Project (CMIP) models (50 % use the JSBACH surface scheme) (Hu et al., 2022), showing a high agreement in the high latitudes. In this study, the MODIS GPP products show a higher correlation with the model, with mean R2 values of 0.71 for NE shrubs and 0.50 for BD shrubs (Table S2) than compared to the site measurements. NE shrubs generally improved the agreement with the MODIS data compared to the NE default (tree) PFT (R2=0.59). The MODIS products generally align with field measurements, though they diverge significantly at two sites. At the ISK site (Norway), the GPP of MODIS and the (CN) model agree quite well, whereas the GPP measured in the field is much larger. This may be due to the specifics of the local climate and landscape at the site coordinates used. Specially, half of the field measurements at the ISK site are taken in wet tundra areas (Pirk et al., 2024) whereas however the model soil hydrology tends to be rather dry. At the LET (Finland) site, which has a significant proportion of forest (e.g. Heydel and Tackenberg, 2017) both observational datasets show a higher GPP which the model does not reflect because it represents shrubs only (in this simulation). Another possible source of the model bias is the underestimation of soil moisture at sites with a higher wetness than 25 %, such as the Stordalen (STR, Sweden) site (Holmes et al., 2022). Overall, two out of sixteen sites (Lettuoso (LET) and Stordalen (STR)) are considered not to be representative of the simulated shrub PFTs due to their heterogeneous ecosystems.
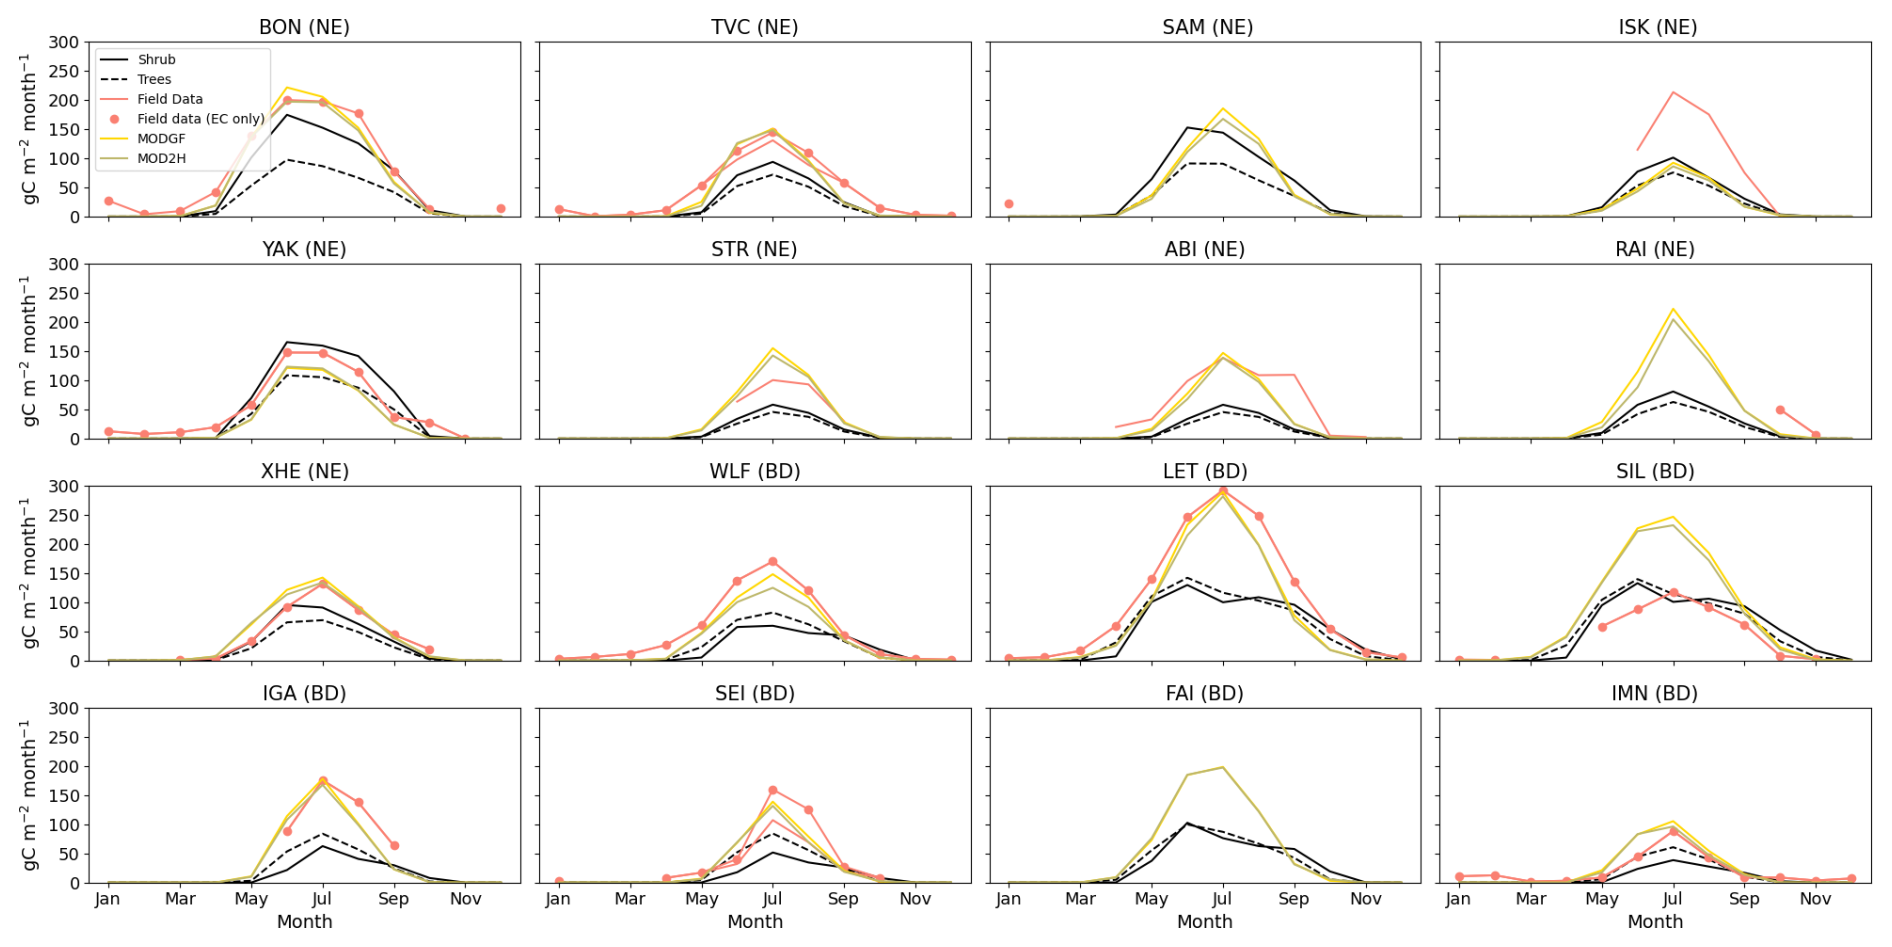
Figure 2Multi-year mean seasonal cycle of GPP [] by measurements (field data and MODIS satellite data: MODGF (MOD17A2HGF) and MOD2H (MODIS17A2H) and model with new shrub PFT, tree PFT and graminoid PFT at 16 sites (BON: Bonanza, US; TVC: Trail Valley Creek, CA; SAM: Sammaltunturi fell, FI; ISK: Iskoras, NO; YAK: Yakutsk, RU; STR: Stordalen, SE; ABI: Abisko, SE; RAI: Raisduoddar, NO; XHE: Neon Healy, US; WLF: Wolf Creek, CA; LET: Lettuoso, FI; SIL: Siikaneva, FI; IGA: Igarka, RU; SEI: Seida, RU; FAI: Fairbanks, US; IMN: Imnavait, US) at individual time periods where field data is available.
All in all, the model's performance depends on the chosen configuration, the evaluated shrub PFT, local heterogeneity of vegetation coverage. While this comparison is an important benchmark for the model and its new parametrization, it is limited to monthly GPP values. The structural and phenological plant characteristics can be only discussed quantitatively in the later analysis of this study due to limited data availability and time constraints.
3.2 Present day C uptake and storage
The simulated (multi-site) average annual GPP flux at shrub sites is 371 , ranging from 132 to 735 for the time period 1990–2010 (Fig. 3a). These estimates (and their partitioning) are consistent with the data synthesized by Virkkala et al. (2025) who report an average (area-upscaled) Arctic GPP of 300 for tundra and 416 for the Arctic permafrost region, although this accounts for all tundra vegetation species (graminoids, shrubs, mosses, and lichen). The annual GPP for shrubs has a much wider interquantile range than for tress and graminoids, i.e. it is more variable (Fig. 3b). The distribution is more symmetrical, with shorter tails and a flatter peak and a lower skewness and kurtosis. This shows the better adaptation of shrubs to the cold Arctic climate, as it has been observed elsewhere (e.g. Mekonnen et al., 2021). Thus, the median (not considering the high values) of the new shrub and tree PFTs are not significantly different, while the average annual GPP increases by 16 % due to the implementation of shrubs. Additionally, Meyer et al. (2021) report a substantially higher GPP at shrubs than at trees when simulating a Canadian site with the CLASSIC model, which aligns well with the site measurements. Shrub dominance instead of graminoid cover would increase the annual mean and median GPP by 40 %, respectively.
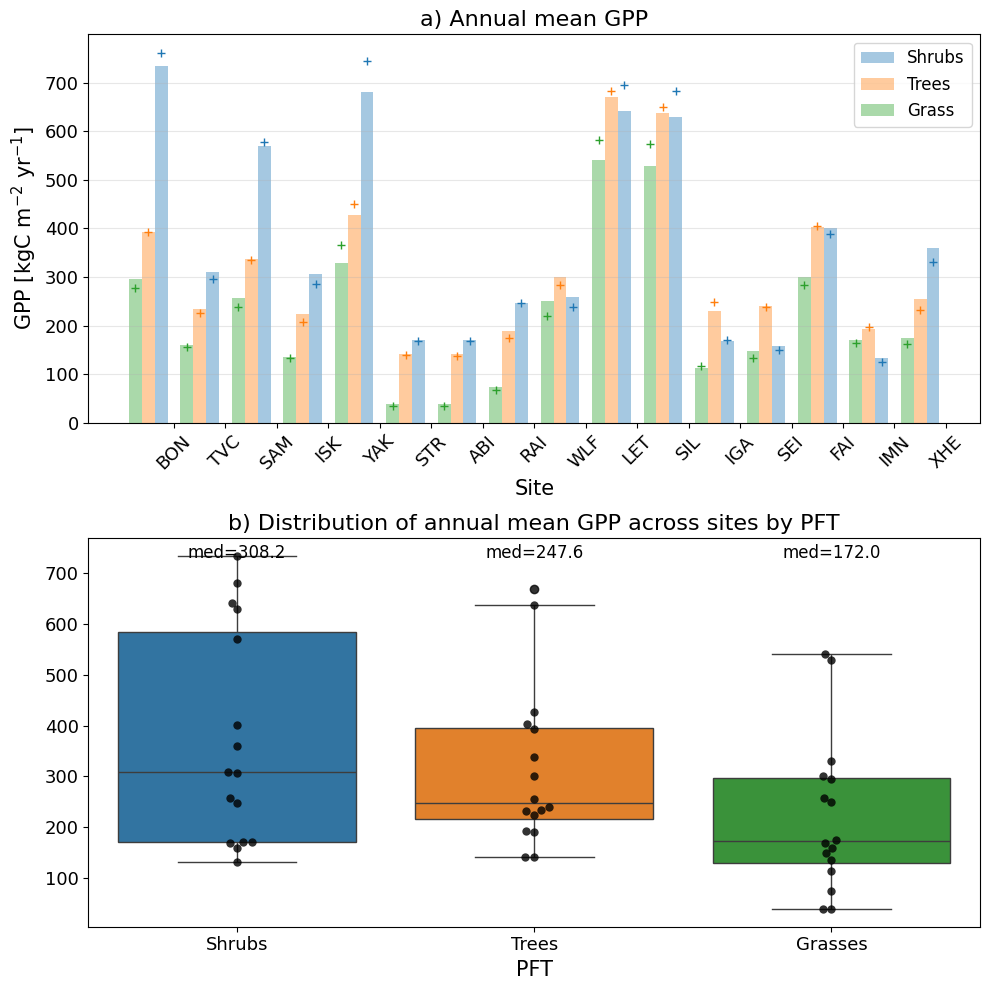
Figure 3Simulated multi-year (1990–2010) annual mean GPP [] per PFT for 16 sites in the Shrubs, Trees and graminoid (grass) simulations, with the values of two most recent years marked with “+” and (b) the distribution across all sites (BON: Bonanza, US; TVC: Trail Valley Creek, CA; SAM: Sammaltunturi fell, FI; ISK: Iskoras, NO; YAK: Yakutsk, RU; STR: Stordalen, SE; ABI: Abisko, SE; RAI: Raisduoddar, NO; XHE: Neon Healy, US; WLF: Wolf Creek, CA; LET: Lettuoso, FI; SIL: Siikaneva, FI; IGA: Igarka, RU; SEI: Seida, RU; FAI: Fairbanks, US; IMN: Imnavait, US). The first eight bars (BON-RAI) show the results at NE shrubs, the later ones at BD shrubs.
The GPP change of the three PFTs is determined by different N pathways, and the strength of the correlation varies not only across the PFTs, but also between sites. For example, the GPP at NE trees and shrubs increase much more strongly in response to uptake than at graminoids, whereas comparing graminoids and trees to BD shrubs reveals a similar slope (Fig. S1 in the Supplement). Thus, among the shrub species, the model simulates faster growth in response to uptake for deciduous shrubs, as also reported by Chen et al. (2020). For all shrubs, the change in uptake explained 50 %–70 % of the GPP change compared to trees (see R2 in Fig. S2 in the Supplement). For NE shrubs, N fixation and net mineralization also showed a significant correlation with the GPP changes (Fig. S2). Most of the increase in GPP at evergreen shrubs could be additionally explained by higher biological nitrogen fixation (BNF) compared to the default PFT. Here, the absolute numbers approximately half the magnitude of the plant uptake (Fig. S3 in the Supplement). Indeed, Davies-Barnard and Friedlingstein (2020) and Schore et al. (2023) report substantially higher asymbiotic BNF in shrubs than in trees, driven by bacterial activity. The GPP changes in deciduous shrubs are usually lower than in evergreen shrubs, which may explain the low correlation. The GPP differences from graminoids are generally less correlated with changes in the N uptake pathways.
The site-averaged foliage (projection) cover of shrubs (i.e. the percentage coverage of the ground area covered by leaves when viewed from above), is very similar to that of trees (4 % higher for shrubs), indicating slightly higher self-thinning in shrubs (Fig. S8 in the Supplement).
Shrub cover reduced the carbon-use efficiency (NPPGPP), at all sites, from 0.64 (graminoids) and 0.68 (trees) to 0.63 at NE and 0.57 at BD shrubs, indicating lower efficiency in converting GPP to biomass overall (Fig. S5a in the Supplement). This is generally consistent with satellite estimates of the NPPGPP ratio for the three different vegetation types reported by Zhang et al. (2013). Unlike needleleaf evergreen shrubs, most deciduous shrubs had lower net primary production (NPP) than trees (Fig. S5a) following the growth respiration (Fig. S5b in the Supplement). Higher growth respiration indicates a faster growth rate and higher seasonal leaf turnover (Ge et al., 2017).
The new shrub PFTs produced reasonable total aboveground C values, ranging from 0.7 to 2.5 kg C m−2 (Fig. 4a, site-mean=1.3 kg C m−2) between 1990–2010. Given that approximately 50 % of C in plants is found in the aboveground part (Ma et al., 2018) these values translate into biomass estimates consistent with measurements of 0.4–1.5 kg C m−2 (Poley et al., 2020; Zhao et al., 2021; Sulman et al., 2021; Orndahl et al., 2025).
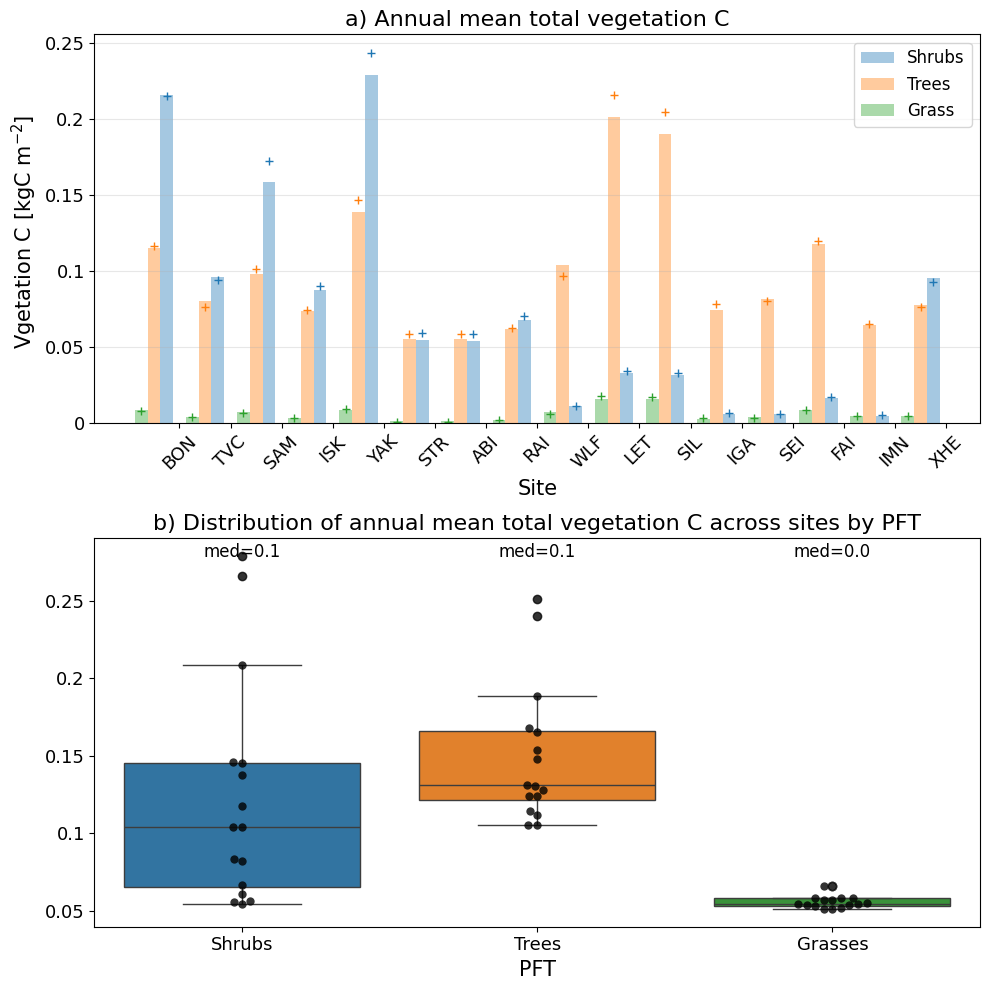
Figure 4Multi-year (1990–2010) annual mean total vegetation C, values of two most recent years marked with “+” and (b) distribution of multi-year annual mean total soil C per PFT in [kg C m−2] at all sites (BON: Bonanza, US; TVC: Trail Valley Creek, CA; SAM: Sammaltunturi fell, FI; ISK: Iskoras, NO; YAK: Yakutsk, RU; STR: Stordalen, SE; ABI: Abisko, SE; RAI: Raisduoddar, NO; XHE: Neon Healy, US; WLF: Wolf Creek, CA; LET: Lettuoso, FI; SIL: Siikaneva, FI; IGA: Igarka, RU; SEI: Seida, RU; FAI: Fairbanks, US; IMN: Imnavait, US). The first eight bars (BON-RAI) show the results of NE shrubs, the later ones of BD shrubs.
Most of the simulated C here was stored in the living wood of the shrubs followed by the storage in coarse roots and heartwood (Fig. S4 in the Supplement). ). Shrubs produce less sapwood than trees, but have a faster production rate (Fig. S6a in the Supplement). According to e.g. Treml et al. (2019) this is due to the narrower and fewer xylem cells in shrubs. As explained by Parker et al. (2021), Mekonnen et al. (2018) deciduous shrubs grew faster than evergreen species (Fig. S6a), since their small leaf mass per unit area enabled them to intercept more light for a given investment of leaf C than evergreen shrubs. Furthermore, the modelled shrubs stored more C in coarse roots than trees, increasing the coarse root:sapwood ratio by a factor eight. This is consistent with findings by Wang et al. (2016) and a global dataset (including 530 shrub land sites) by Ma et al. (2021). Thus, the total aboveground C storage of shrub vegetation is lower overall than that of trees (at 13 out of 16 sites, Cliff's ). Indeed, Jobbágy and Jackson (2000) report that trees allocate more nutrients aboveground than shrubs and graminoids.
While the distribution of annual mean vegetation carbon at shrub sites overlaps with that of trees (Fig. 4a), the mean biomass at sites with shrub coverage is 17 % lower than the mean tree biomass, as indicated by the lower carbon use efficiency of shrubs (Fig. S5b). The shrub distribution has a much larger interquartile range and is more skewed towards higher values than tree distribution, which points to the higher variability of shrubs. The total vegetation C of graminoids is significantly lower (effect size: Cliff's δ=1.0) than in both woody PFTs when considering distribution, median and range, as also found by Lett et al. (2004). Graminoids store relatively more C in fine roots and the labile pool (almost 40 %), but woody plants have significantly larger wood and coarse root storage.
The higher fraction of coarse root C stored by shrubs determines the increase in total soil C (Fig. 7a), reaching 14.3 kg C m−2 compared to other PFTs (vs. 13.2 for trees and 11.1 kg C m−2 for graminoids) at 81 % of the stations. This small (6 %) increase in soil C due to shrub coverage compared to trees is consistent with observational studies reporting greater belowground than aboveground C with shrub vegetation coverage (Ma et al., 2021). It should be noted that the soil type is a primary factor that can explain both increases and decreases in soil organic content, as a meta-analysis of different shrub species found globally (Li et al., 2016). Parker et al. (2021) even report a substantial C loss by shrub expansion, which is consistent with other studies. At a landscape scale, Zhao et al. (2023) found an increase in soil organic carbon with shrub expansion in the Arctic. Our modelling study shows that, evergreen shrubs tend to conserve more C than deciduous shrubs (first eight bars in Fig. 4), as reported by Mekonnen et al. (2018). In comparison with graminoids, soil C increases by 18 % as substantially more C is stored in coarse roots of shrubs. However, since the model does not yet consider the long-term C storage in permafrost soils, the impact on soil C is only discussed briefly here. Given that shrubs exhibit higher root nutrient absorption rates than trees, as supported by Chen et al. (2020), who analyzed 170 root samples from Arctic shrubs, and as corroborated by our simulations (Fig. S6b in the Supplement) significant impacts on nitrogen cycling can also be expected (Martin et al., 2022). Overall, we demonstrate that the newly modelled shrubs produce reasonable C fluxes and storage while reproducing important physiological processes (e.g. wood formation and root allocation) that differ from those of trees.
3.2.1 Transient changes in uptake and storage
Our transient simulations from 1901 to 2010 show an average annual GPP change of 60 for shrubs, with a significant increase since 1960 (Fig. 5a), the increase in GPP over time for trees and graminoids is 30 %–50 % weaker.
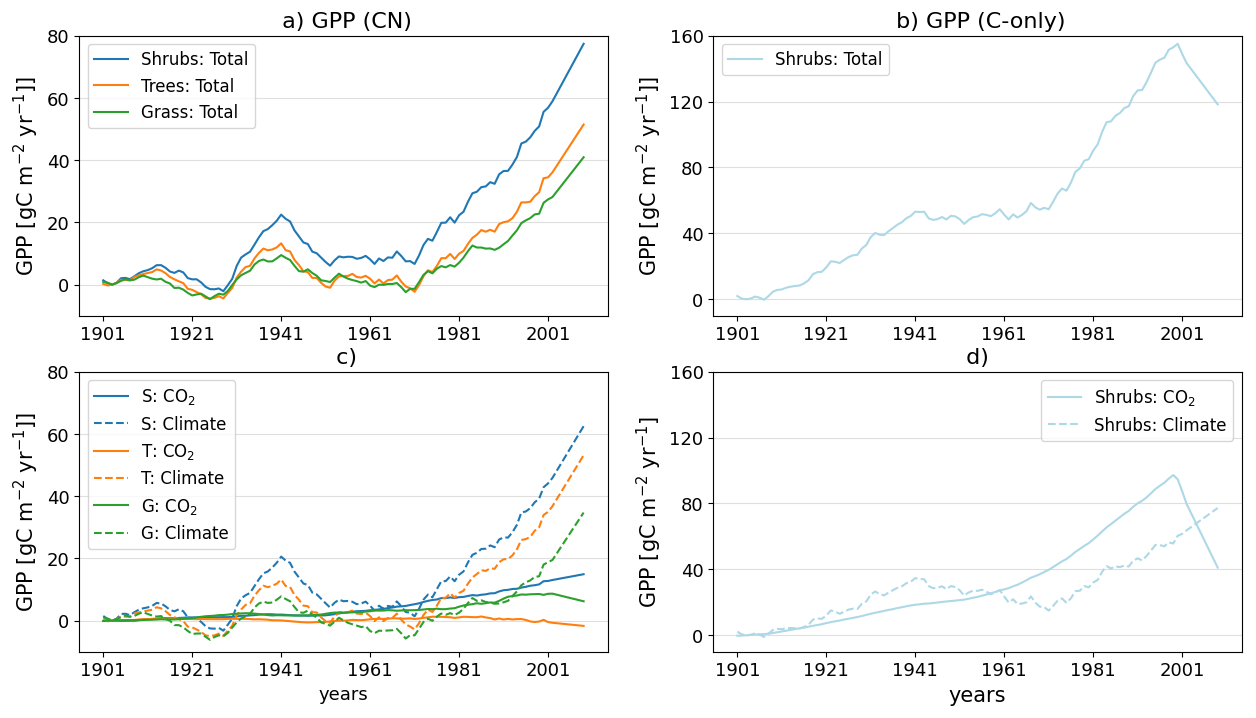
Figure 5Multi sites average 15-years rolling mean total changes (a, b) and CO2 fertilization and climate effect (c, d) in GPP relative to 1901–1911 [] carried out with the N dynamic and C-only model configuration, respectively.
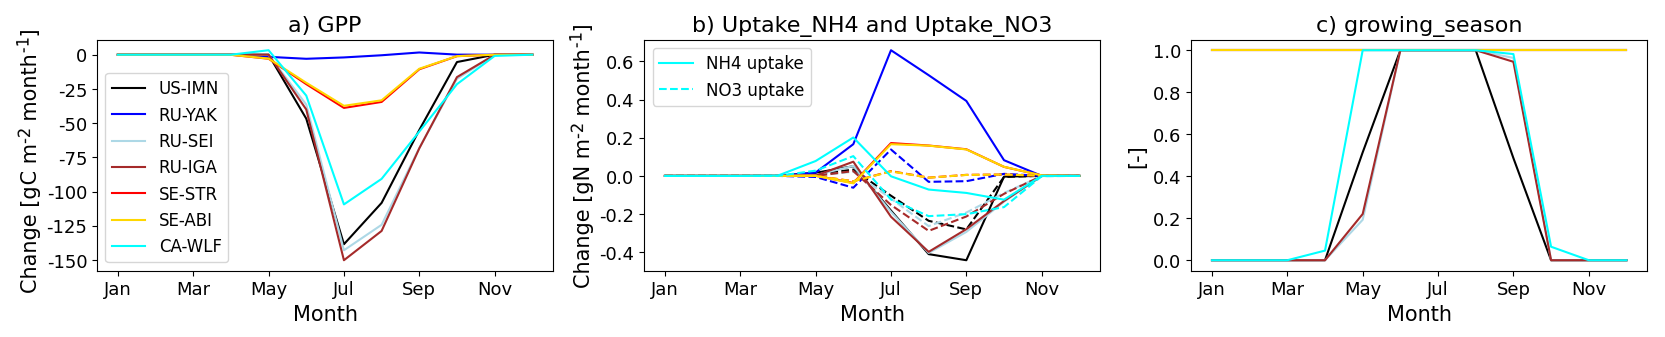
Figure 6Multi-year (1990–2010) average seasonal cycle of (a) growing season length, (b) GPP change (Shrubs-ShrubsConly), (c) change of N uptake and net mineralization, including and (Shrubs-ShrubsConly) at particular stations.
Initializing N and C in the permafrost (simulation: ShrubsPM) increased the soil C pool by 10–60 kg C m−2 (Fig. 7a, 4 %–18 %), towards better agreement with the permafrost C estimates of 20–150 kg C m−2 (0–3 m), where the majority of the soil C is stored (Hugelius et al., 2014). It also improved the total soil N content from 1.5 to 7.4 kg N m−2 (Fig. S12 in the Supplement). Palmtag et al. (2022) report estimates of around 5 kg N m−2, when extrapolated to our modelled soil depths of 9 m using the same vertical distribution.
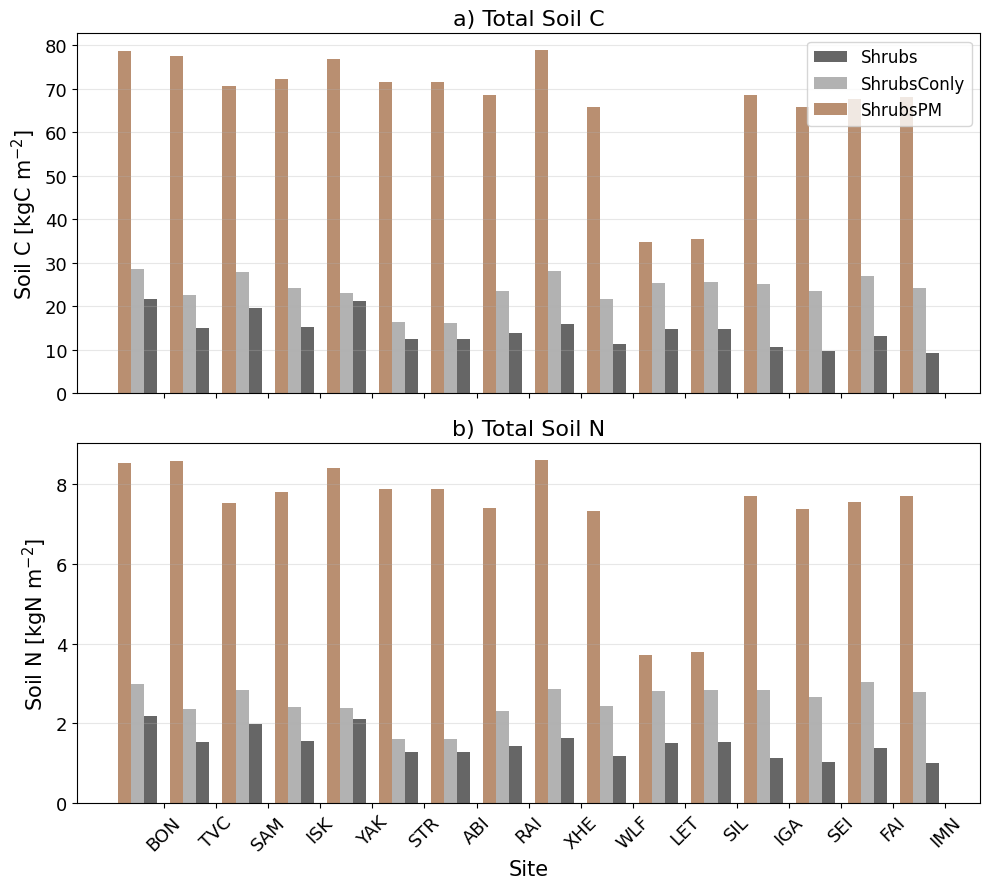
Figure 7Multi-year (1990–2010) average total soil C (a) and total soil nitrogen (b) at the 16 different sites estimated by the three simulations: Shrubs, ShrubsConly and ShrubsbPM.
We deduct from the Shrubs and ShrubsNof simulations the CO2 fertilization effect on shrub GPP across the study sites, with a steep rise in the CO2 effect on GPP since the 1960s (Fig. 5c) following increased atmospheric CO2 concentrations (Intergovernmental Panel on Climate Change, 2023). This effect is more pronounced at sites where nitrogen dynamics have a low impact. For example, at YAK (Yakutsk, Russia), where there is no difference between C-only and CN simulations, we found an GPP increase of up to 40 , caused by CO2 fertilization alone. Most shrub-dominated sites are strongly nitrogen-limited, which results in a small average CO2-fertilization effect (Fig. 5a) across all sites between 1960–2010. This estimate aligns with the results of the QUINCY model study for the high-Arctic tundra by Lacroix et al. (2022), as well as with a number of field N fertilization experiments involving tundra and mixed shrub coverage (DeMarco et al., 2014; Shaver et al., 2001). For NE trees, positive changes in GPP outweigh negative changes at only a few sites over time, leading to a small overall change (Fig. 5a). This is consistent with their lower N uptake compared to shrubs. Thus, the newly modelled shrubs demonstrate higher growing potential (N uptake and GPP) under increased CO2 in comparison to NE trees (default parameters). The CO2-fertilization effect (on GPP) is higher the less nitrogen-limited the sites are (e.g. the YAK site in Russia). Indeed, it has been found that shrubs deepen their roots in response to increasing CO2 (Mekonnen et al., 2021).
After 1960, the climate effect clearly becomes dominant due to the significant temperature increase in the Arctic, as reported, for example, by Wei et al. (2018). The multi-site average GPP increases until 45 at shrub-dominated sites relative to 1901–1910, which is approximately 12 % of the absolute GPP. The foliage projection cover of trees rises over time, similarly to that of shrubs (Fig. 3). In contrast, the GPP of graminoids shows only half of the increase. Until 1960, the climate impact of all three PFTs exhibited a 20-year cycle, driven by variations in dominant climate factors. Among all three PFTs, shrubs respond most to climate effects in the model, e.g. to increasing temperature since 1960. This feature has been cited as a reason for the shrub expansion in the Arctic, as described in e.g. Mekonnen et al. (2021).
As expected, alleviating N limitation in the (ShrubsConly, ShrubsNOf) simulations resulted in a substantially higher CO2 fertilization effect (on average 58 , Fig. 5b). This can be explained by the change in (plant) biological nitrogen fixation (BNF) in plants during an unlimited N supply. BNF increases with temperature (Yu and Zhuang, 2020) and the model formulation used here favors elevated CO2 (Meyerholt et al., 2016). Thus, BNF increases by 5 % yr−1 with rising CO2 (Fig. S10 in the Supplement), meaning that by 2010 the CO2 fertilized C-only simulation had 30 % more BNF than the non-fertilized simulation. BNF is an important N source for plants, whereas the contribution of symbiotic (bacteria) and free-living organism is uncertain (Davies-Barnard et al., 2020). In our C-only model used here plant BNF is unlimited. Thus, a simulation that is twice the size of the observations in the Arctic (see Meyerholt et al., 2016) compensates the absence of other N sources, such as symbiotic BNF (gray line in Fig. S10).
The effect of climate on the total vegetation C (Fig. S9 in the Supplement) is similar to that on GPP, with a sharp increase around 1970 to a change of 0.2 kg C m−2 (8 % of the total amount). Indeed, numerous studies, such as Elmendorf et al. (2012), have reported an increase in Arctic ecosystem productivity due to climate warming. The CO2 fertilization has a minor effect on shrubs and graminoids, and even leads to a reduction in tree vegetation C of about 5 %. Comparing CN and C-only simulations for shrubs reveals the same climate effect, as the climate forcing is the same, but a much higher CO2 fertilization effect occurred in the C-only simulation (0.5 kg m−2, 25 %). Norby et al. (2010) and McCarthy et al. (2010) confirm that local N availability influences the strength and the sign of the CO2 fertilization effect on Arctic trees. Changes in vegetation C also affect the foliage projection cover of trees and shrubs. CO2 fertilization has no significant impact on modelled shrub foliage projection cover (Fig. S8). For trees, however, we see a decrease in foliage cover when accounting for CO2 fertilization over the last 20 simulation years (Fig. S8, orange compared to coral line) which results in higher self-thinning and thus fewer trees per leaf area. Similar to shrubs, graminoids show only a modest response to CO2 fertilization (Fig. 5a).
3.3 Role of nitrogen availability
Here, we compare the C-only (ShrubsConly) and CN (Shrubs) simulations, i.e. simulations in which the nitrogen supply is maintained at levels that do not constrain plant growth vs. an explicit simulation of nitrogen input and output processes, as well as the limitation of plant growth due to nitrogen availability. Accounting for nitrogen limitation significantly reduced the GPP at all sites in shrub cover simulations (Figs. 6b and S7 in the Supplement), most notably for deciduous shrubs. These reductions ranged from 3 (2 %, not significant) for the evergreen shrub at the YAK site in Russia to 150 (75 %) for the deciduous shrub at the IGA site in Russia (Fig. 6a). We demonstrate that the magnitude of GPP change (Fig. 6b) depends on the length of the growing season (Fig. 6a), which impacts the nitrogen supply to the ecosystem through net N mineralization, fixation (not shown) and uptake (Fig. 6c). At sites with deciduous shrubs and a three-month growing season only (at the SEI, IMN, IGA sites; whereas SEI and IGA shrubs behave very similar), these main N sources declined in the CN simulations, leading to a significant decrease in GPP (Fig. 6b). In contrast, shrubs at other sites, e.g. at the WLF site in Canada, showed at least an increase in N uptake at the start of the growing season under the CN configuration. When both N uptake terms and the use of N storage increase (at the sites YAK, STR and ABI, where the shrubs at STR and ABI behave similarly), the reduction in GPP is only slight (Fig. 6b and c). We demonstrated that nitrogen supply strongly limits most simulated shrubs, which is consistent with other studies (Street and Caldararu, 2022). Other than modelled evergreen shrubs, the deciduous shrubs have a higher N demand and respond more rapidly to N additions, as has been reported for alpine shrubs by Zhou et al. (2023). The C-only model, which allows for unlimited biological N fixation, performs better than the CN model when compared to measurements (Table S2). This suggests that the N dynamics in the model may be overly restrictive. Supporting this hypothesis, we extracted 89 measurements of the CN ratio at Betula nana leaves and 36 measurements of the CN ratio at Betula glandulosa leaves were extracted from the TRY database (Kattge et al., 2020). The CN ratio estimated by the C-only configuration at seven stations (with deciduous species) is 24.0 (median), which is consistent with the measured median values (26.06±2.0, 22.56±2.1). However, the median value of the CN model (29.06) instead overestimates the measured CN ratio (i.e. it underestimates the leaf N concentration), thus supporting our hypothesis of overly too strong N limitation in the CN model. We recommend to improve the model by refining key processes such as BNF, to better reflect Arctic conditions.
Higher soil N levels, originating from the improved soil initialization, stimulated primary productivity. This increases the C storage in the coarse root, sapwood and heartwood pools of the plants. Consequently, total vegetation C increased by 1 kg C m−2 (93 %) on average (Fig. S11 in the Supplement).
For most of the sites with NE shrubs, the effects of the enhanced soil N supply (Fig. S7) are clearly reflected in the annual GPP, which increased by 73–290 compared to the standard model simulations (Shrubs). The additional nutrients led to a significant increase in the leaf-to-root mass ratio (Fig. S13 in the Supplement), which indicates significant alleviation of nitrogen limitation. This pattern has been widely reported for other vegetation types and causes the shrubs to allocate more growth to aboveground biomass than to roots. The latter is needed to take up more nutrients. In contrast, GPP for BD shrubs is less strongly affected (Fig. S7), and the leaf-to-root mass ratio at BD shrub sites do not change significantly (Fig. S13b in the Supplement). This feature highlights the contrasting nitrogen sensitivities and acquisition strategies of NE and BD shrubs. Indeed, Martin et al. (2022) report a rapid increase in GPP and leaf-to-root mass ratio in NE shrubs with higher N availability whereas BD shrubs only show a slight response to increased N due to the conservative economics and higher respiration efficiency (Street and Caldararu, 2022).
The change in GPP due to the PM initialization varies significantly over time. From the initialization the GPP difference rapidly increases by 10 to a level which is more or less constant until 1960. With increasing CO2 the GPP difference increases by 30 until 2010.
We incorporated broadleaf deciduous and needleleaf evergreen shrubs into the QUINCY nutrient-enabling terrestrial biosphere model using empirically based parameters to enhance the representation of Arctic carbon cycle processes. We simulated the growth of shrub, tree and graminoids separately at 16 Pan-Arctic sites separately to assess the impact of Arctic shrub cover on carbon uptake and storage. We found that:
-
Modelling shrubs using empirically based parameters enabled a reasonable simulation of gross primary production (GPP), achieving R2 values of 0.5 on average when compared with field data and MODIS satellite observations. This approach also accurately captured well-known physiological processes that are distinct from those of trees.
-
At the same simulated sites, shrubs exhibited greater growth than NE trees and graminoids, leading to a mean increase in GPP of 16 % or 40 %, respectively.
-
Climate-induced effects dominated over other driving factors when simulating enhanced shrub growth from 1901 to 2010. The results imply that this is due to the nitrogen limitation, which was strengthened by CO2 fertilization, but weakened by a warmer climate. This enhanced nitrogen fixation and soil nitrogen turnover.
-
The initialization of soil nitrogen concentrations, parametrized from observation products, enhanced shrub growth, especially at NE sites, improving the model-measurement comparison by 15 %. It also affected the increased C uptake over 1901–2010.
Overall, our results demonstrate that explicitly presenting shrubs significantly changes simulated carbon uptake and storage. This underlines the importance of including evergreen and deciduous shrub plant functional types (PFTs) in global land surface models to accurately predict ongoing changes in the Arctic C cycle. In the light of the significant impact of nitrogen limitation on ecosystem C fluxes as revealed here, we recommend improved constraints on the soil N cycle in low-temperature conditions and its changes in a warming climate. We also call for additional measurements needed to parametrize the PFT-specific traits, such as the biomass allocation to roots, which influence shrubs' efficiency in accessing soil nitrogen (Martin et al., 2022) and are likely to become increasingly important with permafrost thaw.
The scientific part of the QUINCY code is available under a BSD-3C license. The source code is available online (https://doi.org/10.17871/quincy-model-2019, MPI-BGC, 2019). The code version used here has the model tag 2025-11-20-emmerichs-shrub-arctic-ecosystem-carbon. Readers interested in running the model should request a username and password via the Git repository. The model output is available at https://doi.org/10.17617/3.BOEHLH (Emmerichs, 2026).
The supplement related to this article is available online at https://doi.org/10.5194/bg-23-7609-2026-supplement.
TE developed the shrub implementation, conducted the simulations and wrote the main of the manuscript. FL importantly contributed to the concept of the manuscript, prepared the site-level model forcings and developed the permafrost initialization. VB and FL extensively reviewed the manuscript. YZ prepared the MODIS satellite products for the model evaluation. SZ and CG did the most recent improvements of the nitrogen dynamics in QUINCY. SS, CV, KSL, EST have conducted the field measurements at Stordalen, Trail Valley Creek, Abisko and Siikaneva, respectively. All authors contributed to the review of the manuscript.
The contact author has declared that none of the authors has any competing interests.
Publisher's note: Copernicus Publications remains neutral with regard to jurisdictional claims made in the text, published maps, institutional affiliations, or any other geographical representation in this paper. The authors bear the ultimate responsibility for providing appropriate place names. Views expressed in the text are those of the authors and do not necessarily reflect the views of the publisher.
Tamara Emmerichs was funded by the European Research Council under the European Union's Horizon 2020 research and innovation program as part of the Q-Arctic project (grant agreement no. 951288) and by the German Research Foundation as part of the CLICCS Clusters of Excellence (DFG EXC 2037). Fabrice Lacroix received support from Swiss National Science Foundation (grant no. PZ00P2 216442). Yu Zhu was supported by the MoLiCarb project (Deutsche Forschungsgemeinschaft DFG, Project no. 514539694). Sönke Zaehle and Cheng Gong were supported by the European Union's Horizon 2020 research and innovation programme under grant agreement N 101003536 (ESM-2025). Carolina Voigt acknowledges funding from the European Research Council Starting Grant COLDSPOT (no. 101163177). The authors acknowledge the availability of the ABCfluxnet dataset. Especially, we thank Claire Treat, Lona van Delden, Joshua Hashemi to allow using the GPP data from the Siikaneva2 chambers and Sean Carey, Erin Nicholls, Graham Clark for the tower data at Wolfs Creek.
The article processing charges for this open-access publication were covered by the Max Planck Society.
This paper was edited by Paul Stoy and reviewed by Aiden I. G. Schore and one anonymous referee.
Andreu-Hayles, L., Gaglioti, B. V., Berner, L. T., Levesque, M., Anchukaitis, K. J., Goetz, S. J., and D'Arrigo, R.: A narrow window of summer temperatures associated with shrub growth in Arctic Alaska, Environ. Res. Lett., 15, 105012, https://doi.org/10.1088/1748-9326/ab897f, 2020. a
Bonfils, C. J. W., Phillips, T. J., Lawrence, D. M., Cameron-Smith, P., Riley, W. J., and Subin, Z. M.: On the influence of shrub height and expansion on northern high latitude climate, Environ. Res. Lett., 7, 015503, https://doi.org/10.1088/1748-9326/7/1/015503, 2012. a
Bret-Harte, M. S., Shaver, G. R., Zoerner, J. P., Johnstone, J. F., Wagner, J. L., Chavez, A. S., Gunkelman, R. F., Lippert, S. C., and Laundre, J. A.: Developmental plasticity allows Betula nana to dominate tundra subjected to an altered environment, Ecology, 82, 18–32, https://doi.org/10.2307/2680083, 2001. a
Bret-Harte, M. S., Shaver, G. R., and Chapin III, F. S.: Primary and secondary stem growth in arctic shrubs: implications for community response to environmental change, J. Ecol., 90, 251–267, https://doi.org/10.1046/j.1365-2745.2001.00657.x, 2002. a
Buckeridge, K. M., Zufelt, E., Chu, H., and Grogan, P.: Soil nitrogen cycling rates in low arctic shrub tundra are enhanced by litter feedbacks, Plant Soil, 330, 407–421, https://doi.org/10.1007/s11104-009-0214-8, 2010. a
Chen, W., Tape, K. D., Euskirchen, E. S., Liang, S., Matos, A., Greenberg, J., and Fraterrigo, J. M.: Impacts of Arctic shrubs on root traits and belowground nutrient cycles across a northern Alaskan climate gradient, Front. Plant Sci., 11, https://doi.org/10.3389/fpls.2020.588098, 2020. a, b, c
Davies-Barnard, T. and Friedlingstein, P.: The global distribution of biological nitrogen fixation in terrestrial natural ecosystems, Global Biogeochem. Cy., 34, e2019GB006387, https://doi.org/10.1029/2019GB006387, 2020. a
Davies-Barnard, T., Meyerholt, J., Zaehle, S., Friedlingstein, P., Brovkin, V., Fan, Y., Fisher, R. A., Jones, C. D., Lee, H., Peano, D., Smith, B., Wårlind, D., and Wiltshire, A. J.: Nitrogen cycling in CMIP6 land surface models: progress and limitations, Biogeosciences, 17, 5129–5148, https://doi.org/10.5194/bg-17-5129-2020, 2020. a
DeMarco, J., Mack, M. C., and Bret-Harte, M. S.: Effects of arctic shrub expansion on biophysical vs. biogeochemical drivers of litter decomposition, Ecology, 95, 1861–1875, https://doi.org/10.1890/13-2221.1, 2014. a
Du, Z., Zheng, H., Penuelas, J., Sardans, J., Deng, D., Cai, X., Gao, D., Nie, S., He, Y., Lü, X., and Li, M.-H.: Shrub encroachment leads to accumulation of C, N, and P in grassland soils and alters stoichiometry: a meta-analysis, Sci. Total Environ., 951, 175534, https://doi.org/10.1016/j.scitotenv.2024.175534, 2024. a
Elmendorf, S. C., Henry, G. H. R., Hollister, R. D., Björk, R. G., Boulanger-Lapointe, N., Cooper, E. J., Cornelissen, J. H. C., Day, T. A., Dorrepaal, E., Elumeeva, T. G., Gill, M., Gould, W. A., Harte, J., Hik, D. S., Hofgaard, A., Johnson, D. R., Johnstone, J. F., Jónsdóttir, I. S., Jorgenson, J. C., Klanderud, K., Klein, J. A., Koh, S., Kudo, G., Lara, M., Lévesque, E., Magnússon, B., May, J. L., Mercado-Dı′az, J. A., Michelsen, A., Molau, U., Myers-Smith, I. H., Oberbauer, S. F., Onipchenko, V. G., Rixen, C., Martin Schmidt, N., Shaver, G. R., Spasojevic, M. J., Porhallsdottir, P. E., Tolvanen, A., Troxler, T., Tweedie, C. E., Villareal, S., Wahren, C.-H., Walker, X., Webber, P. J., Welker, J. M., and Wipf, S.: Plot-scale evidence of tundra vegetation change and links to recent summer warming, Nat. Clim. Change, 2, 453–457, https://doi.org/10.1038/nclimate1465, 2012. a, b
Emmerichs, T.: Data from the study `Impacts of Shrub Coverage for Arctic Ecosystem Carbon Uptake and Storage', Edmond, V1 [data set], https://doi.org/10.17617/3.BOEHLH (last access: 11 October 2026), 2026. a
Friedlingstein, P., O'Sullivan, M., Jones, M. W., Andrew, R. M., Gregor, L., Hauck, J., Le Quéré, C., Luijkx, I. T., Olsen, A., Peters, G. P., Peters, W., Pongratz, J., Schwingshackl, C., Sitch, S., Canadell, J. G., Ciais, P., Jackson, R. B., Alin, S. R., Alkama, R., Arneth, A., Arora, V. K., Bates, N. R., Becker, M., Bellouin, N., Bittig, H. C., Bopp, L., Chevallier, F., Chini, L. P., Cronin, M., Evans, W., Falk, S., Feely, R. A., Gasser, T., Gehlen, M., Gkritzalis, T., Gloege, L., Grassi, G., Gruber, N., Gürses, Ö., Harris, I., Hefner, M., Houghton, R. A., Hurtt, G. C., Iida, Y., Ilyina, T., Jain, A. K., Jersild, A., Kadono, K., Kato, E., Kennedy, D., Klein Goldewijk, K., Knauer, J., Korsbakken, J. I., Landschützer, P., Lefèvre, N., Lindsay, K., Liu, J., Liu, Z., Marland, G., Mayot, N., McGrath, M. J., Metzl, N., Monacci, N. M., Munro, D. R., Nakaoka, S.-I., Niwa, Y., O'Brien, K., Ono, T., Palmer, P. I., Pan, N., Pierrot, D., Pocock, K., Poulter, B., Resplandy, L., Robertson, E., Rödenbeck, C., Rodriguez, C., Rosan, T. M., Schwinger, J., Séférian, R., Shutler, J. D., Skjelvan, I., Steinhoff, T., Sun, Q., Sutton, A. J., Sweeney, C., Takao, S., Tanhua, T., Tans, P. P., Tian, X., Tian, H., Tilbrook, B., Tsujino, H., Tubiello, F., van der Werf, G. R., Walker, A. P., Wanninkhof, R., Whitehead, C., Willstrand Wranne, A., Wright, R., Yuan, W., Yue, C., Yue, X., Zaehle, S., Zeng, J., and Zheng, B.: Global Carbon Budget 2022, Earth Syst. Sci. Data, 14, 4811–4900, https://doi.org/10.5194/essd-14-4811-2022, 2022. a, b, c, d, e, f
Fu, Y., Piao, S., Zhao, H., Jeong, S., Wang, X., Vitasse, Y., Ciais, P., and Janssens, I.: Unexpected role of winter precipitation in determining heat requirement for spring vegetation green-up at northern middle and high latitude, Glob. Change Biol., 20, https://doi.org/10.1111/gcb.12610, 2014. a, b, c
García Criado, M., Myers-Smith, I. H., Bjorkman, A. D., Elmendorf, S. C., Normand, S., Aastrup, P., Aerts, R., Alatalo, J. M., Baeten, L., Björk, R. G., Björkman, M. P., Boulanger-Lapointe, N., Butler, E. E., Cooper, E. J., Cornelissen, J. H. C., Daskalova, G. N., Fadrique, B., Forbes, B. C., Henry, G. H. R., Hollister, R. D., Høye, T. T., Jacobsen, I. B. D., Jägerbrand, A. K., Jónsdóttir, I. S., Kaarlejärvi, E., Khitun, O., Klanderud, K., Kolari, T. H. M., Lang, S. I., Lecomte, N., Lenoir, J., Macek, P., Messier, J., Michelsen, A., Molau, U., Muscarella, R., Nielsen, M.-L., Petit Bon, M., Post, E., Raundrup, K., Rinnan, R., Rixen, C., Ryde, I., Serra-Diaz, J. M., Schaepman-Strub, G., Schmidt, N. M., Schrodt, F., Sjögersten, S., Steinbauer, M. J., Stewart, L., Strandberg, B., Tolvanen, A., Tweedie, C. E., and Vellend, M.: Plant diversity dynamics over space and time in a warming Arctic, Nature, 642, 653–661, https://doi.org/10.1038/s41586-025-08946-8, 2025. a
Ge, L., Lafleur, P. M., and Humphreys, E. R.: Respiration from soil and ground cover vegetation under tundra shrubs, Arct. Antarct. Alp. Res., 49, 537–550, https://doi.org/10.1657/AAAR0016-064, 2017. a
Giesse, C., Notz, D., and Baehr, J.: The shifting distribution of Arctic daily temperatures under global warming, Earths Future, 12, e2024EF004961, https://doi.org/10.1029/2024EF004961, 2024. a
Gui, Y., Wang, K., Huntingford, C., Wei, S., Li, X., Myneni, R. B., and Piao, S.: Vegetation greenness in 2024, Nature Reviews Earth and Environment, 6, 255–257, https://doi.org/10.1038/s43017-025-00656-z, 2025. a
Harris, I. C.: CRU JRA v1.1: A forcings dataset of gridded land surface blend of climatic research unit (CRU) and Japanese reanalysis (JRA) data, Jan.1901 – Dec.2017, CEDA Archive [data set], https://doi.org/10.5285/13f3635174794bb98cf8ac4b0ee8f4ed, 2019. a
He, P., Ye, Q., Yu, K., Wang, H., Xu, H., Yin, Q., Yue, M., Liang, X., Wang, W., You, Z., Zhong, Y., and Liu, H.: Growing-season precipitation is a key driver of plant leaf area to sapwood area ratio at the global scale, Plant Cell Environ., 48, 746–755, https://doi.org/10.1111/pce.15169, 2025. a
Heijmans, M. M. P. D., Magnusson, R. I., Lara, M. J., Frost, G. V., Myers-Smith, I. H., van Huissteden, J., Jorgenson, M. T., Fedorov, A. N., Epstein, H. E., Lawrence, D. M., and Limpens, J.: Tundra vegetation change and impacts on permafrost, Nature Reviews Earth and Environment, 3, 68–84, https://doi.org/10.1038/s43017-021-00233-0, 2022. a, b
Heydel, F. and Tackenberg, O.: How are the phenologies of ripening and seed release affected by species' ecology and evolution?, Oikos, 126, 738–747, https://doi.org/10.1111/oik.03442, 2017. a
Holmes, M. E., Crill, P. M., Burnett, W. C., McCalley, C. K., Wilson, R. M., Frolking, S., Chang, K.-Y., Riley, W. J., Varner, R. K., Hodgkins, S. B., Coordinators, I. P., Team, I. F., McNichol, A. P., Saleska, S. R., Rich, V. I., and Chanton, J. P.: Carbon accumulation, flux, and fate in Stordalen Mire, a permafrost peatland in transition, Global Biogeochem. Cy., 36, e2021GB007113, https://doi.org/10.1029/2021GB007113, 2022. a
Hu, Q., Li, T., Deng, X., Wu, T., Zhai, P., Huang, D., Fan, X., Zhu, Y., Lin, Y., Xiao, X., Chen, X., Zhao, X., Wang, L., and Qin, Z.: Intercomparison of global terrestrial carbon fluxes estimated by MODIS and Earth system models, Sci. Total Environ., 810, 152231, https://doi.org/10.1016/j.scitotenv.2021.152231, 2022. a
Hugelius, G., Strauss, J., Zubrzycki, S., Harden, J. W., Schuur, E. A. G., Ping, C.-L., Schirrmeister, L., Grosse, G., Michaelson, G. J., Koven, C. D., O'Donnell, J. A., Elberling, B., Mishra, U., Camill, P., Yu, Z., Palmtag, J., and Kuhry, P.: Estimated stocks of circumpolar permafrost carbon with quantified uncertainty ranges and identified data gaps, Biogeosciences, 11, 6573–6593, https://doi.org/10.5194/bg-11-6573-2014, 2014. a
Intergovernmental Panel on Climate Change (IPCC) (Ed.): Emissions Trends and Drivers, in: Climate Change 2022 – Mitigation of Climate Change: Working Group III Contribution to the Sixth Assessment Report of the Intergovernmental Panel on Climate Change, Cambridge University Press, 215–294, https://doi.org/10.1017/9781009157926.004, 2023. a
Jobbágy, E. G. and Jackson, R. B.: The vertical distribution of soil organic carbon and its relation to climate and vegetation, Ecol. Appl., 10, 423–436, https://doi.org/10.1890/1051-0761(2000)010[0423:TVDOSO]2.0.CO;2, 2000. a
Kattge, J., Bönisch, G., Díaz, S., Lavorel, S., Prentice, I. C., Leadley, P., Tautenhahn, S., Werner, G. D. A., Aakala, T., Abedi, M., Acosta, A. T. R., Adamidis, G. C., Adamson, K., Aiba, M., Albert, C. H., Alcántara, J. M., Alcázar C, C., Aleixo, I., Ali, H., Amiaud, B., Ammer, C., Amoroso, M. M., Anand, M., Anderson, C., Anten, N., Antos, J., Apgaua, D. M. G., Ashman, T.-L., Asmara, D. H., Asner, G. P., Aspinwall, M., Atkin, O., Aubin, I., Baastrup-Spohr, L., Bahalkeh, K., Bahn, M., Baker, T., Baker, W. J., Bakker, J. P., Baldocchi, D., Baltzer, J., Banerjee, A., Baranger, A., Barlow, J., Barneche, D. R., Baruch, Z., Bastianelli, D., Battles, J., Bauerle, W., Bauters, M., Bazzato, E., Beckmann, M., Beeckman, H., Beierkuhnlein, C., Bekker, R., Belfry, G., Belluau, M., Beloiu, M., Benavides, R., Benomar, L., Berdugo-Lattke, M. L., Berenguer, E., Bergamin, R., Bergmann, J., Bergmann Carlucci, M., Berner, L., Bernhardt-Römermann, M., Bigler, C., Bjorkman, A. D., Blackman, C., Blanco, C., Blonder, B., Blumenthal, D., Bocanegra-González, K. T., Boeckx, P., Bohlman, S., Böhning-Gaese, K., Boisvert-Marsh, L., Bond, W., Bond-Lamberty, B., Boom, A., Boonman, C. C. F., Bordin, K., Boughton, E. H., Boukili, V., Bowman, D. M. J. S., Bravo, S., Brendel, M. R., Broadley, M. R., Brown, K. A., Bruelheide, H., Brumnich, F., Bruun, H. H., Bruy, D., Buchanan, S. W., Bucher, S. F., Buchmann, N., Buitenwerf, R., Bunker, D. E., Bürger, J., Burrascano, S., Burslem, D. F. R. P., Butterfield, B. J., Byun, C., Marques, M., Scalon, M. C., Caccianiga, M., Cadotte, M., Cailleret, M., Camac, J., Camarero, J. J., Campany, C., Campetella, G., Campos, J. A., Cano-Arboleda, L., Canullo, R., Carbognani, M., Carvalho, F., Casanoves, F., Castagneyrol, B., Catford, J. A., Cavender-Bares, J., Cerabolini, B. E. L., Cervellini, M., Chacón-Madrigal, E., Chapin, K., Chapin, F. S., Chelli, S., Chen, S.-C., Chen, A., Cherubini, P., Chianucci, F., Choat, B., Chung, K.-S., Chytrý, M., Ciccarelli, D., Coll, L., Collins, C. G., Conti, L., Coomes, D., Cornelissen, J. H. C., Cornwell, W. K., Corona, P., Coyea, M., Craine, J., Craven, D., Cromsigt, J. P. G. M., Csecserits, A., Cufar, K., Cuntz, M., da Silva, A. C., Dahlin, K. M., Dainese, M., Dalke, I., Dalle Fratte, M., Dang-Le, A. T., Danihelka, J., Dannoura, M., Dawson, S., de Beer, A. J., De Frutos, A., De Long, J. R., Dechant, B., Delagrange, S., Delpierre, N., Derroire, G., Dias, A. S., Diaz-Toribio, M. H., Dimitrakopoulos, P. G., Dobrowolski, M., Doktor, D., Dřevojan, P., Dong, N., Dransfield, J., Dressler, S., Duarte, L., Ducouret, E., Dullinger, S., Durka, W., Duursma, R., Dymova, O., E-Vojtkó, A., Eckstein, R. L., Ejtehadi, H., Elser, J., Emilio, T., Engemann, K., Erfanian, M. B., Erfmeier, A., Esquivel-Muelbert, A., Esser, G., Estiarte, M., Domingues, T. F., Fagan, W. F., Fagúndez, J., Falster, D. S., Fan, Y., Fang, J., Farris, E., Fazlioglu, F., Feng, Y., Fernandez-Mendez, F., Ferrara, C., Ferreira, J., Fidelis, A., Finegan, B., Firn, J., Flowers, T. J., Flynn, D. F. B., Fontana, V., Forey, E., Forgiarini, C., François, L., Frangipani, M., Frank, D., Frenette-Dussault, C., Freschet, G. T., Fry, E. L., Fyllas, N. M., Mazzochini, G. G., Gachet, S., Gallagher, R., Ganade, G., Ganga, F., García-Palacios, P., Gargaglione, V., Garnier, E., Garrido, J. L., de Gasper, A. L., Gea-Izquierdo, G., Gibson, D., Gillison, A. N., Giroldo, A., Glasenhardt, M.-C., Gleason, S., Gliesch, M., Goldberg, E., Göldel, B., Gonzalez-Akre, E., Gonzalez-Andujar, J. L., González-Melo, A., González-Robles, A., Graae, B. J., Granda, E., Graves, S., Green, W. A., Gregor, T., Gross, N., Guerin, G. R., Günther, A., Gutiérrez, A. G., Haddock, L., Haines, A., Hall, J., Hambuckers, A., Han, W., Harrison, S. P., Hattingh, W., Hawes, J. E., He, T., He, P., Heberling, J. M., Helm, A., Hempel, S., Hentschel, J., Hérault, B., Hereş, A.-M., Herz, K., Heuertz, M., Hickler, T., Hietz, P., Higuchi, P., Hipp, A. L., Hirons, A., Hock, M., Hogan, J. A., Holl, K., Honnay, O., Hornstein, D., Hou, E., Hough-Snee, N., Hovstad, K. A., Ichie, T., Igić, B., Illa, E., Isaac, M., Ishihara, M., Ivanov, L., Ivanova, L., Iversen, C. M., Izquierdo, J., Jackson, R. B., Jackson, B., Jactel, H., Jagodzinski, A. M., Jandt, U., Jansen, S., Jenkins, T., Jentsch, A., Jespersen, J. R. P., Jiang, G.-F., Johansen, J. L., Johnson, D., Jokela, E. J., Joly, C. A., Jordan, G. J., Joseph, G. S., Junaedi, D., Junker, R. R., Justes, E., Kabzems, R., Kane, J., Kaplan, Z., Kattenborn, T., Kavelenova, L., Kearsley, E., Kempel, A., Kenzo, T., Kerkhoff, A., Khalil, M. I., Kinlock, N. L., Kissling, W. D., Kitajima, K., Kitzberger, T., Kjøller, R., Klein, T., Kleyer, M., Klimešová, J., Klipel, J., Kloeppel, B., Klotz, S., Knops, J. M. H., Kohyama, T., Koike, F., Kollmann, J., Komac, B., Komatsu, K., König, C., Kraft, N. J. B., Kramer, K., Kreft, H., Kühn, I., Kumarathunge, D., Kuppler, J., Kurokawa, H., Kurosawa, Y., Kuyah, S., Laclau, J.-P., Lafleur, B., Lallai, E., Lamb, E., Lamprecht, A., Larkin, D. J., Laughlin, D., Le Bagousse-Pinguet, Y., le Maire, G., le Roux, P. C., le Roux, E., Lee, T., Lens, F., Lewis, S. L., Lhotsky, B., Li, Y., Li, X., Lichstein, J. W., Liebergesell, M., Lim, J. Y., Lin, Y.-S., Linares, J. C., Liu, C., Liu, D., Liu, U., Livingstone, S., Llusia, J., Lohbeck, M., Lopez-Garcia, A., Lopez-Gonzalez, G., Lososova, Z., Louault, F., Lukacs, B. A., Lukes, P., Luo, Y., Lussu, M., Ma, S., Maciel Rabelo Pereira, C., Mack, M., Maire, V., Mäkelä, A., Mäkinen, H., Malhado, A. C. M., Mallik, A., Manning, P., Manzoni, S., Marchetti, Z., Marchino, L., Marcilio-Silva, V., Marcon, E., Marignani, M., Markesteijn, L., Martin, A., Martínez-Garza, C., Martínez-Vilalta, J., Maskova, T., Mason, K., Mason, N., Massad, T. J., Masse, J., Mayrose, I., McCarthy, J., McCormack, M. L., McCulloh, K., McFadden, I. R., McGill, B. J., McPartland, M. Y., Medeiros, J. S., Medlyn, B., Meerts, P., Mehrabi, Z., Meir, P., Melo, F. P. L., Mencuccini, M., Meredieu, C., Messier, J., Meszaros, I., Metsaranta, J., Michaletz, S. T., Michelaki, C., Migalina, S., Milla, R., Miller, J. E. D., Minden, V., Ming, R., Mokany, K., Moles, A. T., Molnár V, A., Molofsky, J., Molz, M., Montgomery, R. A., Monty, A., Moravcová, L., Moreno-Martínez, A., Moretti, M., Mori, A. S., Mori, S., Morris, D., Morrison, J., Mucina, L., Mueller, S., Muir, C. D., Müller, S. C., Munoz, F., Myers-Smith, I. H., Myster, R. W., Nagano, M., Naidu, S., Narayanan, A., Natesan, B., Negoita, L., Nelson, A. S., Neuschulz, E. L., Ni, J., Niedrist, G., Nieto, J., Niinemets, Ü., Nolan, R., Nottebrock, H., Nouvellon, Y., Novakovskiy, A., Network, T. N., Nystuen, K. O., O'Grady, A., O'Hara, K., O'Reilly-Nugent, A., Oakley, S., Oberhuber, W., Ohtsuka, T., Oliveira, R., öllerer, K., Olson, M. E., Onipchenko, V., Onoda, Y., Onstein, R. E., Ordonez, J. C., Osada, N., Ostonen, I., Ottaviani, G., Otto, S., Overbeck, G. E., Ozinga, W. A., Pahl, A. T., Paine, C. E. T., Pakeman, R. J., Papageorgiou, A. C., Parfionova, E., Pärtel, M., Patacca, M., Paula, S., Paule, J., Pauli, H., Pausas, J. G., Peco, B., Penuelas, J., Perea, A., Peri, P. L., Petisco-Souza, A. C., Petraglia, A., Petritan, A. M., Phillips, O. L., Pierce, S., Pillar, V. D., Pisek, J., Pomogaybin, A., Poorter, H., Portsmuth, A., Poschlod, P., Potvin, C., Pounds, D., Powell, A. S., Power, S. A., Prinzing, A., Puglielli, G., Pysek, P., Raevel, V., Rammig, A., Ransijn, J., Ray, C. A., Reich, P. B., Reichstein, M., Reid, D. E. B., Rejou-Mechain, M., de Dios, V. R., Ribeiro, S., Richardson, S., Riibak, K., Rillig, M. C., Riviera, F., Robert, E. M. R., Roberts, S., Robroek, B., Roddy, A., Rodrigues, A. V., Rogers, A., Rollinson, E., Rolo, V., Römermann, C., Ronzhina, D., Roscher, C., Rosell, J. A., Rosenfield, M. F., Rossi, C., Roy, D. B., Royer-Tardif, S., Rüger, N., Ruiz-Peinado, R., Rumpf, S. B., Rusch, G. M., Ryo, M., Sack, L., Saldaña, A., Salgado-Negret, B., Salguero-Gomez, R., Santa-Regina, I., Santacruz-García, A. C., Santos, J., Sardans, J., Schamp, B., Scherer-Lorenzen, M., Schleuning, M., Schmid, B., Schmidt, M., Schmitt, S., Schneider, J. V., Schowanek, S. D., Schrader, J., Schrodt, F., Schuldt, B., Schurr, F., Selaya Garvizu, G., Semchenko, M., Seymour, C., Sfair, J. C., Sharpe, J. M., Sheppard, C. S., Sheremetiev, S., Shiodera, S., Shipley, B., Shovon, T. A., Siebenkäs, A., Sierra, C., Silva, V., Silva, M., Sitzia, T., Sjöman, H., Slot, M., Smith, N. G., Sodhi, D., Soltis, P., Soltis, D., Somers, B., Sonnier, G., Sørensen, M. V., Sosinski Jr., E. E., Soudzilovskaia, N. A., Souza, A. F., Spasojevic, M., Sperandii, M. G., Stan, A. B., Stegen, J., Steinbauer, K., Stephan, J. G., Sterck, F., Stojanovic, D. B., Strydom, T., Suarez, M. L., Svenning, J.-C., Svitková, I., Svitok, M., Svoboda, M., Swaine, E., Swenson, N., Tabarelli, M., Takagi, K., Tappeiner, U., Tarifa, R., Tauugourdeau, S., Tavsanoglu, C., te Beest, M., Tedersoo, L., Thiffault, N., Thom, D., Thomas, E., Thompson, K., Thornton, P. E., Thuiller, W., Tichý, L., Tissue, D., Tjoelker, M. G., Tng, D. Y. P., Tobias, J., Török, P., Tarin, T., Torres-Ruiz, J. M., Tóthmérész, B., Treurnicht, M., Trivellone, V., Trolliet, F., Trotsiuk, V., Tsakalos, J. L., Tsiripidis, I., Tysklind, N., Umehara, T., Usoltsev, V., Vadeboncoeur, M., Vaezi, J., Valladares, F., Vamosi, J., van Bodegom, P. M., van Breugel, M., Van Cleemput, E., van de Weg, M., van der Merwe, S., van der Plas, F., van der Sande, M. T., van Kleunen, M., Van Meerbeek, K., Vanderwel, M., Vanselow, K. A., Vårhammar, A., Varone, L., Vasquez Valderrama, M. Y., Vassilev, K., Vellend, M., Veneklaas, E. J., Verbeeck, H., Verheyen, K., Vibrans, A., Vieira, I., Villacís, J., Violle, C., Vivek, P., Wagner, K., Waldram, M., Waldron, A., Walker, A. P., Waller, M., Walther, G., Wang, H., Wang, F., Wang, W., Watkins, H., Watkins, J., Weber, U., Weedon, J. T., Wei, L., Weigelt, P., Weiher, E., Wells, A. W., Wellstein, C., Wenk, E., Westoby, M., Westwood, A., White, P. J., Whitten, M., Williams, M., Winkler, D. E., Winter, K., Womack, C., Wright, I. J., Wright, S. J., Wright, J., Pinho, B. X., Ximenes, F., Yamada, T., Yamaji, K., Yanai, R., Yankov, N., Yguel, B., Zanini, K. J., Zanne, A. E., Zeleny, D., Zhao, Y.-P., Zheng, J., Zheng, J., Zieminska, K., Zirbel, C. R., Zizka, G., Zo-Bi, I. C., Zotz, G., and Wirth, C.: TRY plant trait database – enhanced coverage and open access, Glob. Change Biol., 26, 119–188, https://doi.org/10.1111/gcb.14904, 2020. a, b, c, d, e
Körner, C.: Alpine Treelines: Functional Ecology of the Global High Elevation Tree Limits Springer, Basel, Google Scholar, 141–173, https://doi.org/10.1657/1938-4246-45.3.420, 2012. a
Lacroix, F., Zaehle, S., Caldararu, S., Schaller, J., Stimmler, P., Holl, D., Kutzbach, L., and Göckede, M.: Mismatch of N release from the permafrost and vegetative uptake opens pathways of increasing nitrous oxide emissions in the high Arctic, Glob. Change Biol., 28, 5973–5990, https://doi.org/10.1111/gcb.16345, 2022. a, b, c
Leffler, A. J., Serrone, A., Bolek, A., Rocha, A. V., Korrensalo, A., Vähä, A., Tremblay, A., Barr, A., Salazar, A., Sabrekov, A. F., Rasanen, A., Mavrovic, A., Roy, A., Panov, A. V., Townsend-Small, A., Niyazova, A., Prokushkin, A., Jonsson, A., Lindroth, A., and … Harazono, Y.: ABCFlux v2: Arctic-Boreal CO2 and CH4 In-situ Flux and Environmental Data (Version 1), ORNL Distributed Active Archive Center [data set], https://doi.org/10.3334/ORNLDAAC/2448, 2026. a
Lett, M. S., Knapp, A. K., Briggs, J. M., and Blair, J. M.: Influence of shrub encroachment on aboveground net primary productivity and carbon and nitrogen pools in a mesic grassland, Can. J. Botany, 82, 1363–1370, https://doi.org/10.1139/b04-088, 2004. a
Li, H., Shen, H., Chen, L., Liu, T., Hu, H., Zhao, X., Zhou, L., Zhang, P., and Fang, J.: Effects of shrub encroachment on soil organic carbon in global grasslands, Sci. Rep.-UK, 6, 28974, https://doi.org/10.1038/srep28974, 2016. a
Liu, D., Zhang, C., Ogaya, R., Acil, N., Pugh, T. A. M., Domene, X., Zhang, X., Fang, Y., Yang, X., Essl, F., Dullinger, S., and Peñuelas, J.: World-wide impacts of climate change and nitrogen deposition on vegetation structure, composition, and functioning of shrublands, New Phytol., 247, 1117–1128, https://doi.org/10.1111/nph.70235, 2025. a
Ma, H., Mo, L., Crowther, T. W., Maynard, D. S., van den Hoogen, J., Stocker, B. D., Terrer, C., and Zohner, C. M.: The global distribution and environmental drivers of aboveground versus belowground plant biomass, Nature Ecology and Evolution, 5, 1110–1122, https://doi.org/10.1038/s41559-021-01485-1, 2021. a, b, c
Ma, S., He, F., Tian, D., Zou, D., Yan, Z., Yang, Y., Zhou, T., Huang, K., Shen, H., and Fang, J.: Variations and determinants of carbon content in plants: a global synthesis, Biogeosciences, 15, 693–702, https://doi.org/10.5194/bg-15-693-2018, 2018. a
Martin, A. C., Jeffers, E. S., Petrokofsky, G., Myers-Smith, I., and Macias-Fauria, M.: Shrub growth and expansion in the Arctic tundra: an assessment of controlling factors using an evidence-based approach, Environ. Res. Lett., 12, 085007, https://doi.org/10.1088/1748-9326/aa7989, 2017. a
Martin, A. C., Macias-Fauria, M., Bonsall, M. B., Forbes, B. C., Zetterberg, P., and Jeffers, E. S.: Common mechanisms explain nitrogen-dependent growth of Arctic shrubs over three decades despite heterogeneous trends and declines in soil nitrogen availability, New Phytol., 233, 670–686, https://doi.org/10.1111/nph.17529, 2022. a, b, c, d, e
McCarthy, H. R., Oren, R., Johnsen, K. H., Gallet-Budynek, A., Pritchard, S. G., Cook, C. W., LaDeau, S. L., Jackson, R. B., and Finzi, A. C.: Re-assessment of plant carbon dynamics at the Duke free-air CO2 enrichment site: interactions of atmospheric [CO2] with nitrogen and water availability over stand development, New Phytol., 185, 514–528, https://doi.org/10.1111/j.1469-8137.2009.03078.x, 2010. a
Mekonnen, Z. A., Riley, W. J., and Grant, R. F.: Accelerated nutrient cycling and increased light competition will lead to 21st century shrub expansion in North American Arctic tundra, J. Geophys. Res.-Biogeo., 123, 1683–1701, https://doi.org/10.1029/2017JG004319, 2018. a, b, c, d
Mekonnen, Z. A., Riley, W. J., Berner, L. T., Bouskill, N. J., Torn, M. S., Iwahana, G., Breen, A. L., Myers-Smith, I. H., Criado, M. G., Liu, Y., Euskirchen, E. S., Goetz, S. J., Mack, M. C., and Grant, R. F.: Arctic tundra shrubification: a review of mechanisms and impacts on ecosystem carbon balance, Environ. Res. Lett., 16, 053001, https://doi.org/10.1088/1748-9326/abf28b, 2021. a, b, c, d, e
Meyer, G., Humphreys, E. R., Melton, J. R., Cannon, A. J., and Lafleur, P. M.: Simulating shrubs and their energy and carbon dioxide fluxes in Canada's Low Arctic with the Canadian Land Surface Scheme Including Biogeochemical Cycles (CLASSIC), Biogeosciences, 18, 3263–3283, https://doi.org/10.5194/bg-18-3263-2021, 2021. a, b, c
Meyerholt, J., Zaehle, S., and Smith, M. J.: Variability of projected terrestrial biosphere responses to elevated levels of atmospheric CO2 due to uncertainty in biological nitrogen fixation, Biogeosciences, 13, 1491–1518, https://doi.org/10.5194/bg-13-1491-2016, 2016. a, b
Miller, P. A. and Smith, B.: Modelling tundra vegetation response to recent Arctic warming, AMBIO, 41, 281–291, https://doi.org/10.1007/s13280-012-0306-1, 2012. a
Moore, E. R., Pouyat, R. V., and Trammell, T. L. E.: Soil nitrogen cycling in forests invaded by the shrub Rosa multiflora: importance of soil moisture and invasion density, Biogeochemistry, 167, 301–319, https://doi.org/10.1007/s10533-024-01133-3, 2024. a
MPI-BGC: QUINCY model, MPI-BGC [code], https://doi.org/10.17871/quincy-model-2019, 2019. a
Norby, R. J., Warren, J. M., Iversen, C. M., Medlyn, B. E., and McMurtrie, R. E.: CO2 enhancement of forest productivity constrained by limited nitrogen availability, P. Natl. Acad. Sci. USA, 107, 19368–19373, https://doi.org/10.1073/pnas.1006463107, 2010. a
Orndahl, K. M., Berner, L. T., Macander, M. J., Arndal, M. F., Alexander, H. D., Humphreys, E. R., Loranty, M. M., Ludwig, S. M., Nyman, J., Juutinen, S., Aurela, M., Mikola, J., Mack, M. C., Rose, M., Vankoughnett, M. R., Iversen, C. M., Kumar, J., Salmon, V. G., Yang, D., Grogan, P., Danby, R. K., Scott, N. A., Olofsson, J., Siewert, M. B., Deschamps, L., Maire, V., Lévesque, E., Gauthier, G., Boudreau, S., Gaspard, A., Bret-Harte, M. S., Raynolds, M. K., Walker, D. A., Michelsen, A., Kumpula, T., Villoslada, M., Ylänne, H., Luoto, M., Virtanen, T., Greaves, H. E., Forbes, B. C., Heim, R. J., Hölzel, N., Epstein, H., Bunn, A. G., Holmes, R. M., Natali, S. M., Virkkala, A.-M., and Goetz, S. J.: Next generation Arctic vegetation maps: aboveground plant biomass and woody dominance mapped at 30 m resolution across the tundra biome, Remote Sens. Environ., 323, 114717, https://doi.org/10.1016/j.rse.2025.114717, 2025. a, b
Palmtag, J., Obu, J., Kuhry, P., Siewert, M., Weiss, N., and Hugelius, G.: A high spatial resolution soil carbon and nitrogen dataset for the northern permafrost region, Bolin Centre [data set], https://doi.org/10.17043/palmtag-2022-spatial-1, 2022. a, b
Parker, T. C., Thurston, A. M., Raundrup, K., Subke, J.-A., Wookey, P. A., and Hartley, I. P.: Shrub expansion in the Arctic may induce large scale carbon losses due to changes in plant soil interactions, Plant Soil, 463, 643–651, https://doi.org/10.1007/s11104-021-04919-8, 2021. a, b, c
Pirk, N., Aalstad, K., Mannerfelt, E. S., Clayer, F., de Wit, H., Christiansen, C. T., Althuizen, I., Lee, H., and Westermann, S.: Disaggregating the carbon exchange of degrading permafrost peatlands using Bayesian deep learning, Geophys. Res. Lett., 51, e2024GL109283, https://doi.org/10.1029/2024GL109283, 2024. a
Poley, L. G., Laskin, D. N., and McDermid, G. J.: Quantifying aboveground biomass of shrubs using spectral and structural metrics derived from UAS imagery, Remote Sens.-Basel, 12, 2199, https://doi.org/10.3390/rs12142199, 2020. a
Poulter, B., MacBean, N., Hartley, A., Khlystova, I., Arino, O., Betts, R., Bontemps, S., Boettcher, M., Brockmann, C., Defourny, P., Hagemann, S., Herold, M., Kirches, G., Lamarche, C., Lederer, D., Ottlé, C., Peters, M., and Peylin, P.: Plant functional type classification for earth system models: results from the European Space Agency's Land Cover Climate Change Initiative, Geosci. Model Dev., 8, 2315–2328, https://doi.org/10.5194/gmd-8-2315-2015, 2015. a
Prager, C. M., Naeem, S., Boelman, N. T., Eitel, J. U. H., Greaves, H. E., Heskel, M. A., Magney, T. S., Menge, D. N., Vierling, L. A., and Griffin, K. L.: A gradient of nutrient enrichment reveals nonlinear impacts of fertilization on Arctic plant diversity and ecosystem function, Ecol. Evol., 7, 2449–2460, https://doi.org/10.1002/ece3.2863, 2017. a
Running, S. and Zhao, M.: MODIS/Terra Gross Primary Productivity Gap-Filled 8-Day L4 Global 500m SIN Grid V061, NASA Land Processes Distributed Active Archive Center [data set], https://doi.org/10.5067/MODIS/MOD17A2HGF.061, 2021. a
Running, S., Mu, Q., and Zhao, M.: MOD17A2H MODIS/Terra Gross Primary Productivity 8-Day L4 Global 500m SIN Grid V006, NASA Land Processes Distributed Active Archive Center [data set], https://doi.org/10.5067/MODIS/MOD17A2H.006, 2015. a
Schore, A. I. G., Fraterrigo, J. M., Salmon, V. G., Yang, D., and Lara, M. J.: Nitrogen fixing shrubs advance the pace of tall-shrub expansion in low-Arctic tundra, Communications Earth and Environment, 4, 421, https://doi.org/10.1038/s43247-023-01098-5, 2023. a
Schuur, E. A. G., McGuire, A. D., Schädel, C., Grosse, G., Harden, J. W., Hayes, D. J., Hugelius, G., Koven, C. D., Kuhry, P., Lawrence, D. M., Natali, S. M., Olefeldt, D., Romanovsky, V. E., Schaefer, K., Turetsky, M. R., Treat, C. C., and Vonk, J. E.: Climate change and the permafrost carbon feedback, Nature, 520, 171–179, https://doi.org/10.1038/nature14338, 2015. a
Schuur, E. A., Abbott, B. W., Commane, R., Ernakovich, J., Euskirchen, E., Hugelius, G., Grosse, G., Jones, M., Koven, C., Leshyk, V., Lawrence, D., Loranty, M. M., Mauritz, M., Olefeldt, D., Natali, S., Rodenhizer, H., Salmon, V., Schädel, C., Strauss, J., Treat, C., and Turetsky, M.: Permafrost and climate change: carbon cycle feedbacks from the warming Arctic, Annu. Rev. Env. Resour., 47, 343–371, https://doi.org/10.1146/annurev-environ-012220-011847, 2022. a
Shaver, G. R., Bret-Harte, M. S., Jones, M. H., Johnstone, J., Gough, L., Laundre, J., and Chapin III, F. S.: Species composition interacts with fertilizer to control long-term change in tundra productivity, Ecology, 82, 3163–3181, https://doi.org/10.1890/0012-9658(2001)082[3163:SCIWFT]2.0.CO;2, 2001. a
Street, L. E. and Caldararu, S.: Why are Arctic shrubs becoming more nitrogen limited?, New Phytol., 233, 585–587, https://doi.org/10.1111/nph.17841, 2022. a, b
Sulman, B. N., Salmon, V. G., Iversen, C. M., Breen, A. L., Yuan, F., and Thornton, P. E.: Integrating Arctic plant functional types in a land surface model using above- and belowground field observations, J. Adv. Model. Earth Sy., 13, e2020MS002396, https://doi.org/10.1029/2020MS002396, 2021. a
Tang, X., Li, H., Huang, N., Li, X., Xu, X., Ding, Z., and Xie, J.: A comprehensive assessment of MODIS-derived GPP for forest ecosystems using the site-level FLUXNET database, Environ. Earth Sci., 74, 5907–5918, 2015. a
Thum, T., Nabel, J. E. M. S., Tsuruta, A., Aalto, T., Dlugokencky, E. J., Liski, J., Luijkx, I. T., Markkanen, T., Pongratz, J., Yoshida, Y., and Zaehle, S.: Evaluating two soil carbon models within the global land surface model JSBACH using surface and spaceborne observations of atmospheric CO2, Biogeosciences, 17, 5721–5743, https://doi.org/10.5194/bg-17-5721-2020, 2020. a, b, c, d, e, f
Treml, V., Hejda, T., and Kašpar, J.: Differences in growth between shrubs and trees: how does the stature of woody plants influence their ability to thrive in cold regions?, Agr. Forest Meteorol., 271, 54–63, https://doi.org/10.1016/j.agrformet.2019.02.036, 2019. a, b
Virkkala, A.-M., Rogers, B., Watts, J., Arndt, K., Potter, S., Wargowsky, I., Schuur, E., See, C., Mauritz, M., Boike, J., Bret-Harte, M., Burke, E., Burrell, A., Chae, N., Chatterjee, A., Chevallier, F., Christensen, T. R., Commane, R., Dolman, H. A., and Natali, S.: Wildfires offset the increasing but spatially heterogeneous Arctic–boreal CO2 uptake, Nat. Clim. Change, 15, 188–195, https://doi.org/10.1038/s41558-024-02234-5, 2025. a
Virkkala, A.-M., Wargowsky, I., Vogt, J., Kuhn, M. A., Madaan, S., Windholz, T., Arndt, K. A., Rocher-Ros, G., Göckede, M., Olefeldt, D., Schuur, E. A. G., Bastviken, D., O'Keefe, R., Rogers, B. M., Watts, J. D., Kent, K., Aalstad, K., Aho, K., Ala-Könni, J., Alcock, H., Althuizen, I., Arp, C. D., Asanuma, J., Aurela, M., Balathandayuthabani, S., Attermeyer, K., Barr, A., Barret, M., Batkhishig, O., Biasi, C., Björkman, M. P., Black, A., Blanc-Betes, E., Bodmer, P., Boike, J., Bolek, A., Bouchard, F., Bussmann, I., Cabrol, L., Canfora, E., Carey, S., Castro-Morales, K., Chae, N., Christen, A., Christensen, T. R., Christiansen, C. T., Chu, H., Clark, G., Clayer, F., Crill, P., Cunada, C., Davidson, S. J., Dean, J. F., Dengel, S., Detto, M., Dieleman, C., Domine, F., Dyukarev, E., Edgar, C., Elberling, B., Emmerton, C. A., Euskirchen, E., Falvo, G., Friborg, T., Garneau, M., Giamberini, M., Glagolev, M. V., Gonzalez-Meler, M. A., Granath, G., Guðmundsson, J., Happonen, K., Harazono, Y., Harris, L., Hashemi, J., Hasson, N., Heerah, J., Heffernan, L., Helbig, M., Helgason, W., Heliasz, M., Henry, G., Hensgens, G., Hiyama, T., Holmes, B., Hock, M., Holl, D., Holst, J., Holst, T., Hould-Gosselin, G., Humphreys, E., Hung, J., Huotari, J., Ikawa, H., Ilyasov, D. V., Ishikawa, M., Iwahana, G., Iwata, H., Jackowicz-Korczynski, M. A., Jansen, J., Järveoja, J., Jassey, V. E. J., Jensen, R., Jentzsch, K., Jespersen, R. G., Johannesson, C.-F., Jones, C. P., Jonsson, A., Jung, J. Y., Juutinen, S., Kane, E., Karlsson, J., Karsanaev, S., Kasak, K., Kelly, J., Kempton, K., Klaus, M., Kling, G. W., Kljun, N., Knutson, J., Kobayashi, H., Kochendorfer, J., Kohonen, K.-M., Kolari, P., Korkiakoski, M., Korrensalo, A., Kortelainen, P., Koster, E., Koster, K., Kotani, A., Krishnan, P., Kurbatova, J., Kutzbach, L., Kwon, M. J., Kyzivat, E. D., Lagroix, J., Langhorst, T., Lapshina, E., Larmola, T., Larsen, K. S., Laurion, I., Ledman, J., Lee, H., Leffler, A. J., Lesack, L., Lindroth, A., Lipson, D., Lohila, A., López-Blanco, E., St. Louis, V. L., Lundin, E., Luoto, M., Machimura, T., Magnani, M., Malhotra, A., Maljanen, M., Mammarella, I., Männistö, E., Marchesini, L. B., Marsh, P., Martikainen, P. J., Marushchak, M. E., Mastepanov, M., Mavrovic, A., Maximov, T., Minions, C., Nadeau, D. F., Montemayor, M., Morishita, T., Murphy, P., Nicholls, E., Nilsson, M. B., Niyazova, A., Nordén, J., Noumonvi, K. D., Nykänen, H., Oechel, W., Ojala, A., Okadera, T., Pal, S., Panov, A. V., Papakyriakou, T., Papale, D., Park, S.-J., Parmentier, F.-J. W., Pastorello, G., Peacock, M., Peichl, M., Petrov, R., St. Pierre, K., Pirk, N., Plein, J., Preskienis, V., Prokushkin, A., Pumpanen, J., Rains, H. A., Rakos, N., Räsänen, A., Rautakoski, H., Rinnan, R., Rinne, J., Rocha, A., Roulet, N., Roy, A., Rutgersson, A., Sabrekov, A. F., Sachs, T., Sahlée, E., Salazar, A., Sawakuchi, H. O., Schulze, C., Seco, R., Sepulveda-Jauregui, A., Serikova, S., Serrone, A., Silvennoinen, H. M., Sjogersten, S., Skeeter, J., Snöälv, J., Sobek, S., Sonnentag, O., Stanley, E. H., Strack, M., Strom, L., Sullivan, P., Sullivan, R., Sytiuk, A., Tagesson, T., Taillardat, P., Talbot, J., Tank, S. E., Tenuta, M., Terenteva, I., Thalasso, F., Thiboult, A., Thorgeirsson, H., Garcia Tigreros, F., Torn, M., Townsend-Small, A., Treat, C., Tremblay, A., Trotta, C., Tuittila, E.-S., Turetsky, M., Ueyama, M., Umair, M., Vähä, A., van Delden, L., van Hardenbroek, M., Varlagin, A., Varner, R. K., Virtanen, T., Veretennikova, E., Vesala, T., Voigt, C., Vonk, J. E., Wagner, R., Walter Anthony, K., Wang, Q., Watanabe, M., Webb, H., Welker, J. M., Westergaard-Nielsen, A., Westermann, S., White, J. R., Wille, C., Williamson, S. N., Zolkos, S., Zona, D., and Natali, S. M.: ABCFlux v2: Arctic–boreal CO2 and CH4 monthly flux observations and ancillary information across terrestrial and freshwater ecosystems, Earth Syst. Sci. Data, 18, 6357–6409, https://doi.org/10.5194/essd-18-6357-2026, 2026. a
Vowles, T. and Björk, R. G.: Implications of evergreen shrub expansion in the Arctic, J. Ecol., 107, 650–655, https://doi.org/10.1111/1365-2745.13081, 2019. a
Wang, L., Zhu, H., Lin, A., Zou, L., Qin, W., and Du, Q.: Evaluation of the latest MODIS GPP products across multiple biomes using global eddy covariance flux data, Remote Sens.-Basel, 9, 418, https://doi.org/10.3390/rs9050418, 2017. a
Wang, P., Heijmans, M. M., Mommer, L., van Ruijven, J., Maximov, T. C., and Berendse, F.: Belowground plant biomass allocation in tundra ecosystems and its relationship with temperature, Environ. Res. Lett., 11, 055003, https://doi.org/10.1088/1748-9326/11/5/055003, 2016. a
Wei, T., Li, J., Rong, X., Dong, W., Wu, B., and Ding, M.: Arctic climate changes based on historical simulations (1900–2013) with the CAMS-CSM, J. Meteorol Res., 32, 881–895, https://doi.org/10.1007/s13351-018-7188-5, 2018. a
Yu, T. and Zhuang, Q.: Modeling biological nitrogen fixation in global natural terrestrial ecosystems, Biogeosciences, 17, 3643–3657, https://doi.org/10.5194/bg-17-3643-2020, 2020. a
Zaehle, S. and Friend, A. D.: Carbon and nitrogen cycle dynamics in the OCN land surface model: 1. Model description, site-scale evaluation, and sensitivity to parameter estimates, Global Biogeochem. Cy., 24, https://doi.org/10.1029/2009GB003521, 2010. a
Zhang, W., Miller, P. A., Smith, B., Wania, R., Koenigk, T., and Döscher, R.: Tundra shrubification and tree-line advance amplify arctic climate warming: results from an individual-based dynamic vegetation model, Environ. Res. Lett., 8, 034023, https://doi.org/10.1088/1748-9326/8/3/034023, 2013. a, b, c, d
Zhao, Y., Liu, X., Wang, Y., Zheng, Z., Zheng, S., Zhao, D., and Bai, Y.: UAV-based individual shrub aboveground biomass estimation calibrated against terrestrial LiDAR in a shrub-encroached grassland, Int. J. Appl. Earth Obs., 101, 102358, https://doi.org/10.1016/j.jag.2021.102358, 2021. a
Zhao, Y., Wang, H., Ma, Y., Li, Z., Mi, W., and Cao, Z.: Spatial estimation of soil carbon and nitrogen in a grassland shrubland transition, Ecol. Indic., 153, 110384, https://doi.org/10.1016/j.ecolind.2023.110384, 2023. a
Zhou, Y., Sha, M., Jin, H., Wang, L., Zhang, J., Xu, Z., Tan, B., Chen, L., Wang, L., Liu, S., Xiao, J., You, C., Huang, Y., Chen, Y., and Liu, Y.: The expansion of evergreen and deciduous shrubs changed the chemical characteristics and biological community of alpine meadows soil, Eur. J. Soil Biol., 117, 103505, https://doi.org/10.1016/j.ejsobi.2023.103505, 2023. a
Zhu, X., Pei, Y., Zheng, Z., Dong, J., Zhang, Y., Wang, J., Chen, L., Doughty, R. B., Zhang, G., and Xiao, X.: Underestimates of grassland gross primary production in MODIS standard products, Remote Sens.-Basel, 10, 1771, https://doi.org/10.3390/rs10111771, 2018. a