the Creative Commons Attribution 4.0 License.
the Creative Commons Attribution 4.0 License.
 | 29 Jan 2026
Assessment of the Cape Blanc (northwest Africa) upwelling ecosystem response to recent climate change, using wavelet analyses on dinoflagellate cyst export
Runa T. Reuter
Jan-Berend W. Stuut
Gerard J. M. Versteegh
Vera Pospelova
Iria García-Moreiras
Karin A. F. Zonneveld
Accelerated rates of change in recent climate have urged comprehensive investigations of its impact on marine ecosystems, notably those with high bio-, socio-, and economic importance, such as the upwelling ecosystem off Cape Blanc, Northwest Africa. This paper discusses how phyto- and microzooplankton export flux, represented by dinoflagellate cysts (dinocysts), in this ecosystem can be affected by variable climatic conditions prevailing between 2003 and 2020. The study area is characterised by annual permanent upwelling with cyclic intensity and strong inter-annual variability. Thus, we employed Morlet wavelet analyses to detect periodicities and interannual variations on an 18 year high-resolution sediment trap record of organic-walled dinocyst export flux and local environmental steering factors (e.g., wind direction, wind speed, Saharan dust input and sea-surface temperature). A dinocyst is a fossilisable structure produced by dinoflagellates, a plankton group containing both primary and secondary producers. Significant half-year and annual cycles in the time series of dinocyst export fluxes, upwelling winds, and the dust input time series were detected. Those cycles presented variations that were divided into three distinct phases: Phase I (2003–2008), Phase II (2009–2012), and Phase III (2013–2020). We also observed changes in the taxonomic composition of dinocyst assemblages in every phase, demonstrating their potential as bioindicators for environmental changes. The significant variations within each phase were mostly explained by changes in upwelling intensity and dust input into the area. Our results suggest that there is a strong interaction between these two factors (which depend on surface wind dynamics) and the export flux of dinocysts off Cape Blanc, highlighting the ecosystem's sensitivity to local climate variability.
- Article
(12341 KB) - Full-text XML
- BibTeX
- EndNote


Eastern Boundary Upwelling Ecosystems (EBUEs) are dynamic systems of great importance for biodiversity and food resources (e.g., Pauly and Christensen, 1995; Arístegui et al., 2009). Despite the fact that they cover only about 4 % of the oceanic realm, these biodiversity hotspots contribute to around 25 % of the global fishery (e.g., Pauly and Christensen, 1995; Carr, 2001). They are major oceanic features that have a strong impact on the global carbon cycle by bringing colder and nutrient-rich deeper waters to the ocean surface, stimulating primary production that takes up large amounts of CO2 in the photic zone and transports it down to the deeper ocean via the biological carbon pump (e.g., Beaulieu, 2002; Jiao et al., 2014). The EBUEs are controlled by surface wind dynamics and, as such, are sensitive to climate variability at short and long terms (e.g., Carr, 2001; Fréon et al., 2009). Understanding the dynamics of upwelling and their related abiotic and biotic changes can help clarify the impact of climate change on these ecosystems.
One method to obtain information about biotic changes in a marine ecosystem is to study the fluctuations in the export flux of key organisms of different trophic levels, reflecting the upper ocean bioproduction (e.g., Ducklow et al., 2001). Such key organisms in the marine plankton community are dinoflagellates. This diverse group of microalgae contributes around 6 % to global primary productivity and contains more than 2300 phototrophic/mixotrophic and heterotrophic species (e.g., Schnepf and Elbrächter, 1992; Taylor et al., 2008; Jeong et al., 2010; Gómez, 2012; Sun et al., 2025). Some dinoflagellate species produce biotoxins and are capable of forming harmful algal blooms (HABs). These can have negative impacts on the ecosystem as well as on local socio-economic sectors, sometimes having significant negative repercussions on fishery resources, tourism, and human health (e.g., Starr et al., 2017; Anderson et al., 2021; Pitcher and Louw, 2021). HABs threaten various ocean regions, including high-productive regions such as the EBUEs (Pauly and Christensen, 1995). Approximately 11 %–16 % of living dinoflagellate species produce (resting) cysts during their reproductive cycle (Fig. 1) (Head, 1996; Dale et al., 2002; Bravo and Figueroa, 2014). The morphology of dinoflagellate cysts, or dinocysts, is often species-specific. After their production in the upper water column, they tend to sink to the ocean floor, where they can be fossilised. Their assemblage composition is strongly influenced by environmental conditions (e.g., Dale and Dale, 1992; Pospelova et al., 2008; de Vernal et al., 2020; Marret et al., 2020; García-Moreiras et al., 2021; Likumahua et al., 2021; Rodríguez–Villegas et al., 2022; Zonneveld et al., 2022; Obrezkova et al., 2023; García-Moreiras et al., 2024). In combination with their good preservation potential in sediments, they become excellent proxies to study past ecosystems (e.g., Dale et al., 2002; Pospelova et al., 2002; Ellegaard et al., 2017; García-Moreiras et al., 2018; Zonneveld et al., 2024). In modern environments, the dinocyst assemblage composition changes of their downward flux form an excellent tool to relate changes of both phyto- and microzooplankton production in upper waters to changes in climate and environment, and as such, they also can be used as an excellent tool for monitoring changes in upper ocean marine ecosystems (e.g., Pospelova et al., 2010; Bringué et al., 2019; Romero et al., 2020; García-Moreiras et al., 2025, and references therein).
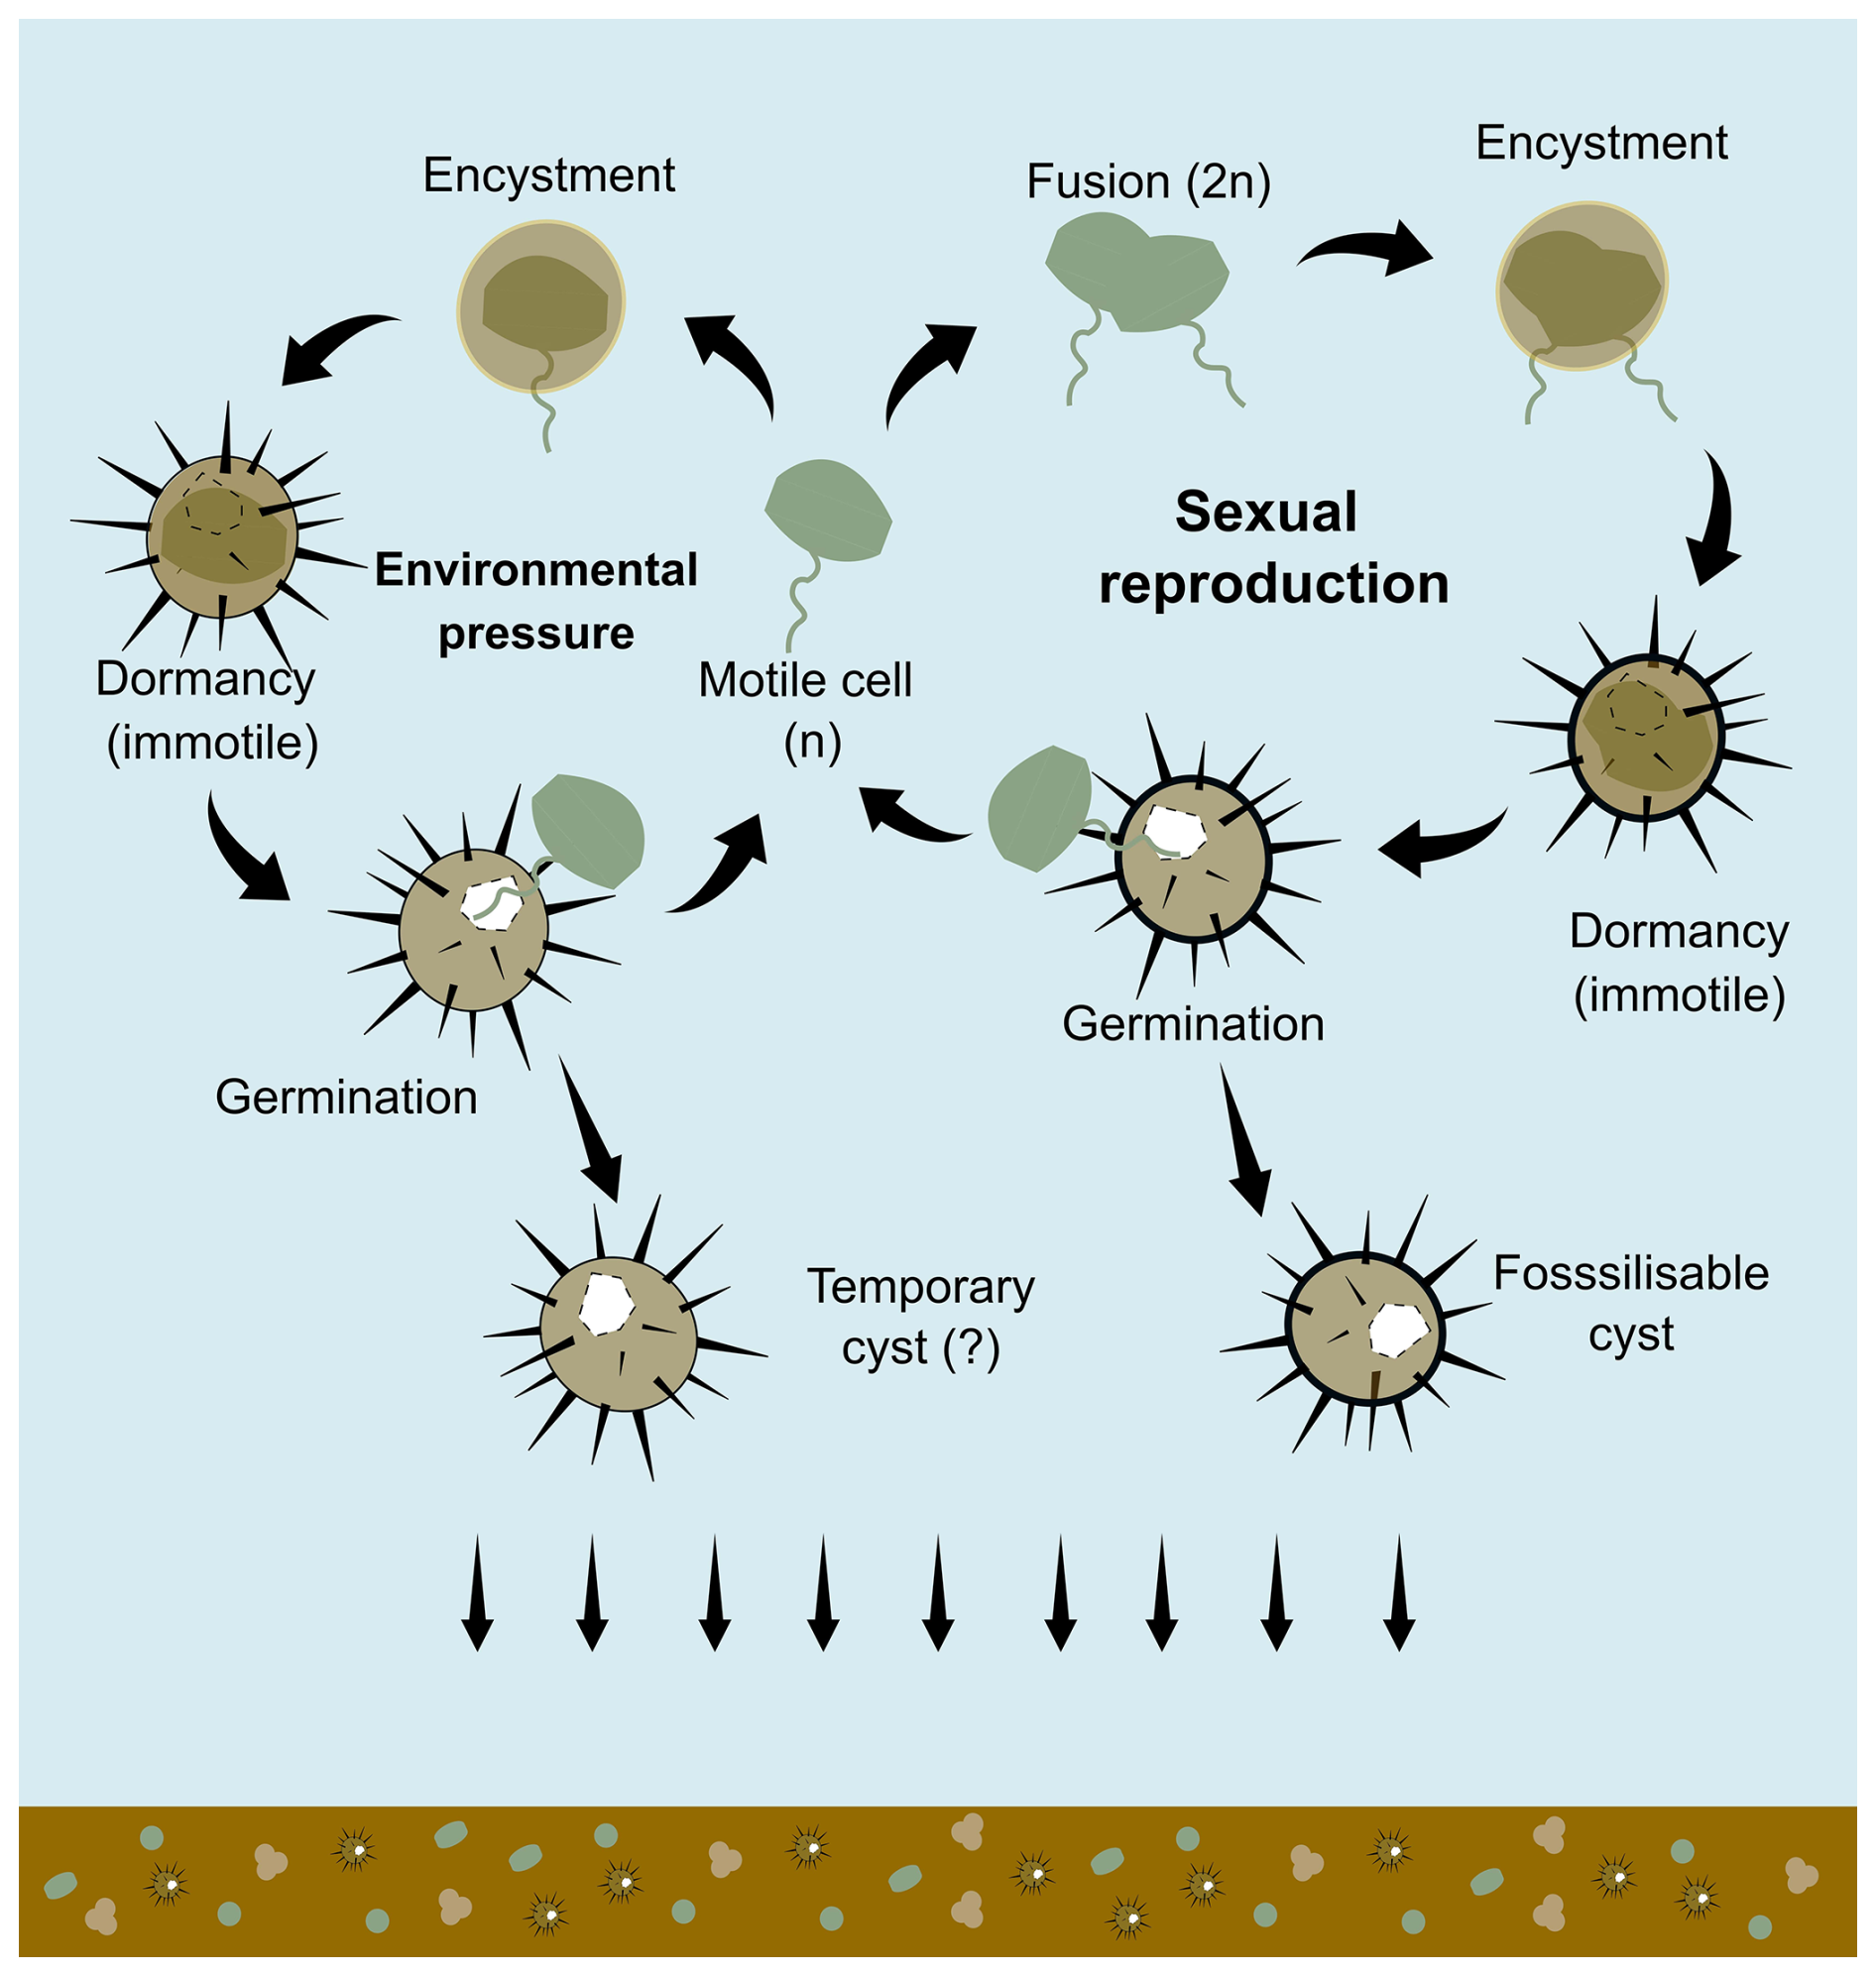
Figure 1The simplified scheme of dinoflagellate cysts formation (encystment) shows two types of cysts: fossilisable cysts through sexual reproduction and potentially temporary cysts that are not usually preserved in the fossil record. The scheme was drawn based on the result of in-situ observation by Zonneveld et al. (2022) and also adapted from Bravo and Figueroa (2014).
So far, most studies focusing on the dinocyst export out of the photic zone in relation to changing environmental conditions covered short time intervals, ranging from several days to less than 5 years (see García-Moreiras et al., 2025). Only two sediment trap studies span a period longer than a decade: one in the Cariaco Basin, Southern Caribbean Sea, for 12.5 years (Bringué et al., 2019) and another in the upwelling area off the Cape Blanc, Northwest Africa, for 18 years (Roza et al., 2024). However, these studies primarily focused on the relationship between the changes in annual and seasonal variation of individual environmental factors on the dinocyst export flux but did not investigate the underlying climatic forcing mechanisms that influenced the marine ecosystems. This information gap motivated us to revisit the 18 year sediment trap record obtained off Cape Blanc in Northwest Africa, which recorded changes in the dinocyst export flux between 2003 and March 2020 (Roza et al., 2024).
The Cape Blanc region hosts the Canary Current upwelling system, which is one of the four major EBUEs. The upwelling system is highly dynamic, with strong annual, inter-annual, and decadal variation (e.g., Romero et al., 2020, 2021; Roza et al., 2024). Although upwelling off Cape Blanc is a permanent feature, its intensity has a cyclic character with maximal upwelling intensity occurring in winter/early spring when the Intertropical Convergence Zone (ITCZ) is at its most southern position and minimal intensity in late summer when the ITCZ has its most northern position (e.g., Mittelstaedt, 1991; Cropper et al., 2014; Fischer et al., 2016). The seasonal change in ITCZ position directly affects the region's surface wind speed and direction. In turn, the wind speed and direction influence the occurrence and frequency of dust storm events, bringing Sahara dust into the oceanic realm. The dust fallout in the oceanic realm contains several trace elements and, as such, can stimulate primary production (e.g., Jickells et al., 2005; Adams et al., 2012; Yu et al., 2019) Although all parameters show a cyclic character, the cyclicity differs for each parameter, and its intensity can change between years (e.g., Fischer et al., 2016, 2019; Romero and Ramondenc, 2022).
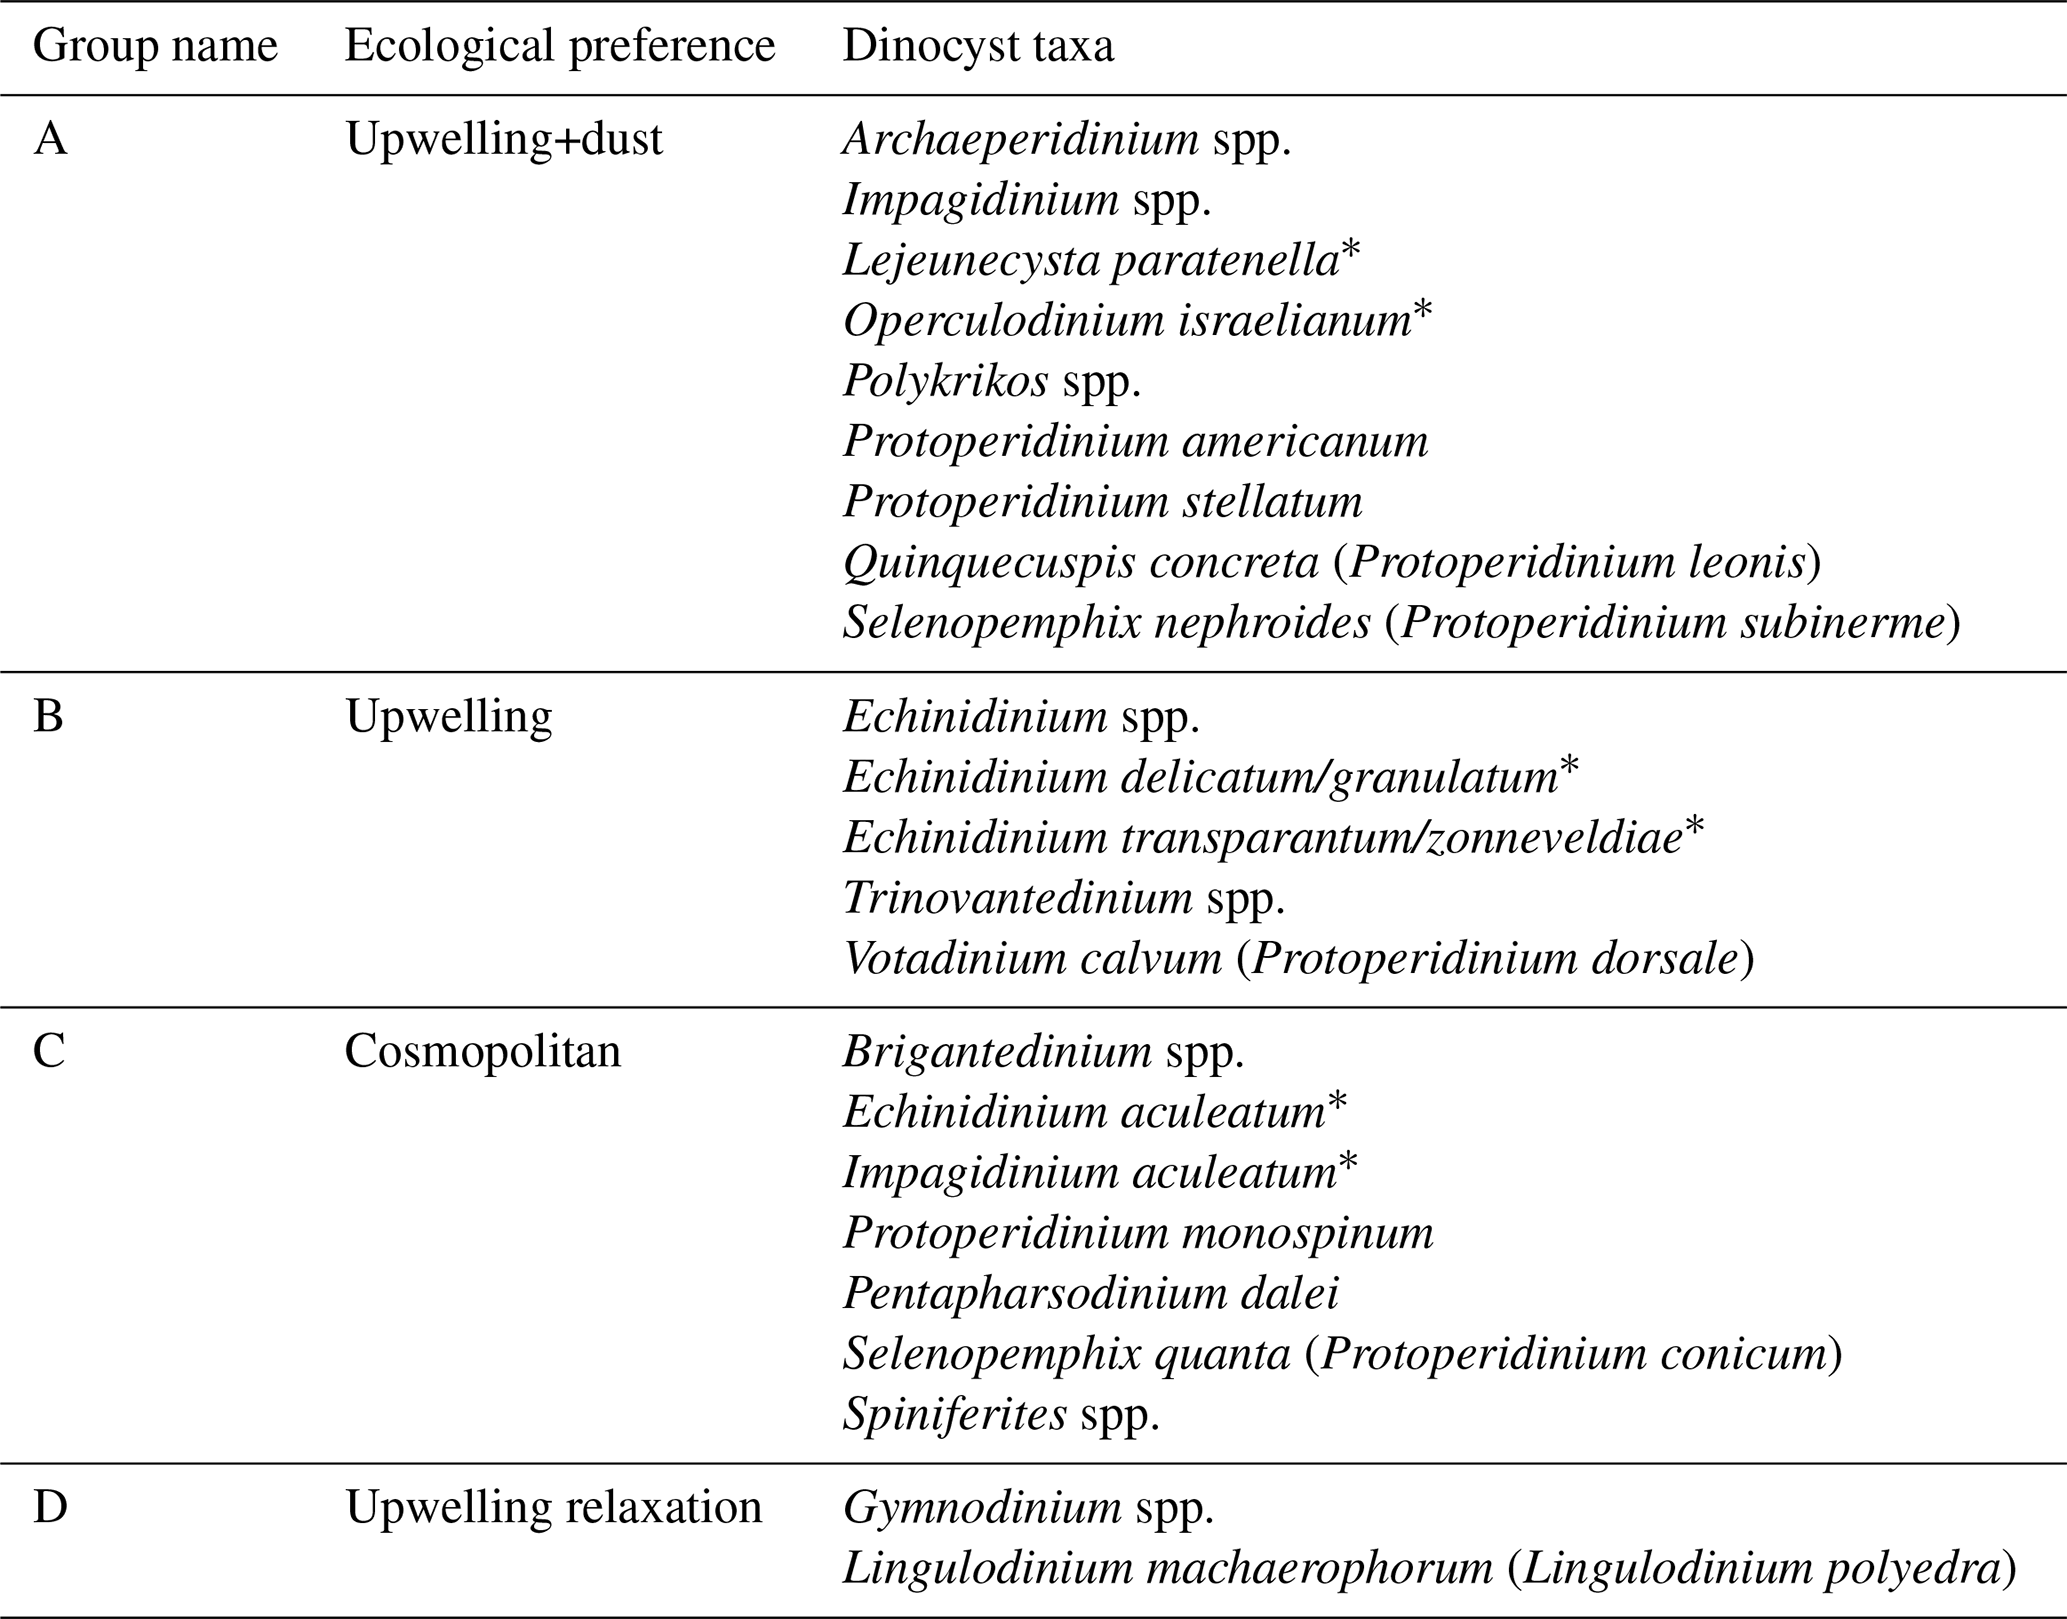
The study of Roza et al. (2024) revealed that the dinoflagellate cyst flux reflected seasonal changes in upper ocean conditions. Four groups of taxa were identified, containing species that responded comparably to upper water environmental changes namely; (A) dinocyst taxa that increased export flux during intensive upwelling and enhanced dust input (upwelling+dust group), (B) dinocyst taxa that enhanced export flux during intensive upwelling only (upwelling group), (C) dinocyst taxa that showed no relationship with any environmental conditions (cosmopolitan group), and (D) taxa that enhanced export flux during upwelling relaxation (upwelling relaxation group).
To obtain insight into how climate change influenced the cyclicity and cyclic intensity of environmental parameters over the last two decades and how this influenced the Canary Current upwelling ecosystem, this study uses wavelet analyses to determine the presence and timing of cyclicities in the environmental factors wind direction, wind speed, occurrence of dust storms, aerosol dust concentration, sea-surface temperature and upwelling index, as well as in the dinocyst export flux time series. Wavelet time series analyses have been successfully applied in the past to dinoflagellate cyst records from downcore (e.g., Patterson et al., 2005; Yu and Berglund, 2007; Bringué et al., 2014) and sediment trap (Bringué et al., 2019). However, those publications did not utilise this method on environmental forcing factors that influenced the dinocyst production in every respective studied area. Thus, wavelet analyses using Morlet technique were applied to all time series analyses, enabling a comparison between dinocysts production and the environmental parameters by implementing cross-correlation analyses, in order to obtain new insights into how the ocean ecosystem responded to changes in the local climate.
2.1 Study site and sampling
We conducted this study using the dinocyst export flux time series published by Roza et al. (2024). Dinocysts were collected with a sediment trap (CBeu) that was deployed in the upwelling region off Cape Blanc over an 18 year period. This sediment trap is located in an area influenced by upwelling, which is part of the Canary Current System, one of the EBEUs (e.g., Mittelstaedt, 1983; Hagen, 2001). In this region, nutrient fertilisation of the upper ocean production primarily comes from the upwelled deep waters, as well as from additional micronutrients originating from the Sahara (e.g., van Camp et al., 1991; Cropper et al., 2014; Chouza et al., 2016). Upwelling can be observed along the shelf break of the northwestern African shelf, with permanent year-round upwelling in the region off Cape Blanc, Mauritania (e.g., Cropper et al., 2014). Here, the local topography, atmospheric, and oceanic conditions facilitate the unique character of this upwelling zone, which also supplies nutrient-rich waters farther to the open ocean region via large filaments (Fig. 2a) (e.g., Mittelstaedt, 1991; van Camp et al., 1991; Hagen, 2001). Although the upwelling is a permanent feature, its intensity changes over the year as a result of the annual migration of the Intertropical Convergence Zone (ITCZ) (e.g., Hagen, 2001; Faye et al., 2015). Stronger upwelling is controlled by winds blowing from the northeast in winter and spring when ITCZ has migrated south (Fig. 2b–d), whereas upwelling is relaxed due to weakened wind speed coming from the east in summer to autumn when the ITCZ has its northernmost position (Fig. 2e–g) (Hagen, 2001; Faye et al., 2015). The ITCZ also controls the transport of Saharan dust into the study region by influencing the strength of the trade winds that carry the dust particles from the Sahara into the open ocean. High dust input to the East Atlantic occurs in winter and spring, while dust transported at higher altitudes reachesmore distal locations in summer and autumn (Ben-Ami et al., 2009; Skonieczny et al., 2013; Prospero et al., 2014).
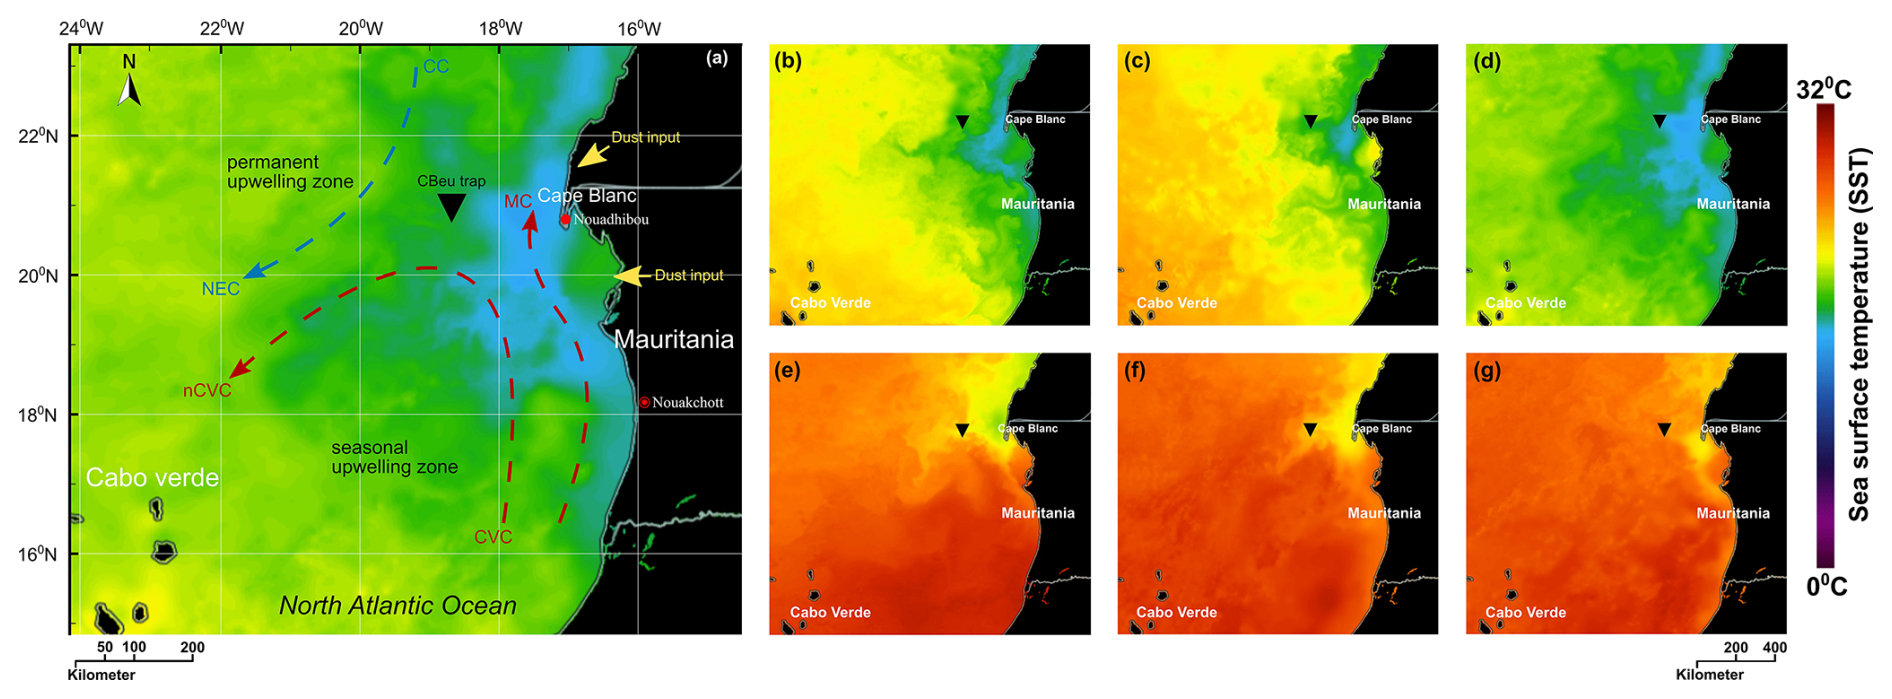
Figure 2Location of the moored sediment trap on the Northwest African coast and temperature of the upper water column extracted from NASA “State Of The Ocean (SOTO)”: (a) the main hydrographic currents of the Atlantic coast of Mauritania depicted after Mittelstaedt (1983, 1991) and Zenk et al. (1991) showing Canary Current (CC) and North Equatorial Current (NEC) in the blue arrow (representing colder waters) as well as Cape Verde Current (CVC), north Cape Verde Current (nCVC), and Mauritania Current (MC) in red arrows (representing warmer waters). The warmer and colder colours of the sea surface correspond to the temperature, as shown by the sea surface temperature (SST) scale bar. (b–d) The Condition of SST distribution was influenced by colder subsurface upwelled waters at maximum upwelling phases in 2005, 2010, and 2015, respectively. (e–g) SST distribution at minimum upwelling phases in 2005, 2010, and 2015, respectively.
The studied samples were collected using a Kiel and Honjo type of sediment trap moored between 20°44.6′–20°53.0′ N and 18°41.9′–18°45.4′ W. The trap drifted in the water column at a depth of ∼1300 m. Below the trap funnel, sampling cups were connected to a computer-programmed carousel. Sampling cups were filled with a mercury chloride (HgCl2) solution that functioned as a poison to stop biochemical processes. Pure Natrium Chloride (NaCl) was added to increase the salinity and density of seawater in the sampling cups to 40 ‰. This procedure followed the protocol of the trap research program at MARUM that was applied by Romero and Fischer (2017), Romero et al. (2020), and Romero and Ramondenc (2022). The trap funnels had a sampling surface area of 0.5 m2 and were equipped with a baffle comb (Kremling et al., 1996). The deployment and recovery at the mooring site have been conducted since 2003, with sampling intervals that varied between one and three weeks. The time series of the sediment trap data presented here covered June 2003–March 2020, which was almost continuous, with some small gaps due to the arrival schedules of research cruises and a few longer gaps that were caused by several reasons, such as (1) malfunctioning of the trap in summer and autumn of 2006, spring of 2008, autumn of 2011, summer of 2012, and winter of 2012/13, and (2) the absence of a research cruise from autumn of 2010 until early spring of 2011 (Fig. 3a). After recovery, the samples were stored in the MARUM repository at 4 °C. The samples were split into fractions using the McLane wet splitter system. Prior to sieving at 1 mm (size mesh), large swimmer plankton, such as crustaceans, were manually picked out of the samples. The sampling and laboratory treatment followed the protocol reported by Mollenhauer et al. (2015), Romero and Fischer (2017), and Fischer et al. (2019). A total of 369 samples were prepared for dinocyst analyses.
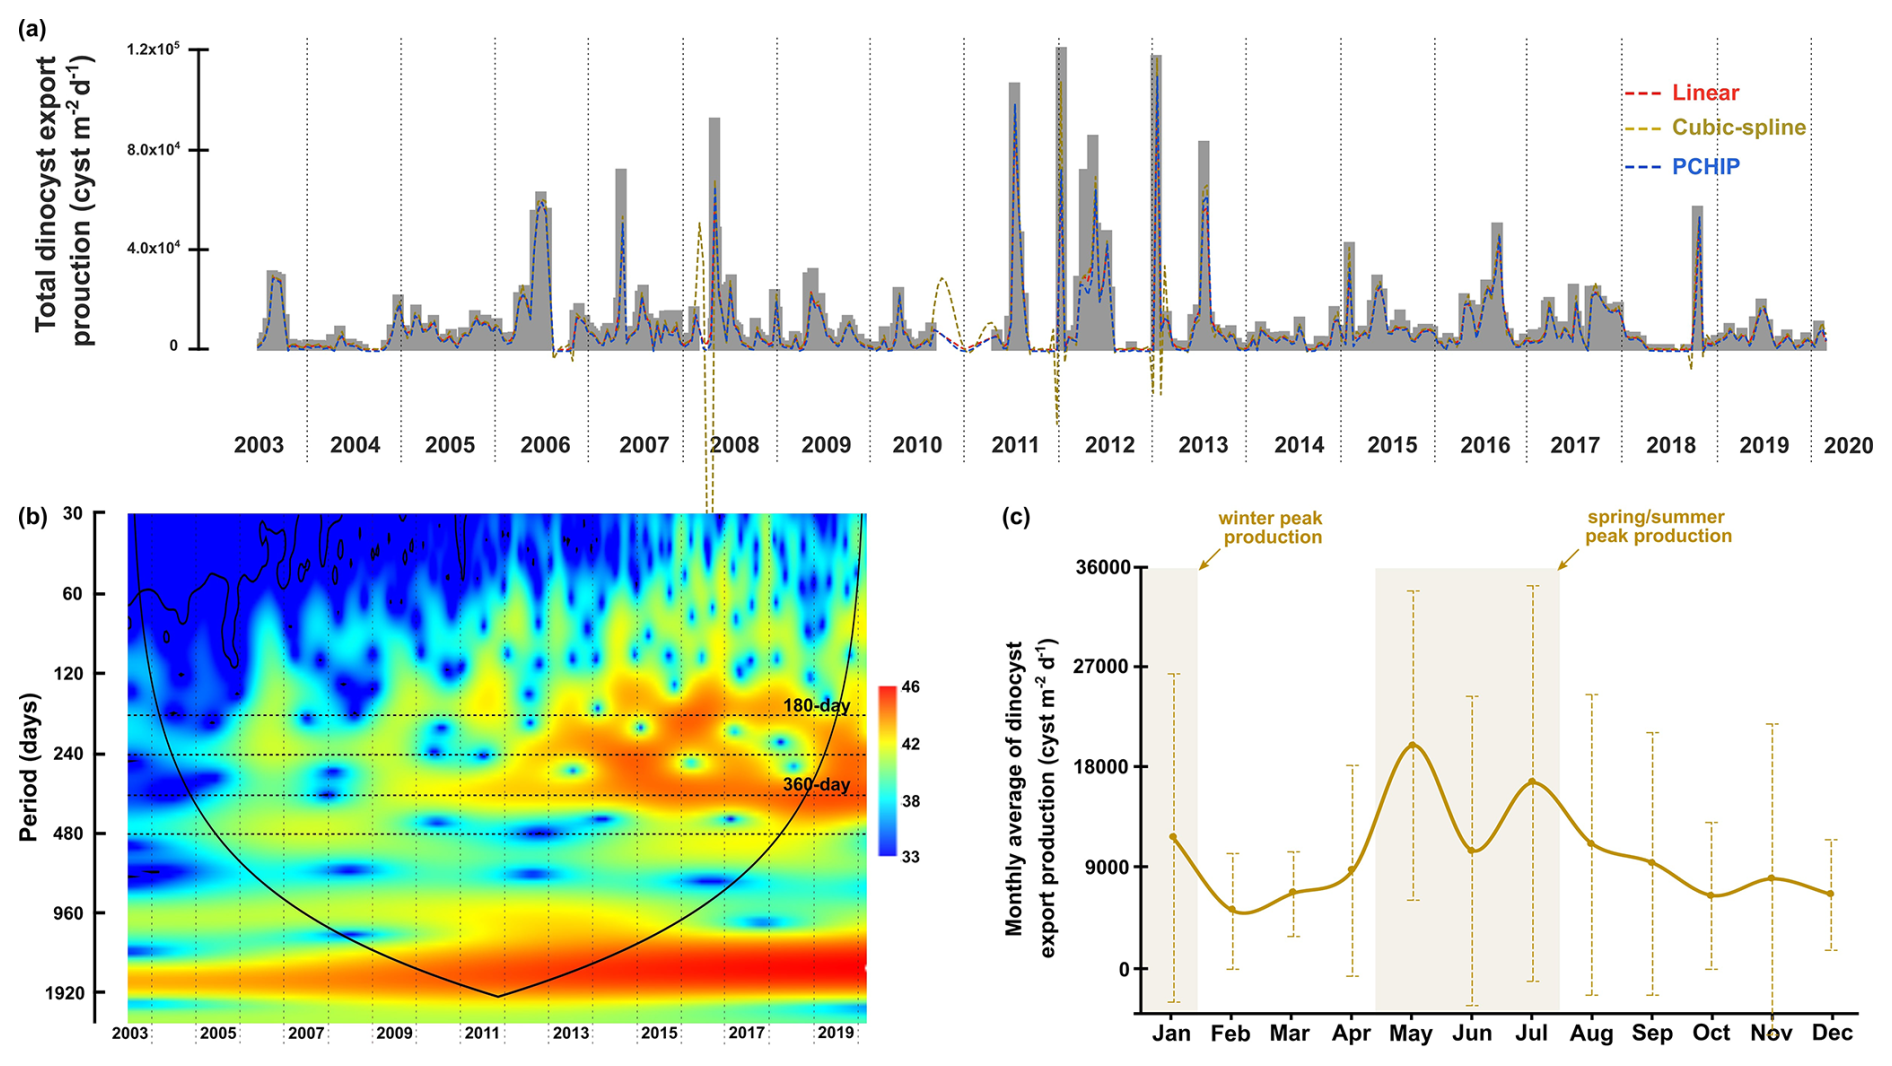
Figure 3The time series of total dinocyst export flux collected by the CBeu trap off Cape Blanc (NW African upwelling system). (a) The original time series of total dinocyst export flux in grey bars and interpolated data are represented by dashed lines with colours corresponding to each methodology. (b) The wavelet power spectra. The colour spectra indicate the different degrees of variance (ranging from high significance in red to low significance in blue), black lines indicate regions with a high level of significance (p=0.05), cone of influence surrounds the significant region of time and frequency that is not affected by the edges of the time series. (c) The monthly average flux of total dinocysts with standard deviation bars.
2.2 Dinocysts extraction, identification, and quantification
Every sample representing a split from the original trap sample was washed with tap water to remove HgCl2 and filtered using a high-precision metal sieve (Stork Veco) with a pore size of 20 µm. The samples were not treated with acids to preserve calcareous materials. The sieved sample was sonicated in an ultrasonic bath for 100 s to resuspend the fine particles. These steps were repeated until no more floating fine particles were observed in the tube. The residue samples were transferred to Eppendorf cups, centrifuged at 3000 rpm for 10 min, and successively concentrated to 1 mL. An aliquot (50 or 100 µL) was pipetted into glycerine gelatine on a microscopic slide, enclosed with a cover slip, and sealed with paraffin wax to protect the organic component from oxidation. This standard procedure refers to Romero et al. (2020) and Roza et al. (2024) sample preparation. Organic-walled dinocysts were identified under light microscopy (Zeiss Axiovert) with 400× magnification, and a minimum of 100 specimens were counted per sample. When a microscope slide did not reach this number, a maximum of two slides were counted to confirm the low cyst concentrations. Cyst taxa were identified based on the morphological characteristics documented in Zonneveld and Pospelova (2015) and van Nieuwenhove et al. (2020). The dinocyst export flux was calculated using Eq. (1):
where CC is the cyst concentration (cysts µL−1), S is the split fraction from the sampling cup, F is the fraction of the identified sample (µL−1), SS is the sampling surface of the trap funnel (m2), and SI is the sampling interval (d−1). Furthermore, the monthly average of export flux data from 2004 to 2019 was calculated and plotted using the menu “pivot table” in Microsoft Excel. Data from 2003 and 2020 were excluded because they did not cover a full year.
2.3 Environmental parameters
The atmospheric parameters of wind speed, wind direction, and dust storm frequency were obtained from the observation site at Nouadhibou Airport, located on the peninsula of Cape Blanc, Mauritania, around 176 km to the east of the sediment trap (Fig. 2a). Information about the surface wind systems and Saharan dust emissions were reported in the form of decoded synoptic values every day in intervals of three hours. For the wind direction, the synoptic values were transformed into the vector values of wind speed relative to its direction. The equations (Eq. 2) of wind direction vectors were adapted from a report by Grange (2014), stating that:
where ui is wind speed (m s−1) and θi is wind direction (°). Meanwhile, the aerosol dust data were transcribed from the horizontal visibility distance at the airport, which was decreased when the dust storm activity from the Sahara intensified. The time series of the surface wind and dust input in daily resolution were available from January 2003 to December 2017 (Fig. 5a, d, and g).
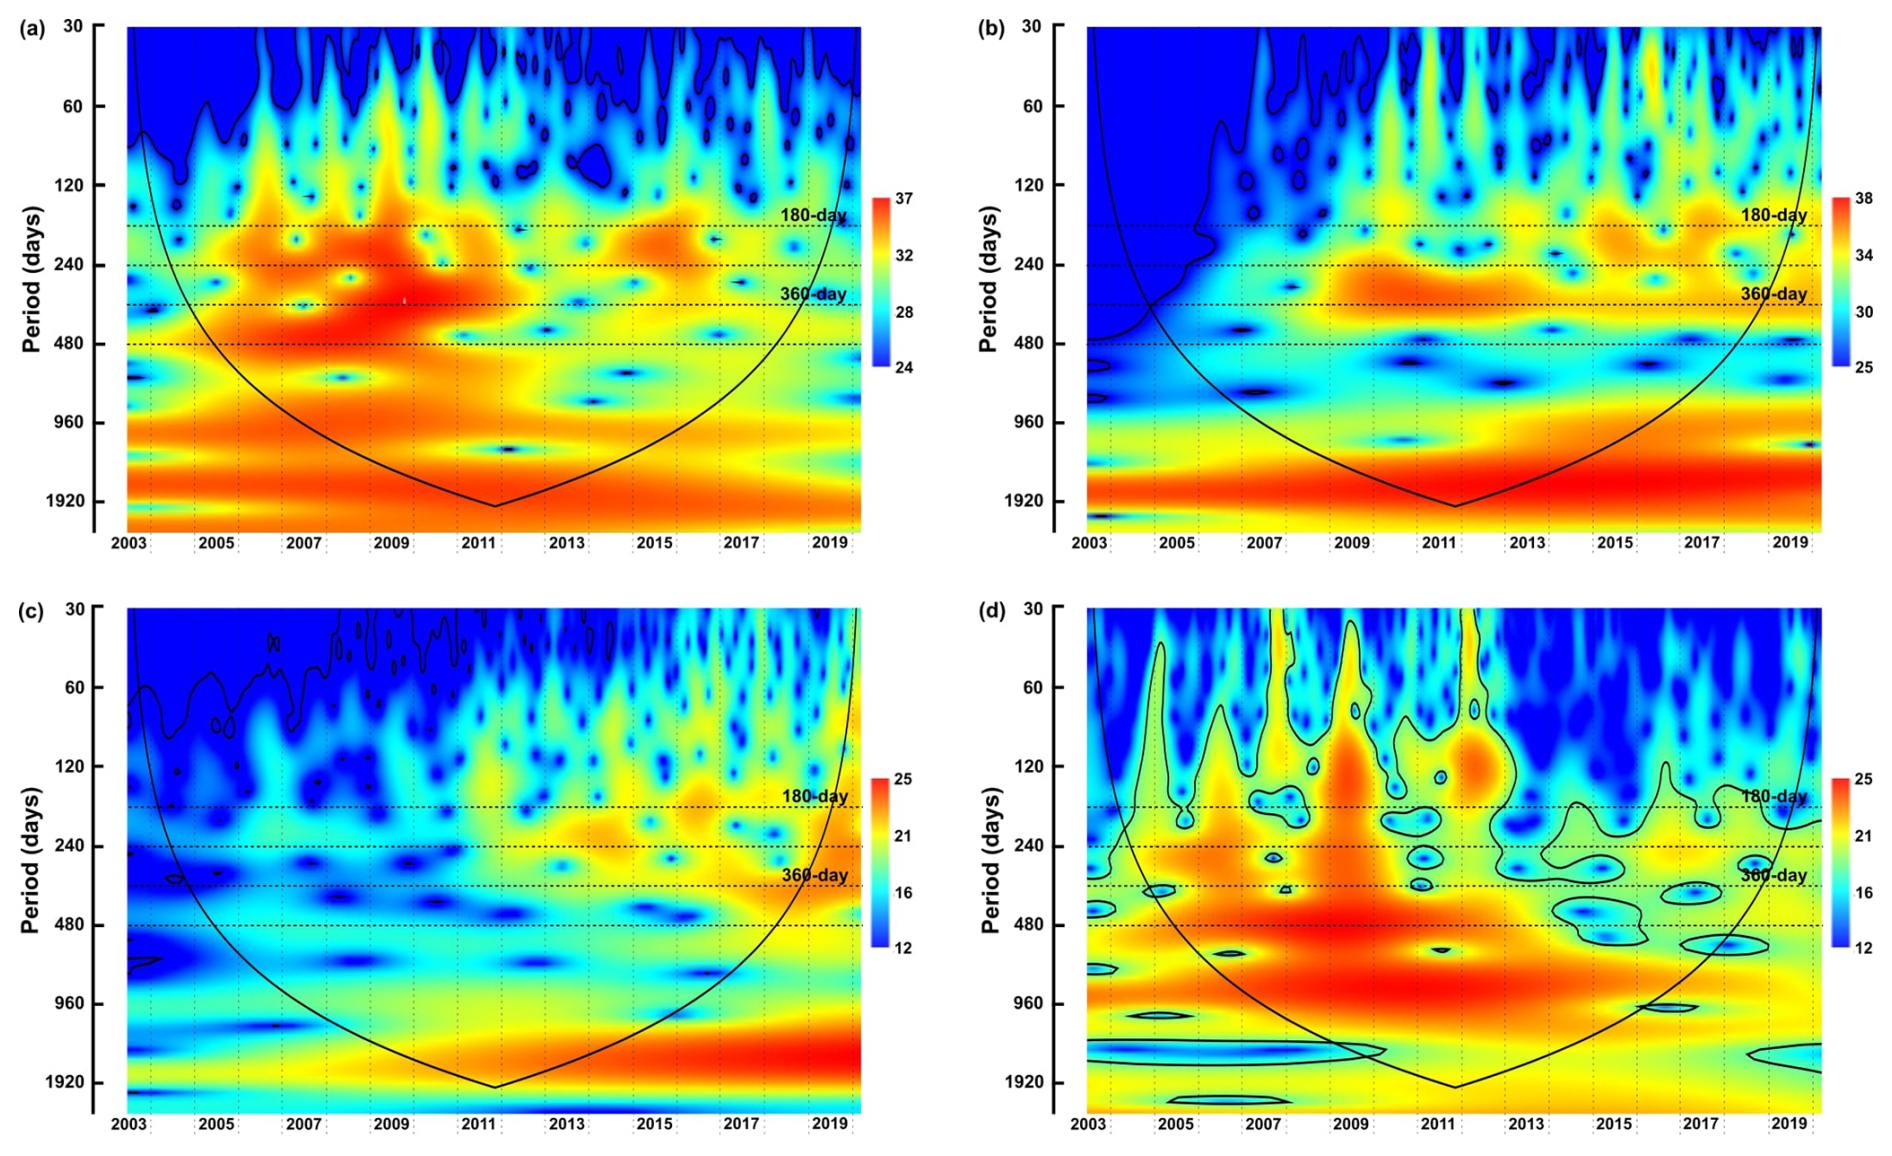
Figure 4The wavelet power spectra of dinocyst groups with similar ecological traits: (a) upwelling+dust group, (b) upwelling group, (c) cosmopolitan group, (d) upwelling relaxation group. Explanations of wavelet components follow the caption in Fig. 3.
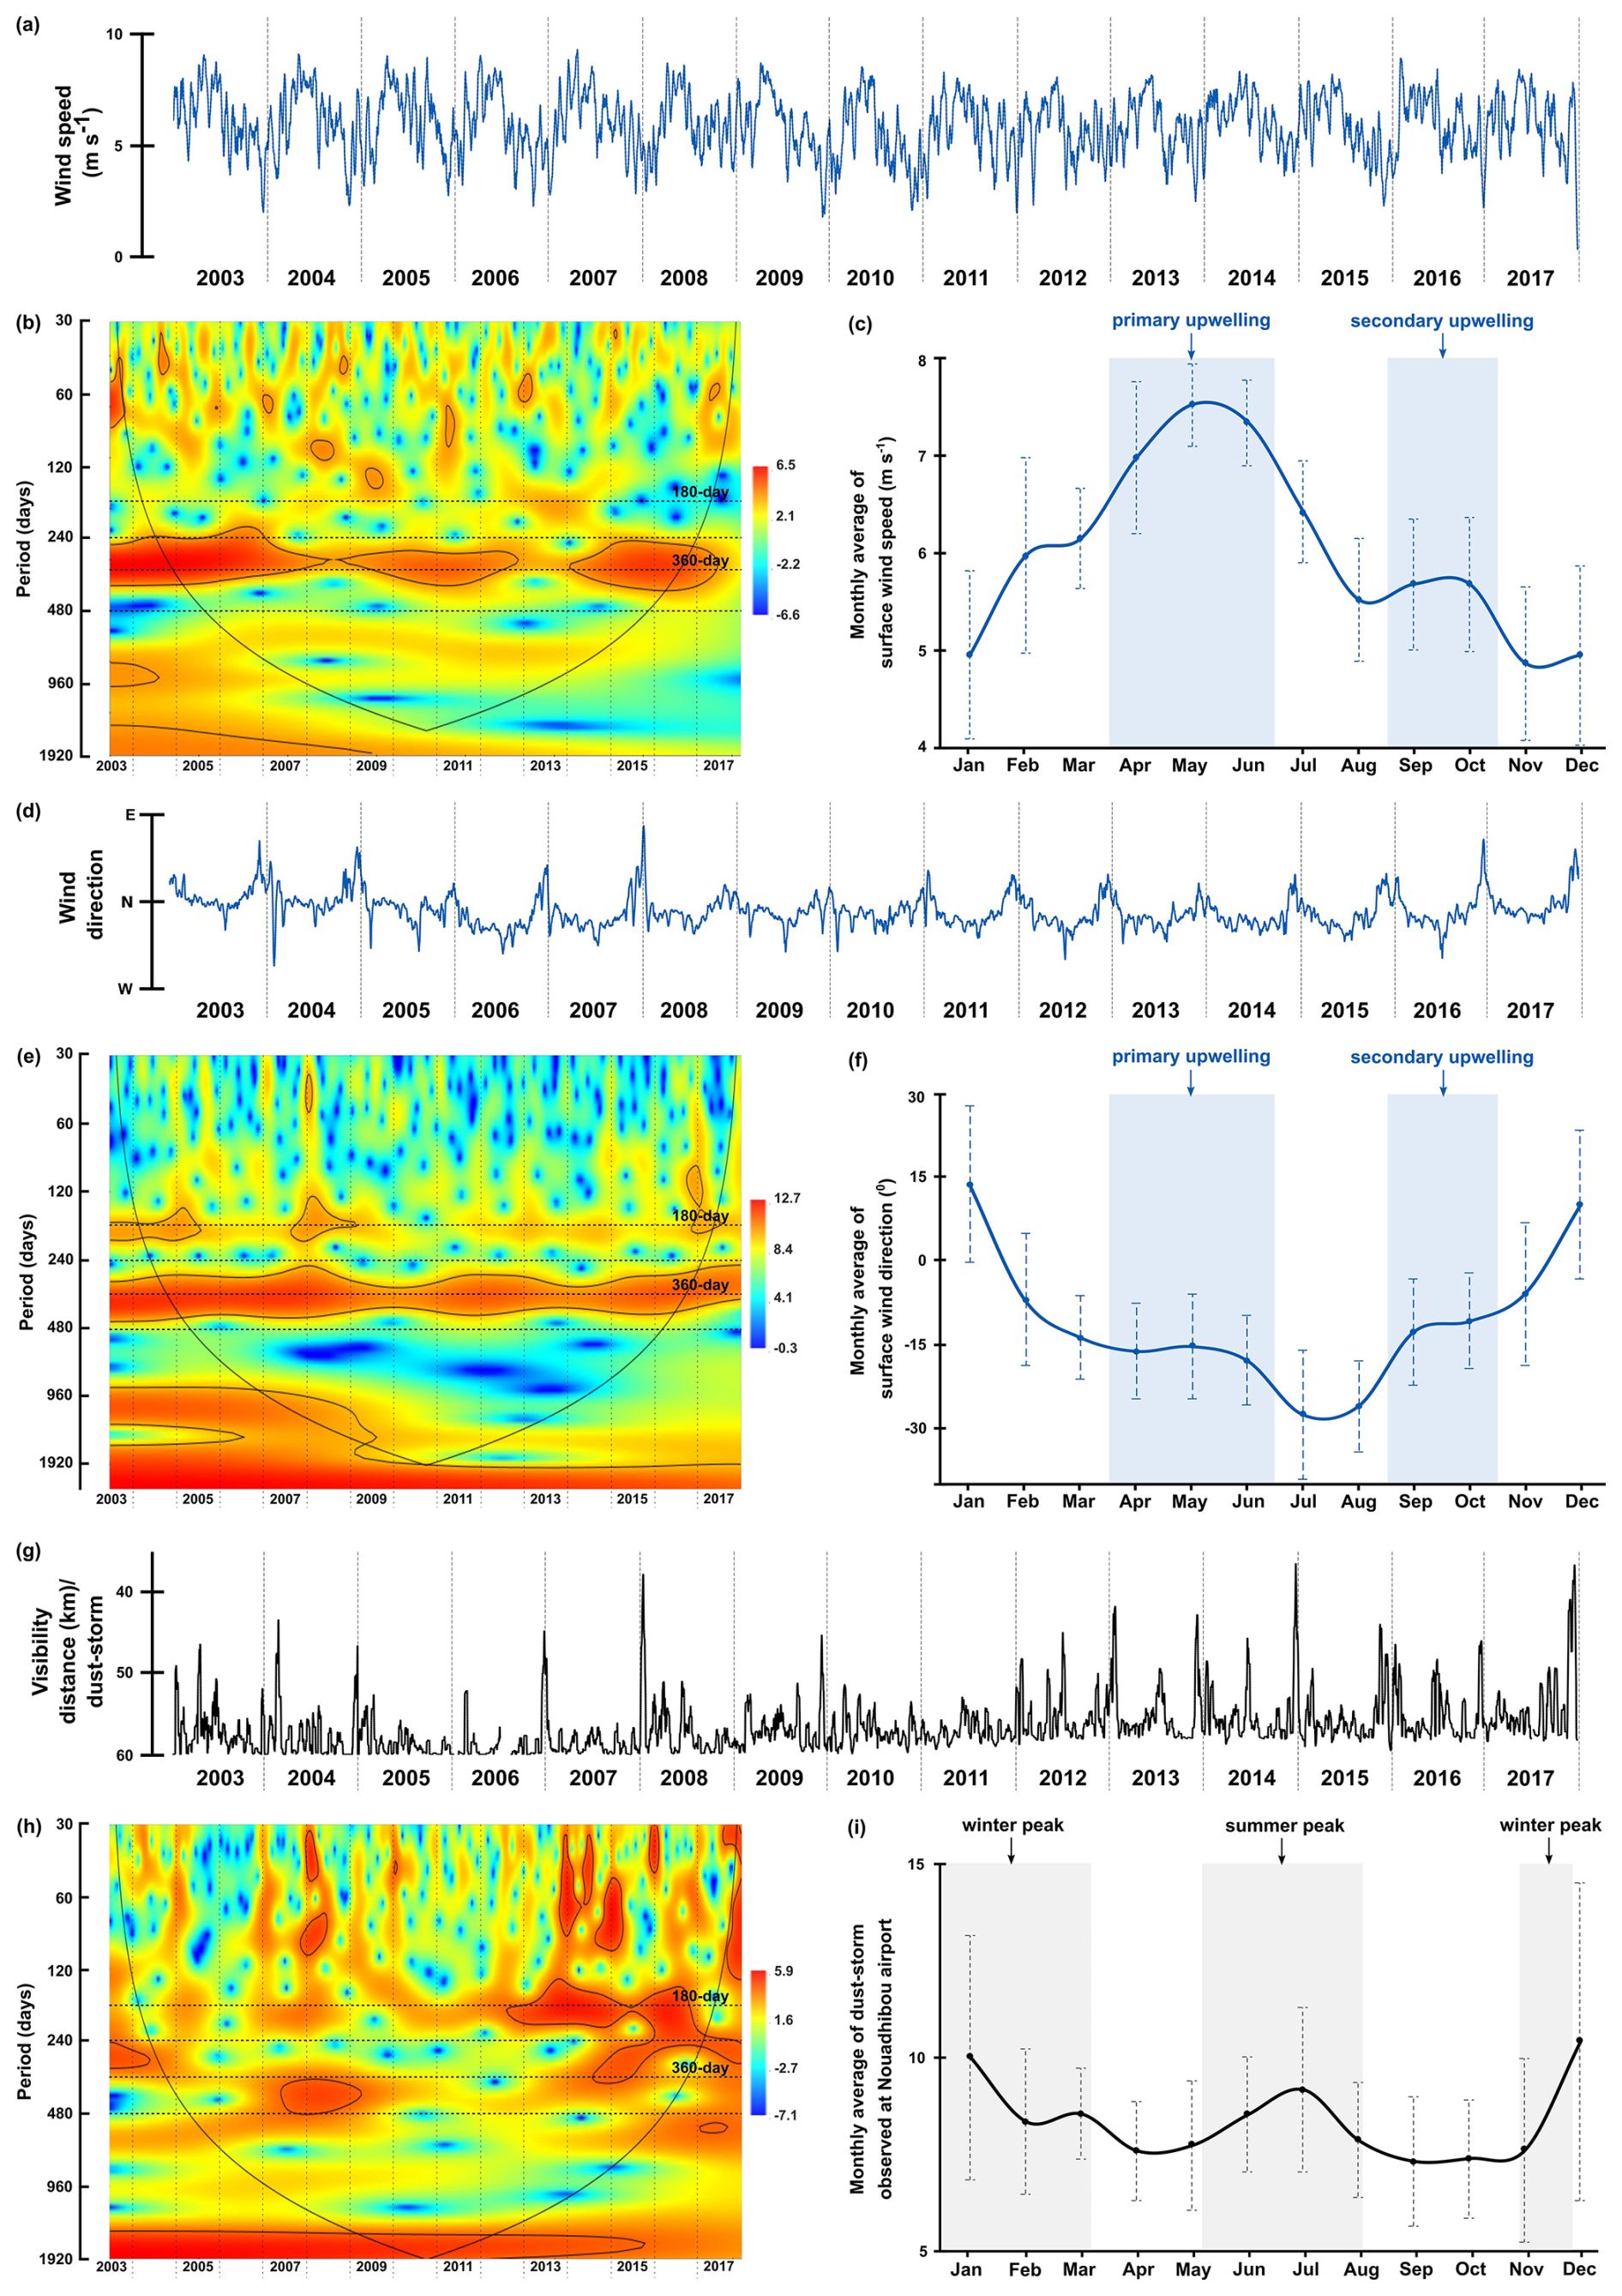
Figure 5The original time series, wavelet power spectra (left) and the monthly average values (right) of surface wind speed(a–c), surface wind direction (d–f), and frequency of dust storm events (g–i) observed at the Nouadhibou airport. Explanations of wavelet components follow the caption in Fig. 3.
Additional aerosol dust data were obtained from NASA AERONET through the Aerosol Optical Depth (AOD) level 2.0 at various altitudes near Cabo Verde. AERONET (Aerosol Robotic Network) is a ground-based sun photometer that measures aerosol properties through several approaches, including aerosol optical depth (AOD) (Fig. 6a). The AOD algorithm records various light wavelengths reflected by the aerosol particles, providing a relative indication of dust concentration in the atmosphere (see Holben et al., 1998). These data, particularly the reflected light at 440 nm wavelength, generated the aerosol dust time series observed at 16°43.9′ N and 22°56.1′ W, which is located approximately 635 km southwest of the sediment trap. The AOD datasets can be downloaded from the NASA AERONET database (https://aeronet.gsfc.nasa.gov/new_web/units.html, last access: 29 April 2024).
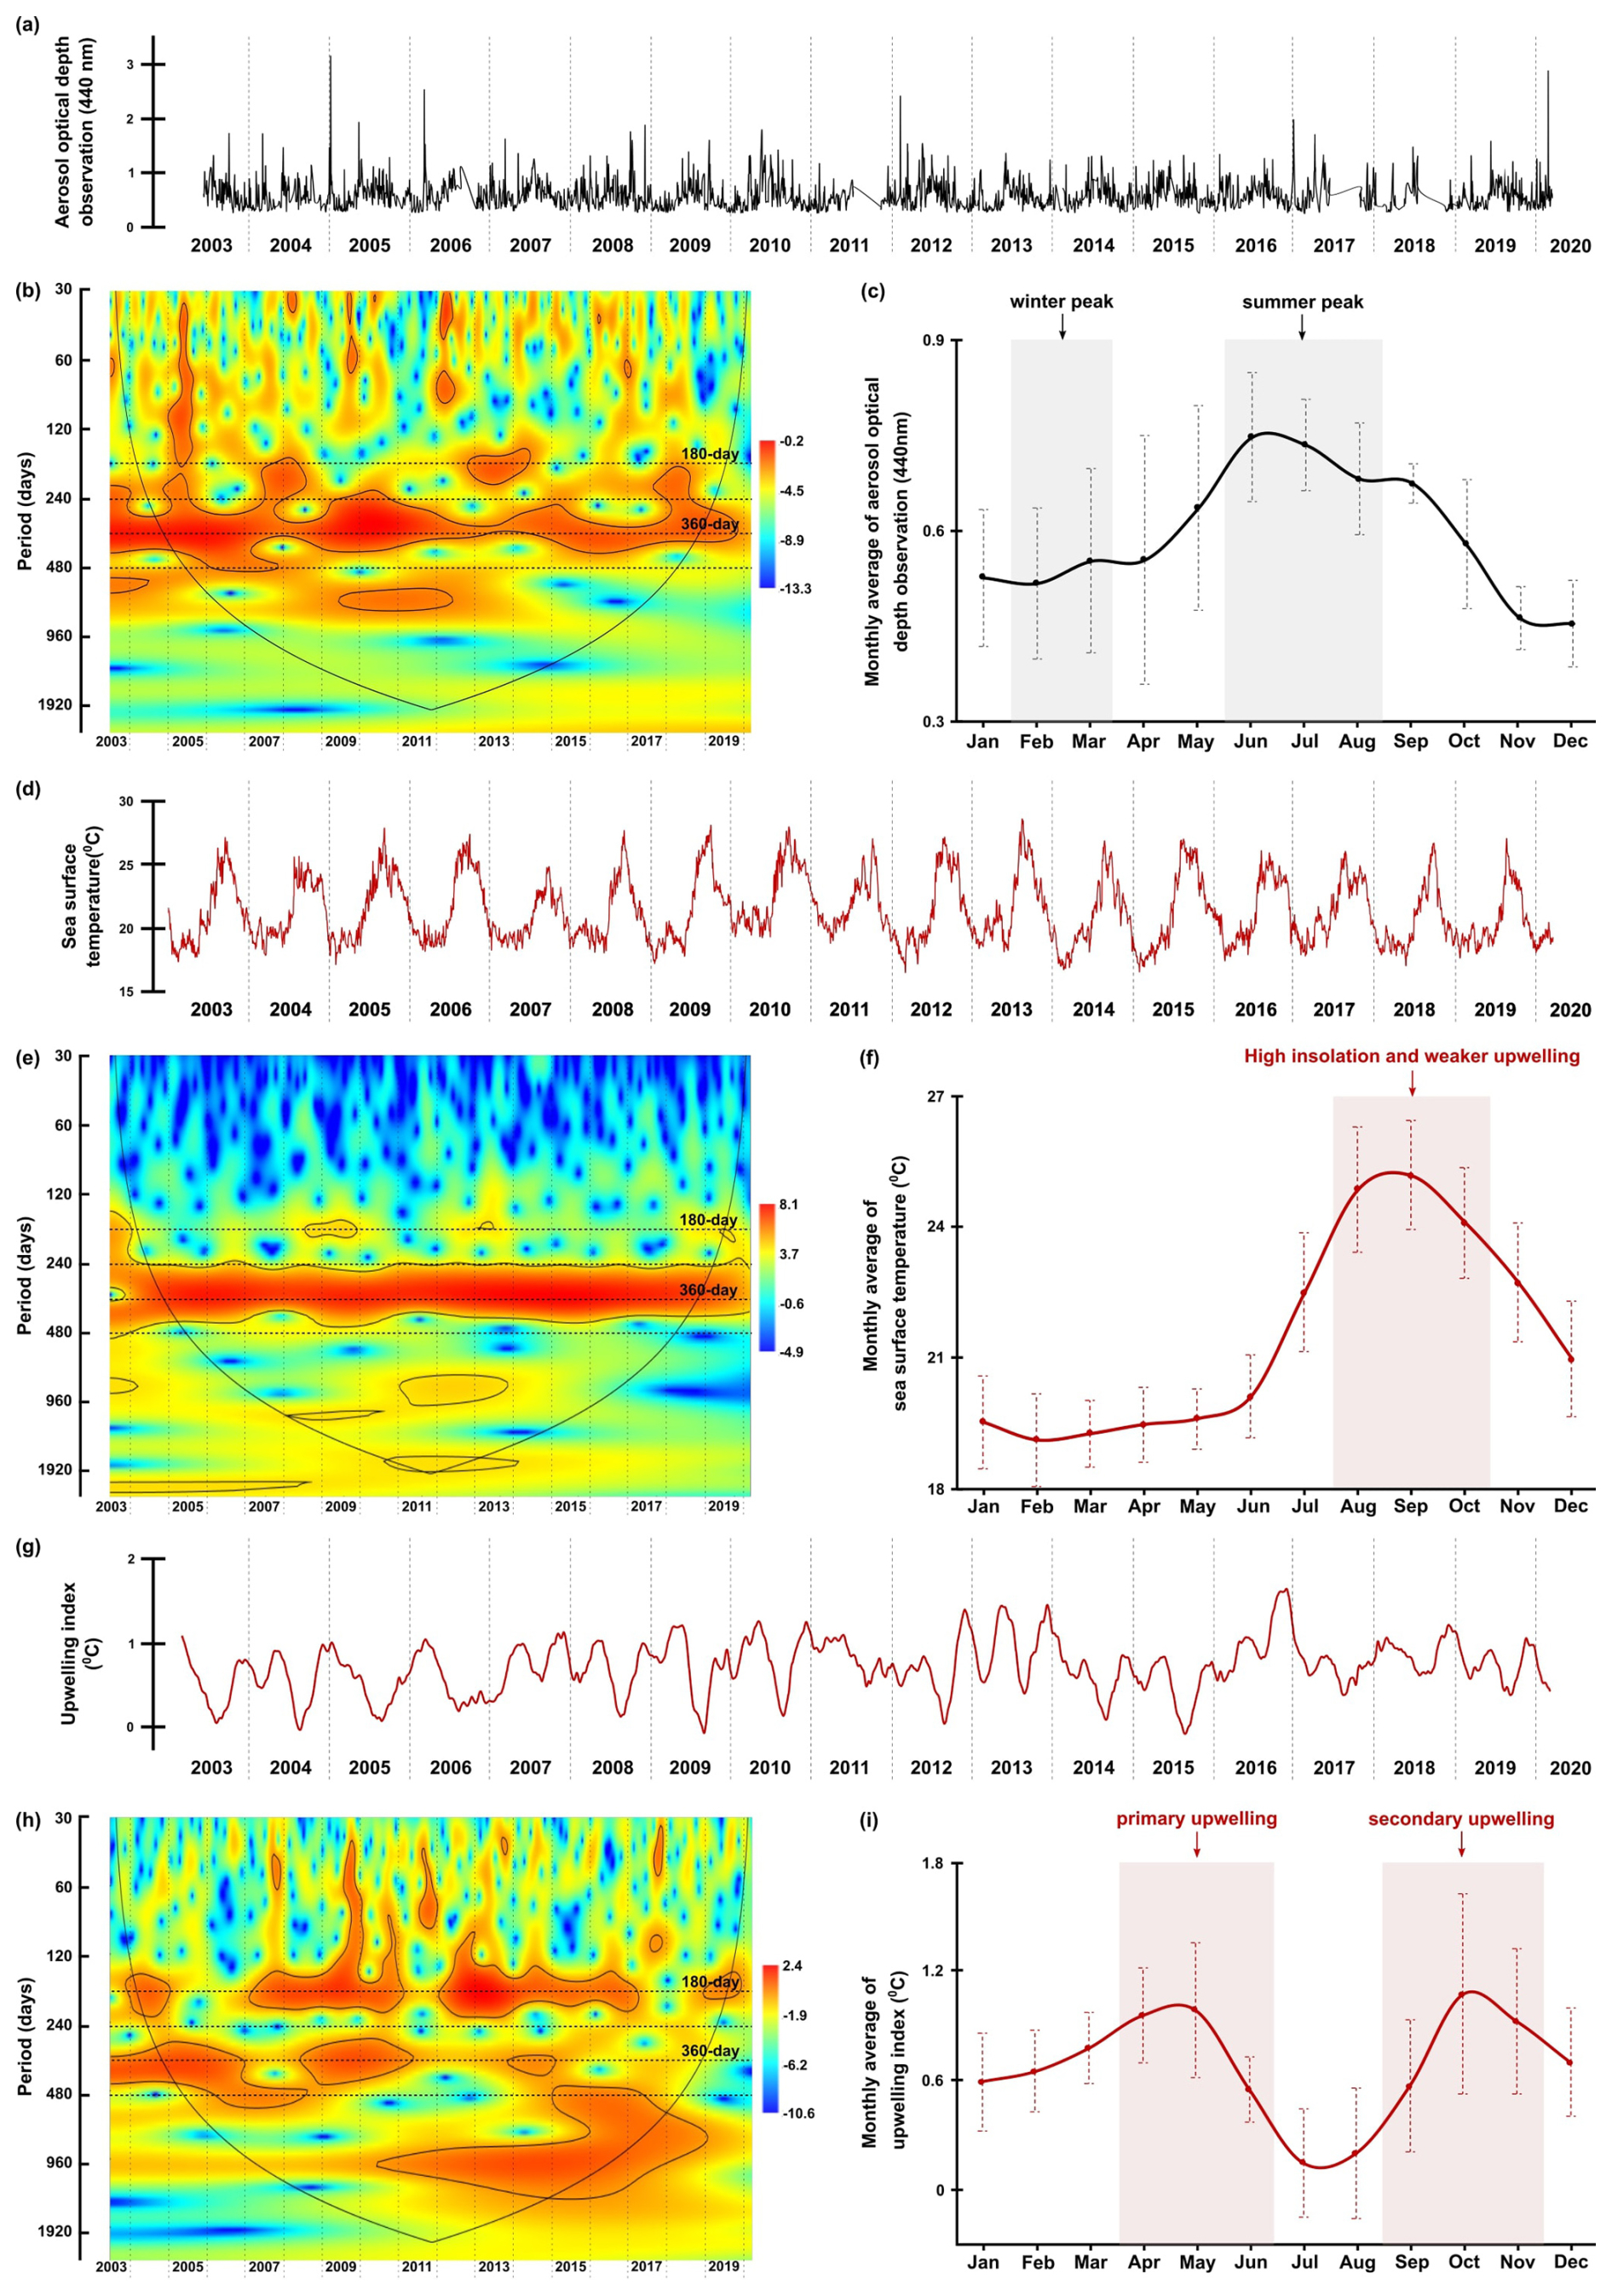
Figure 6The original time series, wavelet power spectra (left) and the monthly average values (right) of aerosol dust concentration (a–c) (aerosol optical depth) observed in Cabo Verde by NASA AERONET satellite, sea surface temperature (d–f), and upwelling index (g–i). Explanations of wavelet components follow the caption in Fig. 3.
Sea surface temperature (SST) and local upwelling index (UI) at daily resolution cover the period from January 2003 until March 2020 (Fig. 6d–g). The UI time series represents the SST difference between the trap location and 200 km further offshore at the same latitude (Cropper et al., 2014; Fischer et al., 2016). These time series were obtained from the ERDDAP data server provided by the National Center for Environmental Information (NCEI) at the vicinity area (4 km grid) of the CBeu trap. Those data can be accessed through the griddap page of ERDAPP, which lists detailed information regarding the data type, e.g., resolution, sources, locations, and available time span. For example, the downloaded dataset for this study is titled SST, daily optimum interpolation (OI), AVHRR Only, version 2.1, Final, Global, 0.25°, 1981–present, Lon ±180°. Furthermore, the Data Access Form can address the specification of the time span, depth, and coordinates of the desired dataset. For this study, the sea surface temperature dataset was downloaded from 1 June 2003 until 30 March 2020, located at 20°22.5′ N and 18°22.5′ W. This database is accessible at https://coastwatch.pfeg.noaa.gov/erddap/griddap/index.html (last access: 29 April 2024). A time lag of 10 d was estimated for all environmental parameters to account for the sinking duration of dinocysts (Fischer and Karakaş, 2009; Iversen and Ploug, 2013). Lastly, the monthly average values for each parameter were calculated using the same procedure as for the dinocyst time series.
2.4 Time series analyses
Wavelet analysis is a frequency-analysis technique that can examine one or more time series in two dimensions: period and time (e.g., Andronov, 2020). However, wavelet analysis requires evenly spaced time resolutions, while the dinocysts export flux time series had unequal sampling intervals ranging from 3.5 to 22 d. In addition, gaps in the dinocyst export flux time series contributed to the variation in time resolutions, with a maximum interval of 255 d. To convert the time series to evenly spaced intervals, a mean interval of 15 d has been calculated for the dinocyst and the environmental parameters data. The missing data in all of the time series were interpolated using the Piecewise Cubic Hermite Interpolating Polynomial (PCHIP) method (Fritsch and Carlson, 1980). This method was selected because its outcome reflected the characteristics of the original data better than the linear and cubic-spline methods (Fig. 3a). We performed this interpolation using MATLAB version R2019a. For the Morlet wavelet transformation, we used the Paleontological Statistics “PAST” software version 4.03 with the “Timeseries – Wavelet transform” package (Hammer et al., 2001). Since the wave amplitudes of time series in nature consist of continuous variations, a nonorthogonal analysis, such as the Morlet wavelet, was applied in our in-situ time series (Torrence and Compo, 1998). This technique is suitable for detecting a clearer periodic pattern in complex time series that consists of real and imaginary components (Torrence and Compo, 1998). The Morlet wavelet provided a coherence coefficient between the wavelet functions and the examined time series, represented in different colour spectra. The coherence colour scale increases from blue (low significance) to red (high significance) (see Fig. 3b). Continuous bands of warm colour spectra in certain periods were interpreted as a cyclic indication, which was tested using periodogram spectral analysis, also done in PAST (see Fig. A1). These analyses were executed on time series of the total dinocyst and four groups of dinocyst taxa export fluxes: upwelling+dust group, upwelling group, cosmopolitan group, and upwelling relaxation group. The taxon composition of the individual groups is given in Table 1. We also performed wavelet and spectral analyses on the following environmental variables: wind speed, wind direction, dust storm frequency, aerosol dust, sea surface temperature at the sediment trap location and the difference in sea surface temperature at the trap location and open ocean (local upwelling index). Moreover, the time series of total dinocyst flux was compared with each parameter using wavelet cross-correlation. This analysis was executed in R using the “WaveletComp” package and the programming codes documented in Rösch and Schmidbauer (2018).
Table 1The taxon list of dinocyst groups according to their relationship to the environmental preferences at the trap site, as established by Roza et al. (2024). The names in brackets are the motile names affiliated with the cyst, while dinocyst taxa with the asterisk symbol (*) are those whose motile names have not been described at the species level.
3.1 Wavelet analyses of the dinoflagellate cyst time series
The wavelet power spectrum of dinocyst export flux revealedfour significant bands, corresponding to different periodicities: 180 d (half-year cycle), 240 d, 360 d (annual cycle), and 480 d (Fig. 3b). All of these periodicities, except for 480 d, are also shown and peaked in the periodogram of spectral analysis (see Figs. A1 and A2). The expression of these periods in wavelet analyses varied over time in the time series of the total dinocyst export flux and four species groups, categorised based on their similar ecological preferences, as described by Roza et al. (2024) (Table 1). The dinocyst time series can be divided into three distinct phases:
-
Phase I (2003–2008): This phase is characterised by insignificant half-year and annual cycles and more pronounced power bands at 240 and 480 d in the total cyst export flux time series. These two pronounced bands were also observed in the time series of group A (upwelling+dust) and group D (upwelling relaxation) (Fig. 4a and d).
-
Phase II (2009–2012): During this phase, the total dinocyst export flux displayed strong power bands for the half-year and annual cycles (180 and 360 d). Groups A and B (both associated with upwelling) showed a strong annual cycle (Fig. 4a and b). The bands of these cycles were generally less pronounced in groups C (cosmopolitan) and D, but became more assertive in group C towards the end of phase II. Dinocysts of group D exhibited a significant 480 d band during this phase (Fig. 4d).
-
Phase III (2013–2020): The total dinocyst export flux showed stronger and intertwined half-year and annual cycles. Group A indicated a brief occurrence of both half-year and annual cycles, as well as the 240 d period (Fig. 4a). Group B showed somewhat intense half-year and annual cycles (but the annual cycle was of lower intensity than in the previous phase) (Fig. 4b). In group C, these three periods were more pronounced than in previous phases (Fig. 4c), while in group D, they were generally weak, but the 240 d period was the most noticeable (Fig. 4d).
3.2 Wavelet analyses of the environmental parameters
The time series of environmental parameters generally showed significant power bands of 180 and 360 d periods, representing the half-year and annual cycles, although their distributions and intensities varied across different environmental factors. The occurrence of these cycles was confirmed by spectral analysis, which showed that they peaked at almost all parameters (see Fig. A3). In the time series of wind speed, wind direction, the dust concentration measured through aerosol optical depth (AOD) by NASA AERONET satellite in Cabo Verde, and sea surface temperature (SST), the annual cycle was much more significant than the half-year cycle indicated by the colour of the power band and the marking of the significance lines (p=0.05) (Figs. 5b, 5e, 6b, and 6e). In some of these time series, the same three different phases observed in the total dinocyst export flux can be distinguished: Phase I (2003–2008), Phase II (2009–2012), Phase III (2013–2020). The transition between these phases in the wind speed time series, at ∼2008 and ∼2013, was characterised by weaker annual power bands, which were not highlighted by the significance lines (Fig. 5b). Although less pronounced, the transition of the three phases can also be observed in dust concentration (AOD) and wind direction time series. The annual power bands of dust concentration (AOD) became weaker and narrower at the same transition years (Fig. 6b), whereas the annual power bands of wind direction displayed the same condition but appeared a little bit later (Fig. 5e). In contrast, the SST displayed undisturbed annual cycle bands, indicating no phase differences in this time series (Fig. 6e).
The half-year cycle band was not significant in the SST time series (Fig. 6e), but it was expressed stronger in the wind direction time series (Fig. 5e). The half-year cycle showed more significant and consistent power bands in the time series of dust storms observed from the Nouadhibou Airport and upwelling index (UI). The annual cycle became less pronounced in Phase II, whereas the half-year dust storm intensity (Nouadhibou) intensified during Phase III (Fig. 5h). Other warm spectra that occurred in each environmental parameter were not looked into further because they could not be compared with all time series of dinocysts. The annual and half-year cycles in the UI time series showed high variability, but the temporal variation did not match the distribution of the three phases mentioned earlier (Fig. 6h).
4.1 Annual cycle in dinoflagellate cysts and environmental parameter time series
The wavelet analyses generally showed significant annual cyclicities in all environmental factors and total dinocyst export flux time series. The annual cycle in the wind system presented the highest intensity of the wind speed coming from the north to northwest of our trap location, which was usually detected in spring (April–June) (Fig. 5c and f), even though sometimes it started from late winter or stretched into early summer (Cropper et al., 2014; Fischer et al., 2016; Roza et al., 2024). The temporal occurrence of this wind speed maximum was driven by the southward migration of the Intertropical Convergence Zone (ITCZ), which allows the trade winds to blow stronger along the northwest African coast (Faye et al., 2015; Sylla et al., 2019). This coastal wind mechanism accommodated the upwelling events in this region, bringing up nutrient-rich subsurface waters that nourished the bloom of phytoplankton, including dinoflagellates (Chen et al., 2021; Picado et al., 2023). Most of the dinocysts collected by the sediment trap were produced by heterotrophic dinoflagellates, which dynamics depended on the concentration of their preys (such as phytoplankton), as shown by the results of diatom and coccolithophore export fluxes from the same sediment trap (e.g., Romero et al., 2021; Romero and Ramondenc, 2022). Therefore, we observe enhanced dinocyst export flux from May until June (Fig. 3c), explaining the general coupling observed between total dinocyst export flux, particularly groups A and B (upwelling+dust and upwelling indicator taxa, respectively) and surface wind dynamics that showed strong annual cycles (Fig. 7a), notably in phase II and III (Fig. 4a and b). Although the annual peaks occurred in spring and summer, the total dinocyst export flux varied over 18 years. Except for February, March, October, and December, the variation in total dinocyst export fluxes was relatively high (Fig. 3c), a common trend observed in other sediment trap records from various locations (García-Moreiras et al., 2025). The cross-correlation analyses of total dinocyst flux with the upwelling wind parameters showed highly significant bands of annual and half-year cycles (Fig. 8a and b), confirming our interpretation. It is expected that most arrows in Fig. 8b point to the left, indicating an anti-phase relationship between wind direction and total dinocyst flux. This case is caused by the north to northwest winds, entered as negative values, which were compared with the dinocyst export flux when it increased.
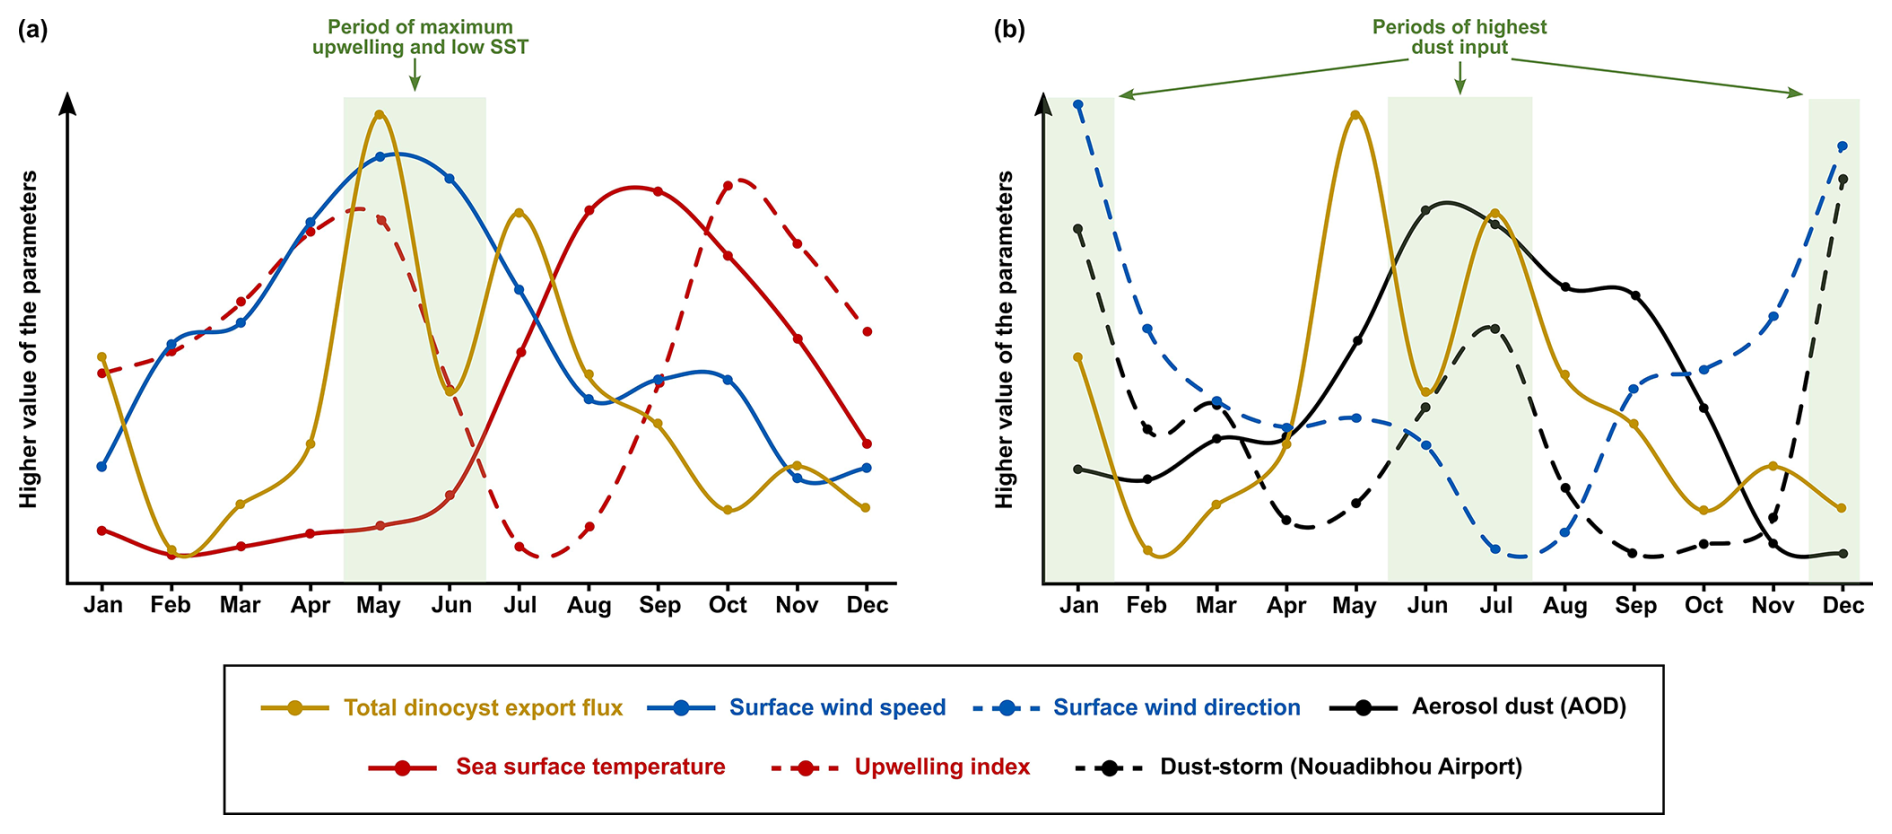
Figure 7The comparison of monthly average data of total dinocyst export flux time series (yellow lines) from 2003 until 2020 with the environmental parameters showcasing (a) the dinocyst export flux peak in spring coincided with the highest upwelling intensity, and (b) the dinocyst export flux peaks in winter and summer coincided with the highest intensity of dust input.
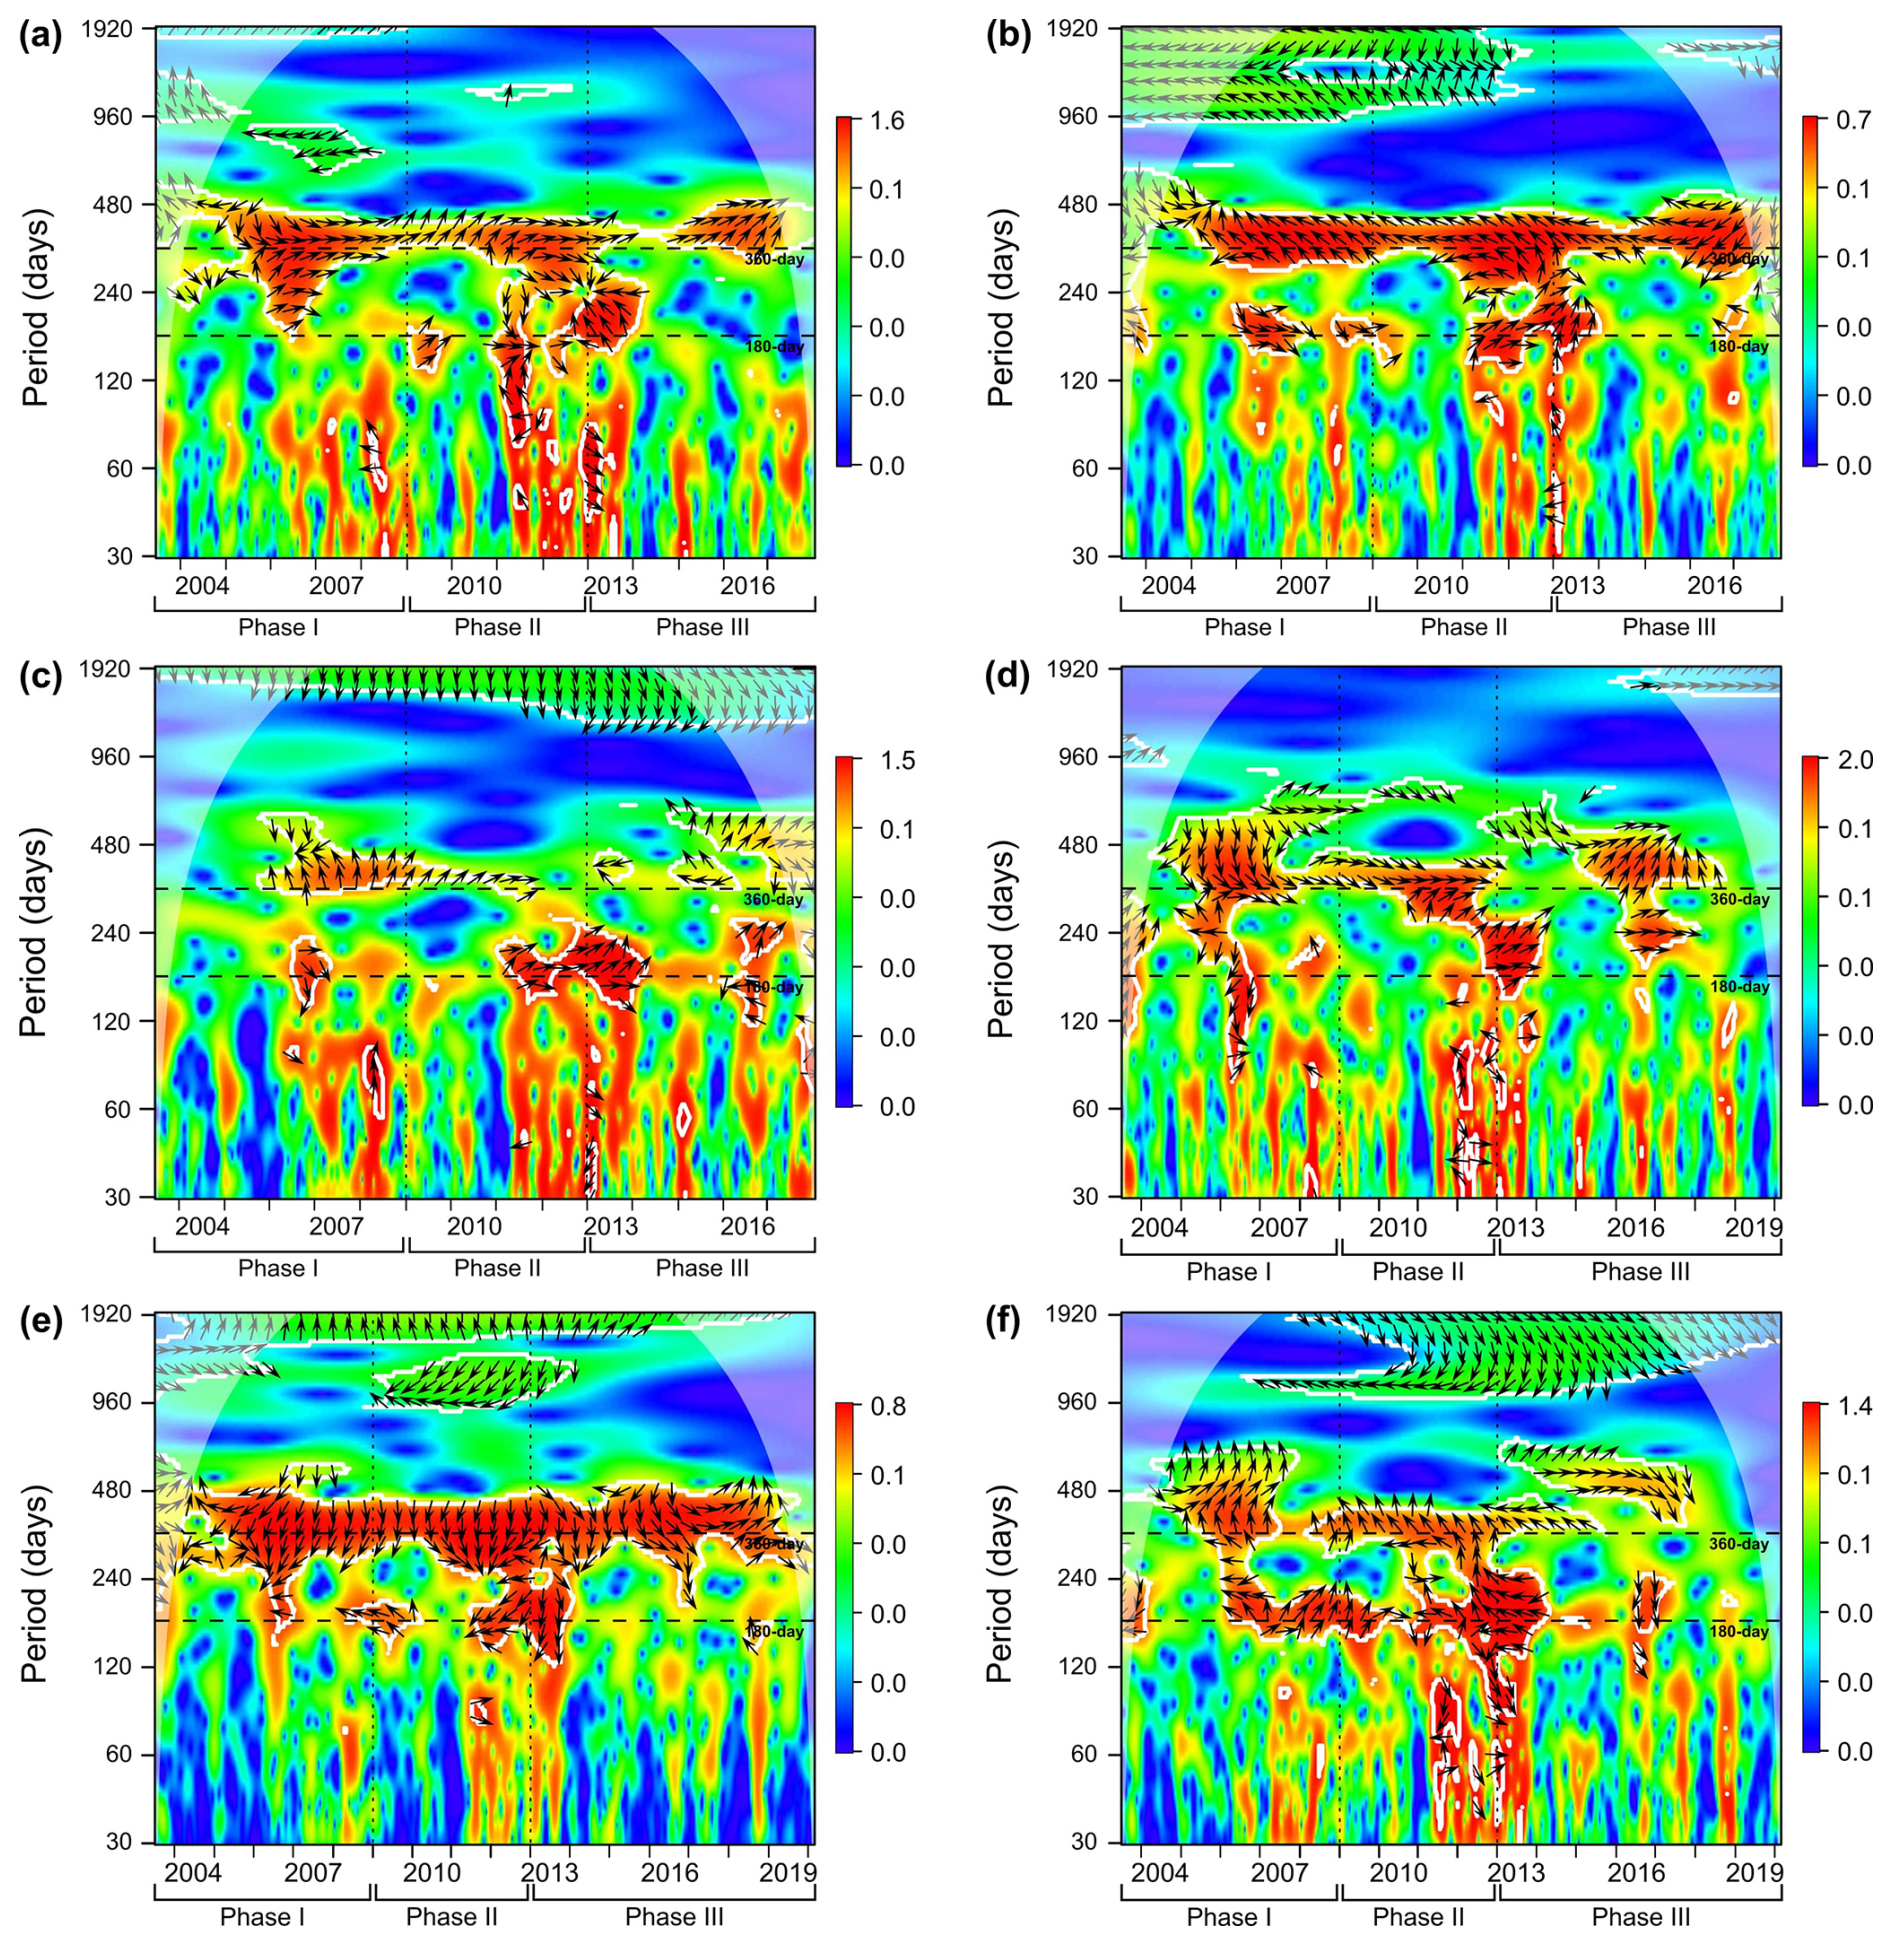
Figure 8The wavelet cross-correlation analyses between time series of environmental parameters (t1): (a) surface wind speed, (b) surface wind direction, (c) dust storm events (Nouadhibou airport), (d) aerosol dust concentration (Cabo Verde), (e) sea surface temperature, (f) upwelling index; and total dinocyst export flux (t2). The colours of wavelet spectra indicate correlation level, white solid lines represent lines of significance, transparent grey area marks the cone of influence, vertical dashed lines indicate phase separation, and the black arrows explain the type of correlation. Arrows pointing to the left indicate anti-phase correlation, while arrows facing right represent in-phase correlation. Upward arrows indicate that t1 is leading t2, while downward arrows represent the opposite case.
In addition to promoting upwelling, surface winds also transport dust particles from the Sahara, which contribute to fertilising the ocean, increasing phytoplankton growth, and eventually increasing dinocyst export flux (Lohan and Tagliabue, 2018; Wyatt et al., 2023). As in the wind time series, a strong annual cycle in the dust time series was observed in the dust storm frequency at Nouadhibou airport and aerosol optical depth (AOD) in Cabo Verde (Figs. 5h and 6b). The maximum dust emission in the studied area usually occurred in winter (December–February) and sometimes extended to spring (Fischer et al., 2016; Roza et al., 2024). Despite the time difference with the occurrence of the upwelling winds, the high transport of dust was still favoured during the boreal winter when ITCZ migrated southward. Annual cycles of both dust records (Cabo Verde and Nouadhibou) showed different patterns over time. The dust time series from the Nouadhibou airport showed a weak annual cycle in dust storm frequency from 2005 to 2006 and from 2010 to 2013 but strongly expressed the half-year cycle (Fig. 5h). Conversely, the annual cycle in dust concentration recorded in Cabo Verde was significant every year (Fig. 6b). This difference may be due to the differences in dust mobilisation between the two observation locations, with different altitudes and distances from the dust source. Cabo Verde is situated further to the southwest of Nouadhibou airport, so sources of emitted dust in boreal winter and summer could differ depending on the trade wind distribution in these two locations (van der Does et al., 2016; Yu et al., 2019). In addition, dust emission in Cabo Verde was observed by a satellite that combined dust concentrations at various altitudes, resulting in a higher peak in summer (Fig. 6c). Although the speed of the surface winds was relatively weaker in winter compared to spring and summer, these winds blew from the continent (northeast), where Saharan dust originated. In comparison, dust storm events were observed from lower altitudes at the Nouadhibou airport, where the dust load displayed the highest peak in winter (Fig. 5i). Furthermore, the dust storm data were derived from the limited range of human visibility observed at the Nouadhibou airport, which can be reduced by sandstorm activity in the Sahara region where this airport is situated. The shorter visibility was translated to higher intensity of dust storm events. The satellite versus human-based observation techniques contributed to the differences between the two dust-related time series. However, both dust records hinted at the intensification of dust emission in winter and summer, coinciding with the higher export flux of dinocysts in both seasons (Fig. 7b). In wavelet cross-correlations, these two dust time series also demonstrated a different relationship with the total dinocyst record. The airport observation data showed a strong correlation with dinocyst export flux in the half-year cycle (Fig. 8c), whereas the satellite (Cabo Verde) data exhibited a significant correlation in the annual cycle (Fig. 8d).
The annual sea surface temperature (SST) is usually driven by insolation into the ocean surface, with the maximum insolation usually occurring during boreal summer (June–August) in the northern hemisphere (Bae et al., 2022; Faye et al., 2015). The tropical region impacted by high insolation has higher precipitation rates and lower air pressure that changes in time with the movement of the ITCZ (Vindel et al., 2020; Bae et al., 2022). However, the primary upwelling in spring and early summer might attenuate surface water warming by bringing colder subsurface waters, keeping the SST low until late summer and autumn (August–October) when SST starts increasing (Fig. 6f) (Faye et al., 2015). As a result, SST reached its highest temperature once every year when the effect of primary upwelling weakened (Fig. 7a). The SST dynamics were confirmed in the wavelet power spectrum, where only the annual cycle was pronounced (Fig. 6e). Furthermore, an anti-phase correlation was shown in the wavelet cross-corelation between SST and total dinocyst flux indicated by many arrows facing left in the annual cycle band (Fig. 8e). It can be concluded that the annual peak export flux of dinocysts in the studied area thrived under strong upwelling, high dust input, and low SST (Fig. 7).
4.2 Other periodicities in dinoflagellate cysts and environmental parameter time series
Besides the annual cycle, the wavelet power spectra showed 240 d, 480 d, and half-year cycles. The 240 and 480 d periods were only detected in the dinocyst time series. Therefore, no relationship between these period occurrences in the total dinocyst export flux and the studied environmental parameters could be drawn, and further study is required to investigate the possible driving factors. A significant power band close to 1920 d, which is equivalent to period of 1818 d shown by spectral analysis (Figs. A1 and A2), also occurred in time series of the total dinocyst export flux and all dinocysts group except for group D, pointing out to a period of around five years (Fig. 3b). However, the dinocyst record spans only 18 years, which means further investigation is required to see if the five-year period remains consistent in a more extended time span of this sediment trap series.
On the other hand, the half-year cycle was significant in a few time series, namely wind direction, dust storm frequency (Nouadhibou airport), and UI, as well as in the total dinocyst export flux. The half-year cycle in the wind direction was observed when the trade winds blew from a north or northwest direction, coinciding with the strongest wind speed from April until June and the slight increase (second peak) in September and October, which we called the primary and secondary upwelling respectively (Fig. 5c and f). The first maximum dust emission occurred during winter, and the second usually occurred in summer with a lower peak (Figs. 5i and 6c). In the UI time series (calculated by the temperature differences between areas influenced by upwelling and offshore), the most significant occurrence of the half-year cycle coincided with the primary upwelling in spring/summer (April–June) and once more in autumn (September–November) (Fig. 6h and i). This result indicates the existence of the second period of upwelling with weaker intensity in the area that was not clearly represented in the wind speed time series (Fig. 5a). The half-year cycle was also observed in the total dinocyst time series, coinciding with the high winter dust emission (January–February) as well as a combination of intensive upwelling and summer dust emission (May–July) (Fig. 3c). Although the correlation between upwelling winds and dust with total dinocyst time series is much more prominent in the annual cycle, the wavelet cross-correlation still confirmed sporadic occurrences of correlated half-year cycle in each time series of upwelling winds and dust (Fig. 8a–d). The cross-correlation graph of dinocyst export flux with UI showed that, most of the time, the half-year and annual cycles were in an anti-phase (left arrows) relationship (Fig. 8f). This result explains that UI was not a steering factor in enhancing dinocyst export flux; rather, it can be used to indicate upwelling mechanisms if surface wind time series are unavailable. In agreement with the findings of the annual cycle correlation between environmental parameters and total dinocyst production, the half-year cycle in total dinocyst export flux can be mainly explained by upwelling intensity and dust emission dynamics.
4.3 Impact of local climate change on the Canary Current Upwelling Ecosystem reflected by the dinoflagellate cyst assemblage
The advantage of wavelet analysis is to facilitate the visualisation of changes in the strength of cycles over time in a time series. Thus, this method was applied to the muti-year series of total dinocyst export flux off Cape Blanc to detect shifts in the dinocyst composition from 2003 until 2020 and link it to environmental factors that drove the changes. As mentioned earlier, wavelet power bands of the annual and half-year cycles of total dinocyst fluxes hinted at three phases. In the total dinocyst production time series, the half-year and annual cycles became significant from phase II (2009–2012) and strengthened in phase III (2013–2020) (Fig. 3b). This consistent increase was observed in the half-year and annual cycles of dust storm frequency (Nouadibhou) time series (Fig. 5h). Meanwhile, half-year and annual cycles in upwelling wind speed and dust emissions (AOD) did not show the same linear increase from Phase I until Phase III (Figs. 5b and 6b). Despite their disparities in interannual variability patterns, the changes in the annual cycles of those two parameters chronologically matched those in the total dinocyst time series. Furthermore, the wavelet cross-correlation also revealed that the annual cycle band showed three distinct zonations in the separation years, when the total dinocyst was compared with upwelling wind speed and dust emissions (AOD) time series (Fig. 8a and d).
In addition to the strengthened cyclic pattern from Phase I to III, the intensity of the dust storm frequency showed a consistent increase from 2008, when Phase I ended. A similar result was reported by Rodríguez et al. (2015), who found an increase in the atmospheric pressure differences from the summer of 2008, where the subtropics (Morocco) indicated maximum high pressure and the tropics (Bamako region) showed minimum low pressure. This report suggested an ITCZ southward shift scenario because this convergence belt moves to areas with lower atmospheric pressures (Arbuszewski et al., 2013; Rodríguez et al., 2015; Mamalakis et al., 2021). Supporting this finding, Mamalakis et al. (2021) conducted a reconstruction of the global mean position of ITCZ from 1983 to 2005 (baseline), and they established a model to predict the movement of this zone in the future to 2100. Their model suggests that the ITCZ in the East Pacific-Atlantic sector will move southward by 0.7° ± 0.9° from its original baseline from 2007 onwards. A southward shift of the ITCZ position would lead to stronger surface trade winds and more aridity in the Sahara regions (North Africa), which would lead to more intensified upwelling and more dust emission to the (sub)tropical part of the North Atlantic Ocean (Rodríguez et al., 2015). This hypothesis is supported by the record of total dinocyst production reflecting more pronounced occurrences of the annual and half cycles in Phase II (2009–2012) and even stronger in Phase III (2013–2020). In addition, the half-year and annual cycles of upwelling+dust taxa (group A) became significant in Phase II and briefly in Phase III, and upwelling taxa (group B) showed more pronounced half-year and annual cycles in Phases II and III. In contrast, the upwelling relaxation group (group D) showed insignificant half-year and annual cycles from the beginning of Phase II and continued until Phase III. This scenario was also demonstrated by wavelet cross-correlation, which exhibited that the annual cycle of upwelling wind speed and dust emission (AOD) was at a lagging state in Phase I (downward arrows) relative to the total dinocyst production, starting to lead in Phase II (mixed signals), and entirely at leading conditions (upward arrows) in Phase III (Fig. 8a and d). This latter indicates that upwelling winds and dust emission drove the cyclic production of total dinocysts from Phase II and consistently became more influential in Phase III. Based on these observations, we could determine that cyclic variabilities in total dinocyst production (Fig. 3b) were driven by different ecological groups in each phase (Fig. 4), which were primarily influenced by upwelling wind dynamics and assisted by Saharan dust input. This new result also supports the assessment of dinocyst ecological groups previously reported by Roza et al. (2024). From all of these findings, we can utilise variabilities in dinocyst assemblages over time as indicators not only of changes in present but also past environmental conditions, due to the high preservation potential of dinocysts in sediment archives. However, the intensification of the cyclic pattern can not be associated with increased total dinocyst export flux, which rose during most of Phase II and declined again in Phase III (Fig. 3a). This flux trend also did not align with the interannual changes in upwelling wind speed, dust emissions (AOD), and dust storm frequency (Nouadibhou), considering their positive impact on dinocyst export flux in this area. The latter indicates that dinocyst flux was not only controlled by nutrient concentrations but also influenced by more complex processes in the upper water column until they were accumulated and preserved in the sediment floor.
The observed changes in the half-year and annual cycles of total dinocyst export flux from Phase I to Phase III (June 2003–March 2020) hinted at some connections to upwelling wind and dust dynamics, which might be caused by the southward movement of the ITCZ position. This shift may be driven by decreasing air pressure and rising air temperature in the south of the Northwest Africa upwelling region, which is the climatic condition where ITCZ will migrate (Arbuszewski et al., 2013; Mamalakis et al., 2021). The three-step change in dinocyst taxon composition suggests that the change in the upper ocean ecosystem of this upwelling area reacted stepwise on the climate change-induced southward movement of the ITCZ. Our results demonstrate that a long record of dinocyst (plankton) export flux may be very helpful in investigating the impact of climatic changes in a specific region by comparing the dinocyst record with sea surface water conditions and atmospheric data.
Wavelet analyses performed on the dinocyst export flux from the 18 year sediment trap and environmental records off Cape Blanc (NW African upwelling system) allowed the detection of periodicity, duration, and variance in cyclic changes in wind speed, wind direction, dust storm events, aerosol dust, sea surface temperature and upwelling index and better interpret the response of the ecosystem to climate change through changes in the dinocyst time series. Significant annual cycles were detected in all records, and a prominent half-year cycle was found in the total dinocyst export flux, wind direction, aerosol dust observed in Carbo Verde, and upwelling index (UI) time series. Both annual and half-year cycles in dinocyst export flux time series can be mainly explained by upwelling intensity and dust emission dynamics, which depend on surface wind speed and direction. The annual highest dinocyst export flux occurred in spring and summer, which was induced by primary upwelling (May–June) and summer dust peak (June–July). The dinocyst export flux was also enhanced during the winter dust peak in December and January.
The pattern of half-year and annual cycles in dinocyst export flux, surface wind speed, and Saharan dust input varied over the years, showing three clear phases. Throughout these phases, various patterns were also observed in the different groups of dinocysts, according to their ecological preferences (upwelling+dust group, upwelling group, cosmopolitan group and upwelling relaxation group):
-
Phase I (2003–2008): Half-year and annual cycles were insignificant in the total dinocyst record but prominent in most environmental records. The upwelling+dust group mainly represented the periodicities of the total dinocyst export flux in this phase.
-
Phase II (2009–2012): both cycles were observed in the total dinocyst record, with the annual cycle being the most pronounced in the upwelling dinocyst group. These periodicities were also observed in wind speed, direction, and dust dynamics.
-
Phase III (2013–2020): both cycles were more strongly pronounced in the spectra of the upwelling and cosmopolitan groups.
The three-step change demonstrated that upwelling significantly enhanced the dinocyst export flux from Phase 2 and further strengthened in Phase 3, when the flux was also influenced by Saharan dust input. Moreover, the southward movement of the Intertropical Convergence Zone (ITCZ) is suspected to have driven the shifts of those environmental parameters. This new result has notably contributed to the knowledge of the dinocyst ecology, which can be applied to improve their use as environmental indicators of modern and past upwelling ecosystems. In addition, the observed coupling between the annual and half-year cycles of the dinocyst export flux and trade wind dynamics evidenced the high reactivity of dinocysts to changes in the offshore ecosystems of the Northwest African upwelling system, highlighting the use of dinoflagellate cysts as a (paleo)climatic proxy.
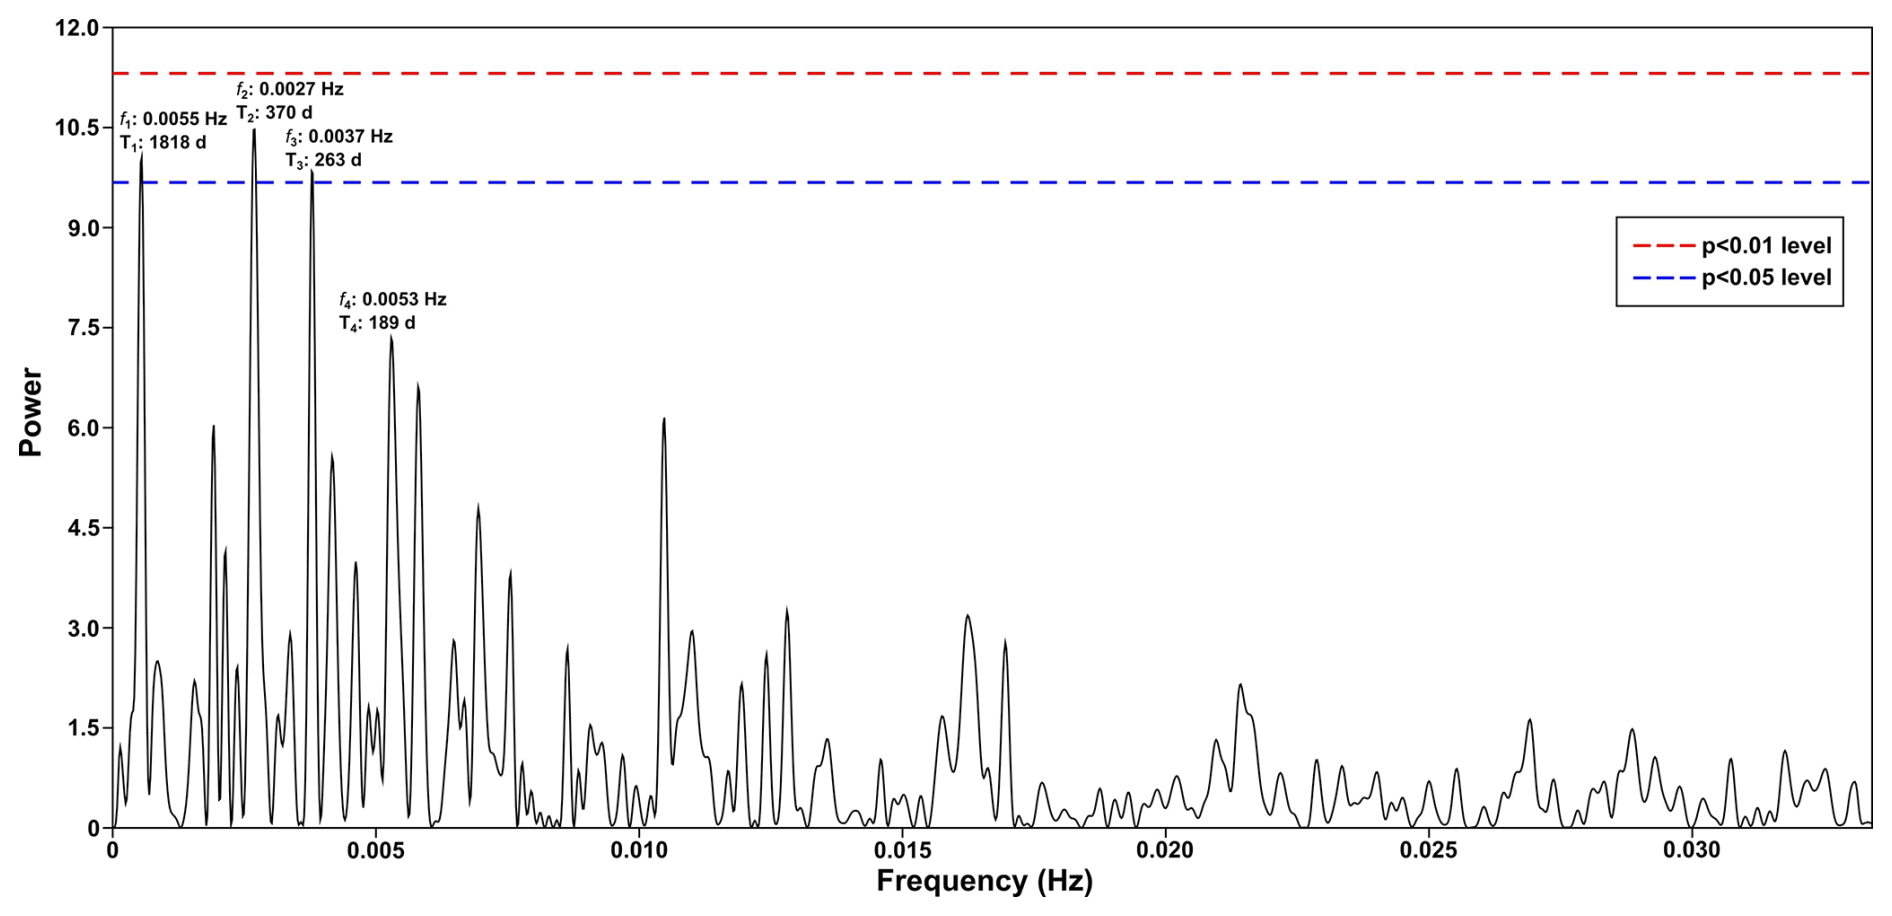
Figure A1Periodogram of spectral analysis applied to the time series of total dinocysts export flux. This graph depicts the four highest frequencies (f) equivalent to periods (T) that occurred in the wavelet power spectra, of which three periodicities cross the significance line (p<0.05).
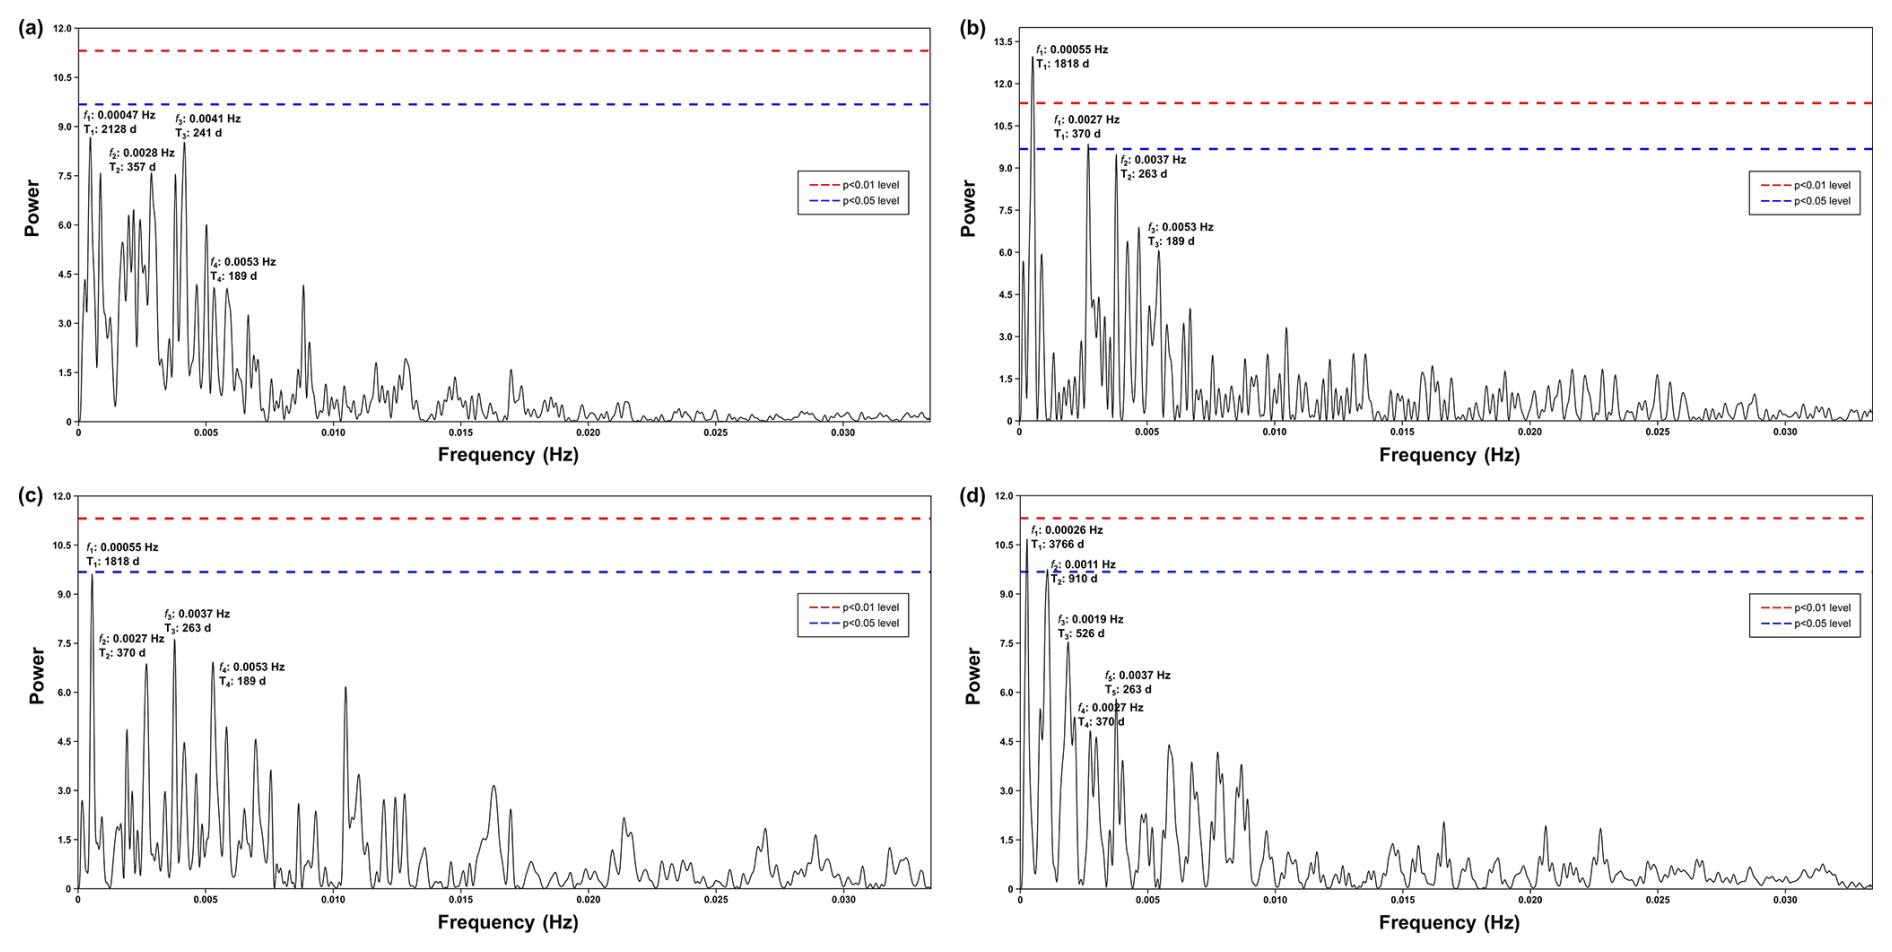
Figure A2Periodogram of spectral analysis in time series of (a) upwelling+dust group, (b) upwelling group, (c) cosmopolitan group, and (d) upwelling relaxation group. This graph shows that the annual and half-year cycles are clearly depicted in the upwelling and cosmopolitan groups, complementing their respective wavelet power spectra.
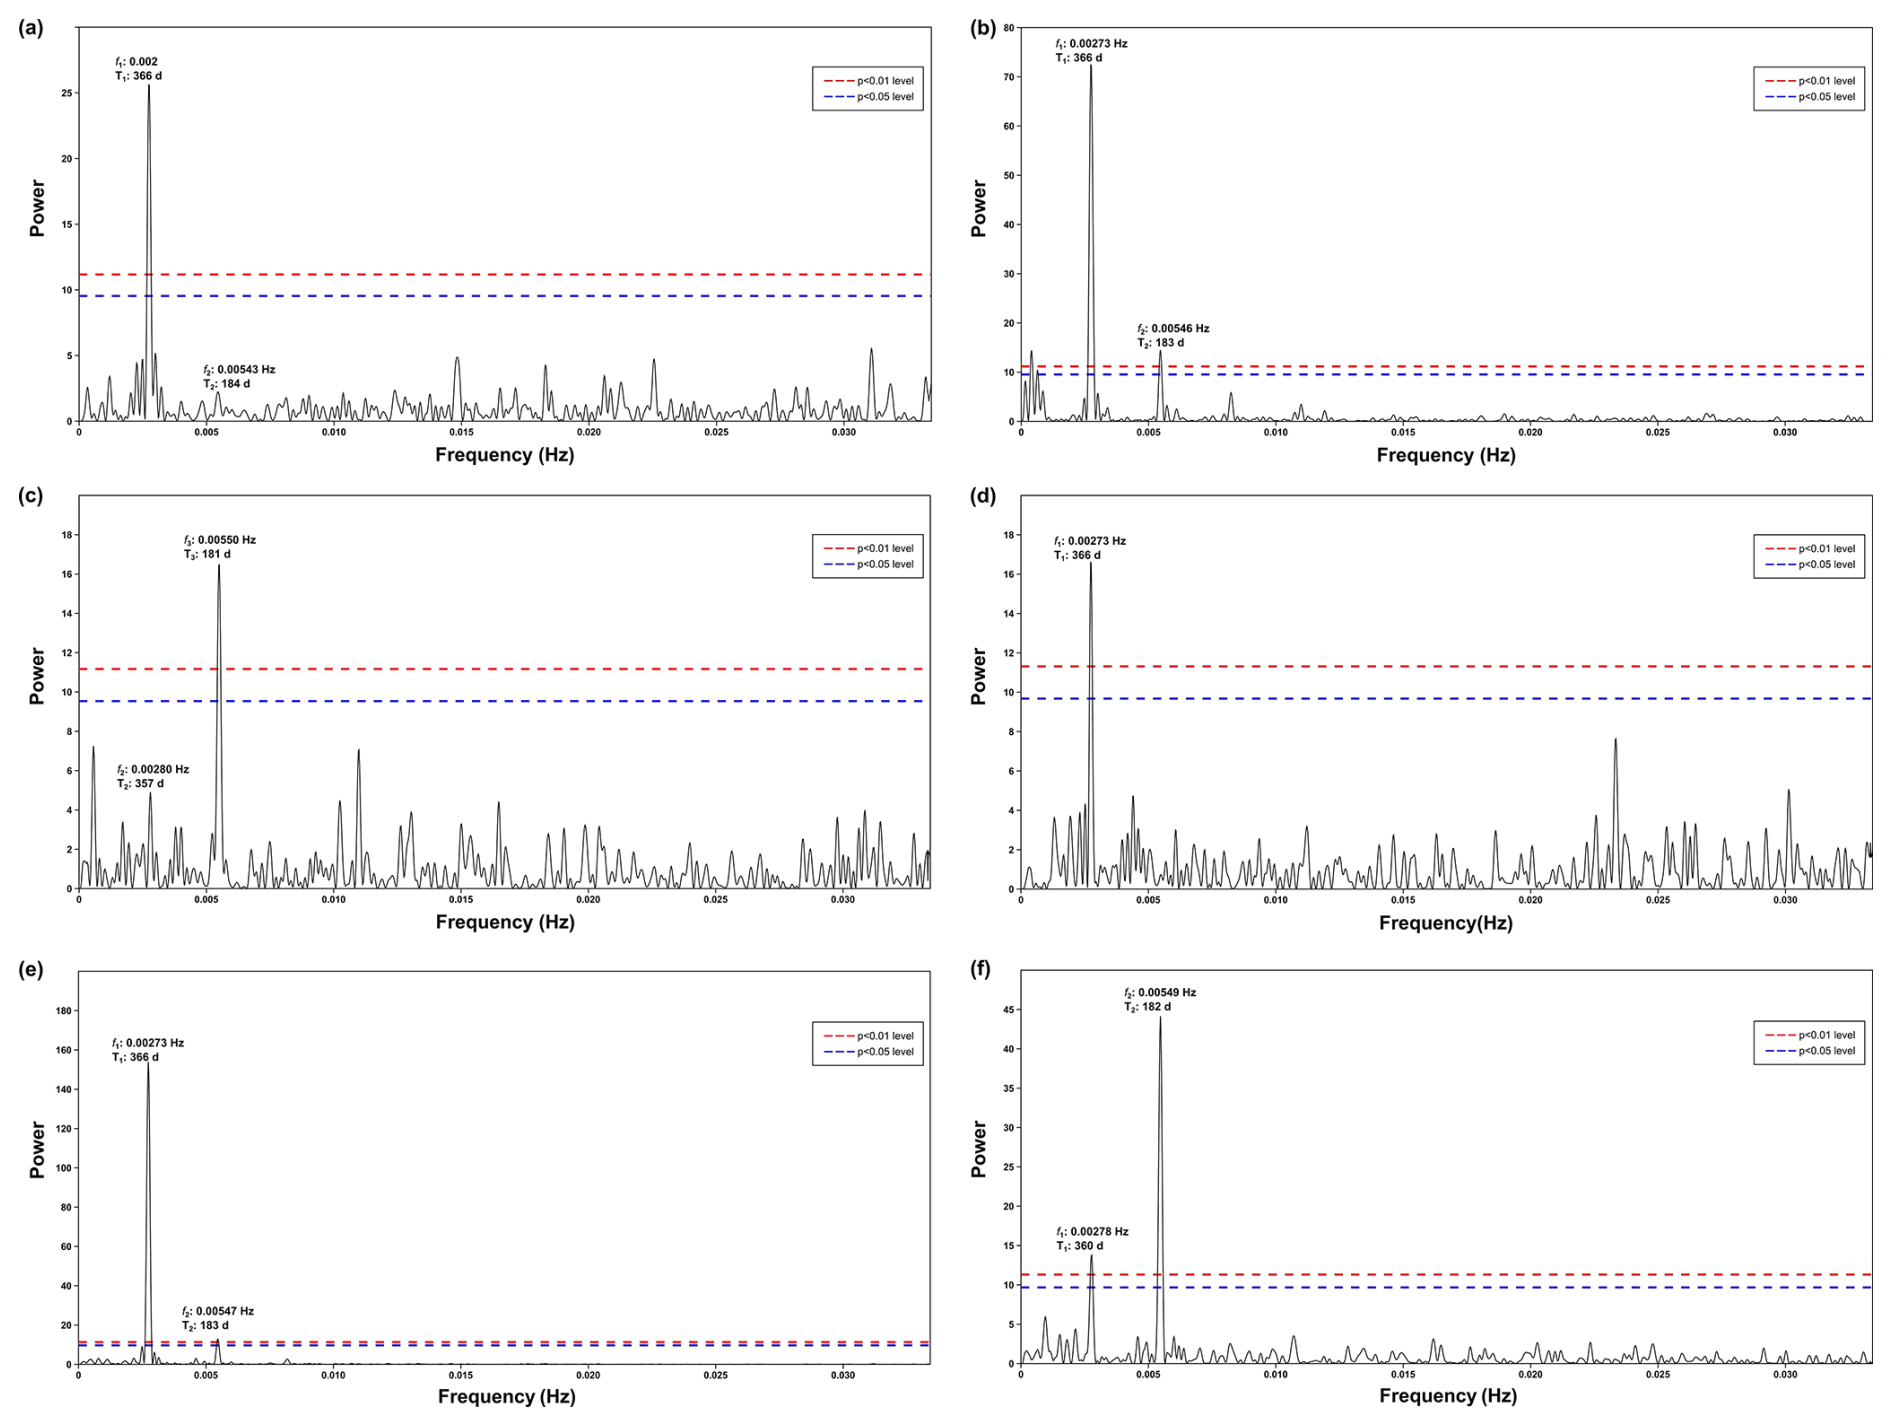
Figure A3Periodogram of spectral analysis in time series of (a) surface wind speed, (b) surface wind direction, (c) frequency of dust storm events observed at the Nouadhibou airport, (d) aerosol dust concentration (aerosol optical depth) observed in Cabo Verde by NASA AERONET satellite, (e) sea surface temperature, and (f) upwelling index.
The published dataset can be accessed through the PANGAEA data repository following this link: https://doi.org/10.1594/PANGAEA.982569 (Roza et al., 2026).
SEVR and KAFZ conceptualised the study. SEVR, GJMV and KAFZ were involved in the sample collection and the material extraction. SEVR, RTR, JBWS, GJMV, VP, and KAFZ contributed to the curation of the data. SEVR, RTR, and KAFZ designed the methodology. KAFZ organised the funding acquisition, project administration, and resources for this study, as well as supervising the study progress. SEVR created the data visualisation. All authors contributed to the formal analysis of this study. SEVR wrote the original draft. RTR, JBWS, GJMV, VP, IGM, and KAFZ contributed to the review and editing of the original draft.
The contact author has declared that none of the authors has any competing interests.
Publisher's note: Copernicus Publications remains neutral with regard to jurisdictional claims made in the text, published maps, institutional affiliations, or any other geographical representation in this paper. The authors bear the ultimate responsibility for providing appropriate place names. Views expressed in the text are those of the authors and do not necessarily reflect the views of the publisher.
This research would not have been possible without the support of the authorities of Germany, Morocco, and Mauritania. Sampling with the sediment trap was made possible with the help of the captain and the ship crews of RV Poseidon, RV Sonne, and RV Maria S. Merian, as well as the MARUM sediment trap team. Dr. Pospelova was the Hanse-Wissenschaftskolleg (HWK) senior research fellow in marine and climate research during her 2016 sabbatical at the Institute for Advanced Study (Germany) with Prof. Zonneveld at the University of Bremen. The authors also thank all individuals and institutions that have directly contributed to the implementation of this study.
This study was financially supported by the German Research Foundation (DFG) through the Cluster of Excellence (EXC 2077): The Ocean Floor – Earth’s Uncharted Interface (grant no. 390741603). Dr. García-Moreiras was supported by two postdoctoral fellowships from Xunta de Galicia (ED481B-2019-074 and ED481D-2024/016), Spain.
The article processing charges for this open-access publication were covered by the University of Bremen.
This paper was edited by Tina Treude and reviewed by Manuel Bringué and one anonymous referee.
Adams, A. M., Prospero, J. M., and Zhang, C.: CALIPSO-Derived Three-Dimensional Structure of Aerosol over the Atlantic Basin and Adjacent Continents, J. Clim., 25, 6862–6879, https://doi.org/10.1175/JCLI-D-11-00672.1, 2012.
Anderson, D. M., Fachon, E., Pickart, R. S., Lin, P., Fischer, A. D., Richlen, M. L., Uva, V., Brosnahan, M. L., McRaven, L., Bahr, F., Lefebvre, K., Grebmeier, J. M., Danielson, S. L., Lyu, Y., and Fukai, Y.: Evidence for massive and recurrent toxic blooms of Alexandrium catenella in the Alaskan Arctic, Proc. Natl. Acad. Sci., 118, e2107387118, https://doi.org/10.1073/pnas.2107387118, 2021.
Andronov, I. L.: Chapter 11 – Advanced Time Series Analysis of Generally Irregularly Spaced Signals: Beyond the Oversimplified Methods, in: Knowledge Discovery in Big Data from Astronomy and Earth Observation, edited by: Škoda, P. and Adam, F., Elsevier, 191–224, https://doi.org/10.1016/B978-0-12-819154-5.00022-9, 2020.
Arbuszewski, J. A., deMenocal, P. B., Cléroux, C., Bradtmiller, L., and Mix, A.: Meridional shifts of the Atlantic intertropical convergence zone since the Last Glacial Maximum, Nat. Geosci., 6, 959–962, https://doi.org/10.1038/ngeo1961, 2013.
Arístegui, J., Barton, E. D., Álvarez-Salgado, X. A., Santos, A. M. P., Figueiras, F. G., Kifani, S., Hernández-León, S., Mason, E., Machú, E., and Demarcq, H.: Sub-regional ecosystem variability in the Canary Current upwelling, Prog. Oceanogr., 83, 33–48, https://doi.org/10.1016/j.pocean.2009.07.031, 2009.
Bae, S. W., Lee, K. E., Ko, T. W., Kim, R. A., and Park, Y.-G.: Holocene centennial variability in sea surface temperature and linkage with solar irradiance, Sci. Rep., 12, 15046, https://doi.org/10.1038/s41598-022-19050-6, 2022.
Beaulieu, S.: Accumulation and Fate of Phytodetritus on the Sea Floor, in: Oceanography and Marine Biology, An Annual Review, vol. 40, edited by: Gibson, R. N., Barnes, M., and Atkinson, R. J. A., Taylor & Francis, New York, USA, 171–232, https://books.google.de/books?hl=id&lr=&id=3wTFDwAAQBAJ&oi=fnd&pg=PA171&ots=8ucUBKJlrl&sig=JkMA2DpaseQeS_SlDEMD0zT__50&redir_esc=y#v=onepage&q&f=false (last access: 17 January 2026), 2002.
Ben-Ami, Y., Koren, I., and Altaratz, O.: Patterns of North African dust transport over the Atlantic: winter vs. summer, based on CALIPSO first year data, Atmos. Chem. Phys., 9, 7867–7875, https://doi.org/10.5194/acp-9-7867-2009, 2009.
Bravo, I. and Figueroa, R.: Towards an Ecological Understanding of Dinoflagellate Cyst Functions, Microorganisms, 2, 11–32, https://doi.org/10.3390/microorganisms2010011, 2014.
Bringué, M., Pospelova, V., and Field, D. B.: High resolution sedimentary record of dinoflagellate cysts reflects decadal variability and 20th century warming in the Santa Barbara Basin, Quat. Sci. Rev., 105, 86–101, https://doi.org/10.1016/j.quascirev.2014.09.022, 2014.
Bringué, M., Pospelova, V., Tappa, E. J., and Thunell, R. C.: Dinoflagellate cyst production in the Cariaco Basin: A 12.5 year-long sediment trap study, Prog. Oceanogr., 171, 175–211, https://doi.org/10.1016/j.pocean.2018.12.007, 2019.
Carr, M.-E.: Estimation of potential productivity in Eastern Boundary Currents using remote sensing, Deep Sea Res. 2 Top. Stud. Oceanogr., 49, 59–80, https://doi.org/10.1016/S0967-0645(01)00094-7, 2001.
Chen, C.-C., Shiah, F.-K., Gong, G.-C., and Chen, T.-Y.: Impact of upwelling on phytoplankton blooms and hypoxia along the Chinese coast in the East China Sea, Mar. Pollut. Bull., 167, 112288, https://doi.org/10.1016/j.marpolbul.2021.112288, 2021.
Chouza, F., Reitebuch, O., Benedetti, A., and Weinzierl, B.: Saharan dust long-range transport across the Atlantic studied by an airborne Doppler wind lidar and the MACC model, Atmos. Chem. Phys., 16, 11581–11600, https://doi.org/10.5194/acp-16-11581-2016, 2016.
Cropper, T. E., Hanna, E., and Bigg, G. R.: Spatial and temporal seasonal trends in coastal upwelling off Northwest Africa, 1981–2012, Deep-Sea Res. I: Oceanogr. Res. Pap., 86, 94–111, https://doi.org/10.1016/j.dsr.2014.01.007, 2014.
Dale, B. and Dale, A.: Dinoflagellate contributions to the sediment flux of the Nordic Seas, in: Dinoflagellate contributions to the deep sea, Vol. 5, edited by: Honjo, S., Woods Hole Oceanographic Institution Woods Hole, Massachusetts, USA, 45–73, https://doi.org/10.1575/1912/410, 1992.
Dale, B., Dale, A. L., and Jansen, J. H. F.: Dinoflagellate cysts as environmental indicators in surface sediments from the Congo deep-sea fan and adjacent regions, Palaeogeogr, Palaeoclimatol, Palaeoecol., 185, 309–338, https://doi.org/10.1016/S0031-0182(02)00380-2, 2002.
de Vernal, A., Radi, T., Zaragosi, S., Van Nieuwenhove, N., Rochon, A., Allan, E., De Schepper, S., Eynaud, F., Head, M. J., Limoges, A., Londeix, L., Marret, F., Matthiessen, J., Penaud, A., Pospelova, V., Price, A., and Richerol, T.: Distribution of common modern dinoflagellate cyst taxa in surface sediments of the Northern Hemisphere in relation to environmental parameters: The new n=1968 database, Mar. Micropaleontol., 159, 101796, https://doi.org/10.1016/j.marmicro.2019.101796, 2020.
Ducklow, H., Steinberg, D., and Buesseler, K.: Upper Ocean Carbon Export and the Biological Pump, Oceanog., 14, 50–58, https://doi.org/10.5670/oceanog.2001.06, 2001.
Ellegaard, M., Dale, B., Mertens, K. N., Pospelova, V., and Ribeiro, S.: Dinoflagellate cysts as proxies for Holocene and recent environmental change in estuaries: Diversity, abundance and morphology, in: Application of Paleoenvironmental Techniques in Estuarine Studies, edited by: Weckström, K., Saunders, K., Gell, P. A., and Skilbeck, G., Springer, Berlin, Germany, 295–312, https://doi.org/10.1007/978-94-024-0990-1_12, 2017.
Faye, S., Lazar, A., Sow, B., and Gaye, A.: A model study of the seasonality of sea surface temperature and circulation in the Atlantic North-eastern Tropical Upwelling System, Front. Phys., 3, 76, https://doi.org/10.3389/fphy.2015.00076, 2015.
Fischer, G. and Karakaş, G.: Sinking rates and ballast composition of particles in the Atlantic Ocean: implications for the organic carbon fluxes to the deep ocean, Biogeosciences, 6, 85–102, https://doi.org/10.5194/bg-6-85-2009, 2009.
Fischer, G., Romero, O., Merkel, U., Donner, B., Iversen, M., Nowald, N., Ratmeyer, V., Ruhland, G., Klann, M., and Wefer, G.: Deep ocean mass fluxes in the coastal upwelling off Mauritania from 1988 to 2012: variability on seasonal to decadal timescales, Biogeosciences, 13, 3071–3090, https://doi.org/10.5194/bg-13-3071-2016, 2016.
Fischer, G., Romero, O., Toby, E., Iversen, M., Donner, B., Mollenhauer, G., Nowald, N., Ruhland, G., Klann, M., Hamady, B., and Wefer, G.: Changes in the dust-influenced biological carbon pump in the canary current system: Implications from a coastal and an offshore sediment trap record off Cape Blanc, Mauritania, Glob. Biogeochem. Cycles, 33, 1100–1128, https://doi.org/10.1029/2019gb006194, 2019.
Fréon, P., Barange, M., and Arístegui, J.: Eastern Boundary Upwelling Ecosystems: Integrative and comparative approaches. Prog. Oceanogr., 83, 1–14, https://doi.org/10.1016/j.pocean.2009.08.001, 2009.
Fritsch, F. N. and Carlson, R. E.: Monotone Piecewise Cubic Interpolation, SIAM J. Numer. Anal., 17, 2, 238–246, https://doi.org/10.1137/0717021, 1980.
García-Moreiras, I., Pospelova, V., García-Gil, S., and Sobrino, C. M.: Climatic and anthropogenic impacts on the Ría de Vigo (NW Iberia) over the last two centuries: A high-resolution dinoflagellate cyst sedimentary record, Palaeogeogr, Palaeoclimatol, Palaeoecol., 504, 201–218, https://doi.org/10.1016/j.palaeo.2018.05.032, 2018.
García-Moreiras, I., Oliveira, A., Santos, A. I., Oliveira, P. B., and Amorim, A.: Environmental Factors Affecting Spatial Dinoflagellate Cyst Distribution in Surface Sediments Off Aveiro-Figueira da Foz (Atlantic Iberian Margin), Front. Mar. Sci., 8, 699483, https://doi.org/10.3389/fmars.2021.699483, 2021.
García-Moreiras, I., Amorim, A., and Zonneveld, K.: Transport and preservation of calcareous and organic-walled dinoflagellate cysts off Cape Blanc (NW Africa) in relation to nepheloid layers, Mar. Environ. Res., 199, 106577, https://doi.org/10.1016/j.marenvres.2024.106577, 2024.
García-Moreiras, I., Amorim, A., Pospelova, V., Zonneveld, K., Anderson, D. M., Beedessee, G., Dale, A., Dale, B., David, O., de Vernal, A., Fatourou, E., Folie-Boivin, E., Helenes, J., García-Portela, M., Gu, F., Gu, H., Iratçabal, V., Janouškovec, J., Limoges, A., Marret, F., Meyvisch, P., Nfongmo, Y. N., Pochic, V., Reguera, B., Sangiorgi, F., Roza, S. E. V., Van Nieuwenhove, N., Williams, R. W., Winifred, V., and Mertens, K. N.: Progress, challenges and future directions in marine organic-walled dinoflagellate cyst research: New insights from an international workshop. Mar. Micropaleontol., 201, 102502, https://doi.org/10.1016/j.marmicro.2025.102502, 2025.
Gómez, F.: A checklist and classification of living dinoflagellates (Dinoflagellata, Alveolata), Cic. Ocea., 27, 65–140, https://doi.org/10.37543/oceanides.v27i1.111, 2012.
Grange, S. K.: Technical report: Averaging wind speeds and directions, 12, https://doi.org/10.13140/RG.2.1.3349.2006, 2014.
Hagen, E.: Northwest African upwelling scenario, Oceanol. Acta, 24, 113–128, https://doi.org/10.1016/S0399-1784(00)01110-5, 2001.
Hammer, Ø., Harper, D. A. T., and Ryan, P. D.: Paleontological statistics software: package for education and data analysis, Palaeontol. Electron., 4, https://palaeo-electronica.org/2001_1/past/issue1_01.htm (last access: 29 December 2024), 2001.
Head, M. J.: Modern dinoflagellate cysts and their biological affinities, in: Palynology: Principles and Applications, Vol. 3, edited by: Jansonius, J. and McGregor, D. C., American Association of Stratigraphic Palynologists, Dallas, USA, 1197–1248, https://www.researchgate.net/profile/Martin-Head/publication/259866107_Modern_dinoflagellate_cysts_and _their_biological_affnities/links/546d02180cf2193b94c57cb2/ Modern-dinoflagellate-cysts-and-their-biological-affnities.pdf (last access: 31 January 2025), 1996.
Holben, B. N., Eck, T. F., Slutsker, I., Tanré, D., Buis, J. P., Setzer, A., Vermote, E., Reagan, J. A., Kaufman, Y. J., Nakajima, T., Lavenu, F., Jankowiak, I., and Smirnov, A.: AERONET – A federated instrument network and data archive for aerosol characterization, Remote Sens. Environ., 66, 1–16, https://doi.org/10.1016/S0034-4257(98)00031-5, 1998.
Iversen, M. H. and Ploug, H.: Temperature effects on carbon-specific respiration rate and sinking velocity of diatom aggregates – potential implications for deep ocean export processes, Biogeosciences, 10, 4073–4085, https://doi.org/10.5194/bg-10-4073-2013, 2013.
Jeong, H. J., Yoo, Y. D., Kim, J. S., Seong, K. A., Kang, N. S., and Kim, T. H.: Growth, feeding and ecological roles of the mixotrophic and heterotrophic dinoflagellates in marine planktonic food webs, Ocean Sci. J., 45, 65–91, https://doi.org/10.1007/s12601-010-0007-2, 2010.
Jiao, N., Zhang, Y., Zhou, K., Li, Q., Dai, M., Liu, J., Guo, J., and Huang, B.: Revisiting the CO2 “source” problem in upwelling areas – a comparative study on eddy upwellings in the South China Sea, Biogeosciences, 11, 2465–2475, https://doi.org/10.5194/bg-11-2465-2014, 2014.
Jickells, T. D., An, Z. S., Andersen, K. K., Baker, A. R., Bergametti, G., Brooks, N., Cao, J. J., Boyd, P. W., Duce, R. A., Hunter, K. A., Kawahata, H., Kubilay, N., laRoche, J., Liss, P. S., Mahowald, N., Prospero, J. M., Ridgwell, A. J., Tegen, I., and Torres, R.: Global Iron Connections Between Desert Dust, Ocean Biogeochemistry, and Climate, Science, 308, 67–71, https://doi.org/10.1126/science.1105959, 2005.
Kremling, K., Lentz, U., Zeitzschel, B., Schultz-Bull, D. E., and Dunkier, J. C.: New type of time-series sediment trap for the reliable collection of inorganic and organic trace chemical substances, Rev. Sci. Instrum., 67, 4360–4363, 1996.
Likumahua, S., Sangiorgi, F., de Boer, M. K., Tatipatta, W. M., Pelasula, D. D., Polnaya, D., Hehuwat, J., Siahaya, D. M., and Buma, A. G. J.: Dinoflagellate cyst distribution in surface sediments of Ambon Bay (eastern Indonesia): Environmental conditions and harmful blooms, Mar. Pollut. Bull., 166, 112269, https://doi.org/10.1016/j.marpolbul.2021.112269, 2021.
Lohan, M. C. and Tagliabue, A.: Oceanic Micronutrients: Trace Metals that are Essential for Marine Life, Elements, 14, 385–390, https://doi.org/10.2138/gselements.14.6.385, 2018.
Mamalakis, A., Randerson, J. T., Yu, J.-Y., Pritchard, M. S., Magnusdottir, G., Smyth, P., Levine, P. A., Yu, S., and Foufoula-Georgiou, E.: Zonally contrasting shifts of the tropical rainbelt in response to climate change, Nat. Clim. Change, 11, 143–151, https://doi.org/10.1038/s41558-020-00963-x, 2021.
Marret, F., Bradley, L., de Vernal, A., Hardy, W., Kim, S. Y., Mudie, P., Penaud, A., Pospelova, V., Price, A., Radi, T., and Rochon, A.: From bi-polar to regional distribution of modern dinoflagellate cysts, an overview of their biogeography, Mar. Micropaleontol., 159, 101753, https://doi.org/10.1016/j.marmicro.2019.101753, 2020.
Mittelstaedt, E.: The upwelling area off Northwest Africa – A description of phenomena related to coastal upwelling, Prog. Oceanogr., 12, 307–331, https://doi.org/10.1016/0079-6611(83)90012-5, 1983.
Mittelstaedt, E.: The ocean boundary along the northwest African coast: Circulation and oceanographic properties at the sea surface, Prog. Oceanogr., 26, 307–355, https://doi.org/10.1016/0079-6611(91)90011-A, 1991.
Mollenhauer, G., Basse, A., Kim, J.-H., Damste, J. S. S., and Fischer, G.: A four-year record of UK′ 37- and TEX86-derived sea surface temperature estimates from sinking particles in the filamentous upwelling region off Cape Blanc, Mauritania, Deep-Sea Res. I: Oceanogr. Res. Pap., 97, 67–79, https://doi.org/10.1016/j.dsr.2014.11.015, 2015.
Obrezkova, M. S., Pospelova, V., and Kolesnik, A. N.: Diatom and dinoflagellate cyst distribution in surface sediments of the Chukchi Sea in relation to the upper water masses, Mar. Micropaleontol., 178, 102184, https://doi.org/10.1016/j.marmicro.2022.102184, 2023.
Patterson, R. T., Prokoph, A., Kumar, A., Chang, A. S., and Roe, H. M.: Late Holocene variability in pelagic fish scales and dinoflagellate cysts along the west coast of Vancouver Island, NE Pacific Ocean, Mar. Micropaleontol., 55, 183–204, https://doi.org/10.1016/j.marmicro.2005.02.006, 2005.
Pauly, D. and Christensen, V.: Primary production required to sustain global fisheries, Nature, 374, 255–257, https://doi.org/10.1038/374255a0, 1995.
Picado, A., Vaz, N., Alvarez, I., and Dias, J. M.: Modelling coastal upwelling off NW Iberian Peninsula: New insights on the fate of phytoplankton blooms, Sci. Total Environ., 874, 162416, https://doi.org/10.1016/j.scitotenv.2023.162416, 2023.
Pitcher, G. C. and Louw, D. C.: Harmful algal blooms of the Benguela eastern boundary upwelling system, Harmful Algae, 102, 101898, https://doi.org/10.1016/j.hal.2020.101898, 2021.
Pospelova, V., Chmura, G. L., Boothman, W. S., and Latimer, J. S.: Dinoflagellate cyst records and human disturbance in two neighboring estuaries, New Bedford Harbor and Apponagansett Bay, Massachusetts (USA), Sci. Total Environ., 298, 81–102, https://doi.org/10.1016/S0048-9697(02)00195-X, 2002.
Pospelova, V., de Vernal, A., and Pedersen, T. F.: Distribution of dinoflagellate cysts in surface sediments from the northeastern Pacific Ocean (43–25° N) in relation to sea surface temperature, salinity, productivity and coastal upwelling, Mar. Micropaleontol., 68, 21–48, https://doi.org/10.1016/j.marmicro.2008.01.008, 2008.
Pospelova, V., Esenkulova, S., Johannessen, S. C., O'Brien, M. C., and Macdonald, R. W.: Organic-walled dinoflagellate cyst production, composition and flux from 1996 to 1998 in the central Strait of Georgia (BC, Canada): a sediment trap study. Mar. Micropaleontol., 75, 17–37, https://doi.org/10.1016/j.marmicro.2010.02.003, 2010.
Prospero, J. M., Collard, F.-X., Molinié, J., and Jeannot, A.: Characterizing the annual cycle of African dust transport to the Caribbean Basin and South America and its impact on the environment and air quality, Glob. Biogeochem. Cycles, 28, 757–773, https://doi.org/10.1002/2013gb004802, 2014.
Rodríguez, S., Cuevas, E., Prospero, J. M., Alastuey, A., Querol, X., López-Solano, J., García, M. I., and Alonso-Pérez, S.: Modulation of Saharan dust export by the North African dipole, Atmos. Chem. Phys., 15, 7471–7486, https://doi.org/10.5194/acp-15-7471-2015, 2015.
Rodríguez–Villegas, C., Díaz, P. A., Salgado, P., Tomasetti, S. J., Díaz, M., Marín, S. L., Baldrich, Á. M., Niklitschek, E., Pino, L., Matamala, T., Espinoza, K., and Figueroa, R. I.: The role of physico-chemical interactions in the seasonality of toxic dinoflagellate cyst assemblages: The case of the NW Patagonian fjords system, Environ. Pollut., 311, 119901, https://doi.org/10.1016/j.envpol.2022.119901, 2022.
Romero, O. E. and Fischer, G.: Shift in the species composition of the diatom community in the eutrophic Mauritanian coastal upwelling: Results from a multi-year sediment trap experiment (2003–2010), Prog. Oceanogr., 159, 31–44, https://doi.org/10.1016/j.pocean.2017.09.010, 2017.
Romero, O. E. and Ramondenc, S.: A 17 year time-series of diatom populations' flux and composition in the Mauritanian coastal upwelling, Front. Mar. Sci., 9, 1006345, https://doi.org/10.3389/fmars.2022.1006345, 2022.
Romero, O. E., Baumann, K.-H., Zonneveld, K. A. F., Donner, B., Hefter, J., Hamady, B., Pospelova, V., and Fischer, G.: Flux variability of phyto- and zooplankton communities in the Mauritanian coastal upwelling between 2003 and 2008, Biogeosciences, 17, 187–214, https://doi.org/10.5194/bg-17-187-2020, 2020.
Romero, O. E., Ramondenc, S., and Fischer, G.: A 2-decade (1988–2009) record of diatom fluxes in the Mauritanian coastal upwelling: impact of low-frequency forcing and a two-step shift in the species composition, Biogeosciences, 18, 1873–1891, https://doi.org/10.5194/bg-18-1873-2021, 2021.
Rösch, A. and Schmidbauer, H.: WaveletComp 1.1: A guided tour through the R package, hs-stat [code], http://www.hs-stat.com/projects/WaveletComp/WaveletComp_guided_tour.pdf (last access: 12 November 2025), 2018.
Roza, S. E. V., Versteegh, G. J. M., Pospelova, V., and Zonneveld, K. A. F.: Environmental control of interannual and seasonal variability in dinoflagellate cyst export flux over 18 years in the Cape Blanc upwelling region (Mauritania), Front. Mar. Sci., 11, 1284425, https://doi.org/10.3389/fmars.2024.1284425, 2024.
Roza, S. E. V., Zonneveld, K. A. F., Pospelova, V., Stuut, J.-B. W., Versteegh, G. J. M., and Reuter, R. T.: The original and interpolated time series of dinoflagellate cysts export flux and multiple environmental factors off Cape Blanc, Northwest Africa, PANGAEA [data set], https://doi.org/10.1594/PANGAEA.982569, 2026. a
Schnepf, E. and Elbrächter, M.: Nutritional strategies in dinoflagellates: A review with emphasis on cell biological aspects, Eur. J. Protistol., 28, 3–24, https://doi.org/10.1016/S0932-4739(11)80315-9, 1992.
Skonieczny, C., Bory, A., Bout-Roumazeilles, V., Abouchami, W., Galer, S. J. G., Crosta, X., Diallo, A., and Ndiaye, T.: A three-year time series of mineral dust deposits on the West African margin: Sedimentological and geochemical signatures and implications for interpretation of marine paleo-dust records, Earth Planet. Phys., 364, 145–156, https://doi.org/10.1016/j.epsl.2012.12.039, 2013.
Starr, M., Lair, S., Michaud, S., Scarratt, M., Quilliam, M., Lefaivre, D., Robert, M., Wotherspoon, A., Michaud, R., Ménard, N., Sauvé, G., Lessard, S., Béland, P., and Measures, L.: Multispecies mass mortality of marine fauna linked to a toxic dinoflagellate bloom, PloS One, 12, e0176299, https://doi.org/10.1371/journal.pone.0176299, 2017.
Sun, D., Jia, Y., Yang, S., Lang, S., Ye, Z., Li, Z., and Wang, S.: Global patterns in primary production of marine phytoplankton taxonomic groups, Glob. Planet. Change, 255, 105057, https://doi.org/10.1016/j.gloplacha.2025.105057, 2025.
Sylla, A., Mignot, J., Capet, X., and Gaye, A. T.: Weakening of the Senegalo–Mauritanian upwelling system under climate change, Clim. Dyn., 53, 4447–4473, https://doi.org/10.1007/s00382-019-04797-y, 2019.
Taylor, F. J. R., Hoppenrath, M., and Saldarriaga, J. F.: Dinoflagellate diversity and distribution, Biodivers. Conserv., 17, 407–418, https://doi.org/10.1007/s10531-007-9258-3, 2008.
Torrence, C. and Compo, G. P.: A Practical Guide to Wavelet Analysis, Bull. Amer. Meteor. Soc., 79, 61–78, https://doi.org/10.1175/1520-0477(1998)079<0061:APGTWA>2.0.CO;2, 1998.
Van Camp, L., Nykjaer, L., Mittelstaedt, E., and Schlittenhardt, P.: Upwelling and boundary circulation off Northwest Africa as depicted by infrared and visible satellite observations, Prog. Oceanogr., 26, 357–402, https://doi.org/10.1016/0079-6611(91)90012-B, 1991.
van der Does, M., Korte, L. F., Munday, C. I., Brummer, G.-J. A., and Stuut, J.-B. W.: Particle size traces modern Saharan dust transport and deposition across the equatorial North Atlantic, Atmos. Chem. Phys., 16, 13697–13710, https://doi.org/10.5194/acp-16-13697-2016, 2016.
Van Nieuwenhove, N., Head, M. J., Limoges, A., Pospelova, V., Mertens, K. N., Matthiessen, J., De Schepper, S., de Vernal, A., Eynaud, F., Londeix, L., Marret, F., Penaud, A., Radi, T., and Rochon, A.: An overview and brief description of common marine organic-walled dinoflagellate cyst taxa occurring in surface sediments of the Northern Hemisphere, Mar. Micropaleontol., 159, 101814, https://doi.org/10.1016/j.marmicro.2019.101814, 2020.
Vindel, J. M., Valenzuela, R. X., Navarro, A. A., and Polo, J.: Temporal and spatial variability analysis of the solar radiation in a region affected by the intertropical convergence zone, Meteorol. Appl., 27, e1824, https://doi.org/10.1002/met.1824, 2020.
Wyatt, N. J., Birchill, A., Ussher, S., Milne, A., Bouman, H. A., Shoenfelt Troein, E., Pabortsava, K., Wright, A., Flanagan, O., Bibby, T. S., Martin, A., and Moore, C. M.: Phytoplankton responses to dust addition in the Fe-Mn co-limited eastern Pacific sub-Antarctic differ by source region, Proc. Natl. Acad. Sci. U. S. A., 120, e2220111120, https://doi.org/10.1073/pnas.2220111120, 2023.
Yu, H., Tan, Q., Chin, M., Remer, L. A., Kahn, R. A., Bian, H., Kim, D., Zhang, Z., Yuan, T., Omar, A. H., Winker, D. M., Levy, R., Kalashnikova, O., Crepeau, L., Capelle, V., and Chedin, A.: Estimates of African dust deposition along the trans-Atlantic transit using the decade-long record of aerosol measurements from CALIOP, MODIS, MISR, and IASI, J. Geophys. Res., 124, 7975–7996, https://doi.org/10.1029/2019JD030574, 2019.
Yu, S.-Y. and Berglund, B. E.: A dinoflagellate cyst record of Holocene climate and hydrological changes along the southeastern Swedish Baltic coast, Quat. Res., 67, 215–224, https://doi.org/10.1016/j.yqres.2006.12.004, 2007.
Zenk, W., Klein, B., and Schroder, M.: Cape Verde Frontal Zone, Deep Sea Res. I: Oceanogr. Res. Pap., 38, 505–530, https://doi.org/10.1016/S0198-0149(12)80022-7, 1991.
Zonneveld, K. A. F. and Pospelova, V.: A determination key for modern dinoflagellate cysts, Palynology, 39, 387–409, https://doi.org/10.1080/01916122.2014.990115, 2015.
Zonneveld, K. A. F., Meilland, J., Donner, B., and Versteegh, G. J. M.: Export flux succession of dinoflagellate cysts and planktonic foraminifera in an active upwelling cell off Cape Blanc (NW Africa), Eur. J. Phycol., 57, 29–47, https://doi.org/10.1080/09670262.2021.1885066, 2022.
Zonneveld, K. A. F., Harper, K., Klügel, A., Chen, L., De Lange, G., and Versteegh, G. J. M.: Climate change, society, and pandemic disease in Roman Italy between 200 BCE and 600 CE, Sci. Adv., 10, eadk1033, https://doi.org/10.1126/sciadv.adk1033, 2024.