
the Creative Commons Attribution 4.0 License.
the Creative Commons Attribution 4.0 License.
 | 19 Nov 2026
Acidification in coastal waters of Adélie Land, Antarctica (1985–2025)
Nicolas Metzl

Bronte Tilbrook
John Akl
Craig Neill
Alexandra Aymard
Claire Lo Monaco
Gilles Reverdin
Jean-Baptiste Sallée
Aude Barton
Frédéric Chevallier
Marion Gehlen
Ocean acidification is expected to be particularly severe in Antarctic continental shelves due to enhanced anthropogenic carbon uptake in cold waters in response to rising atmospheric CO2, sea-ice retreat, freshening and climate-change feedbacks. Models suggest that undersaturated conditions with respect to aragonite (Ωar), a major form of calcium carbonate formed by marine species, could be reached as soon as 2052 for austral winter. Here we present new ocean carbonate system observations from cruises conducted since 2010 in the Adélie Land coastal region in East Antarctica, along with data from a BCG-Argo float and results from a neural network model for the period 1985–2025. The region is a permanent CO2 sink which was most pronounced since 2006. The CO2 sink leads to an increase of surface water total CO2 concentrations (CT) (+0.44 ± 0.01 ) and to a decrease of pH (−0.013 per decade) and Ωar (−0.035 per decade) for the winter season. The lowest surface Ωar of 1.2 was observed in winter 2024 from the float data, a critical limit for some marine species such as pteropods. A projection of the CT concentrations in the future, based on observed anthropogenic CO2 concentrations and emissions scenarios, suggests that aragonite saturation state (Ωar = 1) will occur in surface waters as soon as 2055 in the Adélie Land region, which is part of a larger area of East Antarctica proposed as a Marine Protected Area by the Commission for the Conservation of Antarctic Marine Living Resources since the early 2010s.
- Article
(8681 KB) - Full-text XML
-
Supplement
(1962 KB) - BibTeX
- EndNote


Coastal and continental shelf waters can experience ocean acidification (OA) due to increasing ocean CO2 uptake in response to increased greenhouse forcing (Bourgeois et al., 2016; Laruelle et al., 2018; Roobaert et al., 2024a, b). As opposed to the open ocean, the detection of CO2 and acidification trends in Antarctic coastal waters is complicated by multiple effects such as anthropogenic CO2 (Cant) uptake, warming or cooling, variability in biological processes, upwelling, and changes in sea-ice cover and freshening.
In the Southern Ocean, OA has been studied using sea surface CO2 fugacity (fCO2) observations at regional scale mainly in the Sub-Antarctic, Polar Front or Permanent Open Ocean zones (Xue et al., 2018; Brandon et al., 2022; Metzl et al., 2024b). There are two long-term time series in the Drake Passage to the north of the Antarctic Peninsula (Takahashi et al., 2014; Hauri et al., 2015; Munro et al., 2015) that have been used to evaluate OA in coastal Antarctic zones. The observed pH rates at Drake and Palmer station ranged between +0.020 ± 0.020 and −0.015 ± 0.008 per decade. Recently, Mazloff et al. (2023) merged Biogeochemical Argo (BGC-Argo) float and historical observations to estimate OA in the entire Southern Ocean (SO). In the seasonal ice zone (SIZ), they evaluated pH trend of −0.0242 ± 0.0007 per decade between 1994 and 2017 in subsurface waters (100–210 m). Estimates of the decadal change in OA based on observations, are often limited to data collected 2–15 years apart (e.g., Hauck et al., 2010; Pardo et al., 2017; Carter et al., 2019). In the regions of dense water formation, Cant is efficiently transported to the deep ocean implying that acidification can be detected not only in surface waters but also in deep and bottom waters (Zhang et al., 2023). The Adélie Land region is one of the four main bottom water formation regions in Antarctica with the formation of Adélie Land Bottom Water (ALBW), which was first recognized by Gordon and Tchernia (1972). Subsequently, a number of studies have described and quantified the variability of the ALBW formation and its properties (e.g. Williams et al., 2010; Aoki et al., 2013; van Wijk and Rintoul 2014; Shadwick et al., 2014; Pardo et al., 2017). Once formed on the continental shelf and slope, ALBW is transported away from its source, and ventilates the entire Australian-Antarctic Basin and beyond (Sholeninova et al., 2025). Significant Cant concentrations of up to 44 µmol kg−1 have been observed in the shelf waters (Shadwick et al., 2014), linking the ocean CO2 uptake in coastal waters and OA at depth (Zhang et al., 2023)
The Adélie Land is part of a proposed Marine Protected Area of East Antarctica (Boothroyd et al., 2024) and severe undersaturated conditions with respect to aragonite could occur as soon as 2055 at the surface in austral winter and in 2080 for summer (Nissen et al., 2024). Preliminary results based on summer observations gathered from 2002–2012 indicate that the trend of surface water total CO2 concentrations (CT) in the Adélie Land region was not significant (N−CT trend = +0.63 ± 0.70 , Metzl et al., 2025a). This region has large inter-annual variability in pCO2 and CT linked to competitive processes between anthropogenic CO2 uptake, primary production, mixing, or ice melting (Shadwick et al., 2013, 2014, 2017) possibly masking the trend.
In this context, more data are needed to better evaluate the changes in the carbonate system in Antarctic coastal zones and the associated OA (Tilbrook et al., 2019). This would allow us to better evaluate the long-term changes with regard to the biological impacts and offer better validation for ocean and Earth system models that struggle to reproduce the seasonal cycles of the carbonate chemistry and remain poorly constrained to project future OA changes, particularly in high latitudes.
In this study, we present new fCO2 and CT data obtained in January 2024 and in December–February 2024–2025 off Adélie Land region combined with historical data and machine learning products to better define the seasonality and trends in CT and OA. Using historical data since the 1980s and BGC-Argo float data in 2024–2025 we estimate the trends in the carbonate system (pH and Ωar). As most observations were obtained in austral summer (December–March) the results from a reconstruction of the global surface ocean carbonate system model (Chau et al., 2024a) that extended to 2025 were used to explore the decadal trends for different seasons. Based on subsurface anthropogenic CO2 concentrations estimates for 1995–2025 we investigate future changes in Ωar. Previous studies predicted undersaturation with respect to aragonite to be reach by the mid of this century (Nissen et al., 2024) with potential detrimental impacts for marine calcifiers such as pteropods (Bednaršek et al., 2023).
2.1 Data selection in the Adélie Land sector
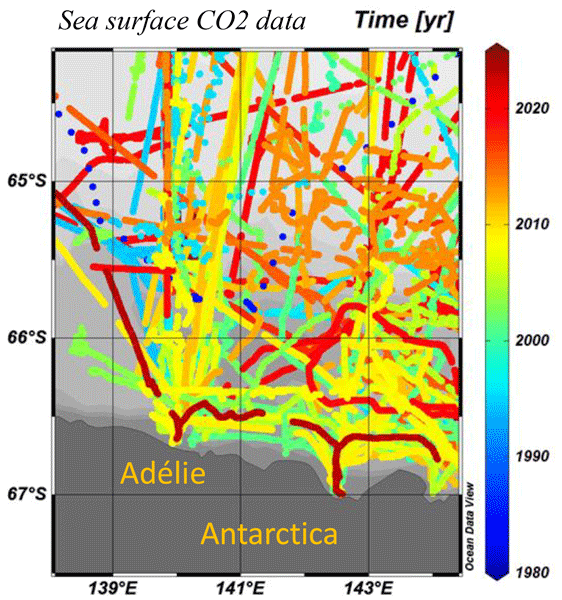
To explore the long-term change of the carbonate system in this region, we selected the fCO2 data from Surface Ocean CO2 Atlas (SOCAT), version v2025 (Bakker et al., 2016, 2025) with the addition of 3 recent cruises conducted on-board the ship L'Astrolabe in December 2024, January 2025 and February 2025. These include 67 cruises from 1984–2025 south of 63° S and between 140–150° E (see the detail in Table S1 in the Supplement and Fig. 1). During some cruises (MINERVE cruises between 2003 and 2012 and OISO-10 cruise in 2003) continuous underway or regular sampling for total alkalinity (AT) and CT measurements were performed (data available in the SNAPO-CO2 data-set, Metzl et al., 2025a). During the L'Astrolabe cruise in January 2025, AT and CT samples in sea surface water were also taken, analyzed at the SNAPO-CO2 service facilities at LOCEAN laboratory (Paris/France), and included in this work. In addition, we also used water column data between 1993 and 2018 from the Global Ocean Data Analysis Project (GLODAP), version GLODAPv2.2023 data-base (Lauvset et al., 2023, 2024; Table S2); the GLODAP data in surface waters (0–30 m) are also used to synthetize all AT and CT data in the region and used to validate and compare results of the CT and pH trends based on fCO2 data and to complement periods when fCO2 data are not available. Finally, data from a BGC-Argo float in 2024–2025 (WMO 2903867) are introduced to complement the water column and winter data.
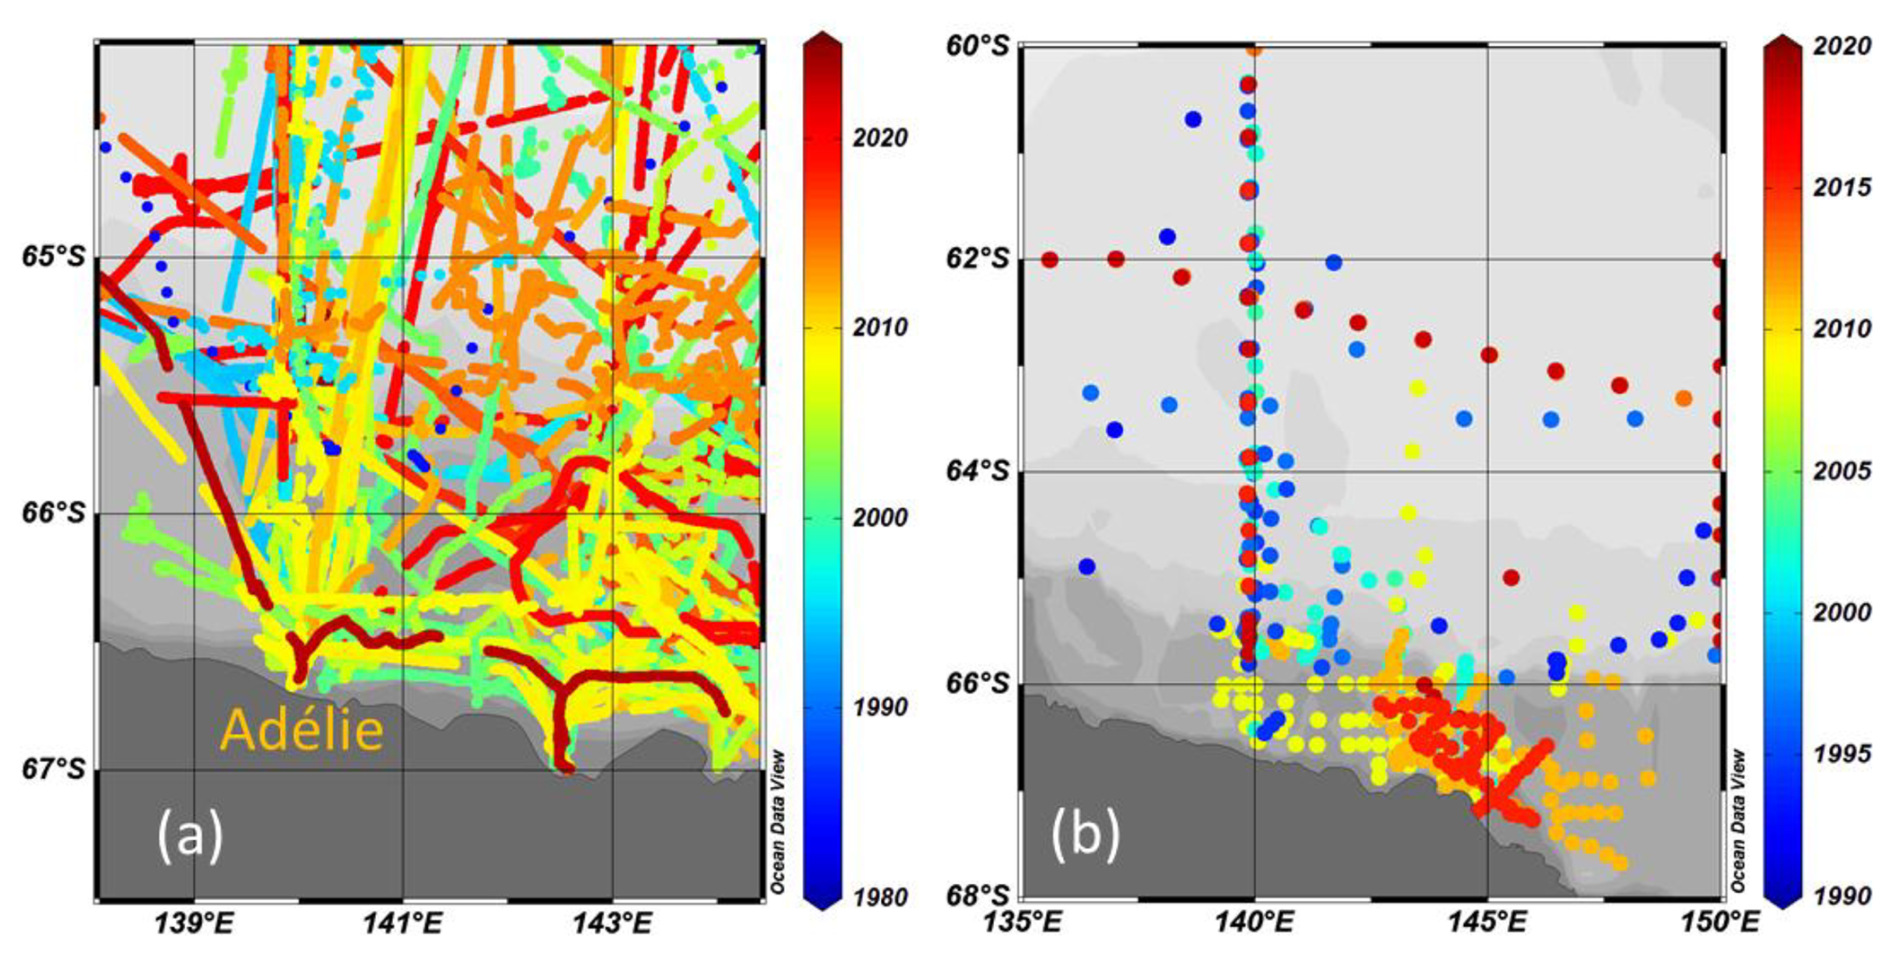
Figure 1Maps of (a) SOCAT data and (b) GLODAP data selected in the Adélie Land region. Color code is for year. Figures produced with ODV (Schlitzer, 2018).
2.2 Methods
The methods to derive surface underway fCO2 in SOCAT were described in previous studies (e.g. Metzl et al., 1999; Ishii et al., 2002; Brévière et al., 2006; Laika et al., 2009; Midorikawa et al., 2012; Shadwick et al., 2014, 2017), or detailed in the cruises metadata available in the SOCAT data-sets (https://www.socat.info, last access: 7 July 2025). The methods for underway or discrete AT and CT measurements were described and available in the SNAPO-CO2 data-set (Metzl et al., 2024a, 2025a). Here we describe the methods used during the L'Astrolabe 2024–2025 cruises.
The underway fCO2 measurements onboard L'Astrolabe in December 2024/February 2025 (Fig. S1 in the Supplement) were made by CSIRO, Hobart, using a General Oceanics 8050 fCO2 system equipped with a LICOR LI-7815 analyser (Pierrot et al., 2009; Tilbrook et al., 2025). The same technique was used during Le Commandant Charcot voyage in 2023 and Investigator voyage in 2024. The precision of the fCO2 data is estimated to be ±2 µatm, with cruises flagged B in SOCAT (Table S1, Gkritzalis et al., 2024).
In December 2024–January 2025, discrete sampling was performed from the ship's seawater supply for salinity, AT, CT, δ13C, δ18O. Salinity is given on the practical salinity scale (UNESCO, 1981). For AT and CT samples were collected in 500 mL borosilicate glass bottles and poisoned with 300 µL of HgCl2, closed with greased stoppers (Apiezon®) following the standard operating procedures of Dickson et al. (2007). Discrete samples were returned to the LOCEAN laboratory (Paris, France) in March 2025, stored in a dark room at 4 °C, and analyzed in April 2025. AT and CT were measured using a potentiometric titration method (Edmond, 1970) in a closed cell. For calibration, we used the Certified Referenced Materials (CRM # 208) provided by Prof. A. Dickson (SIO, University of California). A total of 31 samples were analyzed for the R2 cruise in December 2024–January 2025. Two anomalous values were identified for both AT and CT (WOCE flag 4 assigned) either due to a sampling or analytical issues and were not considered further (Fig. S2). For the other data, we estimate that the accuracy for both AT and CT is better than 4 µmol kg−1, as for other samples measured at the SNAPO-CO2 facilities (Metzl et al., 2025a). These data were used for the validation of calculated carbonate system parameters using fCO2 data with an AT/salinity relationship.
In this region a BGC-Argo float (WMO 2903867) was launched on 26 January 2024 at location 132° E/64° S and drifted south-eastward. Like other SOCCOM floats (Sarmiento et al., 2023) this float recorded T, S, O2, pH, nitrates and Chl-a down to 1500 m. The float data are available at https://www.mbari.org/products/data-repository/ (last access: 10 May 2025). Its last record with good pH data was on 15 January 2025 at 144.5° E/66.2° S. AT was estimated with the LIAR V2.2 algorithm (Carter et al., 2016, 2017). From pH and AT data we calculated CT, Ωar and fCO2 using the same CO2sys code used for the shipboard data (Sect. 2.3). Based on the uncertainty of the float data and calculations the CT, fCO2 and Ωar errors are respectively of 6.8 µmol kg−1, 9.4 µatm and 0.103.
2.3 Carbonate system calculation and AT/Salinity relationship
From fCO2 or AT and CT data, we calculated pHT (pH at total scale) and the saturation states of aragonite and calcite (Ωar, Ωca). Here we used the CO2sys program (version CO2sys_v2.5, Orr et al., 2018) with K1 and K2 dissociation constants from Lueker et al. (2000), KSO4 dissociation constant from Dickson (1990). Total boron concentration was calculated according to Uppström (1974). Nutrients were not measured for many cruises and when not available we used fixed climatological values of 40 and 2 µmol kg−1 for silicate and phosphate respectively (Fig. S3; Beucher et al., 2004; Bender et al., 2016). When a strong bloom occurred, as indicated by high fluorescence and low fCO2, the nutrient concentrations were halved. The nutrient values used had no impact on the long-term trends. When using fCO2 data to derive pHT, CT, or Ωar, the AT concentrations are derived from salinity (e.g. Millero et al., 1998; Lee et al., 2006; Shadwick et al., 2014; Stark et al., 2018; Leseurre et al., 2022). Here we used the AT/Salinity relationship derived from AT data south of 60° S (Fig. S4).
This relation compared well with those previously estimated in the southern ocean (Lee et al., 2006; Shadwick et al., 2014; Stark et al., 2018) as well as when derived from GLODAP data only (Fig. S4). This relation has been checked for the region south of 63° S, i.e. south of the nutrients gradient (Fig. S3) and will be used for the trend analysis discussed in Sect. 3.3.
To take into account the warming/cooling or the freshening, the fCO2 and CT data were also normalized. For temperature fCO2 normalization (f) at SST fixed (SSTfix) we used the relation described by Takahashi et al. (1993):
The salinity CT normalization was calculated at salinity 34 ().
2.4 Observation-based reconstructions of surface ocean carbonate system variables
Output from CMEMS-LSCE-FFNN, an ensemble-based feed-forward neural network (CMEMS-LSCE-FFNN or FFNN for simplicity, Chau et al., 2024a) at global scale and 0.25°×0.25° resolution provided fCO2 for seasons when direct observations were not available. Precisely, an ensemble of 100 models was trained on randomly subsampled SOCAT and predictor data with a ratio of 2:1 for training and validation. The approach uses a 3 month gliding window and the month of reconstruction is excluded from the training data (p-leave out). The means (μ) and standard deviations (σ) are computed from the 100-member ensembles and represent the model best estimate and associated uncertainty. The predictors include sea-surface height, sea surface temperature, sea surface salinity, mixed-layer depth, chlorophyll-a, atmospheric CO2 and geographical coordinates (longitudes and latitudes) as well as pCO2 from the climatology (Takahashi et al., 2009). The model uses fCO2 data from SOCATv2025 (Bakker et al., 2025) that covers January 1985 to December 2024, while 2025 is produced in near-real-time (NRT) prediction mode (Chau et al., 2024b). The reconstructed fCO2 field for 1985–2025 was used to derive air–sea CO2 fluxes. Time and space varying surface total alkalinity fields, AT, were derived from the multivariate linear regression model LIAR (Carter et al., 2016, 2017) based on sea surface temperature, salinity, and nutrients concentration (nitrate, silicate, from WOA18, Garcia et al., 2019), i.e. the same as for BGC-Argo floats. Surface ocean pH and CT were obtained from reconstructed fCO2 and AT, temperature, salinity, and nutrients through the speciation software CO2sys. Uncertainty of pH, AT and CT is derived from LIAR and CO2sys error propagation (Orr et al., 2018) at each grid cell and for each time step. For the in-depth evaluation of fCO2, pH, AT and CT please refer to Chau et al. (2022, 2024a). Note the no specific tuning was employed for the region under study. When comparing the CT or pH trends from the model based on AT derived from LIAR or from Eq. (1) we obtained the same results (Table S3). The multi-year reconstruction and the near-real time prediction, including uncertainty estimates, are available under the DOI https://doi.org/10.48670/moi-00047 (E.U. Copernicus Marine Service Information, 2025).
3.1 Air–sea CO2 fluxes
To investigate the temporal changes of the air–sea CO2 fluxes we used the model results in the region 65–66.5° S/139–141° E after averaging the monthly 0.25×0.25 grid cells in this box. During the first period, 1985–2000, the FFNN model estimated a CO2 flux close to 0 (average = −0.030 ± 0.107 ). After 2000, the model suggests an increase of the CO2 sink especially after 2016 (Fig. 2), a signal identified at a larger scale in the Antarctic Seasonal Ice Zone in Spring–Summer 2003–2022 (Deng et al., 2025). The maximum CO2 sink of −1.2 occurred in 2023. This is much stronger than the flux of −0.31 derived from the climatology in 2010 (Fay et al., 2024). In austral summer, the variability of the flux could be large. Previous studies reported fluxes ranging between +0.1 to −3.5 in summer in this region (Ishii et al., 2002; Arroyo et al., 2020) but the CO2 sink could be up to −15 to −30 in the Mertz Polynya region east of the Adélie Land (Shadwick et al., 2014, 2017). In January 2023 the sink derived from the FFNN model reached a maximum of −17 . This was associated to low fCO2 (321.5 µatm) and high wind speed (up to 7.8 m s−1) during a high positive Southern Annual Mode (SAM index of 4.56 in January 2023, data obtained from https://legacy.bas.ac.uk/met/gjma/sam.html, last access: 29 October 2025, based on Marshall, 2003). Strong CO2 sinks, < −10 , were also estimated in January 2019 and in February 2002, 2016 and 2021 also associated to positive SAM (> 1.4). In January and February 2025, the period of the L'Astrolabe recent cruises, the sink was respectively −7.6 ± 2.9 and −12.1 ± 6.1 (when the SAM was respectively only 1.4 and 0.31). The impact of the CO2 uptake and its increase over time on the pHT and Ωar changes is discussed in the following sections.
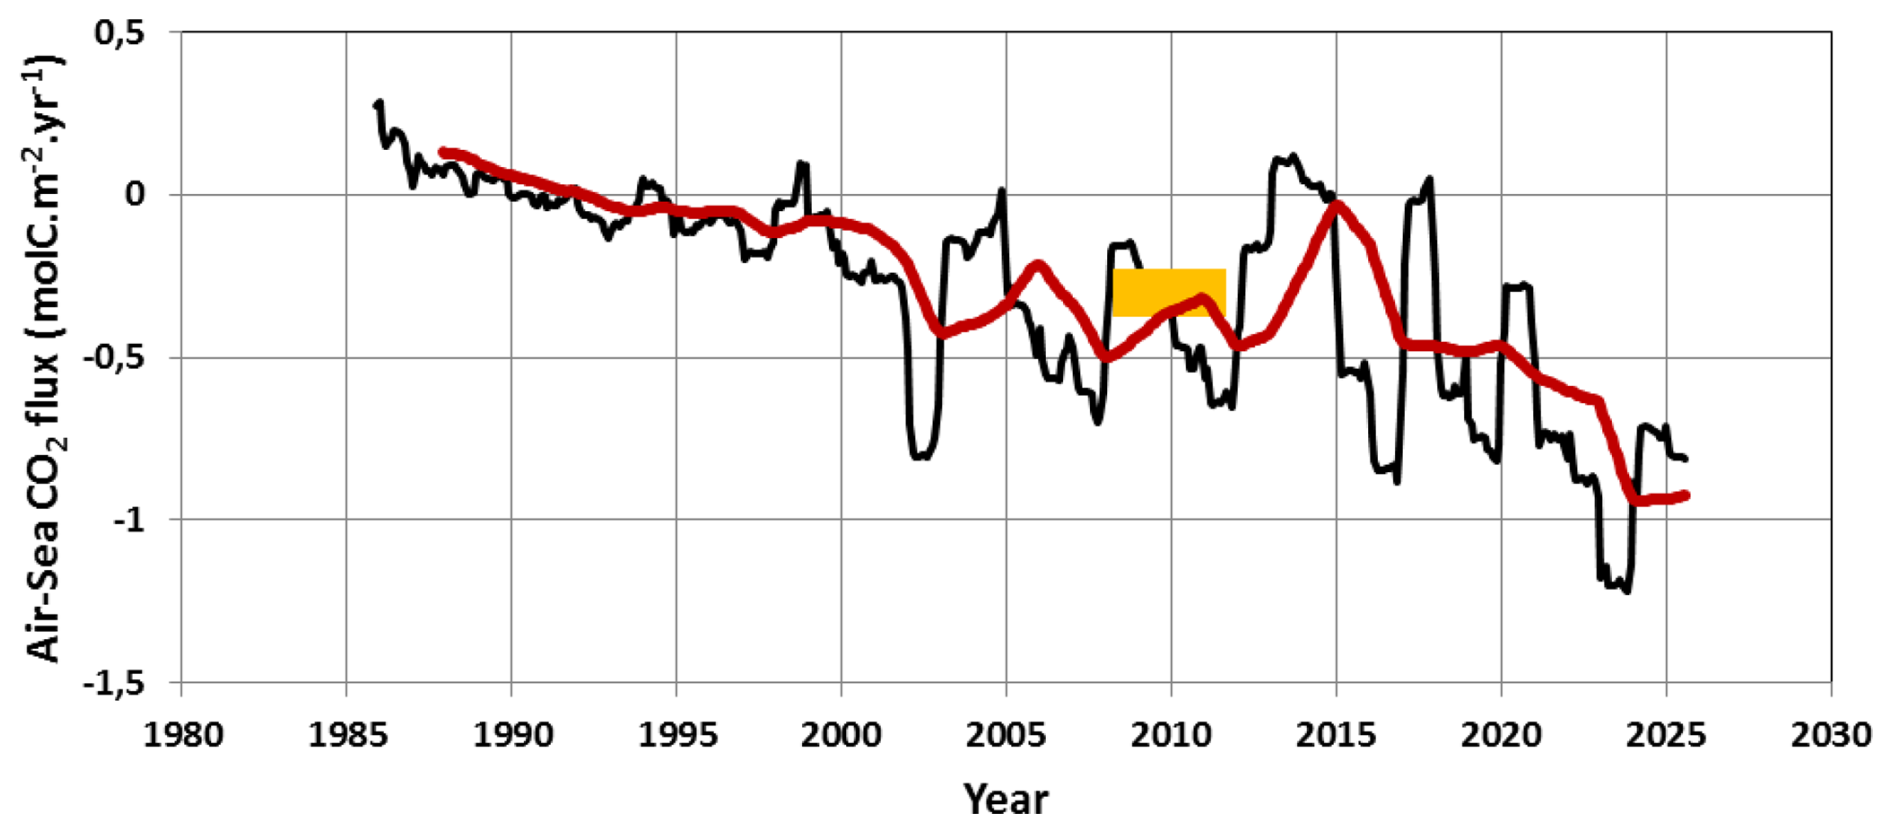
Figure 2Time-series of air–sea CO2 flux (annual in black, 36 month running mean in red) in the Adélie Land region based on the FFNN-LSCE model over 1985–2025 (centered at 66° S/140° E). Also shown (Orange Square) the climatological flux for year 2010 at the same location (Fay et al., 2024). Negative value denotes ocean CO2 sink.
3.2 Recent cruises and a BGC-Argo float (2024–2025)
The 2024–2025 shipboard and BGC-Argo observations consistently showed the ocean was a CO2 sink in summer (Fig. 3). The large spatial variability observed at 66–67° S, with fCO2 lower than 300 µatm, was linked to biological activity concentrated near the coast above the Adélie Bank (140–142° E) and the Mertz Bank (145–147° E) (Fig. S5). Biological processes also drove significant inter-annual changes. For example, along the ∼140° E track visited in January 2024 (RV Investigator) and in February 2025 (L'Astrolabe), fCO2 showed the same southward decrease but shifted by 26 µatm, while only 7 µatm is attributable to the temperature differences (Fig. 4a). The CT concentrations derived from the fCO2 data indicated that the difference was most pronounced at 65.3° S (Fig. 4b) where the Chl-a was higher in 2024 (Fig. S5). This demonstrates that biology drives most spatial and temporal variability making CT or pHT trend detection difficult in Antarctic coastal summer data (Monteiro et al., 2020; Metzl et al., 2025a).
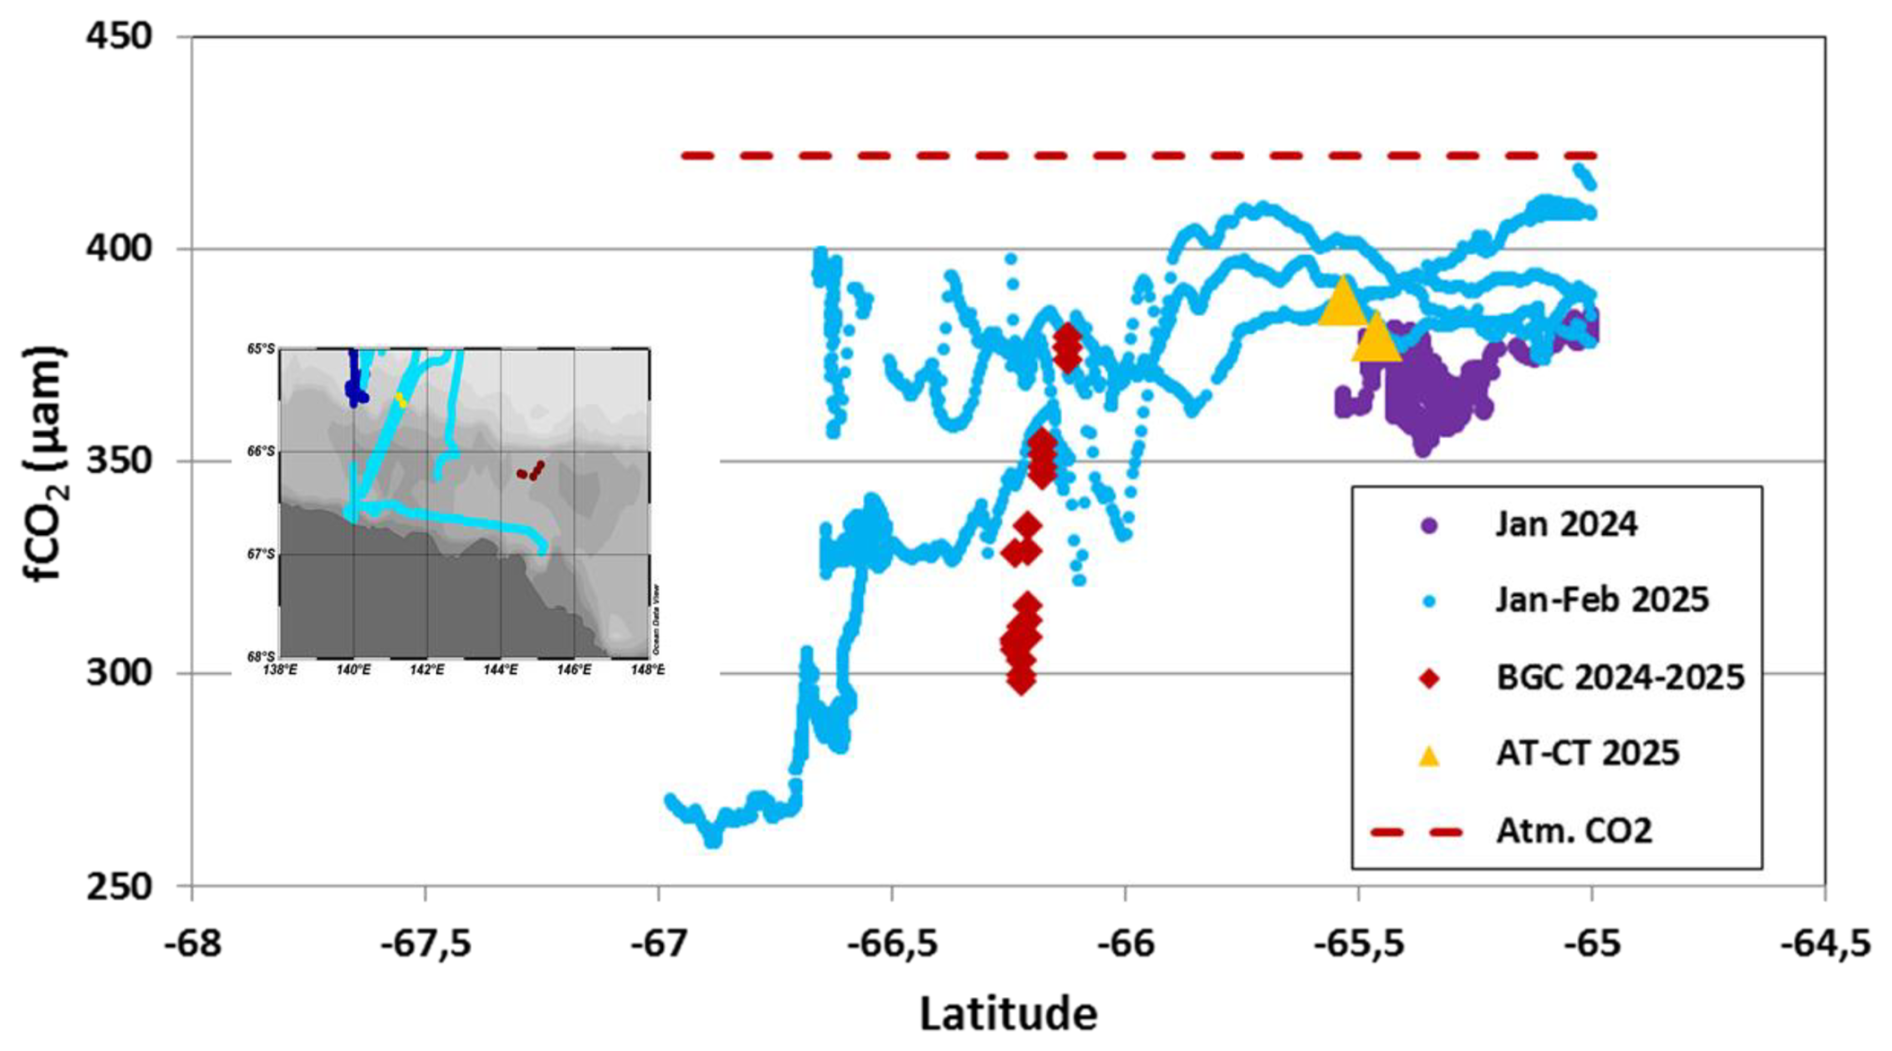
Figure 3Distribution of sea surface fCO2 (µatm) observed south of 65° S in January 2024 (purple) and January–February 2025 (blue) from shipboard, in December 2024 and January 2025 from the BGC-Argo (red diamonds), and calculated from AT CT data in January 2025 (orange triangles). The red dashed line is the mean atmospheric fCO2 in January 2025 at Cap Grim or at South Pole (419.5 µatm). (https://gml.noaa.gov/dv/iadv/, last access: 7 July 2025). Locations of the data are identified in the insert map produced with ODV (Schlitzer, 2018).
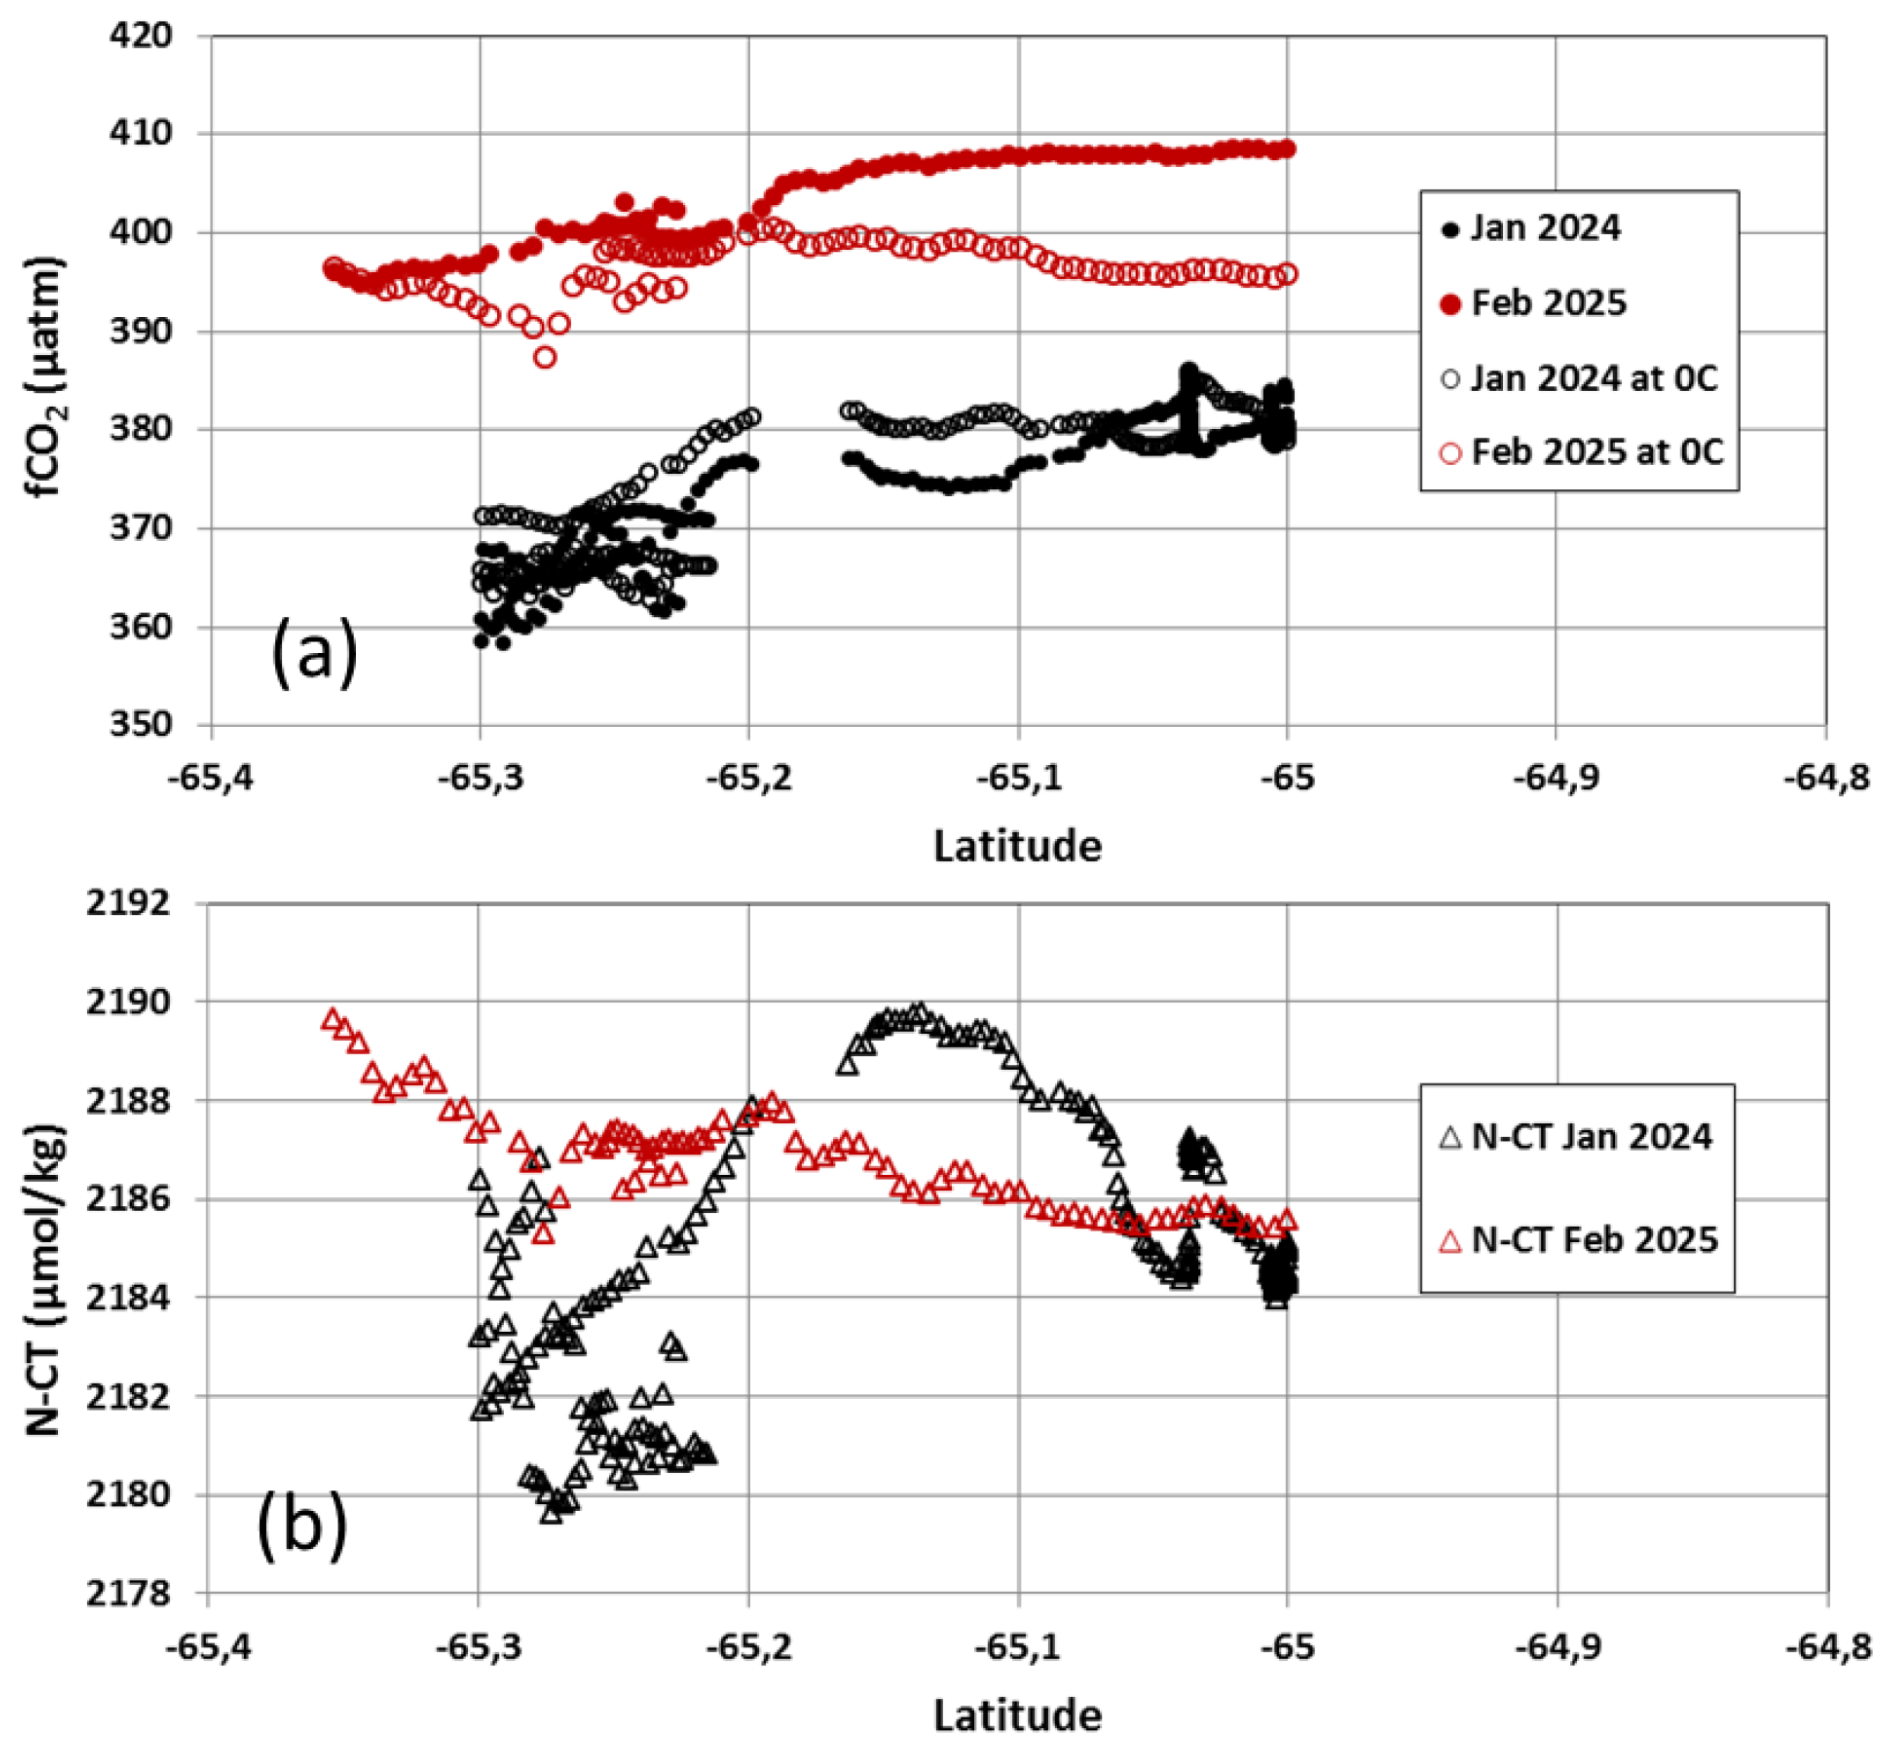
Figure 4(a) Distribution of sea surface fCO2 (µatm) and temperature normalized fCO2 at 0 °C (open symbols) observed south of 65° S in January 2024 (black) and February 2025 (red) along the same track. (b) Same as (a) for salinity normalized CT concentrations (µmol kg−1) calculated from fCO2 data. The low N−CT in 2024 (< 2182 µmol kg−1) were linked to higher biological activity in 2024 (Fig. S5).
A BGC-Argo float (WMO 2903867) provided wintertime fCO2 data for 2024 (Fig. 5). The maximum fCO2 of 440 µatm, above the atmospheric CO2 level, occurred in September (Fig. 5a). In September 2024, and given the error associated to the fCO2 data derived from the float (±9.4 µatm), we estimated a positive ocean–atmosphere difference (ΔfCO2 > 0, a potential CO2 source) with a range between 28.4 and 9.6 µatm. The FFNN model also produced a maximum of fCO2 in winter (fCO2 = 427 µatm in August 2024, Fig. S6) leading to a wintertime CO2 source of 0.43 . In August 1996 during the only cruise conducted in austral winter (Expocode 09AR19960822) we estimated fCO2 from the AT CT data in surface waters. This also lead to a potential CO2 source, ΔfCO2 ranging between 31.7 and 7.5 µatm. For the same periods, August 1996 and September 2024, ΔfCO2 from the FFNN model were respectively 37.95 and 12.4 µatm. The air–sea CO2 fluxes estimated by the FFNN model were +0.176 in August 1996 and +0.184 in September 2024, i.e. a similar value observed 28 years apart.
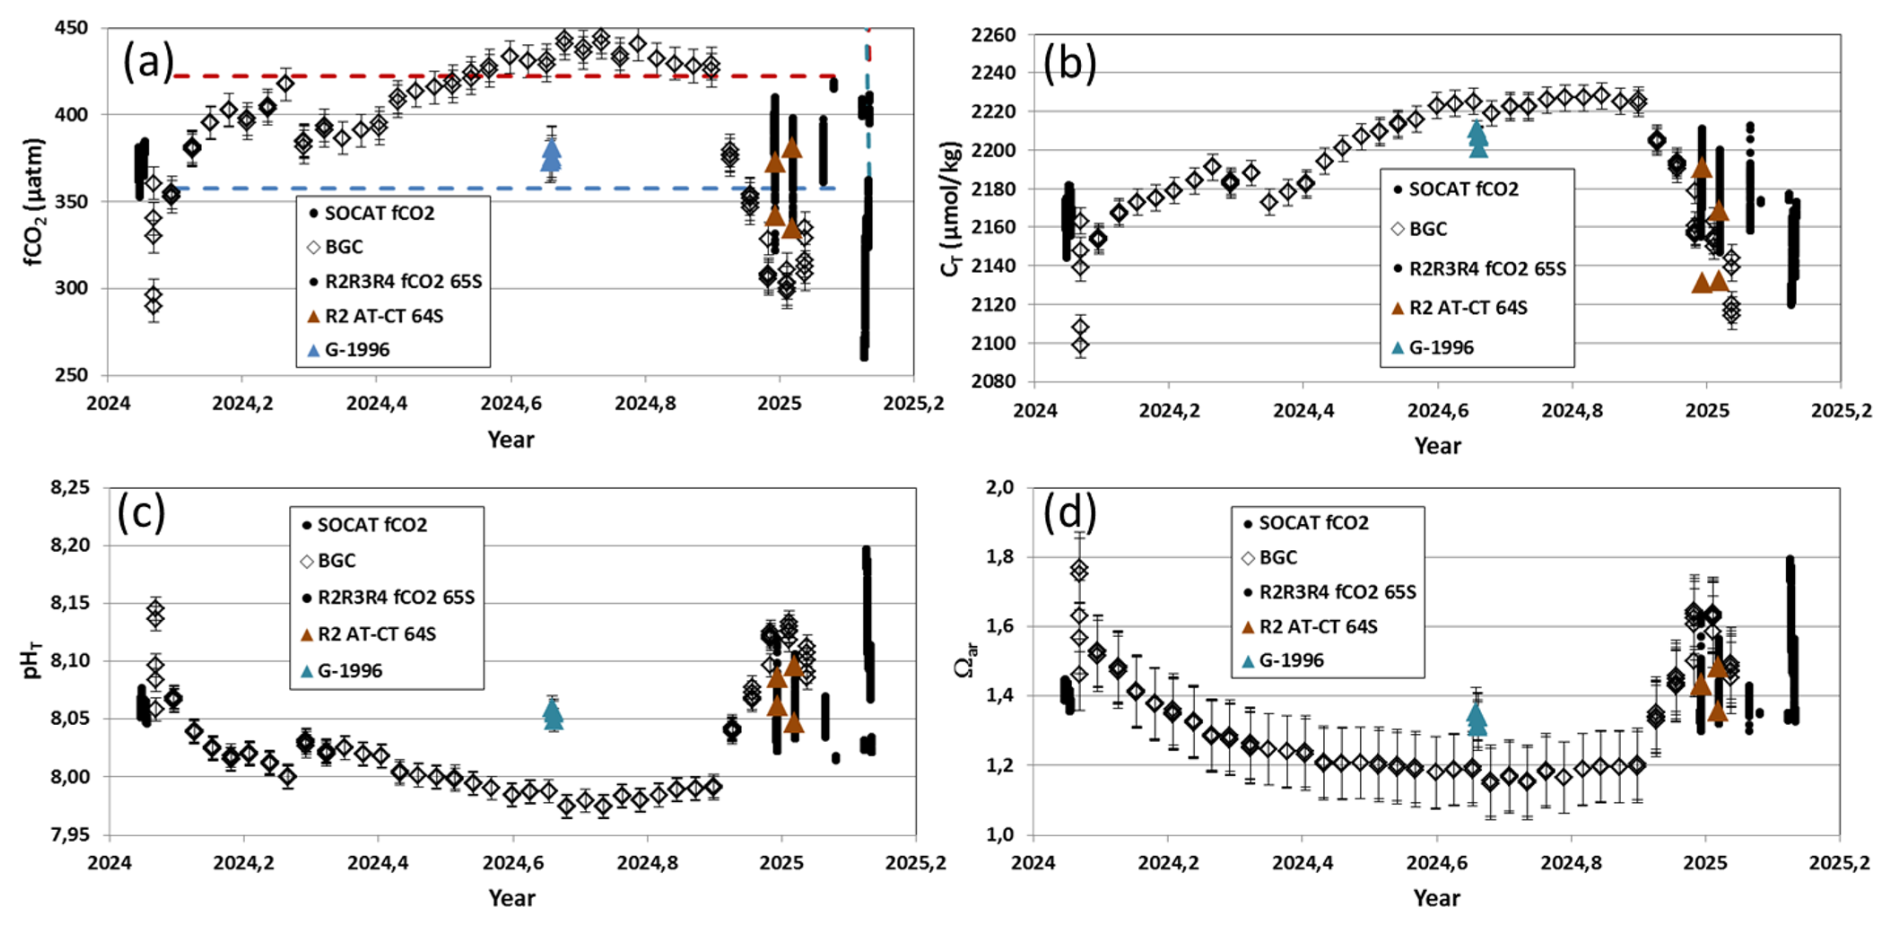
Figure 5Time-series of (a) sea surface fCO2 (µatm), (b) CT (µmol kg−1), (c) pHT and (d) Ωar observed south of 64° S in 2024–2025 based on SOCAT fCO2 data (black circles), L'Astrolabe fCO2 data (R2R3R4, black circles), BGC-Argo float (open diamonds) and AT CT data in January 2025 (R2, orange triangles). Also shown the results from AT CT data from a cruise in winter 1996 (blue triangles, cruise 09AR19960822). The dashed lines in panel (a) are the mean atmospheric CO2 concentrations in 1996 (blue) and 2025 (red). Error bars (vertical) are indicated for measured or calculated values.
In September 2024 the sea surface CT estimate from the float reached a maximum of 2221.3 ± 1.9 µmol kg−1 compared to 2207.2 ± 3.7 µmol kg−1 measured in August 1996 (Fig. 5b). The difference of +14.1 µmol kg−1 would translate into a rate of +0.5 over 28 years similar to the range of the anthropogenic CO2 trend in the Antarctic Surface Water (AASW), +0.35 ± 0.14 to +0.65 ± 0.21 derived from 4 cruises in 1995–2011 in this region (Pardo et al., 2017). Consequently, pHT decreased from 8.054 ± 0.005 (winter 1996) to 7.976 ± 0.002 (winter 2024) (Fig. 5c) and Ωar decreased from 1.334 ± 0.017 to 1.157 ± 0.009 (Fig. 5d). A pHT decrease of 0.0781 in 28 years corresponds to a trend of −0.028 per decade. This substantial signal derived from measured pH (BGC-Argo in 2024) and calculated pHT (shipboard AT and CT data in 1996), is sensitive to method uncertainties. Accounting for AT and CT measurements uncertainty (±4 µmol kg−1, Lauvset et al., 2024) the pHT decrease ranges from −0.021 to −0.035 per decade consistent with previous estimates of −0.035 ± 0.002 per decade in the AASW in this region (Pardo et al., 2017). This rapid pHT decrease requires confirmation with longer time series and quantification of contributing processes (anthropogenic CO2 signal, mixing, warm deep water intrusion, sea-ice extent, natural variability, etc.).
3.3 The period 1985–2025: high variability in summer, trends in winter
To evaluate trends we averaged data from each cruise around 140° E and south of 65° S. In this region fCO2 data from SOCAT are available since 1984 and AT and CT data from GLODAP and SNAPO-CO2 since 1994. The FFNN model starts in 1985 and was constrained by satellite Chl-a data since 1998, and by climatological Chl-a before then.
The average fCO2 and CT data present higher values in recent years (Fig. 6). The fCO2 average for January 2025 (mean = 382.3 µatm) was much higher than the first data in January 1984 (fCO2 = 317.5 µatm). The difference of 64.8 µatm would translate into a trend of +1.58 µatm yr−1 with the atmospheric trend of +1.98 ppm yr−1 for the same period. In January 2025, the CT measurements (CT normalized at salinity 34, N−CT = 2182 µmol kg−1) increased by +10 µmol kg−1 compared to January 1994 (N−CT = 2172 µmol kg−1) corresponding to a trend of +0.32 .
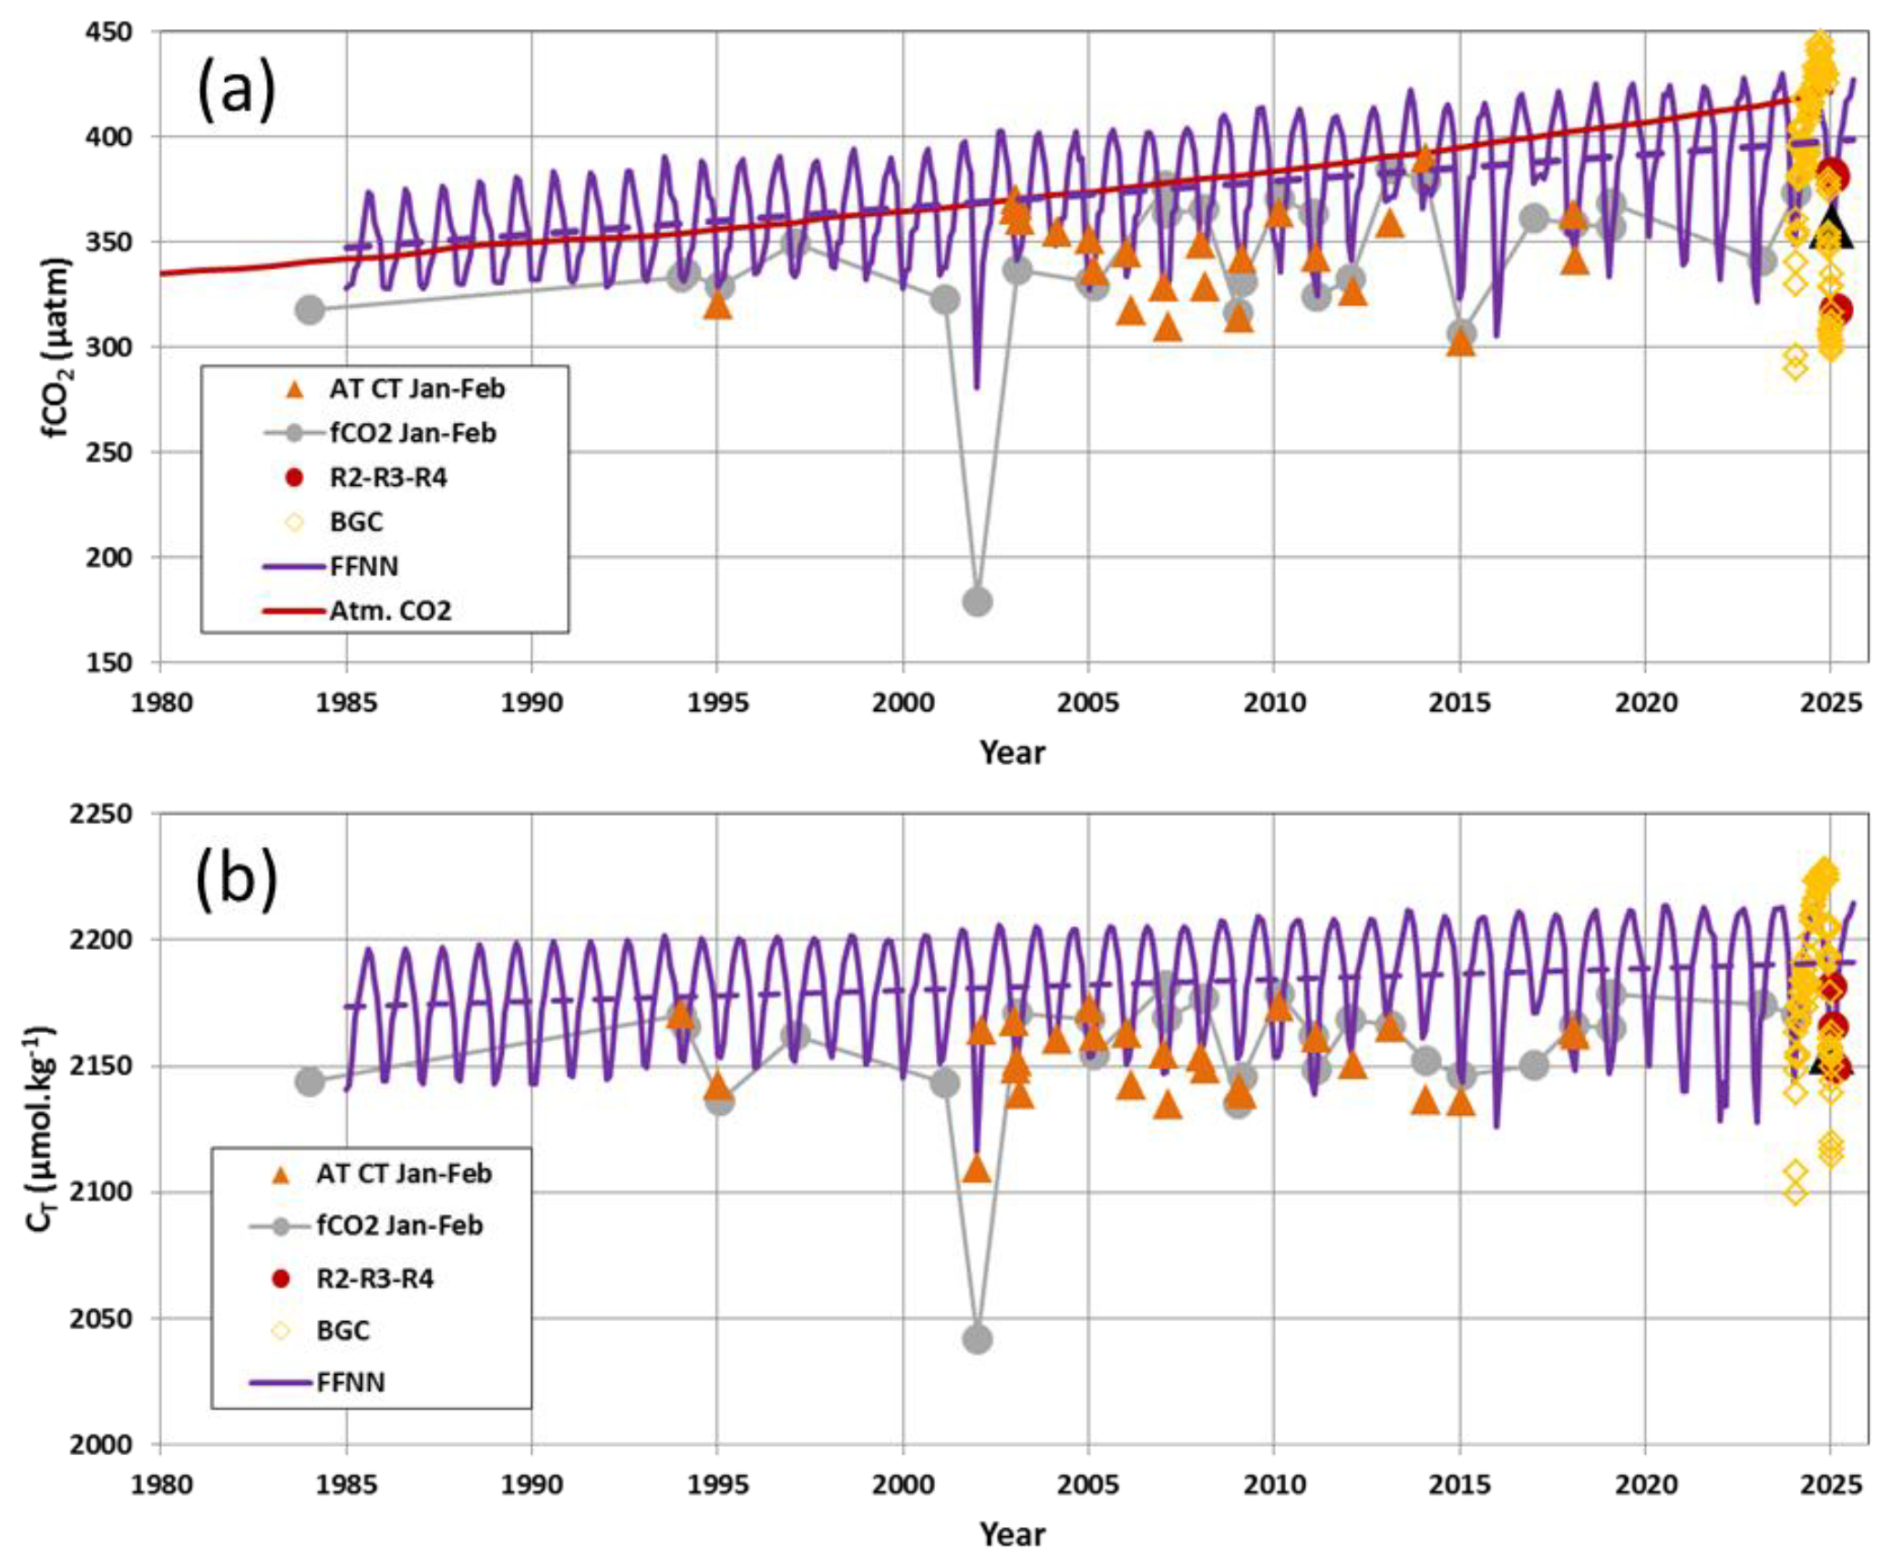
Figure 6Time-series of (a) sea surface fCO2 (µatm) and (b) CT (µmol kg−1) observed south of 65° S based on SOCAT fCO2 data in summer 1985–2024 (grey circles), from AT CT data in summer 1995–2018 (orange triangles), L'Astrolabe fCO2 data in summer 2025 (R2R3R4, red circles), AT CT data in 2025 (R2, black triangles) and BGC-Argo float data in 2024–2025 (open diamonds). Also shown are the monthly values of the FFNN model (purple) and the associated trend (dashed lines, +1.27 µatm yr−1 and 0.44 ). In panel (a) the red line is the atmospheric fCO2.
Although the CT data present higher concentrations in the recent decade, the trends based on observations are uncertain due to the large inter-annual variability (Table 1). Indeed, the time series of fCO2 and CT present large inter-annual variability in summer (Fig. 6) which is particularly apparent in 2002 and 2015 and was clearly linked to biological activity (Figs. S7 and S8). The FFNN model captured these anomalies leading to stronger CO2 sinks in summer 2002 and 2015 (Figs. 2 and S8). This also led to anomalies in pHT and Ωar (Fig. 7). Consequently, the long-term trends of observed properties in summer are uncertain and the errors associated with the trends in the FFNN model are also larger in summer compared to winter (Table 1). A simple linear projection of the Ωar trend in winter from the FFNN model (−0.0035 ± 0.0001 per year) suggests that a value of 1.2 would be reached in 2032 and saturation (Ωar = 1) in 2090.
Table 1Trends of properties in the Adélie zone derived from observations (measured AT, CT or fCO2) and from the FFNN model. For observations the trends are evaluated for summer only. For the FFNN model trends are estimated for all seasons or only for January and August. The last line is based on winter data in 2024 (BGC-Argo) and 1996 (ATCT data). Standard deviations are in brackets.
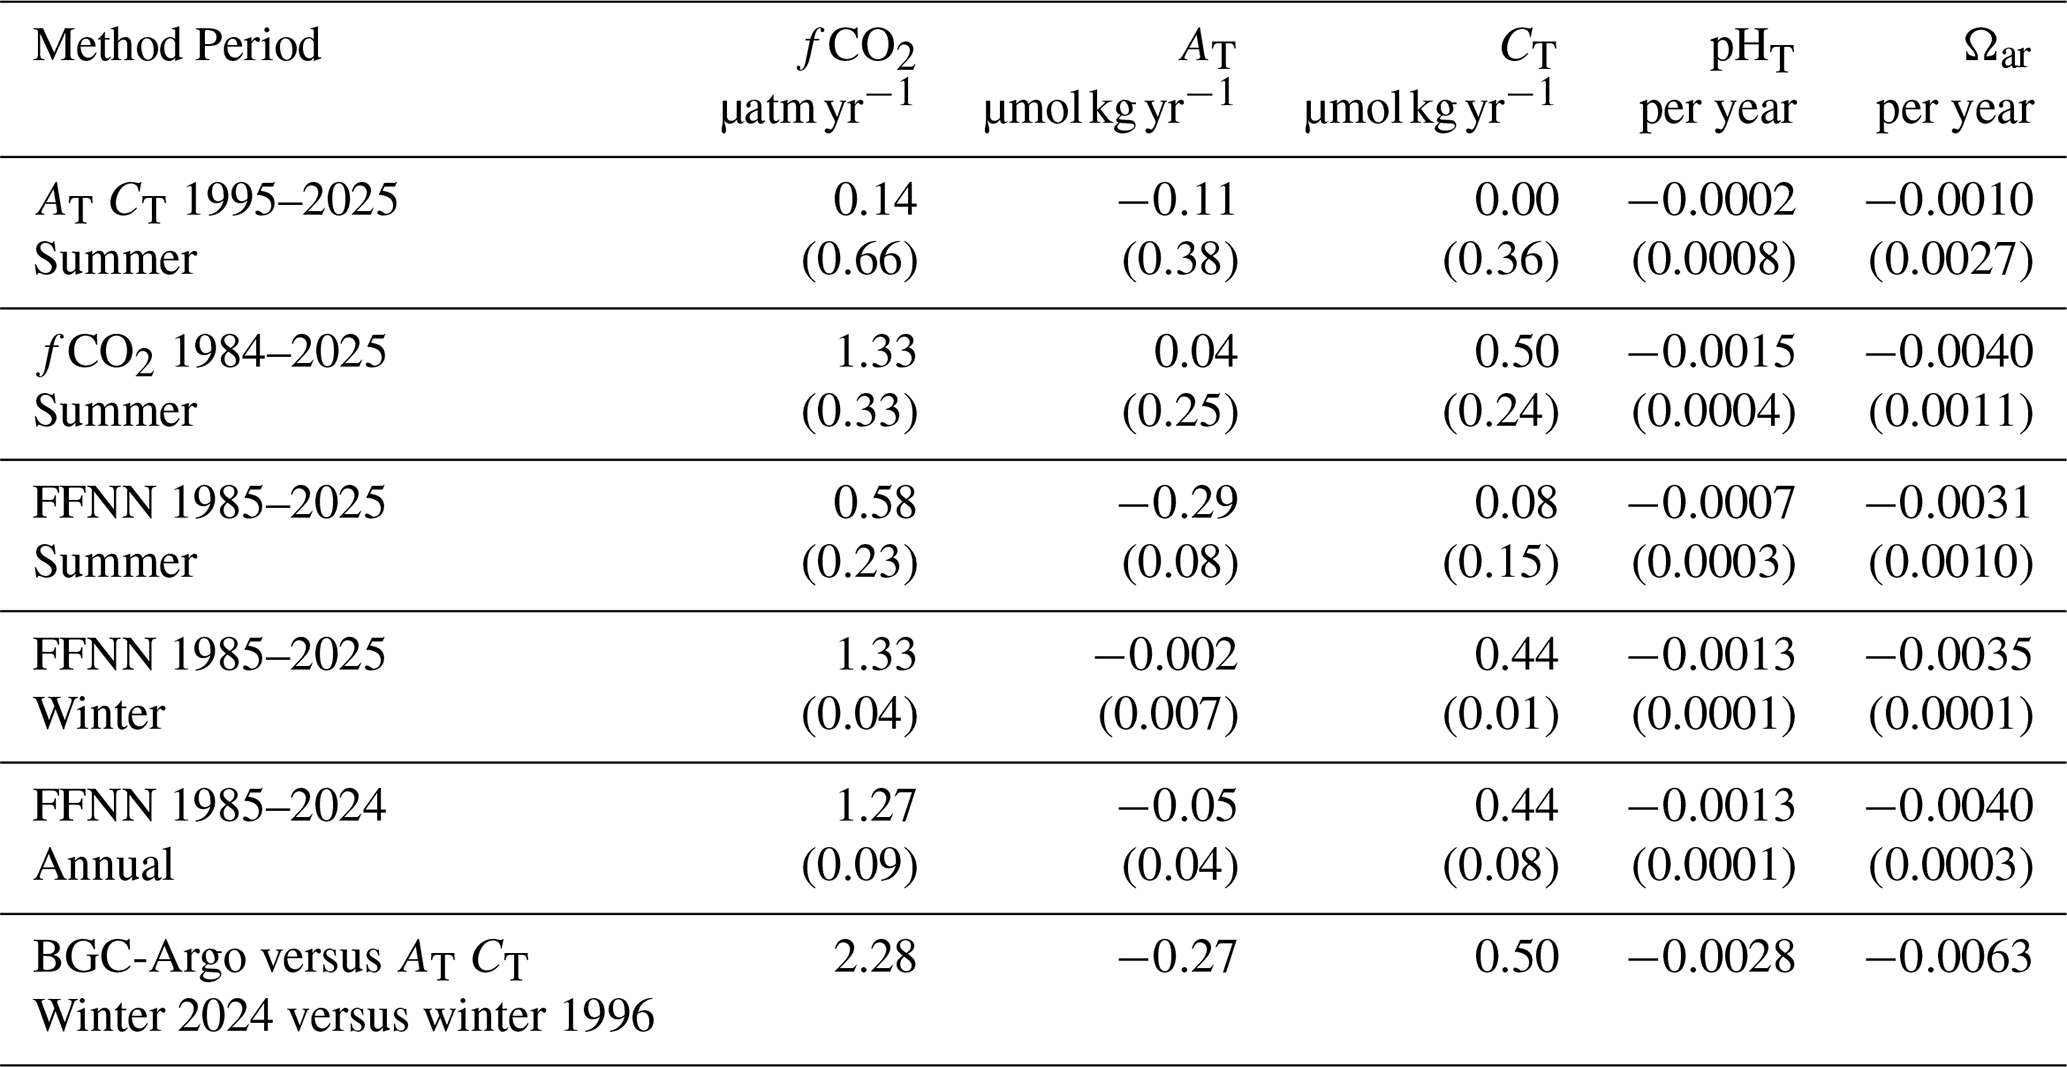
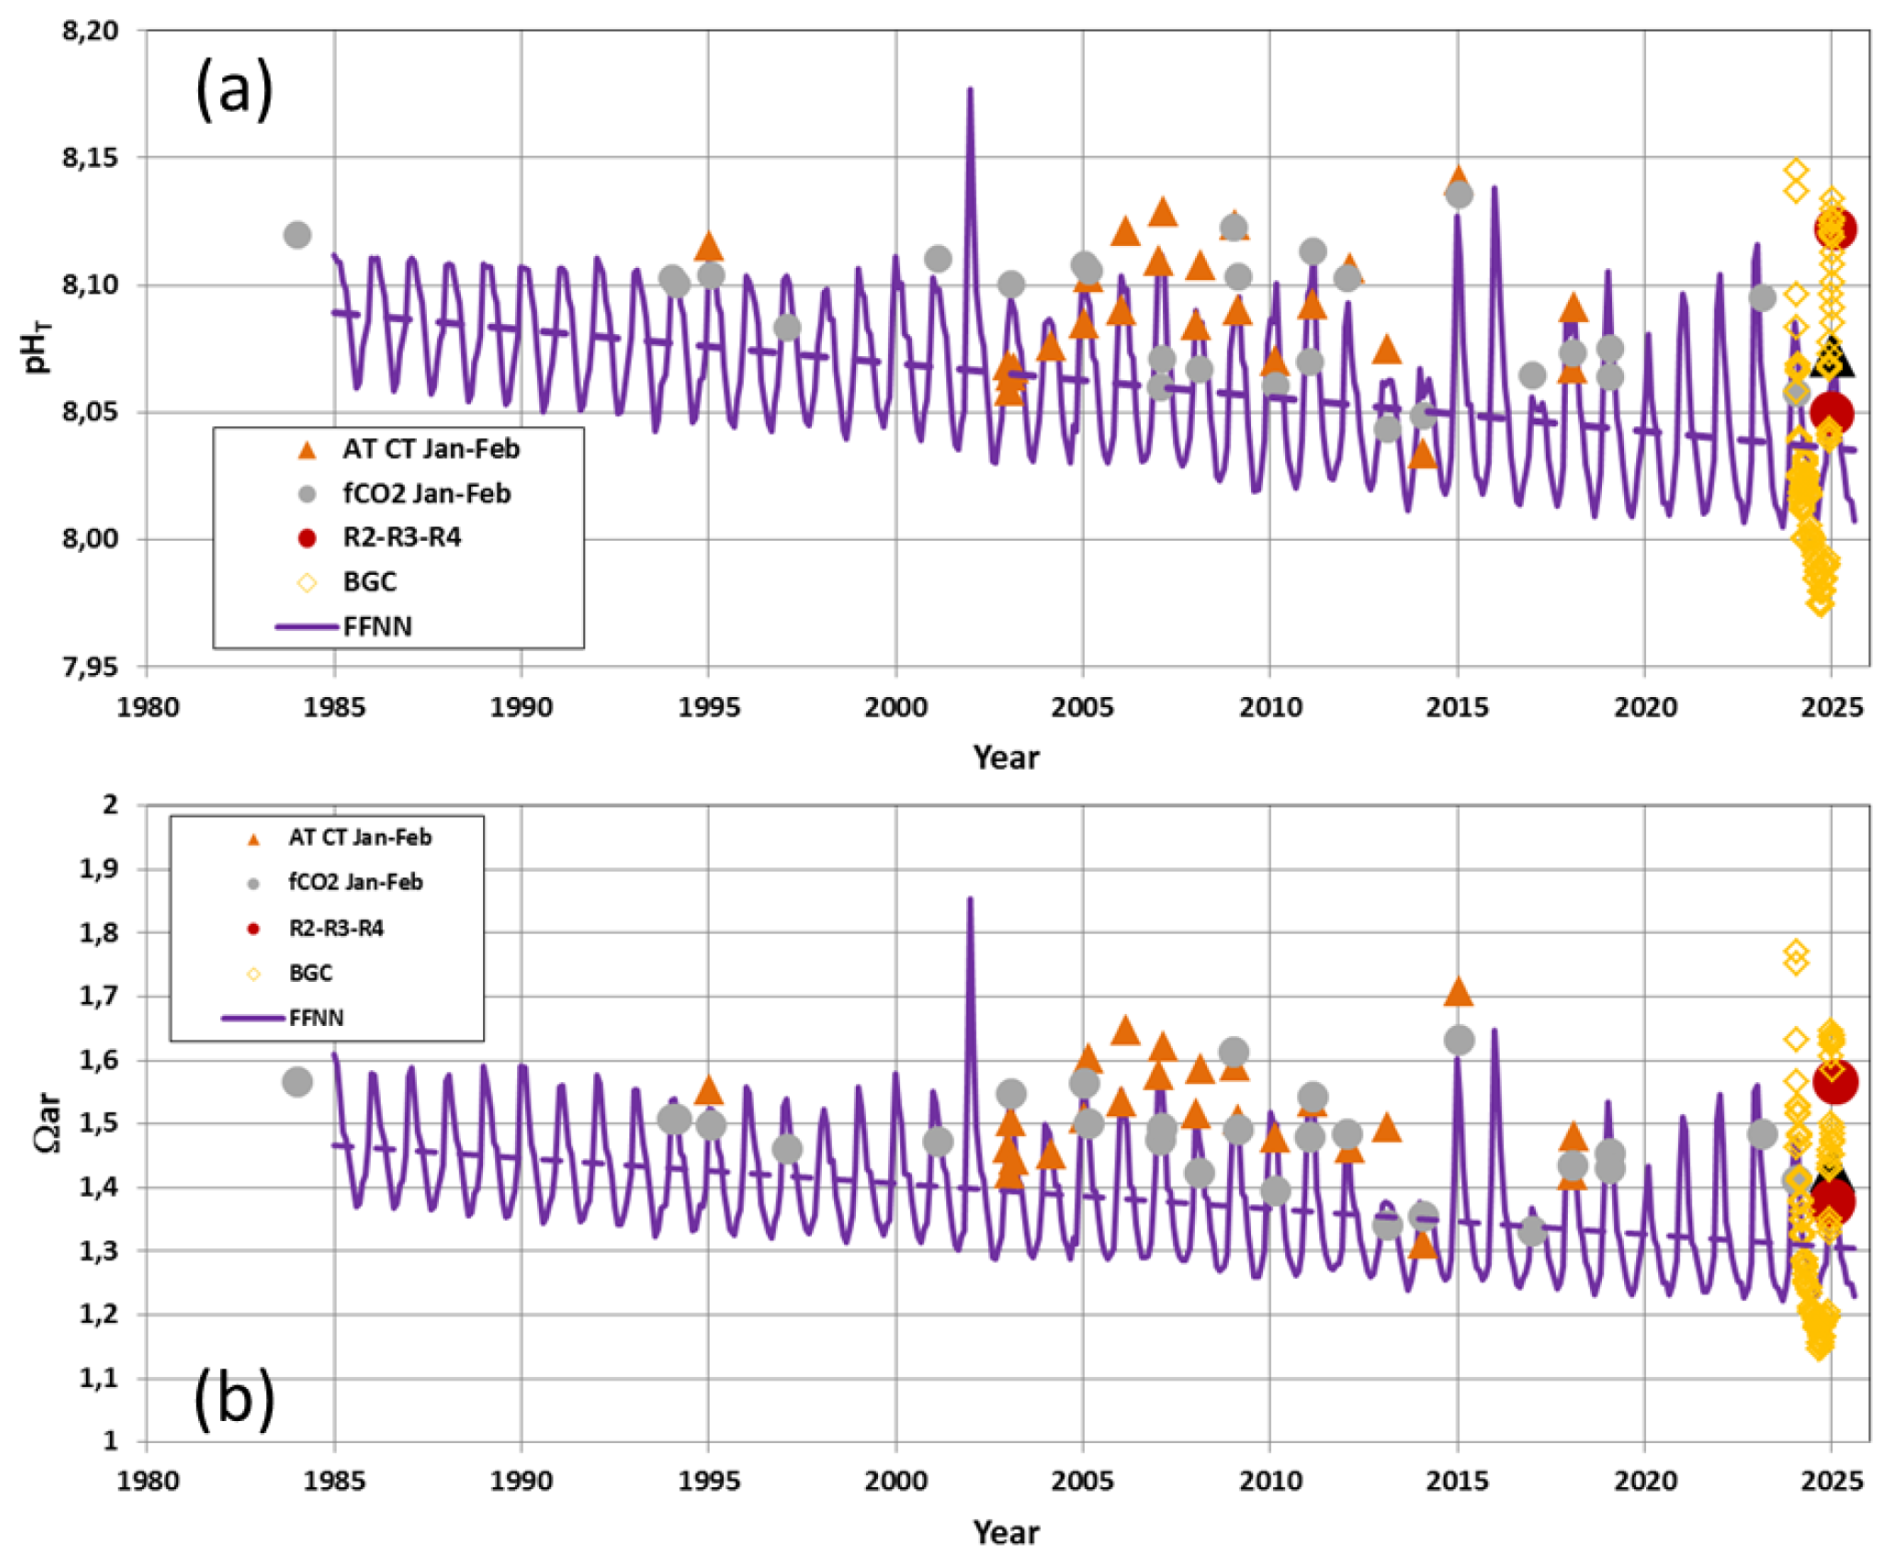
Figure 7Time-series of (a) pHT and (b) Ωar observed south of 65° S based on SOCAT fCO2 data in summer 1984–2024 (grey circles), from AT CT data in summer 1995–2018 (orange triangles), L'Astrolabe fCO2 data in summer 2025 (R2R3R4, red circles), AT CT data in 2025 (R2, black triangles) and BGC-Argo float data in 2024–2025 (open diamonds). Also shown are the monthly values of the FFNN model (purple) and the associated trend (dashed lines, see Table 3, pH = −0.0013 per year and Ωar = −0.0040 per year).
The observations indicate that the lowest Ωar occurred in winter 2024 (BGC-Argo data, Ωar = 1.146, on 6 September 2024). This is 0.25 lower than in 1985 and 0.15 lower than in 1996 and the decrease of Ωar in surface also occurred at depth (Fig. 8). In the mixed layer Ωar decreased from around 1.35 in August 1996 to 1.15 in winter 2024. Such a value is observed at 200 m in January 2025 and at 300–400 m in 1996 indicating an upward migration of Ωar (Pardo et al., 2017). We noticed that the FFNN value in August 1996 (Ωar = 1.34) was coherent with that observed in August 1996 in the mixed-layer (Fig. 8). In August 2024 and 2025, the FFNN value (Ωar = 1.23) is close to that observed from the float in winter 2024 (Ωar = 1.2) and to the data observed at 200 m in 1996 or at 75 m in 2025. The distribution of Ωar for the FFNN is more homogeneous in winter (Fig. S9) and provides a smaller error estimate of the long term trend but is constrained by few observations. The FFNN model also has a more variable air–sea CO2 flux during summer compared to winter (Fig. S10), leading to significant change in annual CO2 uptake (Fig. 2). The seasonal amplitude from the FFNN results also show significant variability over 5–10 years after 1998 (Fig. S11) but no trend of the fCO2 seasonality was detected as was suggested in other ocean regions (e.g. Landschützer et al., 2018; Rodgers et al., 2023; Shadwick et al., 2023). To estimate the processes that drive the pHT and Ωar changes we focus on results for the winter season.
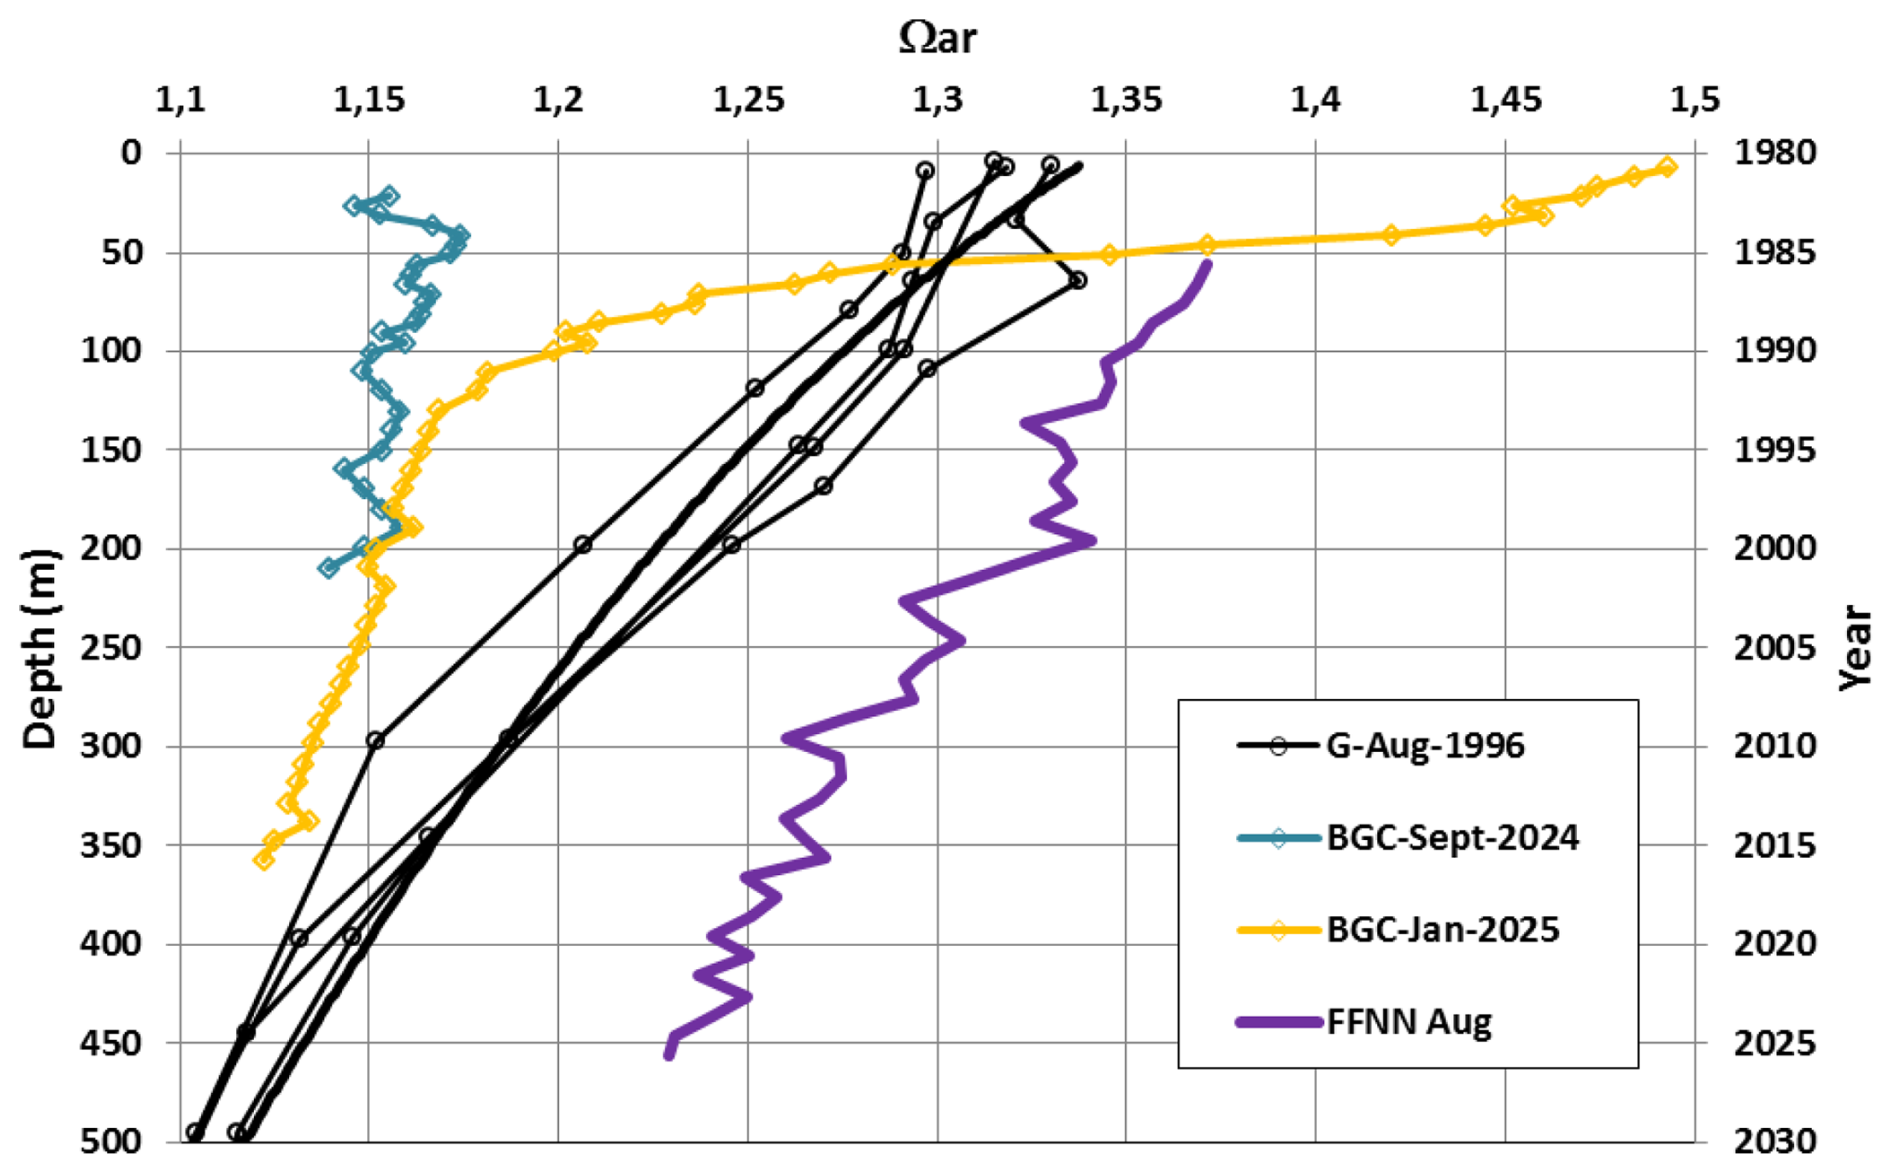
Figure 8Profiles (0–500 m left axis) of Ωar in August 1996 (GLODAP data, black circles), September 2024 (BGC-Argo, blue diamonds) and January 2025 (BGC-Argo, orange diamonds) along with surface time-series in 1985–2025 (right axis) of Ωar in August from the FFNN model (purple line). In the mixed layer Ωar decreased from around 1.35 in 1996 to 1.15 in 2024 (i.e. a value observed at 300–400 m in 1996). The FFNN values in August 1996 are coherent with August 1996 observations in the mixed-layer. In August 2025, Ωar FFNN value of 1.23 is close to the data observed at 200 m in 1996 or at 75 m in 2025 demonstrating the upward shift of Ωar.
Table 2Trends of properties (per year) in layers 100–150, 150–200 and 200–250 m for 1995–2024. Standard-deviations are in bracket.
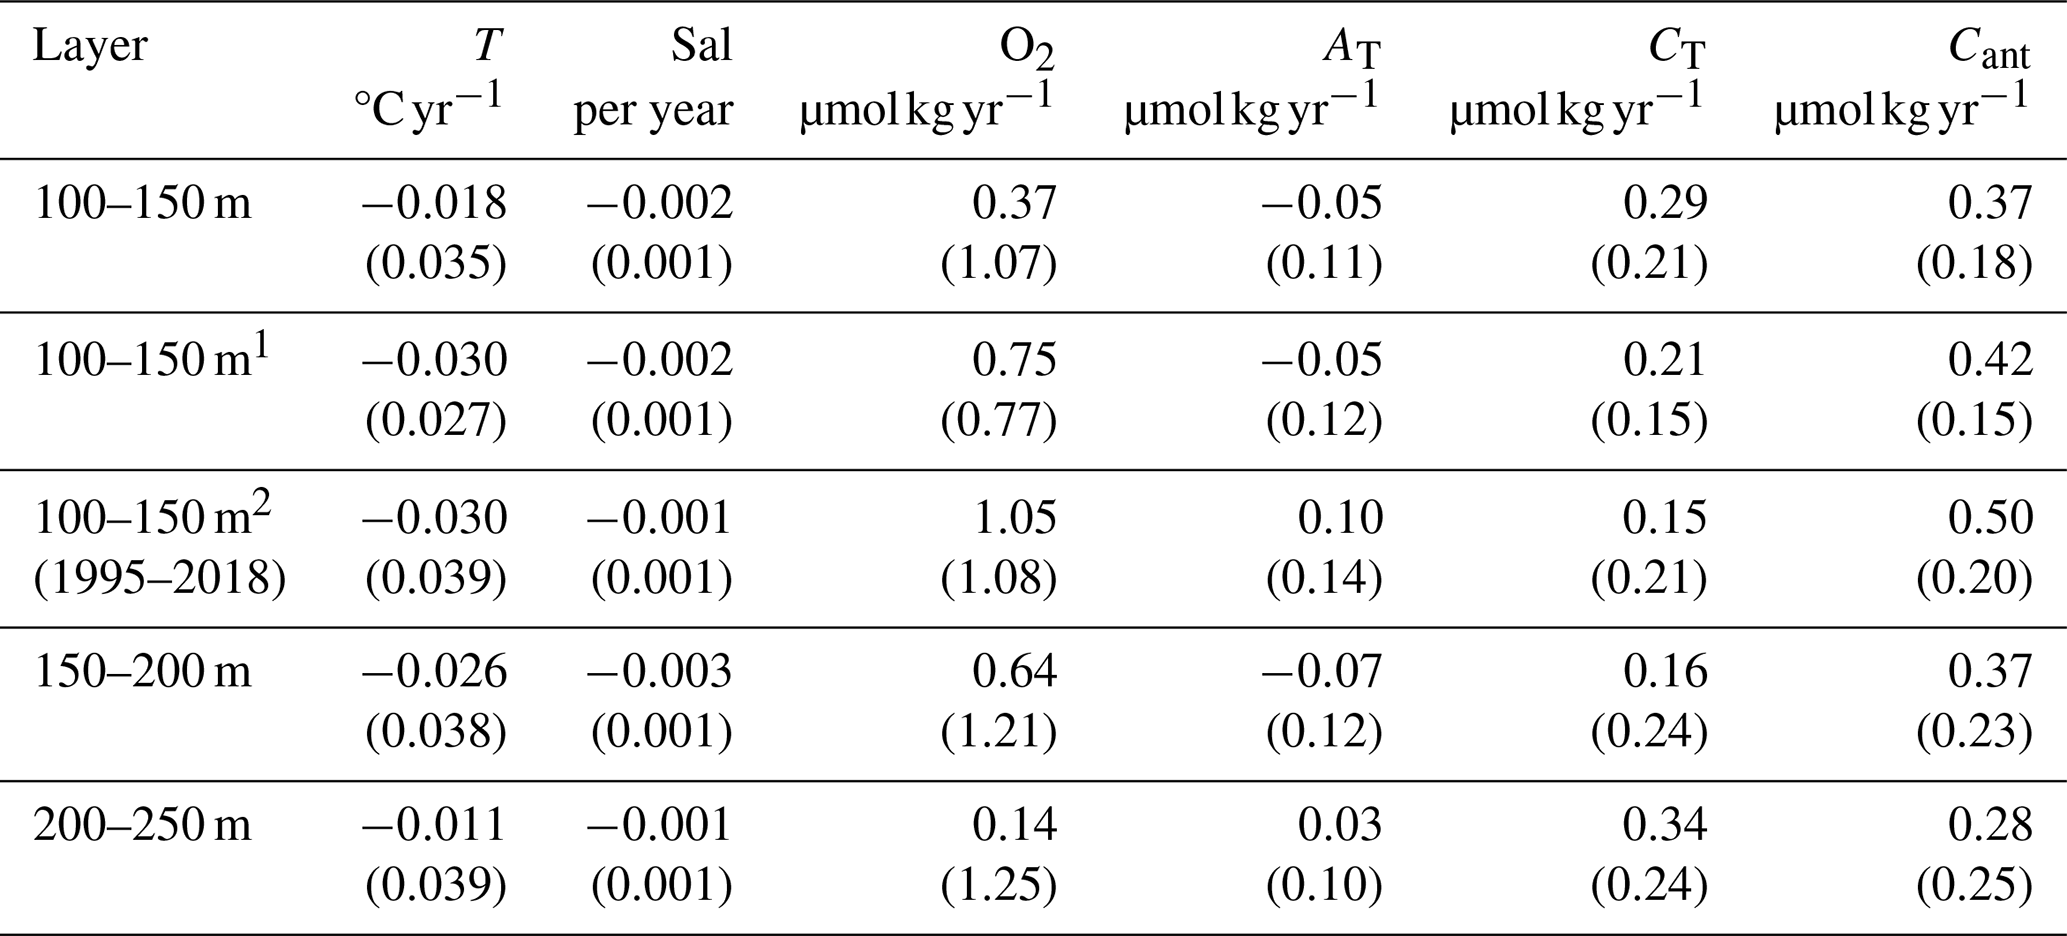
1 Indicates results without the 2013 anomaly. 2 Indicates results without the 2013 anomaly and without the 2024 BGC-Argo data.
3.4 Anthropogenic CO2
To estimate the anthropogenic CO2 concentrations (Cant) in the water column we used the TrOCA method developed by Touratier et al. (2007). This method was successfully used in the southern Ocean (Shadwick et al., 2014; Kerr et al., 2018; Mahieu et al., 2020; Zhang et al., 2023; Metzl et al., 2024b). Here we selected the data below 100 m depth for 1994–2018 and from the BGC-Argo float (March 2024 to January 2025, Fig. S12). The Cant trends were tested in three layers, 100–150, 150–200 and 200–250 m (Fig. 9). In all layers, the mean Cant concentration ranged from 15–25 µmol kg−1 in 1995–1996 to 30–35 µmol kg−1 in 2024. CT and Cant concentrations present positive trends (Table 2, Figs. 9a and S13). No significant changes were observed for AT (not shown) but we noticed that δ13C observations in January 2025 were lower than in January 2003 suggesting that surface waters captured the anthropogenic Suess effect signal (Fig. S14) as previously observed in this region (McNeil et al., 2001). Without the BGC-Argo data the Cant trend would be +0.50 ± 0.20 . This is almost the same as derived for surface CT in winter from the FFNN model (0.44 ± 0.01 ) and equal to the trend derived from only two winter observations (Table 1). The anthropogenic subsurface CO2 signal was also present in the winter surface data, but these are based on only two observational periods. Our results are similar to previous Cant trend estimates for the region, ranging between +0.35 and +0.65 (Pardo et al., 2017). In 2013 low Cant concentrations were estimated in the three layers and were associated with higher temperature, salinity, nitrate and CT, and lower O2 concentrations (Fig. S12) probably linked to regional import of warmer Upper Circumpolar Deep Water (UCDW) that contains high CT, low O2 and low Cant (e.g. Shadwick et al., 2014; Pardo et al., 2017). The FFNN model produced slightly higher surface CT concentrations in 2013 (+6 µmol kg−1, Figs. 9a and S13d). This 2013 anomaly has very little impact on the estimated trend; removing 2013 yields a trend of +0.42 compared to +0.37 for the whole time series (Table 2). To quantify the impact of Cant on the CT, pHT and Ωar trends in surface waters, we used both estimates (with or without 2013 data for sensitivity analysis). For the layer 100–150 m, the relationship of Cant versus atmospheric CO2 concentration, xCO2 (Fig. 9b) are as follow:
These equations are used to compare the time-series and project the trend in the future.
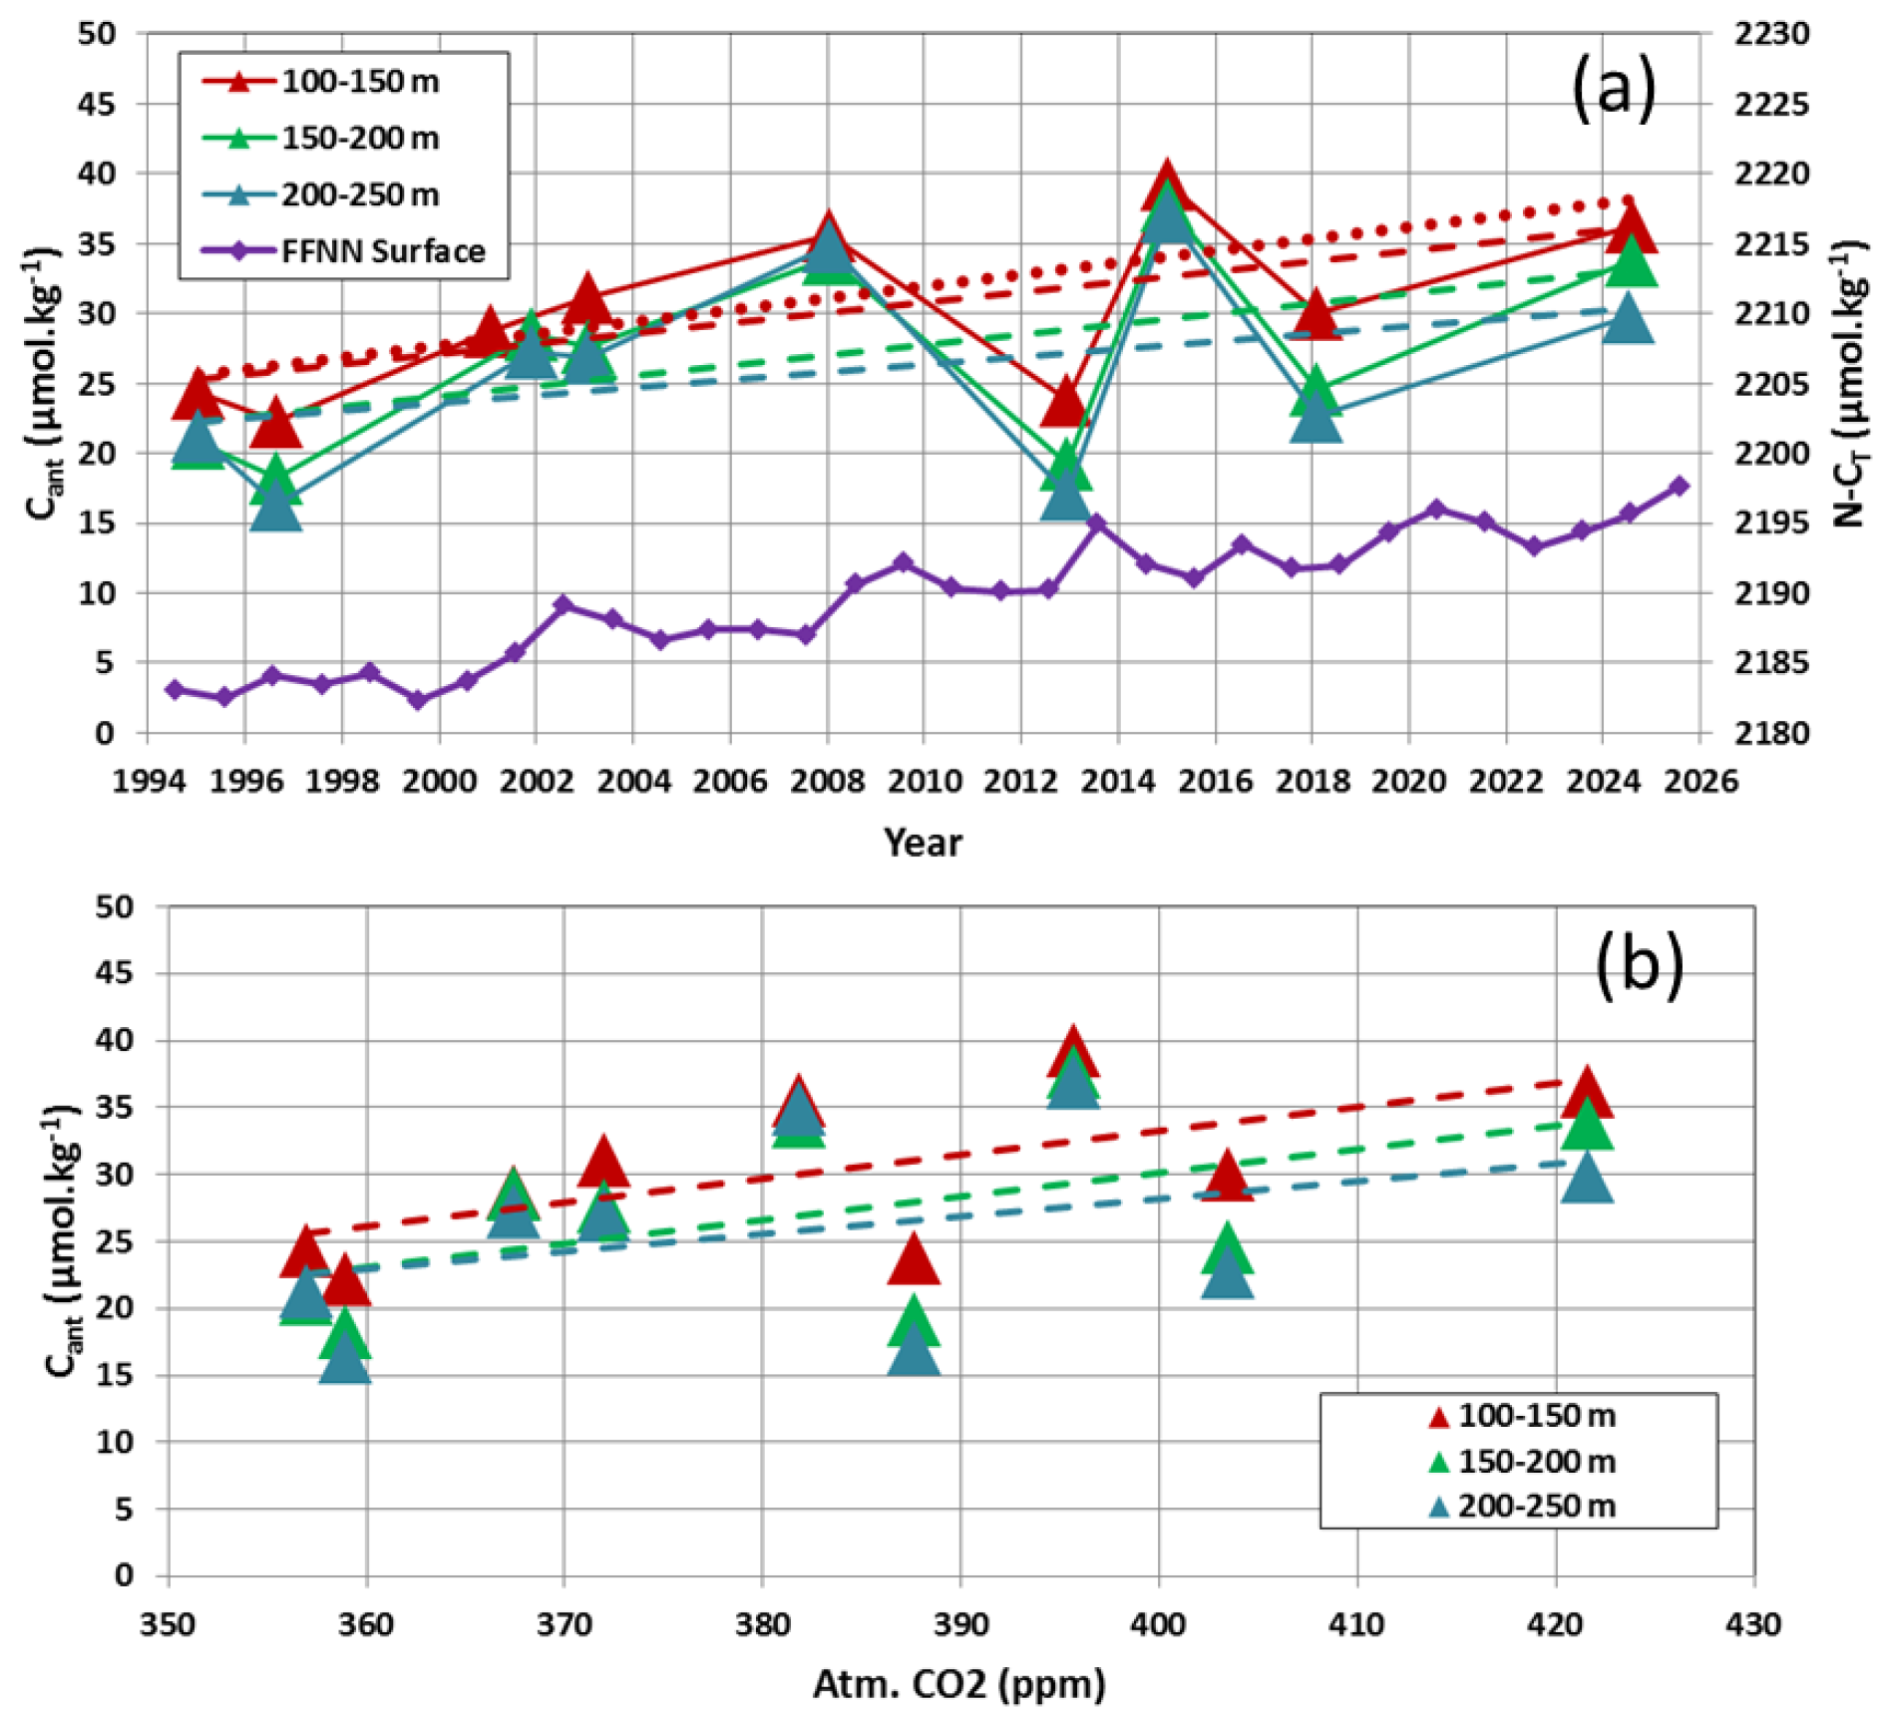
Figure 9(a) Time-series of anthropogenic CO2 (Cant µmol kg−1) estimated in 3 layers (below 100 m) from 1994–2024. The Cant trends are represented by dashed lines (see Table 2). Also shown the N−CT concentration (µmol kg−1, right axis) from the FFNN model in August (purple). (b) Same data for Cant versus atmospheric CO2 with associated slopes (dashed lines). For the reconstructed simulation in sea surface waters the results in layer 100–150 m were used with (red dashed) or without the 2013 anomaly (red dotted).
3.5 Carbonate system reconstruction and projection in the future
To reconstruct the temporal change of the carbonate system properties (Metzl et al., 2025b) we used the relations between Cant and atmospheric CO2 described above and calculated the CT concentration each year correcting CT as follows, where t represents the time-step in year, from 1960–2100:
The values of xCO2 in Eqs. (2), (3) or (4) were derived from SSP emissions scenarios (Shared Socioeconomic Pathways, Meinshausen et al., 2020). We selected a “high” emission scenario SSP5-8.5 and a stabilization scenario SSP2-4.5 and we applied Eq. (5) for August using either the Cant trend (Table 2) or Eq. (2) (Eqs. 3 or 4 were tested but led to the same results). Temperature, salinity and alkalinity were fixed (SST = −1.8 °C; SSS = 34.2; AT = 2310 µmol kg−1) and fCO2, pHT and Ωar were calculated using CO2sys_v2.5 (Orr et al., 2018).
The estimated CT using the Cant trend (Eq. 5) is close to the FFNN model and observations (Fig. 10a). The mean difference of CT between the FFNN model and the CT estimated for all years (1985–2025) is −1.72 ± 1.53 µmol kg−1. This suggests that anthropogenic CO2 is a main driver of CT changes but additional processes need to be included to explain the full trend in surface CT. In 2009 and 2013 the difference is larger than 4 µmol kg−1 (Fig. S15). As discussed above, the import of warm and CT-rich UCDW in 2013 likely increased the surface CT. For 2009 there was no data in the water column to explore such scenario but the same process may have occurred.
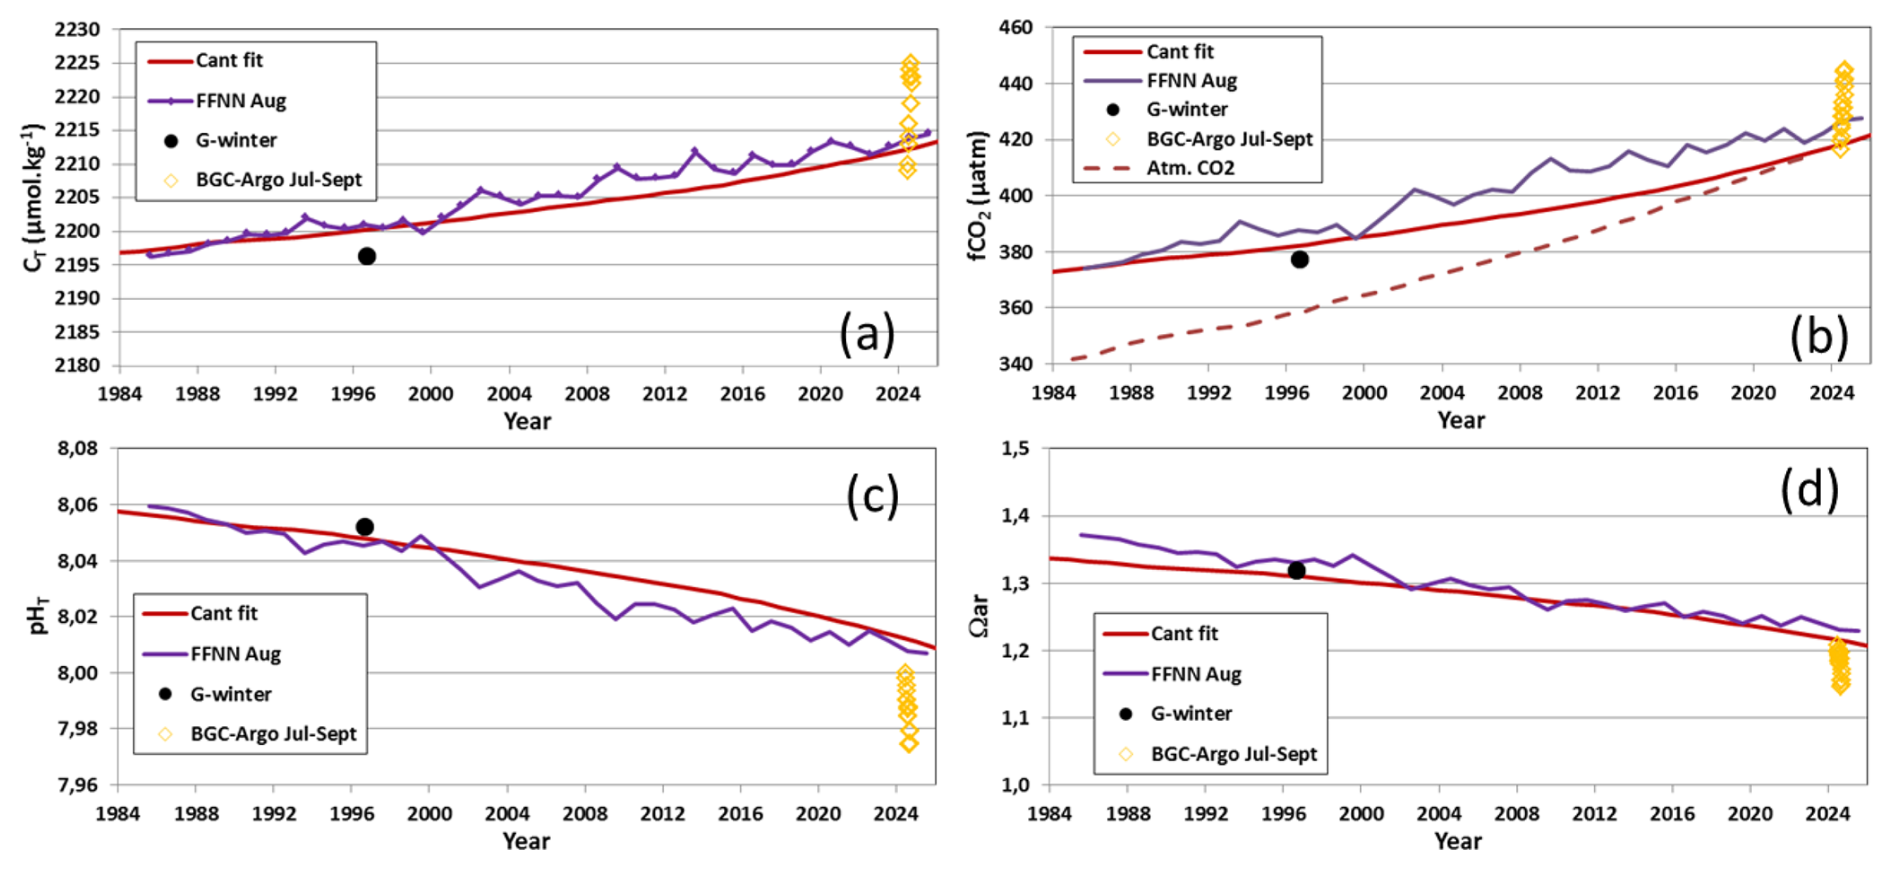
Figure 10Time-series of (a) CT concentrations, (b) atmospheric and oceanic fCO2, (c) pHT and (d) Ωar based on a reconstruction for August using Cant fit (red line, see Eq. 2). The reconstruction is compared with the FFNN model (purple), observations in winter 1996 and in winter 2024.
Table 3Sea surface values of properties in winter for different years and methods in the Adélie Land region (Fig. 12). Methods are from observations (Obs.), FFNN model (FFNN) and reconstructions based on two scenarios SSP2-4.5 (SSP45) and SSP2-8.5 (SSP85). For Cant the value is for the layer 100–150 m. The last line is for year 2090 using SSP2-85 scenario.
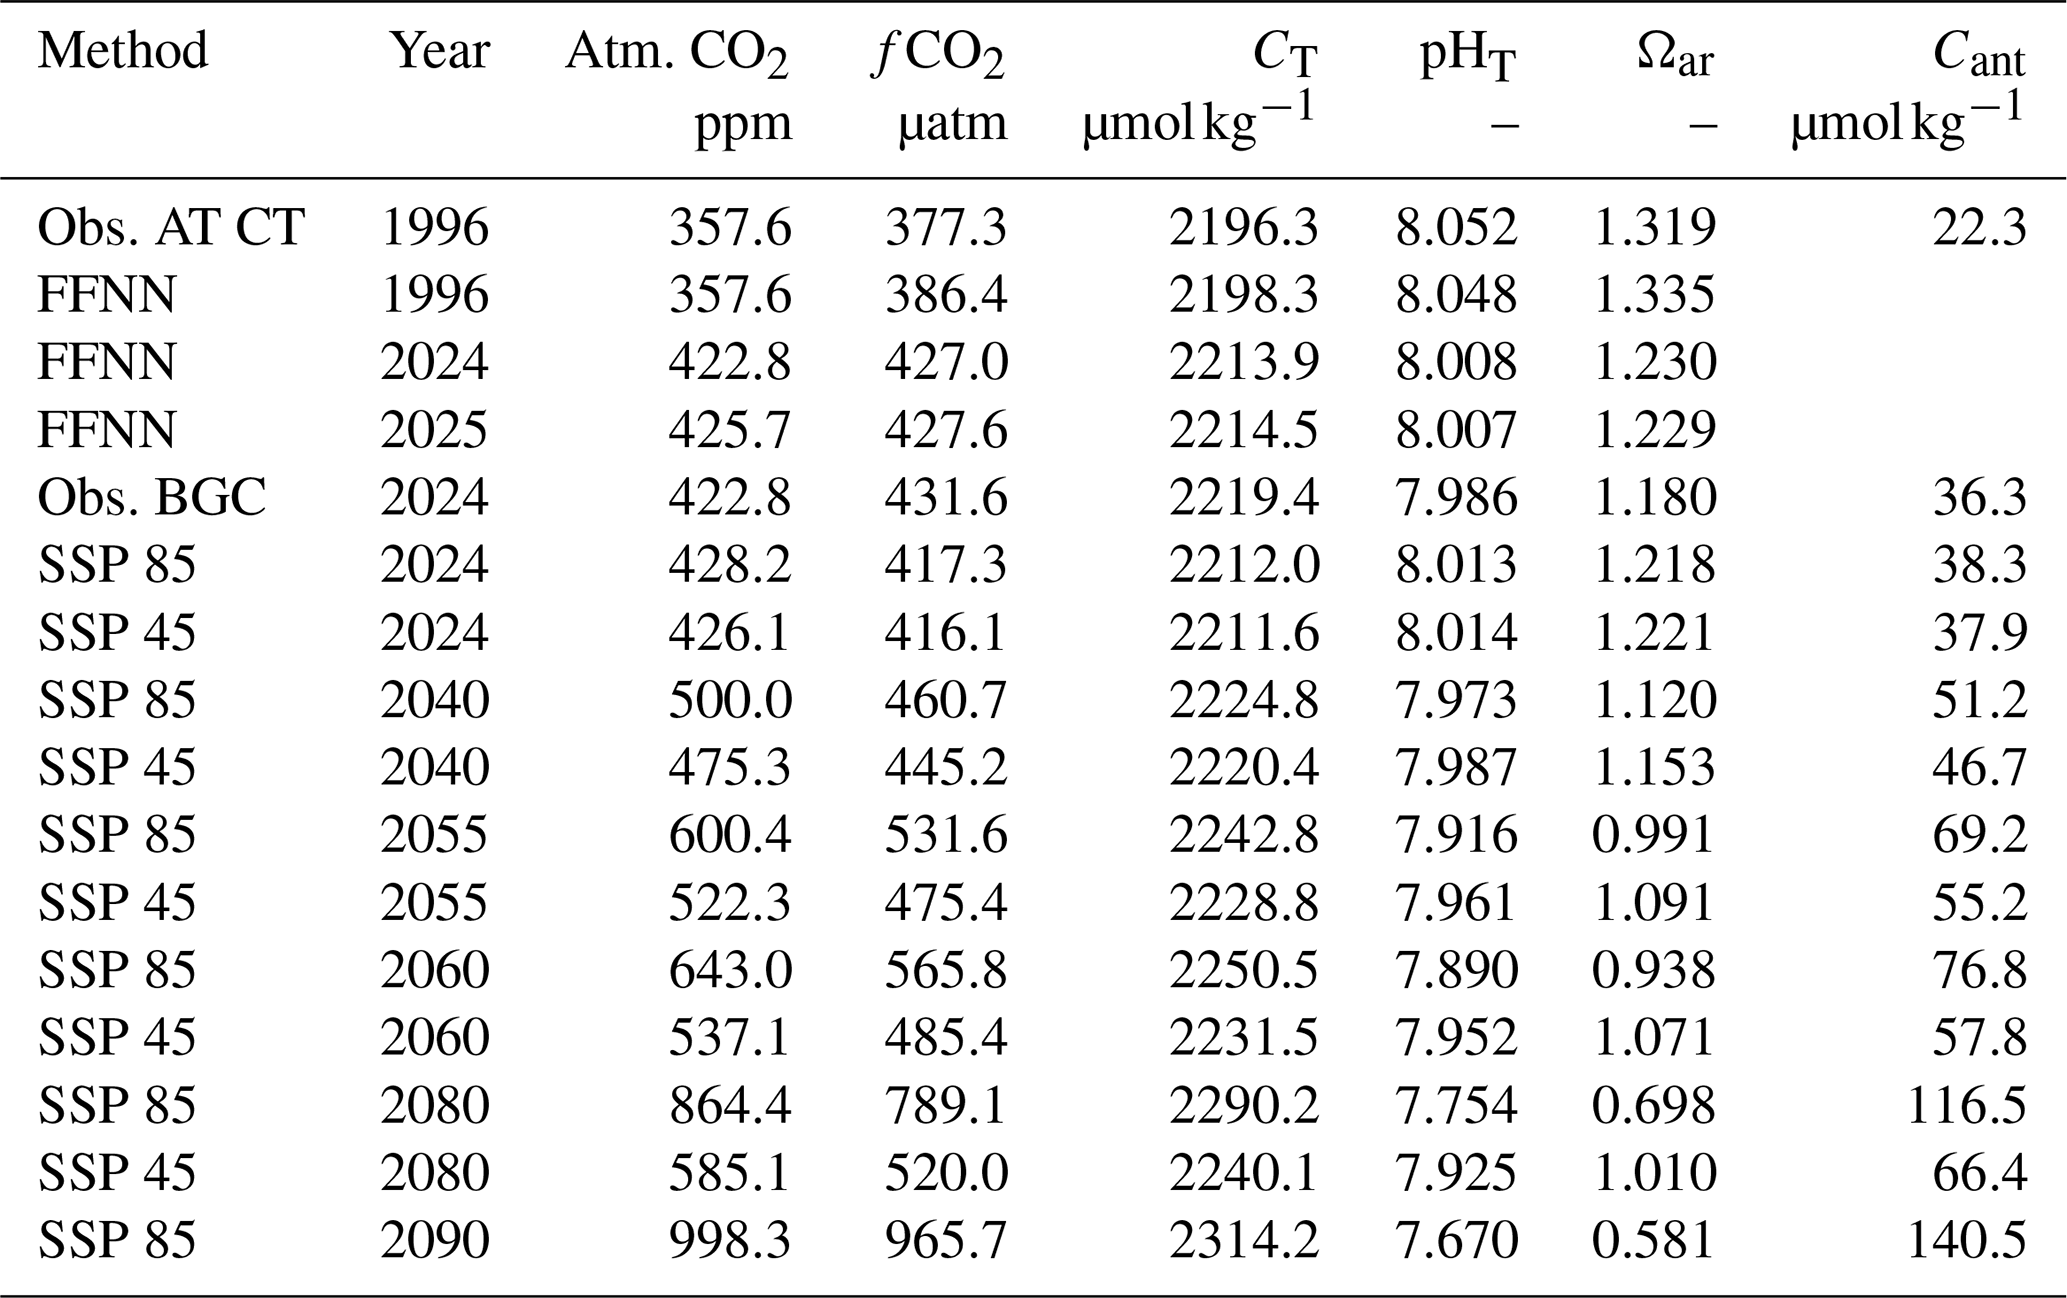
Based on this estimation, we conclude that the anthropogenic CO2 uptake is responsible for 70 % of the CT increase over 1985–2025. This also drives the decrease of pHT and Ωar (Fig. 10c and d). Projecting the trends from the FFNN model and the reconstruction, a value of 1.2 for Ωar would be reached in year 2032 from the FFNN model against 2034 for the estimation based on Eq. (5). If correct, this would lead to “severe shell dissolution” for pteropods (Bednaršek et al., 2019).
In the Adélie Land region the aragonite saturation depth (ASD, Ωar = 1) was observed at 1000 m in 1995 and at 700 m in 2011 (Pardo et al., 2017). In summer 2007/2008, Shadwick et al. (2014) also reported an ASD around 700–900 m. The data in 2018 and 2024 also identified the ASD at 800–1000 m but Ωar values close to 1 were also observed at 100 m (Fig. 11). At around 100–200 m depth, this is probably linked to remineralized CT in the remnant winter water layer, leading to homogeneous and low Ωar (1.15) after mixing/upwelling in wintertime (Fig. 8).
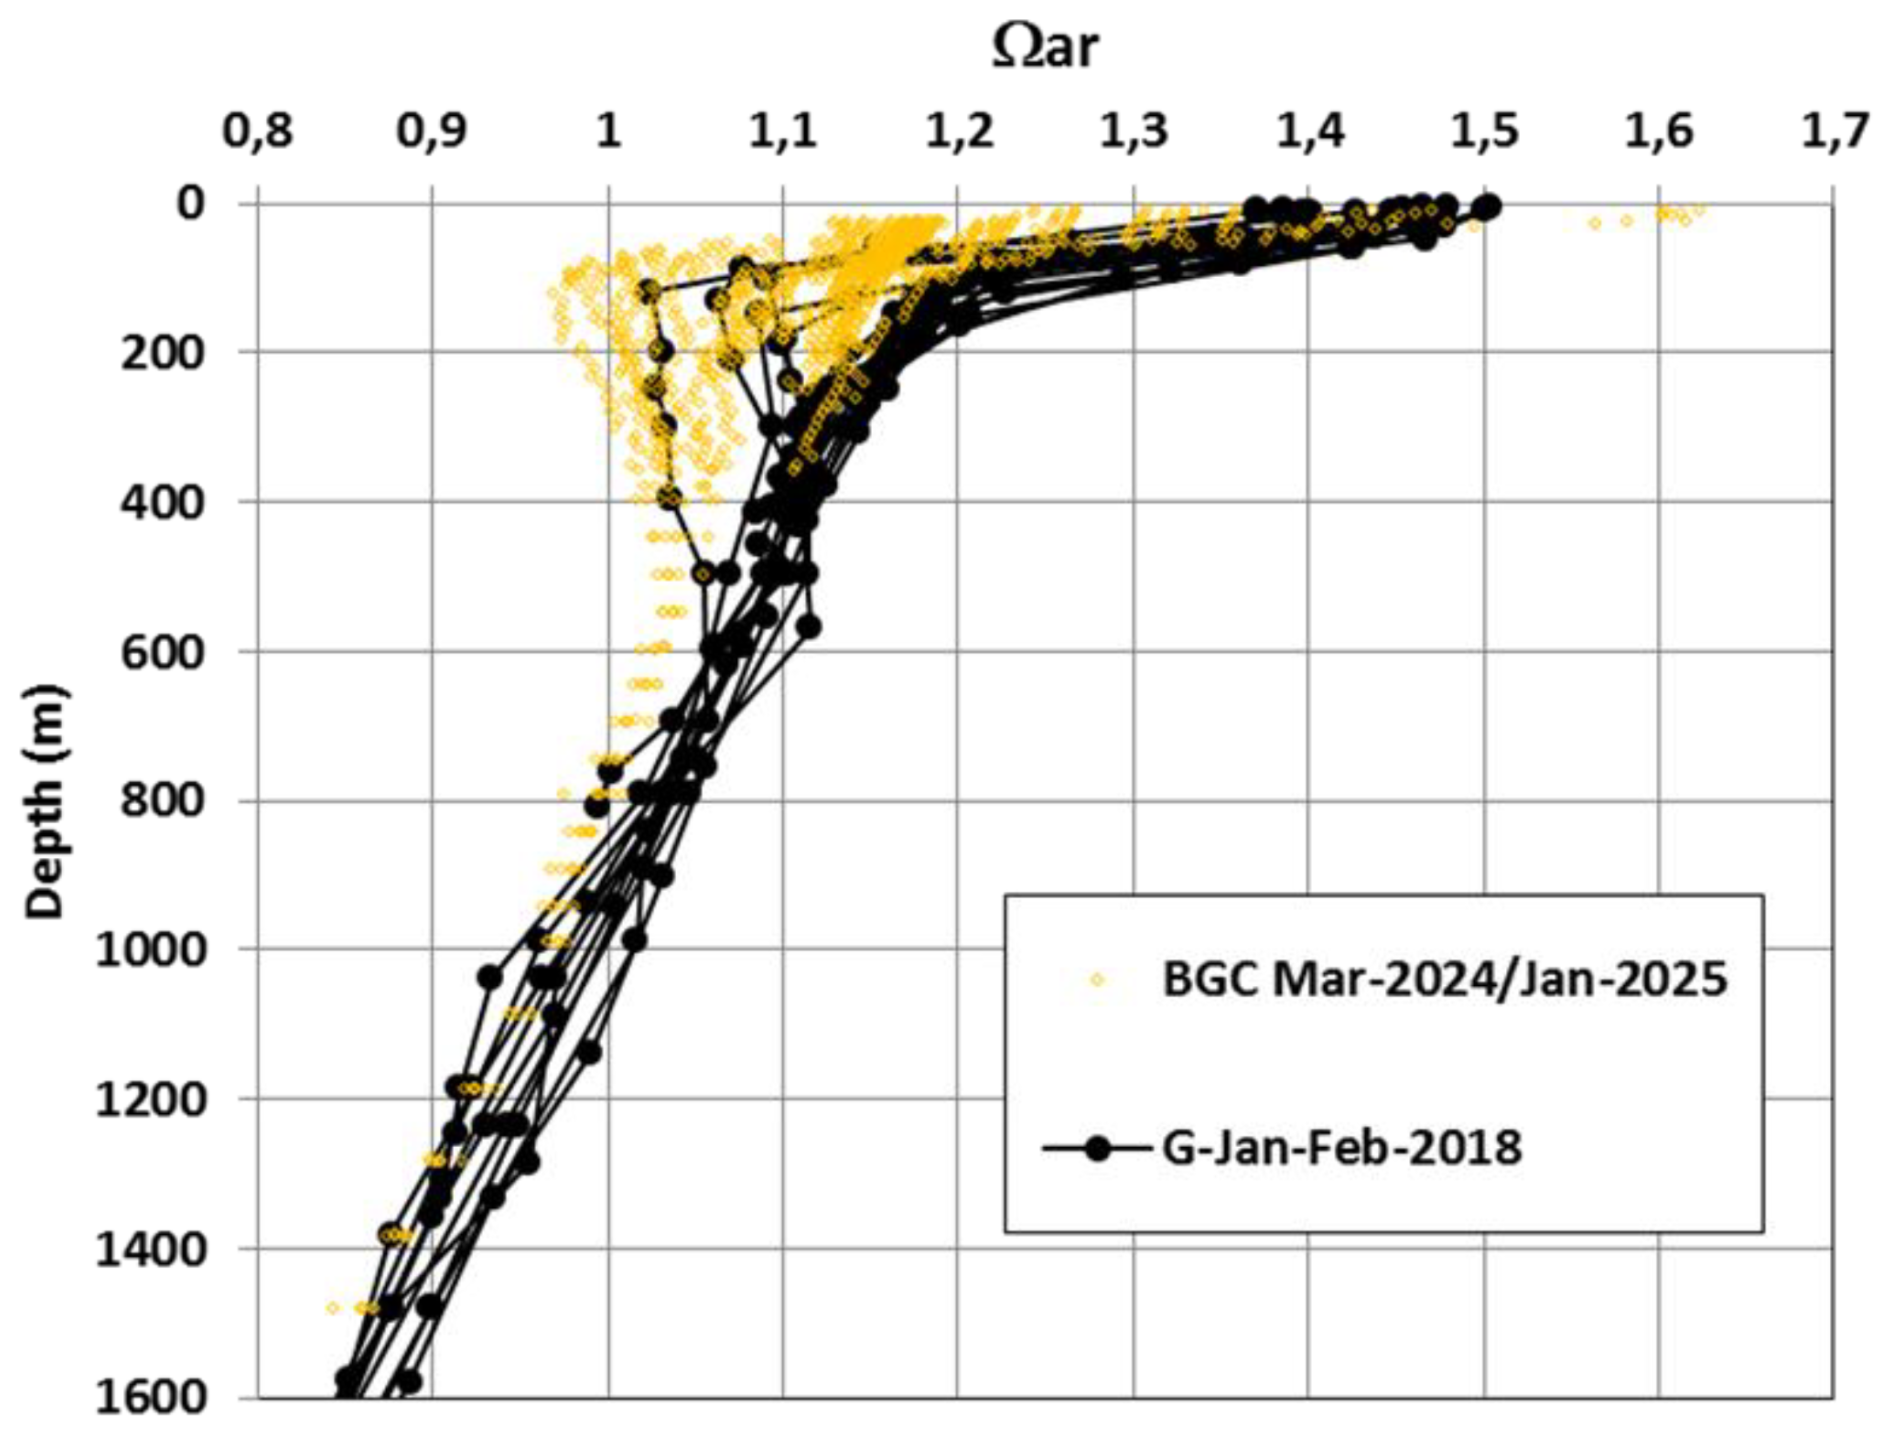
Figure 11Profiles of Ωar in January–February 2018 (GLODAP data, black circles) and in March 2024/January 2025 (BGC-Argo, orange diamonds). Ωar saturation state (Ωar = 1) occurred at depth (800–1000 m) and is also identified around 100 m.
We are now interested in exploring when the aragonite undersaturation would be reached in surface waters (Fig. 12). The sensitivity analysis based on the two relationships (Eqs. 2 and 3) show similar results. Differences between the two future scenarios (SSP5-8.5 and SSP2-4.5) are large after 2040 (Table 3). For the high scenario, the surface CT concentrations reaches 2250 µmol kg−1 in 2060, a concentration observed in the Adélie Land Bottom Water (ALBW) (Shadwick et al., 2014). After 2060, pHT is lower than 7.9. Based on the high scenario, the aragonite undersaturation would be reached in 2055 (at atmospheric CO2 = 600 ppm). This is much sooner than deduced in the Southern Ocean from the Coupled Model Intercomparison Project Phase 6 (CMIP6) global models (Ωar = 1.04 in 2080, Table S9 in Jiang et al., 2023) and would have potential dramatic impact on species such as pteropods (Bednaršek et al., 2012, 2023) as well as for diatoms abundant in the SO (e.g. Petrou et al., 2019; Duncan et al., 2022).
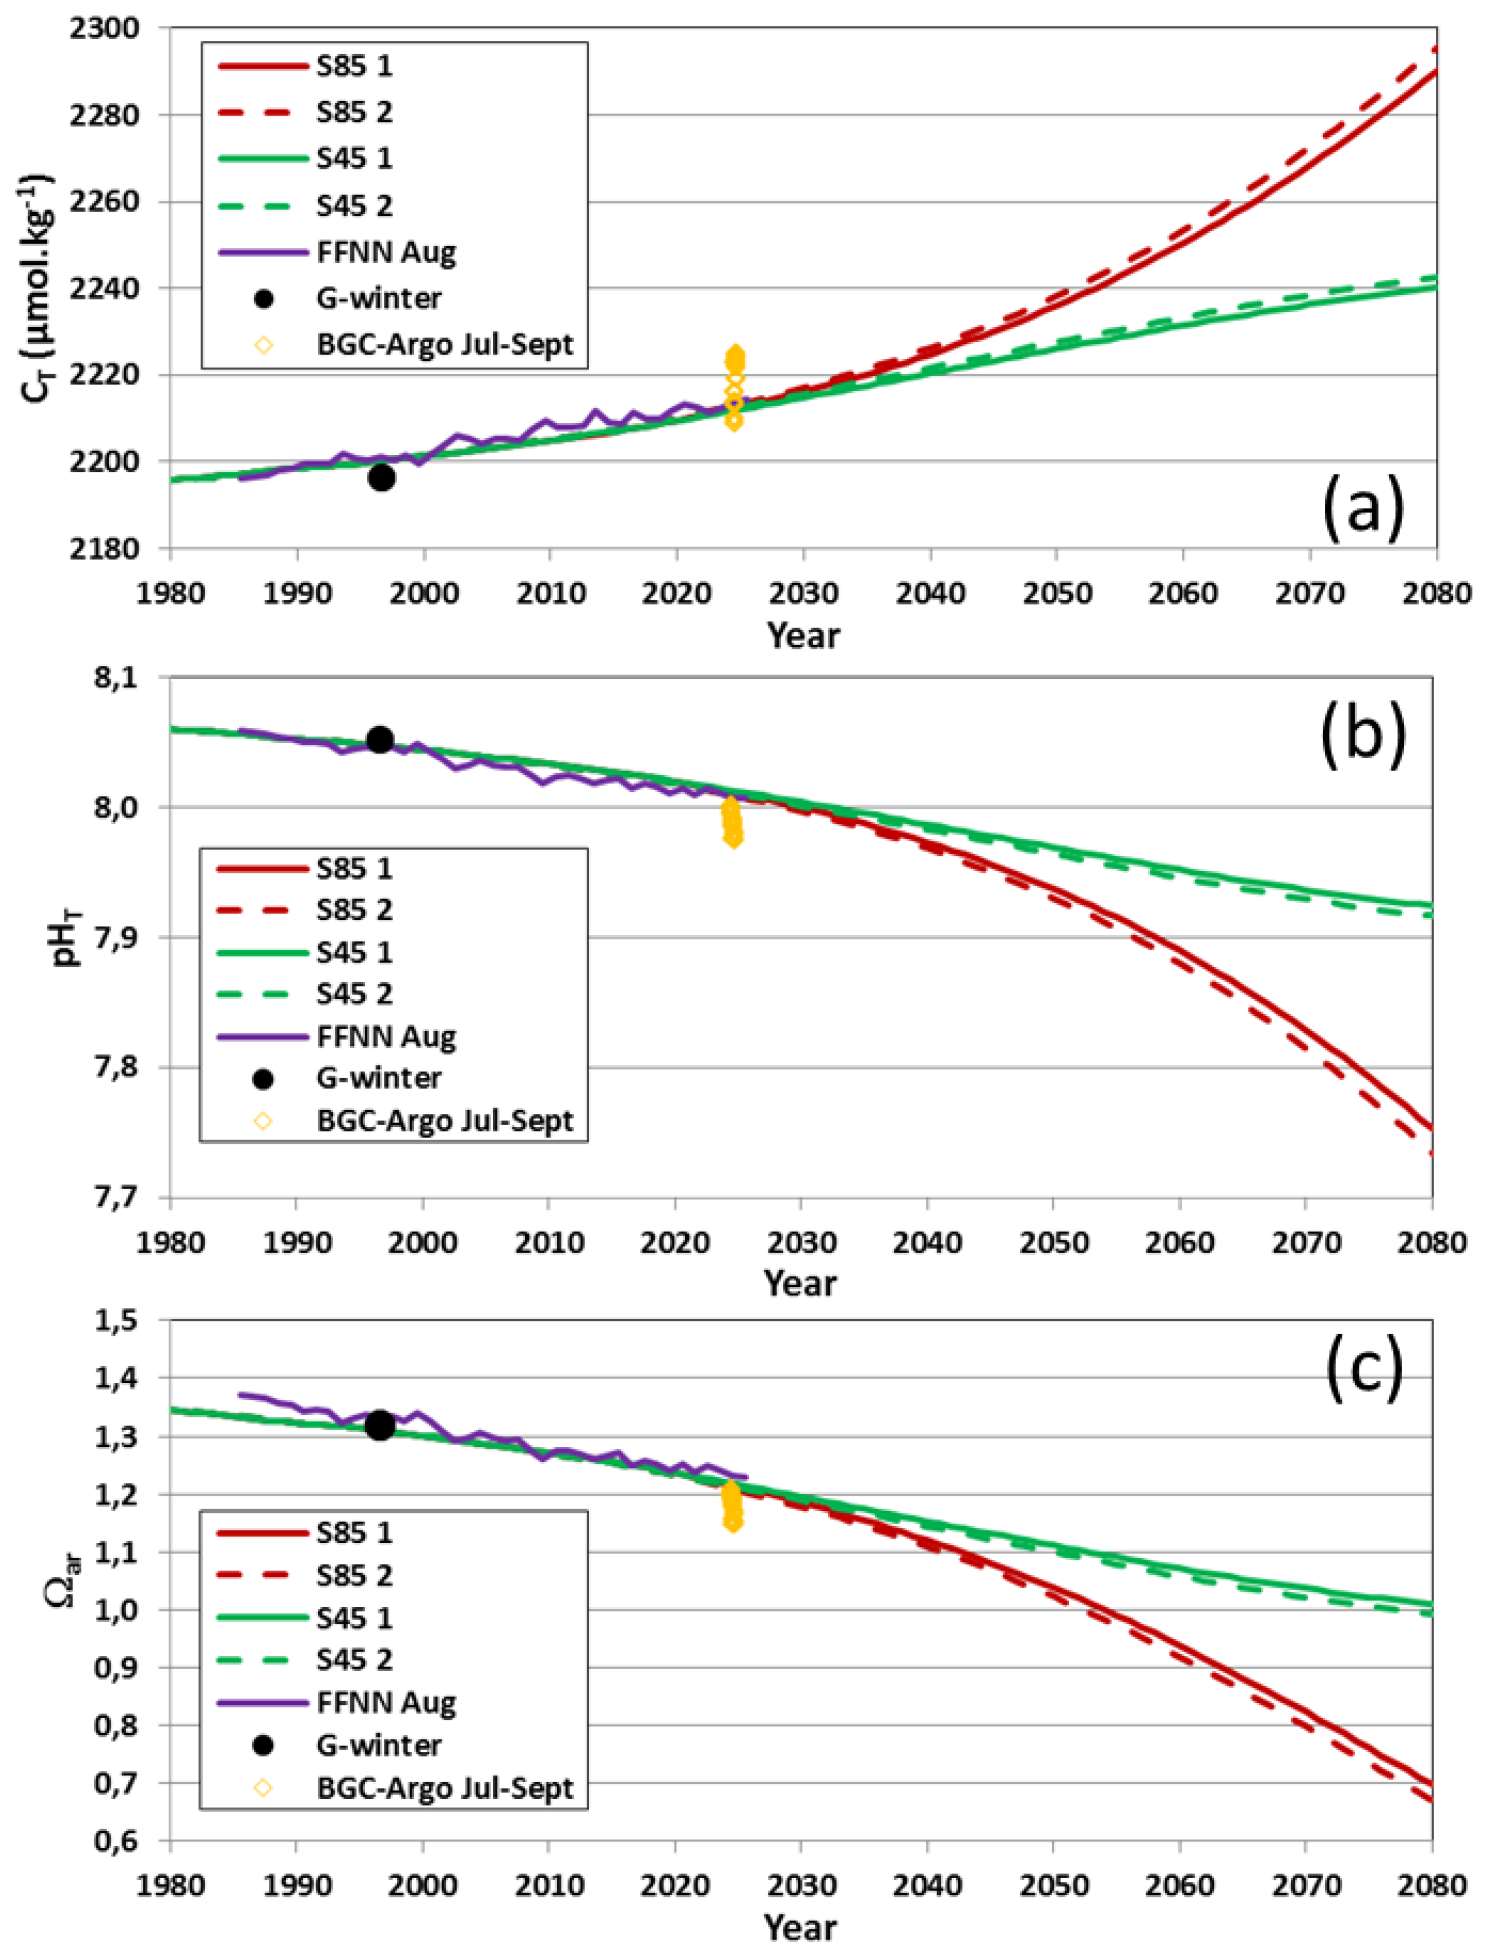
Figure 12Time-series of (a) CT concentrations, (b) pHT and (c) Ωar on a reconstruction for August for two scenarios (SSP85, red line and SSP45 green lines). Observations in winter 1996 and 2024 and the FFNN-LSCE model over 1985–2025 in August (purple) are also shown. The simulations based on Cant trend with (line) or without (dashed) 2013 anomaly are presented.
In our projection, the Cant concentration of 25 µmol kg−1 in 1990 will reach 140.5 µmol kg−1 in 2090 for the scenario SSP5-8.5. In 2090, a pHT of 7.67 and an Ωar of 0.581 are in line with the results of a high-resolution ocean model in the East Antarctica region (a proposed Marine Protected Area, Nissen et al., 2024). Their model suggested that aragonite undersaturation would occur in 2050, coherent with our projection (2055, Fig. 12). For a low emission scenario (SSP2-4.5) this would not occur before 2080 (Fig. 12).
New shipboard fCO2, CT, AT and BGC-Argo pHT observations in 2024 and 2025 and historical fCO2 data available since 1984 were used to evaluate the decadal trends of the carbonate system in the Adélie Land region.
The sea surface CT and fCO2 measurements in summer 2024–2025 present very high variability linked to biological activity. The mean measured fCO2 observation in January 2025 of 382.3 µatm was much higher than in January 1984 (fCO2 = 317.5 µatm) but in February 2025 fCO2 decreased to 317.8 ± 33.8 µatm close to fCO2 derived from the BGC-Argo float in January 2025 (311.6 ± 12.2 µatm). Previous fCO2 observations ranged from 179.2 µatm in 2002 to 376.7 µatm in 2007, highlighting the large inter-annual variability in summer.
In summer 2025, the measured CT between 2130 and 2190 µmol kg−1 were much lower than CT derived from the BGC-Argo data in winter 2024 (2221 µmol kg−1) whereas in winter 1996, the measured CT was 2207 µmol kg−1. The winter CT increase from 1996–2024 translates into a signal of anthropogenic CO2 uptake. Using an adapted relationship for this region, pHT and Ωar were calculated from CT or fCO2 data. We estimated a pHT decrease in surface waters from 8.054 ± 0.005 in winter 1996 (calculated from shipboard data) to 7.976 ± 0.002 in winter 2024 (measured from the BGC-Argo float). The calculated Ωar decreased from 1.334 ± 0.017 in 1996 to 1.157 ± 0.009 in 2024. Such low Ωar (1.03 ± 0.10) has been also observed in summer 2015 in the Gerlache Strait, Antarctic Peninsula (Kerr et al., 2018).
As most data were available in summer, the results of a monthly FFNN model were used to estimate the long-term trends. The FFNN model informed that the region was a permanent CO2 sink and most pronounced since 2006. The maximum sink occurred in 2023 (−1.2 ) when the SAM was positive. Results from the FFNN model indicate a pHT decrease of −0.013 per decade and Ωar decrease of −0.035 per decade over 1985–2025 in winters. As no change in alkalinity was observed, the OA was mainly explained by the CT increase (0.44 ± 0.01 ) associated with accumulation of anthropogenic CO2 calculated from subsurface data since 1995.
A projection of the CT concentrations in the future, based on observed anthropogenic CO2 concentrations and emissions scenarios, suggests that aragonite undersaturation would occur in surface water as soon as 2055 with potential impacts on plankton species such as pteropods (and many others species). Interestingly, our data-based analysis is in line with the results of a high-resolution ocean model dedicated to the Marine Protected Areas in the Antarctic coastal zone (Nissen et al., 2024). Their model suggests that climate-change feedbacks, through warming, sea-ice extend, or upwelling, might accelerate OA in these regions. Our simple projection (Fig. 12) does not take into account effects of warming, cooling, change of upwelling with CT-rich waters, or freshening. As opposed to other oceanic regions (Cheng et al., 2025), the Adélie Land coastal region experienced a surface cooling trend of between −0.1 and −0.3 °C per decade (Auger et al., 2021, for summer 1993–2017). For the period 1993–2023, Morrow and Kestenare (2025) also estimate a cooling of −0.06 °C per decade and a freshening of −0.012 per decade. Such a cooling and freshening would increase pHT by only +0.00897 and reduce Ωar by −0.00112 in 2100 representing a small change compared to the effect of CO2 emissions. The results presented here support maintaining observations in the Adélie Land region, both from shipboard and BGC-Argo floats, and to investigate property changes and OA in other Antarctic coastal zones.
Data used in this study are available in SOCAT (https://www.socat.info, last access: 7 July 2025; Bakker et al., 2016) for fCO2 surface data, and in GLODAP (https://www.glodap.info, last access: 7 July 2025) at https://doi.org/10.25921/zyrq-ht66 (Lauvset et al., 2023, 2024) for water-column data. The AT and CT underway data from OISO and MINERVE cruises are available in Seanoe (https://www.seanoe.org, last access: 7 July 2025) at https://doi.org/10.17882/102337 (Metzl et al., 2024a). The BGC-Argo float data with derived carbon parameters are available from SOCCOM (https://soccom.org, last access: 7 July 2025, https://www.mbari.org/products/data-repository/, last access: 7 July 2025). The CMEMS-LSCE-FFNN model data are available at EU Copernicus Marine Service Information (https://resources.marine.copernicus.eu/products, last access: 7 July 2025) at https://doi.org/10.48670/moi-00047 (E.U. Copernicus Marine Service Information, 2025).
The supplement related to this article is available online at https://doi.org/10.5194/bg-23-8457-2026-supplement.
CLM and NM are co-investigators of the ongoing Océan Indien Service d'Observation (OISO) project. J-BS is principal investigator of the Sustained Observation of the Southern Ocean (SOSO) project. BT, JA and CN provided the fCO2 data, AA analyzed the AT CT data and GR provided the C13 data from L'Astrolabe cruises in 2024–2025. NM provided the AT CT data from SNAPO-CO2 database. MG and FC developed the CMEMS-LSCE-FFNN model and AB provided the model results. NM started the analysis, wrote the draft of the manuscript and prepared the figures with contributions from all co-authors.
The contact author has declared that none of the authors has any competing interests.
Publisher's note: Copernicus Publications remains neutral with regard to jurisdictional claims made in the text, published maps, institutional affiliations, or any other geographical representation in this paper. The authors bear the ultimate responsibility for providing appropriate place names. Views expressed in the text are those of the authors and do not necessarily reflect the views of the publisher.
The Astrolabe data since 1996 were collected as part of a French–Australian collaboration. Underway fCO2 data from L'Astrolabe 2024–2025 and earlier Australian cruises were sourced from CSIRO and Australia's Integrated Marine Observing System (IMOS) – IMOS is enabled by the National Collaborative Research Infrastructure Strategy (NCRIS). The OISO program on-board Marion-Dufresne was supported by the French institutes INSU (Institut National des Sciences de l'Univers) and IPEV (Institut Polaire Paul-Emile Victor), OSU Ecce-Terra (at Sorbonne Université). We also acknowledge INSU/CNRS and OSU ECCE-Terra for supporting the SNAPO-CO2 facility housed by the LOCEAN laboratory in Paris/France. The development of the neural network model benefited from funding by the French INSU-GMMC project PPR-Green-Grog (grant no. 5-DS-PPR-GGREOG), the EU H2020 project AtlantOS (grant no. 633211), as well as through the Copernicus Marine Environment Monitoring Service (project 83-CMEMS-TAC-MOB). MG was funded by the European Union under grant agreement no. 101083922 (OceanICU). Views and opinions expressed are however those of the author(s) only and do not necessarily reflect those of the European Union or European Research Executive Agency. Neither the European Union nor the granting authority can be held responsible for them. The Surface Ocean CO2 Atlas (SOCAT, https://www.socat.info, last access: 7 July 2025) is an international effort, endorsed by the International Ocean Carbon Coordination Project (IOCCP) and the Surface Ocean Lower Atmosphere Study (SOLAS) to deliver a uniformly quality-controlled surface ocean CO2 database. We thank François Forget, Rafik Hassen-Khodja and Ehouarn Millour for discrete sampling during 2025 L'Astrolabe cruises. Rik Wanninkhof provided comments on a preliminary draft. We thank the associate editor Mathilde Hagens to manage this manuscript, and two anonymous reviewers for their suggestions that helped to improve this article.
This research has been supported by the Institut national des sciences de l'Univers (grant nos. SO/OISO, SNAPO-CO2, and 5-DS-PPR-GGREOG), the Sorbonne Université (grant nos. SNAPO-CO2 and SO/OISO), the European Commission, Horizon 2020 Framework Programme (grant no. 633211), the Institut Polaire Français Paul Emile Victor (grant no. SOCISSE), and the Commonwealth Scientific and Industrial Research Organisation, Marine National Facility (grant no. IMOS).
This paper was edited by Mathilde Hagens and reviewed by two anonymous referees.
Aoki, S., Kitade, Y., Shimada, K., Ohshima, K. I., Tamura, T., Bajish, C. C., Moteki, M., and Rintoul, S. R.: Widespread freshening in the Seasonal Ice Zone near 140 E off the Adelie Land Coast, Antarctica, from 1994–2012, J. Geophys. Res.-Oceans, 118, 6046–6063, https://doi.org/10.1002/2013JC009009, 2013.
Arroyo, M. C., Shadwick, E. H., Tilbrook, B., Rintoul, S. R., and Kusahara, K.: A continental shelf pump for CO2 on the Adélie Land coast, East Antarctica, J. Geophys. Res.-Oceans, 125, e2020JC016302, https://doi.org/10.1029/2020JC016302, 2020.
Auger, M., Morrow, R., Kestenare, E., Sallée, J.-B., and Cowley, R.: Southern Ocean in-situ temperature trends over 25 years emerge from interannual variability, Nat. Commun., 12, 514, https://doi.org/10.1038/s41467-020-20781-1, 2021.
Bakker, D. C. E., Pfeil, B., Landa, C. S., Metzl, N., O'Brien, K. M., Olsen, A., Smith, K., Cosca, C., Harasawa, S., Jones, S. D., Nakaoka, S., Nojiri, Y., Schuster, U., Steinhoff, T., Sweeney, C., Takahashi, T., Tilbrook, B., Wada, C., Wanninkhof, R., Alin, S. R., Balestrini, C. F., Barbero, L., Bates, N. R., Bianchi, A. A., Bonou, F., Boutin, J., Bozec, Y., Burger, E. F., Cai, W.-J., Castle, R. D., Chen, L., Chierici, M., Currie, K., Evans, W., Featherstone, C., Feely, R. A., Fransson, A., Goyet, C., Greenwood, N., Gregor, L., Hankin, S., Hardman-Mountford, N. J., Harlay, J., Hauck, J., Hoppema, M., Humphreys, M. P., Hunt, C. W., Huss, B., Ibánhez, J. S. P., Johannessen, T., Keeling, R., Kitidis, V., Körtzinger, A., Kozyr, A., Krasakopoulou, E., Kuwata, A., Landschützer, P., Lauvset, S. K., Lefèvre, N., Lo Monaco, C., Manke, A., Mathis, J. T., Merlivat, L., Millero, F. J., Monteiro, P. M. S., Munro, D. R., Murata, A., Newberger, T., Omar, A. M., Ono, T., Paterson, K., Pearce, D., Pierrot, D., Robbins, L. L., Saito, S., Salisbury, J., Schlitzer, R., Schneider, B., Schweitzer, R., Sieger, R., Skjelvan, I., Sullivan, K. F., Sutherland, S. C., Sutton, A. J., Tadokoro, K., Telszewski, M., Tuma, M., van Heuven, S. M. A. C., Vandemark, D., Ward, B., Watson, A. J., and Xu, S.: A multi-decade record of high-quality fCO2 data in version 3 of the Surface Ocean CO2 Atlas (SOCAT), Earth Syst. Sci. Data, 8, 383–413, https://doi.org/10.5194/essd-8-383-2016, 2016.
Bakker, D. C. E., Alin, S. R., Aramaki, T., Barbero, L., Bates, N., Gkritzalis, T., Jones, S. D., Kozyr, A., Lauvset, S. K., Macovei, V. A., Metzl, N., Munro, D. R., Nakaoka, S.-I., O'Brien, K. M., Olsen, A., Pierrot, D., Steinhoff, T., Sullivan, K. F., Sutton, A. J., Sweeney, C., Wada, C., Wanninkhof, R., Akl, J., Arbilla, L. A., Azetsu-Scott, K., Battisti, R., Beatty, C. M., Becker, M., Benoit-Cattin, A., Berghoff, C. F., Bittig, H. C., Bonin, J. A., Bott, R., Bozzano, R., Burger, E. F., Brunetti, F., Cantoni, C., Castelli, G., Chambers, D. P., Chierici, M., Corbo, A., Cronin, M., Cross, J. N., Currie, K. I., Dentico, C., Emerson, S. R., Enochs, I. C., Enright, M. P., Enyo, K., Ericson, Y., Evans, W., Fay, A. R., Feely, R. A., Fragiacomo, E., Fransson, A., Gehrung, M., Giani, M., Glockzin, M., Hamnca, S., Holodkov, N., Hoppema, M., Ibánhez, J. S. P., Kadono, K., Kamb, L., Kralj, M., Kristensin, T. O., Laudicella, V. A., Lefèvre, N., Leseurre, C., Lo Monaco, C., Maenner Jones, S., Maenza, R. A., McAuliffe, A. M., Mdokwana, B., Monacci, N. M., Musielewicz, S., Neill, C., Newberger, T., Nojiri, Y., Ohman, M. D., Ólafsdóttir, S. R., Olivier, L., Omar, A. M., Osborne, J., Pensieri, S., Petersen, W., Plueddemann, A. J., Rehder, G., Roden, N. P., Rutgersson, A., Sallée, J.-B., Sanders, R., Sarpe, D., Schirnik, C., Schlitzer, R., Send, U., Skjelvan, I., Sutherland, S. C., T'Jampens, M., Tamsitt, V., Telszewski, M., Theetaert, H., Tilbrook, B., Trull, T., Tsanwani, M., Van de Velde, S., Van Heuven, S. M. A. C., Veccia, M. H., Voynova, Y. G., Weller, R. A., and Williams, N. L.: Surface Ocean CO2 Atlas Database Version 2025 (SOCATv2025) (NCEI Accession 0304549), NOAA National Centers for Environmental Information [data set], https://doi.org/10.25921/648f-fv35, 2025.
Bednaršek, N., Tarling, G. A., Bakker, D. C. E., Fielding, S., Jones, E. M., Venables, H. J., Ward, P., Kuzirian, A., Lézé, B., Feely, R. A., and Murphy, E. J.: Extensive dissolution of live pteropods in the Southern Ocean, Nat. Geosci., 5, 881–885, https://doi.org/10.1038/NGEO1635, 2012.
Bednaršek, N., Feely, R. A., Howes, E. L., Hunt, B. P. V., Kessouri, F., León, P., Lischka, S., Maas, A. E., McLaughlin, K., Nezlin, N. P., Sutula, M., and Weisberg, S. B.: Systematic Review and Meta-Analysis Toward Synthesis of Thresholds of Ocean Acidification Impacts on Calcifying Pteropods and Interactions With Warming, Front. Mar. Sci., 6, 227, https://doi.org/10.3389/fmars.2019.00227, 2019.
Bednaršek, N., Feely, R. A., Pelletier, G., and Desmet, F.: Global synthesis of the status and trends of ocean acidification impacts on shelled pteropods, Oceanography, 36, 130–137, https://doi.org/10.5670/oceanog.2023.210, 2023.
Bender, M. L., Tilbrook, B., Cassar, N., Jonsson, B., Poisson, A., and Trull, T. W.: Ocean productivity south of Australia during spring and summer, Deep-Sea Res. Pt. I, 112, 68–78, https://doi.org/10.1016/j.dsr.2016.02.018, 2016.
Beucher, C., Tréguer, P., Hapette, A.-M., Corvaisier, R., Metzl, N., and Pichon, J.-J.: Intense summer Si-recycling in the surface Southern Ocean, Geophys. Res. Lett., 31, L09305, https://doi.org/10.1029/2003GL018998, 2004.
Boothroyd, A., Adams, V., Alexander, K., and Hill, N.: Stakeholder perceptions of the Commission for the Conservation of Antarctic Marine Living Resources Marine Protected Area planning process, Mar. Policy, 170, 106381, https://doi.org/10.1016/j.marpol.2024.106381, 2024.
Bourgeois, T., Orr, J. C., Resplandy, L., Terhaar, J., Ethé, C., Gehlen, M., and Bopp, L.: Coastal-ocean uptake of anthropogenic carbon, Biogeosciences, 13, 4167–4185, https://doi.org/10.5194/bg-13-4167-2016, 2016.
Brandon, M., Goyet, C., Touratier, F., Lefèvre, N., Kestenare, E., and Morrow, R.: Spatial and temporal variability of the physical, carbonate and CO2 properties in the Southern Ocean surface waters during austral summer (2005–2019), Deep-Sea Res. Pt. I, https://doi.org/10.1016/j.dsr.2022.103836, 2022.
Brévière, E., Metzl, N., Poisson, A., and Tilbrook, B.: Changes of oceanic CO2 sink in the Eastern Indian sector of the Southern Ocean, Tellus B, 58, 438–446, https://doi.org/10.1111/j.1600-0889.2006.00220.x, 2006.
Carter, B. R., Williams, N. L., Gray, A. R., and Feely, R. A.: Locally interpolated alkalinity regression for global alkalinity estimation, Limnol. Oceanogr.-Meth., 14, 268–277, https://doi.org/10.1002/lom3.10087, 2016.
Carter, B. R., Feely, R. A., Williams, N. L., Dickson, A. G., Fong, M. B., and Takeshita, Y.: Updated methods for global locally interpolated estimation of alkalinity, pH, and nitrate, Limnol. Oceanogr.-Meth., 16, 119–131, https://doi.org/10.1002/lom3.10232, 2017.
Carter, B. R., Feely, R. A., Wanninkhof, R., Kouketsu, S., Sonnerup, R. E., Pardo, P. C., Sabine, C. L., Johnson, G. C., Sloyan, B. M., Murata, A., Mecking, S., Tilbrook, B., Speer, K., Talley, L. D., Millero, F. J., Wijffels, S. E., Macdonald, A. M., Gruber, N., and Bullister, J. L.: Pacific anthropogenic carbon between 1991 and 2017, Global Biogeochem. Cy., 33, 597–617, https://doi.org/10.1029/2018GB006154, 2019.
Chau, T. T. T., Gehlen, M., and Chevallier, F.: A seamless ensemble-based reconstruction of surface ocean pCO2 and air–sea CO2 fluxes over the global coastal and open oceans, Biogeosciences, 19, 1087–1109, https://doi.org/10.5194/bg-19-1087-2022, 2022.
Chau, T.-T.-T., Gehlen, M., Metzl, N., and Chevallier, F.: CMEMS-LSCE: a global, 0.25°, monthly reconstruction of the surface ocean carbonate system, Earth Syst. Sci. Data, 16, 121–160, https://doi.org/10.5194/essd-16-121-2024, 2024a.
Chau, T.-T.-T., Chevallier, F., and Gehlen, M.. Global analysis of surface ocean CO2 fugacity and air–sea fluxes with low latency, Geophys. Res. Lett., 51, e2023GL106670, https://doi.org/10.1029/2023GL106670, 2024b.
Cheng, L., Abraham, J., Trenberth, K. E., Reagan, J., Zhang, H.-M., Storto, A., Von Schuckmann, K., Pan, Y., Zhu, Y., Mann, M. E., Zhu, J., Wang, F., Yu, F., Locarnini, R., Fasullo, J., Huang, B., Graham, G., Yin, X., Gouretski, V., Zheng, F., Li, Y., Zhang, B., Wan, L., Chen, X., Wang, D., Feng, L., Song, X., Liu, Y., Reseghetti, F., Simoncelli, S., Chen, G., Zhang, R., Mishonov, A., Tan, Z., Wei, W., Yuan, H., Li, G., Ren, Q., Cao, L., Lu, Y., Du, J., Lyu, K., Sulaiman, A., Mayer, M., Wang, H., Ma, Z., Bao, S., Yan, H., Liu, Z., Yang, C., Liu, X., Hausfather, Z., Szekely, T., and Gues, F.: Record High Temperatures in the Ocean in 2024, Adv. Atmos. Sci., 42, 1092–1109, https://doi.org/10.1007/s00376-025-4541-3, 2025.
Deng, P., He, S., Zhang, Z., Smith, W. O., Jr., He, J., Lan, M., Du, Z., and Le, C.: Increased carbon sink within the seasonal sea ice zone associated with climate variability in the Southern Ocean, Geophys. Res. Lett., 52, e2025GL118274, https://doi.org/10.1029/2025GL118274, 2025.
Dickson, A. G.: Standard potential of the reaction: , and the standard acidity constant of the ion in synthetic sea water from 273.15–318.15 K, J. Chem. Thermodyn., 22, 113–127, https://doi.org/10.1016/0021-9614(90)90074-Z, 1990.
Dickson, A. G., Sabine, C. L., and Christian, J. R.: Guide to best practices for ocean CO2 measurements, North Pacific Marine Science Organization, Sidney, British Columbia, 191, https://doi.org/10.25607/OBP-1342, 2007.
Duncan, R. J., Nielsen, D. A., Sheehan, C. E., Deppeler, S., Hancock, A. M., Schulz, K. G., Davidson, A. T. and Petrou, K.: Ocean acidification alters the nutritional value of Antarctic diatoms, New Phytol., 233, 1813–1827, https://doi.org/10.1111/nph.17868, 2022.
Edmond, J. M.: High precision determination of titration alkalinity and total carbon dioxide content of sea water by potentiometric titration, Deep-Sea Res., 17, 737–750, https://doi.org/10.1016/0011-7471(70)90038-0, 1970.
E.U. Copernicus Marine Service Information (CMEMS): Surface ocean carbon fields, Marine Data Store (MDS) [data set], https://doi.org/10.48670/moi-00047, last access: 7 July 2025.
Fay, A. R., Munro, D. R., McKinley, G. A., Pierrot, D., Sutherland, S. C., Sweeney, C., and Wanninkhof, R.: Updated climatological mean ΔfCO2 and net sea–air CO2 flux over the global open ocean regions, Earth Syst. Sci. Data, 16, 2123–2139, https://doi.org/10.5194/essd-16-2123-2024, 2024.
Garcia, H. E., Weathers, K. W., Paver, C. R., Smolyar, I., Boyer, T. P., Locarnini, R. A., Zweng, M. M., Mishonov, A. V., Baranova, O. K., Seidov, D., and Reagan, J. R.: World Ocean Atlas 2018, Dissolved Inorganic Nutrients (phosphate, nitrate and nitrate + nitrite, silicate), vol. 4, edited by: Mishonov, A. (Technical Editor), NOAA Atlas NESDIS 84, 35 pp., https://archimer.ifremer.fr/doc/00651/76336/ (last access: 30 July 2022), 2019.
Gordon, A. L. and Tchernia, P. L.: Waters of the continental margin off Adelie Coast, Antarctica, Antarctica Oceanology II: The Australian–New Zealand Sector, 59–69, https://agupubs.onlinelibrary.wiley.com/doi/10.1029/AR019p0059 (last access: 17 November 2026), 1972.
Gkritzalis, T., Bakker, D. C. E., Lauvset, S. K., and Steinhoff, T.: SOCAT Quality Control Cookbook – For version 2025 of the Surface Ocean CO2 Atlas, http://www.socat.info (last access: 29 June 2026), 2024.
Hauck, J., Hoppema, M., Bellerby, R. G. J., Völker, C., and Wolf-Gladrow, D.: Data-based estimation of anthropogenic carbon and acidification in the Weddell Sea on a decadal timescale, J. Geophys. Res., 115, C03004, https://doi.org/10.1029/2009jc005479, 2010.
Hauri, C., Doney, S. C., Takahashi, T., Erickson, M., Jiang, G., and Ducklow, H. W.: Two decades of inorganic carbon dynamics along the West Antarctic Peninsula, Biogeosciences, 12, 6761–6779, https://doi.org/10.5194/bg-12-6761-2015, 2015.
Ishii, M., Inoue, H. Y., and Matsueda, H.: Net community production in the marginal ice zone and its importance for the variability of the oceanic pCO2 in the Southern Ocean south of Australia, Deep-Sea Res. Pt. II, 49, 1691–1706, https://doi.org/10.1016/s0967-0645(02)00007-3, 2002.
Jiang, L.-Q., Dunne, J., Carter, B. R., Tjiputra, J. F., Terhaar, J., Sharp, J. D., Olsen, A., Alin, S., Bakker, D. C. E., Feely, R. A., Gattuso, J.-P., Hogan, P., Ilyina, T., Lange, N., Lauvset, S. K., Lewis, E. R., Lovato, T., Palmieri, J., Santana-Falcón, Y., Schwinger, J., Séférian, R., Strand, G., Swart, N., Tanhua, T., Tsujino, H., Wanninkhof, R., Watanabe, M., Yamamoto, A., and Ziehn, T.: Global surface ocean acidification indicators from 1750–2100, J. Adv. Model. Earth Sy., 15, e2022MS003563, https://doi.org/10.1029/2022MS003563, 2023.
Kerr, R., Goyet, C., da Cunha, L. C., Orselli, I. B. M., Lencina-Avila, J. M., Mendes, C. R. B., Carvalho-Borges, M., Mata, M. M., and Tavano, V. M.: Carbonate system properties in the Gerlache Strait, Northern Antarctic Peninsula (February 2015): II. Anthropogenic CO2 and seawater acidification, Deep. Res. Pt. II, 149, 182–192, https://doi.org/10.1016/j.dsr2.2017.07.007, 2018.
Laika, H. E., Goyet, C., Vouve, F., Poisson, A., and Touratier, F.: Interannual properties of the CO2 system in the Southern Ocean south of Australia, Antarct. Sci., 21, 663–680, https://doi.org/10.1017/S0954102009990319, 2009.
Landschützer, P., Gruber, N., Bakker, D. C. E., Stemmler, I., and Six, K. D.: Strengthening seasonal marine CO2 variations due to increasing atmospheric CO2, Nat. Clim. Change, 8, 146–150, https://doi.org/10.1038/s41558-017-0057-x, 2018.
Laruelle, G. G., Cai, W.-J., Hu, X., Gruber, N., Mackenzie, F. T., and Regnier, P.: Continental shelves as a variable but increasing global sink for atmospheric carbon dioxide, Nat. Commun., 9, 454, https://doi.org/10.1038/s41467-017-02738-z, 2018.
Lauvset, S. K., Lange, N., Tanhua, T., Bittig, H. C., Olsen, A., Kozyr, A., Álvarez, M., Azetsu-Scott, K., Brown, P. J., Carter, B. R., Cotrim da Cunha, L., Hoppema, M., Humphreys, M. P., Ishii, M., Jeansson, E., Murata, A., Müller, J. D., Pérez, F. F., Schirnick, C., Steinfeldt, R., Suzuki, T., Ulfsbo, A., Velo, A., Woosley, R. J., and Key, R. M.: The annual update GLODAPv2.2023: the global interior ocean biogeochemical data product, Earth Syst. Sci. Data, 16, 2047–2072, https://doi.org/10.5194/essd-16-2047-2024, 2024.
Lauvset, S. K., Lange, N., Tanhua, T., Bittig, H. C., Olsen, A., Kozyr, A., Álvarez, M., Azetsu-Scott, K., Becker, S., Brown, P. J., Carter, B. R., Cotrim da Cunha, L., Feely, R. A., Hoppema, M., Humphreys, M. P., Ishii, M., Jeansson, E., Jones, S. D., Lo Monaco, C., Murata, A., Müller, J. D., Pérez, F. F., Schirnick, C., Steinfeldt, R., Suzuki, T., Tilbrook, B., Ulfsbo, A., Velo, A., Woosley, R. J., and Key, R. M.: Global Ocean Data Analysis Project version 2.2023 (GLODAPv2.2023) (NCEI Accession 0283442), NOAA National Centers for Environmental Information [data set], https://doi.org/10.25921/zyrq-ht66, 2023.
Lee, K., Tong, L. T., Millero, F. J., Sabine, C. L., Dickson, A. G., Goyet, C., Park, G. H., Wanninkhof, R., Feely, R. A., and Key, R. M.: Global relationships of total alkalinity with salinity and temperature in surface waters of the world's oceans, Geophys. Res. Lett., 33, L19605, https://doi.org/10.1029/2006GL027207, 2006.
Leseurre, C., Lo Monaco, C., Reverdin, G., Metzl, N., Fin, J., Mignon, C., and Benito, L.: Summer trends and drivers of sea surface fCO2 and pH changes observed in the southern Indian Ocean over the last two decades (1998–2019), Biogeosciences, 19, 2599–2625, https://doi.org/10.5194/bg-19-2599-2022, 2022.
Lueker, T. J., Dickson, A. G., and Keeling, C. D.: Ocean pCO(2) calculated from dissolved inorganic carbon, alkalinity, and equations for K-1 and K-2: validation based on laboratory measurements of CO2 in gas and seawater at equilibrium, Mar. Chem., 70, 105–119, https://doi.org/10.1016/S0304-4203(00)00022-0, 2000.
Mahieu, L., Lo Monaco, C., Metzl, N., Fin, J., and Mignon, C.: Variability and stability of anthropogenic CO2 in Antarctic Bottom Water observed in the Indian sector of the Southern Ocean, 1978–2018, Ocean Sci., 16, 1559–1576, https://doi.org/10.5194/os-16-1559-2020, 2020.
Marshall, G. J.: Trends in the Southern Annular Mode from observations and reanalyses, J. Climate, 16, 4134–4143, https://doi.org/10.1175/1520%-0442%282003%29016<4134%3ATITSAM>2.0.CO%3B2, 2003.
Mazloff, M. R., Verdy, A., Gille, S. T., Johnson, K. S., Cornuelle, B. D., and Sarmiento, J.: Southern Ocean acidification revealed by biogeochemical-Argo floats, J. Geophys. Res.-Oceans, 128, e2022JC019530, https://doi.org/10.1029/2022JC019530, 2023.
McNeil, B. I., Tilbrook, B., and Matear, R. J.: Accumulation and uptake of anthropogenic CO2 in the Southern Ocean, south of Australia between 1968 and 1996, J. Geophys. Res., 106, 31431–31445, https://doi.org/10.1029/2000JC000331, 2001.
Meinshausen, M., Nicholls, Z. R. J., Lewis, J., Gidden, M. J., Vogel, E., Freund, M., Beyerle, U., Gessner, C., Nauels, A., Bauer, N., Canadell, J. G., Daniel, J. S., John, A., Krummel, P. B., Luderer, G., Meinshausen, N., Montzka, S. A., Rayner, P. J., Reimann, S., Smith, S. J., van den Berg, M., Velders, G., Meinshausen, M., Nicholls, Z. R. J., Lewis, J., Gidden, M. J., Vogel, E., Freund, M., Beyerle, U., Gessner, C., Nauels, A., Bauer, N., Canadell, J. G., Daniel, J. S., John, A., Krummel, P. B., Luderer, G., Meinshausen, N., Montzka, S. A., Rayner, P. J., Reimann, S., Smith, S. J., van den Berg, M., Velders, G. J. M., Vollmer, M. K., and Wang, R. H. J.: The shared socio-economic pathway (SSP) greenhouse gas concentrations and their extensions to 2500, Geosci. Model Dev., 13, 3571–3605, https://doi.org/10.5194/gmd-13-3571-2020, 2020.
Metzl, N., Tilbrook, B., and Poisson, A.: The annual fCO2 cycle and the air–sea CO2 flux in the sub-Antarctic Ocean, Tellus B, 51, 849–861, https://doi.org/10.1034/j.1600-0889.1999.t01-3-00008.x, 1999.
Metzl, N., Fin, J., Lo Monaco, C., Mignon, C., Alliouane, S., Bombled, B., Boutin, J., Bozec, Y., Comeau, S., Conan, P., Coppola, L., Cuet, P., Ferreira, E., Gattuso, J.-P., Gazeau, F., Goyet, C., Grossteffan, E., Lansard, B., Lefèvre, D., Lefèvre, N., Leseurre, C., Lombard, F., Petton, S., Pujo-Pay, M., Rabouille, C., Reverdin, G., Ridame, C., Rimmelin-Maury, P., Ternon, J.-F., Touratier, F., Tribollet, A., Wagener, T., and Wimart-Rousseau, C.: An updated synthesis of ocean total alkalinity and dissolved inorganic carbon measurements from 1993–2023: the SNAPO-CO2-v2 dataset, SEANOE [data set], https://doi.org/10.17882/102337, 2024a.
Metzl, N., Lo Monaco, C., Leseurre, C., Ridame, C., Reverdin, G., Chau, T. T. T., Chevallier, F., and Gehlen, M.: Anthropogenic CO2, air–sea CO2 fluxes, and acidification in the Southern Ocean: results from a time-series analysis at station OISO-KERFIX (51° S–68° E), Ocean Sci., 20, 725–758, https://doi.org/10.5194/os-20-725-2024, 2024b.
Metzl, N., Fin, J., Lo Monaco, C., Mignon, C., Alliouane, S., Bombled, B., Boutin, J., Bozec, Y., Comeau, S., Conan, P., Coppola, L., Cuet, P., Ferreira, E., Gattuso, J.-P., Gazeau, F., Goyet, C., Grossteffan, E., Lansard, B., Lefèvre, D., Lefèvre, N., Leseurre, C., Petton, S., Pujo-Pay, M., Rabouille, C., Reverdin, G., Ridame, C., Rimmelin-Maury, P., Ternon, J.-F., Touratier, F., Tribollet, A., Wagener, T., and Wimart-Rousseau, C.: An updated synthesis of ocean total alkalinity and dissolved inorganic carbon measurements from 1993 to 2023: the dataset, Earth Syst. Sci. Data, 17, 1075–1100, https://doi.org/10.5194/essd-17-1075-2025, 2025a.
Metzl, N., Lo Monaco, C., Tribollet, A., Ternon, J.-F., Chevallier, F., and Gehlen, M.: New observations confirm the progressive acidification in the Mozambique Channel, Biogeosciences, 22, 7187–7204, https://doi.org/10.5194/bg-22-7187-2025, 2025b.
Midorikawa, T., Inoue, H. Y., Ishii, M., Sasano, D., Kosugi, N., Hashida, G., Nakaoka, S., and Suzuki, T.: Decreasing pH trend estimated from 35 year time series of carbonate parameters in the Pacific sector of the Southern Ocean in summer, Deep-Sea Res., 61, 131–139, https://doi.org/10.1016/j.dsr.2011.12.003, 2012.
Millero, F. J., Lee, K., Roche, M.: Distribution of alkalinity in the surface waters of the majorq oceans, Mar. Chem. 60, 111–130, https://doi.org/10.1016/S0304-4203(97)00084-4, 1998.
Monteiro, T., Kerr, R., Orselli, I. B. M., and Lencina-Avila, J. M.: Towards an intensified summer CO2 sink behaviour in the Southern Ocean coastal regions, Prog. Oceanogr., https://doi.org/10.1016/j.pocean.2020.102267, 2020.
Morrow, R. and Kestenare, E.: 30 years of sea surface temperature and salinity observations crossing the Southern Ocean near 140° E: Trends and rollercoaster variability, J. Marine Syst., 249, https://doi.org/10.1016/j.jmarsys.2025.104048, 2025.
Munro, D. R., Lovenduski, N. S., Takahashi, T., Stephens, B. B., Newberger, T., and Sweeney, C.: Recent evidence for a strengthening CO2 sink in the Southern Ocean from carbonate system measurements in the Drake Passage (2002–2015), Geophys. Res. Lett., 42, https://doi.org/10.1002/2015GL065194, 2015.
Nissen, C., Lovenduski, N. S., Brooks, C. M., Hoppema, M., Timmermann, R., and Hauck, J.: Severe 21st-century ocean acidification in Antarctic Marine Protected Areas, Nat. Commun., 15, 259, https://doi.org/10.1038/s41467-023-44438-x, 2024.
Orr, J. C., Epitalon, J.-M., Dickson, A. G., and Gattuso, J.-P.: Routine uncertainty propagation for the marine carbon dioxide system, Mar. Chem., 207, 84–107, https://doi.org/10.1016/j.marchem.2018.10.006, 2018.
Petrou, K., Baker, K. G., Nielsen, D. A., Hancock, A. M., Schulz, K. G., and Davidson, A. T.: Acidification diminishes diatom silica production in the Southern Ocean, Nat. Clim. Change, 9, 781–786, https://doi.org/10.1038/s41558-019-0557-y, 2019.
Pardo, P. C., Tilbrook, B., Langlais, C., Trull, T. W., and Rintoul, S. R.: Carbon uptake and biogeochemical change in the Southern Ocean, south of Tasmania, Biogeosciences, 14, 5217–5237, https://doi.org/10.5194/bg-14-5217-2017, 2017.
Pierrot, D., Neill, C., Sullivan, K., Castle, R., Wanninkhof, R., Lüger, H., Johannessen, T., Olsen, A., Feely, R. A., and Cosca, C. E.: Recommendations for Autonomous Underway pCO2 Measuring Systems and Data Reduction Routines, Deep-Sea Res. Pt. II, 56, https://doi.org/10.1016/j.dsr2.2008.12.005, 2009.
Rodgers, K. B., Schwinger, J., Fassbender, A. J., Landschützer, P., Yamaguchi, R., Frenzel, H., Stein, K., Müller, J. D., Goris, N., Sharma, S., Bushinsky, S., Chau, T. T. T., Gehlen, M., Gallego, M. A., Gloege, L., Gregor, L., Gruber, N., Hauck, J., Iida, Y., Ishii, M., Keppler, L., Kim, J. E., Schlunegger, S., Tjiputra, J., Toyama, K., Ayar, P. V., and Velo, A.: Seasonal variability of the surface ocean carbon cycle: A synthesis, Global Biogeochem. Cy., 37, e2023GB007798, https://doi.org/10.1029/2023GB007798, 2023.
Roobaert, A., Resplandy, L., Laruelle, G. G., Liao, E., and Regnier, P.: Unraveling the physical and biological controls of the global coastal CO2 sink, Global Biogeochem. Cy., 38, e2023GB007799, https://doi.org/10.1029/2023GB007799, 2024a.
Roobaert, A., Regnier, P., Landschützer, P., and Laruelle, G. G.: A novel sea surface pCO2-product for the global coastal ocean resolving trends over 1982–2020, Earth Syst. Sci. Data, 16, 421–441, https://doi.org/10.5194/essd-16-421-2024, 2024b.
Sarmiento, J. L., Johnson, K. S., Arteaga, L. A., Bushinsky, S. M., Cullen, H. M., Gray, A. R., Hotinski, R. M., Maurer, T. L., Mazloff, M. R., Riser, S. C., Russell, J. L., Schofield, O. M., and Talley, L. D.: The Southern Ocean Carbon and Climate Observations and Modeling (SOCCOM) project: A review, Prog. Oceanogr., https://doi.org/10.1016/j.pocean.2023.103130, 2023.
Shadwick, E., Rintoul, S., Tilbrook, B., Williams, G., Young, N., Fraser, A. D., Marchant, H., Smith, J., and Tamura, T.: Glacier tongue calving reduced dense water formation and enhanced carbon uptake, Geophys. Res. Lett., 40, 904–909, https://doi.org/10.1002/grl.50178, 2013.
Shadwick, E. H., Tilbrook, B., and Williams, G. D.: Carbonate chemistry in the Mertz Polynya (East Antarctica): Biological and physical modification of dense water outflows and the export of anthropogenic CO2, J. Geophys. Res.-Oceans, 119, 1–14, https://doi.org/10.1002/2013JC009286, 2014.
Shadwick, E. H., Tilbrook, B., and Currie, K. I.: Late-summer biogeochemistry in the Mertz Polynya: East Antarctica, J. Geophys. Res.-Oceans, 122, 7380–7394, https://doi.org/10.1002/2017JC013015, 2017.
Shadwick, E. H., Wynn-Edwards, C. A., Matear, R. J., Jansen, P., Schulz, E. and Sutton, A. J.: Observed amplification of the seasonal CO2 cycle at the Southern Ocean Time Series, Front. Mar. Sci. 10:1281854, https://doi.org/10.3389/fmars.2023.1281854, 2023.
Schlitzer, R.: Ocean Data View, http://odv.awi.de (last access: 4 August 2017), 2018.
Sholeninova, P., Morrison, A. K., Mc C. Hogg, A., and Foppert, A.: Quantification of Antarctic bottom water pathways in the Australian-Antarctic Basin, J. Geophys. Res.-Oceans, 130, e2024JC022305, https://doi.org/10.1029/2024JC022305, 2025.
Stark, J. S., Roden, N. P., Johnstone, G. J., Milnes, M., Black, J. G., Whiteside, S., Kirkwood, W., Newbery, K., Stark, S., van Ooijen, E., Tilbrook, B., Peltzer, E. T., Berry, K., and Roberts, D.: Carbonate chemistry of an in-situ free-ocean CO2 enrichment experiment (antFOCE) in comparison to short term variation in Antarctic coastal waters, Scientific Reports, 8, 2816, https://doi.org/10.1038/s41598-018-21029-1, 2018.
Takahashi, T., Olafsson, J., Goddard, J. G., Chipman, D. W., and Sutherland, S. C.: Seasonal variation of CO2 and nutrients in the high-latitude surface oceans: A comparative study, Global Biogeochem. Cy., 7, 843–878, https://doi.org/10.1029/93GB02263, 1993.
Takahashi, T., Sutherland, S. C., Wanninkhof, R., Sweeney, C., Feely, R. A., Chipman, D. W., Hales, B., Friederich, G., Chavez, F., Sabine, C., Watson, A., Bakker, D. C., Schuster, U., Metzl, N., Yoshikawa-Inoue, H., Ishii, M., Midorikawa, T., Nojiri, Y., Körtzinger, A., Steinhoff, T., Hoppema, M., Olafsson, J., Arnarson, T. S., Tilbrook, B., Johannessen, T., Olsen, A., Bellerby, R., Wong, C., Delille, B., Bates, N., and de Baar, H. J.: Climatological mean and decadal change in surface ocean pCO2, and net sea–air CO2 flux over the global oceans, Deep-Sea Res. Pt. II, 56, 554–577, https://doi.org/10.1016/j.dsr2.2008.12.009, 2009.
Takahashi, T., Sutherland, S. C., Chipman, D. W., Goddard, J. G., Ho, C., Newberger, T., Sweeney, C., and Munro, D. R.: Climatological distributions of pH, pCO2, total CO2, alkalinity, and CaCO3 saturation in the global surface ocean, and temporal changes at selected locations, Mar. Chem., 164, 95–125, https://doi.org/10.1016/j.marchem.2014.06.004, 2014.
Tilbrook, B., Jewett E. B., DeGrandpre, M. D., Hernandez-Ayon, J. M., Feely, R. A., Gledhill, D. K., Hansson, L., Isensee, K., Kurz, M. L., Newton, J. A., Siedlecki, S. A., Chai, F., Dupont, S., Graco, M., Calvo, E., Greeley, D., Kapsenberg, L., Lebrec, M., Pelejero, C., Schoo, K. L., and Telszewski, M.: An Enhanced Ocean Acidification Observing Network: From People to Technology to Data Synthesis and Information Exchange, Frontiers in Marine Science, 6, 337, https://doi.org/10.3389/fmars.2019.00337, 2019.
Tilbrook, B, Neill, C., and Akl, J.: Surface water CO2 measurements from ships of opportunity: A report for Australia's Integrated Marine Observing System, CSIRO, Hobart, 26 pp., https://doi.org/10.25919/x90f-bw32, 2025.
Touratier, F., Azouzi, L., and Goyet, C.: CFC-11, Δ14C and 3H tracers as a means to assess anthropogenic CO2 concentrations in the ocean, Tellus B, 59, 318–325, https://doi.org/10.1111/j.1600-0889.2006.00247.x, 2007.
UNESCO: Tenth report of the Joint Panel on Oceanographic Tables and Standards, UNESCO Technical Papers in Marine Science, https://unesdoc.unesco.org/ark:/48223/pf0000046148 (last access: 3 November 2026), 1981.
Uppström, L. R.: The boron/chlorinity ratio of deep-sea water from the Pacific Ocean, Deep Sea Research and Oceanographic Abstracts, 21, 161–162, https://doi.org/10.1016/0011-7471(74)90074-6., 1974.
van Wijk, E. M. and Rintoul, S. R.: Freshening drives contraction of Antarctic bottom water in the Australian Antarctic Basin: Freshening drives contraction of AABW, Geophys. Res. Lett., 41, 1657–1664, https://doi.org/10.1002/2013GL058921, 2014.
Williams, G. D., Aoki, S., Jacobs, S. S., Rintoul, S. R., Tamura, T., and Bindoff, N. L.: Antarctic Bottom Water from the Adélie and George V Land coast, East Antarctica (140–149 E), J. Geophys. Res.-Ocean., 115, C04027, https://doi.org/10.1029/2009JC005812, 2010.
Xue, L., Cai, W.-J., Takahashi, T., Gao, L., Wanninkhof, R., Wei, M., Li, K., Feng, L., and Yu, W.: Climatic modulation of surface acidification rates through summertime wind forcing in the Southern Ocean, Nat. Commun., 9, 3240, https://doi.org/10.1038/s41467-018-05443-7, 2018.
Zhang, S., Wu, Y., Cai, W.-J., Cai, W., Feely, R. A., Wang, Z., Tanhua, T., Wang, Y., Liu, C., Li, X., Yang, Q., Ding, M., Xu, Z., Kerr, R., Luo, Y., Cheng, X., Chen, L., and Qi, D.: Transport of anthropogenic carbon from the Antarctic shelf to deep Southern Ocean triggers acidification, Global Biogeochem. Cy., 37, e2023GB007921, https://doi.org/10.1029/2023GB007921, 2023.