the Creative Commons Attribution 4.0 License.
the Creative Commons Attribution 4.0 License.
 | 02 May 2018
N2 fixation as a dominant new N source in the western tropical South Pacific Ocean (OUTPACE cruise)
Mathieu Caffin
Thierry Moutin
Rachel Ann Foster
Pascale Bouruet-Aubertot
Andrea Michelangelo Doglioli
Hugo Berthelot
Cécile Guieu
Olivier Grosso
Sandra Helias-Nunige
Nathalie Leblond
Audrey Gimenez
Anne Alexandra Petrenko
Alain de Verneil
Sophie Bonnet
We performed nitrogen (N) budgets in the photic layer of three contrasting stations representing different trophic conditions in the western tropical South Pacific (WTSP) Ocean during austral summer conditions (February–March 2015). Using a Lagrangian strategy, we sampled the same water mass for the entire duration of each long-duration (5 days) station, allowing us to consider only vertical exchanges for the budgets. We quantified all major vertical N fluxes both entering (N2 fixation, nitrate turbulent diffusion, atmospheric deposition) and leaving the photic layer (particulate N export). The three stations were characterized by a strong nitracline and contrasted deep chlorophyll maximum depths, which were lower in the oligotrophic Melanesian archipelago (MA, stations LD A and LD B) than in the ultra-oligotrophic waters of the South Pacific Gyre (SPG, station LD C). N2 fixation rates were extremely high at both LD A (593 ± 51 µmol N m−2 d−1) and LD B (706 ± 302 µmol N m−2 d−1), and the diazotroph community was dominated by Trichodesmium. N2 fixation rates were lower (59 ± 16 µmol N m−2 d−1) at LD C, and the diazotroph community was dominated by unicellular N2-fixing cyanobacteria (UCYN). At all stations, N2 fixation was the major source of new N (> 90 %) before atmospheric deposition and upward nitrate fluxes induced by turbulence. N2 fixation contributed circa 13–18 % of primary production in the MA region and 3 % in the SPG water and sustained nearly all new primary production at all stations. The e ratio (e ratio = particulate carbon export ∕ primary production) was maximum at LD A (9.7 %) and was higher than the e ratio in most studied oligotrophic regions (< 5 %), indicating a high efficiency of the WTSP to export carbon relative to primary production. The direct export of diazotrophs assessed by qPCR of the nifH gene in sediment traps represented up to 30.6 % of the PC export at LD A, while their contribution was 5 and < 0.1 % at LD B and LD C, respectively. At the three studied stations, the sum of all N input to the photic layer exceeded the N output through organic matter export. This disequilibrium leading to N accumulation in the upper layer appears as a characteristic of the WTSP during the summer season.
- Article
(1677 KB) - Full-text XML
- BibTeX
- EndNote


Biological nitrogen fixation, the reduction of atmospheric dinitrogen (N2) to ammonia, is performed by a diverse group of prokaryotic organisms, commonly called diazotrophs. It provides the major external source of bio-available nitrogen (N) to the ocean, before riverine and atmospheric inputs (Deutsch et al., 2007; Gruber, 2008; Gruber and Sarmiento, 1997). In the oligotrophic ocean, N availability often limits phytoplankton growth (e.g. Moore et al., 2013) and N2 fixation sustains a significant part of new primary production (PP, i.e. the production unrelated to internal recycling of organic matter in the photic layer) such as in the North (Karl et al., 1997) and South Pacific Ocean (Moutin et al., 2008), the western Mediterranean Sea (Garcia et al., 2006), or the tropical North Atlantic (Capone et al., 2005). New N input by N2 fixation has thus been recognized as a significant process influencing global oceanic productivity, and can eventually fuel CO2 sequestration through the N2-primed prokaryotic carbon (C) pump (Karl et al., 2003).
Low δ15N signatures of particles from sediment traps in the tropical North Pacific (Karl et al., 1997, 2012; Scharek et al., 1999a, b) and Atlantic (Altabet, 1988; Bourbonnais et al., 2009; Knapp et al., 2005; Mahaffey et al., 2003) suggest that at least part of the recently fixed N is ultimately exported out of the photic zone. Knapp et al. (2008) and Bourbonnais et al. (2009) also observed a low δ15N of NO (relative to δ18O-NO in surface waters in the western and eastern subtropical Atlantic Ocean, supporting the role of N2 fixers in these regions. Böttjer et al. (2017) revealed that N2 fixation supports 26–47 % of particulate N (PN) export over a 9-year time series (2005–2013) period at station ALOHA (North Pacific Subtropical Gyre). Export efficiency may depend on the diazotroph community composition present in surface waters. Blooms of diatom–diazotroph associations (DDAs) systematically observed in late summer at station ALOHA are thought to be directly responsible for the concomitant pulses of particulate export (Karl et al., 2012). High export associated with DDAs has also been observed in the Amazon River plume (Subramaniam et al., 2008), suggesting a high direct export efficiency associated with DDAs. Trichodesmium is one of the main contributors to global N2 fixation (Mahaffey et al., 2005) but is rarely recovered in sediment traps (Chen et al., 2003; Walsby, 1992), suggesting a low direct export efficiency. However, the N2 fixed by Trichodesmium is efficiently transferred to large, non-diazotrophic phytoplankton, such as diatoms (Berthelot et al., 2016; Bonnet et al., 2016a), which can be subsequently exported (Nelson et al., 1995), suggesting a potential indirect export pathway. A recent mesocosm study performed in New Caledonia unexpectedly revealed that the production sustained by unicellular diazotrophic cyanobacteria (hereafter referred to as UCYN) was much more efficient at promoting particle export than the production sustained by DDAs (Berthelot et al., 2015). However, the export efficiency of UCYN has been poorly studied (White et al., 2012) in the open ocean, despite the fact that they contribute as much as Trichodesmium to N2 fixation rates in many parts of the ocean (Bonnet et al., 2009; Martínez-Pérez et al., 2016; Moisander et al., 2010; Montoya et al., 2004). More studies are thus needed to further investigate the ability of different diazotroph communities to fuel direct or indirect particle export in the oligotrophic ocean.
Studying the impact of N2 fixation on PN export in the ocean and the relative role of each diazotroph group in this process is technically challenging. It requires the measurement of all major N fluxes both entering the photic layer (N2 fixation, nitrate (NO eddy diffusion, atmospheric deposition) and leaving the photic layer (PN export) with an adequate time frame (i.e. linking production and export). In addition, the sampling has to be performed under contrasting situations, for example when either Trichodesmium or UCYN dominate the diazotroph community, hence allowing assessment of the potential role of each diazotroph group. Most importantly, such N budgets must be performed in the same water mass to ensure that the particulate matter recovered in the sediment traps corresponds to the production that occurred just above in the photic layer. This is what we did during the OUTPACE (Oligotrophy to UlTra-oligotrophy PACific Experiment) cruise in the western tropical South Pacific (WTSP) in summer 2015, during which we used a Lagrangian strategy.
The WTSP has recently been identified as a hotspot of N2 fixation, including N2 fixation rates > 500 µmol N m−2 d−1 (Bonnet et al., 2017). The region covered by the OUTPACE cruise is characterized by trophic and N2 fixation gradients (Moutin et al., 2017). The region covered by the OUTPACE cruise encompasses contrasting trophic regimes characterized by strong differences in top nitracline depths, from 46 to 141 m (Moutin et al., 2018), and representing a large part of the oligotrophic gradient at the scale of the world ocean (Moutin and Prieur, 2012; their Fig. 9). The westward oligotrophic waters are characterized by high N2 fixation rates (631 ± 286 µmol N m−2 d−1) mainly associated with Trichodesmium (i.e. within the hot spot around Melanesian archipelago waters, hereafter named MA), and the eastward ultra-oligotrophic waters (in the eastern border of the South Pacific Gyre, hereafter named SPG waters) are characterized by low N2 fixation rates (85 ± 79 µmol N m−2 d−1), mainly associated with UCYN (Bonnet et al., 2018; Stenegren et al., 2018). This west to east N2 fixation gradient has been mainly attributed to a decrease in iron availability in SPG waters as compared to MA waters (Guieu et al., 2018). This region therefore provides ideal conditions to study the potential role of N2 fixation on particulate export under contrasting situations.
In the present study, we focus on (i) the contribution of N2 fixation to new N inputs in the WTSP during the summer season, (ii) the coupling between N2 fixation and export, and (iii) the equilibrium versus disequilibrium between N2 fixation and particulate N export in the WTSP.
2.1 Station sampling strategy
The OUTPACE cruise was carried out during austral summer conditions (18 February–3 April 2015) along a west–east 4000 km transect from New Caledonia (22∘ S–166∘ E) to French Polynesia (17∘30′ S–149∘30′ W). We performed a N budget at three stations, hereafter named long duration (LD), that were chosen according to three criteria: (1) local minima of surface current intensity, (2) different trophic regimes, i.e. oligotrophic vs. ultra-oligotrophic, and (3) different diazotroph communities, i.e. Trichodesmium vs. UCYN.
To locate these three stations, we used a Lagrangian strategy developed during previous cruises such as LATEX (Doglioli et al., 2013; Petrenko et al., 2017) and KEOPS2 (d'Ovidio et al., 2015). Briefly, the regions of interest along the vessel route were first characterized at large scale through the analysis of satellite data. The altimetry-derived currents were processed by SPASSO (Software Package for an Adaptive Satellite-based Sampling for Ocean campaigns; http://www.mio.univ-amu.fr/SPASSO/, last access: November 2017) to derive Eulerian and Lagrangian diagnostics of ocean circulation: Okubo–Weiss parameter, particle retention time and advection, Lagrangian coherent structures (d'Ovidio et al., 2015), together with maps of the sea surface temperature and chlorophyll a (Chl a) concentrations. The satellite data were processed on land in near-real time and transmitted to the ship together with a daily bulletin proposing LD station positions (the complete series of 43 bulletins is available on the OUTPACE website at https://outpace.mio.univ-amu.fr/OUT_Figures/Bulletins/, last access: November 2017). We also performed onboard quantitative polymerase chain reaction (qPCR) analyses on the nifH gene to measure the abundance of six groups of diazotrophs (Stenengren et al., 2018). Thus, we located the stations in regions where either Trichodesmium or UCYN dominated the diazotroph community. Then, the exact locations of the three LD stations were determined on board in real time from a rapid survey using a moving vessel profiler (MVP), equipped with conductivity–temperature–depth (CTD) and fluorimeter sensors, accompanied by the hull-mounted thermosalinograph and acoustic Doppler current profiler (Moutin et al., 2017). Finally, Surface Velocity Program (SVP) drifters were deployed in order to study the relative dispersion at the surface (de Verneil et al., 2018) during the station occupation.
By using this strategy, LD A station (19∘12.8′ S–164∘41.3′ E, 25 February–2 March) was positioned in MA waters in the western part of the transect (Fig. 1) offshore from New Caledonia. LD B station (18∘14.4′ S–170∘51.5′ W, 15–20 March) was positioned in MA waters near the island of Niue and LD C station (18∘25.2′ S–165∘56.4′ W, 23–28 March) was positioned in the eastern part of the transect, in the SPG near the Cook Islands.
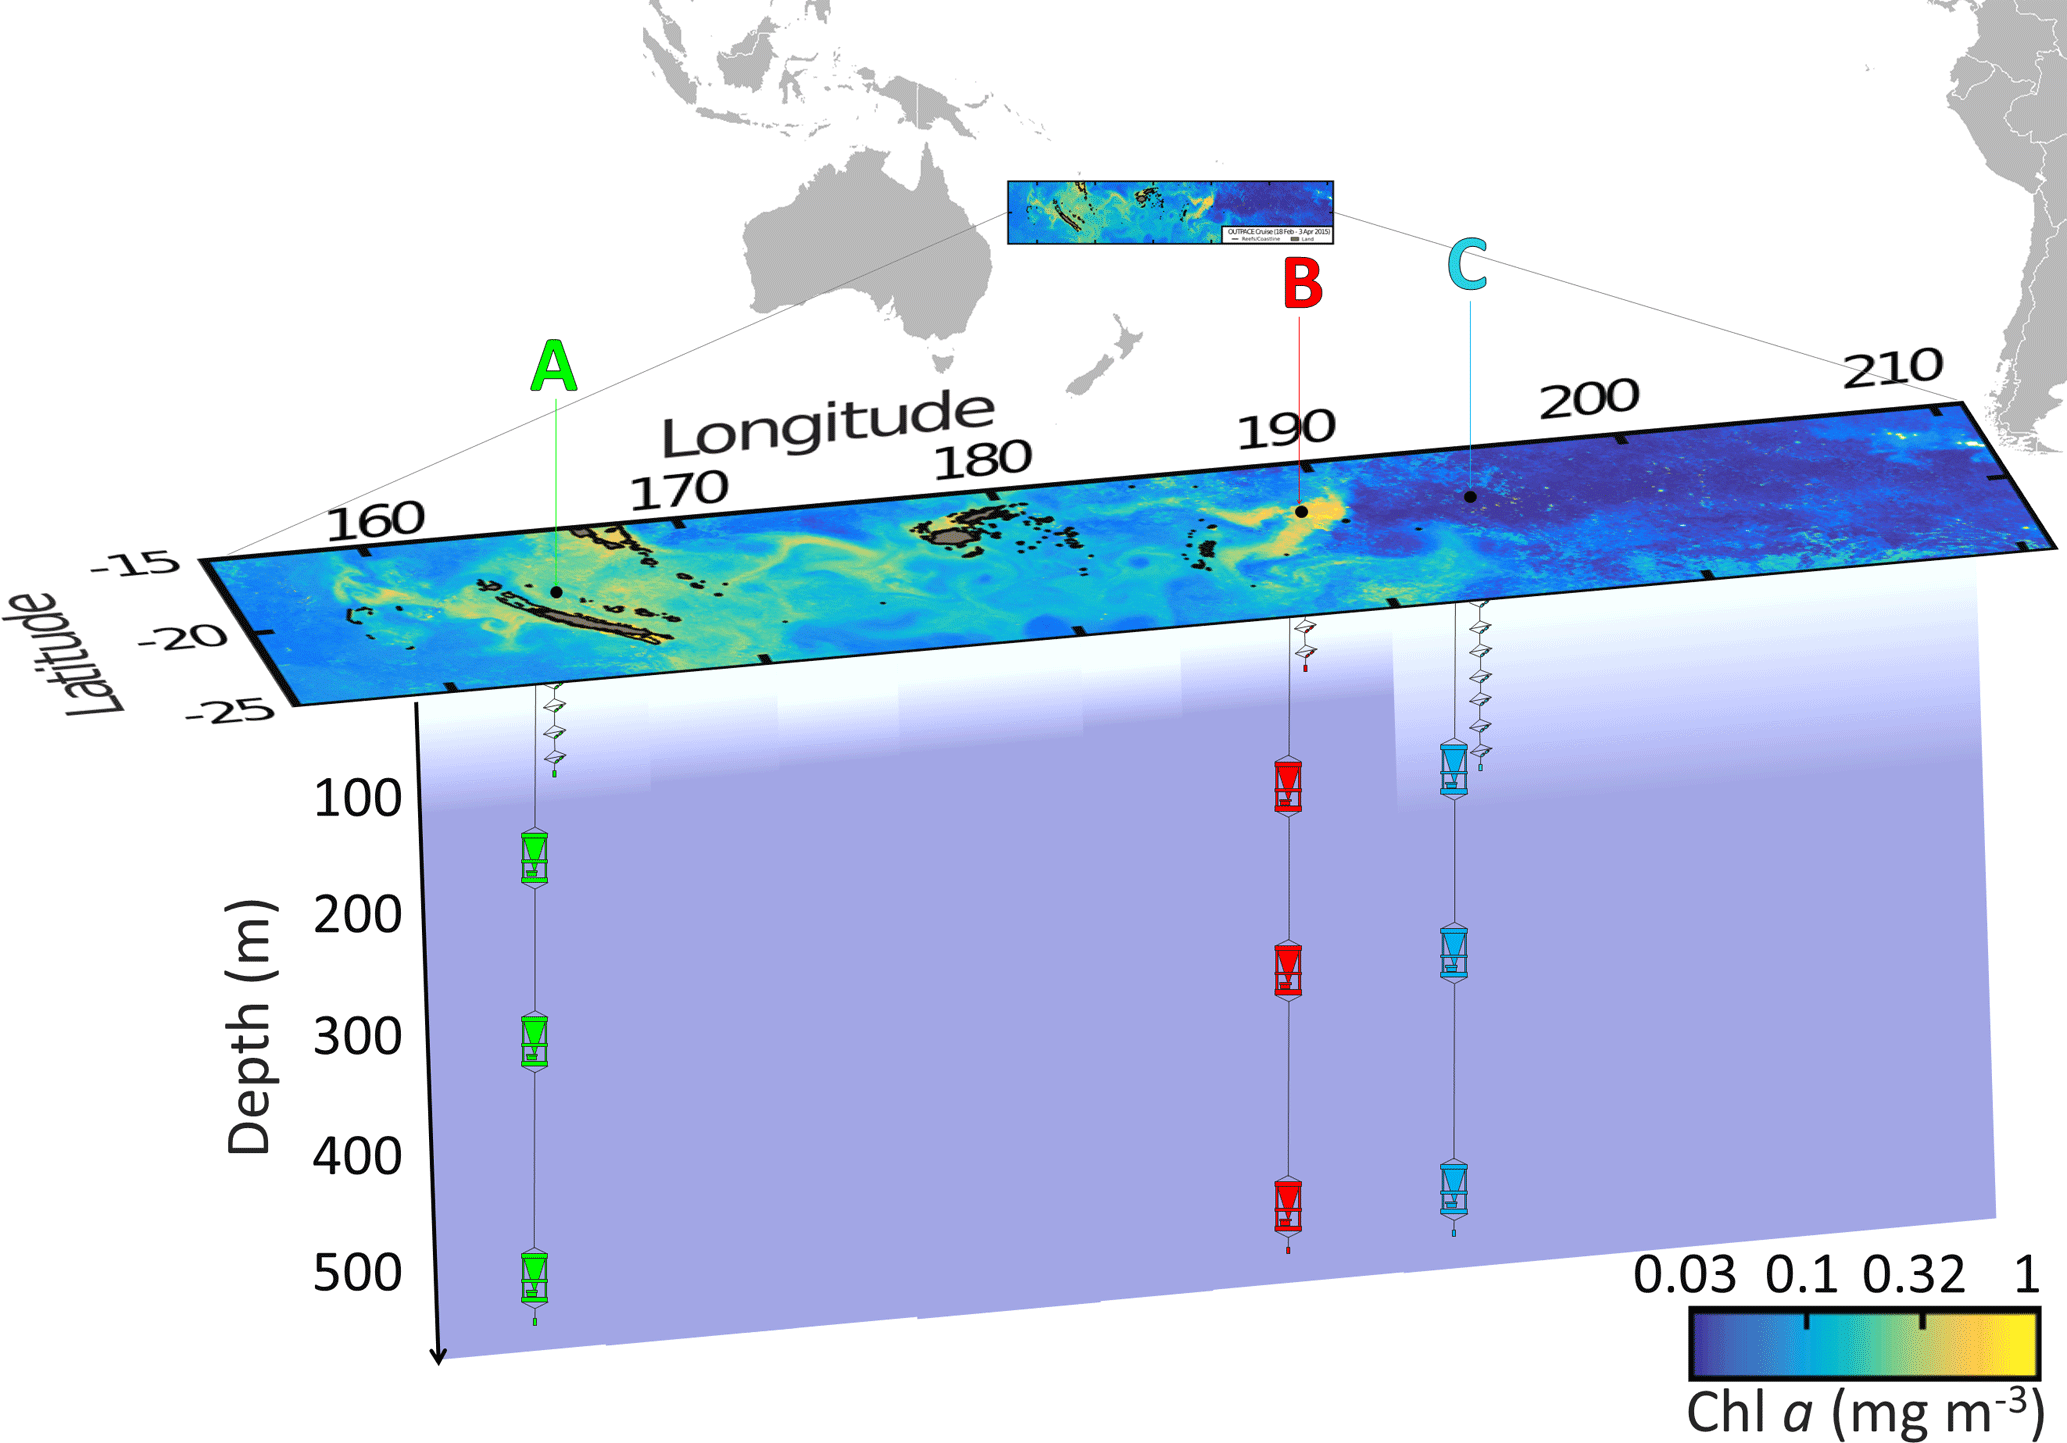
Figure 1Position of the long-duration stations sampled in this study (OUTPACE cruise): LD A in green, LD B in red and LD C in blue on a quasi-Lagrangian surface Chl a concentrations map. The in situ production lines were deployed in the photic layer (from 5 to 105, 80 and 180 m for LD A, LD B and LD C, respectively) and the PPS5 sediment traps were deployed at 150, 330 and 520 m.
Each LD station was investigated for 5 days. The sequence of operations was the following: a drifting array equipped with three PPS5 sediment traps, current meters, oxygen sensors and high-frequency temperature sensors (see https://outpace.mio.univ-amu.fr/spip.php?article75 for details, last access: November 2017) was deployed at each station on the first day. Then, a series of CTD (SBE 911+ Sea-Bird) casts (0–500 m) were performed every 3–4 h near the actual position of the drifting array to study the high-frequency evolution of temperature, salinity, photosynthetically available radiation (PAR) and chlorophyll a fluorescence during the station occupation. Small-scale turbulence was characterized in the first 800 m from microstructure measurements using a vertical microstructure profiler (VMP1000) that was typically deployed prior to or following each CTD cast (Bouruet-Aubertot et al., 2018). Nutrient concentration measurements (0–200 m) were performed every day on the midday CTD casts (hereafter named “nut. CTD”). In addition to the 0–500 m casts every 3–4 h, production casts (0–150 m) (hereafter named “prod. CTD”) were performed three times at each LD station (on day 1, 3 and 5) to quantify N2 fixation and primary production rates. Incubations with tracers (14C and 15N2; see below) to quantify N2 fixation and primary production were performed on an in situ drifting production line deployed for 24 h from dawn to dawn. The drifting array with the traps was recovered at the end of each LD station. Aerosol sampling was performed throughout the cruise transect. The inputs of new N to the photic layer were induced by three different sources: atmospheric deposition at the air–sea interface, N2 fixation as an interior source and NO input by vertical diffusion. The N output was driven by PN sedimentation. The methods for the determination of each parameter are given below.
2.2 Experimental procedures
2.2.1 Physical and chemical parameters, nutrient concentrations and C : N ratios
In situ Chl a concentrations were derived from fluorescence measurements performed with a AquaTraka III (Chelsea Technologies Group Ltd) sensor mounted on the CTD. The chlorophyll fluorescence sensor was calibrated prior to the cruise and post-calibration was conducted using all HPLC measurements undertaken during the cruise. PAR was measured on each CTD profile. Phosphate (PO and NO concentrations were measured daily at 12 depths from the surface to 200 m on each nutrient CTD cast using standard colorimetric procedures (Aminot and Kérouel, 2007) on an AA3 AutoAnalyzer (Seal Analytical). After filtration, one sample was directly analysed on board and the other poisoned with 50 µL of HgCl2 (20 g L−1) and stored for analysis after the cruise in the laboratory. The quantification limits were 0.05 µmol L−1 for PO and NO.
2.2.2 Primary production and associated N uptake
PP was measured in triplicate using the 14C tracer method (Moutin and Raimbault, 2002). Samples were incubated in 320 mL polycarbonate bottles on the in situ drifting production line (Aquamout: https://outpace.mio.univ-amu.fr/spip.php?article75, last access: November 2017) for 24 h from dusk to dusk at 9 depths (75, 54, 36, 19, 10, 3, 1, 0.3 and 0.1 % of surface irradiance levels), corresponding to the sub-surface (5 m) down to 105, 80 and 180 m for stations LD A, LD B and LD C, respectively. A N-derived PP (N-PP) was obtained at each depth by dividing PP by the classical C : N Redfield ratio (6.625). Integrated N-PP (iN-PP) over the studied layer (surface to 125, 100 and 200 m for LD A, LD B and LD C, respectively) was calculated by using the trapezoidal method, assuming that surface N-PP was identical to N-PP measured in subsurface (5 m) and considering that N-PP 20 m below the deepest sampled depth was zero (JGOFS, 1988).
2.2.3 Atmospheric deposition
N atmospheric deposition (NO and NO (nitrite), hereafter called NOx) was quantified along the transect after dissolution of aerosols collected continuously during the transect, as described in Guieu et al. (2018). Briefly, the sampling device, designed to avoid ship contamination, was installed at the look-out post in the front of the ship and collected aerosols at ∼ 20 L min−1 onto polycarbonate filters (47 mm diameter, 0.45 µm porosity, previously acid-cleaned with a 2 % solution of HCl (Merck, Ultrapur, Germany) and thoroughly rinsed with ultra-pure water and dried under a laminar flow bench and stored in acid-cleaned Petri dishes). Dissolution experiments to determine NOx released in surface seawater after deposition were performed on board using acid-cleaned Sartorius filtration units (volume 0.250 L) and filtered surface (5 m) seawater. Each sample was subjected to two contact times: the first contact was at 1 min, and the second contact was at 24 h. NOx was analysed using a 1 m long liquid waveguide capillary cell (LWCC) made of quartz capillary tubing, following the protocol described in Louis et al. (2015). An extrapolated NOx release from dry deposition was estimated on the basis of a deposition velocity of submicron particles (0.4 m s−1; Vong et al., 2010).
2.2.4 Nitrogen fixation rates
N2 fixation rates were measured using the 15N2 tracer method (Montoya et al., 1996, modified; see below), on days 1, 3 and 5 at each LD station (hereafter named in situ_1, in situ_2 and in situ_3, respectively). Seawater was collected from the Niskin bottles in duplicate 4.5 L polycarbonate bottles at nine depths (same depths as for PP). A total of 5 mL of 15N2 gas (99 atom% 15N, Eurisotop) was injected into each bottle through the septum cap using a gas-tight syringe. The purity of the 15N2 Cambridge isotopes stocks was previously checked by Dabundo et al. (2014) and more recently by Benavides et al. (2015) and Bonnet et al. (2016a). They were found to be lower than 2 × 10⁻⁸ mol : mol of 15N2, leading to a potential N2 fixation rates overestimation of < 1 %. All bottles were shaken 20 times to facilitate the 15N2 dissolution and incubated in situ on the production line at the same depth of sampling for 24 h from dawn to dawn (hereafter called the “in situ incubation method”). It has been previously shown that the bubble method potentially underestimated N2 fixation rates (Großkopf et al., 2012; Mohr et al., 2010) compared to methods consisting in adding the 15N2 as dissolved in a subset of seawater previously N2 degassed (Mohr et al., 2010). This underestimation is due to incomplete equilibration of the 15N2 gas with surrounding seawater. However, other studies did not find any significant difference between the two methods (Bonnet et al., 2016b; Shiozaki et al., 2015). In the present study, we intentionally decided to use the bubble method due to the high risk of both organic matter and trace metal contamination during the 15N2-enriched seawater preparation (Klawonn et al., 2015), which has been seen to enhance N2 fixation in this area (Benavides et al., 2017; Moisander et al., 2010). However, to minimize possible rate underestimations due to incomplete equilibration of the 15N2 gas with surrounding seawater, the final 15N enrichment of the N2 pool was quantified in the incubation bottles on each profile in triplicate at 5 m and at the deep chlorophyll maximum (DCM). After incubation, 12 mL of each 4.5 L bottle was subsampled in Exetainers, fixed with HgCl2 (final concentration 20 µg mL−1), and stored upside down at 4 ∘C in the dark until analysed onshore within 6 months after the cruise, according to Kana et al. (1994), using a membrane inlet mass spectrometer (MIMS).
For each LD station, in parallel with the last N2 fixation profile (the in situ_3 profile), we performed a replicate N2 fixation profile in which bottles were incubated in on-deck incubators (see details on https://outpace.mio.univ-amu.fr/spip.php?article135, last access: November 2017) equipped with circulating seawater at the specified irradiances using blue screening (hereafter called the “deck incubation method”). For these profiles, samples were collected in triplicate at six of the nine depths reported above (75, 54, 36, 10, 1 and 0.1 % surface irradiance level) in 2.3 L polycarbonate bottles amended with 2.5 mL of 15N2 gas (99 atom% 15N, Eurisotop) for 24 h.
In both cases, incubations were stopped by gentle filtration (< 0.2 bar) of the samples onto pre-combusted (450 ∘C, 4 h) Whatman GF/F filters (25 mm diameter, 0.7 µm nominal porosity). Filters were stored in pre-combusted glass tubes at −20 ∘C during the cruise, then dried at 60 ∘C for 24 h before analysis onshore. 15N enrichments of PN collected on filters were determined using an elemental analyser coupled to an isotope ratio mass spectrometer (EA-IRMS, Integra2 Sercon Ltd). The accuracy of the EA-IRMS system was systematically checked using International Atomic Energy Agency (IAEA) reference materials, AIEA-N-1 and IAEA-310A. In addition, the 15N enrichment of the ambient (unlabelled) PN was measured in one replicate at each station at the DCM and the subsurface and was used as the “initial” 15N enrichment, as termed in Montoya et al. (1996). The minimum quantifiable rate calculated using standard propagation of errors via the observed variability between replicate samples measured according to Gradoville et al. (2017) was 0.035 nmol N L−1 d−1. Integrated N2 fixation rates over the studied layer were calculated by using the same method as for the iN-PP.
2.2.5 Nitrate turbulent diffusion
NO inputs from deep waters by turbulent mixing were estimated at the top of the nitracline. The top of the nitracline was found to fall along an isopycnal surface (, the density of which was determined at each station. The NO turbulent diffusive flux along the isopycnal surface was defined as
where Kz is the turbulent diffusion coefficient along the isopycnal inferred from VMP1000 measurements performed every 3–4 h during the LD station occupation, as described in Bouruet-Aubertot et al. (2018), is the constant slope of the nitracline, calculated for each station, and is the vertical density gradient measured by the VMP1000 at the isopycnal depth . The time series of the NO turbulent diffusive flux was calculated using an hourly temporal interpolation of Kz over the entire duration of each LD station. In addition, daily averages and 5-day averages were computed.
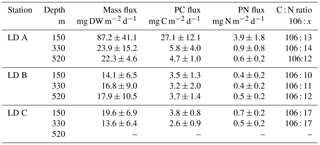
Table 1Sediment trap data at the three LD stations. Depth of collection, mean mass flux of dry weight (DW) matter, particulate C and N flux, and mean C : N molar ratio. No data were collected at LD C at 520 m.
2.2.6 Particulate matter export
Particulate matter export was quantified with three PPS5 sediment traps (1 m2 surface collection, Technicap, France) deployed for 5 days at 150, 330 and 520 m at each LD station (Fig. 1). We decided to use the same configuration at the three LD stations. The first trap was deployed at 150 m as it is always below the base of the photic layer and therefore below the productivity layer. The depth of 520 m was used because most of the diel zooplankton vertical migrations stopped above this depth, and 330 m was chosen as an intermediary depth. Particle export was recovered in polyethylene flasks screwed on a rotary disk, which allowed the flask to be automatically changed every 24 h to obtain a daily material recovery rate. The flasks were previously filled with a buffered solution (sodium borate) of formaldehyde (final concentration 2 % and pH = 8) and were stored at 4 ∘C after collection until analysis to prevent degradation of the collected material. The flask corresponding to the fifth day of sampling on the rotary disk was not filled with formaldehyde in order to collect “fresh particulate matter” for further diazotroph quantification, as described below. Thus, this last flask was not used in the particulate export computations reported in Table 1. Onshore, swimmers were handpicked from each sample, quantified and genera-identified. Exported particulate matter and swimmers were both weighed and analysed separately on EA-IRMS (Integra2, Sercon Ltd) to quantify exported PC and PN.
2.2.7 Diazotroph abundance in the traps
Triplicate aliquots of 2 to 4 mL from the flask dedicated to diazotroph quantification were filtered onto 0.2 µm Supor filters, flash-frozen in liquid nitrogen and stored at −80 ∘C until analysis. Nucleic acids were extracted from the filters as described in Moisander et al. (2008) with a 30 s reduction in the agitation step in a Fast Prep cell disruptor (Thermo, Model FP120; Qbiogene, Inc. Cedex, Frame) and an elution volume of 70 µL. Diazotrophs abundance for Trichodesmium spp., UCYN-B (Crocosphaera watsonii), UCYN-A1 (Candidatus Atelocyanobacterium thalassa), het-1 (Richelia intracellularis in symbiosis with Rhizosolenia), and het-2 (Richelia intracellularis in symbiosis with Hemiaulus) were quantified by qPCR analyses on the nifH gene using previously described oligonucleotides and assays (Foster et al., 2007; Church et al., 2005). The qPCR was conducted in a StepOnePlus system (applied Biosystems, Life Technologies, Stockholm Sweden) with the following parameters: 50 ∘C for 2 min and 95 ∘C for 10 min, and 45 cycles of 95 ∘C for 15 s followed by 60 ∘C for 1 min. Gene copy numbers were calculated from the mean cycle threshold (Ct) value of three replicates and the standard curve for the appropriate primer and probe set. For each primer and probe set, duplicate standard curves were made from 10-fold dilution series ranging from 108 to 1 gene copies per reaction. The standard curves were made from linearized plasmids of the target nifH or from synthesized gBLocks gene fragments (IDT technologies, Cralville, Iowa, USA). Regression analyses of the results (number of cycles = Ct) of the standard curves were analysed in Excel. Two microlitres of 5 KDa filtered nuclease-free water was used for the no-template controls (NTCs). No nifH copies were detected for any target in the NTC. In some samples, only one or two of the three replicates produced an amplification signal; these were noted as detectable but not quantifiable (< QL). A fourth replicate was used to estimate the reaction efficiency for the Trichodesmium and UCYN-B targets, as previously described in Short et al. (2004). Seven and two samples were below 95 % in reaction efficiency for Trichodesmium and UCYN-B, respectively. The samples with qPCR reaction efficiency below 95 % were excluded. The detection limit for the qPCR assays is 1–10 copies.
To determine directly the biovolume and C content of diazotrophs, cell sizes of Trichodesmium and UCYN-B were determined in samples from the photic layer of each LD station. Briefly, 2.3 L of surface (5 m) seawater was gently filtered (< 0.2 bar) onto 2 µm nominal porosity (25 mm diameter) polycarbonate filters, fixed with paraformaldehyde (final concentration 2 %) and stored at −80 ∘C. Cell length and width measurements were performed on 25 to 50 cells per station at 400 × magnification with a Zeiss Axio Observer epifluorescence microscope. The biovolume (BV) of Trichodesmium and UCYN was estimated using the equation for a cylinder and a sphere, respectively (Sun and Liu, 2003). The cellular C contents were determined by using the relation between BV and C content according to Verity et al. (1992). Given that our work was performed in the field on wild populations, we preferred to use the biovolume estimate for C content rather than previously measured values based on published culture data. The C contents estimated here are within the range of those previously reported (Dekaezemacker and Bonnet, 2011; Dron et al., 2013; Hynes et al., 2012; Knapp, 2012; Luo et al., 2012). As DDAs were not easily identified on the filters, the C content was indirectly estimated. We used a C content of 1400 pg C cell−1 for Rhizosolenia spp. (determined for the OUTPACE cruise; Karine Leblanc, personal communication, 2017) and assumed six cells per trichome of Richelia intracellularis (Foster and Zehr, 2006; Villareal, 1989), and one Richelia per diatom Rhizosolenia (both Rhizosolenia spp. and R. intracellularis are rarely reported as asymbiotic).
Table 2Mean daily N budget at the three stations LD A, LD B and LD C.
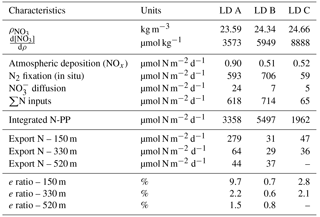
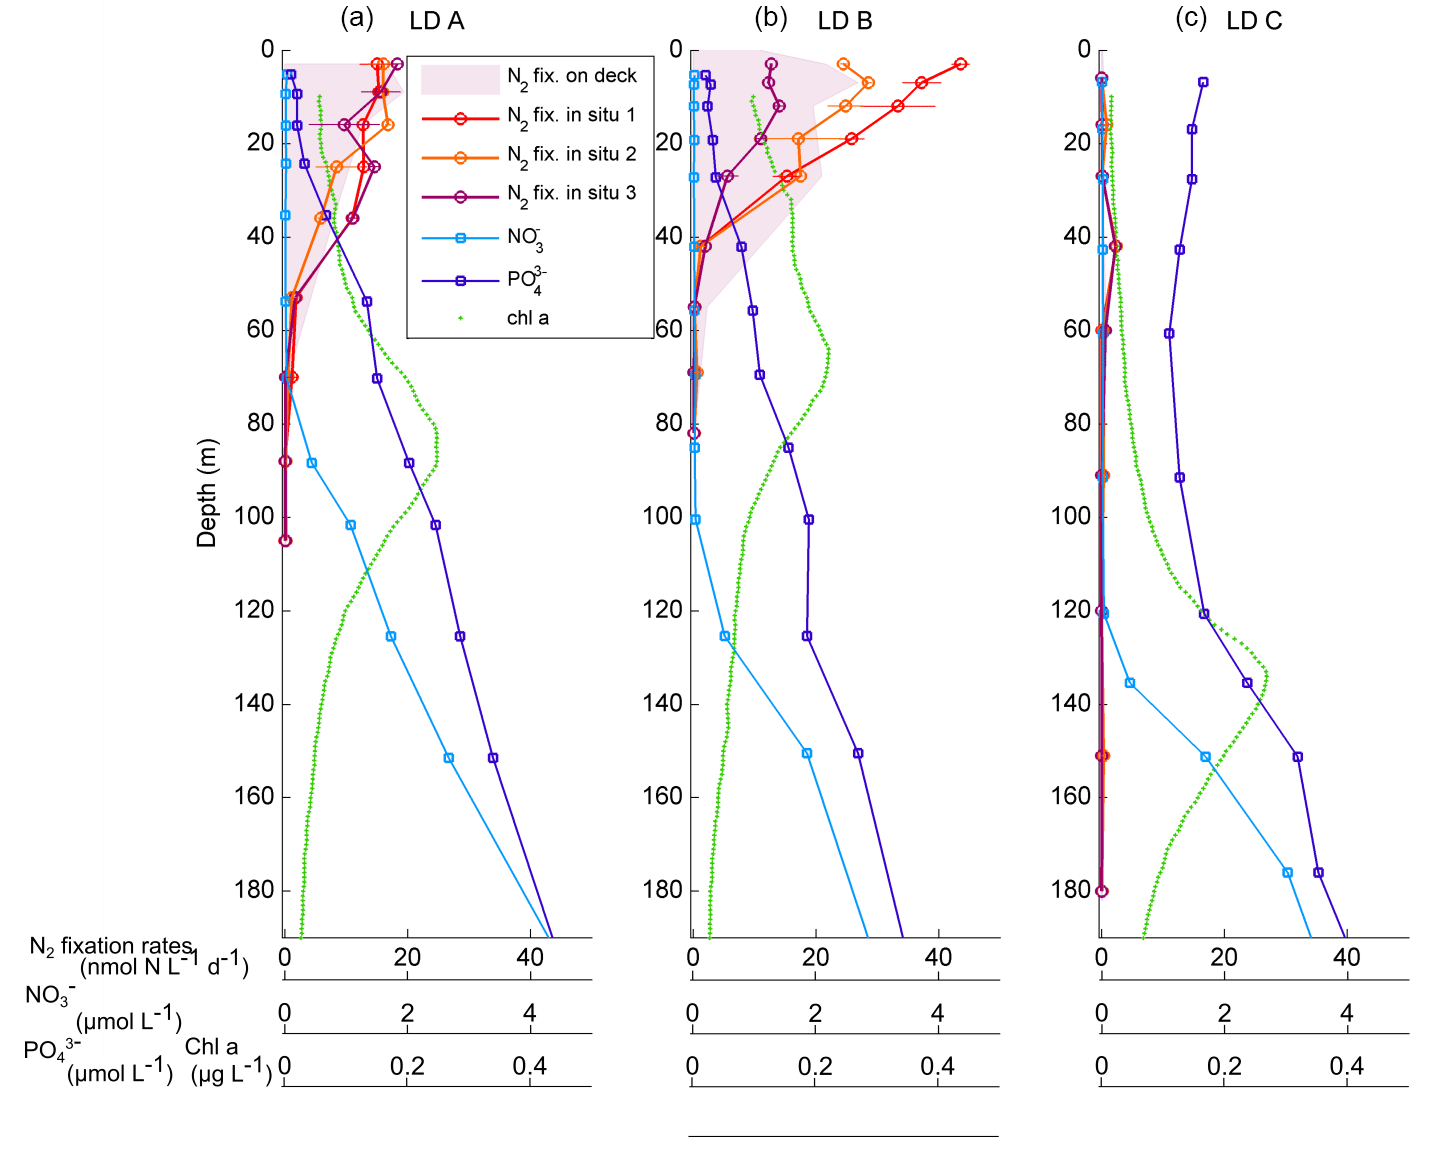
Figure 2Vertical profiles of net N2 fixation rates (nmol N L−1 d−1) estimated using in situ incubations at day 1 (in situ 1: red circles), day 3 (in situ 2: orange circles) and day 5 (in situ 3: purple) and using on-deck incubations (purple filled area) at stations LD A (a), LD B (b) and LD C (c). The NO concentrations averaged over the 5 days of station occupation are also reported (light blue squares: µmol L−1), as well as PO concentrations (dark blue squares: µmol L−1), and fluorescence/chlorophyll (green dots: µg L−1).
2.2.8 Statistical analyses
Spearman correlation coefficients were used to examine the relationships between DCM and nitracline depths during the station occupation (α = 0.05).
A non-parametric Mann–Whitney test (α=0.05) was used to compare N2 fixation rates obtained using in situ and on-deck incubation methods.

Figure 3Temporal evolution of PAR, DCM (green line), (red line), and 1 % of surface PAR (yellow dots and crosses) during the three stations' occupation period (LD A: a; LD B: b; LD C: c).
3.1 Hydrological background
NO concentrations in the photic layer were below the quantification limit (0.05 µmol L−1) during the station occupation at the three LD stations. They became quantifiable below 70, 100 and 120 m depth at LD A, B and C, respectively (Fig. 2) and at depths corresponding to a density anomaly of 23.59, 24.34 and 24.66 kg m−3, respectively. The latter values correspond to the top of the nitracline; the isopycnal (Fig. 3; Table 2). The corresponding values were 3573, 5949 and 8888 µmol kg−1 for stations LD A, LD B and LD C, respectively.
Averaged PO concentrations were close to or below the quantification limit (0.05 µmol L−1) from the surface to 20 m at LD A and LD B, and then increased with depth to reach 0.46 and 0.36 µmol L−1 at 200 m at LD A and LD B, respectively (Fig. 2). At LD C, PO concentrations were always above the quantification limit and varied from 0.11 to 0.17 µmol L−1 in the 0–120 m layer. Below 120 m, PO concentrations increased with depth to reach 0.43 µmol L−1 at 200 m.
At LD A, the DCM and the depths were located between 60 and 100 m (Fig. 3). At LD B, the was located between 100 and 120 m, while the depth of the DCM increased from 25 to 70 m during the five days that the station was occupied. At LD C, the DCM and the were below the bottom of the photic layer (110–120 m), varying concurrently between 115 and 155 m. The DCM and depths were significantly correlated (p < 0.05) at LD A and LD C and not correlated (p > 0.05) at LD B. The depths of the photic layers, corresponding to 1 % of the surface PAR at midday, were 80–90 m at LD A, 60–70 m at LD B and 110–120 m at LD C.
3.2 Atmospheric deposition
Nitrate dissolution from aerosols occurred rapidly, releasing in seawater on average 1.8 nmol m−3 (26 ng m−3) dissolved inorganic nitrogen. Nitrate appeared to be nitrate aerosol since no correlation was observed between nitrate and Fe, Si, Na and Cl (Karine Desboeufs, personal communication, 2017), precluding a mixing with ash or sea salt. Extrapolated dry deposition flux (Table 2) was on average 630 ± 329 nmol m−2 d−1 (3.22 ± 1.7 mg m−2 yr−1).
3.3 N2 fixation rates
N2 fixation rates measured using the in situ incubation method ranging from < QL to 19.3 nmol N L−1 d−1 at LD A, 0.1 to 45.0 nmol N L−1 d−1 at LD B and < QL to 2.6 nmol N L−1 d−1 at LD C (Fig. 2). At LD A and LD B, maximum rates were measured near the surface (5 m) where they reached 19.3 and 45.0 nmol N L−1 d−1, and decreased with depth down to 0.5 nmol L−1 d−1 at 70 and 55 m, respectively at LD A and LD B. At LD C, N2 fixation rates were 2 to 20 times lower than at LD B and LD A, with a maximum of 2.6 nmol N L−1 d−1 located around 40 m. Close to the surface (5 m), rates were below the quantification limit. At LD A and LD C, the three profiles measured on days 1, 3 and 5 at each station were similar to each other, while at LD B rates measured in the 0–40 m layer were different over the three sampling dates (Fig. 2), with rates decreasing over time.
N2 fixation rates measured using the deck incubation method were not statistically different (Mann–Whitney paired test, p < 0.05) from those measured using the in situ mooring line method (Fig. 2). They ranged 0.1 to 21.0 nmol N L−1 d−1 at LD A and 0.1 to 30.3 nmol N L−1 d−1 at LD B, and were below 1.2 nmol N L−1 d−1 at LD C. Overall, the profiles were similar between the two methods, except the maximum at 40 m at LD C, which was not sampled with the on-deck incubation method. In addition, N2 fixation rates from days 1–3 were not statistically different each other (Mann–Whitney paired test, p < 0.05).
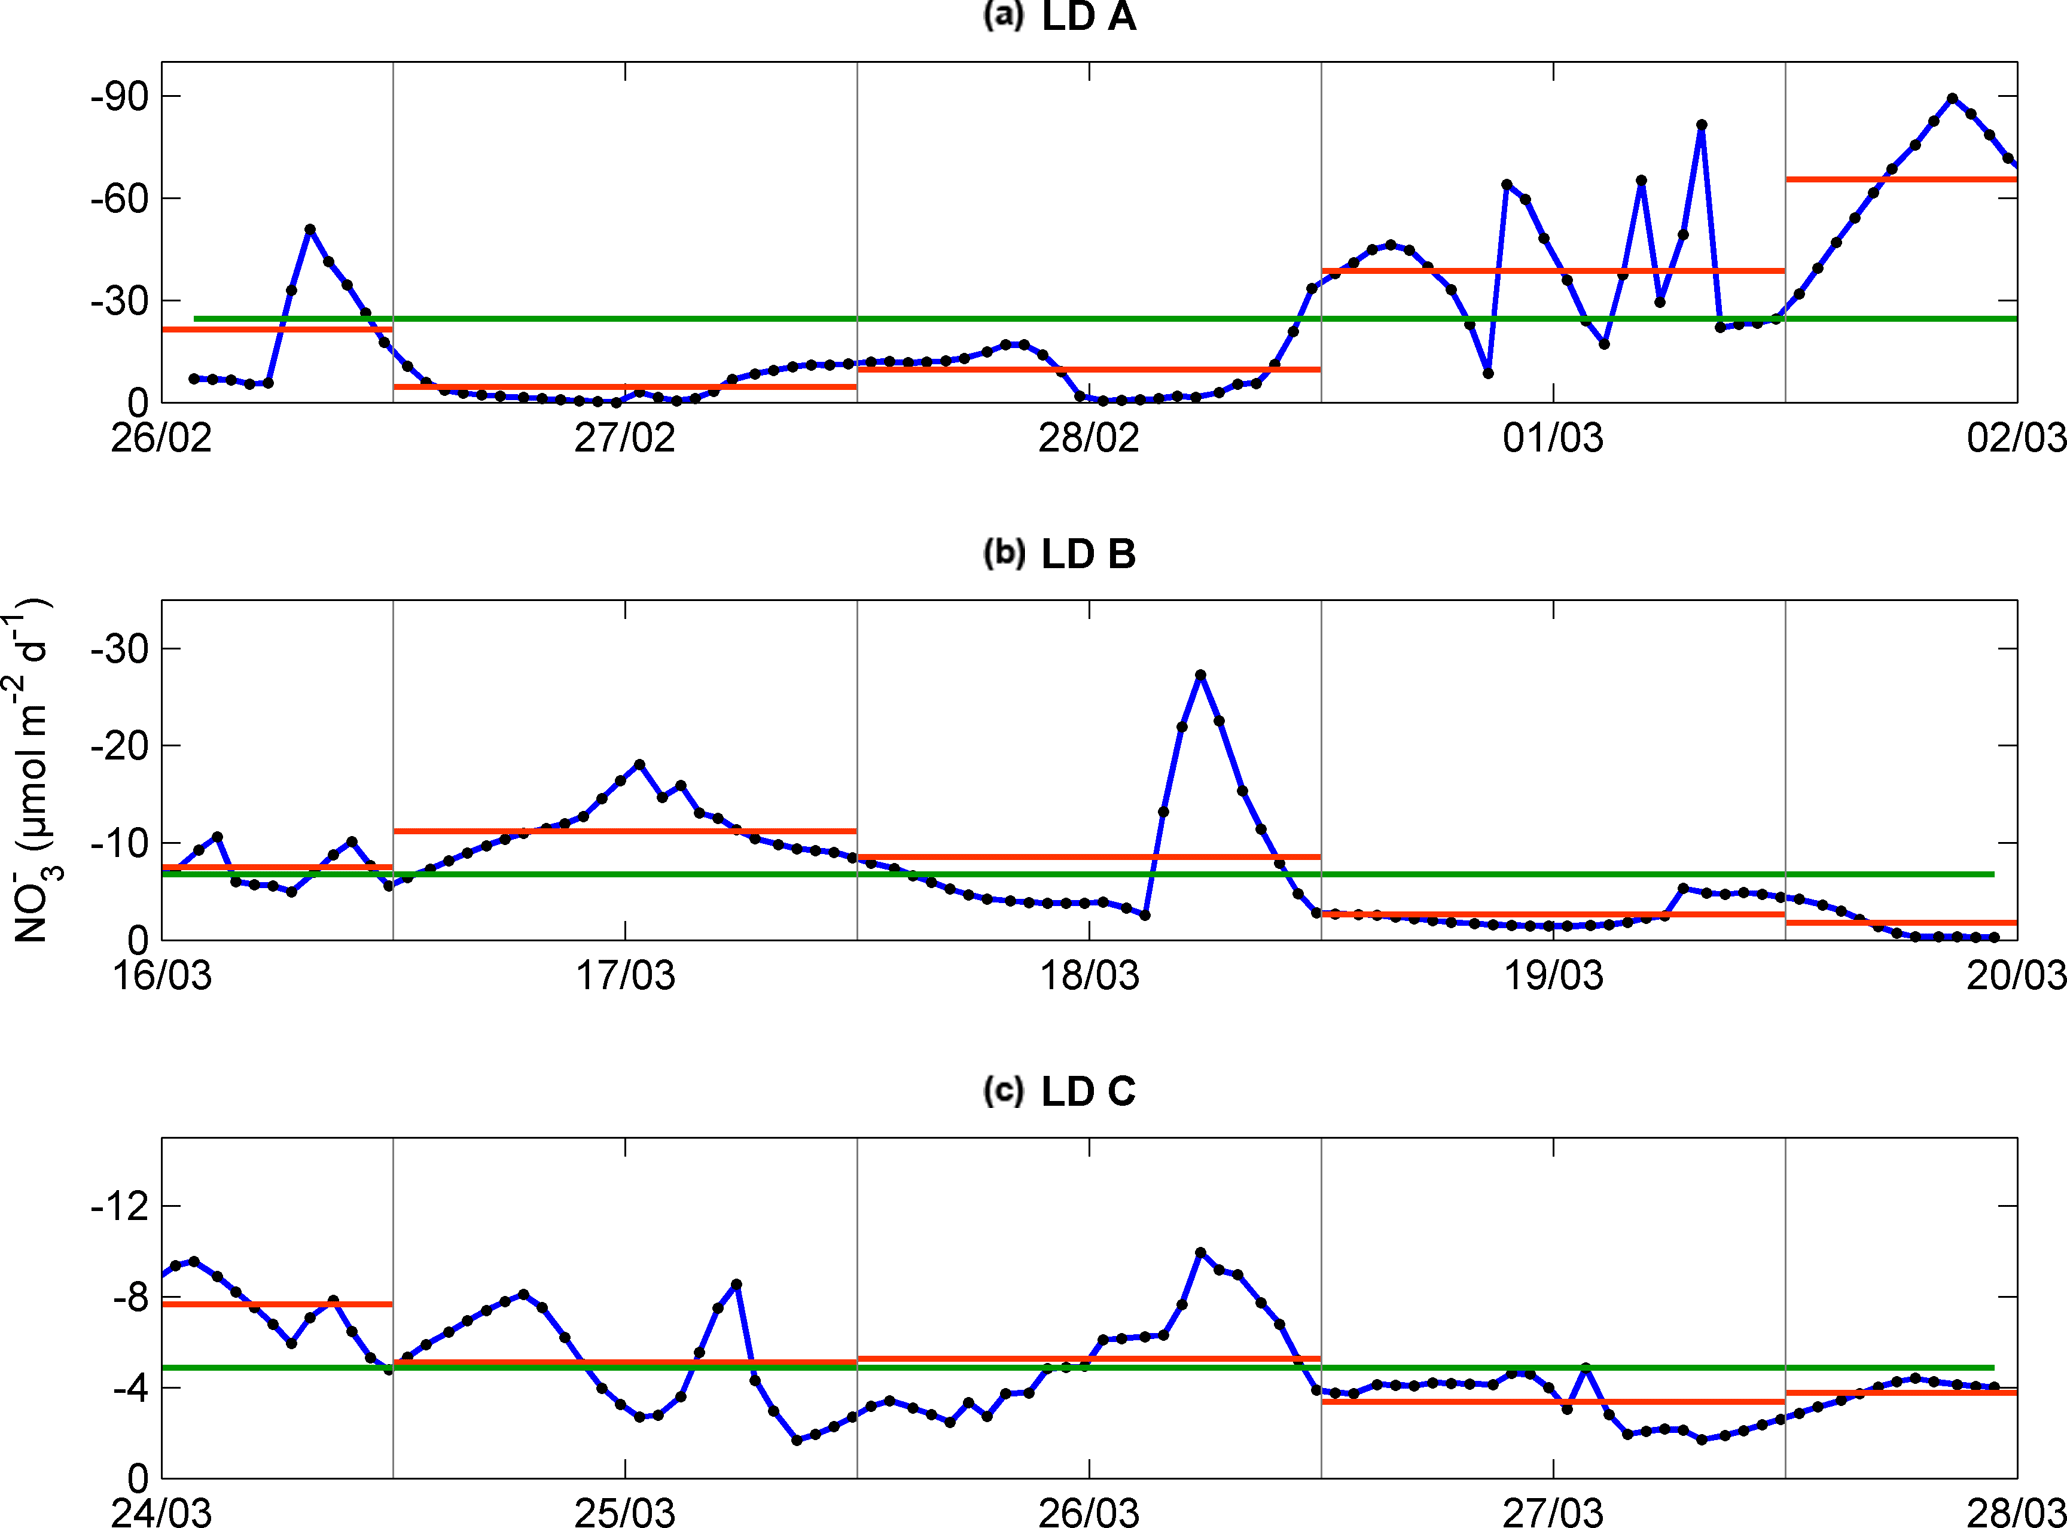
Figure 4Temporal evolution of upward vertical NO flux (µmol N m−2 d−1) calculated at the top of the nitracline for each station, LD A (a), LD B (b), and LD C (c), after temporal interpolation (blue). Daily mean from noon to noon in dashed orange line and occupation period mean in green line.
Integrated N2 fixation rates were 593 ± 51, 706 ± 302 and 59 ± 16 µmol N m−2 d−1 at LD A, LD B and LD C, respectively using data from the in situ incubation method (Fig. 2; Table 2) and 628 ± 156, 942 ± 253 and 56 ± 31 µmol N m−2 d−1 at LD A, LD B, and LD C, respectively, using data from the deck incubation method (Fig. 2). At LD A, 80 % of the integrated N2 fixation rate was reached at 36 m, at LD B 82 % was reached at 27 m, and at LD C 78 % was reached at 60 m.
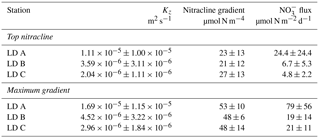
Table 3Mean turbulent diffusion coefficient (Kz), mean nitracline gradient, mean NO flux and associated standard deviations (n=3) over the station occupation at LD A, LD B and LD C at the top nitracline and at the maximum gradient.
3.4 Vertical turbulent diffusive fluxes of nitrate
The averaged NO input through vertical turbulent diffusion showed strong time variability, with a typical standard deviation of the same order as the mean value (Table 3) and a strong contrast between the western station LD A and the two other stations, with mean values equal to 24.4 ± 24.4 µmol N m−2 d−1 at LD A and 6.7 ± 5.3 and 4.8 ± 2.2 µmol N m−2 d−1 at LD B and LD C, respectively (Fig. 4). At LD A, a NO peak input of 50 µmol N m−2 d−1 was observed on day 1 (26 February), while during days 2 and 3 (27 and 28 February) the daily average input was lower than the average value for the station, between 5 and 10 µmol N m−2 d−1, without any peak input. At the end of LD A (days 4 and 5 – 1 and 2 March), the strongest NO input variability was observed with instantaneous peaks reaching 46 to 89 µmol N m−2 d−1. When averaged per day, daily input was minimum on day 2 (27 February) with 5 µmol N m−2 d−1 and maximum on day 5 (2 March) with 65 µmol N m−2 d−1 (red lines in Fig. 4a). At LD B, the mean daily NO input varied within a factor of ∼ 5, from 2 µmol N m−2 d−1 on day 5 (20 March) to 11 µmol N m−2 d−1 on day 2 (17 March). The highest daily averages obtained on days 2 and 3 were explained by the occurrence of NO input peaks. At LD C, NO input heterogeneously varied between 2 and 10 µmol N m−2 d−1 with minimum daily average on day 4 (27 March; 3 µmol N m−2 d−1) and maximum daily average on day 1 (24 March; 8 µmol N m−2 d−1). Similarly as for the other stations, NO input peaks were observed during the days of higher mean daily NO input.
This time variability in NO input was strongly influenced by the vertical turbulent diffusion coefficient. The Kz time series showed strong variability (Table 3), with peak values occurring intermittently during periods of enhanced turbulence, thus leading to peaks in NO turbulent diffusive flux.
3.5 Particulate matter export
Mass fluxes recovered in the sediment traps at the three stations over the three sampling depths (150, 330 and 520 m) ranged from 13.6 to 87.2 mg of dry weight (DW) m−2 d−1 (Table 1). At LD A and LD C, fluxes decreased with depth, which was not observed at LD B. Maximum mass fluxes were measured at LD A, with 87.2 mg DW m−2 d−1 at 150 m, 23.9 mg DW m−2 d−1 at 330 m and 22.3 mg DW m−2 d−1 at 520 m. LD B presented the lowest export rate at 150 m (14.1 mg DW m−2 d−1) over the three stations. At LD C, 19.6 mg DW m−2 d−1 of particulate matter was exported at 150 m and the lowest export rate was recorded at 330 m.
Particulate C (PC) and PN recovered in the sediment traps followed the same patterns as the mass fluxes (Table 1), with a maximum export rate at 150 m at LD A and a minimum export rate at LD B and LD C. However, as PN and PC were not always in the same proportion in the exported matter, variations in C : N ratios at the three stations were reduced, with averaged C : N ratios of 8.2 at LD A, 9.1 at LD B and 6.2 at LD C.
The mass of swimmers (zooplankton) recovered in the traps ranged from 10.5 to 376.1 mg DW m−2 d−1 (Table 4) and accounted for 36 to 94 % of total DW. The maximum was found at 330 m at LD A, and 150 m at LD B and LD C. As for particulate matter, zooplankton C (Zoo-C) and N (Zoo-N) mass measured at each depth of each station followed the same pattern as the mass of swimmers recovered. Zoo-C ranged from 4.9 to 129.2 mg C m−2 d−1 and Zoo-N ranged from 1.1 to 19.5 mg N m−2 d−1.
Table 4Zooplankton sediment traps data at the three LD stations. Depth of sampling, mean dry weight (DW) zooplankton recovered in the traps, and C and N associated with zooplankton.
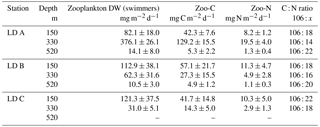

Figure 5Relative contribution of each diazotroph (Trichodesmium in red, UCYN-B in orange and het-1 in yellow) to the total PC associated with diazotrophs (diazotroph-PC) in the sediment traps at 150 m (top), 330 m (middle) and 520 m (bottom), at the three stations LD A (a), LD B (b) and LD C (c). Values in blue correspond to the contribution of diazotroph-PC to total PC measured in the traps. No Trichodesmium valid data available at LD A 150 m.
3.6 Direct export of diazotrophs
Trichodesmium abundance measured in the sediment traps at the three stations ranged from below quantification limit (< QL) to 2.67 × 10⁴ nifH gene copies mL−1 of sediment material (< QL at LD C 330 m and not available at LD A 150 m), and represented less than 0.1 % of Trichodesmium abundance integrated over the water column at the three stations based on data of Stenegren et al. (2018). UCYN-B abundance measured in the traps ranged from < QL to 4.27 × 10³ nifH gene copies mL−1. It accounted for 0.1 to 10.5 % of UCYN-B abundance integrated over the water column at LD A, and < 0.5 % at LD B and LD C. DDAs abundance, restricted to het-1 (Richelia associated with Rhizosolenia diatoms), ranged from < QL to 1.99 × 10⁴ nifH gene copies mL−1 (< QL at LD A 150 and 520 m, LD B 150 m and LD C 330 m) and accounted up to 72.6, 2.9 and 0.1 % of DDAs abundance integrated over the water column at LD A, LD B and LD C, respectively. While het-2 (Richelia associated with Hemiaulus diatoms) were observed in the water column (Stenegren et al., 2018), they were only detected in one sediment trap sample (LD B, 330 m) and < QL in 330 m from LD A and 500 m from LD B. When converted to C, diazotrophs represented between 5.4 and 30.6 % (Fig. 5) of the total PC measured in the traps (Table 1) at LD A, from < 0.1 to 5.0 % at LD B, and < 0.1 % at LD C. Trichodesmium, and het-1 were the major contributors to diazotroph export at LD A and LD B (note that Trichodesmium data were not available for LD A, 150 m) and UCYN-B and het-1 were the major contributors at LD C.
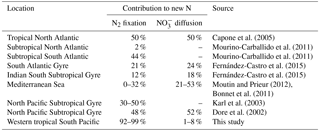
Table 5Contribution of N2 fixation and NO vertical diffusion to new N inputs in oligotrophic region.
4.1 Towards a daily N budget
The analysis of hydrographic tracers and velocity structures present during our study at the three stations reveals that horizontal variability due to advection was important at spatial scales larger than the ones sampled at each station (de Verneil et al., 2018). Thus, we consider that we sampled the same water mass at each station and only vertical exchanges controlled input and output of N in the upper water column, which allow us to perform a daily N budget at the three stations, as summarized in Table 2.
4.2 Contribution of N2 fixation to new N input in the WTSP
The daily N budget (Table 2) indicates that N2 fixation was the major external source of N to the WTSP, regardless of the degree of oligotrophy, and represents more than 90 % of new N to the surface ocean at every station. This contribution is higher than in previous studies performed in other oligotrophic regions impacted by N2 fixation (Table 5) such as the tropical North Atlantic (50 %, Capone et al., 2005) and Pacific (30–50 %, Dore et al., 2002; Karl et al., 2002) and higher than the average contribution at the global scale (Gruber, 2008). This previously unreported high contribution of N2 fixation may have several origins.
Extrapolated NOx deposition from the atmosphere during OUTPACE (range: 0.34–1.05 µmol m−2 d−1) were one order of magnitude lower than predicted with major uncertainties by global models that include wet and gas deposition for that region (Kanakidou et al., 2012). Our flux could be an underestimation as it represents only dry deposition and as gas and organic forms were not measured. At the global scale and depending on the location, organic nitrogen could represent up to 90 % of N atmospheric deposition (Kanakidou et al., 2012), and NH could account for ∼ 40 % (Dentener et al., 2006). Even if we double our estimated deposition flux, atmospheric deposition still remained low (< 1.5 %) and consequently represented a minor contribution of the new N input (Table 2). This negligible contribution of atmospheric input to the overall N budget (less than 1.5 %) therefore implies an important contribution of other terms, such as N2 fixation.
Then, NO input by vertical turbulent diffusion appeared as the second source (1 to 8 %) of new N at the three stations. This contribution was lower than in previous studies in other oligotrophic regions (Table 5), where NO input by vertical turbulent diffusion contributes ∼ 18 % of new N in the Indian South Subtropical Gyre (Fernández-Castro et al., 2015), and ∼ 50 % in the tropical North Atlantic (Capone et al., 2005). In most studies (Fernández-Castro et al., 2015; Moutin and Prieur, 2012; Painter et al., 2013), an average Kz value is used (i.e. averaged over the cruise, over a station or over depth) to determine NO input by turbulence in the photic layer. In this study we performed high-frequency direct measurements of Kz and highlighted the importance of turbulent event pulses on diffusive NO input. Using a constant Kz of 10−5 m2 s−1 at the three stations decreases the NO input down to 22.9 µmol N m−2 d−1 at LD A and increases NO input up to 19.9 and 25.5 µmol N m−2 d−1 at LD B and LD C, which is 2.7 and 4.8 times higher than using a high-frequency Kz for the latter two stations. The contrasted NO input observed at the three stations results from the high variability in turbulence along the west–east transects (Bouruet-Aubertot et al., 2018). Thus, using a constant Kz removes the contrasted NO input between the three stations (∼ 4 times higher at LD A than at LD B and LD C). Consequently, using average Kz values for the turbulent diffusive flux computation can lead to significant bias. In our study, NO input was calculated at the top of the nitracline. Painter et al. (2013) have demonstrated the variability that may be introduced into the estimated NO input by the depth of the defined nitracline. With a constant Kz in the 2 cases, they estimated that NO input was 5 times lower at the top of nitracline depth than at the maximum gradient depth. In our study, the NO input would also be ∼ 3–4 times higher if calculated at the maximum gradient depth rather than at the top nitracline, mainly due to the increase in the nitracline gradient up to 48 µmol N m−4 (Table 3). However, in all cases, the NO input by turbulence always represented a minor contribution to the N budget.
Finally, the high contribution of N2 fixation to new N input in the photic layer results from the intrinsically high N2 fixation rates we measured in the WTSP (especially in MA waters), which are part of the hotspot of N2 fixation reported by Bonnet et al. (2017), with rates being in the upper range of rates reported in the global N2 fixation Marine Ecosystem Data (MAREDAT) database (Luo et al., 2012). Those high N2 fixation rates are as high as they are westward in the Solomon Sea (Berthelot et al., 2017; Bonnet et al., 2015), extending the hotspot of N2 fixation to the whole of the WTSP (Bonnet et al., 2017).
The contribution of N2 fixation to PP was around 13–18 % in MA waters and 3 % in SPG waters. The high contribution measured in the MA region is an order of magnitude higher than that reported in previous studies performed in the Pacific Ocean (Moutin et al., 2008; Raimbault and Garcia, 2008; Shiozaki et al., 2014), the Atlantic Ocean (Fonseca-Batista et al., 2017; Rijkenberg et al., 2011) and the Mediterranean Sea (Moutin and Prieur, 2012), where it never exceeds 5 %, and also slightly higher than the contribution reported from a mesocosm experiment in the New Caledonia lagoon during a UCYN bloom (10.8 ± 5.0 %; Berthelot et al., 2015). As there was low supply of NO through vertical diffusion (< 8 %) and atmospheric deposition (< 1.5 %), N2 fixation sustains nearly all new production during the austral summer in the WTSP.
4.3 Coupling between N2 fixation and export in the WTSP
Previous studies have used different methods for coupled measurements of N2 fixation and export (Berthelot et al., 2015; Dore et al., 2008; Karl et al., 2012; Scharek et al., 1999a; Subramaniam et al., 2008; White et al., 2012). The Lagrangian strategy used here was designed to sample the same water mass during the experiment and therefore minimize the methodological issues associated with particulate export flux measurements using sediment traps in the open ocean (Monroy et al., 2017). The severe meteorological conditions due to the development of tropical cyclone Pam (a category 5 storm) that hit the Vanuatu islands on March 2015 required us to establish the LD B station at a more easterly location than initially planned (Moutin et al., 2017). LD B was therefore sampled in a surface bloom with a DCM close to the surface (Fig. 3), in contrast to LD A and LD C, which were sampled in a zone with a DCM near the bottom of the photic layer (Fig. 3). Thus, data from LD B, although presented together with LD A and LD C, will be discussed apart.
Stations LD A and LD C were considered as oligotrophic and ultra-oligotrophic, respectively. PP was twice higher and the DCM shallower at station LD A, compared to LD C. Furthermore, the diazotroph community composition was contrasted between the two stations, with a clear dominance of Trichodesmium at LD A (6.6 × 10⁴ nifH gene copies L−1 at 5 m) and lower abundance of diazotrophs, and a clear domination of UCYN-B (3.6 × 10³ nifH gene copies L−1 at 5 m) and het-1 (3.0 × 10³ nifH copies L−1 at 5 m) (Stenegren et al., 2018) at LD C. The e ratio (e ratio = PC export ∕ PP) calculated at LD A (9.7 %) was higher than the e ratio in most studied oligotrophic regions (Karl et al., 2012; Moutin and Prieur, 2012; Raimbault and Garcia, 2008), where it rarely exceeds 1 %, indicating a high efficiency of the WTSP to export C relative to PP. Moreover, the e ratio was higher at LD A (characterized by high N2 fixation rates, 593 µmol N m−2 d−1) than at LD C (characterized by low N2 fixation (59 µmol N m−2 d−1)). This is in agreement with previous studies reporting typical e ratios of 1 % in ultra-oligotrophic regions characterized by low N2 fixation rates (like LD C), such as the eastern SPG (Moutin et al., 2008; Raimbault and Garcia, 2008) or the Mediterranean Sea (Bonnet et al., 2011), and typical e ratios of 5 % in regions characterized by high N2 fixation rates such as station ALOHA (Karl et al., 2012). Taken together, these results suggest that N2 fixation would enhance particle export. This is supported by Knapp et al. (2018), who showed that nearly all exported production was supported by N2 fixation in MA waters during the OUTPACE cruise.
At station ALOHA, the e ratio varies between 2 and 15 % and is maximum during summer export fluxes of PN, which are attributed to the direct export of DDAs (Karl et al., 2012). In the present study, we investigated the potential direct export of diazotrophs by measuring the abundance of each diazotroph group in the traps. We reveal that the export efficiency of Trichodesmium, i.e. the percentage of organisms present in the water column recovered in the traps (< 0.1 %), was lower than that of other diazotrophs, which is in agreement with Walsby (1992) and Chen et al. (2003), who revealed that Trichodesmium are rarely recovered in the sediment traps. The export efficiency of UCYN-B (2.3 % on average) and het-1 (4.0 % on average) was higher than that of Trichodesmium, which is consistent with Bonnet et al. (2016b) and Karl et al. (2012). In a mesocosm experiment performed in the coastal waters of New Caledonia, Bonnet et al. (2016b) revealed that UCYN-C were efficiently exported thanks to aggregation processes. In this study, the contribution of diazotrophs to PC export was up to 30.6 % at LD A, and was mainly driven by het-1 as the estimated het-1 C content was higher than that of UCYN-B and Trichodesmium. This suggests that DDAs were efficiently exported, which is in agreement with previous studies (Karl et al., 2012; Subramaniam et al., 2008). At LD C, less than 0.1 % of the total PC measured in the traps was associated with diazotrophs, which is probably due to lower abundances of het-1 in the traps (< DL) than at LD A and the dominance of UCYN-B (at 330 m) having low cellular C content. The contribution of diazotrophs to PC export at LD A (up to 30.6 % at 330 m) was high compared to what has been measured in a much smaller water column (15 m high mesocosms) in New Caledonia (ca. 20 %; Bonnet et al., 2016a), and suggests that the direct export of diazotrophs should be further investigated in oligotrophic open ocean. To date, few qPCR data on nifH from sediment traps are available (Karl et al., 2012) to compare with our study. However, it has to be noted that we measured the highest export and e ratio at LD A, where Trichodesmium dominated the diazotroph community. This suggests that most of the export was likely indirect, i.e. after the transfer of diazotroph-derived N (DDN) to the surrounding bacterial, phytoplankton and zooplankton communities, as revealed by Caffin et al. (2018) during the same cruise.
Station LD B was studied during a surface Trichodesmium bloom; however observations of poor cell integrity were reported (Stenegren et al., 2018) and other evidence indicated the senescence of the bloom (de Verneil et al., 2018). Higher N2 fixation and integrated PP rates than those measured at LD A and C together, with lower PN export, resulted in an e ratio less than 0.8 % (Table 2) at LD B. This very low export efficiency is probably related to the fact that we sampled station LD B during a collapsing Trichodesmium bloom (Stenegren et al., 2018) triggered by PO starvation (de Verneil et al., 2017), as already reported in the WTSP (Moutin et al., 2005). The collapse of Trichodesmium blooms can possibly result from viral lysis (Hewson et al., 2004), mainly leading to the release of dissolved N in surrounding waters, or programmed cell death, mainly leading to rapid sinking of biomass, and may influence C export (Bar-Zeev et al., 2013). Programmed cell death (PCD) was detected at LD B (Spungin et al., 2018), indicating that this process cannot be excluded, while Trichodesmium was not recovered in the traps (they dominated the export of diazotrophs at 150 m, but altogether the direct export of diazotrophs never exceeded 1.1 % of total export). It is thus likely that most of the N accumulated in the phytoplankton pool (including Trichodesmium) was released to the dissolved pool due to grazing and viral lysis, then quickly remineralized due to high microbial activity at LD B (Van Wambeke et al., 2018) and thus would explain the low export rate measured at this station. This result is supported by the efficient transfer of DDN to the surface planktonic food web at this station, as described in Caffin et al. (2018), and previously by Bonnet et al. (2016b) and Berthelot et al. (2016) in the WTSP. Thus, elevated Chl a patches such as those we sampled at LD B may be more productive areas than the ambient oligotrophic waters, but less efficient in terms of export, corresponding to the concept of “high-biomass, low-export” (HBLE) environments initially reported for the Southern Ocean (Lam and Bishop, 2007), where surface waters with high biomass were associated with low particle export at depth.
4.4 Disequilibrium of new vs. exported production
The daily N budget computed here reveals that N input into the photic layer through atmospheric deposition, N2 fixation and vertical NO diffusion exceeded N output through organic matter export at the three studied stations. This imbalance between new and exported production is also observed in different oligotrophic regions of the ocean, such as the SPG (Raimbault and Garcia, 2008), the Barents Sea (Olli et al., 2002; Reigstad et al., 2008; Wexels Riser et al., 2008), the North and South Atlantic gyres (Thomalla et al., 2006), and the equatorial Pacific (Bacon et al., 1996). It should be noted that our budget was performed at the daily scale, but at the annual or longer timescales, the PN export from the photic layer is supposed to balance new N input (Dore et al., 2002; Eppley and Peterson, 1979).
Table 6Contribution of N export by active zooplankton migration to total PN export.
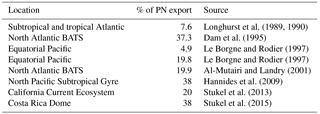
This imbalance between new and exported N frequently reported in the oligotrophic ocean may result from (1) a spatial decoupling between production and export, (2) a temporal decoupling between production and export and/or (3) processes other than particle export such as DON and/or zooplankton export. As we used the Lagrangian strategy described above and confirmed that we sampled the same water at all LD stations during our surveys (de Verneil et al., 2018), the first option (spatial decoupling) can be excluded. The second option would mean that we performed our budget during a period corresponding to production of organic matter that was dissociated from the export that would have occurred later. Such a temporal lag has already been reported in the Southern Ocean (Nodder and Waite, 2001), accompanied by biomass accumulation in the photic layer; therefore, we cannot exclude this hypothesis here. Regarding the third possible explanation, the primary process by which organic matter is exported out of the photic layer is the gravitational sinking of particles to the deep ocean (Karl et al., 1996; Knauer et al., 1990). However, two other main processes can contribute to export: physical mixing resulting in export of dissolved organic matter (Carlson et al., 1994; Carlson and Ducklow, 1995; Copin-Montégut and Avril, 1993; Toggweiler, 1989) and zooplankton diel migrations that actively transport organic matter out of the photic layer (Longhurst et al., 1989, 1990; Longhurst and Glen Harrison, 1988; Vinogradov, 1970). In the present study, the DON export flux was limited to eddy diffusion as we performed our survey during the stratification period, and the low downward flux of DON estimated by Moutin et al. (2018) was unable to explain the observed imbalance. However, zooplankton might play a significant role, although it is hard to quantify. Zooplankton living below the photic layer migrate to the surface at night, and when going down, can increase the export of dissolved and particulate organic and inorganic N through defecation, excretion or mortality (Atkinson et al., 1996; Le Borgne and Rodier, 1997; Dam et al., 1993, 1995; Longhurst et al., 1989, 1990; Longhurst and Williams, 1992; Zhang and Dam, 1998) if it occurs below a barrier to vertical mixing (i.e. nitracline or pycnocline; Longhurst et al., 1989, 1990). Zooplankton has been reported to represent between 4.9 and 38 % of the total export flux (Table 6) in several ecosystems and therefore should be considered in export calculations. Here, we estimated the maximum contribution of zooplankton using the higher value reported in Table 6 (38 %). It reached a maximum of 106 µmol N m−2 d−1 at LD A, 12 µmol N m−2 d−1 at LD B and 18 µmol N m−2 d−1 at LD C at 150 m. By applying this correction to our export values, it cannot explain the observed disequilibrium between new and exported N.
Finally, the zooplankton themselves are sampled by the traps but dead zooplankton were not distinguishable from live swimmers. In the present study, the zooplankton contribution to PN export (Table 4) was high (68 % on average), and above what has ever been measured in other oligotrophic areas such as the Mediterranean Sea (Moutin and Prieur, 2012). Here, all zooplankton recovered in traps were considered as live swimmers and were therefore discarded, which may have lead to an underestimation of the PN export and could also partly explain the observed disequilibrium between new and export production. Further studies should be undertaken to assess the contribution of living versus dead zooplankton to PN.
In summary, we suggest that zooplankton plays a key role on the export in the WTSP and its contribution would increase the particulate export. Moreover, zooplankton activity can transfer N accumulated in the phytoplankton pool to the dissolved pool following grazing and related trophic processes. N from the dissolved pool is then remineralized by microbial activity and accumulates in the photic layer; thus, N is not recovered in sediment traps.
4.5 Methodological underestimation leads to a possible higher contribution of N2 fixation
In this study we intentionally used the “bubble method” to measure N2 fixation rates, considering the small differences observed between this method and the method consisting in adding the 15N2 as dissolved in a subset of seawater previously N2 degassed (Mohr et al., 2010) in Pacific waters (Bonnet et al., 2016b; Shiozaki et al., 2015) and the high risk of sample contamination involved when manipulating sample seawater to prepare dissolved 15N2 (Klawonn et al., 2015). In addition to the contamination issues, preparing dissolved 15N2 on board represents additional time with samples sitting on the bench or rosette before incubation, which is especially critical in tropical environments. To reduce any potential underestimation, we measured the 15N enrichment of the N2 pool at the end of the incubation (7.548 ± 0.557 atom%, Bonnet et al., 2018), which was lower than the theoretical value of ∼ 8.2 atom% based on gas constants calculations (Weiss, 1970). It should be noted that the sampling procedure used for the 15N enrichment measurement of the N2 pool can induce gas exchange between the atmosphere and the sample, and a possible N2 contamination that can lead to a decrease in the 15N enrichment of the sample. Moreover, we are aware that the dissolution kinetics of 15N2 in the incubation bottles is progressive along the 24 h of incubation (Mohr et al., 2010). Therefore, the 15N enrichment of the N2 pool measured with the MIMS at the end of the incubation likely represents maximum values, and the N2 fixation rates provided in this study represent minimum values. This reinforces the conclusions of this study regarding the prominent role of N2 fixation in this region. Großkopf et al. (2012) found that the discrepancy between both methods was more important when UCYN dominates the diazotroph community as compared to when Trichodesmium dominates. Consequently, N2 fixation rates in this study are potentially more underestimated in SPG waters than in MA waters. By applying the maximum factor of underestimation found by Großkopf et al. (2012; i.e. 1.7), N2 fixation in SPG waters would have been higher (100 µmol N m−1 d−1 instead of 59), which is still far lower than in MA waters and does not change the conclusions of this study.
In this study, we successfully used a Lagrangian strategy in the WTSP to follow the same water mass during 5 days in order to perform N budgets during the stratification period (February–March 2015) at three stations. N2 fixation appeared as a substantial biogeochemical process providing the major external source of N in the photic layer. Trichodesmium was the major diazotroph in the oligotrophic MA waters (LD A and LD B), while UCYN dominated the diazotroph community in the ultra-oligotrophic waters of the gyre (LD C). N2 fixation contributed ∼ 13–18 % of the estimated PP in the MA region where N2 fixation rates were high, and ∼ 3 % in the SPG water where N2 fixation rates were low. As there was limited supply of NO through vertical turbulent diffusion (< 8 %) and dry atmospheric deposition (< 1 %), N2 fixation accounted for nearly all new production (more than 90 % of new N). The current coupling between typical high N2 fixation rates of the WTSP, with the high PN and PC export measured in this region associated with high e ratios (up to ∼ 10 %), suggests that N2 fixation plays an important role in export during austral summer conditions in the WTSP, either directly or indirectly. The export efficiency measured here in the WTSP (LD A) is comparable to that measured in the Southern Ocean (Rembauville et al., 2015), considered as an efficient ecosystem for C export. The oligotrophic ocean represents 60 % of the global ocean surface and therefore may play a more significant role in C export than initially considered (Baines et al., 1994; Wassmann, 1990). Even if the link between N2 fixation rates and export is obvious, the possible temporal decoupling between these processes and the potential role of zooplankton need to be further investigated. Finally, as Bonnet et al. (2017) have recently shown that the WTSP is a hotspot of N2 fixation, and as we have shown the importance of this process with regard to the N input and N and C export, we suggest that this region of the world ocean should be further investigated by means of oceanographic cruises and the establishment of time series. This would give us a “big picture” of the role of N2 fixation on the export in the oligotrophic ocean.
All data and metadata are available at the French INSU/CNRS LEFE CYBER database (scientific coordinator: Hervé Claustre; data manager and webmaster: Catherine Schmechtig) at the following web address: http://www.obs-vlfr.fr/proof/php/outpace/outpace.php (INSU/CNRS LEFE CYBER, 2017).
The authors declare that they have no conflict of interest.
This article is part of the special issue “Interactions between planktonic organisms and biogeochemical cycles across trophic and N2 fixation gradients in the western tropical South Pacific Ocean: a multidisciplinary approach (OUTPACE experiment)”. It is not associated with a conference.
This is a contribution of the OUTPACE (Oligotrophy from Ultra-oligoTrophy
PACific Experiment) project (https://outpace.mio.univ-amu.fr/, last
access: November 2017), funded by the French research national agency
(ANR-14-CE01-0007-01), the LEFE-CyBER programme (CNRS-INSU), the GOPS
programme (IRD) and the CNES (BC T23, ZBC 4500048836). The project leading to
this publication received funding from European FEDER Fund under project
1166-39417. The OUTPACE cruise (https://doi.org/10.17600/15000900, Moutin and Bonnet,
2015) was managed by MIO (OSU
Institut Pytheas, AMU) from Marseilles (France). The authors thank the crew
of the RV L'Atalante for outstanding shipboard operations.
Gilles Rougier and Marc Picheral are warmly thanked for their efficient help
in CTD rosette management and data processing, as well as
Catherine Schmechtig for the LEFE-CyBER database management. Justine Louis is
warmly thanked for the analyses of atmospheric DIN on board. The
satellite-derived data of sea surface temperature, Chl a concentrations and
currents have been provided by CLS in the framework of the CNES funding; we
warmly thank Marie Isabelle Pujol and Guillaume Taburet for their support in
providing these data. We acknowledge NOAA, and in particular Rick Lumpkin,
for providing the SVP drifters.
Edited by:
Helge Niemann
Reviewed by: Carolin Löscher, Annie
Bourbonnais, and two anonymous referees
Al-Mutairi, H. and Landry, M. R.: Active export of carbon and nitrogen at station ALOHA by diel migrant zooplankton, Deep-Sea Res. Pt. II, 48, 2083–2103, https://doi.org/10.1016/S0967-0645(00)00174-0, 2001.
Altabet, M. A.: Variations in nitrogen isotopic composition between sinking and suspended particles: implications for nitrogen cycling and particle transformation in the open ocean, Deep-Sea Res. Pt. A, 35, 535–554, https://doi.org/10.1016/0198-0149(88)90130-6, 1988.
Aminot, A. and Kérouel, R.: Dosage automatique des nutriments dans les eaux marines?: méthodes en flux continu, Ifremer, Plouzané, 2007.
Atkinson, A., Shreeve, R. S., Pakhomov, E. A., Priddle, J., Blight, S. P., and Ward, P.: Zooplankton response to a phytoplankton bloom near South Georgia, Antarctica, Mar. Ecol.-Prog. Ser., 144, 195–210, https://doi.org/10.3354/meps144195, 1996.
Bacon, M. P., Cochran, J. K., Hirschberg, D., Hammar, T. R., and Fleer, A. P.: Export flux of carbon at the equator during the EqPac time-series cruises estimated from 234Th measurements, Deep.-Sea Res. Pt. II, 43, 1133–1153, https://doi.org/10.1016/0967-0645(96)00016-1, 1996.
Baines, S. R., Pace, M. L., and Karl, D. M.: Why does the relationship between sinking flux and planktonic primary production differ between lakes and oceans?, Limnol. Oceanogr., 39, 213–226, 1994.
Bar-Zeev, E., Avishay, I., Bidle, K. D., and Berman-Frank, I.: Programmed cell death in the marine cyanobacterium Trichodesmium mediates carbon and nitrogen export, ISME J., 7, 2340–2348, https://doi.org/10.1038/ismej.2013.121, 2013.
Benavides, M., Berthelot, H., Duhamel, S., Raimbault, P., and Bonnet, S.: Dissolved organic matter uptake by Trichodesmium in the Southwest Pacific, Sci. Rep., 7, 41315, https://doi.org/10.1038/srep41315, 2017.
Berthelot, H., Moutin, T., L'Helguen, S., Leblanc, K., Hélias, S., Grosso, O., Leblond, N., Charrière, B., and Bonnet, S.: Dinitrogen fixation and dissolved organic nitrogen fueled primary production and particulate export during the VAHINE mesocosm experiment (New Caledonia lagoon), Biogeosciences, 12, 4099–4112, https://doi.org/10.5194/bg-12-4099-2015, 2015.
Berthelot, H., Bonnet, S., Grosso, O., Cornet, V., and Barani, A.: Transfer of diazotroph-derived nitrogen towards non-diazotrophic planktonic communities: a comparative study between Trichodesmium erythraeum, Crocosphaera watsonii and Cyanothece sp., Biogeosciences, 13, 4005–4021, https://doi.org/10.5194/bg-13-4005-2016, 2016.
Berthelot, H., Benavides, M., Moisander, P. H., Grosso, O., and Bonnet, S.: High-nitrogen fixation rates in the particulate and dissolved pools in the Western Tropical Pacific (Solomon and Bismarck Seas), Geophys. Res. Lett., 2, 1–10, https://doi.org/10.1002/2017GL073856, 2017.
Bonnet, S., Biegala, I. C., Dutrieux, P., Slemons, L. O., and Capone, D. G.: Nitrogen fixation in the western equatorial Pacific: Rates, diazotrophic cyanobacterial size class distribution, and biogeochemical significance, Global Biogeochem. Cy., 23, 1–13, https://doi.org/10.1029/2008GB003439, 2009.
Bonnet, S., Grosso, O., and Moutin, T.: Planktonic dinitrogen fixation along a longitudinal gradient across the Mediterranean Sea during the stratified period (BOUM cruise), Biogeosciences, 8, 2257–2267, https://doi.org/10.5194/bg-8-2257-2011, 2011.
Bonnet, S., Rodier, M., Turk-Kubo, K. A., Germineaud, C., Menkes, C., Ganachaud, A., Cravatte, S., Raimbault, P., Campbell, E., Quéroué, F., Sarthou, G., Desnues, A., Maes, C., and Eldin, G.: Contrasted geographical distribution of N2 fixation rates and nifH phylotypes in the Coral and Solomon Seas (southwestern Pacific) during austral winter conditions, Global Biogeochem. Cy., 29, 1874–1892, https://doi.org/10.1002/2015GB005117, 2015.
Bonnet, S., Berthelot, H., Turk-Kubo, K. A., Cornet-Barthaux, V., Fawcett, S., Berman-Frank, I., Barani, A., Grégori, G., Dekaezemacker, J., Benavides, M., and Capone, D. G.: Diazotroph derived nitrogen supports diatom growth in the South West Pacific: A quantitative study using nanoSIMS, Limnol. Oceanogr., 61, 1549–1562, https://doi.org/10.1002/lno.10300, 2016a.
Bonnet, S., Berthelot, H., Turk-Kubo, K., Fawcett, S., Rahav, E., L'Helguen, S., and Berman-Frank, I.: Dynamics of N2 fixation and fate of diazotroph-derived nitrogen in a low-nutrient, low-chlorophyll ecosystem: results from the VAHINE mesocosm experiment (New Caledonia), Biogeosciences, 13, 2653–2673, https://doi.org/10.5194/bg-13-2653-2016, 2016b.
Bonnet, S., Caffin, M., Berthelot, H., and Moutin, T.: Hot spot of N2 fixation in the western tropical South Pacific pleads for a spatial decoupling between N2 fixation and denitrification, P. Natl. Acad. Sci. USA, 114, E2800–E2801, https://doi.org/10.1073/pnas.1619514114, 2017.
onnet, S., Caffin, M., Berthelot, H., Grosso, O., Benavides, M., Helias-Nunige, S., Guieu, C., Stenegren, M., and Foster, R. A.: In depth characterization of diazotroph activity across the Western Tropical South Pacific hot spot of N2 fixation, Biogeosciences Discuss., https://doi.org/10.5194/bg-2017-567, in review, 2018.
Böttjer, D., Dore, J. E., Karl, D. M., Letelier, R. M., Mahaffey, C., Wilson, S. T., Zehr, J. P., and Church, M. J.: Temporal variability of nitrogen fixation and particulate nitrogen export at Station ALOHA, Limnol. Oceanogr., 62, 200–216, https://doi.org/10.1002/lno.10386, 2017.
Bourbonnais, A., Lehmann, M. F., Waniek, J. J., and Schulz-Bull, D. E.: Nitrate isotope anomalies reflect N2 fixation in the Azores Front region (subtropical NE Atlantic), J. Geophys. Res.-Ocean., 114, 1–16, https://doi.org/10.1029/2007JC004617, 2009.
Bouruet-Aubertot, P., Cuypers, Y., Le Goff, H., Rougier, G., de Verneuil, A., Doglioli, A., Picheral, M., Yohia, C., Caffin, M., Lefèvre, D., Petrenko, A., and Moutin, T.: Longitudinal contrast in small scale turbulence along 20∘ S in the Pacific Ocean: origin and impact on biogeochemical fluxes, Biogeosciences Discuss., in preparation, 2018.
Caffin, M., Foster, R., Berthelot, H., and Bonnet, S.: Fate of N2 fixation in the Western Tropical South Pacific Ocean: Transfer of diazotroph-derived nitrogen to non-diazotrophic communities and export of diazotrophs, Biogeosciences Discuss., in preparation, 2018.
Capone, D. G., Burns, J. A., Montoya, J. P., Subramaniam, A., Mahaffey, C., Gunderson, T., Michaels, A. F., and Carpenter, E. J.: Nitrogen fixation by Trichodesmium spp.: An important source of new nitrogen to the tropical and subtropical North Atlantic Ocean, Global Biogeochem. Cy., 19, 1–17, https://doi.org/10.1029/2004GB002331, 2005.
Carlson, C. A. and Ducklow, H. W.: Dissolved organic carbon in the upper ocean of the central equatorial Pacific Ocean, 1992: Daily and finescale vertical variations, Deep-Sea Res. Pt. II, 42, 639–656, https://doi.org/10.1016/0967-0645(95)00023-J, 1995.
Carlson, C. A., Ducklow, H. W., and Michaels, A. F.: Annual flux of dissolved organic carbon from the euphotic zone in the northwestern Sargasso Sea, Nature, 371, 405–408, https://doi.org/10.1038/371405a0, 1994.
Chen, Y. L. L., Chen, H. Y., and Lin, Y. H.: Distribution and downward flux of Trichodesmium in the South China Sea as influenced by the transport from the Kuroshio Current, Mar. Ecol.-Prog. Ser., 259, 47–57, https://doi.org/10.3354/meps259047, 2003.
Church, M. J., Short, C. M., Jenkins, B. D., Karl, D. M., and Zehr, J. P.: Temporpl Patterns of nitrogenase gene (nifH) expression in the oligotrophic North Pacific Ocean, Appl. Environ. Microb., 71, 5362–5370, https://doi.org/10.1128/AEM.71.9.5362-5370.2005, 2005.
Copin-Montégut, G. and Avril, B.: Vertical distribution and temporal variation of dissolved organic carbon in the North-Western Mediterranean Sea, Deep-Sea Res. Pt. I, 40, 1963–1972, https://doi.org/10.1016/0967-0637(93)90041-Z, 1993.
Dabundo, R., Lehmann, M. F., Treibergs, L., Tobias, C. R., Altabet, M. A., Moisander, P. H., and Granger, J.: The contamination of commercial 15N2 gas stocks with 15N labeled nitrate and ammonium and consequences for nitrogen fixation measurements, PLoS ONE, 9, e110335, https://doi.org/10.1371/journal.pone.0110335, 2014.
Dam, H. G., Miller, C. A., and Jonasdottir, S. H.: The Trophic Role of Mesozooplankton at 47-Degrees-N, 20-Degrees-W during the North-Atlantic Bloom Experiment, Deep-Sea Res. Pt. II, 40, 197–212, https://doi.org/10.1016/0967-0645(93)90013-D, 1993.
Dam, H. G., Roman, M. R., and Youngbluth, M. J.: Downward export of respiratory carbon and dissolved inorganic nitrogen by diel-migrant mesozooplankton at the JGOFS Bermuda time-series station, Deep-Sea Res. Pt. I, 42, 1187–1197, https://doi.org/10.1016/0967-0637(95)00048-B, 1995.
Dekaezemacker, J. and Bonnet, S.: Sensitivity of N2 fixation to combined nitrogen forms (NO and NH in two strains of the marine diazotroph Crocosphaera watsonii (Cyanobacteria), Mar. Ecol.-Prog. Ser., 438, 33–46, https://doi.org/10.3354/meps09297, 2011.
Dentener, F., Drevet, J., Lamarque, J. F., Bey, I., Eickhout, B., Fiore, A. M., Hauglustaine, D., Horowitz, L. W., Krol, M., Kulshrestha, U. C., Lawrence, M., Galy-Lacaux, C., Rast, S., Shindell, D., Stevenson, D., Van Noije, T., Atherton, C., Bell, N., Bergman, D., Butler, T., Cofala, J., Collins, B., Doherty, R., Ellingsen, K., Galloway, J., Gauss, M., Montanaro, V., Muller, J. F., Pitari, G., Rodriguez, J., Sanderson, M., Solmon, F., Strahan, S., Schultz, M., Sudo, K., Szopa, S., and Wild, O.: Nitrogen and sulfur deposition on regional and global scales: a multimodel evaluation, Global Biogeochem. Cy., 20, GB4003, https://doi.org/10.1029/2005GB002672, 2006.
Deutsch, C. A., Sarmiento, J. L., Sigman, D. M., Gruber, N., and Dunne, J. P.: Spatial coupling of nitrogen inputs and losses in the ocean, Nature, 445, 163–167, https://doi.org/10.1038/nature05392, 2007.
de Verneil, A., Rousselet, L., Doglioli, A. M., Petrenko, A. A., and Moutin, T.: The fate of a southwest Pacific bloom: gauging the impact of submesoscale vs. mesoscale circulation on biological gradients in the subtropics, Biogeosciences, 14, 3471–3486, https://doi.org/10.5194/bg-14-3471-2017, 2017.
de Verneil, A., Rousselet, L., Doglioli, A. M., Petrenko, A. A., Maes, C., Bouruet-Aubertot, P., and Moutin, T.: OUTPACE long duration stations: physical variability, context of biogeochemical sampling, and evaluation of sampling strategy, Biogeosciences, 15, 2125–2147, https://doi.org/10.5194/bg-15-2125-2018, 2018.
Doglioli, A. M., Nencioli, F., Petrenko, A. A., Rougier, G., Fuda, J.-L., and Grima, N.: A software package and hardware tools for in situ experiments in a Lagrangian reference frame, J. Atmos. Ocean. Tech., 30, 1940–1950, 2013.
Dore, J. E., Brum, J. R., Tupas, L. M., and Karl, D. M.: Seasonal and interannual variability in sources of nitrogen supporting export in the oligotrophic subtropical North Pacific Ocean, Limnol. Oceanogr., 47, 1595–1607, 2002.
Dore, J. E., Letelier, R. M., Church, M. J., Lukas, R., and Karl, D. M.: Summer phytoplankton blooms in the oligotrophic North Pacific Subtropical Gyre: Historical perspective and recent observations, Prog. Oceanogr., 76, 2–38, https://doi.org/10.1016/j.pocean.2007.10.002, 2008.
d'Ovidio, F., Della Penna, A., Trull, T. W., Nencioli, F., Pujol, M.-I., Rio, M.-H., Park, Y.-H., Cotté, C., Zhou, M., and Blain, S.: The biogeochemical structuring role of horizontal stirring: Lagrangian perspectives on iron delivery downstream of the Kerguelen Plateau, Biogeosciences, 12, 5567–5581, https://doi.org/10.5194/bg-12-5567-2015, 2015.
Dron, A., Rabouille, S., Claquin, P., Talec, A., Raimbault, V., and Sciandra, A.: Photoperiod length paces the temporal orchestration of cell cycle and carbon-nitrogen metabolism in Crocosphaera watsonii, Environ. Microbiol., 15, 3292–3304, https://doi.org/10.1111/1462-2920.12163, 2013.
Eppley, R. W. and Peterson, B. J.: Particulate organic matter flux and planktonic new production in the deep ocean, Nature, 282, 677–680, https://doi.org/10.1038/282677a0, 1979.
Fernández-Castro, B., Mouriño-Carballido, B., Marañón, E., Chouciño, P., Gago, J., Ramírez, T., Vidal, M., Bode, A., Blasco, D., Royer, S.-J., Estrada, M., and Simó, R.: Importance of salt fingering for new nitrogen supply in the oligotrophic ocean, Nat. Commun., 6, 8002, https://doi.org/10.1038/ncomms9002, 2015.
Fonseca-Batista, D., Dehairs, F., Riou, V., Fripiat, F., Elskens, M., Deman, F., Brion, N., Quéroue, F., Bode, M., and Auel, H.: Nitrogen fixation in the eastern Atlantic reaches similar levels in the Southern and Northern Hemisphere, J. Geophys. Res.-Ocean., 122, 587–601, 2017.
Foster, R. A. and Zehr, J. P.: Characterization of diatom-South Pacific gyrecyanobacteria symbioses on the basis of nifH, hetR and 16S rRNA sequences, Environ. Microbiol., 8, 1913–1925, https://doi.org/10.1111/j.1462-2920.2006.01068.x, 2006.
Foster, R. A., Subramaniam, A., Mahaffey, C., Carpenter, E. J., Capone, D. G., and Zehr, J. P.: Influence of the Amazon River plume on distributions of free-living and symbiotic cyanobacteria in the western tropical north Atlantic Ocean, Limnol. Oceanogr., 52, 517–532, https://doi.org/10.4319/lo.2007.52.2.0517, 2007.
Garcia, N., Raimbault, P., Gouze, E., and Sandroni, V.: Fixation de diazote et production primaire en Méditerranée occidentale, C. R. Biol., 329, 742–750, https://doi.org/10.1016/j.crvi.2006.06.006, 2006.
Gradoville , M. R., Bombar, D., Crump, B. C., Letelier, R. M., Zehr, J. P., and White, A. E.: Diversity and activity of nitrogen-fixing communities across ocean basins, Limnol. Oceanogr., 62, 1895–1909, 2017.
Großkopf, T., Mohr, W., Baustian, T., Schunck, H., Gill, D., Kuypers, M. M. M., Lavik, G., Schmitz, R. A., Wallace, D. W. R., and LaRoche, J.: Doubling of marine dinitrogen-fixation rates based on direct measurements, Nature, 488, 361–364, https://doi.org/10.1038/nature11338, 2012.
Gruber, N.: The Marine Nitrogen Cycle: Overview and Challenges, Nitrogen Mar. Environ., 1–50, https://doi.org/10.1016/B978-0-12-372522-6.00001-3, 2008.
Gruber, N. and Sarmiento, J. L.: Global patterns of marine nitrogen fixation and denitrification, Global Biogeochem. Cy., 11, 235–266, https://doi.org/10.1029/97GB00077, 1997.
Guieu, C., Bonnet, S., Petrenko, A., Menkes, C., Chavagnac, V., Desboeufs, C., Maes, C., and Moutin, T.: Iron from a submarine source impacts the productive layer of the Western Tropical South Pacific (WTSP), Scientific Reports, in review, 2018.
Hannides, C. C. S., Landry, M. R., Benitez-Nelson, C. R., Styles, R. M., Montoya, J. P., and Karl, D. M.: Export stoichiometry and migrant-mediated flux of phosphorus in the North Pacific Subtropical Gyre, Deep-Sea Res. Pt. I, 56, 73–88, https://doi.org/10.1016/j.dsr.2008.08.003, 2009.
Hewson, I., Govil, S. R., Capone, D. G., Carpenter, E. J., and Fuhrman, J. A.: Evidence of Trichodesmium viral lysis and potential significance for biogeochemical cycling in the oligotrophic ocean, Aquat. Microb. Ecol., 36, 1–8, https://doi.org/10.3354/ame036001, 2004.
Hynes, A. M., Webb, E. A., Doney, S. C., and Waterbury, J. B.: Comparison of cultured trichodesmium (cyanophyceae) with species characterized from the field, J. Phycol., 48, 196–210, https://doi.org/10.1111/j.1529-8817.2011.01096.x, 2012.
INSU/CNRS LEFE CYBER: available at: http://www.obs-vlfr.fr/proof/php/outpace/outpace.php (last access: 27 April 2018), 2017.
JGOFS: Core measurements protocols?: report of the core measurement working group, Jt. Glob. Ocean Flux Study, JGOFS repo, SCOR 1-40, 1988.
Kana, T. M., Darkangelo, C., Hunt, M. D., Oldham, J. B., Bennett, G. E., and Cornwell, J. C.: Membrane Inlet Mass Spectrometer for Rapid High-Precision Determination of N2, O2, and Ar in Environmental Water Samples, Anal. Chem., 66, 4166–4170, https://doi.org/10.1021/ac00095a009, 1994.
Kanakidou, M., Duce, R. A., Prospero, J. M., Baker, A. R., BenitezNelson, C., Dentener, F. J., Hunter, K. A., Liss, P. S., Mahowald, N., Okin, G. S., Sarin, M., Tsigaridis, K., Uematsu, M., Zamora, L. M., and Zhu, T.: Atmospheric fluxes of organic N and P to the global ocean, Global Biogeochem. Cy., 26, GB3026, https://doi.org/10.1029/2011GB004277, 2012.
Karl, D. M., Christian, J. R., Dore, J. E., Hebel, D. V., Letelier, R. M., Tupas, L. M., and Winn, C. D.: Seasonal and interannual variability in primary production and particle flux at Station ALOHA, Deep-Sea Res. Pt. II, 43, 539–568, https://doi.org/10.1016/0967-0645(96)00002-1, 1996.
Karl, D. M., Letelier, R. M., Tupas, L. M., Dore, J. E., Christian, J. R., and Hebel, D. V.: The role of nitrogen fixation in biogeochemical cycling in the subtropical North Pacific Ocean, Nature, 388, 533–538, https://doi.org/10.1038/41474, 1997.
Karl, D. M., Michaels, A. F., Bergman, B., Capone, D. G., Carpenter, E. J., Letelier, R., Lipschultz, F., Paerl, H., Sigman, D., and Stal, L.: Dinitrogen fixation in the world's oceans, Biogeochemistry, 57–58, 47–98, https://doi.org/10.1023/A:1015798105851, 2002.
Karl, D. M., Bates, N., Emerson, S., Harrisson, P. J., Jeandel, C., Liu, K. K., Marty, J. C., Michaels, A. F., Miquel, J. C., Neuer, S., Nojiri, Y., and Wong, C. S.: Temporal studies of biogeochemical processes determined from ocean time-series observations during the JGOFS era, in: Ocean Biogeochemistry: The role of the ocean carbon cycle in global change, edited by: Fasham, M. J. R., International Geosphere-Biosphere Programme Book Series, Springer-Verlag, New York, 239–267, 2003.
Karl, D. M., Church, M. J., Dore, J. E., Letelier, R. M., and Mahaffey, C.: Predictable and efficient carbon sequestration in the North Pacific Ocean supported by symbiotic nitrogen fixation, P. Natl. Acad. Sci. USA, 109, 1842–1849, https://doi.org/10.1073/pnas.1120312109, 2012.
Klawonn, I., Lavik, G., Böning, P., Marchant, H. K., Dekaezemacker, J., Mohr, W., and Ploug, H.: Simple approach for the preparation of 15−15N2-enriched water for nitrogen fixation assessments: Evaluation, application and recommendations, Front. Microbiol., 6, 769, https://doi.org/10.3389/fmicb.2015.00769, 2015.
Knapp, A. N.: The sensitivity of marine N2 fixation to dissolved inorganic nitrogen, Front. Microbiol., 3, 1–14, https://doi.org/10.3389/fmicb.2012.00374, 2012.
Knapp, A. N., Sigman, D. M., and Lipschultz, F.: N isotopic composition of dissolved organic nitrogen and nitrate at the Bermuda Atlantic Time-series study site, Global Biogeochem. Cy., 19, 1–15, https://doi.org/10.1029/2004GB002320, 2005.
Knapp, A. N., Difiore, P. J., Deutsch, C., Sigman, D. M., and Lipschultz, F.: Nitrate isotopic composition between Bermuda and Puerto Rico: implications for N2 fixation in the Atlantic Ocean, Global Biogeochem. Cy., 22, GB3014, https://doi.org/10.1029/2007GB003107, 2008.
Knapp, A. N., McCabe, K. M., Grosso, O., Leblond, N., Moutin, T., and Bonnet, S.: Distribution and rates of nitrogen fixation in the western tropical South Pacific Ocean constrained by nitrogen isotope budgets, Biogeosciences Discuss., https://doi.org/10.5194/bg-2017-564, in review, 2018.
Knauer, G. A., Redalje, D. G., Harrison, W. G. and Karl, D. M.: New production at the VERTEX time-series site, Deep-Sea Res. Pt. A, 37, 1121–1134, https://doi.org/10.1016/0198-0149(90)90054-Y, 1990.
Lam, P. J. and Bishop, J. K. B.: High biomass, low export regimes in the Southern Ocean, Deep-Sea Res. Pt. II, 54, 601–638, https://doi.org/10.1016/j.dsr2.2007.01.013, 2007.
Le Borgne, R. and Rodier, M.: Net zooplankton and the biological pump: A comparison between the oligotrophic and mesotrophic equatorial Pacific, Deep-Sea Res. Pt. II, 44, 2003–2023, https://doi.org/10.1016/S0967-0645(97)00034-9, 1997.
Longhurst, A. R. and Glen Harrison, W.: Vertical nitrogen flux from the oceanic photic zone by diel migrant zooplankton and nekton, Deep-Sea Res. Pt. A, 35, 881–889, https://doi.org/10.1016/0198-0149(88)90065-9, 1988.
Longhurst, A. R. and Williams, R. G.: Carbon flux by seasonal vertical migrant cpoepods is a small number, J. Plankton Res., 14, 1495–1509, 1992.
Longhurst, A. R., Bedo, A. W., Harrison, W. G., Head, E. J. H., Horne, E. P., Irwin, B., and Morales, C. E.: NFLUX: a test of vertical nitrogen flux by diel migrant biota, Deep-Sea Res. Pt. A, 36, 1705–1719, https://doi.org/10.1016/0198-0149(89)90067-8, 1989.
Longhurst, A. R., Bedo, A. W., Harrison, W. G., Head, E. J. H., and Sameoto, D. D.: Vertical flux of respiratory carbon by oceanic diel migrant biota, Deep-Sea Res. Pt. A, 37, 685–694, https://doi.org/10.1016/0198-0149(90)90098-G, 1990.
Louis, J., Bressac, M., Pedrotti, M. L., and Guieu, C. Dissolved inorganic nitrogen and phosphorus dynamics in seawater following an artificial Saharan dust deposition event, Frontiers in Marine Science, 2, 27, https://doi.org/10.3389/fmars.2015.00027, 2015.
Luo, Y.-W., Doney, S. C., Anderson, L. A., Benavides, M., Berman-Frank, I., Bode, A., Bonnet, S., Boström, K. H., Böttjer, D., Capone, D. G., Carpenter, E. J., Chen, Y. L., Church, M. J., Dore, J. E., Falcón, L. I., Fernández, A., Foster, R. A., Furuya, K., Gómez, F., Gundersen, K., Hynes, A. M., Karl, D. M., Kitajima, S., Langlois, R. J., LaRoche, J., Letelier, R. M., Marañón, E., McGillicuddy Jr., D. J., Moisander, P. H., Moore, C. M., Mouriño-Carballido, B., Mulholland, M. R., Needoba, J. A., Orcutt, K. M., Poulton, A. J., Rahav, E., Raimbault, P., Rees, A. P., Riemann, L., Shiozaki, T., Subramaniam, A., Tyrrell, T., Turk-Kubo, K. A., Varela, M., Villareal, T. A., Webb, E. A., White, A. E., Wu, J., and Zehr, J. P.: Database of diazotrophs in global ocean: abundance, biomass and nitrogen fixation rates, Earth Syst. Sci. Data, 4, 47–73, https://doi.org/10.5194/essd-4-47-2012, 2012.
Mahaffey, C., Williams, R. G., Wolff, G. A., Mahowald, N. M., Anderson, W., and Woodward, M.: Biogeochemical signatures of nitrogen fixation in the eastern North Atlantic, Geophys. Res. Lett., 30, 33–36, https://doi.org/10.1029/2002GL016542, 2003.
Mahaffey, C., Michaels, A. F., and Capone, D. G.: The conundrum of marine N2 fixation, Am. J. Sci., 305, 546–595, https://doi.org/10.2475/ajs.305.6-8.546, 2005.
Martínez-Pérez, C., Mohr, W., Löscher, C. R., Dekaezemacker, J., Littmann, S., Yilmaz, P., Lehnen, N., Fuchs, B. M., Lavik, G., Schmitz, R. A., LaRoche, J., and Kuypers, M. M. M.: The small unicellular diazotrophic symbiont, UCYN-A, is a key player in the marine nitrogen cycle, Nat. Microbiol., 1, 16163, https://doi.org/10.1038/nmicrobiol.2016.163, 2016.
Mohr, W., Großkopf, T., Wallace, D. W. R., and LaRoche, J.: Methodological underestimation of oceanic nitrogen fixation rates, PLoS One, 5, 1–7, https://doi.org/10.1371/journal.pone.0012583, 2010.
Moisander, P. H., Beinart, R. A., Voss, M., and Zehr, J. P.: Diversity and abundance of diazotrophic microorganisms in the South China Sea during intermonsoon, ISME J., 2, 954–967, https://doi.org/10.1038/ismej.2008.51, 2008.
Moisander, P. H., Beinart, R. A., Hewson, I., White, A. E., Johnson, K. S., Carlson, C. A., Montoya, J. P., and Zehr, J. P.: Unicellular Cyanobacterial Distributions Broaden the Oceanic N2 Fixation Domain, Science, 327, 1512–1514, https://doi.org/10.1126/science.1185468, 2010.
Montoya, J. P., Voss, M., Kahler, P., and Capone, D. G.: A Simple , High-Precision , High-Sensitivity Tracer Assay for N2 Fixation, Appl. Environ. Microbiol., 62, 986–993, 1996.
Montoya, J. P., Holl, C. M., Zehr, J. P., Hansen, A., Villareal, T. A., and Capone, D. G.: High rates of N2 fixation by unicellular diazotrophs in the oligotrophic Pacific Ocean, Nature, 430, 1027–1031, https://doi.org/10.1038/nature02824, 2004.
Monroy, P., Hernández-García, E., Rossi, V., and López, C.: Modeling the dynamical sinking of biogenic particles in oceanic flow, Nonlin. Processes Geophys., 24, 293–305, https://doi.org/10.5194/npg-24-293-2017, 2017.
Moore, C. M., Mills, M. M., Arrigo, K. R., Berman-Frank, I., Bopp, L., Boyd, P. W., Galbraith, E. D., Geider, R. J., Guieu, C., Jaccard, S. L., Jickells, T. D., La Roche, J., Lenton, T. M., Mahowald, N. M., Marañón, E., Marinov, I., Moore, J. K., Nakatsuka, T., Oschlies, A., Saito, M. A., Thingstad, T. F., Tsuda, A., and Ulloa, O.: Processes and patterns of oceanic nutrient limitation, Nat. Geosci., 6, 701–710, https://doi.org/10.1038/ngeo1765, 2013.
Mourino-Carballido, B., Graña, R., Fernández, A., Bode, A., Varela, M., Domínguez, J., Escànez, J., de Armas, D., and Marañón, E.: Importance of N2 fixation vs. nitrate eddy diffusion along a latitudinal transect in the Atlantic Ocean, Limnol. Oceanogr., 56, 999–1007, https://doi.org/10.4319/lo.2011.56.3.0999, 2011.
Moutin, T. and Bonnet, S.: OUTPACE, https://doi.org/10.17600/15000900, 2015.
Moutin, T. and Prieur, L.: Influence of anticyclonic eddies on the Biogeochemistry from the Oligotrophic to the Ultraoligotrophic Mediterranean (BOUM cruise), Biogeosciences, 9, 3827–3855, https://doi.org/10.5194/bg-9-3827-2012, 2012.
Moutin, T. and Raimbault, P.: Primary production, carbon export and nutrients availability in western and eastern Mediterranean Sea in early summer 1996 (MINOS cruise), J. Marine Syst., 33–34, 273–288, https://doi.org/10.1016/S0924-7963(02)00062-3, 2002.
Moutin, T., Van Den Broeck, N., Beker, B., Dupouy, C., Rimmelin, P., and Le Bouteiller, A.: Phosphate availability controls Trichodesmium spp. biomass in the SW Pacific Ocean, Mar. Ecol.-Prog. Ser., 297, 15–21, https://doi.org/10.3354/meps297015, 2005.
Moutin, T., Karl, D. M., Duhamel, S., Rimmelin, P., Raimbault, P., Van Mooy, B. A. S., and Claustre, H.: Phosphate availability and the ultimate control of new nitrogen input by nitrogen fixation in the tropical Pacific Ocean, Biogeosciences, 5, 95–109, https://doi.org/10.5194/bg-5-95-2008, 2008.
Moutin, T., Doglioli, A. M., de Verneil, A., and Bonnet, S.: Preface: The Oligotrophy to the UlTra-oligotrophy PACific Experiment (OUTPACE cruise, 18 February to 3 April 2015), Biogeosciences, 14, 3207–3220, https://doi.org/10.5194/bg-14-3207-2017, 2017.
Moutin, T., Wagener, T., Caffin, M., Fumenia, A., Gimenez, A., Baklouti, M., Bouruet-Aubertot, P., Pujo-Pay, M., Leblanc, K., Lefevre, D., Helias Nunige, S., Leblond, N., Grosso, O., and de Verneil, A.: Nutrient availability and the ultimate control of the biological carbon pump in the Western Tropical South Pacific Ocean, Biogeosciences Discuss., https://doi.org/10.5194/bg-2017-565, in review, 2018.
Nelson, D. M., Tréguer, P., Brzezinski, M. A., Leynaert, A., and Quéguiner, B.: Production and dissolution of biogenic silica in the ocean: Revised global estimates, comparison with regional data and relationship to biogenic sedimentation, Global Biogeochem. Cy., 9, 359–372, https://doi.org/10.1029/95GB01070, 1995.
Nodder, S. D. and Waite, A. M.: Is Southern Ocean organic carbon and biogenic silica export enhanced by iron-stimulated increases in biological production? Sediment trap results from SOIREE, Deep-Sea Res. Pt. II, 48, 2681–2701, https://doi.org/10.1016/S0967-0645(01)00014-5, 2001.
Olli, K., Wexels Riser, C., Wassmann, P., Ratkova, T., Arashkevich, E., and Pasternak, A.: Seasonal variation in vertical flux of biogenic matter in the marginal ice zone and the central Barents Sea, J. Marine Syst., 38, 189–204, https://doi.org/10.1016/S0924-7963(02)00177-X, 2002.
Painter, S. C., Patey, M. D., Forryan, A., and Torres-Valdés, S.: Evaluating the balance between vertical diffusive nitrate supply and nitrogen fixation with reference to nitrate uptake in the eastern subtropical North Atlantic Ocean, J. Geophys. Res.-Ocean., 118, 5732–5749, https://doi.org/10.1002/jgrc.20416, 2013.
Petrenko, A. A., Doglioli, A. M, Nencioli, F., Kersalé, M., Hu, Z., and d'Ovidio, F.: A review of the LATEX project: mesoscale to submesoscale processes in a coastal environment, Ocean Dynam., 67, 513–533, 2017.
Raimbault, P. and Garcia, N.: Evidence for efficient regenerated production and dinitrogen fixation in nitrogen-deficient waters of the South Pacific Ocean: impact on new and export production estimates, Biogeosciences, 5, 323–338, https://doi.org/10.5194/bg-5-323-2008, 2008
Reigstad, M., Wexels Riser, C., Wassmann, P., and Ratkova, T.: Vertical export of particulate organic carbon: Attenuation, composition and loss rates in the northern Barents Sea, Deep-Sea Res. Pt. II, 55, 2308–2319, https://doi.org/10.1016/j.dsr2.2008.05.007, 2008.
Rembauville, M., Blain, S., Armand, L., Quéguiner, B., and Salter, I.: Export fluxes in a naturally iron-fertilized area of the Southern Ocean – Part 2: Importance of diatom resting spores and faecal pellets for export, Biogeosciences, 12, 3171–3195, https://doi.org/10.5194/bg-12-3171-2015, 2015.
Rijkenberg, M. J. A., Langlois, R. J., Mills, M. M., Patey, M. D., Hill, P. G., Nielsdóttir, M. C., Compton, T. J., LaRoche, J., and Achterberg E. P.: Environmental forcing of nitrogen fixation in the Eastern Tropical and Sub-Tropical North Atlantic Ocean, PLoS ONE, 6, e28989, https://doi.org/10.1371/journal.pone.0028989, 2011.
Scharek, R., Tupas, L. M., and Karl, D. M.: Diatom fluxes to the deep sea in the oligotrophic North Pacific gyre at Station ALOHA, Mar. Ecol.-Prog. Ser., 182, 55–67, https://doi.org/10.3354/meps182055, 1999a.
Scharek, R., Latasa, M., Karl, D. M., and Bidigare, R. R.: Temporal variations in diatom abundance and downward vertical flux in the oligotrophic North Pacific gyre, Deep-Sea Res. Pt. I, 46, 1051–1075, https://doi.org/10.1016/S0967-0637(98)00102-2, 1999b.
Shiozaki, T., Kodama, T., and Furuya, K.: Large-scale impact of the island mass effect through nitrogen fixation in the western South Pacific Ocean, Geophys. Res. Lett., 41, 2907–2913, https://doi.org/10.1002/2014GL059835, 2014.
Shiozaki, T., Nagata, T., Ijichi, M., and Furuya, K.: Nitrogen fixation and the diazotroph community in the temperate coastal region of the northwestern North Pacific, Biogeosciences, 12, 4751–4764, https://doi.org/10.5194/bg-12-4751-2015, 2015.
Short, S. M., Jenkins, B. D., and Zehr, J. P.: The spatial and temporal distribution of two diazotrophic bacteria in the Chesapeake Bay, Appl. Environ. Microb., 70, 2186–2192, https://doi.org/10.1128/AEM.70.4.2186-2192.2004, 2004.
Spungin, D., Belkin, N., Foster, R., Stenegren, M., Caputo, A., Pujo-Pay, M., Leblond, N., Dupouy, C., Bonnet, S., and Berman-Frank, I.: Programmed cell death in diazotrophs and the fate of organic matter in the Western Tropical South Pacific Ocean during the OUTPACE cruise, Biogeosciences Discuss., https://doi.org/10.5194/bg-2018-3, in review, 2018.
Stenegren, M., Caputo, A., Berg, C., Bonnet, S., and Foster, R. A.: Distribution and drivers of symbiotic and free-living diazotrophic cyanobacteria in the western tropical South Pacific, Biogeosciences, 15, 1559–1578, https://doi.org/10.5194/bg-15-1559-2018, 2018.
Stukel, M. R., Ohman, M. D., Benitez-Nelson, C. R., and Landry, M. R.: Contributions of mesozooplankton to vertical carbon export in a coastal upwelling system, Mar. Ecol.-Prog. Ser., 491, 47–65, https://doi.org/10.3354/meps10453, 2013.
Stukel, M. R., Benitez-Nelson, C. R., Decima, M., Taylor, A. G., Buchwald, C., and Landry, M. R.: The biological pump in the Costa Rica Dome: An open-ocean upwelling system with high new production and low export, J. Plankton Res., 38, 348–365, https://doi.org/10.1093/plankt/fbv097, 2015.
Subramaniam, A., Yager, P. L., Carpenter, E. J., Mahaffey, C., Björkman, K. M., Cooley, S., Kustka, A. B., Montoya, J. P., Sanudo-Wilhelmy, S. A., Shipe, R., and Capone, D. G.: Amazon River enhances diazotrophy and carbon sequestration in the tropical North Atlantic Ocean, P. Natl. Acad. Sci. USA, 105, 10460–10465, https://doi.org/10.1073/pnas.0710279105, 2008.
Sun, J. and Liu, D.: Geometric models for calculating cell biovolume and surface area for phytoplankton, J. Plankton Res., 25, 1331–1346, https://doi.org/10.1093/plankt/fbg096, 2003.
Thomalla, S., Turnewitsch, R., Lucas, M., and Poulton, A.: Particulate organic carbon export from the North and South Atlantic gyres: The 234Th/238U disequilibrium approach, Deep-Sea Res. Pt. II, 53, 1629–1648, https://doi.org/10.1016/j.dsr2.2006.05.018, 2006.
Toggweiler, J. R.: Is the downward dissolved organic matter (DOM) flux important in carbon transport?, Productivity in the Ocean: Present and Past, edited by: Berger, W. H., Smetacek, V. S., and Wefer, G., Wiley, New York, 65–83, 1989.
Van Wambeke, F., Gimenez, A., Duhamel, S., Dupouy, C., Lefevre, D., Pujo-Pay, M., and Moutin, T.: Dynamics of phytoplankton and heterotrophic bacterioplankton in the western tropical South Pacific Ocean along a gradient of diversity and activity of diazotrophs, Biogeosciences Discuss., https://doi.org/10.5194/bg-2017-556, in review, 2018.
Verity, P. G., Robertson, C. Y., Tronzo, C. R., Andrews, M. G., Nelson, J. R., and Sieracki, M. E.: Relationships between cell volume and the carbon and nitrogen content of marine photosynthetic nanoplankton, Limnol. Oceanogr., 37, 1434–1446, https://doi.org/10.4319/lo.1992.37.7.1434, 1992.
Villareal, T. A.: Division cycles in the nitrogen-fixing rhizosolenia (Baciliariophyceae)-richelia (nostocaceae) symbiosis, Br. Phycol. J., 24, 357–365, https://doi.org/10.1080/00071618900650371, 1989.
Vinogradov, M. E.: Vertical distribution of the oceanic zooplankton, Moscow: Nauka, 318 pp., 1968 (in Russian), Engl. transl. by Israel Progr. Scient. Transl., Jerusalem, 339 pp., 1970.
Vong, R. J., Vong, I. J., Vickers, D., and Covert, D. S.: Size-dependent aerosol deposition velocities during BEARPEX'07, Atmos. Chem. Phys., 10, 5749–5758, https://doi.org/10.5194/acp-10-5749-2010, 2010.
Walsby, A. E.: The gas vesicles and buoyancy of Trichodesmium, in: Marine pelagic cyanobacteria: Trichodesmium and other diazotrophs, Springer, the Netherlands, 141–161, 1992.
Wassman, F.: Relationships between primary and export production in the boreal coastal zone of the North Atlantic, Limnol. Oceanogr., 35, 464–471, 1990.
Weiss, R. F.: The solubility of nitrogen, oxygen and argon in water and seawater, Deep-Sea Res., 17, 721–735, 1970.
Wexels Riser, C., Wassmann, P., Reigstad, M. and Seuthe, L.: Vertical flux regulation by zooplankton in the northern Barents Sea during Arctic spring, Deep-Sea Res. Pt. II, 55, 2320–2329, https://doi.org/10.1016/j.dsr2.2008.05.006, 2008.
White, A. E., Foster, R. A., Benitez-Nelson, C. R., Masqué, P., Verdeny, E., Popp, B. N., Arthur, K. E., and Prahl, F. G.: Nitrogen fixation in the Gulf of California and the Eastern Tropical North Pacific, Prog. Oceanogr., 109, 1–17, https://doi.org/10.1016/j.pocean.2012.09.002, 2012.
Zhang, X. and Dam, H. G.: Downward export of carbon by die1 migrant mesozooplankton in the central equatorial Pacific, 44, 2191–2202, 1998.