the Creative Commons Attribution 4.0 License.
the Creative Commons Attribution 4.0 License.
 | 30 May 2018
Effects of elevated CO2 and temperature on phytoplankton community biomass, species composition and photosynthesis during an experimentally induced autumn bloom in the western English Channel
Matthew Keys
Gavin Tilstone
Helen S. Findlay
Claire E. Widdicombe
Tracy Lawson
The combined effects of elevated pCO2 and temperature were investigated during an experimentally induced autumn phytoplankton bloom in vitro sampled from the western English Channel (WEC). A full factorial 36-day microcosm experiment was conducted under year 2100 predicted temperature (+4.5 ∘C) and pCO2 levels (800 µatm). Over the experimental period total phytoplankton biomass was significantly influenced by elevated pCO2. At the end of the experiment, biomass increased 6.5-fold under elevated pCO2 and 4.6-fold under elevated temperature relative to the ambient control. By contrast, the combined influence of elevated pCO2 and temperature had little effect on biomass relative to the control. Throughout the experiment in all treatments and in the control, the phytoplankton community structure shifted from dinoflagellates to nanophytoplankton . At the end of the experiment, under elevated pCO2 nanophytoplankton contributed 90 % of community biomass and was dominated by Phaeocystis spp. Under elevated temperature, nanophytoplankton comprised 85 % of the community biomass and was dominated by smaller nanoflagellates. In the control, larger nanoflagellates dominated whilst the smallest nanophytoplankton contribution was observed under combined elevated pCO2 and temperature (∼ 40 %). Under elevated pCO2, temperature and in the control there was a significant decrease in dinoflagellate biomass. Under the combined effects of elevated pCO2 and temperature, dinoflagellate biomass increased and was dominated by the harmful algal bloom (HAB) species, Prorocentrum cordatum. At the end of the experiment, chlorophyll a (Chl a) normalised maximum photosynthetic rates () increased > 6-fold under elevated pCO2 and > 3-fold under elevated temperature while no effect on was observed when pCO2 and temperature were elevated simultaneously. The results suggest that future increases in temperature and pCO2 simultaneously do not appear to influence coastal phytoplankton productivity but significantly influence community composition during autumn in the WEC.
- Article
(5421 KB) - Full-text XML
-
Supplement
(532 KB) - BibTeX
- EndNote


Oceanic concentration of CO2 has increased by ∼ 42 % over pre-industrial levels, with a continuing annual increase of ∼ 0.4 %. The current CO2 level has reached ∼ 400 µatm and has been predicted to rise to > 700 µatm by the end of this century (IPCC, 2013), with estimates exceeding 1000 µatm (Matear and Lenton, 2018; Raupach et al., 2007; Raven et al., 2005). With increasing atmospheric CO2, the oceans continue to absorb CO2 from the atmosphere, which results in a shift in oceanic carbonate chemistry resulting in a decrease in seawater pH, or ocean acidification (OA). The projected increase in atmospheric CO2 and corresponding increase in ocean uptake is predicted to result in a decrease in global mean surface seawater pH of 0.3 units below the present value of 8.1 to 7.8 (Wolf-Gladrow et al., 1999). Under this scenario, the shift in dissolved inorganic carbon (DIC) equilibria has wide ranging implications for phytoplankton photosynthetic carbon fixation rates and growth (Riebesell, 2004).
Concurrent with OA, elevated atmospheric CO2 and other climate active gases have warmed the planet by ∼ 0.6 ∘C over the past 100 years (IPCC, 2014). Atmospheric temperature has been predicted to rise by a further 1.8 to 4 ∘C by the end of this century (Alley et al., 2007). Phytoplankton metabolic activity may be accelerated by increased temperature (Eppley, 1972), which can vary depending on the phytoplankton species and their physiological requirements (Beardall et al., 2009; Boyd et al., 2013). Long-term data sets already suggest that ongoing changes in coastal phytoplankton communities are likely due to climate shifts and other anthropogenic influences (Edwards et al., 2006; Smetacek and Cloern, 2008; Widdicombe et al., 2010). The response to OA and temperature can potentially alter the community composition, community biomass and photophysiology. Understanding how these two factors may interact, synergistically or antagonistically, is critical to our understanding and for predicting future primary productivity (Boyd and Doney, 2002; Dunne, 2014).
Laboratory studies of phytoplankton species in culture and studies on natural populations in the field have shown that most species exhibit sensitivity, in terms of growth and photosynthetic rates, to elevated pCO2 and temperature individually. To date, only a few studies have investigated the interactive effects of these two parameters on natural populations (e.g. Coello-Camba et al., 2014; Feng et al., 2009; Gao et al., 2017; Hare et al., 2007). Most laboratory studies demonstrate variable results with species-specific responses. In the diatom Thalassiosira weissflogii, for example, pCO2 elevated to 1000 µatm and +5 ∘C temperature synergistically enhanced growth, while the same conditions resulted in a reduction in growth for the diatom Dactyliosolen fragilissimus (Taucher et al., 2015). Although there have been fewer studies on dinoflagellates, variable responses have also been reported (Errera et al., 2014; Fu et al., 2008). In natural populations, elevated pCO2 has stimulated the growth of pico- and nanophytoplankton (Boras et al., 2016; Engel et al., 2008) while increased temperature has reduced their biomass (Moustaka-Gouni et al., 2016; Peter and Sommer, 2012). In a recent field study on natural phytoplankton communities, elevated temperature (+3 ∘C above ambient) enhanced community biomass but the combined influence of elevated temperature and pCO2 reduced the biomass (Gao et al., 2017).
Phytoplankton species composition, abundance and biomass has been measured since 1992 at the time series station L4 in the western English Channel (WEC) to evaluate how global changes could drive future shifts in phytoplankton community structure and carbon biogeochemistry. At this station, sea surface temperature and pCO2 reach maximum values during late summer and start to decline in autumn. During October, mean seawater temperatures at 10 m decrease from 15.39 ∘C (±0.49 SD) to 14.37 ∘C (± 0.62 SD). Following a period of CO2 oversaturation in late summer, pCO2 returns to near-equilibrium at station L4 in October when mean pCO2 values decrease from 455.32 µatm (± 63.92 SD) to 404.06 µatm (± 38.55 SD) (Kitidis et al., 2012).
From a biological perspective, the autumn period at station L4 is characterised by the decline of the late summer diatom and dinoflagellate blooms (Widdicombe et al., 2010) when their biomass approaches values close to the time series minima (diatom biomass range: 6.01 (± 6.88 SD)–2.85 (± 3.28 SD) mg C m−3; dinoflagellate biomass range: 1.75 (± 3.28 SD)–0.66 (± 1.08 SD) mg C m−3). Typically, over this period nanophytoplankton becomes numerically dominant and biomass ranges from 20.94 (± 33.25 SD) to 9.38 (± 3.31 SD) mg C m−3, though there is considerable variability in this biomass.
Based on the existing literature, the working hypotheses of this study are that (1) community biomass will increase differentially under individual treatments of elevated temperature and pCO2, (2) elevated pCO2 will lead to taxonomic shifts due to differences in species-specific CO2 concentrating mechanisms and/or RuBisCO specificity, (3) photosynthetic carbon fixation rates will increase differentially under individual treatments of elevated temperature and pCO2, (4) elevated temperature will lead to taxonomic shifts due to species-specific thermal optima, and (5) temperature and pCO2 elevated simultaneously will have synergistic effects.
The objective of the study was therefore to investigate the combined effects of elevated pCO2 and temperature on phytoplankton community structure, biomass and photosynthetic carbon fixation rates during the autumn transition from diatoms and dinoflagellates to nanophytoplankton at station L4 in the WEC.
2.1 Perturbation experiment, sampling and experimental setup
Experimental seawater containing a natural phytoplankton community was sampled at station L4 (50∘15′ N, 4∘13′ W) on 7 October 2015 from 10 m depth (40 L). The experimental seawater was gently pre-filtered through a 200 µm Nitex mesh to remove mesozooplankton grazers, into two 20 L acid-cleaned carboys. While grazers play an important role in regulating phytoplankton community structure (e.g. Strom, 2002), our experimental goals considered only the effects of elevated temperature and pCO2, though the mesh size used does not remove microzooplankton. In addition, 320 L of seawater was collected into sixteen 20 L acid-cleaned carboys from the same depth for use as experimental media. Immediately upon return to the laboratory the media seawater was filtered through an in-line 0.2 and 0.1 µm filter (Acropak™, Pall Life Sciences) and then stored in the dark at 14 ∘C until use. The experimental seawater was gently and thoroughly mixed and transferred in equal parts from each carboy (to ensure homogeneity) to sixteen 2.5 L borosilicate incubation bottles (four sets of four replicates). The remaining experimental seawater was sampled for initial (T0) concentrations of nutrients, Chl a, total alkalinity, dissolved inorganic carbon, particulate organic carbon (POC) and nitrogen (PON) and was also used to characterise the starting experimental phytoplankton community. The incubation bottles were placed in an outdoor simulated in situ incubation culture system and each set of replicates was linked to one of four 22 L reservoirs filled with the filtered seawater media. Neutral density spectrally corrected blue filters (Lee Filter no. 061) were placed between polycarbonate sheets and mounted to the top, sides and ends of the incubation system to provide ∼ 50 % irradiance, approximating PAR measured at 10 m depth at station L4 on the day of sampling prior to starting experimental incubations (see Fig. S1 in the Supplement for time course of PAR levels during the experiment). The media was aerated with CO2 free air and 5 % CO2 in air precisely mixed using a mass flow controller (Bronkhorst UK Limited) and used for the microcosm dilutions as per the following experimental design: (1) control (390 µatm pCO2, 14.5 ∘C matching station L4 in situ values), (2) high temperature (390 µatm pCO2, 18.5 ∘C), (3) high pCO2 (800 µatm pCO2, 14.5 ∘C) and (4) combination (800 µatm pCO2, 18.5 ∘C).
Initial nutrient concentrations (0.24 µM nitrate + nitrite, 0.086 µM phosphate and 2.14 µM silicate on 7 October 2015) were amended to 8 µM nitrate + nitrite and 0.5 µM phosphate. Pulses of nutrient inputs frequently occur at station L4 from August to December following heavy rainfall events and subsequent riverine inputs to the system (e.g. Barnes et al., 2015). Our nutrient amendments simulated these in situ conditions and were held constant to maintain phytoplankton growth. Previous pilot studies highlighted that, if these concentrations are not maintained, the phytoplankton population crashes (Keys, 2017). As the phytoplankton community was sampled over the transitional phase from diatoms and dinoflagellates to nanophytoplankton, the in situ silicate concentration was maintained to reproduce the silicate concentrations typical of this time of year (Smyth et al., 2010). Nutrient concentrations were measured at time point T0 only.
Media transfer and sample acquisition was driven by peristaltic pumps. Following 48 h acclimation in batch culture, semi-continuous daily dilution rates were maintained at between 10 and 13 % of the incubation bottle volume throughout the experiment. CO2-enriched seawater was added to the high-CO2 treatment replicates every 24 h, acclimating the natural phytoplankton population to increments of elevated pCO2 from ambient to ∼ 800 µatm over 8 days followed by maintenance at ∼ 800 µatm as per the method described by Schulz et al. (2009). Adding CO2-enriched seawater is the preferred protocol, since some phytoplankton species are inhibited by the mechanical effects of direct bubbling (Riebesell et al., 2010; Shi et al., 2009), which causes a reduction in growth rates and the formation of aggregates (Love et al., 2016). pH was monitored daily to adjust the pCO2 of the experimental media (+/−) prior to dilutions to maintain target pCO2 levels in the incubation bottles. The seasonality in pH and total alkalinity (TA) are fairly stable at station L4 with high pH and low dissolved inorganic carbon during early summer and low pH, high DIC throughout autumn and winter (Kitidis et al., 2012). By maintaining the carbonate chemistry over the duration of the experiment, we aimed to simulate natural events at the study site.
To provide sufficient time for changes in the phytoplankton community to occur and to achieve an ecologically relevant data set, the incubation period was extended well beyond short-term acclimation. Previous pilot studies using the same experimental protocols highlighted that, after ∼ 20 days of incubation, significant changes in community structure and biomass were observed (Keys, 2017). These results were used to inform a more relevant incubation period of 30+ days.
2.2 Analytical methods
2.2.1 Chlorophyll a
Chl a was measured in each incubation bottle. Triplicate samples of 100 mL from each replicate were filtered onto 25 mm GF/F filters (nominal pore size 0.7 µm), extracted in 90 % acetone overnight at −20 ∘C and Chl a concentration was measured on a Turner Trilogy™ fluorometer using the non-acidified method of Welschmeyer (1994). The fluorometer was calibrated against a stock Chl a standard (Anacystis nidulans, Sigma Aldrich, UK), the concentration of which was determined with a PerkinElmer™ spectrophotometer at wavelengths 663.89 and 750.11 nm. Samples for Chl a analysis were taken every 2–3 days.
2.2.2 Carbonate system
Samples of 70 mL for total alkalinity (TA) and dissolved inorganic carbon analysis were collected from each experimental replicate, stored in amber borosilicate bottles with no head space and fixed with 40 µL of supersaturated Hg2Cl2 solution for later determination (Apollo SciTech™ Alkalinity Titrator AS-ALK2; Apollo SciTech™ AS-C3 DIC analyser, with analytical precision of 3 µmol kg−1). Duplicate measurements were made for TA and triplicate measurements for DIC. Carbonate system parameter values for media and treatment samples were calculated from TA and DIC measurements using the programme CO2SYS (Pierrot et al., 2006) with dissociation constants of carbonic acid of Mehrbach et al. (1973) refitted by Dickson and Millero (1987). Samples for TA and DIC were taken for analysis every 2–3 days throughout the experiment.
2.2.3 Phytoplankton community analysis
Phytoplankton community analysis was performed by flow cytometry (Becton Dickinson Accuri™ C6) for the 0.2 to 18 µm size fraction following Tarran et al. (2006) and inverted light microscopy was used to enumerate cells > 18 µm (BS EN 15204, 2006). For flow cytometry, 2 mL samples fixed with glutaraldehyde to a final concentration of 2 % were flash frozen in liquid nitrogen and stored at −80 ∘C for subsequent analysis. Phytoplankton data acquisition was triggered on both chlorophyll fluorescence and forward light scatter (FSC) using prior knowledge of the position of Synechococcus sp. to set the lower limit of analysis. Density plots of FSC vs. Chl fluorescence, phycoerythrin fluorescence vs. Chl fluorescence and side scatter vs. Chl fluorescence were used to discriminate between Synechococcus sp., picoeukaryote phytoplankton (approx. 0.5–3 µm), coccolithophores, cryptophytes, Phaeocystis sp. single cells and nanophytoplankton (eukaryotes > 3 µm, excluding the coccolithophores, cryptophytes and Phaeocystis sp. single cells; for further information on flow cytometer calibration for phytoplankton size measurements, see the Supplement). For inverted light microscopy, 140 mL samples were fixed with 2 % (final concentration) acid Lugol's iodine solution and analysed by inverted light microscopy (Olympus™ IMT-2) using the Utermöhl counting technique (Utermöhl, 1958; Widdicombe et al., 2010). Phytoplankton community samples were taken at T0, T10, T17, T24 and T36.
2.2.4 Phytoplankton community biomass
The smaller size fraction identified and enumerated through flow cytometry; picophytoplankton, nanophytoplankton, Synechococcus, coccolithophores and cryptophytes were converted to carbon biomass (mg C m−3) using a spherical model to calculate mean cell volume,
and a carbon conversion factor of 0.22 pg C µm−3 (Booth, 1988). A conversion factor of 0.285 pg C µm−3 was used for coccolithophores (Tarran et al., 2006) and cell a volume of 113 µm3 and carbon cell−1 value of 18 pg applied for Phaeocystis spp. (Widdicombe et al., 2010). Phaeocystis spp. were identified and enumerated by flow cytometry separately to the nanophytoplankton class due to high observed abundance in the high-pCO2 treatment. Mean cell measurements of individual species/taxa were used to calculate cell bio-volume for the 18 µm + size fraction according to Kovala and Larrance (1966) and converted to biomass according to the equations of Menden-Deuer and Lessard (2000).
2.2.5 POC and PON
Samples for particulate organic carbon (POC) and particulate organic nitrogen (PON) were taken at T0, T15 and T36. Samples of 150 mL were taken from each replicate and filtered under gentle vacuum pressure onto pre-ashed 25 mm glass fibre filters (GF/F, nominal pore size 0.7 µm). Filters were stored in acid-washed petri-slides at −20 ∘C until further processing. Sample analysis was conducted using a Thermoquest elemental analyser (Flash 1112). Acetanilide standards (Sigma Aldrich, UK) were used to calibrate measurements of carbon and nitrogen and also used during the analysis to account for possible drift in measured concentrations.
2.2.6 Chl fluorescence-based photophysiology
Photosystem II (PSII) variable chlorophyll fluorescence parameters were measured using a fast repetition rate fluorometer (FRRf) (FastOcean sensor in combination with an Act2Run laboratory system, Chelsea Technologies, West Molesey, UK). The excitation wavelengths of the FRRf's light-emitting diodes (LEDs) were 450, 530 and 624 nm. The instrument was used in single turnover mode with a saturation phase comprising 100 flashlets on a 2 µs pitch and a relaxation phase comprising 40 flashlets on a 50 µs pitch. Measurements were conducted in a temperature-controlled chamber at 15 ∘C. The minimum (Fo) and maximum (Fm) Chl fluorescence were estimated according to Kolber et al. (1998). Maximum quantum yields of PSII were calculated as
PSII electron flux was calculated on a volume basis (JVPSII; ) using the absorption algorithm (Oxborough et al., 2012) following spectral correction by normalising the FRRf LED emission to the white spectra using FastPRO 8 software. This step required inputting the experimental phytoplankton community fluorescence excitation spectra values (FES). Since we did not measure the FES of our experimental samples, we used mean literature values for each phytoplankton group calculated proportionally (based on percentage contribution to total estimated biomass per phytoplankton group) as representative values for our experimental samples. The JVPSII rates were converted to chlorophyll-specific carbon fixation rates (mg C (mg Chl a)−1 ), calculated as follows:
where φE : C is the electron requirement for carbon uptake (molecule CO2 (mol electrons)−1), MWC is the molecular weight of carbon and Chl a is the Chl a measurement specific to each sample. Chl a-specific JVPSII-based photosynthesis–irradiance (PE) curves were conducted in replicate batches between 10:00 and 16:00 to account for variability over the photoperiod at between 8 and 14 irradiance intensities. The maximum intensity applied was adjusted according to ambient natural irradiance on the day of sampling. Maximum photosynthetic rates of carbon fixation (), the light-limited slope (αB) and the light saturation point of photosynthesis (Ek) were estimated by fitting the data to the model of Webb et al. (1974):
Due to instrument failure during the experiment, samples for FRRf fluorescence-based light curves were taken at T36 only.
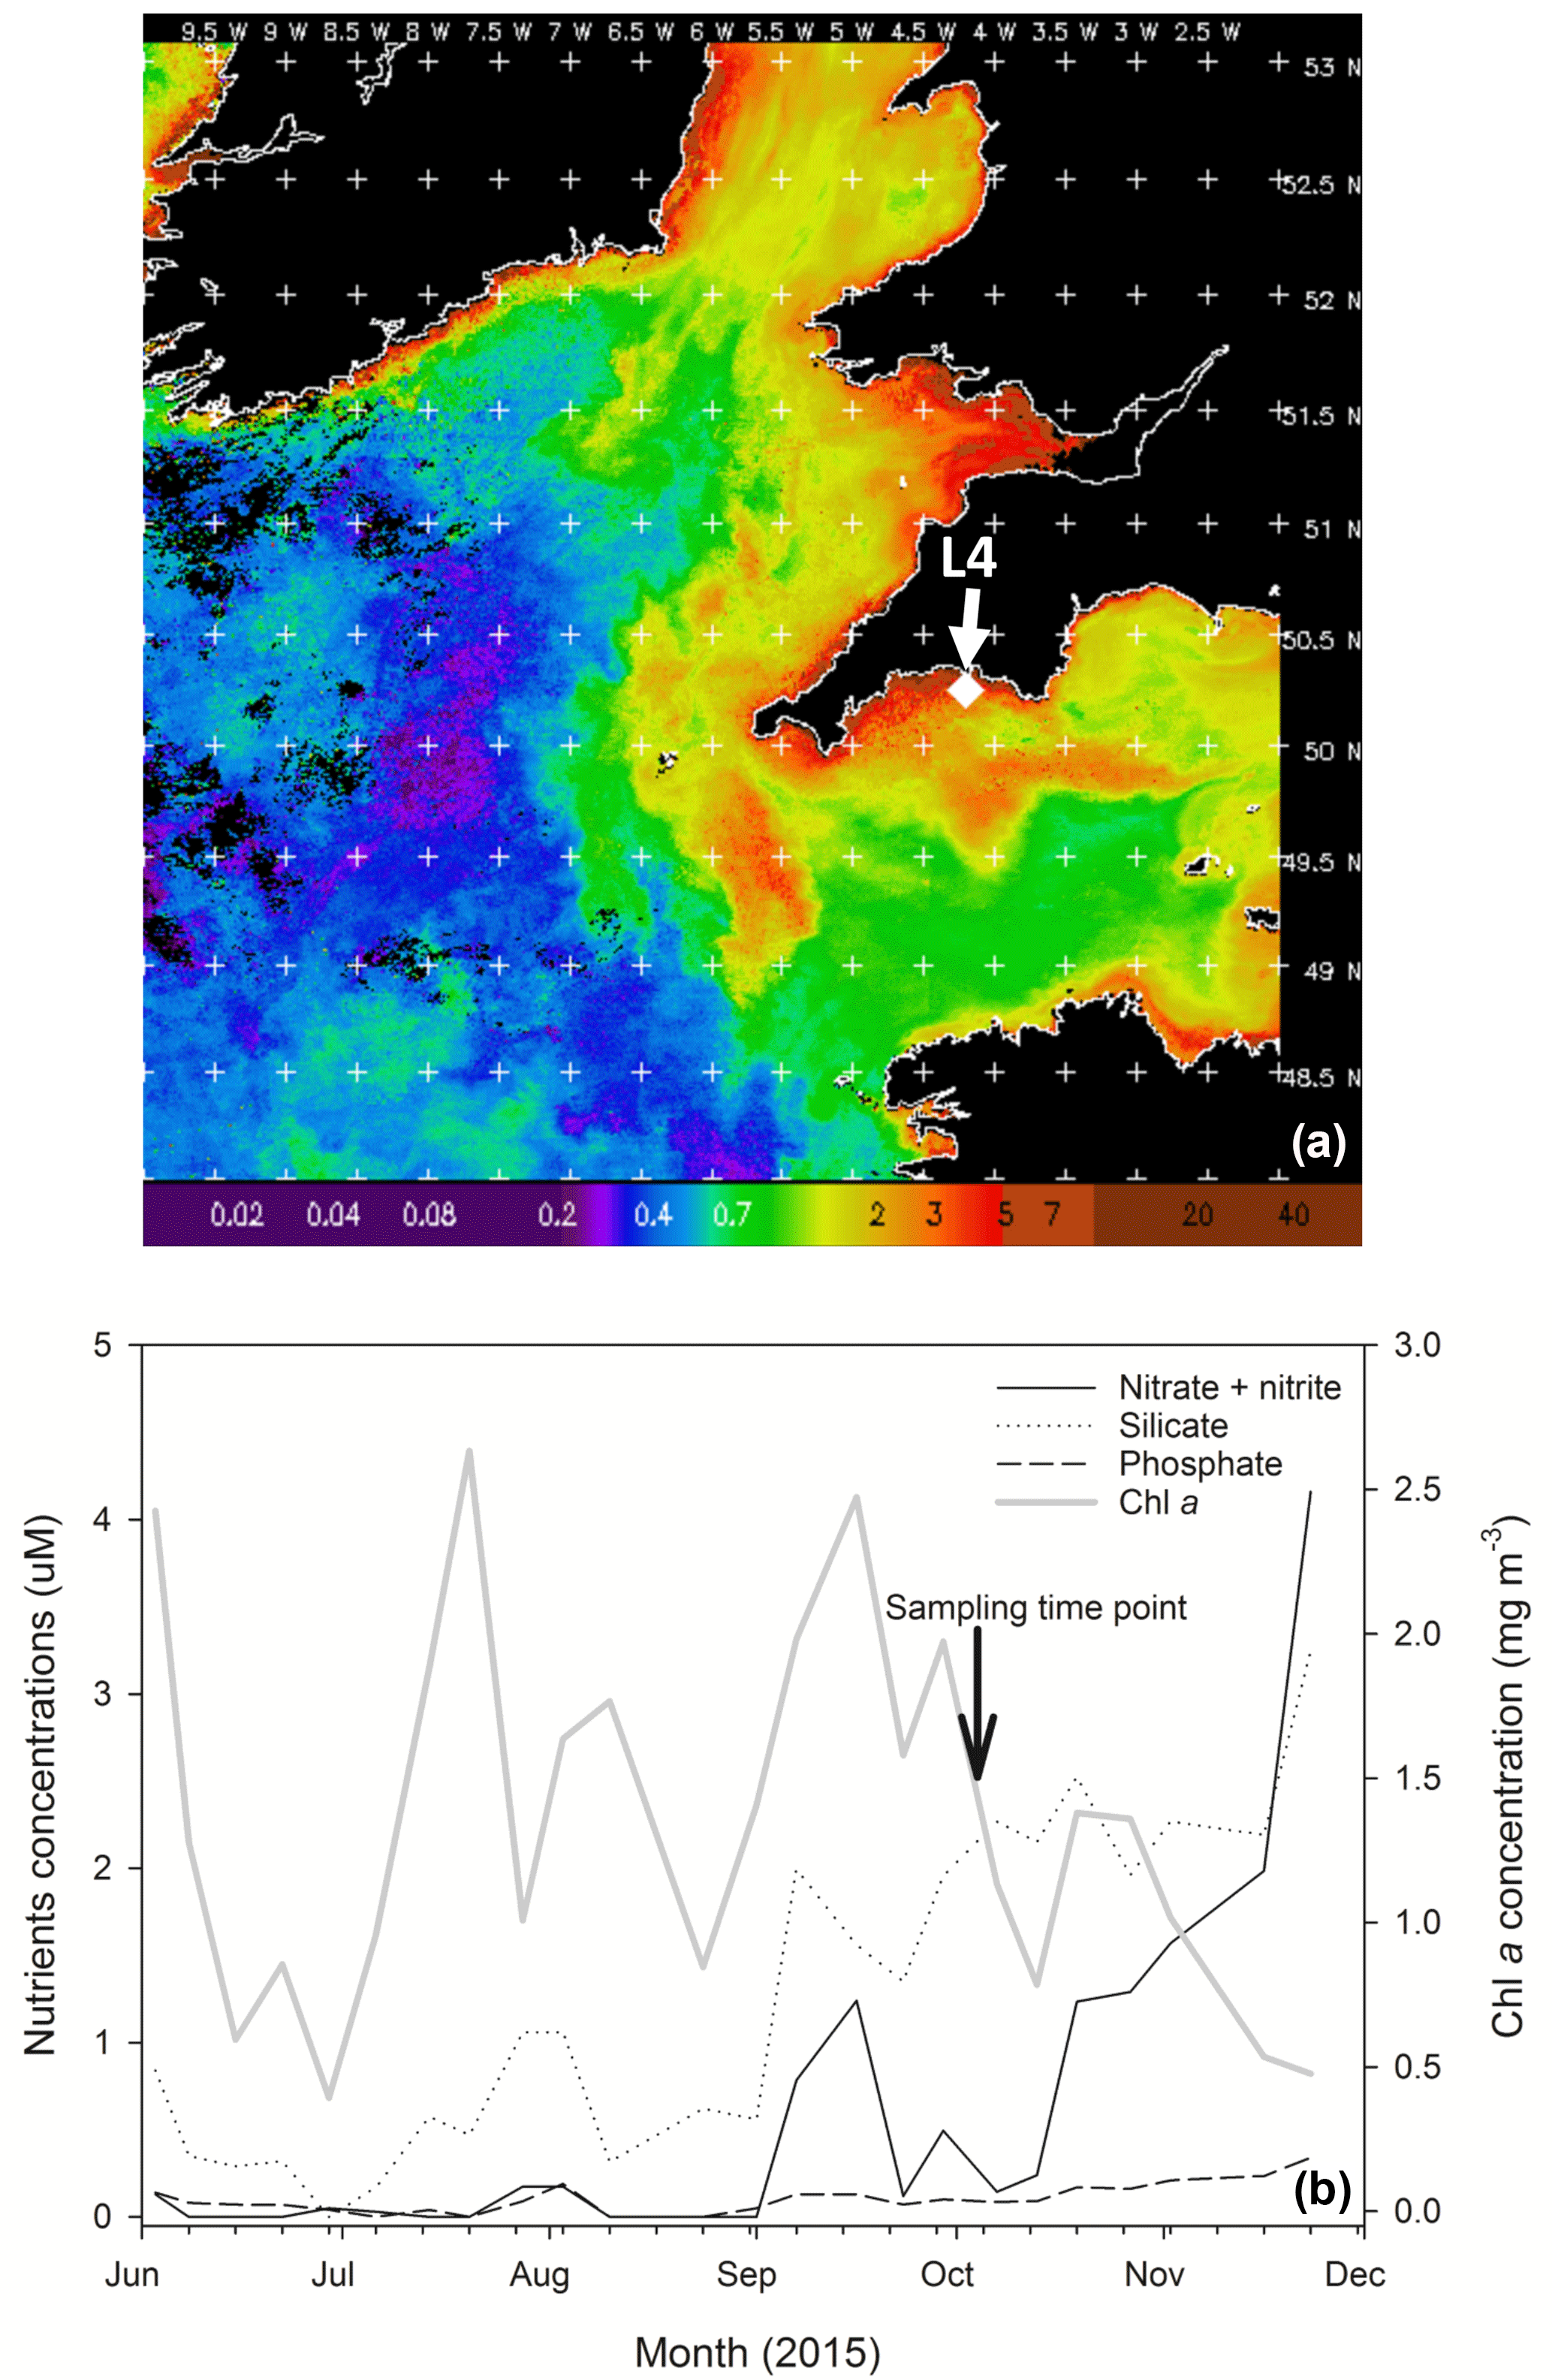
Figure 1(a) MODIS weekly composite Chl a image of the western English Channel covering the period 30 September–6 October 2015 (coincident with the week of phytoplankton community sampling for the present study); processing courtesy of NEODAAS. The position of coastal station L4 is marked with a white diamond. (b) Profiles of weekly nutrient and Chl a concentrations from station L4 at a depth of 10 m over the second half of 2015 in the months prior to phytoplankton community sampling (indicated by the black arrow and text).
2.3 Statistical analysis
To test for effects of temperature, pCO2 and possible time dependence of the measured response variables (Chl a, total biomass, POC, PON, photosynthetic parameters and biomass of individual species), generalised linear mixed models with the factors pCO2, temperature and time (and all interactions) were applied to the data between T0 and T36. Analyses were conducted using the lme4 package in R (R Core Team, 2016).
Chl a concentration in the WEC at station L4 from 30 September to 6 October 2015 (when sea water was collected for the experiment) varied between 0.02 and 5 mg m−3, with a mean concentration of ∼ 1.6 mg m−3 (Fig. 1a). Over the period leading up to phytoplankton community sampling, increasing nitrate and silicate concentrations coincided with a Chl a peak on 23 September (Fig. 1b). Routine net trawl (20 µm) sample observations indicated a phytoplankton community dominated by the diatoms Leptocylindrus danicus and L. minimus with a lower presence of the dinoflagellates Prorocentrum cordatum, Heterocapsa spp. and Oxytoxum gracile. Following decreasing nitrate concentrations, there was a P. cordatum bloom on 29 September, during the week before the experiment started (data not shown).
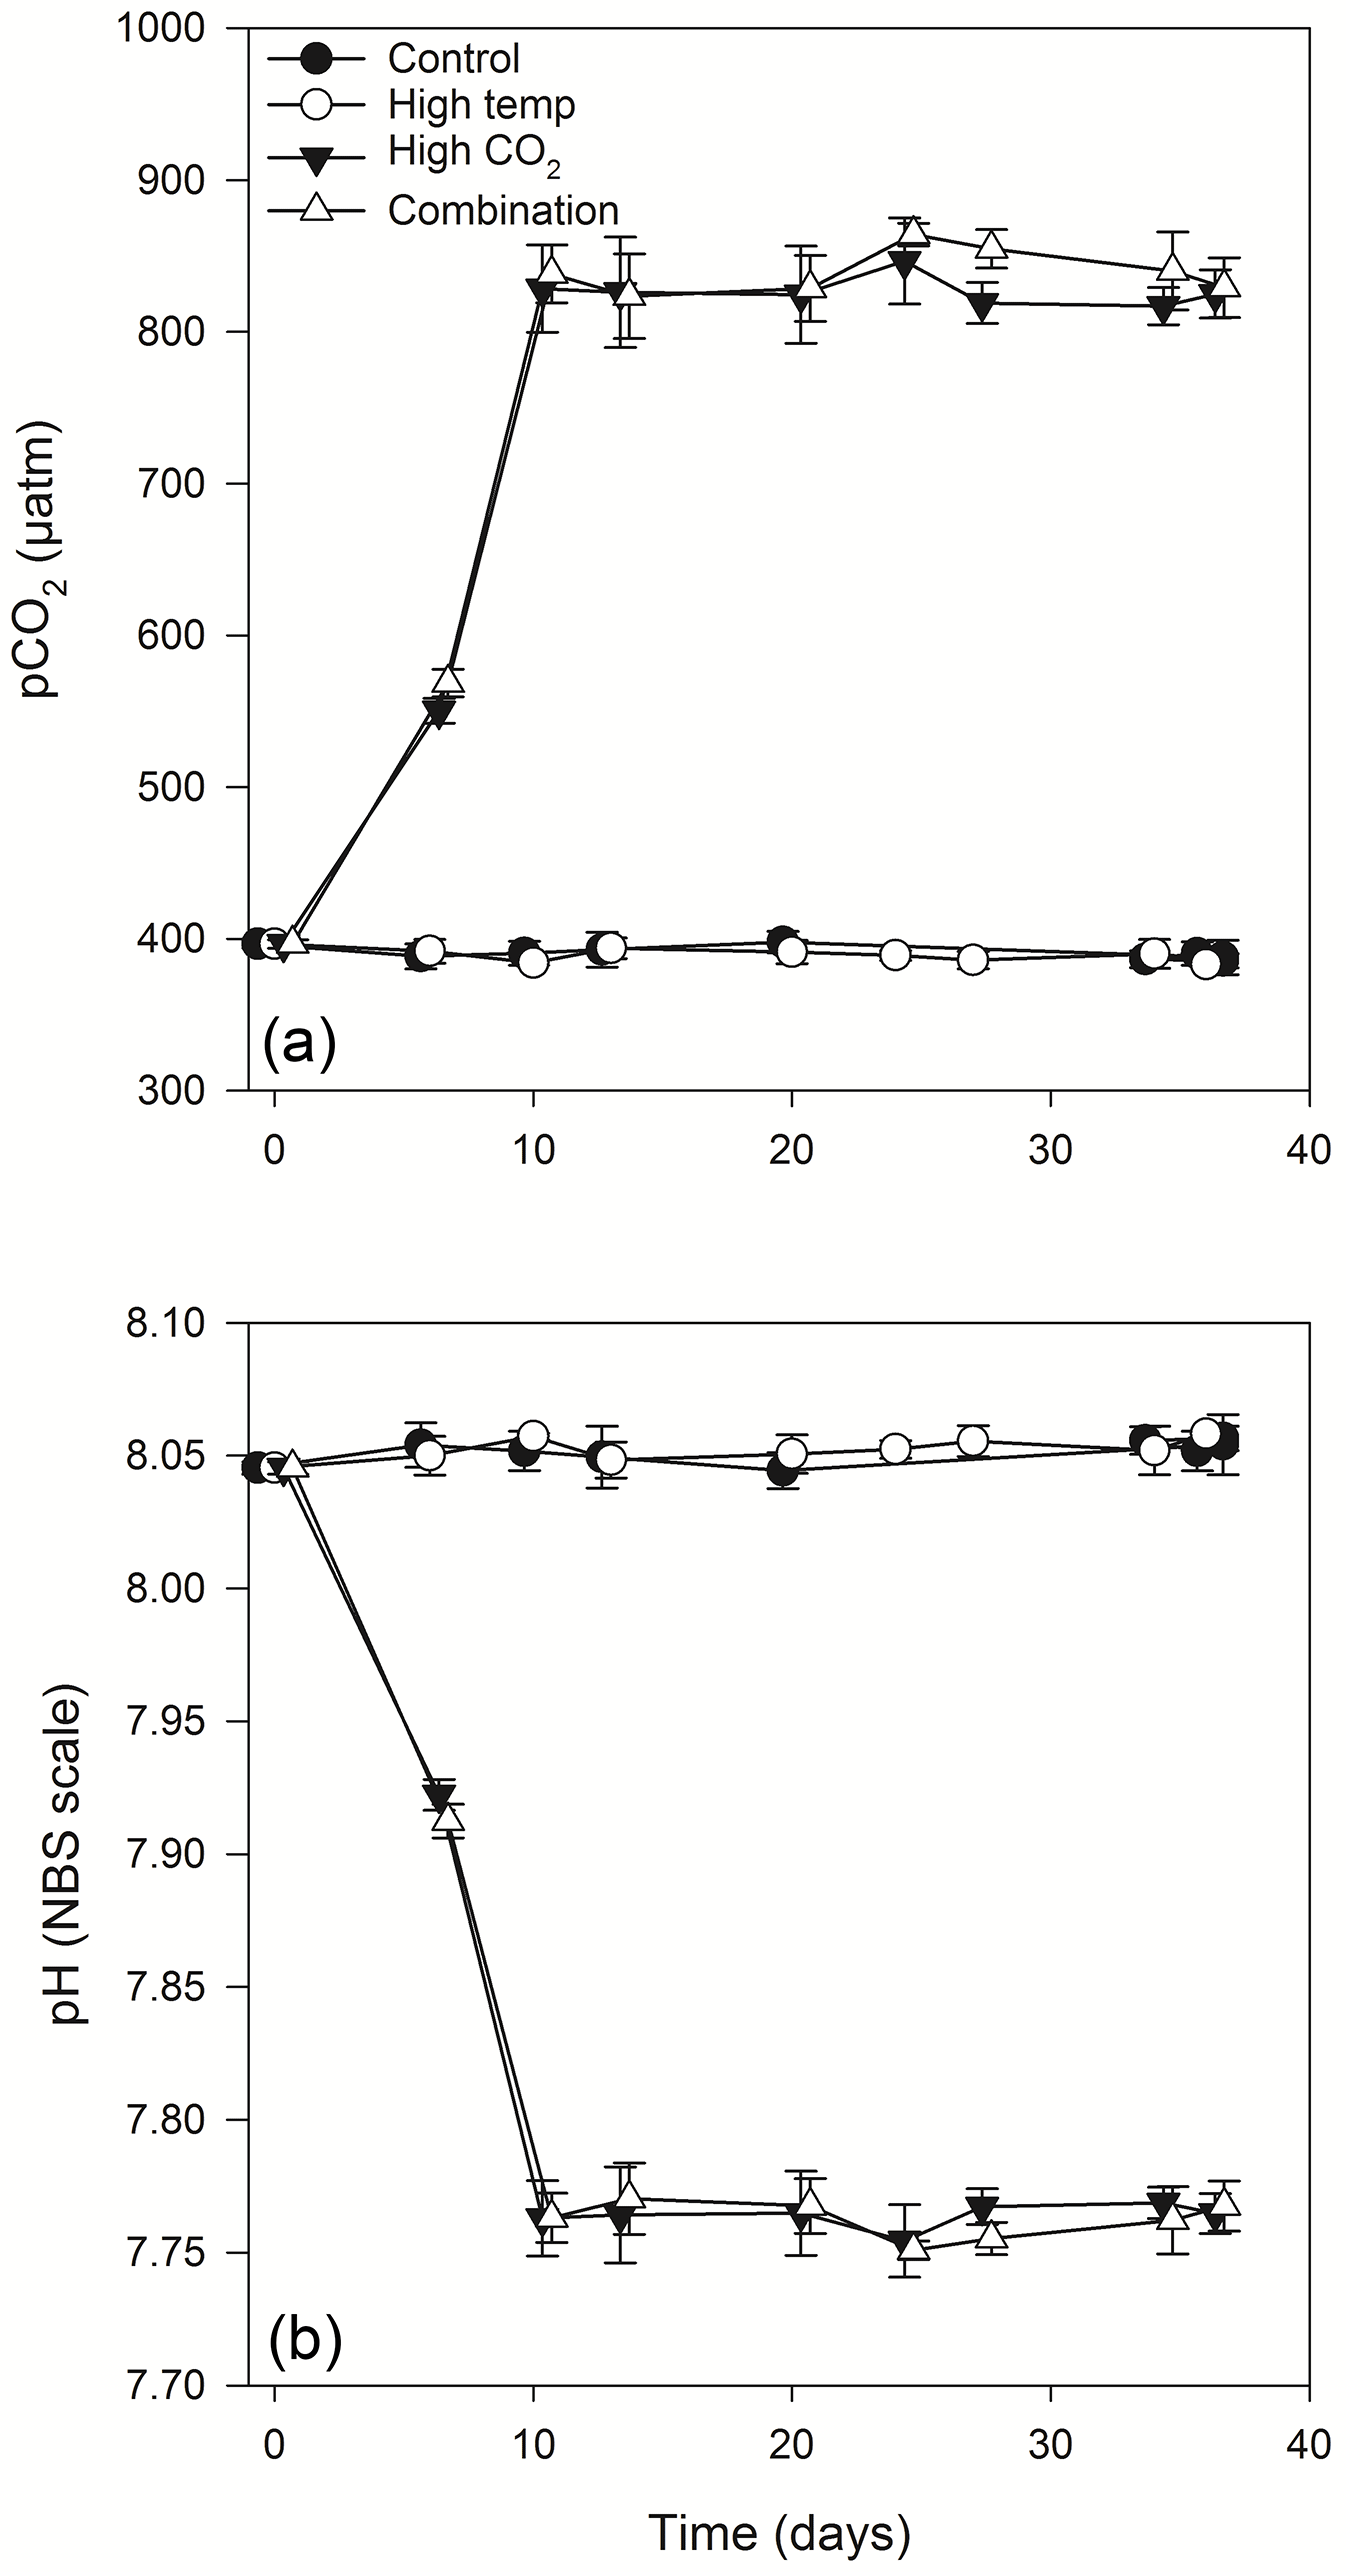
Figure 2Calculated values of partial pressure of CO2 in seawater (pCO2) (a) and pH (b) from direct measurements of total alkalinity and dissolved inorganic carbon. (For full carbonate system values see Table S1 in the Supplement).
3.1 Experimental carbonate system
Equilibration to the target high pCO2 values (800 µatm) within the high-pCO2 and combination treatments was achieved at T10 (Fig. 2a, b). These treatments were slowly acclimated to increasing levels of pCO2 over 7 days (from the initial dilution at T3), while the control and high-temperature treatments were acclimated at the same ambient carbonate system values as those measured at station L4 on the day of sampling. Following equilibration, the mean pCO2 values within the control and high-temperature treatments were 394.9 (± 4.3 SD) and 393.2 (± 4.8 SD) µatm respectively, while in the high-pCO2 and combination treatments mean pCO2 values were 822.6 (± 9.4) and 836.5 (± 15.6 SD) µatm respectively. Carbonate system values remained stable throughout the experiment (for full carbonate system measured and calculated parameters, see Table S1 in the Supplement).
3.2 Experimental temperature treatments
Mean temperatures in the control and high-pCO2 treatments were 14.1 (± 0.35 SD) ∘C, and in the high-temperature and combination treatments the mean temperatures were 18.6 (± 0.42 SD) ∘C, with a mean temperature difference between the ambient and high-temperature treatments of 4.46 (± 0.42 SD) ∘C (Supplement, Fig. S2a, b).
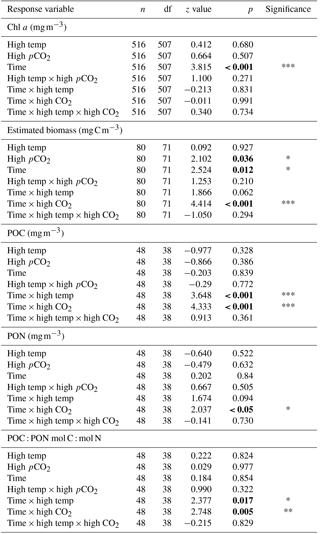
Table 1Results of generalised linear mixed model testing for effects of time, temperature, pCO2 and all interactions on Chl a, phytoplankton biomass, and particulate organic carbon and nitrogen. Significant results are in bold; * p<0.05, ** p<0.01, *** p<0.001.
3.3 Chlorophyll a
Mean Chl a in the experimental seawater at T0 was 1.64 (± 0.02 SD) mg m−3 (Fig. 3a). This decreased in all treatments between T0 and T7 to ∼ 0.1 (± 0.09, 0.035 and 0.035 SD) mg m−3 in the control, high-pCO2 and combination treatments, while in the high-temperature treatment at T7 Chl a was 0.46 mg m−3 (± 0.29 SD) (z = 2.176, p<0.05). From T7 to T12 Chl a increased in all treatments, which was highest in the combination (4.99 mg m−3 ± 0.69 SD) and high-pCO2 treatments (3.83 mg m−3 ± 0.43 SD). Overall, Chl a was significantly influenced by experimental time, independent of experimental treatments (Table 1). At T36 Chl a concentration in the combination treatment was higher (6.87 (± 0.58 SD) mg m−3) than all other treatments while the high-temperature treatment concentration was higher (4.77 (± 0.44 SD) mg m−3) than the control and high-pCO2 treatment. Mean concentrations for the control and high-pCO2 treatment at T36 were not significantly different at 3.30 (± 0.22 SD) and 3.46 (± 0.35 SD) mg m−3 respectively (pairwise comparison t = 0.78, p = 0.858).
3.4 Phytoplankton biomass
The starting biomass in all treatments was 110.2 (± 5.7 SD) mg C m−3 (Fig. 3b). The biomass was dominated by dinoflagellates (∼ 50 %) with smaller contributions from nanophytoplankton (∼ 13 %), cryptophytes (∼ 11 %), diatoms (∼ 9 %), coccolithophores (∼ 8 %), Synechococcus (∼ 6 %) and picophytoplankton (∼ 3 %). Total biomass was significantly influenced in all treatments over time (Table 1), and at T10 it was significantly higher in the high-temperature treatment when biomass reached 752 (± 106 SD) mg C m−3 (z = 2.769, p<0.01). Biomass was significantly higher in the elevated pCO2 treatment (interaction of time × high pCO2) (Table 1), reaching 2481 (± 182.68 SD) mg C m−3 at T36, ∼ 6.5-fold higher than the control (z = 3.657, p<0.001). Total biomass in the high-temperature treatment at T36 was significantly higher than the combination treatment and ambient control (z=2.744, p<0.001), which were 525 (± 28.02 SD) mg C m−3 and 378 (± 33.95 SD) mg C m−3 respectively. Reaching 1735 (± 169.24 SD) mg C m−3, biomass in the high-temperature treatment was ∼ 4.6-fold higher than the control.
POC followed the same trends in all treatments between T0 and T36 (Fig. 3c) and was in close range of the estimated biomass (R2=0.914, Fig. 3d). POC was significantly influenced by the interaction of time × high pCO2 and time × high temperature (Table 1). At T36 POC was significantly higher in the high-pCO2 treatment (2086 ± 155.19 SD mg m−3) followed by the high-temperature treatment (1594 ± 162.24 SD mg m−3) – ∼ 5.4-fold and 4-fold higher than the control respectively, whereas a decline in POC was observed in the control and combination treatment. PON followed the same trend as POC over the course of the experiment, though it was only significantly influenced by the interaction between time and high pCO2 (Fig. 3e, Table 1). At T36 concentrations were 147 (± 12.99 SD) and 133 (± 15.59 SD) mg m−3 in the high-pCO2 and high-temperature treatments respectively, while PON was 57.75 (± 13.07 SD) mg m−3 in the combination treatment and 47.18 (± 9.32 SD) mg m−3 in the control. POC : PON ratios were significantly influenced by the interaction of time × high pCO2 and time × high temperature (Table 1). The largest increase of 33 %, from 10.72 to 14.26 (± 1.73 SD) mol C : mol N, was in the high-pCO2 treatment (73 % higher than the control), followed by an increase of 32 % to 9.83 (± 1.82 SD) mol C : mol N in the combination treatment (19 % higher than the control) and an increase of 17 % to 12.09 (± 2.14 SD) mol C : mol N in the high-temperature treatment (46 % higher than the control). In contrast, the POC : PON ratio in the control declined by 20 % from T0 to T36, from 10.33 to 8.26 (± 0.50 SD) mol C : mol N (Fig. 3f).
Table 2Results of generalised linear mixed model testing for significant effects of time, temperature, pCO2 and all interactions on phytoplankton species biomass. Significant results are in bold; * p<0.05, ** p<0.01, *** p<0.001.
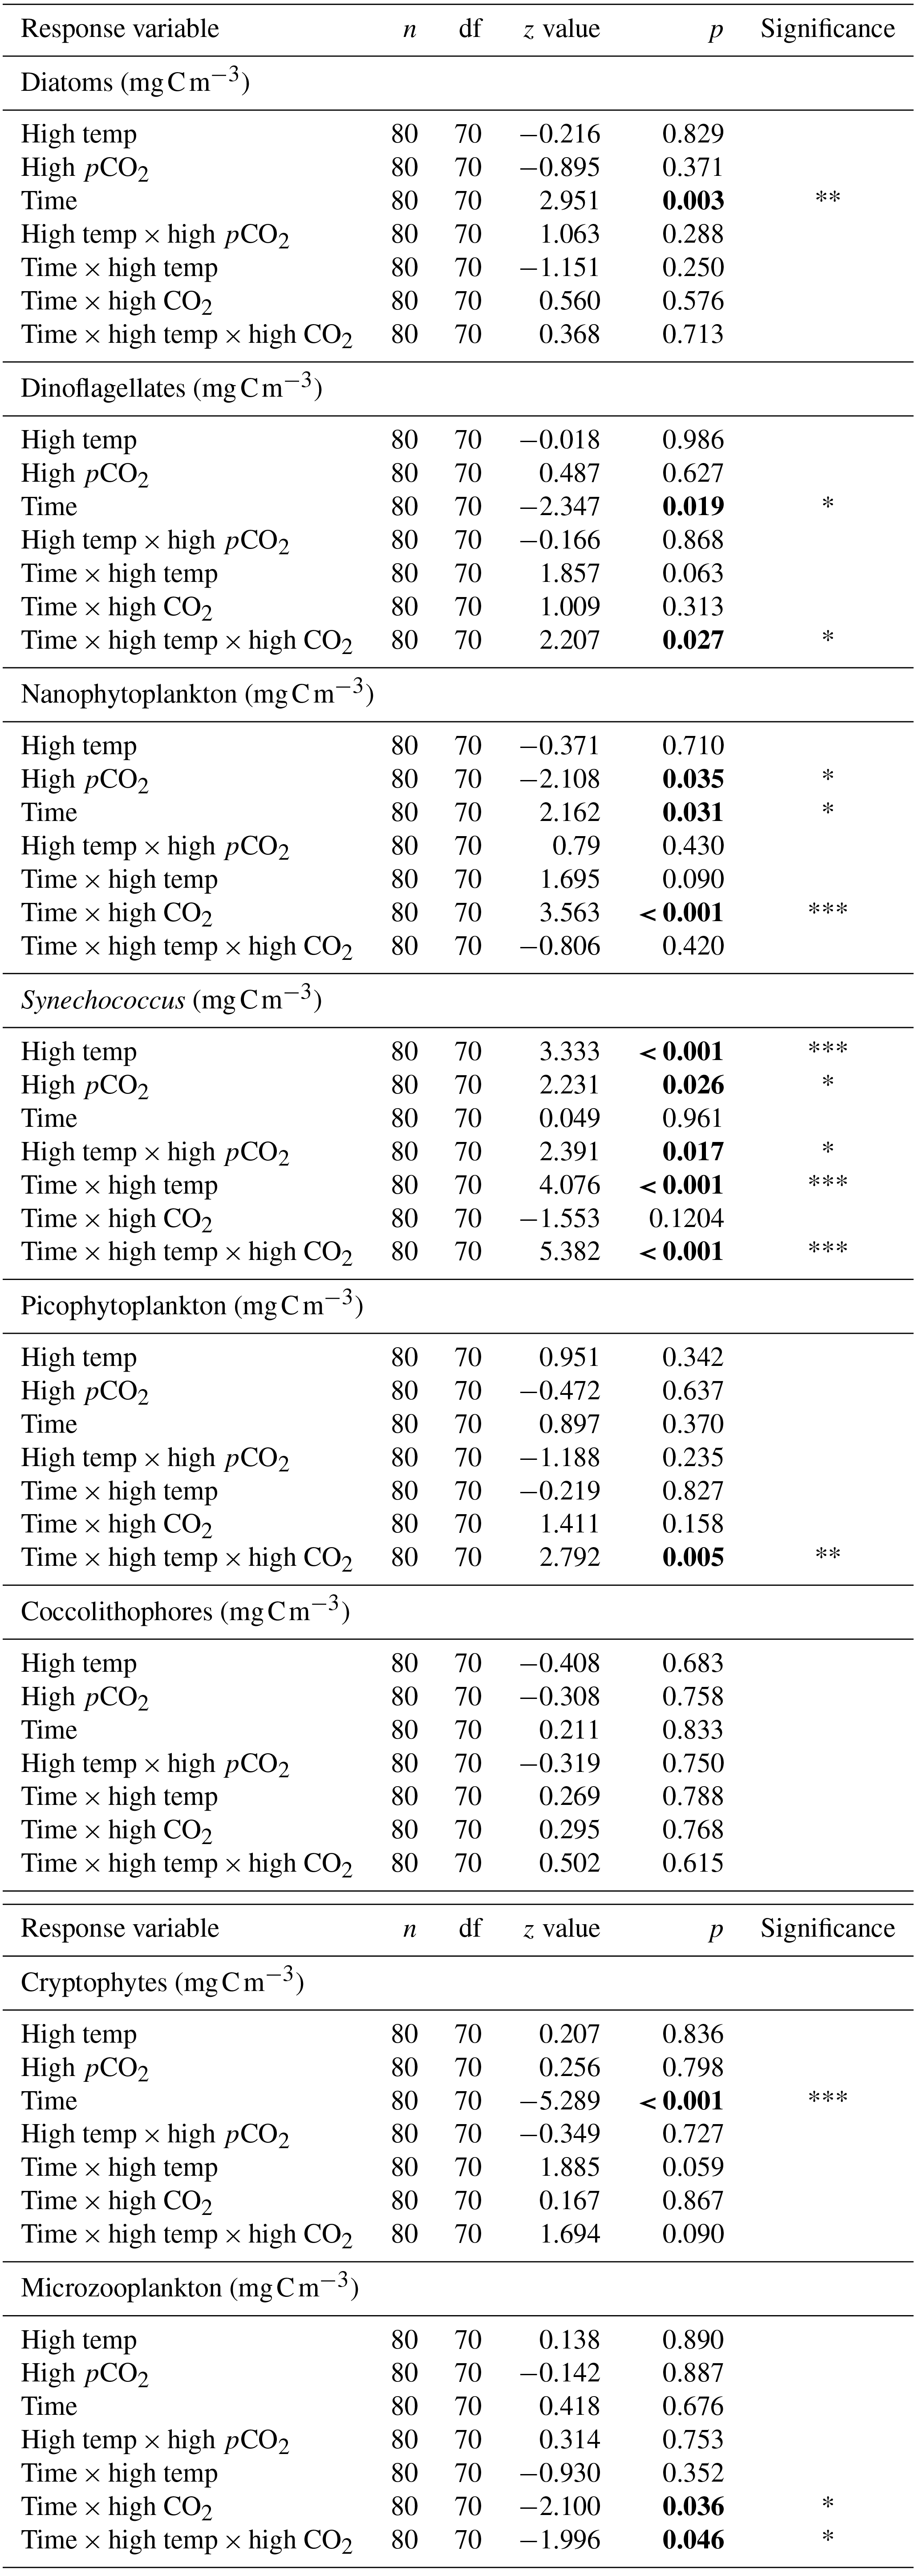
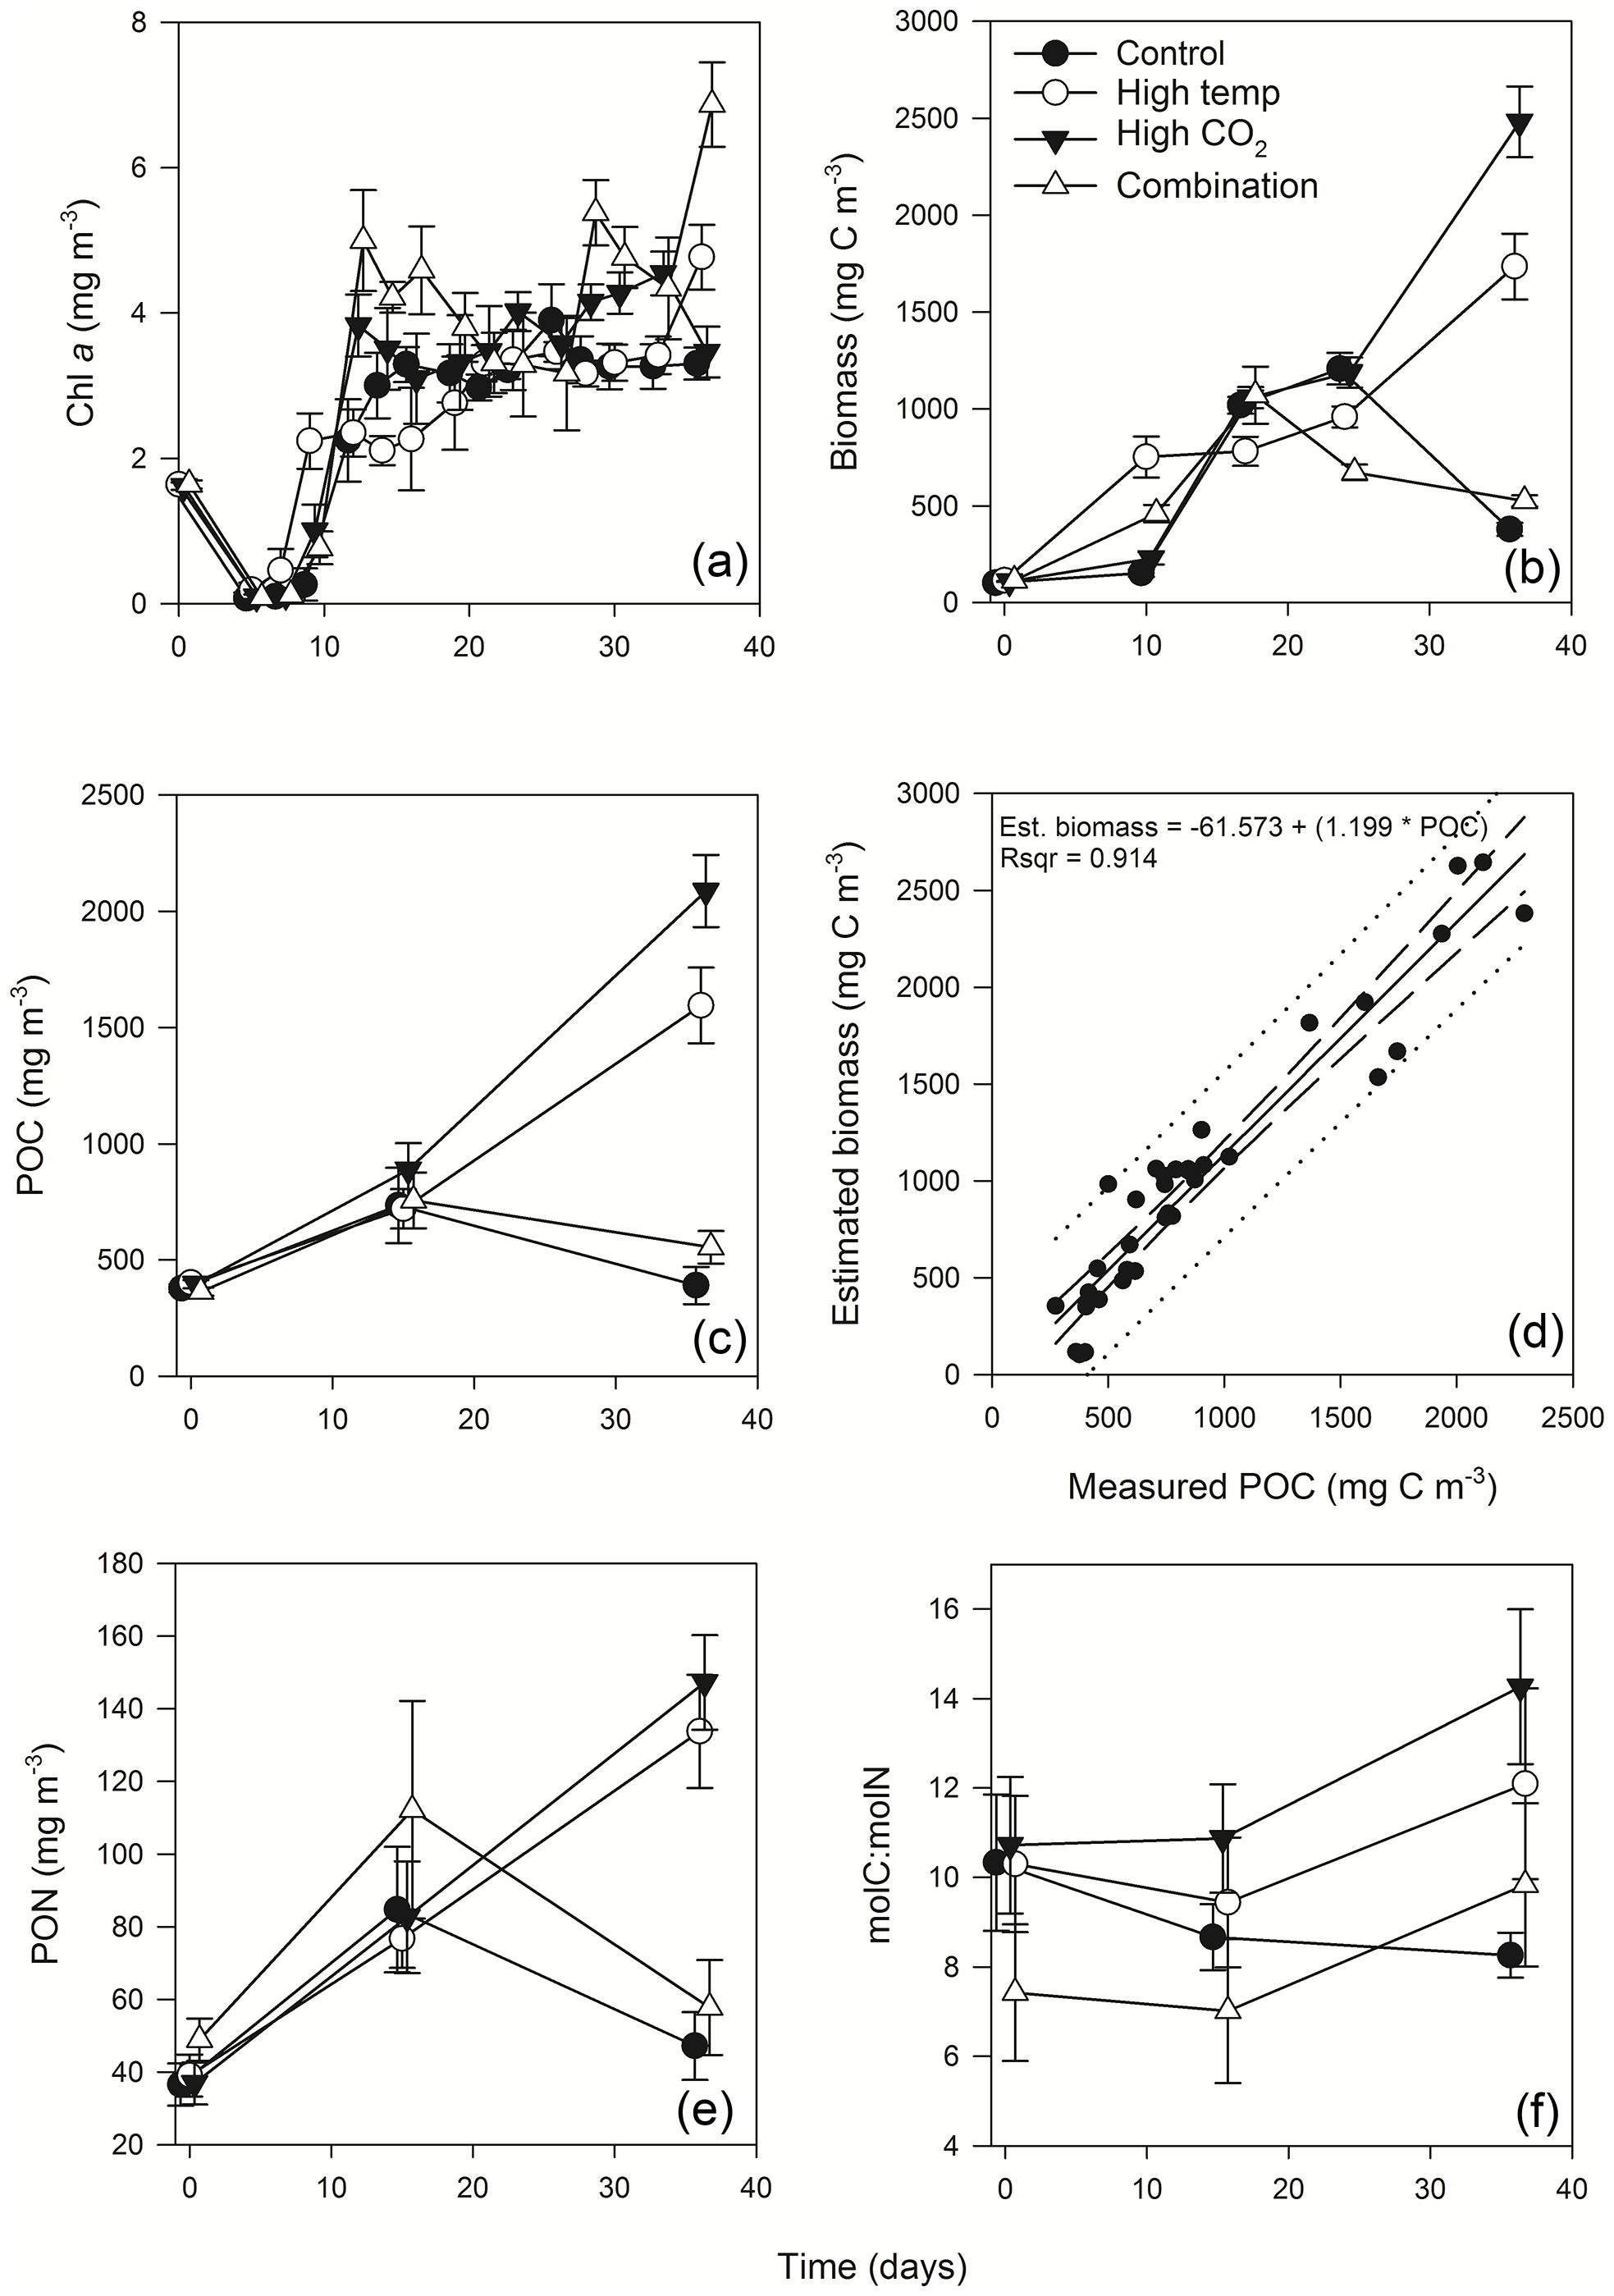
Figure 3Time course of Chl a (a), estimated phytoplankton biomass (b), POC (c), regression of estimated phytoplankton carbon vs. measured POC (d), PON (e) and POC : PON (f).
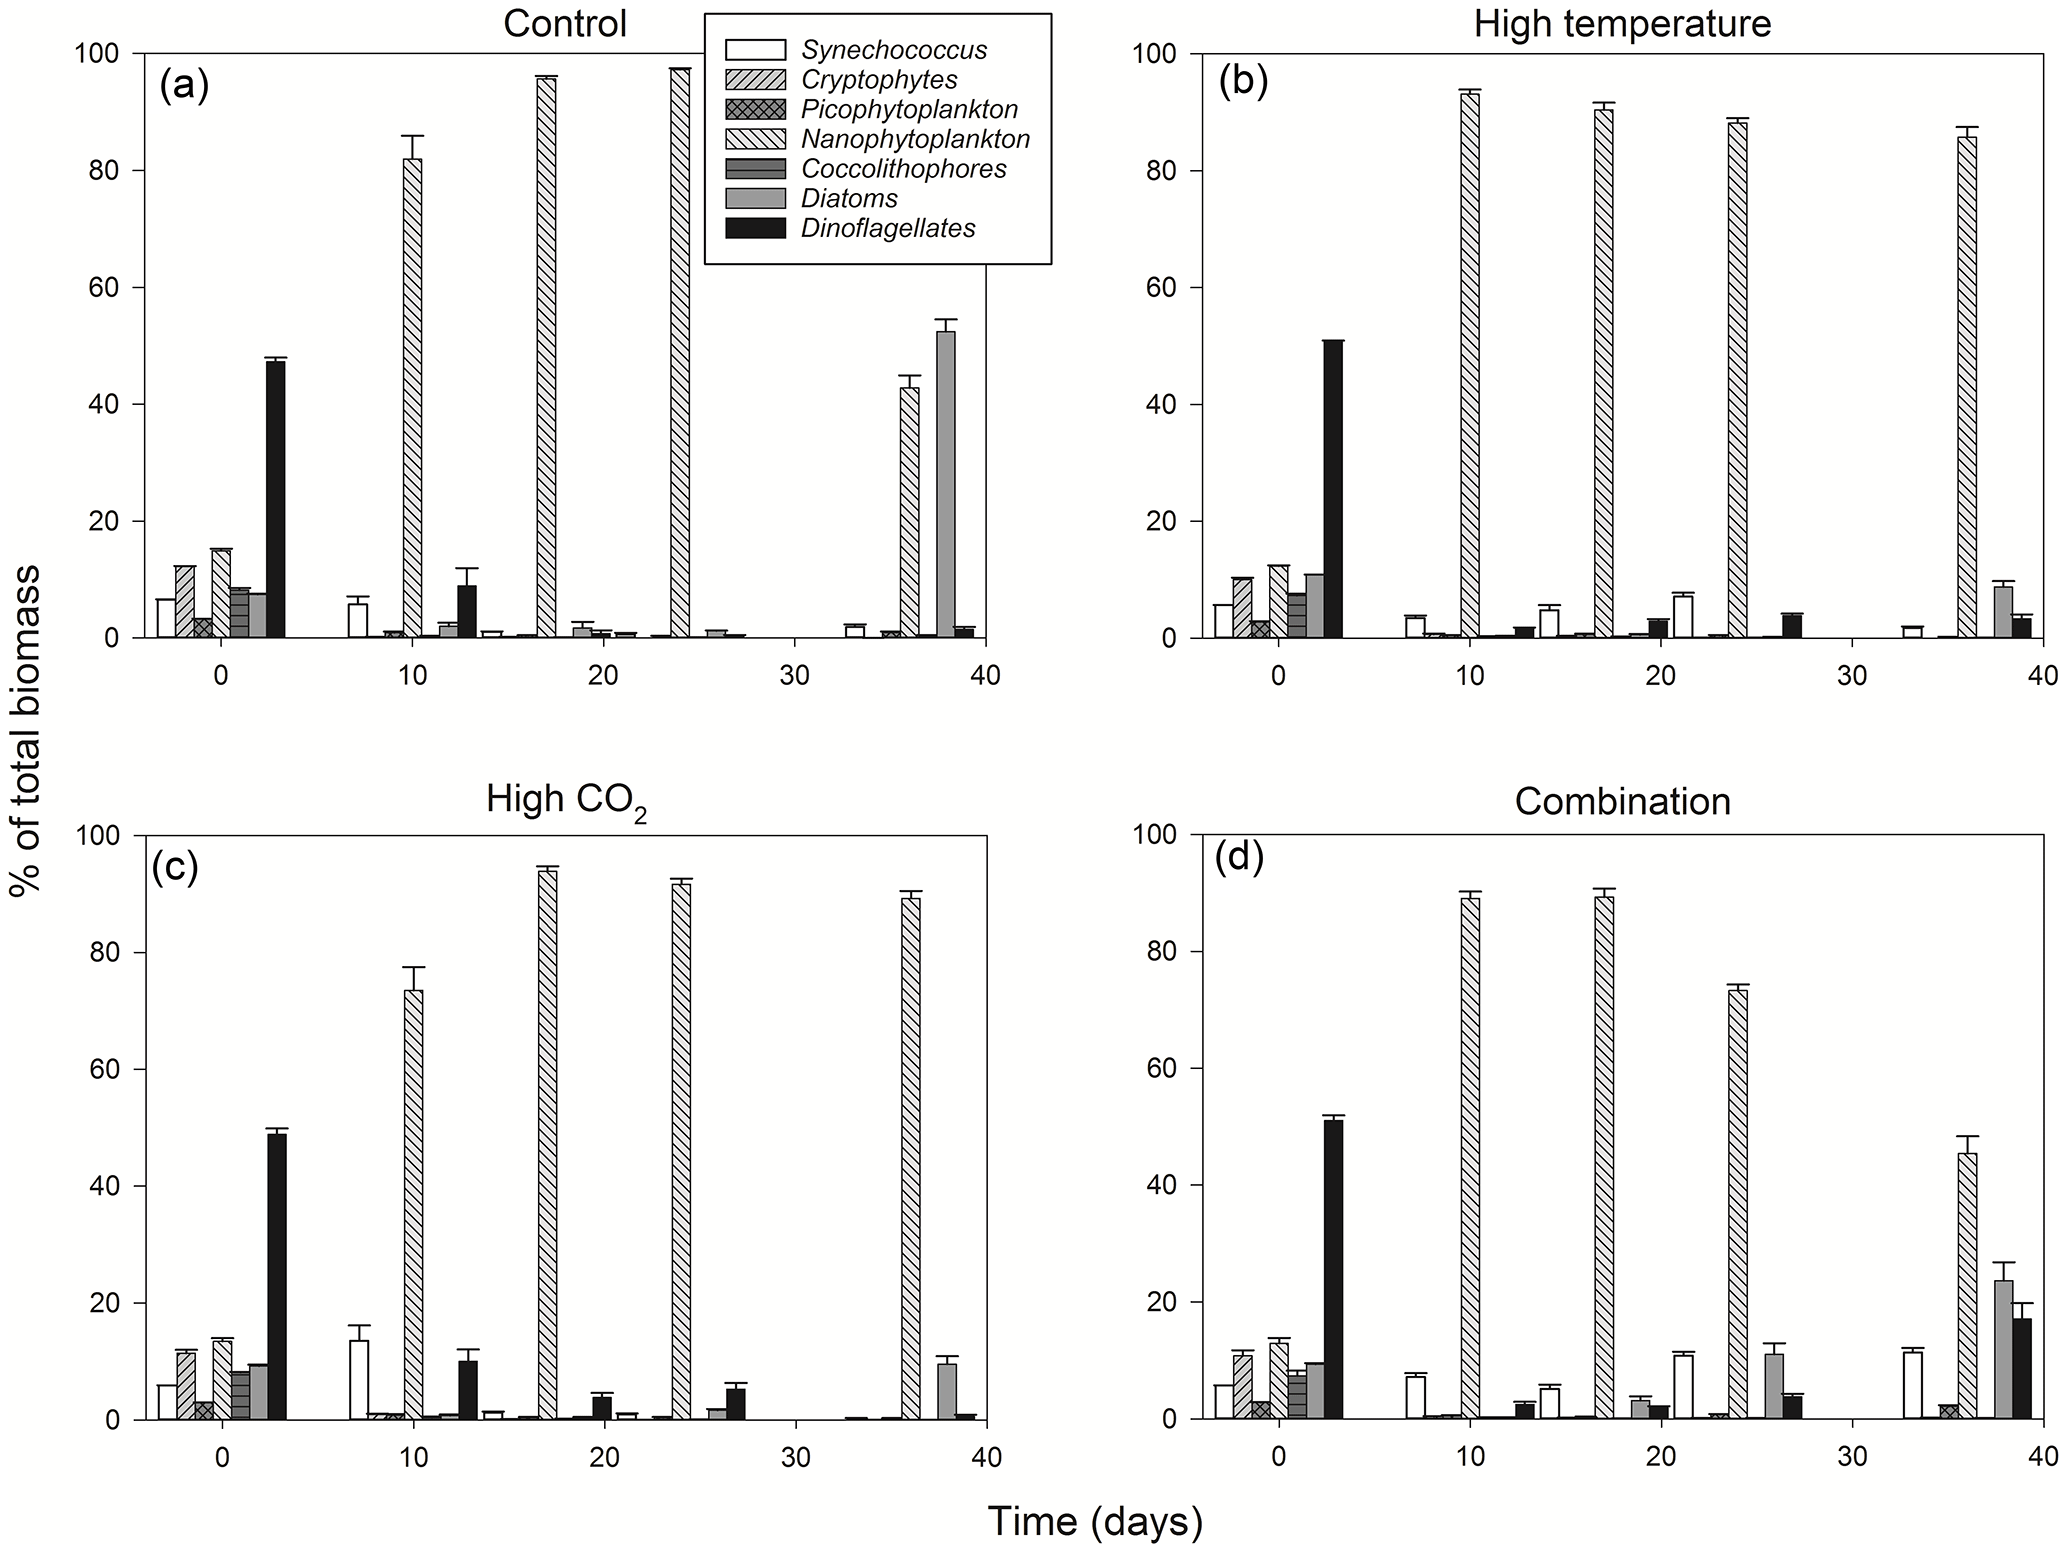
Figure 4Percentage contribution to community biomass by phytoplankton groups/species throughout the experiment in the control (a), high-temperature (b), high-CO2 (c) and combination treatments (d).

3.5 Community composition
From T0 to T24 the community shifted away from dominance of dinoflagellates in all treatments, followed by further regime shifts between T24 and T36 in the control and combination treatments. At T36 diatoms dominated the phytoplankton community biomass in the ambient control (Fig. 4a), while the high-temperature and high-pCO2 treatments exhibited near-mono-specific dominance of nanophytoplankton (Fig. 4b, c). The most diverse community was in the combination treatment where dinoflagellates and Synechococcus became more prominent (Fig. 4d).
Between T10 and T24 the community shifted to nanophytoplankton in all experimental treatments. This dominance was maintained to T36 in the high-temperature and high-pCO2 treatments whereas, in the ambient control and combination treatment, the community shifted away from nanophytoplankton (Fig. 5a). Nanophytoplankton biomass was significantly higher in the high-pCO2 treatment (Table 2) with biomass reaching 2216 (± 189.67 SD) mg C m−3 at T36. This biomass was also high (though not significantly throughout the experiment until T36) in the high-temperature treatment (T36: 1489 (± 170.32 SD) mg C m−3, z = 1.695, p = 0.09) compared to the control and combination treatments. In the combination treatment, nanophytoplankton biomass was 238 (± 14.16 SD) mg C m−3 at T36, which was higher than the control, though not significantly (162 ± 20.02 SD mg C m−3). In addition to significant differences in nanophytoplankton biomass amongst the experimental treatments, treatment-specific differences in cell size were also observed. Larger nanoflagellates dominated the control (mean cell diameter of 6.34 µm) and smaller nanoflagellates dominated the high-temperature and combination treatments (mean cell diameters of 3.61 and 4.28 µm), whereas Phaeocystis spp. dominated the high-pCO2 treatment (mean cell diameter 5.04 µm) and was not observed in any other treatment (Supplement, Fig. S3a–d).
At T0, diatom biomass was low and dominated by Coscinodiscus wailessii (48 %; 4.99 mg C m−3), Pleurosigma (25 %; 2.56 mg C m−3) and Thalassiosira subtilis (19 %; 1.94 mg C m−3). Small biomass contributions were made by Navicula distans, undetermined pennate diatoms and Cylindrotheca closterium. Biomass in the diatom group remained low from T0 to T24 but increased significantly through time in all treatments (Table 2), with the highest biomass in the high-pCO2 treatment (235 ± 21.41 SD mg C m−3, Fig. 5b). The highest diatom contribution to total community biomass at T36 was in the ambient control (52 % of biomass; 198 ± 17.28 SD mg C m−3). In both the high-temperature and combination treatments, diatom biomass was lower at T36 (151 ± 10.94 SD and 124 ± 19.16 SD mg C m−3 respectively). In all treatments, diatom biomass shifted from the larger C. wailessii to the smaller C. closterium, N. distans, T. subtilis and Tropidoneis spp., the relative contributions of which were treatment specific. Overall N. distans dominated diatom biomass in all treatments at T36 (ambient control: 112 ± 24.86 SD mg C m−3, 56 % of biomass; high temperature: 106 ± 17.75 SD mg C m−3, 70 % of biomass; high pCO2: 152 ± 19.09 SD mg C m−3, 61 % of biomass; and combination: 111 ± 20.97 SD mg C m−3, 89 % of biomass; Supplement, Fig. S4a–d).
The starting dinoflagellate community was dominated by Gyrodinium spirale (91 %; 49 mg C m−3), with smaller contributions from Katodinium glaucum (5 %; 2.76 mg C m−3), Prorocentrum cordatum (3 %; 1.78 mg C m−3) and undetermined Gymnodiniales (1 %; 0.49 mg C m−3). At T36 dinoflagellate biomass was significantly higher in the combination treatment (90 ± 16.98 SD mg C m−3, Fig. 5c, Table 2) followed by the high-temperature treatment (57 ± 6.87 SD mg C m−3, Table 2). There was no significant difference in dinoflagellate biomass between the high-pCO2 treatment and ambient control at T36 when biomass was low. In the combination treatment, the dinoflagellate biomass became dominated by P. cordatum, which contributed 59 (± 12.95 SD) mg C m−3 (66 % of biomass in this group).
Synechococcus biomass was significantly higher in the combination treatment (reaching 59.9 ± 4.30 SD mg C m−3 at T36, Fig. 5d, Table 2) followed by the high-temperature treatment (30 ± 5.98 SD mg C m−3, Table 2). In both the high-pCO2 treatment and control Synechococcus biomass was low (∼ 7 mg C m−3 in both treatments at T36), though an initial significant response to high pCO2 was observed between T0 and T10 (Table 2). In all treatments and throughout the experiment, relative to the other phytoplankton groups, biomass of picophytoplankton (Fig. 5e), cryptophytes (Fig. 5f) and coccolithophores (Fig. 5g) remained low, though there was a slight increase in picophytoplankton in the combination treatment (11.26 ± 0.79 SD mg C m−3; Table 2).
Microzooplankton was dominated by Strombilidium spp. in all treatments throughout the experiment, though biomass was low relative to the phytoplankton community (Fig. 6). Following a decline from T0 to T10, microzooplankton biomass increased in all but the high-CO2 treatment until T17 when biomass diverged. The biomass trajectory maintained an increase in the control when at T36 it was highest at ∼ 1.6 mg C m−3, 90 % higher than the high-temperature treatment (0.83 mg C m−3). Microzooplankton biomass was significantly lower in the high-CO2 treatment at T36 (, p=0.036) and undetected in the combination treatment at this time point (Table 2).
Table 3FRRf-based photosynthesis–irradiance curve parameters for the experimental treatments on the final day (T36).
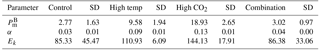
Table 4Results of generalised linear model testing for significant effects of temperature, CO2 and temperature × CO2 on phytoplankton photophysiology at T36; (maximum photosynthetic rates), α (light-limited slope) and Ik (light-saturated photosynthesis). Significant results are in bold; * p<0.05, ** p<0.001, *** p<0.0001.
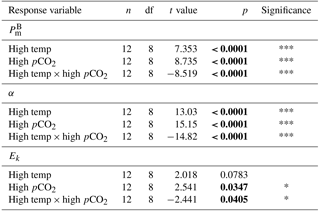
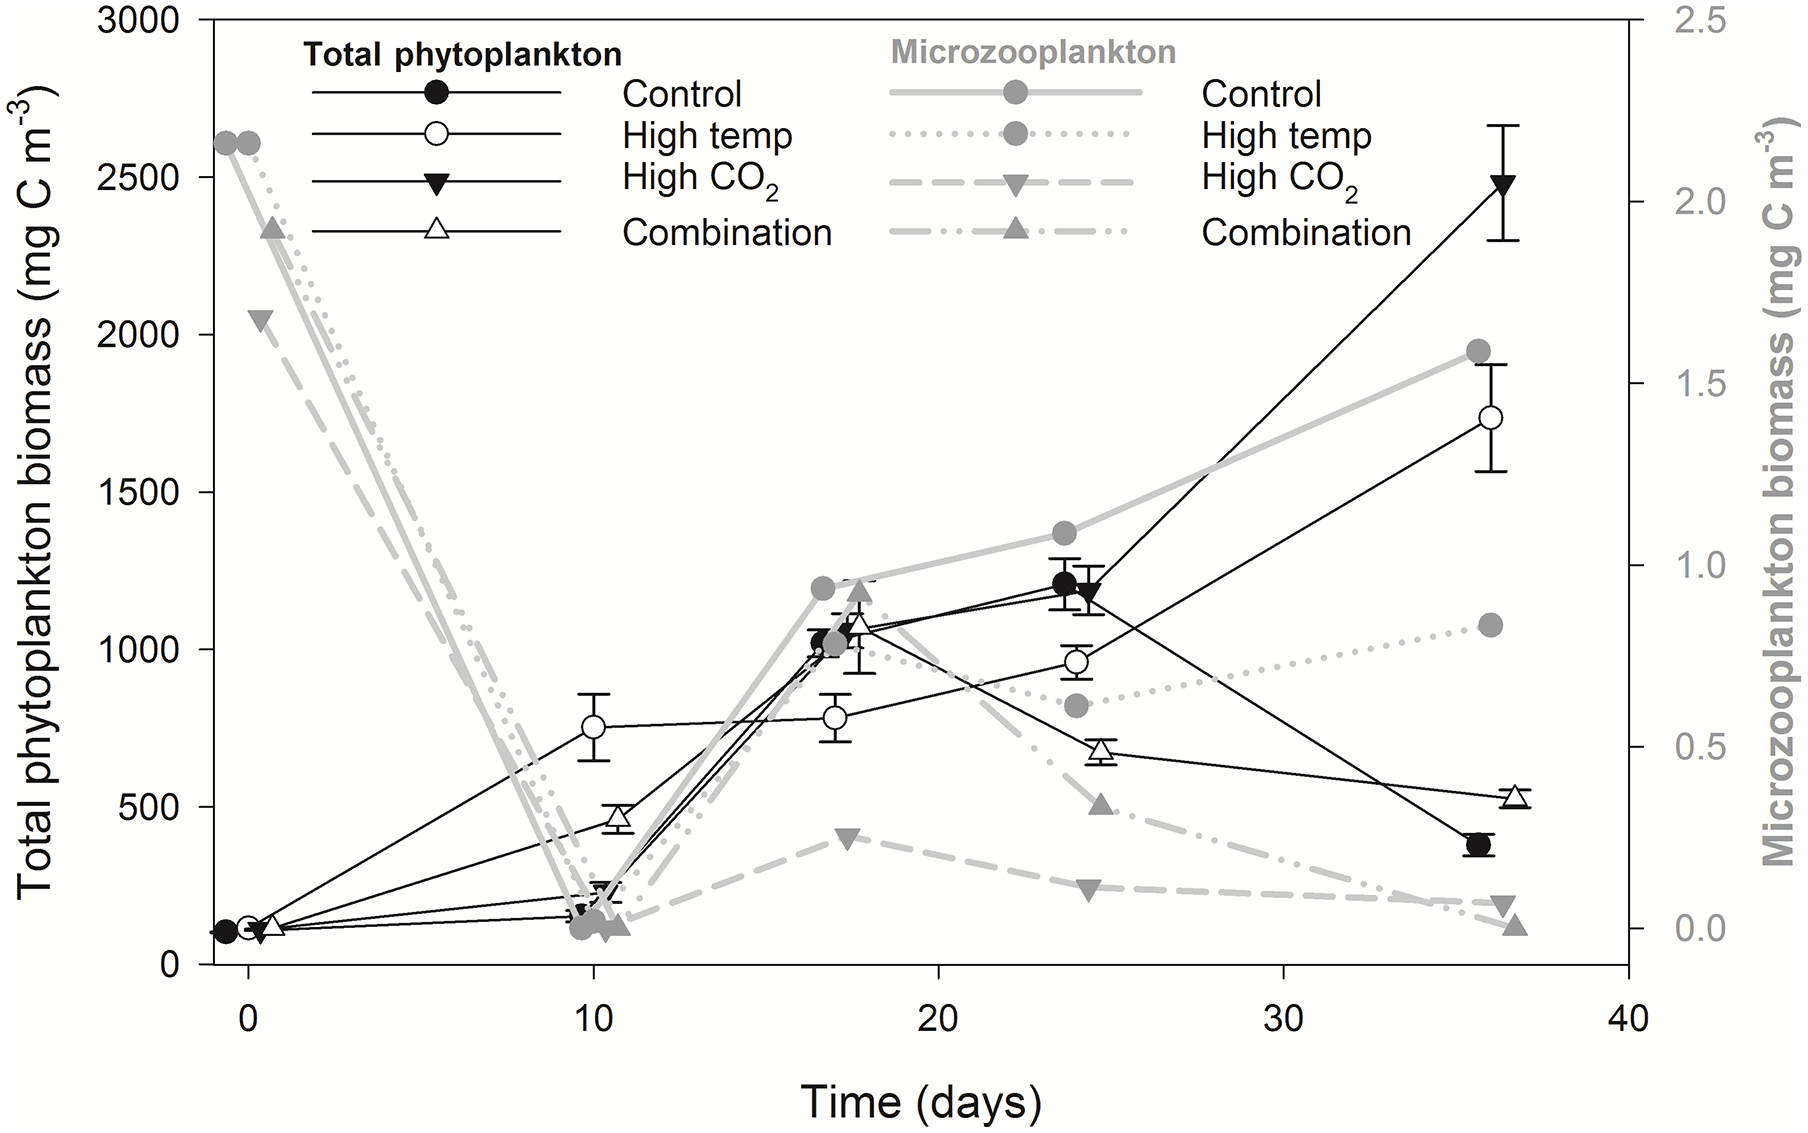
Figure 6Microzooplankton biomass (dominated by Strombilidium sp.) relative to total phytoplankton biomass.
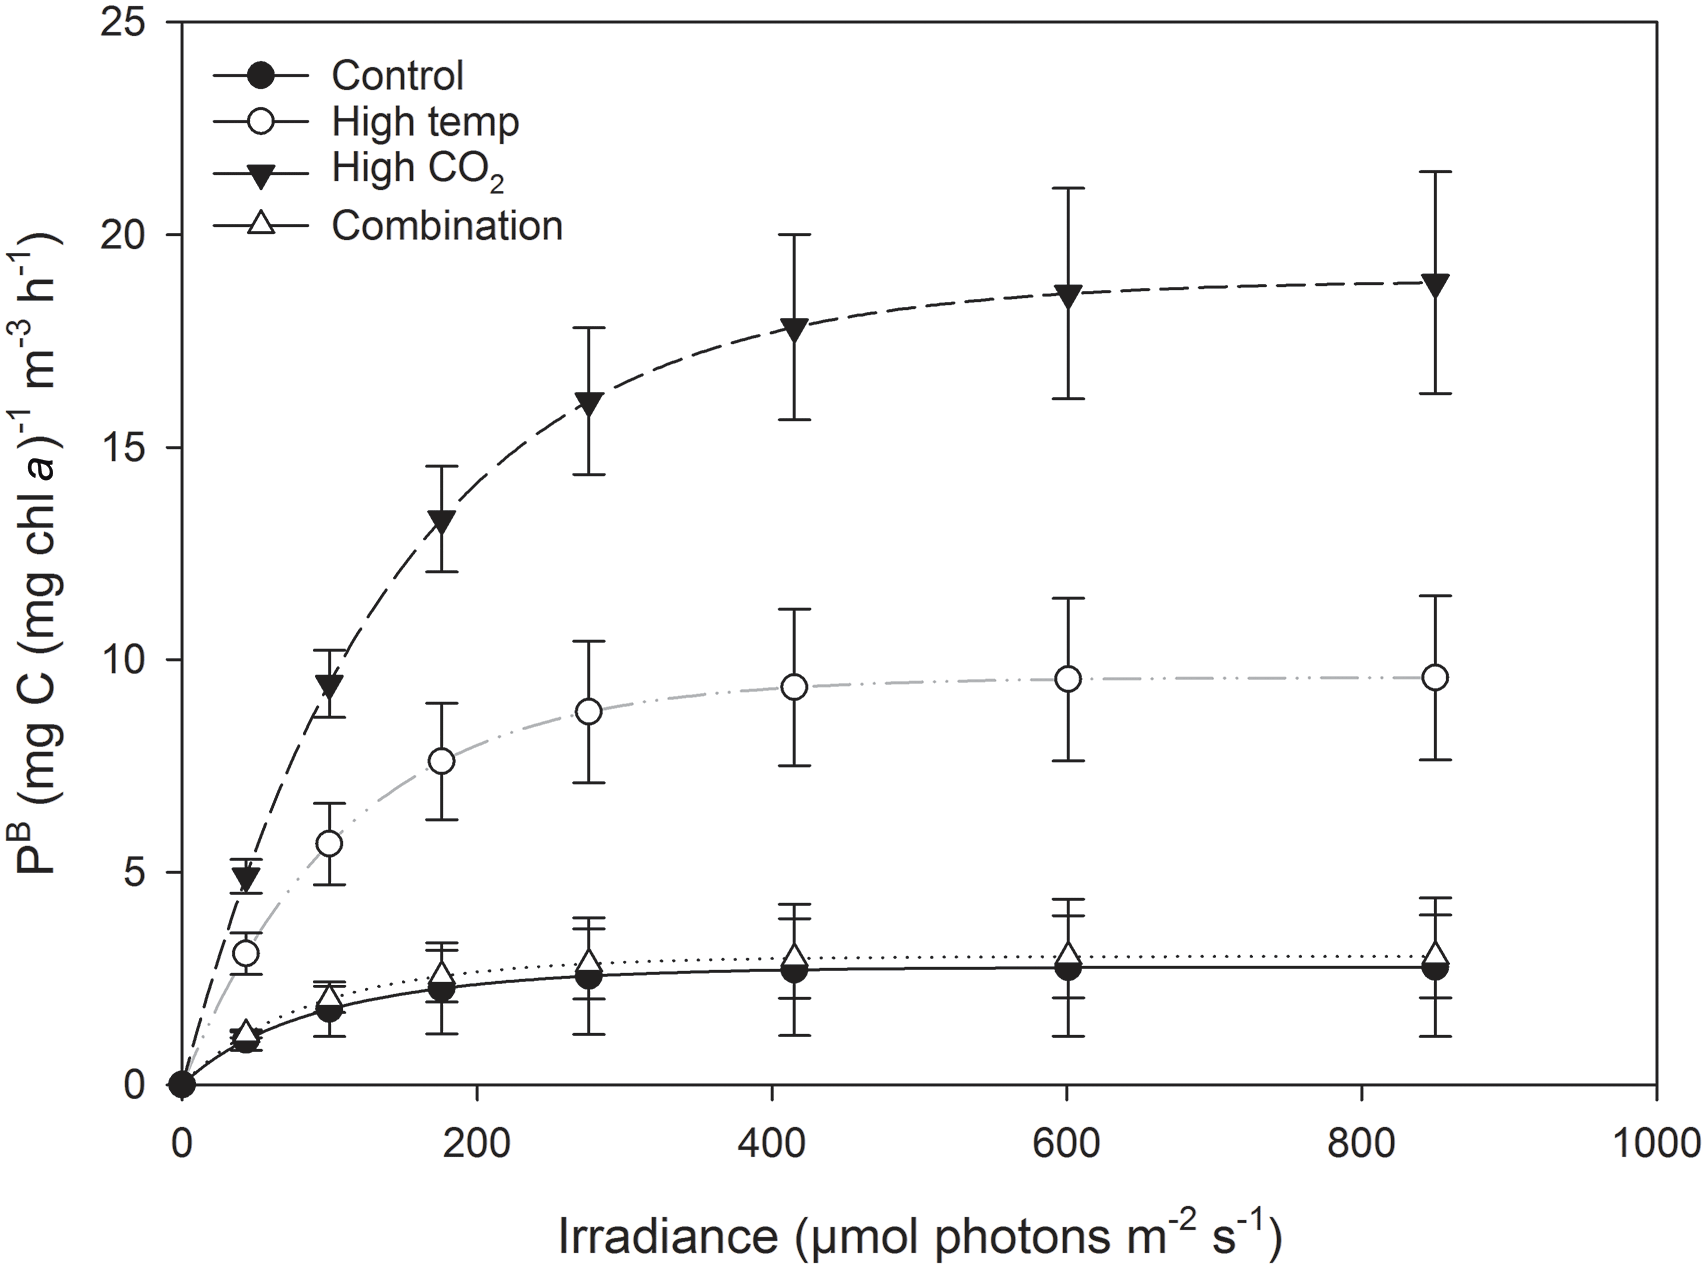
Figure 7Fitted parameters of FRRf-based photosynthesis–irradiance curves for the experimental treatments on the final experimental day (T36).
3.6 Chl a fluorescence-based photophysiology
At T36, FRRf PE parameters were strongly influenced by the experimental treatments. was significantly higher in the high-pCO2 treatment (18.93 mg C (mg Chl a)), followed by the high-temperature treatment (9.58 mg C (mg Chl a); Fig. 7, Tables 3 and 4). There was no significant difference in between the control and combination treatments (2.77 and 3.02 mg C (mg Chl a)). Light-limited photosynthetic efficiency (αB) also followed the same trend and was significantly higher in the high-pCO2 treatment (0.13 mg C (mg Chl a) ) followed by the high-temperature treatment (0.09 mg C (mg Chl a) ; Tables 3 and 4). αB was low in both the control and combination treatment (0.03 and 0.04 mg C (mg Chl a) respectively). The light saturation point of photosynthesis (Ek) was significantly higher in the high-pCO2 treatment relative to all treatments (144.13 ), though significantly lower in the combination treatment relative to both the high-pCO2 and high-temperature treatments (Tables 3 and 4).
Individually, elevated temperature and pCO2 resulted in the highest biomass and maximum photosynthetic rates () at T36, when nanophytoplankton dominated. The interaction of these two factors had little effect on total biomass with values close to the ambient control, and no effect on . The combination treatment, however, exhibited the greatest diversity of phytoplankton functional groups, with dinoflagellates and Synechococcus becoming dominant over time.
Elevated pCO2 has been shown to enhance the growth and photosynthesis of some phytoplankton species which have active uptake systems for inorganic carbon (Giordano et al., 2005; Reinfelder, 2011). Elevated pCO2 may therefore lead to lowered energetic costs of carbon assimilation in some species and a redistribution of the cellular energy budget to other processes (Tortell et al., 2002). In this study, under elevated pCO2 where the dominant group was nanophytoplankton, the most abundant species was the haptophyte Phaeocystis spp. Photosynthetic carbon fixation in Phaeocystis spp. is presently near saturation with respect to current levels of pCO2 (Rost et al., 2003). Dominance of this spp. under elevated pCO2 may be due to lowered grazing pressure since microzooplankton biomass was lowest in the high-CO2 treatment throughout the experiment. The increased biomass and photosynthetic carbon fixation in this experimental community under elevated pCO2 is due to the community shift to Phaeocystis spp. The increased biomass in the high-temperature treatment (where microzooplankton biomass remained stable between T17 and T36, though lower than the control) may be attributed to enhanced enzymatic activities, since algal growth commonly increases with temperature until after an optimal range (Boyd et al., 2013; Goldman and Carpenter, 1974; Savage et al., 2004). Optimum growth temperatures for marine phytoplankton are often several degrees higher than environmental temperatures (Eppley, 1972; Thomas et al., 2012). Nanophytoplankton also dominated in this treatment and, while Phaeocystis spp. was not discriminated, no further classification was made at a group/species level. Reduced biomass in the control from T24 onwards may be due to increased grazing pressure given the highest concentrations of microzooplankton biomass were observed in the control. Conversely, microzooplankton biomass declined significantly from T17 in the combination treatment, indicating reduced grazing pressure while phytoplankton biomass also declined from this time point. Nutrient concentrations were not measured beyond T0 and we cannot therefore exclude the possibility that differences in nutrient availability may have contributed to observed differences between control, high-temperature and high-CO2 treatments.
4.1 Chl a
Biomass in the control peaked at T25 followed by a decline to T36. Correlated with this, Chl a also peaked at T25 in the control and declined to 3.3 mg m−3 by T27, remaining close to this value until T36. Biomass in the combination treatment peaked at T20 followed by decline to T36, whereas Chl a in this treatment declined from T20 to T25 followed by an increase at T27 before further decline similar to the biomass. Chl a peaked in this treatment again at T36 (6.8 mg m−3). We attribute the increase in Chl a between T25 and T27 (coincident with an overall biomass decrease) to lower species-specific carbon : Chl a ratios as a result of the increase in dinoflagellates, Synechococcus and picophytoplankton biomass from T25. We speculate that the decline in biomass under nutrient replete conditions in the combination treatment was probably due to slower species-specific growth rates when diatoms and dinoflagellates became more prominent in this treatment. Carbon : Chl a ratios in diatoms and dinoflagellates have previously been demonstrated to be lower than nano- and picophytoplankton (Sathyendranath et al., 2009). This contrasts the results reported in comparable studies as Chl a is generally highly correlated with biomass (e.g. Feng et al., 2009). Similar results were reported however by Hare et al. (2007), which indicates that Chl a may not always be a reliable proxy for biomass in mixed communities.
4.2 Biomass
This study shows that the phytoplankton community response to elevated temperature and pCO2 is highly variable. pCO2 elevated to ∼ 800 µatm induced higher community biomass, similar to the findings of Kim et al. (2006), whereas in other natural community studies no CO2 effect on biomass was observed (Delille et al., 2005; Maugendre et al., 2017; Paul et al., 2015). A ∼ 4.5 ∘C increase in temperature also resulted in higher biomass at T36 in this study, similar to the findings of Feng et al. (2009) and Hare et al. (2007), though elevated temperature has previously reduced the biomass of natural nanophytoplankton communities in the western Baltic Sea and Arctic Ocean (Coello-Camba et al., 2014; Moustaka-Gouni et al., 2016). When elevated temperature and pCO2 were combined, community biomass exhibited little response, similar to the findings of Gao et al. (2017), though an increase in biomass has also been reported (Calbet et al., 2014; Feng et al., 2009). Geographic location and season also play an important role in structuring the community and its response in terms of biomass to elevated temperature and pCO2. (Li et al., 2009; Morán et al., 2010). This may explain part of the variability in responses observed from studies on phytoplankton during different seasons and provinces.
4.3 Carbon : nitrogen
In agreement with others, the results of this experiment showed highest increases in C : N under elevated pCO2 alone (Riebesell et al., 2007). C : N also increased under high temperature, consistent with the findings of Lomas and Glibert (1999) and Taucher et al. (2015). It also increased when pCO2 and temperature were elevated, albeit to a lesser degree, which was also observed by Calbet et al. (2014), but contrasts other studies that have observed C : N being unaffected by the combined influence of elevated pCO2 and temperature (Deppeler and Davidson, 2017; Kim et al., 2006; Paul et al., 2015). C : N is a strong indicator of cellular protein content (Woods and Harrison, 2003) and increases under elevated pCO2 and warming may lead to lowered nutritional value of phytoplankton which has implications for zooplankton reproduction and the biogeochemical cycling of nutrients.
4.4 Photosynthetic carbon fixation rates
At T36, under elevated pCO2, was > 6 times higher than in the control, but only one time point was measured, so we are not able to make decisive conclusions. Riebesell et al. (2007) and Tortell et al. (2008) also reported an increase in under elevated pCO2. By contrast other observations on natural populations under elevated pCO2 reported a reduction in (Feng et al., 2009; Hare et al., 2007). Studies on laboratory cultures have shown that increases in temperature cause an increase in photosynthetic rates (Feng et al., 2008; Fu et al., 2007; Hutchins et al., 2007), similar to what we observed in this study. In the combined pCO2 and temperature treatment, we found no effect on , which has also been observed in experiments on natural populations (Coello-Camba and Agustí, 2016; Gao et al., 2017). This contrasts the findings of Feng et al. (2009) and Hare et al. (2007) who observed the highest when temperature and pCO2 were elevated simultaneously. In this study, increases in αB and Ek under elevated pCO2 and a decrease in these parameters when elevated pCO2 and temperature were combined also contrast the trends reported by Feng et al. (2009). However, we should stress that, while our photophysiological measurements support our observed trends in community biomass, they were made on a single occasion at the end of the experiment. Future experiments should focus on acquiring photophysiological measurements throughout.
Species-specific photosynthetic rates have been demonstrated to decrease beyond their thermal optimum (Raven and Geider, 1988), which can be modified through photoprotective rather than photosynthetic pigments (Kiefer and Mitchell, 1983). This may explain the difference in between the high-pCO2 and high-temperature treatments (in addition to differences in nanophytoplankton community composition in relation to Phaeocystis spp. discussed above), as the experimental high-temperature treatment in this study was ∼ 4.5 ∘C higher than the control.
There was no significant effect of combined elevated pCO2 and temperature on , which was strongly influenced by taxonomic differences between the experimental treatments. Warming has been shown to lead to smaller cell sizes in nanophytoplankton (Atkinson et al., 2003; Peter and Sommer, 2012), which was observed in the combined treatment together with decreased nanophytoplankton biomass. Diatoms also shifted to smaller species with reduced biomass, while dinoflagellate and Synechococcus biomass increased at T36. Dinoflagellates are the only photoautotrophs with form II RuBisCO (Morse et al., 1995), which has the lowest carboxylation : oxygenation specificity factor among eukaryotic phytoplankton (Badger et al., 1998), which may give dinoflagellates a disadvantage in carbon fixation under present ambient pCO2 levels. Phytoplankton growth rates are generally slower in surface waters with high pH (≥ 9) resulting from photosynthetic removal of CO2 by previous blooms and the associated nutrient depletion (Hansen, 2002; Hinga, 2002). Though growth under high pH provides indirect evidence that dinoflagellates possess carbon concentrating mechanisms (CCMs), direct evidence is limited and points to the efficiency of CCMs in dinoflagellates as moderate in comparison to diatoms and some haptophytes (Reinfelder, 2011, and references therein). Given that dinoflagellates accounted for just ∼ 20 % of biomass in the combination treatment, exerting a minor influence on community photosynthetic rates, further work is required to explain the lower under the combined influence of elevated pCO2 and temperature compared to the individual treatment influences. We applied the same electron requirement parameter for carbon uptake across all treatments, though in nature and between species there can be considerable variation in this parameter (e.g. 1.15 to 54.2 ; Lawrenz et al., 2013), which can co-vary with temperature, nutrients, Chl a, irradiance and community structure. Better measurement techniques at quantifying this variability are necessary in the future.
4.5 Community composition
Phytoplankton community structure changes were observed, with a shift from dinoflagellates to nanophytoplankton which was most pronounced under single treatments of elevated temperature and pCO2. Amongst the nanophytoplankton, a distinct size shift to smaller cells was observed in the high-temperature and combination treatments, while in the high-pCO2 treatment Phaeocystis spp. dominated. Under combined pCO2 and temperature from T24 onwards, however, dinoflagellate and Synechococcus biomass increased and nanophytoplankton biomass decreased. An increase in pico- and nanophytoplankton has previously been reported in natural communities under elevated pCO2 (Bermúdez et al., 2016; Boras et al., 2016; Brussaard et al., 2013; Engel et al., 2008) while no effect on these size classes has been observed in other studies (Calbet et al., 2014; Paulino et al., 2007). Moustaka-Gouni et al. (2016) also found no CO2 effect on natural nanophytoplankton communities but increased temperature reduced the biomass of this group. Kim et al. (2006) observed a shift from nanophytoplankton to diatoms under elevated pCO2 alone while a shift from diatoms to nanophytoplankton under combined elevated pCO2 and temperature has been reported (Hare et al., 2007). A variable response in Phaeocystis spp. to elevated pCO2 has also been reported with increased growth (Chen et al., 2014; Keys et al., 2017), no effect (Thoisen et al., 2015) and decreased growth (Hoogstraten et al., 2012) observed. Phaeocystis spp. can outcompete other phytoplankton and form massive blooms (up to 10 g C m−3) with impacts on food webs, global biogeochemical cycles and climate regulation (Schoemann et al., 2005). While not a toxic algal species, Phaeocystis spp. are considered a harmful algal bloom (HAB) species when biomass reaches sufficient concentrations to cause anoxia through the production of mucus foam which can clog the feeding apparatus of zooplankton and fish (Eilertsen and Raa, 1995).
Recently published studies on the response of diatoms to elevated pCO2 and temperature vary greatly. For example, Taucher et al. (2015) showed that Thalassiosira weissflogii incubated at 1000 µatm pCO2 increased growth by 8 % while for Dactyliosolen fragilissimus, growth increased by 39 %; temperature elevated by +5 ∘C also had a stimulating effect on T. weissflogii but inhibited the growth rate of D. fragilissimus; and when the treatments were combined growth was enhanced in T. weissflogii but reduced in D. fragilissimus. In our study, elevated pCO2 increased biomass in diatoms (time dependent), but elevated temperature and the combination of these factors reduced the signal of this response. A distinct size shift in diatom species was observed in all treatments, from the larger Coscinodiscus spp., Pleurosigma and Thalassiosira subtilis to the smaller Navicula distans. This was most pronounced in the combination treatment where N. distans formed 89 % of diatom biomass. Navicula spp. previously exhibited a differential response to both elevated temperature and pCO2. At +4.5 ∘C and 960 ppm CO2 Torstensson et al. (2012) observed no synergistic effects on the benthic Navicula directa. Elevated temperature increased growth rates by 43 % while a reduction of 5 % was observed under elevated CO2. No effects on growth were detected at pH ranging from 8 to 7.4 units in Navicula spp. (Thoisen et al., 2015), while there was a significant increase in growth in N. distans along a CO2 gradient at a shallow cold-water vent system (Baragi et al., 2015).
Synechococcus grown under pCO2 elevated to 750 ppm and temperature elevated by 4 ∘C resulted in increased growth and a 4-fold increase in (Fu et al., 2007) which is similar to the results of the present study.
The combination of elevated temperature and pCO2 significantly increased dinoflagellate biomass to 17 % of total biomass. This was due to P. cordatum, which increased biomass by more than 30-fold from T0 to T30 (66 % of dinoflagellate biomass in this treatment). Despite the global increase in the frequency of HABs few studies have focussed on the response of dinoflagellates to elevated pCO2 and temperature. In laboratory studies at 1000 ppm CO2, growth rates of the HAB species Karenia brevis increased by 46 %; at 1000 ppm CO2 and +5 ∘C temperature its growth increased by 30 % but was reduced under elevated temperature alone (Errera et al., 2014). A combined increase in pCO2 and temperature enhanced both the growth and in the dinoflagellate Heterosigma akashiwo, whereas in contrast to the present findings only pCO2 alone enhanced these parameters in P. cordatum (Fu et al., 2008).
Increased biomass, and a community shift to nanophytoplankton under individual increases in temperature and pCO2 suggest a potential negative feedback on atmospheric CO2, whereby more CO2 is removed from the ocean, and hence from the atmosphere through an increase in photosynthesis. The selection of Phaeocystis spp. under elevated pCO2 indicates the potential for negative impacts on ecosystem function and food web structure due to the formation of hypoxic zones which can occur under eutrophication, inhibitory feeding effects and lowered fecundity in many copepods associated with this species (Schoemann et al., 2005; Verity et al., 2007). While more CO2 is fixed, selection for nanophytoplankton in both of these treatments, however, may result in reduced carbon sequestration due to slower sinking rates of the smaller phytoplankton cells (Bopp et al., 2001; Laws et al., 2000). When temperature and pCO2 were elevated simultaneously, community biomass showed little response and no effects on were observed. This suggests no change in feedback to atmospheric CO2 and climate warming in future warmer high-CO2 oceans. Additionally, combined elevated pCO2 and temperature significantly modified taxonomic composition, by reducing diatom biomass relative to the control with an increase in dinoflagellate biomass dominated by the HAB species, P. cordatum. This has implications for fisheries, ecosystem function and human health.
These experimental results provide new evidence that increases in pCO2 coupled with rising sea temperatures may have antagonistic effects on the autumn phytoplankton community in the WEC. Under future global change scenarios, the size range and biomass of diatoms may be reduced with increased dinoflagellate biomass and the selection of HAB species. The experimental simulations of year 2100 temperature and pCO2 demonstrate that the effects of warming can be offset by elevated pCO2, maintaining current levels of coastal phytoplankton productivity while significantly altering the community structure, and in turn these shifts will have consequences on carbon biogeochemical cycling in the WEC.
Data are available on request. Please contact the corresponding author: ghti@pml.ac.uk.
The supplement related to this article is available online at: https://doi.org/10.5194/bg-15-3203-2018-supplement.
MK collected, measured, processed and analysed the data and prepared the figures. GT and HSF sought the necessary funds to support the research and conceived and directed the project. MK and GT wrote the paper with input from CEW and TL. CEW supervised and advised on phytoplankton taxonomic classifications.
The authors declare that they have no conflict of interest.
Gavin Tilstone, Helen S. Findlay and Claire E. Widdicombe were supported by the UK Natural Environment
Research Council's (NERC) National Capability – the Western Channel Observatory (WCO).
Claire E. Widdicombe was also partly funded by the NERC and Department
for Environment, Food and Rural Affairs, Marine Ecosystems Research Program
(grant no. NE/L003279/1). Matthew Keys was supported by a NERC PhD studentship
(grant no. NE/L50189X/1). We thank Glen Tarran for his training, help and
assistance with flow cytometry, the National Earth Observation Data Archive
and Analysis Service UK (NEODAAS) for providing the MODIS image used in Fig. 1
and the crew of RV Plymouth Quest for their helpful assistance during
field sampling.
Edited by: Emilio Marañón
Reviewed by: two anonymous referees
Alley, D., Berntsen, T., Bindoff, N. L., Chen, Z. L., Chidthaisong, A., Friedlingstein, P., Gregory, J. G. H., Heimann, M., Hewitson, B., Hoskins, B., Joos, F., Jouzel., Kattsov, V., Lohmann, U., Manning, M., Matsuno, T., Molina, M., Nicholls, N., Overpeck, J., Qin, D. H., Raga, G. Ramaswamy, V., Ren, J. W., Rusticucci, M., Solomon, S., Somerville, R., Stocker, T. F., Stott, P., Stouffer, R. J., Whetton, P., Wood, R. A., and Wratt, D.: Climate Change 2007. The Physical Science basis: Summary for policymakers. Contribution of Working Group I to the Fourth Assessment Report of the Intergovernmental Panel on Climate Change, 2007.
Atkinson, D., Ciotti, B. J., and Montagnes, D. J. S.: Protists decrease in size linearly with temperature: ca. 2.5 % C-1, Proc. R. Soc. B. Biol. Sci., 270, 2605–2611, https://doi.org/10.1098/rspb.2003.2538, 2003.
Badger, M. R., Andrews, T. J., Whitney, S. M., Ludwig, M., Yellowlees, D. C., Leggat, W., and Price, G. D.: The diversity and coevolution of Rubisco , plastids , pyrenoids , and chloroplast-based CO2-concentrating mechanisms in algae 1, Can. J. Bot., 76, 1052–1071, 1998.
Baragi, L. V., Khandeparker, L., and Anil, A. C.: Influence of elevated temperature and pCO2 on the marine periphytic diatom Navicula distans and its associated organisms in culture, Hydrobiologia, 762, 127–142, https://doi.org/10.1007/s10750-015-2343-9, 2015.
Barnes, M. K., Tilstone, G. H., Smyth, T. J., Widdicombe, C. E., Gloël, J., Robinson, C., Kaiser, J., and Suggett, D. J.: Drivers and effects of Karenia mikimotoi blooms in the western English Channel, Prog. Oceanogr., 137, 456–469, https://doi.org/10.1016/j.pocean.2015.04.018, 2015.
Beardall, J., Stojkovic., S., and Larsen, S.: Living in a high CO2 world: impacts of global climate change on marine phytoplankton, Plant Ecol. Divers., 2, 191–205, https://doi.org/10.1080/17550870903271363, 2009.
Bermúdez, J. R., Riebesell, U., Larsen, A., and Winder, M.: Ocean acidification reduces transfer of essential biomolecules in a natural plankton community, Sci. Rep., 6, 27749, https://doi.org/10.1038/srep27749, 2016.
Booth, B. C.: Size classes and major taxonomic groups of phytoplankton at two locations in the subarctic pacific ocean in May and August, 1984, Mar. Biol., 97, 275–286, https://doi.org/10.1007/BF00391313, 1988.
Bopp, L., Monfray, P., Aumont, O., Dufresne, J.-L., Le Treut, H., Madec, G., Terray, L. and Orr, J. C.: Potential impact of climate change on marine export production, Global Biogeochem. Cy., 15, 81–99, https://doi.org/10.1029/1999GB001256, 2001.
Boras, J. A., Borrull, E., Cardelu, C., Cros, L., Gomes, A., Sala, M. M., Aparicio, F. L., Balague, V., Mestre, M., Movilla, J., Sarmento, H., Va, E., and Lo, A.: Contrasting effects of ocean acidification on the microbial food web under different trophic conditions, ICES J. Mar. Sci., 73, 670–679, 2016.
Boyd, P. W. and Doney, S. C.: Modelling regional responses by marine pelagic ecosystems to global climate change, Geophys. Res. Lett., 29, 1–4, 2002.
Boyd, P. W., Rynearson, T. A., Armstrong, E. A., Fu, F., Hayashi, K., Hu, Z., Hutchins, D. A., Kudela, R. M., Litchman, E., Mulholland, M. R., Passow, U., Strzepek, R. F., Whittaker, K. A., Yu, E., and Thomas, M. K.: Marine Phytoplankton Temperature versus Growth Responses from Polar to Tropical Waters – Outcome of a Scientific Community-Wide Study, PLoS One, 8, https://doi.org/10.1371/journal.pone.0063091, 2013.
Brussaard, C. P. D., Noordeloos, A. A. M., Witte, H., Collenteur, M. C. J., Schulz, K., Ludwig, A., and Riebesell, U.: Arctic microbial community dynamics influenced by elevated CO2 levels, Biogeosciences, 10, 719–731, https://doi.org/10.5194/bg-10-719-2013, 2013.
Calbet, A., Sazhin, A. F., Nejstgaard, J. C., Berger, S. A., Tait, Z. S., Olmos, L., Sousoni, D., Isari, S., Martínez, R. A., Bouquet, J.-M., Thompson, E. M., Båmstedt, U., and Jakobsen, H. H.: Future climate scenarios for a coastal productive planktonic food web resulting in microplankton phenology changes and decreased trophic transfer efficiency, PLoS One, 9, e94388, https://doi.org/10.1371/journal.pone.0094388, 2014.
Chen, S., Beardall, J., and Gao, K.: A red tide alga grown under ocean acidification upregulates its tolerance to lower pH by increasing its photophysiological functions, Biogeosciences, 11, 4829–4837, https://doi.org/10.5194/bg-11-4829-2014, 2014.
Coello-Camba, A. and Agustí, S.: Acidification counteracts negative effects of warming on diatom silicification, Biogeosciences Discuss., https://doi.org/10.5194/bg-2016-424, 2016.
Coello-Camba, A., Agustã, S., Holding, J., Arrieta, J. M., and Duarte, C. M.: Interactive effect of temperature and CO2 increase in Arctic phytoplankton, Front. Mar. Sci., 1, 1–10, https://doi.org/10.3389/fmars.2014.00049, 2014.
Delille, B., Harlay, J., Zondervan, I., Jacquet, S., Chou, L., Wollast, R., Bellerby, R. G. J., Frankignoulle, M., Borges, A. V., Riebesell, U., and Gattuso, J.-P.: Response of primary production and calcification to changes of pCO2 during experimental blooms of the coccolithophorid Emiliania huxleyi, Global Biogeochem. Cy., 19, GB2023, https://doi.org/10.1029/2004GB002318, 2005.
Deppeler, S. L. and Davidson, A. T.: Southern Ocean Phytoplankton in a Changing Climate, Front. Mar. Sci., 4, 40, https://doi.org/10.3389/fmars.2017.00040, 2017.
Dickson, A. G. and Millero, F. J.: A comparison of the equilibrium constants for the dissociation of carbonic acid in seawater media, Deep-Sea Res. Pt. I, 34, 1733–1743, 1987.
Dunne, J. P.: A roadmap on ecosystem change, Nat. Clim. Change, 5, 20, https://doi.org/10.1038/nclimate2480, 2014.
Edwards, M., Johns, D., Leterme, S. C., Svendsen, E., and Richardson, A. J.: Regional climate change and harmful algal blooms in the northeast Atlantic, Limnol. Oceanogr., 51, 820–829, https://doi.org/10.4319/lo.2006.51.2.0820, 2006.
Eilertsen, H. and Raa, J.: Toxins in seawater produced by a common phytoplankter?: Phaeocystis pouchetii, J. Mar. Biotechnol., 3, 115–119, 1995.
Engel, A., Schulz, K. G., Riebesell, U., Bellerby, R., Delille, B., and Schartau, M.: Effects of CO2 on particle size distribution and phytoplankton abundance during a mesocosm bloom experiment (PeECE II), Biogeosciences, 5, 509–521, https://doi.org/10.5194/bg-5-509-2008, 2008.
Eppley, R. W.: Temperature and phytoplankton growth in the sea, Fish. Bull., 70, 1063–1085, 1972.
Errera, R. M., Yvon-Lewis, S., Kessler, J. D., and Campbell, L.: Reponses of the dinoflagellate Karenia brevis to climate change: pCO2 and sea surface temperatures, Harmful Algae, 37, 110–116, https://doi.org/10.1016/j.hal.2014.05.012, 2014.
Feng, Y., Warner, M. E., Zhang, Y., Sun, J., Fu, F.-X., Rose, J. M., and Hutchins, D. A.: Interactive effects of increased pCO2 , temperature and irradiance on the marine coccolithophore Emiliania huxleyi (Prymnesiophyceae), Eur. J. Phycol., 43, 87–98, https://doi.org/10.1080/09670260701664674, 2008.
Feng, Y., Hare, C., Leblanc, K., Rose, J., Zhang, Y., DiTullio, G., Lee, P., Wilhelm, S., Rowe, J., Sun, J., Nemcek, N., Gueguen, C., Passow, U., Benner, I., Brown, C., and Hutchins, D.: Effects of increased pCO2 and temperature on the North Atlantic spring bloom. I. The phytoplankton community and biogeochemical response, Mar. Ecol. Prog. Ser., 388, 13–25, https://doi.org/10.3354/meps08133, 2009.
Fu, F.-X., Warner, M. E., Zhang, Y., Feng, Y., and Hutchins, D. A.: Effects of Increased Temperature and CO2 on Photosynthesis, Growth, and Elemental Ratios in Marine Synechococcus and Prochlorococcus (Cyanobacteria), J. Phycol., 43, 485–496, https://doi.org/10.1111/j.1529-8817.2007.00355.x, 2007.
Fu, F.-X., Zhang, Y., Warner, M. E., Feng, Y., Sun, J., and Hutchins, D. A.: A comparison of future increased CO2 and temperature effects on sympatric Heterosigma akashiwo and Prorocentrum minimum, Harmful Algae, 7, 76–90, https://doi.org/10.1016/j.hal.2007.05.006, 2008.
Gao, G., Jin, P., Liu, N., Li, F., Tong, S., Hutchins, D. A., and Gao, K.: The acclimation process of phytoplankton biomass, carbon fixation and respiration to the combined effects of elevated temperature and pCO2 in the northern South China Sea, Mar. Pollut. Bull., 118, 213–220, https://doi.org/10.1016/j.marpolbul.2017.02.063, 2017.
Giordano, M., Beardall, J., and Raven, J. A.: CO2 concentrating mechanisms in algae: mechanisms, environmental modulation, and evolution., Annu. Rev. Plant Biol., 56, 99–131, https://doi.org/10.1146/annurev.arplant.56.032604.144052, 2005.
Goldman, J. and Carpenter, E.: A kinetic approach to the effect of temperature on algal growth, Limnol. Oceanogr., 19, 756–766, https://doi.org/10.4319/lo.1974.19.5.0756, 1974.
Hansen, P.: Effect of high pH on the growth and survival of marine phytoplankton: implications for species succession, Aquat. Microb. Ecol., 28, 279–288, https://doi.org/10.3354/ame028279, 2002.
Hare, C., Leblanc, K., DiTullio, G., Kudela, R., Zhang, Y., Lee, P., Riseman, S., and Hutchins, D.: Consequences of increased temperature and CO2 for phytoplankton community structure in the Bering Sea, Mar. Ecol. Prog. Ser., 352, 9–16, https://doi.org/10.3354/meps07182, 2007.
Hinga, K. R.: Effects of pH on coastal marine phytoplankton, Mar. Ecol. Prog. Ser., 238, 281–300, 2002.
Hoogstraten, A., Peters, M., Timmermans, K. R., and de Baar, H. J. W.: Combined effects of inorganic carbon and light on Phaeocystis globosa Scherffel (Prymnesiophyceae), Biogeosciences, 9, 1885–1896, https://doi.org/10.5194/bg-9-1885-2012, 2012.
Hutchins, D. A., Fu, F.-X., Zhang, Y., Warner, M. E., Feng, Y., Portune, K., Bernhardt, P. W., and Mulholland, M. R.: CO2 control of Trichodesmium N2 fixation, photosynthesis, growth rates, and elemental ratios: Implications for past, present, and future ocean biogeochemistry, Limnol. Oceanogr., 52, 1293–1304, https://doi.org/10.4319/lo.2007.52.4.1293, 2007.
IPCC: Climate Change 2013: The Physical Science Basis. Contribution of Working Group I to the Fifth Assessment Report of the Intergovernmental Panel on Climate Change, Intergov. Panel Clim. Chang. Work. Gr. I Contrib. to IPCC Fifth Assess. Rep. (AR5), Cambridge Univ Press. New York, 1535, https://doi.org/10.1029/2000JD000115, 2013.
IPCC: Climate Change 2014 Synthesis Report Summary Chapter for Policymakers, IPCC, 31, https://doi.org/10.1017/CBO9781107415324, 2014.
Keys, M.: Effects of future CO2 and temperature regimes on phytoplankton community composition, biomass and photosynthetic rates in the Western English Channel, PhD thesis, University of Essex, UK, 2017.
Keys, M., Tilstone, G., Findlay, H. S., Widdicombe, C. E., and Lawson, T.: Effects of elevated CO2 on phytoplankton community biomass and species composition during a spring Phaeocystis spp. bloom in the western English Channel, Harmful Algae, 67, 92–106, https://doi.org/10.1016/j.hal.2017.06.005, 2017.
Kiefer, D. A. and Mitchell, B. G.: A simple steady state description of phytoplankton growth based on absorption cross section and quantum efficiency, Limnol. Oceanogr., 28, 770–776, https://doi.org/10.4319/lo.1983.28.4.0770, 1983.
Kim, J.-M., Lee, K., Shin, K., Kang, J.-H., Lee, H.-W., Kim, M., Jang, P.-G., and Jang, M.-C.: The effect of seawater CO2 concentration on growth of a natural phytoplankton assemblage in a controlled mesocosm experiment, Limnol. Oceanogr., 51, 1629–1636, https://doi.org/10.4319/lo.2006.51.4.1629, 2006.
Kitidis, V., Hardman-mountford, N. J., Litt, E., Brown, I., Cummings, D., Hartman, S., Hydes, D., Fishwick, J. R., Harris, C., Martinez-vicente, V., Woodward, E. M. S., and Smyth, T. J.: Seasonal dynamics of the carbonate system in the Western English Channel, Cont. Shelf Res., 42, 2–12, 2012.
Kolber, Z. S., Prášil, O., and Falkowski, P. G.: Measurements of variable chlorophyll fluorescence using fast repetition rate techniques: Defining methodology and experimental protocols, Biochim. Biophys. Acta-Bioenerg., 1367, 88–106, https://doi.org/10.1016/S0005-2728(98)00135-2, 1998.
Kovala, P. E. and Larrance, J. D.: Computation of phytoplankton cell numbers, cell volume, cell surface and plasma volume per liter, from microscopical counts, Special report, University of Washington, Department of Oceanography, 38, 1966.
Lawrenz, E., Silsbe, G., Capuzzo, E., Ylöstalo, P., Forster, R. M., Simis, S. G. H., Prášil, O., Kromkamp, J. C., Hickman, A. E., Moore, C. M., Forget, M. H., Geider, R. J., and Suggett, D. J.: Predicting the Electron Requirement for Carbon Fixation in Seas and Oceans, PLoS One, 8, e58137, https://doi.org/10.1371/journal.pone.0058137, 2013.
Laws, E. A., Falkowski, P. G., Smith, W. O., Ducklow, H. W., and McCarthy, J. J.: Temperature effects on export production in the open ocean, Global Biogeochem. Cy., 14, 1231–1246, https://doi.org/10.1029/1999GB001229, 2000.
Li, W. K. W., McLaughlin, F. A., Lovejoy, C., and Carmack, E. C.: Smallest Algae Thrive As the Arctic Ocean Freshens, Science, 326, 539–539, https://doi.org/10.1126/science.1179798, 2009.
Lomas, M. W. and Glibert, P. M.: Interactions between and uptake and assimilation: Comparison of diatoms and dinoflagellates at several growth temperatures, Mar. Biol., 133, 541–551, https://doi.org/10.1007/s002270050494, 1999.
Love, B. A., Olson, M. B., and Wuori, T.: Technical Note: A minimally invasive experimental system for pCO2 manipulation in plankton cultures using passive gas exchange (atmospheric carbon control simulator), Biogeosciences, 14, 2675–2684, https://doi.org/10.5194/bg-14-2675-2017, 2017.
Matear, R. J. and Lenton, A.: Carbon–climate feedbacks accelerate ocean acidification, Biogeosciences, 15, 1721–1732, https://doi.org/10.5194/bg-15-1721-2018, 2018.
Maugendre, L., Gattuso, J. P., Poulton, A. J., Dellisanti, W., Gaubert, M., Guieu, C., and Gazeau, F.: No detectable effect of ocean acidification on plankton metabolism in the NW oligotrophic Mediterranean Sea: Results from two mesocosm studies, Estuar. Coast. Shelf Sci., 186, 89–99, https://doi.org/10.1016/j.ecss.2015.03.009, 2017.
Mehrbach, C., Culberson, C. H., Hawley, J. E., and Pytkowicz, R. M.: Measurement of the Apparent Dissociation Constants of Carbonic Acid in Seawater at Atmospheric Pressure, Limnol. Oceanogr., 18, 897–907, 1973.
Menden-Deuer, S. and Lessard, E. J.: Carbon to volume relationships for dinoflagellates, diatoms, and other protist plankton, Limnol. Oceanogr., 45, 569–579, https://doi.org/10.4319/lo.2000.45.3.0569, 2000.
Morán, X. A. G., López-Urrutia, Á., Calvo-Díaz, A., and Li, W. K. W.: Increasing importance of small phytoplankton in a warmer ocean, Glob. Change Biol., 16, 1137–1144, https://doi.org/10.1111/j.1365-2486.2009.01960.x, 2010.
Morse, D., Salois, P., Markovic, P., and Hastings, J. W.: A nuclear-encoded form II RuBisCO in dinoflagellates, Science, 268, 1622–1624, https://doi.org/10.1126/science.7777861, 1995.
Moustaka-Gouni, M., Kormas, K. A., Scotti, M., Vardaka, E., and Sommer, U.: Warming and Acidification Effects on Planktonic Heterotrophic Pico- and Nanoflagellates in a Mesocosm Experiment, Protist, 167, 389–410, https://doi.org/10.1016/j.protis.2016.06.004, 2016.
Oxborough, K., Moore, C. M., Suggett, D. J., Lawson, T., Chan, H. G., and Geider, R. J.: Direct estimation of functional PSII reaction center concentration and PSII electron flux on a volume basis: a new approach to the analysis of Fast Repetition Rate fluorometry (FRRf) data, Limnol. Oceanogr.-Methods, 10, 142–154, https://doi.org/10.4319/lom.2012.10.142, 2012.
Paul, C., Matthiessen, B., and Sommer, U.: Warming, but not enhanced CO2 concentration, quantitatively and qualitatively affects phytoplankton biomass, Mar. Ecol. Prog. Ser., 528, 39–51, https://doi.org/10.3354/meps11264, 2015.
Paulino, A. I., Egge, J. K., and Larsen, A.: Effects of increased atmospheric CO2 on small and intermediate sized osmotrophs during a nutrient induced phytoplankton bloom, Biogeosciences, 5, 739–748, https://doi.org/10.5194/bg-5-739-2008, 2008.
Peter, K. H. and Sommer, U.: Phytoplankton Cell Size: Intra- and Interspecific Effects of Warming and Grazing, PLoS One, 7, e49632, https://doi.org/10.1371/journal.pone.0049632, 2012.
Pierrot, D., Lewis, E., and Wallace, D. W. R.: MS Excel program developed for CO2 system calculations, ORNL/CDIAC-105a, Carbon Dioxide Inf. Anal. Center, Oak Ridge Natl. Lab. US Dep. Energy, Oak Ridge, Tennessee, 2006.
Raupach, M. R., Marland, G., Ciais, P., Le Quéré, C., Canadell, J. G., Klepper, G., and Field, C. B.: Global and regional drivers of accelerating CO2 emissions, P. Natl. Acad. Sci. USA, 104, 10288–10293, https://doi.org/10.1073/pnas.0700609104, 2007.
Raven, J. A. and Geider, R. J.: Temperature and algal growth, New Phytol., 110, 441–461, https://doi.org/10.1111/j.1469-8137.1988.tb00282.x, 1988.
Raven, J., Caldeira, K., Elderfield, H., Hoegh-Guldberg, O., Liss, P., Riebesell, U., Shepherd, J., Turley, C., and Watson, A.: Ocean acidification due to increasing atmospheric carbon dioxide, R. Soc., London, UK, 68 pp., ISBN 0-85403-617-2, 2005.
R Core Team: R: A language and environment for statistical computing, R Foundation for Statistical Computing, Vienna, Austria, available at: https://www.R-project.org/ (last access: 28 May 2018), 2016.
Reinfelder, J. R.: Carbon Concentrating Mechanisms in Eukaryotic Marine Phytoplankton, Ann. Rev. Mar. Sci., 3, 291–315, https://doi.org/10.1146/annurev-marine-120709-142720, 2011.
Riebesell, U.: Effects of CO2 Enrichment on Marine Phytoplankton, J. Oceanogr., 60, 719–729, https://doi.org/10.1007/s10872-004-5764-z, 2004.
Riebesell, U., Schulz, K. G., Bellerby, R. G. J., Botros, M., Fritsche, P., Meyerhöfer, M., Neill, C., Nondal, G., Oschlies, A., Wohlers, J., and Zöllner, E.: Enhanced biological carbon consumption in a high CO2 ocean, Nature, 450, 545–548, https://doi.org/10.1038/nature06267, 2007.
Riebesell, U., Fabry, V. J., Hansson, L., and Gattuso, J.-P.: Guide to best practices for ocean acidification, edited by: Hansson, L., Gattuso, J.-P., Riebesell, U., and Fabry, V. J., Publications Office Of The European Union, Luxembourg, 2010.
Rost, B., Riebesell, U., Burkhardt, S., and Su, D.: Carbon acquisition of bloom-forming marine phytoplankton, Limnol. Oceanogr., 48, 55–67, 2003.
Sathyendranath, S., Stuart, V., Nair, A., Oka, K., Nakane, T., Bouman, H., Forget, M. H., Maass, H., and Platt, T.: Carbon-to-chlorophyll ratio and growth rate of phytoplankton in the sea, Mar. Ecol. Prog. Ser., 383, 73–84, https://doi.org/10.3354/meps07998, 2009.
Savage, V. M., Gillooly, J. F., Brown, J. H., West, G. B., and Charnov, E. L.: Effects of Body Size and Temperature on Population Growth, Am. Nat., 163, 429–441, https://doi.org/10.1086/381872, 2004.
Schoemann, V., Becquevort, S., Stefels, J., Rousseau, V., and Lancelot, C.: Phaeocystis blooms in the global ocean and their controlling mechanisms: a review, J. Sea Res., 53, 43–66, https://doi.org/10.1016/j.seares.2004.01.008, 2005.
Schulz, K. G., Barcelos e Ramos, J., Zeebe, R. E., and Riebesell, U.: CO2 perturbation experiments: similarities and differences between dissolved inorganic carbon and total alkalinity manipulations, Biogeosciences, 6, 2145–2153, https://doi.org/10.5194/bg-6-2145-2009, 2009.
Shi, D., Xu, Y., and Morel, F. M. M.: Effects of the pH/pCO2 control method on medium chemistry and phytoplankton growth, Biogeosciences, 6, 1199–1207, https://doi.org/10.5194/bg-6-1199-2009, 2009.
Smetacek, V. and Cloern, J. E.: On Phytoplankton Trends, Science, 319, 1346–1348, 2008.
Smyth, T. J., Fishwick, J. R., AL-Moosawi, L., Cummings, D. G., Harris, C., Kitidis, V., Rees, A., Martinez-Vicente, V., and Woodward, E. M. S.: A broad spatio-temporal view of the Western English Channel observatory, J. Plankton Res., 32, 585–601, https://doi.org/10.1093/plankt/fbp128, 2010.
Strom, S.: Novel interactions between phytoplankton and microzooplankton?: their influence on the coupling between growth and grazing rates in the sea, Hydrobiologia, 480, 41–54, 2002.
Tarran, G. A., Heywood, J. L., and Zubkov, M. V.: Latitudinal changes in the standing stocks of nano- and picoeukaryotic phytoplankton in the Atlantic Ocean, Deep-Sea Res. Pt. II, 53, 1516–1529, https://doi.org/10.1016/j.dsr2.2006.05.004, 2006.
Taucher, J., Jones, J., James, A., Brzezinski, M. A., Carlson, C. A., Riebesell, U., and Passow, U.: Combined effects of CO2 and temperature on carbon uptake and partitioning by the marine diatoms Thalassiosira weissflogii and Dactyliosolen fragilissimus, Limnol. Oceanogr., 60, 901–919, https://doi.org/10.1002/lno.10063, 2015.
Thoisen, C., Riisgaard, K., Lundholm, N., Nielsen, T., and Hansen, P.: Effect of acidification on an Arctic phytoplankton community from Disko Bay, West Greenland, Mar. Ecol. Prog. Ser., 520, 21–34, https://doi.org/10.3354/meps11123, 2015.
Thomas, M. K., Kremer, C. T., Klausmeier, C. A., and Litchman, E.: A Global Pattern of Thermal Adaptation in Marine Phytoplankton, Science, 338, 1085–1088, https://doi.org/10.1126/science.1224836, 2012.
Torstensson, A., Chierici, M., and Wulff, A.: The influence of increased temperature and carbon dioxide levels on the benthic/sea ice diatom Navicula directa, Polar Biol., 35, 205–214, https://doi.org/10.1007/s00300-011-1056-4, 2012.
Tortell, P., DiTullio, G., Sigman, D., and Morel, F.: CO2 effects on taxonomic composition and nutrient utilization in an Equatorial Pacific phytoplankton assemblage, Mar. Ecol. Prog. Ser., 236, 37–43, https://doi.org/10.3354/meps236037, 2002.
Tortell, P. D., Payne, C. D., Li, Y., Trimborn, S., Rost, B., Smith, W. O., Riesselman, C., Dunbar, R. B., Sedwick, P., and DiTullio, G. R.: CO2 sensitivity of Southern Ocean phytoplankton, Geophys. Res. Lett., 35, L04605, https://doi.org/10.1029/2007GL032583, 2008.
Utermöhl, H.: Zur vervollkommnung der quantitativen phytoplankton-methodik, Mitt. int. Ver. Theor. Angew. Limnol., 9, 1–38, 1958.
Verity, P. G., Brussaard, C. P., Nejstgaard, J. C., Van Leeuwe, M. A., Lancelot, C., and Medlin, L. K.: Current understanding of Phaeocystis ecology and biogeochemistry, and perspectives for future research, edited by: van Leeuwe, M. A., Stefels, J., Belviso, S., Lancelot, C., Verity, P. G., and Gieskes, W. W. C., Springer, the Netherlands, 2007.
Webb, W. L., Newton, M., and Starr, D.: Carbon dioxide exchange of Alnus rubra, Oecologia, 17, 281–291, https://doi.org/10.1007/BF00345747, 1974.
Welschmeyer, N. A.: Fluorometric analysis of chlorophyll a in the presence of chlorophyll b and pheopigments, Limnol. Oceanogr., 39, 1985–1992, 1994.
Widdicombe, C. E., Eloire, D., Harbour, D., Harris, R. P., and Somerfield, P. J.: Long-term phytoplankton community dynamics in the Western English Channel, J. Plankton Res., 32, 643–655, https://doi.org/10.1093/plankt/fbp127, 2010.
Wolf-Gladrow, B. D. A., Riebesell, U. L. F., Burkhardt, S., and Jelle, B.: Direct effects of CO2 concentration on growth and isotopic composition of marine plankton, Tellus, 51B, 461–476, 1999.
Woods, H. A. and Harrison, J. F.: Temperature and the chemical composition of poikilothermic organisms, Funct. Ecol., 17, 237–245, 237–245, 2003.