the Creative Commons Attribution 4.0 License.
the Creative Commons Attribution 4.0 License.
 | 11 Jul 2018
The strategies of water–carbon regulation of plants in a subtropical primary forest on karst soils in China
Jing Wang
Xuefa Wen
Xinyu Zhang
Shenggong Li
Coexisting plant species in a karst ecosystem may use diverse strategies of trade off between carbon gain and water loss to adopt to the low soil nutrient and low water availability conditions. An understanding of the impact of CO2 diffusion and maximum carboxylase activity of Rubisco (Vcmax) on the light-saturated net photosynthesis (A) and intrinsic water use efficiency (iWUE) can provide insight into physiological strategies of the water–carbon regulation of coexisting plant species used in adaptation to karst environments at the leaf scale. We selected 63 dominant species (across 6 life forms) in a subtropical karst primary forest in southwestern China, measured their CO2 response curves, and calculated the corresponding stomatal conductance to CO2 (gs), mesophyll conductance to CO2 (gm), and Vcmax. The results showed that gs and gm varied about 7.6- and 34.5-fold, respectively, and that gs was positively related to gm. The contribution of gm to the leaf CO2 gradient was similar to that of gs. gs ∕ A, gm ∕ A and gt ∕ A was negatively related to Vcmax ∕ A. The relative limitations of gs (ls), gm (lm), and Vcmax (lb) to A for the whole group (combined six life forms) were significantly different from each other (P < 0.05). lm was the largest (0.38 ± 0.12), followed by lb (0.34 ± 0.14), and ls (0.28 ± 0.07). No significant difference was found between ls, lm, and lb for trees and tree/shrubs, while lm was the largest, followed by lb and ls for shrubs, grasses, vines and ferns (P < 0.05). iWUE varied about 3-fold (from 29.52 to 88.92 µmol CO2 mol−1 H2O) across all species, and was significantly correlated with gs, Vcmax, gm ∕ gs, and Vcmax ∕ gs. These results indicated that karst plants maintained relatively high A and low iWUE through the covariation of gs, gm, and Vcmax as an adaptation to a karst environment.
- Article
(1629 KB) - Full-text XML
- Companion paper
-
Supplement
(733 KB) - BibTeX
- EndNote


Diverse strategies of trade off between carbon gain and water loss are critical for the survival of coexisting plant species. In order to adapt to harsh environments, coexisting plant species develop distinct patterns of strategies for carbon–water regulation (light-saturated net photosynthesis (A) and intrinsic water use efficiency; iWUE) (Sullivan et al., 2017). iWUE is the ratio of A to stomatal conductance to H2O (gsw) (Moreno-Gutierrez et al., 2012). Plants with high iWUE are better able to adapt to nutrient- and water-limited environments (Flexas et al., 2016). Due to the greater hydraulic erosion and complex underground drainage network (Nie et al., 2014; Chen et al., 2015), karst soils cannot retain enough nutrients and water for plant growth even though precipitation is high (1000–2000 mm) (Liu et al., 2011; Fu et al., 2012; Chen et al., 2015). An understanding of the impact of CO2 diffusion and the maximum carboxylase activity of Rubisco (Vcmax) on A and iWUE in karst plants can provide insight into the physiological strategies of water–carbon regulation of plants used in adaptation to karst environments at the leaf scale. Until now, variability in A and iWUE has only been reported in 13 co-occurring trees and 12 vines (Chen et al., 2015), and 12 co-occurring tree species (Fu et al., 2012) in two tropical karst forests in southwestern China.
Based on Fick's first law, A has been shown to be only limited by leaf stomatal conductance to CO2 (gs= gsw/1.6) and Vcmax (Flexas et al., 2012; Buckley and Warren, 2014); originally, mesophyll conductance to CO2 (gm) was proposed to be infinite, i.e., CO2 concentration in chloroplast (Cc) was equal to the CO2 concentration in intercellular air space (Ci). However, gm varies greatly among species (Warren and Adams, 2006; Flexas et al., 2013). Recent studies have confirmed that A was jointly constrained by gs, gm, and Vcmax, and that their relative contribution to A was species-dependent and site-specific (Carriqui et al., 2015; Tosens et al., 2016; Galmes et al., 2017; Peguero-Pina et al., 2017a, b; Veromann-Jurgenson et al., 2017).
Variation in iWUE (=A ∕ gsw) depends on the relative changes in A (gs, gm, Vcmax) and gsw (gsw= 1.6 gs) (Flexas et al., 2013; Gago et al., 2014). Theoretical relationships between iWUE and gs, gm, and Vcmax have been deduced using two approaches. First, based on Fick's first law of CO2 diffusion, Flexas et al. (2013) deduced that iWUE was a function of gm ∕ gs and CO2 gradients (the ambient CO2 concentration (Ca)–the CO2 concentration at the sites of carboxylation (Cc)) within a leaf. And second, combining Fick's first law of CO2 diffusion and the Farquhar biochemical model (Farquhar and Sharkey, 1982), Flexas et al. (2016) deduced that iWUE was a function of Vcmax ∕ gs, Cc, CO2 compensation point of photosynthesis (Γ∗), and the effective Michaelis–Menten constant of Rubisco for CO2 (Km). Until now, most previous studies have focused on the role of CO2 diffusion in limiting iWUE, and have suggested that iWUE was negatively related to gs, and positively related to gm ∕ gs (Flexas et al., 2013). Gago et al. (2014) used a meta-analysis with 239 species, and were the first to confirm that iWUE was positively related to Vcmax ∕ gs. Although both gm ∕ gs and Vcmax ∕ gs were positively correlated with iWUE, there was only a weak correlation between gm ∕ gs and Vcmax ∕ gs, which indicates that iWUE can be improved by increasing Vcmax or gm (proportionally higher than gs), not both (Gago et al., 2014).
It is noteworthy that Flexas et al. (2016) and Gago et al. (2014) found that most of the previous work on constraints ofgs, gm, and Vcmax on A were conducted in crops or saplings, and only a few studies were in natural ecosystems. For example, gm was the main factor limiting A in two Antarctic vascular grasses (Saez et al., 2017), and in 35 Australian sclerophylls (Niinemets et al., 2009b) in different habitats. The A of two closely related Mediterranean Abies species growing in two different habitats was mainly constrained by gm in one, and by gs in the other habitat (Peguero-Pina et al., 2012). Beyond that, it still remains unknown how gs, gm, and Vcmax regulate A and iWUE across species in natural ecosystems.
In this study, we selected 63 dominant plant species, including 6 life forms (tree (n= 29), tree/shrub (n= 11), shrub (n= 11), grass (n= 11), vine (n= 5), and fern (n= 3)), from a subtropical primary forest in the “karst critical zone (karst CZ)” of southwestern China, and measured their A and CO2 response curves. gm was calculated using the curve-fitting method (Ethier and Livingston, 2004). The obtained gm was used to transform the A–Ci into A–Cc response curves, and then to calculate the A and Vcmax. Our objective was to determine and distinguish the limitations of CO2 diffusion (gs and gm) and Vcmax on A and iWUE in different life forms in this karst primary forest, and to understand the patterns of strategies for carbon–water regulation in karst plants.
2.1 Site information
This study was conducted in a subtropical primary forest (26∘14′48 N, 105∘45′51 E; elevation, 1460 m), located in the karst CZ of southwestern China. This region has a typical subtropical monsoon climate, with a mean annual precipitation of 1255 mm, and mean annual air temperature of 15.1 ∘C (Zeng et al., 2016). The soils are characterized by a high ratio of exposed rock, shallow and nonhomogeneous soil cover, and complex underground drainage networks, e.g., grooves, channels, and depressions (Chen et al., 2010; Zhang et al., 2011; Wen et al., 2016). Soils and soil water are easily leached into underground drainage networks. Soil texture is silt clay loam, and soil PH is 6.80 ± 0.16 (Chang et al., 2018). The total nitrogen and phosphorus content in soil is 7.30 ± 0.66 and 1.18 ± 0.35 g Kg−1, respectively, which was similar with that of non-karst CZs (Wang et al., 2018). However, the soil quantities (16.04–61.89 Kg m−2) and nitrogen and phosphorus storage (12.04 and 1.68 t hm−2) is much lower than that of non-karst CZs, due to the thin and heterogeneous soil layer (Jobbagy and Jackson, 2000; He et al., 2008; Li et al., 2007; Lu et al., 2010). The typical vegetation type is mixed evergreen and broadleaf deciduous primary forest, dominated by Itea yunnanensis Franch., Carpinus pubescens Burk., and Lithocarpus confinis Huang., etc. (Wang et al., 2018).
2.2 Leaf gas-exchange measurements
In July and August 2016, 63 species (Table S1 in the Supplement) were selected for measurements of the A and CO2 response curves. The species sampled were selected according to their abundance in the study site. They are the main components of this forest, including 55 woody species (46 deciduous and 10 evergreen species) and 5 herb species. To distinguish the strategies of water–carbon regulation of plants among different life forms, the species were grouped into 6 life forms, including (1) tree (n= 29), (2) tree/shrub (n= 11), (3) shrub (n= 11), (4) grass (n= 11), (5) vine (n= 5), and (6) fern (n= 3). “Tree/shrub” is a kind of low wood plant between tree and shrub. Ferns grow in the understory; vines climb up to the shrub canopy to get light.
Details of leaf sampling and measurements of the CO2 response curve are briefly described as follows. Branches exposed to the sun were excised from the upper part of the crown (trees, tree/shrubs, shrubs and vines) or aboveground portion (grasses, ferns), and immediately recut under water to maintain xylem water continuity. Back in the laboratory, branches and aboveground portions were kept at 25 ∘C for 30 min. Fully expanded and mature leaves were induced for 30 min at a saturating light density (1500 µmol m−2 s−1). CO2 response curve measurements were performed when A andgs was stable. Three leaves per species were collected and measured. A total of 189 leaves were collected from adult individuals of 63 species.
The CO2 response curves were measured with 11 CO2 concentration gradients in the chamber following the procedural guidelines described by Long and Bernacchi (2003). The photosynthetic photon flux density was 1500 µmol m−2 s−1. The leaf temperature was 25 ∘C, controlled by the block temperature. The humidity in the leaf chamber was maintained at ambient conditions. Leaf area, thickness (LT), and dry mass were measured after the CO2 response measurements. Leaf mass per area (LMA) was calculated by dividing the corresponding dry mass by leaf area. Finally, leaf density (LD) was calculated by dividing the corresponding LMA by LT. More details are given in Wang et al. (2018).
2.3 Response curve analyses
A and the corresponding gsw (gs=gsw/1.6), Ca, and Ci were extracted from the CO2 response curve under saturating light (1500 µmol m−2 s−1) conditions, with the CO2 concentration inside the cuvette set to 400 µmol mol−1 (Domingues et al., 2010). Vcmax was estimated by fitting A–Cc curves (Ethier and Livingston, 2004). The obtained values of gm were used to transform the A–Ci into A–Cc response curves as Cc=Ci–A ∕ gm.
Three methods are most commonly used for gm estimation. Those methods have been reviewed by Warren (2006) and Pons et al. (2009). Briefly, gm can be calculated by the stable isotope method (Evans, 1983; Sharkey et al., 1991; Loreto et al., 1992), the J method (Bongi and Loreto, 1989; Dimarco et al., 1990; Harley et al., 1992; Epron et al., 1995; Laisk et al., 2005), and the “curve-fitting” method (Ethier and Livingston, 2004; Sharkey et al., 2007). All of these methods are based on gas-exchange measurements (Pons et al., 2009), and some common assumptions (Warren, 2006). Thus, the accuracy of each method is unknown to some extent (Warren, 2006).
gm was estimated by the “curve-fitting” method in this study. Although the “curve-fitting” method is less precise than the stable isotope method, it is much more readily available and has been used for several decades (Warren, 2006; Sharkey, 2012). Accurate measurements of A and Ci are prerequisites for estimating gm using the “curve-fitting” method (Pons et al., 2009). Warren (2006) pointed out that highly accurate measurements require small leaf areas and low flow rates. We confirmed that the calculated Cc and the initial slope of the A–Cc curves were positive, suggesting that the measured gm was reliable (Warren, 2006).
2.4 Theory of trade-off between carbon and water at leaf scale
The exchange of H2O and CO2 between the leaf and the atmosphere is regulated by stomata (Gago et al., 2014). According to Fick's first law of diffusion, A and gs are related as follows:
where A is the photosynthetic rate (µmol CO2 m−2 s−1), Ca is the ambient CO2 concentration (µmol mol−1), and Ci is the intercellular CO2 concentration (µmol mol−1).
Mesophyll is the barrier for CO2 inside the leaf. A and mesophyll conductance to CO2 (gm) are related as follows:
where Cc is the CO2 concentration at the sites of carboxylation (µmol mol−1). Cc not only depends on CO2 supply by gm, but also on CO2 demand (the maximum carboxylase activity of Rubisco, Vcmax).
2.4.1 The relationship between iWUE and gm ∕ gs
iWUE is a function of CO2 diffusion conductances (e.g., gs and gm) and leaf CO2 concentration gradients. We can express A as the product of the total CO2 diffusion conductance (gt) from ambient air to chloroplasts, and the corresponding CO2 concentration gradients by combining Eq. (1) and (2) (Flexas et al., 2013):
where gt= 1/(1/gs+ 1/gm). This equation demonstrates that CO2 concentration gradients in leaves are constrained by stomatal and mesophyll resistance to CO2. Therefore, iWUE can be expressed as
Equation (4) means that iWUE is positively related to gm ∕ gs, but not to gm itself (Warren and Adams, 2006; Flexas et al., 2013; Buckley and Warren, 2014; Cano et al., 2014).
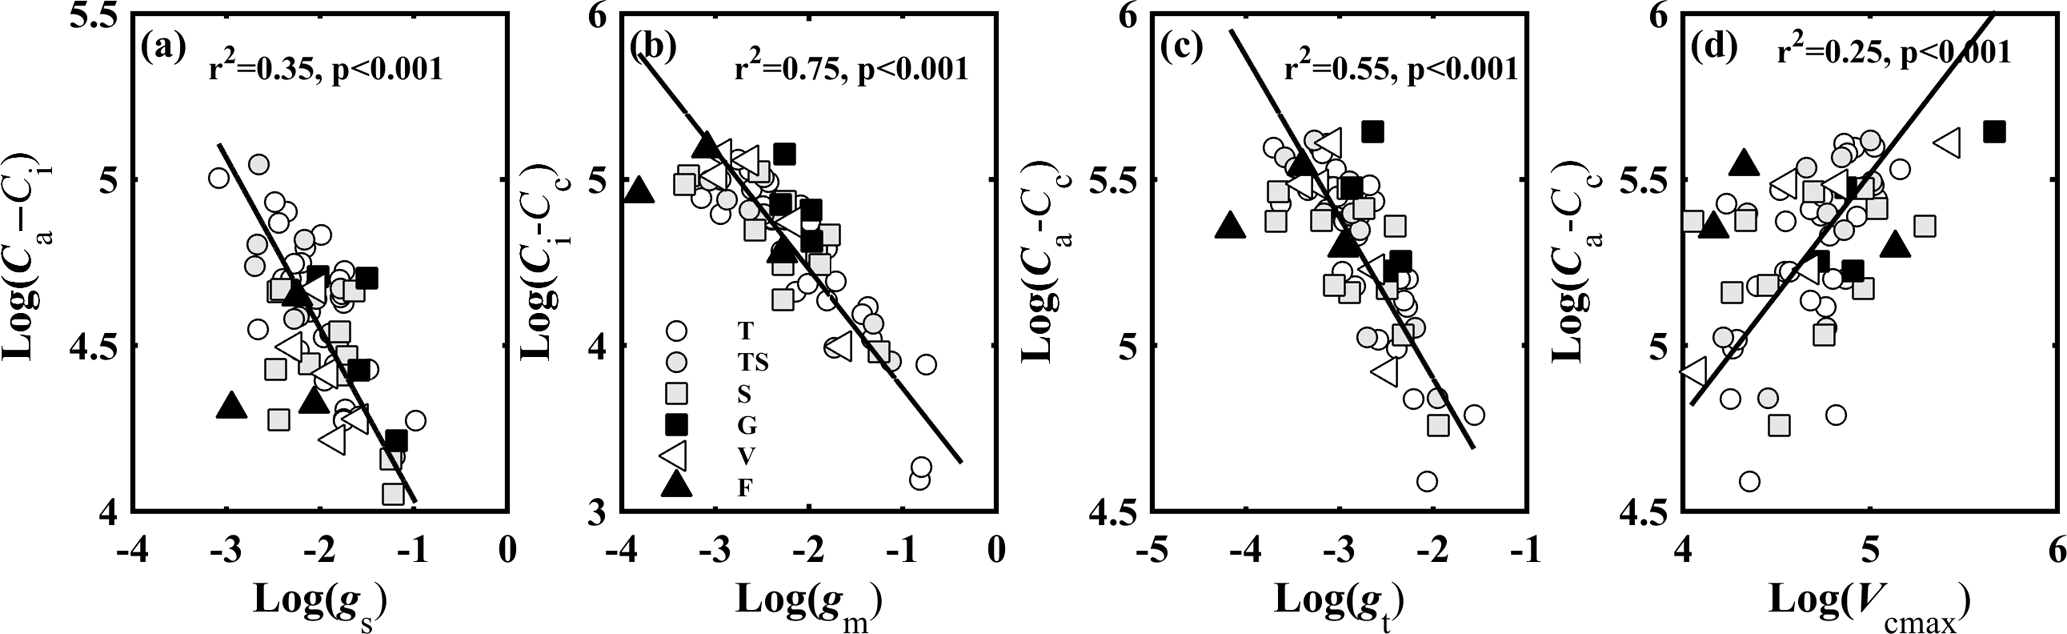
Figure 1Relationships between (a) CO2 gradient between ambient air and intercellular air space (Ca–Ci, µmol mol−1) and stomatal conductance to CO2 (gs, mol CO2 m−2 s−1); (b) CO2 gradient between intercellular air space and chloroplasts (Ci–Cc, µmol mol−1) and mesophyll conductance to CO2 (gm, mol CO2 m−2 s−1); (c) CO2 concentration gradient between ambient air and chloroplasts (Ca–Cc, µmol mol−1) and total conductance to CO2 (gt, mol CO2 m−2 s−1); and (d) Ca–Cc and the maximum carboxylase activity of Rubisco (Vcmax, µmol CO2 m−2 s−1). Lines refer to regression line for 63 species. T, TS, S, G, V, and F represent tree, tree/shrub, shrub, grass, vine, and fern, respectively.
2.4.2 The relationship between iWUE and Vcmax ∕ gs
When Fick's first law and the Farquhar biochemical model (Farquhar and Sharkey, 1982) are combined, iWUE is also a function of Vcmax. Based on the Farquhar biochemical model (Farquhar and Sharkey, 1982), when A is limited by Rubisco, it can be expressed by the following equation (Sharkey et al., 2007):
where Γ∗ is the CO2 compensation point of photosynthesis in the absence of non-photorespiratory respiration in light (Rd), and Km is the effective Michaelis–Menten constant of Rubisco for CO2. Combining Eqs. (1) and (5) (Flexas et al., 2016), we obtain the following:
Because Rd is much smaller than A in actively photosynthesizing leaves, Vcmax ∕ gs can be approximated as
Consequently, iWUE can be expressed as
2.5 Statistical analysis
2.5.1 Quantitative analysis of limitations on A
The relative contribution of gs (ls), gm (lm), and Vcmax (lb) to A can be separated by a quantitative limitation model introduced by Jones (1985) and further developed by Grassi and Magnani (2005). The sum of ls, lm, and lb is one. ls, lm and lb can be calculated as follows:
where ∂A ∕ ∂Cc was calculated as the slope of A–Cc response curves over a Cc range of 50–100 µmol mol−1. ls, lm, and lb have no units. A is co-limited by the three factors when ls≈ 0.3, lm≈ 0.3, and lb≈ 0.4 (Galmes et al., 2017).
2.5.2 Data analysis
Data were analyzed either as a whole group (six life forms combined) or by individual life forms. The bivariate linear regressions of leaf gas exchange parameters were performed using the standardized major axis (SMA) regression fits, and all of the data were made on loge-transformed data (Table S2).
To test for differences among life forms, SMA regression fits were used to compare the slope of regression lines where significant relationships had already been obtained. Note that grass, vine, and fern were not considered due to the small sample size. A similar trend was obtained, and no significant difference was found between life forms although significant relationships were not obtained for some bivariate linear regressions. Accordingly, six life forms were grouped together to analyze the strategy of water–carbon regulation of plants.
The difference of relative limitation of gs, gm, and Vcmax to A for life forms or as a whole group were performed using one-way ANOVA and Duncan's multiple comparison. The probability of significance was defined at p < 0.05.
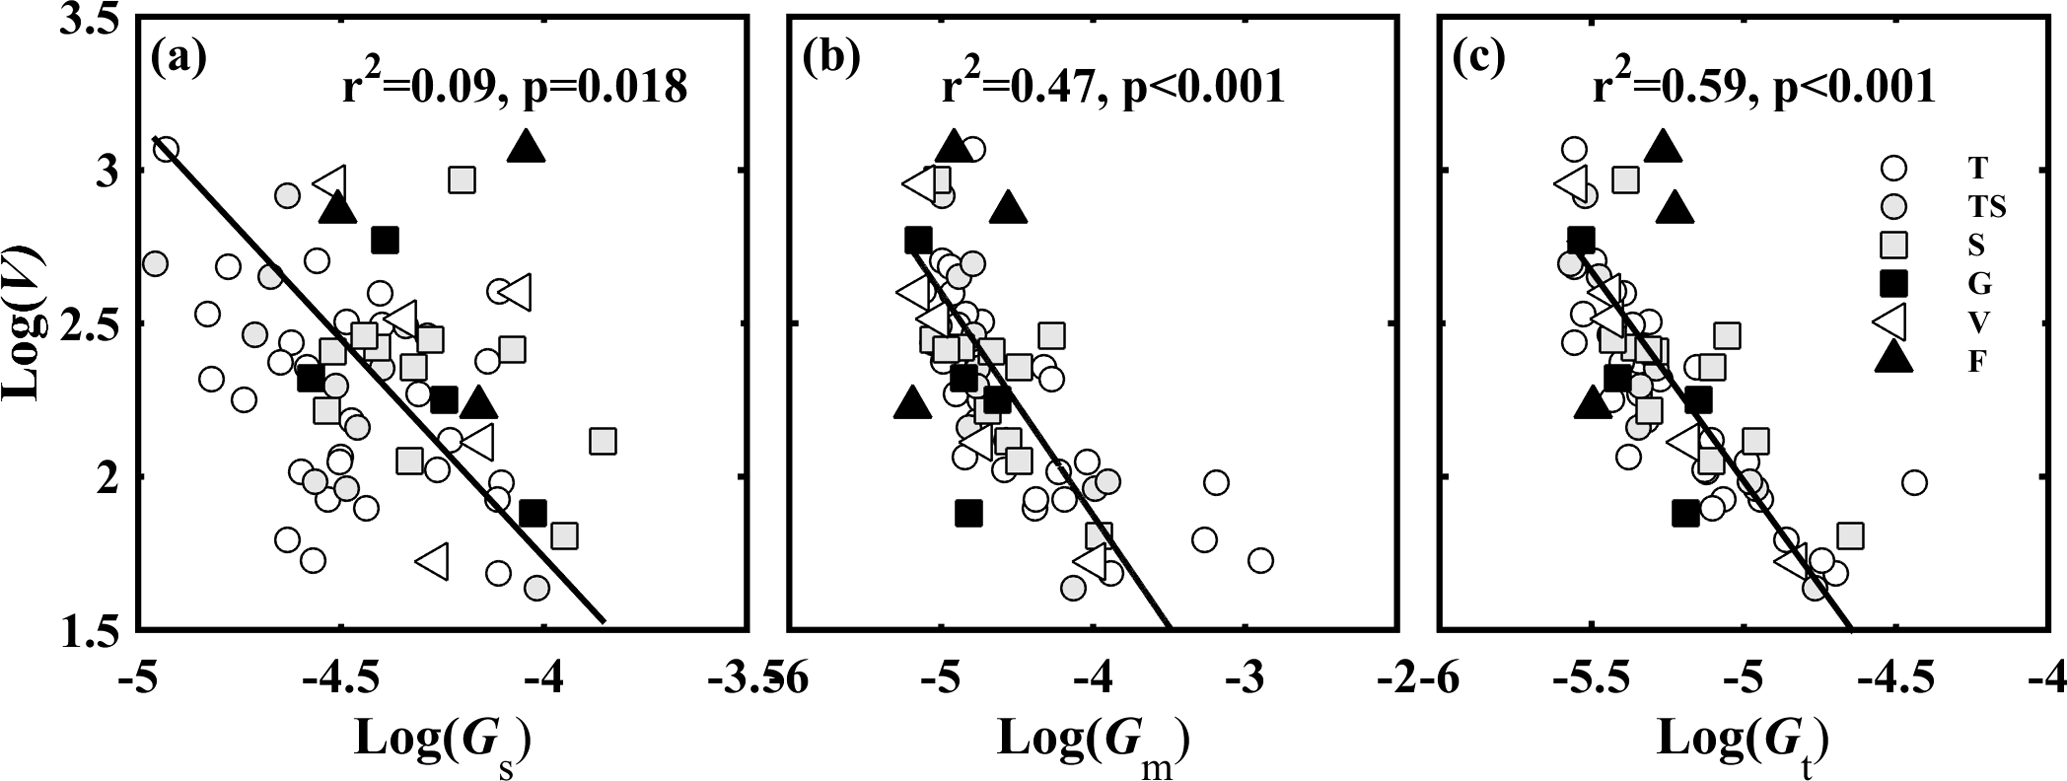
Figure 2Relationships between (a) V and Gs; (b) V and Gm; and (c) V and Gt. V is the ratio of photosynthetic capacity (Vcmax) to light-saturated net photosynthesis (A, µmol CO2 m−2 s−1); Gs is the ratio of stomatal conductance to CO2 (gs, mol CO2 m−2 s−1) to A; Gm is the ratio of mesophyll conductance to CO2 (gm, mol CO2 m−2 s−1) to A; and Gt is the ratio of total conductance to CO2 (gt, mol CO2 m−2 s−1) to A. Lines refer to regression line for 63 species. T, TS, S, G, V, and F represent tree, tree/shrub, shrub, grass, vine, and fern, respectively.
3.1 Interrelation among gs, gm, gt, and Vcmax
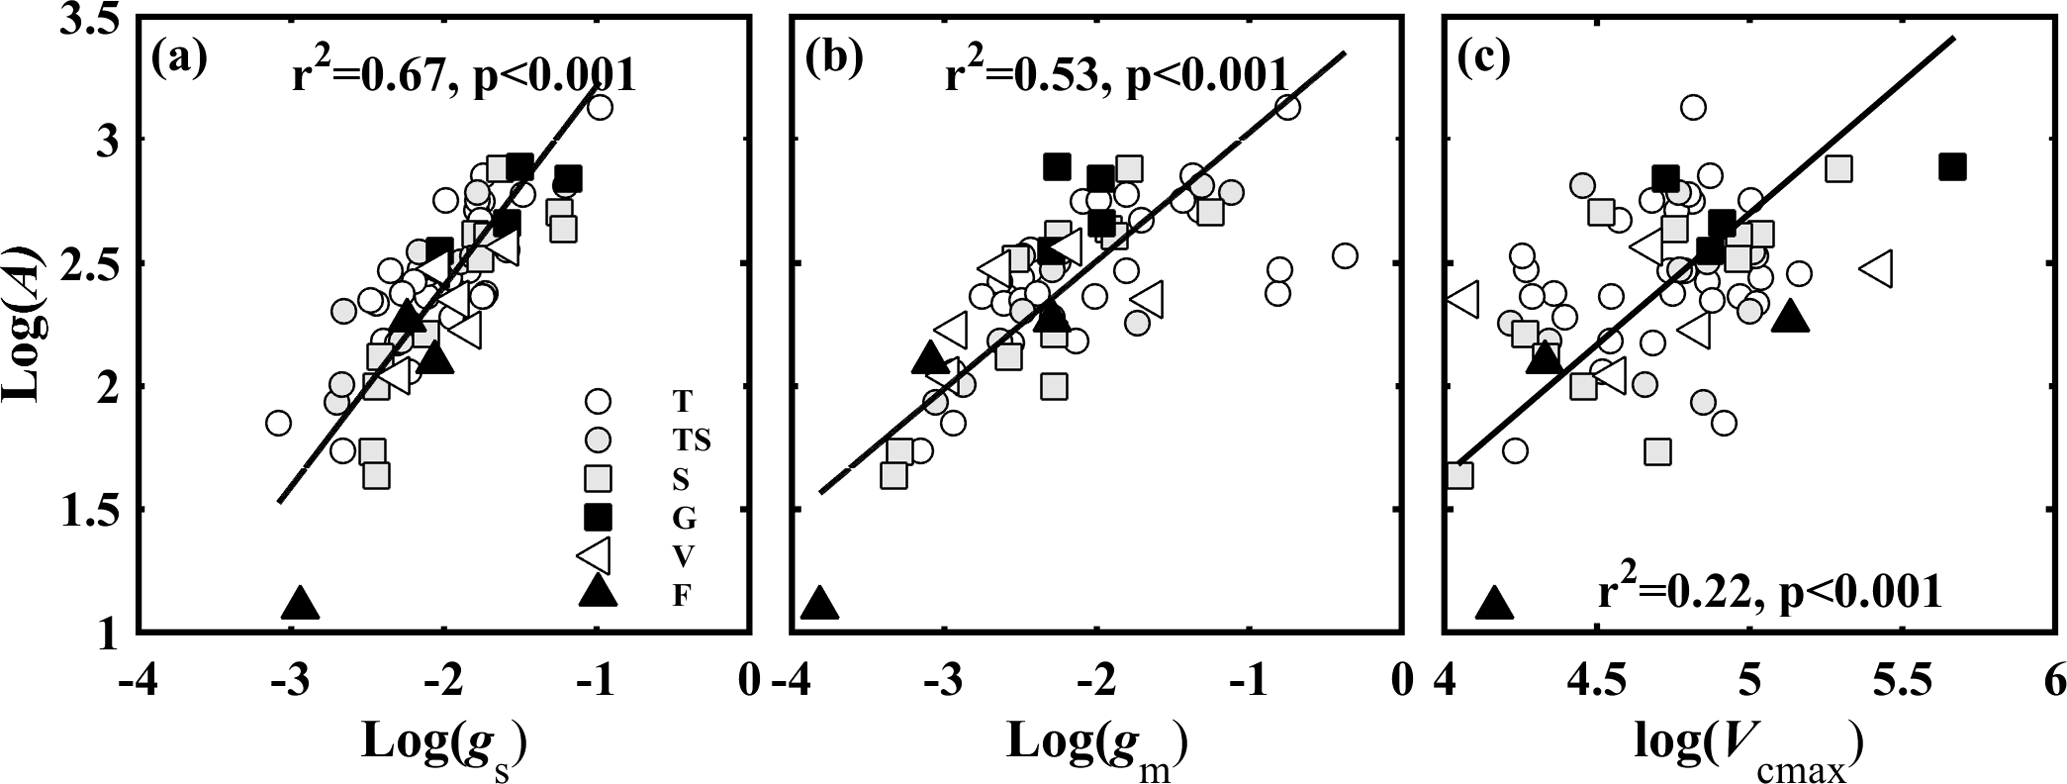
Figure 3Relationships between light-saturated net photosynthesis (A, µmol CO2 m−2 s−1) and (a) stomatal conductance to CO2 (gs, mol CO2 m−2 s−1); (b) mesophyll conductance to CO2 (gm, mol CO2 m−2 s−1); and (c) the maximum carboxylase activity of Rubisco (Vcmax, µmol CO2 m−2 s−1). Lines refer to regression line for 63 species. T, TS, S, G, V, and F represent tree, tree/shrub, shrub, grass, vine, and fern, respectively.
CO2 concentration gradients in leaves were controlled by CO2 diffusion conductance and Vcmax. Figure 1 shows the relationship between CO2 gradients (Ca–Ci, Ci–Cc, and Ca–Cc) in leaves and the corresponding CO2 diffusion conductance (gs, gm, and gt) (Fig. 1a–c), and between Ca–Cc and Vcmax (Fig. 1d). CO2 concentration gradients (Ca–Ci, Ci–Cc, and Ca–Cc) were significantly negatively associated with the corresponding CO2 diffusion conductance (gs, gm, and gt) (P < 0.001). Vcmax was positively associated with Ca–Cc (P < 0.001).
gs, gm, and gt were significantly positively related to each other (P < 0.001) (Fig. S1 in the Supplement). The contribution of gm to the leaf CO2 gradient was similar to that of gs. The contribution of gs (57.51–155.13 µmol mol−1) to Ca–Cc (98.50–282.94 µmol mol−1) varied from 28 to 86 %, and the contribution of gm (18.15–179.36 µmol mol−1) to Ca–Cc varied from 14 to 72 %. But the variation range of gm (0.02–0.69 mol CO2 m−2 s−1) was 4.5 times that of gs (0.05–0.38 mol CO2 m−2 s−1).

Figure 4Relationships between (a) stomatal conductance to CO2 (gs, mol CO2 m−2 s−1) and ls (gs limitation on light-saturated net photosynthesis; A); (b) mesophyll conductance to CO2 (gm, mol CO2 m−2 s−1) and lm (gm limitation on A); and (c) the maximum carboxylase activity of Rubisco (Vcmax, µmol CO2 m−2 s−1) and lb (Vcmax limitation on A). Lines refer to regression line for 63 species. T, TS, S, G, V, and F represent tree, tree/shrub, shrub, grass, vine, and fern, respectively.
No relationship was found between the CO2 diffusion conductance (gs, gm, and gt) and Vcmax (Fig. S2). However, after normalization of gs, gm, gt, and Vcmax for A (normalized parameters are hereafter called GS=gS ∕ A, Gm=gm ∕ ∕ A, and V=Vcmax ∕ A), V was significantly positively correlated with Gm and Gt (P < 0.001) (Fig. 2b, c), and was slightly positively correlated with Gs (P < 0.05) (Fig. 2a), which represented the trade-off between CO2 supply and demand.
3.2 Contribution of gs, gm, and Vcmax to A
The variation in A was attributed to variation in gs, gm, gt, and Vcmax. A was positively correlated with gs (Fig. 3a), gm (Fig. 3b), and Vcmax (Fig. 3c). We used the quantitative limitation model (Eqs. 9, 10 and 11) to separate gs (ls), gm (lm), and Vcmax (lb) limitations to A. ls, lm, and lb were negatively associated with gs, gm, and Vcmax, respectively (Fig. 4). The contributions by gs, gm, and Vcmax to limiting A were different for each species (Fig. S3). ls varied 2.6-fold (from 0.17 to 0.45), lm varied 10.5-fold (from 0.05 to 0.55), and lb varied 6.2-fold ( from 0.11 to 0.68) across species. Overall, lm (0.38 ± 0.12) was significantly larger than lb (0.34 ± 0.14) and ls (0.28 ± 0.07) (P < 0.05).
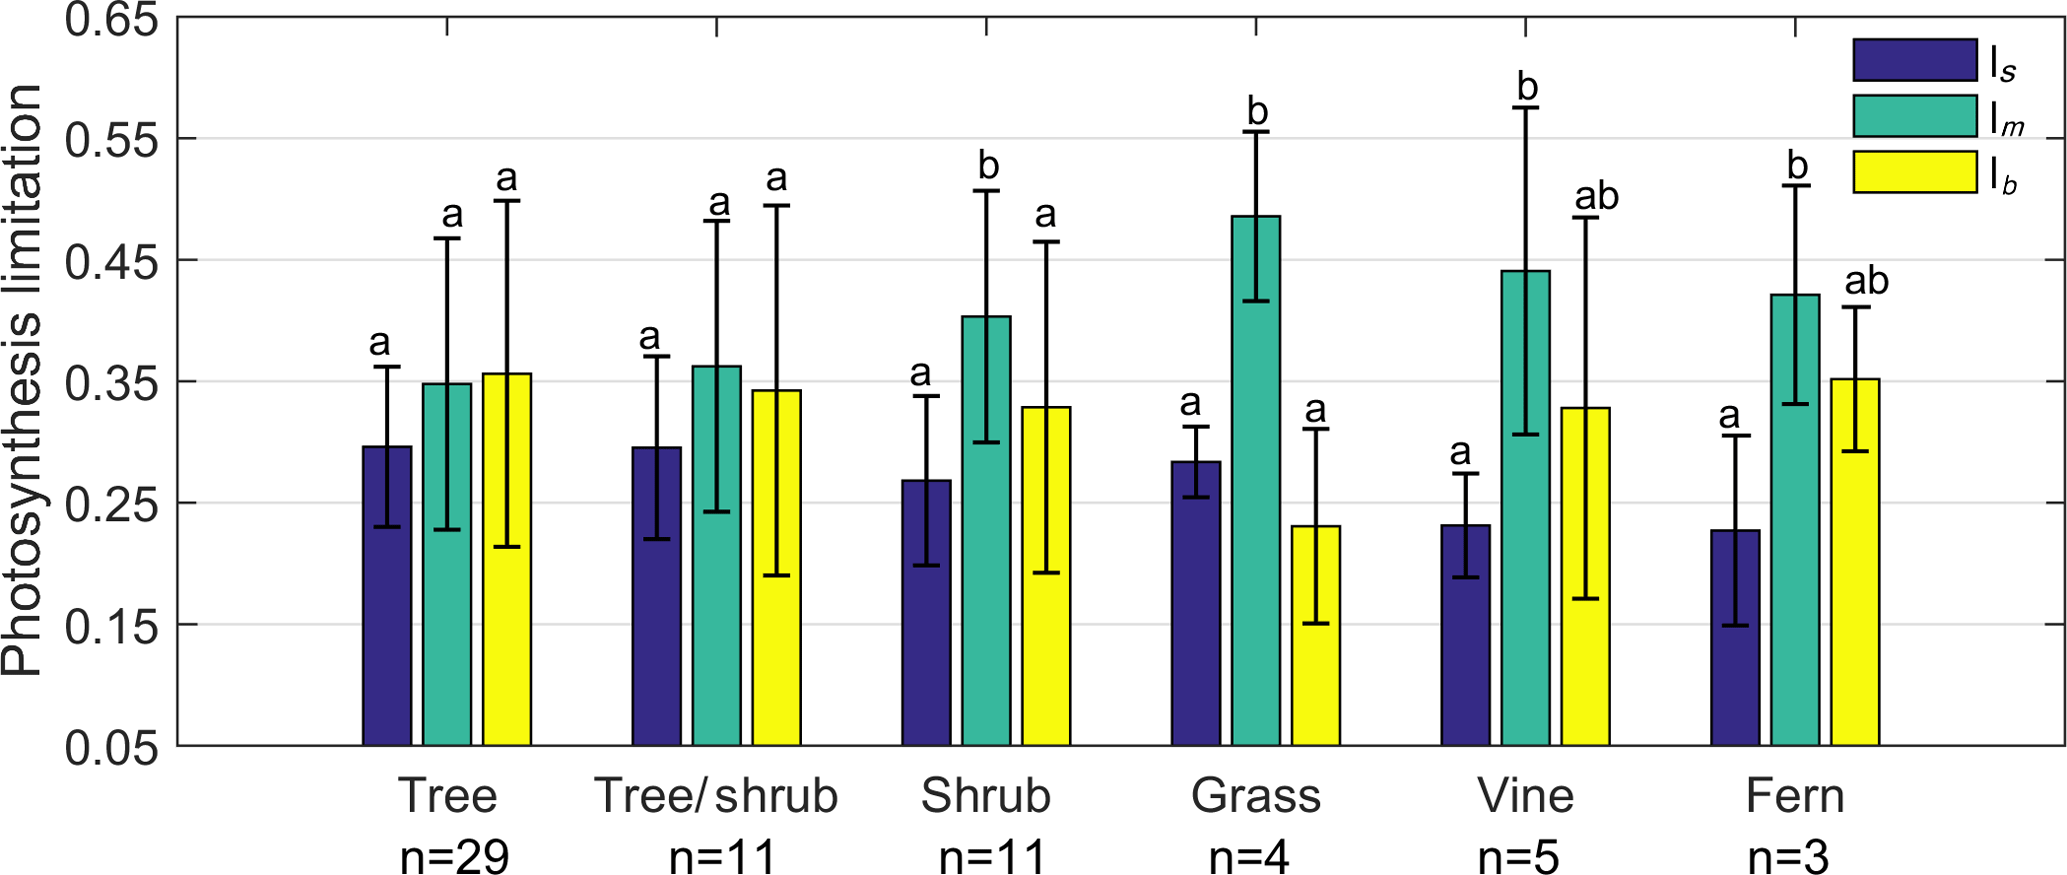
Figure 5Limitation to light-saturated net photosynthesis (A) in six life forms by stomatal conductance to CO2 (ls), mesophyll conductance to CO2 (lm), and the maximum carboxylase activity of Rubisco (lb). Error bars denominate standard deviation (1σ).
To further understand how A was limited by gs, gm, and Vcmax among life forms, we grouped the 63 species into 6 life forms: tree, tree/shrub, shrub, grass, vine, and fern. The results showed that there was no significant difference between ls, lm, and lb for trees and tree/shrubs. lm of shrubs and grasses was significantly higher than that of ls and lb (P < 0.05). lm of vines and ferns was significantly higher than that of ls (P < 0.05) (Fig. 5).
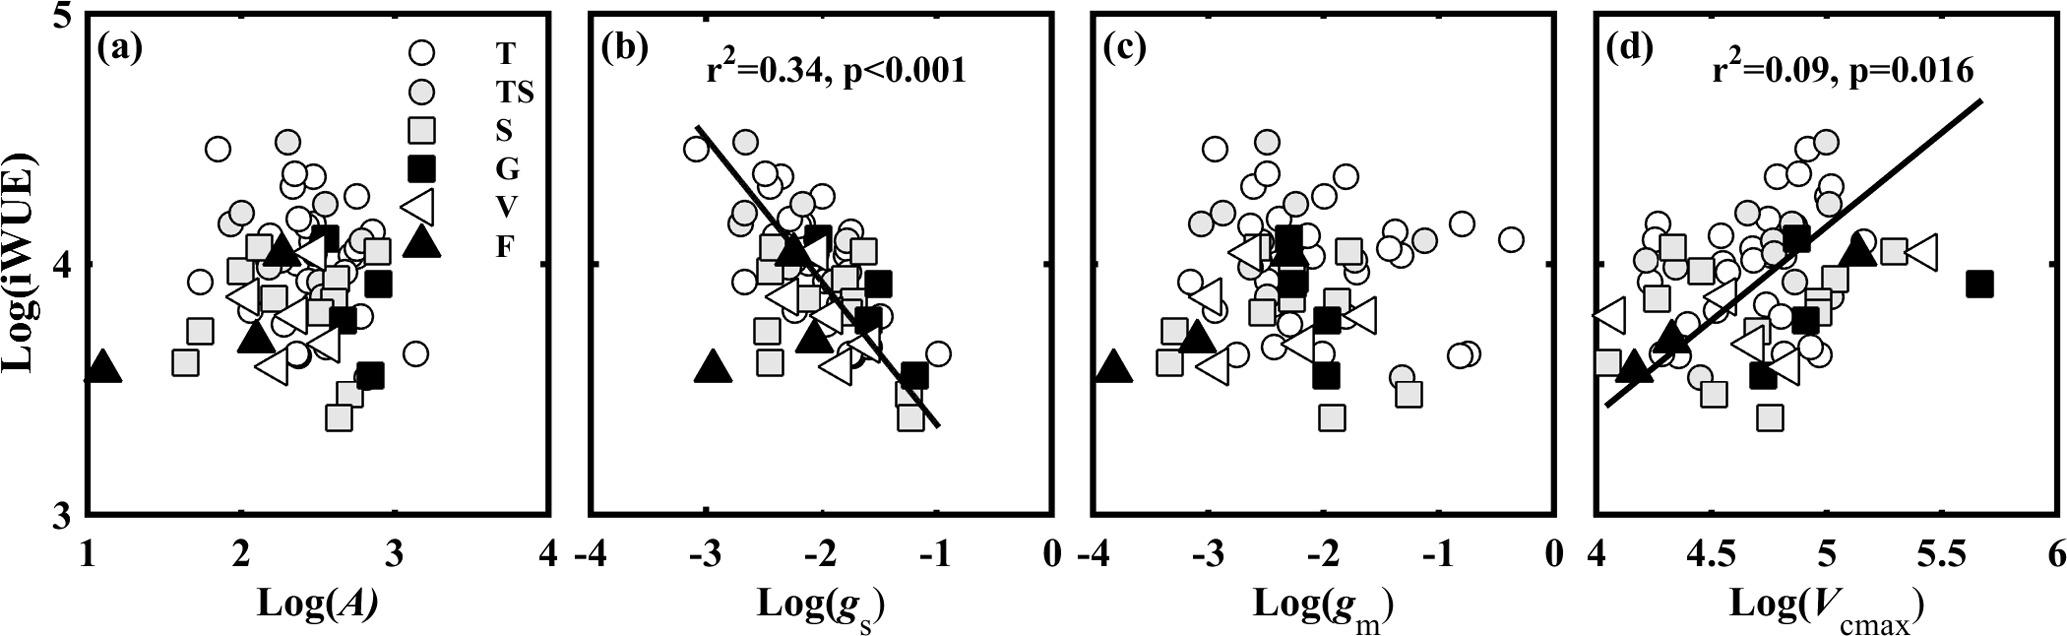
Figure 6Relationships between the observed intrinsic water use efficiency (iWUE, µmol CO2 mol−1 H2O) and (a) light-saturated net photosynthesis (A, µmol CO2 m−2 s−1); (b) stomatal conductance to CO2 (gs, mol CO2 m−2 s−1); (c) mesophyll conductance to CO2 (gm, mol CO2 m−2 s−1); and (d) the maximum carboxylase activity of Rubisco (Vcmax, µmol CO2 m−2 s−1). Lines refer to regression line for 63 species. T, TS, S, G, V, and F represent tree, tree/shrub, shrub, grass, vine, and fern, respectively.
3.3 Effect of gs, gm, and Vcmax on iWUE
iWUE varied from 29.52 to 88.92 µmol CO2 mol−1 H2O. In theory, iWUE is regulated by gs (gsw= 1.6 gs), gm, and Vcmax. However, a simple correlation analysis showed that iWUE was negatively related to gs (Fig. 6b), and not related to A (Fig. 6a), gm (Fig. 6c), or Vcmax (Fig. 6d).
A correlation analysis was used to test how gm ∕ gs and Vcmax ∕ gs affected iWUE. The results showed that iWUE was positively correlated with gm ∕ gs (Fig. 7a) and Vcmax ∕ gs (Fig. 7b). However, there was no significant relationship between gm ∕ gs and Vcmax ∕ gs. iWUE was regulated by covariation between gs, gm, and Vcmax.
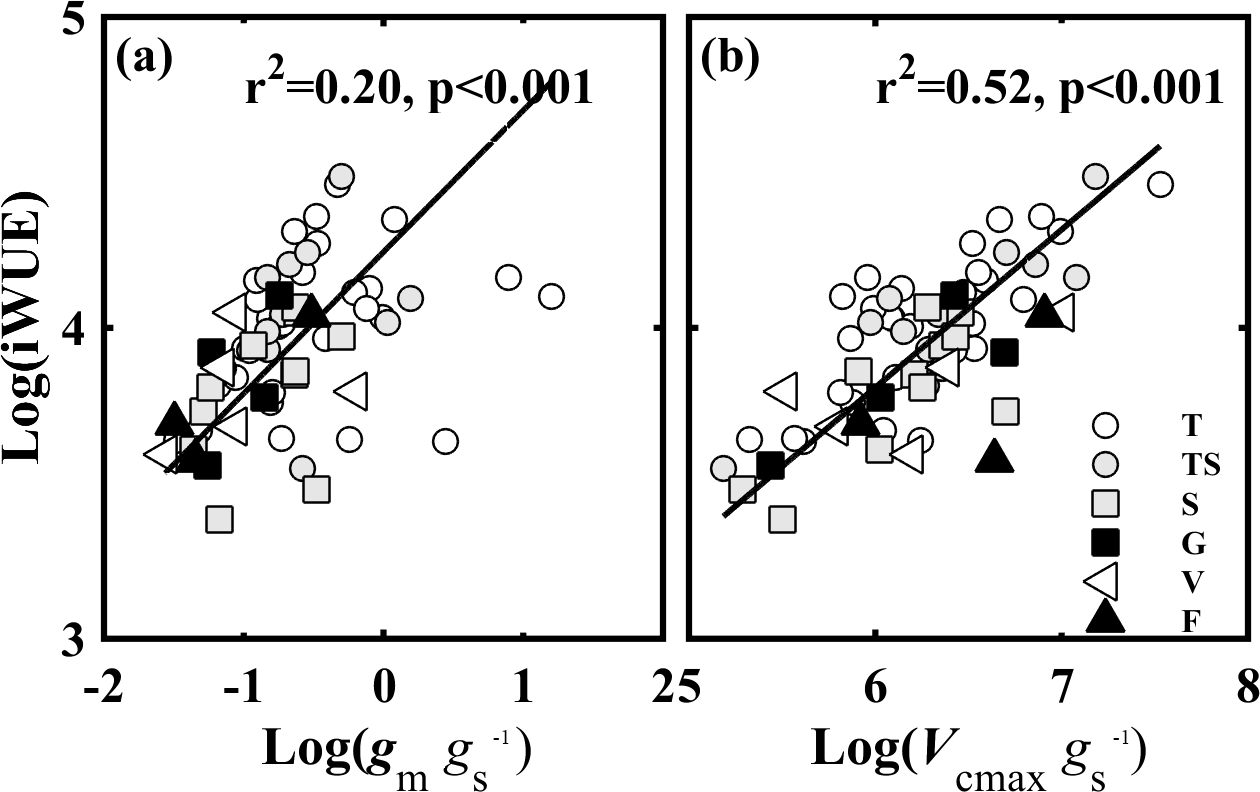
Figure 7The relationships of the intrinsic water use efficiency (iWUE, µmol CO2 mol−1 H2O) and (a) the ratio of mesophyll conductance to CO2 (gm) to (gs) (gm ∕ gs), and (b) the ratio of the maximum carboxylase activity of Rubisco (Vcmax) to gs (Vcmax ∕ gs). Lines refer to regression line for 63 species. T, TS, S, G, V, and F represent tree, tree/shrub, shrub, grass, vine, and fern, respectively.
4.1 Covariation in gs, gm, and Vcmax in regulating A
A was constrained by gs, gm, and Vcmax acting together; however, variability in the relative contribution of these three factors depended on species and habitats (Tosens et al., 2016; Galmes et al., 2017; Peguero-Pina et al., 2017a; Veromann-Jurgenson et al., 2017). A was significantly correlated with gs, gm, and Vcmax (Fig.3a–c). gs was positively related to gm (Fig. S1c), while no relationship was found between the CO2 diffusion conductance (gs and gm) and Vcmax (Fig. S2). The relative limitations of gs, gm, and Vcmax were separated by a quantitative limitation model (Jones, 1985; Grassi and Magnani, 2005). The results showed that ls, lm, and lb of the 63 species varied over a large range (Fig. S3), indicating plants have diverse strategies to coordinate CO2 diffusion (gs and gm) and Vcmax to maintain relative high A. The order of factor limitations to A was lm > lb >ls (P < 0.05) (Fig. S3). Furthermore, we tested the relationship between the relative limitations and the corresponding limitation factors. The results showed that ls, lm, and lb were negatively associated with gs, gm, and Vcmax, respectively (Fig. 4). The relationship was also stronger for gm–lm (r2= 0.65) than Vcmax–lb (r2= 0.27) and gs–ls (r2= 0.19).
gs was more highly correlated with A, while the results showed that A was more limited by gm. This could be due to two possible reasons. Firstly, compared to the linear relationship between A and gs, a nonlinear trend was found between A and gm when gm > 0.4 (Fig. 3a, b). Secondly, leaf structure plays an important role in regulating gm and Vcmax and, consequently, in determining A (Veromann-Jurgenson et al., 2017). Negative relationships between A ∕ LMA and LT (r2= 0.16, p= 0.002), and A ∕ LMA and LT (r2= 0.3, p < 0.001)were also observed (Fig. S4c, d), while A was not correlated with LT and LD (Fig. S4a, b).
The importance of gm in constraining A was variable, and depended on leaf structural traits; only LMA, LT, and LD were analyzed in this study. Large variability in gm has been shown both between and within species with different life forms and habits (Gago et al., 2014; Flexas et al., 2016). Variability in gm in this study is similar to that in global datasets (Gago et al., 2014; Flexas et al., 2016). There was no significant difference among life forms (P > 0.05). Previous studies have confirmed that LMA (Tomas et al., 2013), thickness of leaf cell wall (Peguero-Pina et al., 2017b), liquid phase of mesophyll (Veromann-Jurgenson et al., 2017), cell wall thickness of mesophyll (Tosens et al., 2016; Terashima et al., 2011), and surface area of mesophyll and chloroplast exposed to intercellular space (Veromann-Jurgenson et al., 2017) were the main limitations for gm. The wide variability of gm between different species and life forms in the same ecosystem seems to be related to the diversity of leaf anatomical traits.
No significant difference of LMA, LT, and LD was found among life forms (P < 0.05). Negative correlations of gm (Terashima et al., 2005) or gm ∕ LMA (Niinemets et al., 2009a; Veromann-Jurgenson et al., 2017) with LMA have been reported. In this study, there was a significant relationship between gm ∕ LMA with LMA (P < 0.01); however, no relationship was found between gm and LMA. gm ∕ LMA was significantly negatively related to LD (p < 0.01) (Fig. S5c), and there was also a weak negative relationship with LT (p= 0.06) (Fig. S5d), demonstrating the negative effect of cell wall thickness on gm (Terashima et al., 2006; Niinemets et al., 2009a). The strong investment in supportive structures was the main reason for the limitation of gm on A (Veromann-Jurgenson et al., 2017). However, it is still unknown how leaf anatomical traits affect gm and A, and this should be further explored.
gs is responsible for the CO2 exchange between atmosphere and leaves, and regulates the CO2 fixation (A) and water loss (Lawson and Blatt, 2014). The variability of gs was controlled by stomatal anatomy, i.e., stomata density and size, and mesophyll demands for CO2 (Lawson and Blatt, 2014). However, the stomatal anatomy was not analyzed in this study. We only focused on how the relationship between gs and gm regulates A. A positive relationship has been observed between gs and gm (Flexas et al., 2013). For example, the restricted CO2 diffusion from the ambient air to chloroplast is the main reason for a decreased A under water stress conditions, due to both the stomatal and mesophyll limitations (Olsovska et al., 2016). gs was significantly positively related to gm for 63 species (P < 0.001, Fig. S1) in this study, and no difference in the slopes of the regression lines between gs and gm was found among life forms, demonstrating that A was regulated by the covariation of gs and gm. However, the variability of gm and lm was larger than gs and ls, respectively (Figs. 1 and S3).
The wide variation in the range of lb (0.11–0.68) highlighted the important role of Vcmax in regulating A. Vcmax was used to represent the CO2 demand in the photosynthetic process in this study. The relative contribution of Vcmax to A not only depends on Ca–Cc, but also on leaf nutrient levels. A positive relationship was found between Ca–Cc and Vcmax (Fig. 1d). Furthermore, Vcmax ∕ LMA was also co-regulated by leaf nitrogen, phosphorus, and magnesium content (Jing et al. 2018). In addition, Vcmax ∕ LMA was negatively related to LT (p < 0.05) (Fig. S6c) and LD (p < 0.05) (Fig. S6d), while Vcmax was not correlated with LT and LD (Fig. S6a,b); this demonstrated that leaf structure plays an important role in regulating Vcmax.
The trade-off between CO2 supply (gs and gm) and demand (carboxylation capacity of Rubisco) can help maintain a relatively high A (Galmes et al., 2017; Saez et al., 2017). In this study, we used Vcmax as a proxy for the carboxylation capacity of Rubisco, and the normalized Vcmax by A (V=Vcmax ∕ A) was significantly negatively correlated with the normalized gt by A (Gt=gt ∕ A) (P < 0.001) (Fig. 2c). This indicated that the trade-off between CO2 supply and demand also existed among different species in the same ecosystems. For the Limonium genus(flowering plants) (Galmes et al., 2017), gt was significantly positively related to Rubisco carboxylase specific activity, and significantly negatively related to Rubisco specificity factor to CO2. In the case of Antarctic vascular (Saez et al., 2017) and Mediterranean plants (Flexas et al., 2014), A was mainly limited by low gm, but it could be partially counterbalanced by a highly efficient Rubisco through high specificity for CO2. This highlights the importance of the trade-off between CO2 supply and demand in plant adaptation to karst environment. However, it is still unknown how leaf anatomical traits affect gm, Vcmax, and A, and this should be further explored.
4.2 Covariation of gs, gm, and Vcmax in regulating iWUE
Compared with the global dataset under well-watered conditions (19.27–171.88 µmol CO2 mol−1 H2O) (Flexas et al., 2016), iWUE (52.85 ± 13.08 µmol CO2 mol−1 H2O) was somewhat lower in this study. iWUE varied from 29.53 to 88.91 µmol CO2 mol−1 H2O, and the variability of iWUE was larger than in the karst tropical primary forest (Fu et al., 2012; Chen et al., 2015). The average iWUE of 12 vines and 13 trees in the karst tropical primary forest was 41.23 ± 13.21 µmol CO2 mol−1 H2O (Chen et al., 2015), while that of six evergreen and six deciduous trees was 66.7 ± 4.9 and 49.7 ± 2.0 µmol CO2 mol−1 H2O, respectively (Fu et al., 2012). The results demonstrated that karst plants use a diverse strategies of carbon–water regulation to adopt to the harsh karst environment.
Coexisting species have a diverse strategies of carbon–water regulation, ranging from “profligate/opportunistic” to “conservative”, which means that their ecophysiological niches are separate (Moreno-Gutierrez et al., 2012; Nie et al., 2014; Prentice et al., 2014). Species with high gs, and low iWUE were defined to have a “profligate/opportunistic” water use strategy, and species with low gs and high iWUE were defined to exhibit a “conservative” water use strategy (Moreno-Gutierrez et al., 2012). Consistent with previous research (Moreno-Gutierrez et al., 2012), coexisting plant species growing in the karst ecosystem had diverse water use strategies. However, karst plants tended to lose more water to gain more carbon, i.e., karst plants used a “profligate/opportunistic” water use strategy to adapt to the low nutrient availability and water stress conditions.
Prentice et al. (2014) studied the trade-off between carbon gain and water loss of woody species in contrasting climates, and found that species in hot and wet regions tend to lose more water in order to fix more carbon (high gs ∕ A, low Vcmax_Ci ∕ A), and vice versa. Although karst soils cannot contain enough water for plant growth, the trade-off between carbon gain and water loss (high gs ∕ A and low Vcmax_Ci ∕ A) was similar to that shown for plants growing in hot and wet regions (Prentice et al., 2014).
iWUE is regulated by the covariation of gs, gm, and Vcmax. In theory, water loss is regulated by gs only, while carbon gain (A) is regulated by gs, gm, and Vcmax (Fig. 3) (Lawson and Blatt, 2014). However, in this study, iWUE was negatively related to gs (R2= 0.30) and Vcmax (R2= 0.09), and not related to A, gm (Fig. 6).
CO2 diffusion and the Farquhar biochemical model indicated that iWUE is affected by gm ∕ gs and Vcmax ∕ gs (Gago et al., 2014; Flexas et al., 2016). There was a hyperbolic dependency of iWUE on gm ∕ gs due to the roles of gs and gm in Ci and Cc, and of Cc in A (Flexas et al., 2016). In meta-analyses, both Gago et al. (2014) and Flexas et al. (2016) found that iWUE was significantly positively related to gm ∕ gs and Vcmax ∕ gs. The results of this study are consistent with the meta-analyses (Fig. 7), demonstrating that plant species with relatively high gm ∕ gs or Vcmax ∕ gs had relatively high iWUE. The relationship between iWUE and Vcmax ∕ gs (R2= 0.50) was stronger than the relationship between iWUE and gm ∕ gs (R2= 0.20), demonstrating that iWUE was mainly regulated by Vcmax ∕ gs. The reason for this may be that iWUE was correlated to gs and Vcmax, and gs was positively related to gm.
However, plants cannot simultaneously have high gm ∕ gs and high Vcmax ∕ gs. Similarly to the study by Gago et al. (2014), we found no relationship between gm ∕ gs and Vcmax ∕ gs. Gago et al. (2014) thought that the poor relationship between gm ∕ gs and Vcmax ∕ gs indicated that the iWUE may be improved by gm ∕ gs or Vcmax ∕ gs separately; if both of them were simultaneously improved, an enhanced effect on iWUE could be anticipated. In addition, Flexas et al. (2016) showed in a simulation that the increase in iWUE caused by overinvestment in photosynthetic capacity would progressively lead to inefficiency in the trade-off between carbon gain and water use, causing an imbalance between CO2 supply and demand.
This study provides information regarding the limitations of A and iWUE by gs, gm, and Vcmax in 63 species across 6 life forms in the field. The results showed that plants growing in karst CZs used diverse strategies of carbon–water regulation, but no difference was found among life forms. The covariation of CO2 supply (gs and gm) and demand (Vcmax) regulated A, indicating that species maintained a relatively high A through covaring their leaf anatomical structure and Vcmax. iWUE was relatively low, but ranged widely, indicating that plants used the “profligate/opportunistic” water use strategy to maintain the survival, growth, and structure of the community. iWUE was regulated by gs, Vcmax, gm ∕ gs, and Vcmax ∕ gs, indicating that species with high gm ∕ gs or Vcmax ∕ gs will have to be much more competitive to respond to the ongoing rapid warming and drought in the karst CZs.
Requests for data or other materials should be directed to Xuefa Wen (wenxf@igsnrr.ac.cn).
The supplement related to this article is available online at: https://doi.org/10.5194/bg-15-4193-2018-supplement.
JW, XW, and XZ planed and designed the research. JW performed experiments and analyzed data. JW prepared the manuscript with contributions from all co-authors.
The authors declare that they have no conflict of interest.
This study was supported by the National Natural Science Foundation of China
(grant nos. 41571130043, 31470500, and 41671257).
Edited by: Zhongjun Jia
Reviewed by: two anonymous referees
Bongi, G. and Loreto, F.: Gas-exchange properties of salt-stressed olive (Olea-Europra L) leaves, Plant Physiol., 90, 1408–1416, 1989.
Buckley, T. N. and Warren, C. R.: The role of mesophyll conductance in the economics of nitrogen and water use in photosynthesis, Photosynth. Res., 119, 77–88, 2014.
Cano, F. J., Lopez, R., and Warren, C. R.: Implications of the mesophyll conductance to CO2 for photosynthesis and water-use efficiency during long-term water stress and recovery in two contrasting Eucalyptus species, Plant Cell Environ., 37, 2470–2490, 2014.
Carriqui, M., Cabrera, H. M., Conesa, M. A., Coopman, R. E., Douthe, C., Gago, J., Galle, A., Galmes, J., Ribas-Carbo, M., Tomas, M., and Flexas, J.: Diffusional limitations explain the lower photosynthetic capacity of ferns as compared with angiosperms in a common garden study, Plant Cell Environ., 38, 448–460, 2015.
Chang, J. J., Zhu, J. X., Xu, L., Su, H. X., Gao, Y., Cai, X. L., Peng, T., Wen, X. F., Zhang, J. J., and He, N. P.: Rational land-use types in the karst regions of China: Insights from soil organic matter composition and stability, Catena, 160, 345–353, 2018.
Chen, H., Zhang, W., Wang, K., and Fu, W.: Soil moisture dynamics under different land uses on karst hillslope in northwest Guangxi, China, Environ. Earth Sci., 61, 1105–1111, 2010.
Chen, Y. J., Cao, K. F., Schnitzer, S. A., Fan, Z. X., Zhang, J. L. and Bongers, F.: Water-use advantage for lianas over trees in tropical seasonal forests, New Phytol., 205, 128–136, 2015.
Dimarco, G., Manes, F., Tricoli, D. and Vitale, E.: Fluorescence Parameters Measured Concurrently with Net Photosynthesis to Investigate Chloroplastic CO2 Concentration in Leaves of Quercus ilex L, J. Plant Physiol., 136, 538–543, 1990.
Domingues, T. F., Meir, P., Feldpausch, T. R., Saiz, G., Veenendaal, E. M., Schrodt, F., Bird, M., Djagbletey, G., Hien, F., Compaore, H., Diallo, A., Grace, J., and Lloyd, J.: Co-limitation of photosynthetic capacity by nitrogen and phosphorus in West Africa woodlands, Plant Cell Environ., 33, 959–980, 2010.
Epron, D., Godard, D., Cornic, G., and Genty, B.: Limitation of net CO2 assimilation rate by internal resistances to CO2 transfer in the leaves of two tree species (Fagus sylvatica L. and Castanea sativa Mill), Plant Cell Environ., 18, 43–51, 1995.
Ethier, G. J. and Livingston, N. J.: On the need to incorporate sensitivity to CO2 transfer conductance into the Farquhar-von Caemmerer-Berry leaf photosynthesis model, Plant Cell Environ., 27, 137–153, 2004.
Evans, J. R.: Nitrogen and photosynthesis in the flag leaf of Wheat (Triticum aestivum L.), Plant Physiol., 72, 297–302, 1983.
Farquhar, G. D. and Sharkey, T. D.: Stomatal conductance and photosynthesis, Annu. Rev. Plant Phys., 33, 317–345, 1982.
Flexas, J., Barbour, M. M., Brendel, O., Cabrera, H. M., Carriqui, M., Diaz-Espejo, A., Douthe, C., Dreyer, E., Ferrio, J.P., Gago, J., Galle, A., Galmes, J., Kodama, N., Medrano, H., Niinemets, U., Peguero-Pina, J. J., Pou, A., Ribas-Carbo, M., Tomas, M., Tosens, T., and Warren, C. R.: Mesophyll diffusion conductance to CO2: An unappreciated central player in photosynthesis, Plant Sci., 193, 70–84, 2012.
Flexas, J., Niinemets, U., Galle, A., Barbour, M. M., Centritto, M., Diaz-Espejo, A., Douthe, C., Galmes, J., Ribas-Carbo, M., Rodriguez, P., Rossello, F., Soolanayakanahally, R., Tomas, M., Wright, I. J., Farquhar, G. D., and Medrano, H.: Diffusional conductances to CO2 as a target for increasing photosynthesis and photosynthetic water-use efficiency, Photosynth. Res., 117, 45–59, 2013.
Flexas, J., Diaz-Espejo, A., Gago, J., Galle, A., Galmes, J., Gulias, J. and Medrano, H.: Photosynthetic limitations in Mediterranean plants: A review, Environ. Exp. Bot., 103, 12–23, 2014.
Flexas, J., Diaz-Espejo, A., Conesa, M. A., Coopman, R. E., Douthe, C., Gago, J., Galle, A., Galmes, J., Medrano, H., Ribas-Carbo, M., Tomas, M., and Niinemets, U.: Mesophyll conductance to CO2 and Rubisco as targets for improving intrinsic water use efficiency in C-3 plants, Plant Cell Environ., 39, 965–982, 2016.
Fu, P.-L., Jiang, Y.-J., Wang, A.-Y., Brodribb, T. J., Zhang, J.-L., Zhu, S.-D., and Cao, K.-F.: Stem hydraulic traits and leaf water-stress tolerance are co-ordinated with the leaf phenology of angiosperm trees in an Asian tropical dry karst forest, Ann. Bot., 110, 189–199, 2012.
Gago, J., Douthe, C., Florez-Sarasa, I., Escalona, J. M., Galmes, J., Fernie, A. R., Flexas, J., and Medrano, H.: Opportunities for improving leaf water use efficiency under climate change conditions, Plant Sci., 226, 108–119, 2014.
Galmes, J., Angel Conesa, M., Manuel Ochogavia, J., Alejandro Perdomo, J., Francis, D. M., Ribas-Carbo, M., Save, R., Flexas, J., Medrano, H., and Cifre, J.: Physiological and morphological adaptations in relation to water use efficiency in Mediterranean accessions of Solanum lycopersicum, Plant Cell Environ., 34, 245–260, 2011.
Galmes, J., Molins, A., Flexas, J., and Conesa, M. A.: Coordination between leaf CO2 diffusion and Rubisco properties allows maximizing photosynthetic efficiency in Limonium species, Plant Cell Environ., 40, 2081–2094, 2017.
Grassi, G. and Magnani, F.: Stomatal, mesophyll conductance and biochemical limitations to photosynthesis as affected by drought and leaf ontogeny in ash and oak trees, Plant Cell Environ., 28, 834–849, 2005.
Harley, P. C., Loreto, F., Dimarco, G., and Sharkey, T. D.: Theoretical considerations when estimating the mesophyll conductance to CO2 flux by analysis of the response of photosynthesis to CO2, Plant Physiol., 98, 1429–1436, 1992.
He, N. P., Yu, Q., Wu, L., Wang, Y. S., and Han, X. G.: Carbon and nitrogen store and storage potential as affected by land-use in a Leymus chinensis grassland of northern China, Soil Biol. Biochem., 40, 2952–2959, 2008.
Jobbagy, E. G. and Jackson, R. B.: The vertical distribution of soil organic carbon and its relation to climate and vegetation, Ecol. Appl. 10, 423–436, 2000.
Jones, H. G.: Partitioning stomatal and non-stomatal limitations to photosynthesis, Plant Cell Environ., 8, 95–104, 1985.
Laisk, A., Eichelmann, H., Oja, V., Rasulov, B., Padu, E., Bichele, I., Pettai, H., and Kull, O.: Adjustment of leaf photosynthesis to shade in a natural canopy: rate parameters, Plant Cell Environ., 28, 375–388, 2005.
Lawson, T. and Blatt, M. R.: Stomatal Size, Speed, and Responsiveness Impact on Photosynthesis and Water Use Efficiency, Plant Physiol., 164, 1556–1570, 2014.
Li, Z. P., Han, F. X., Su, Y., Zhang, T. L., Sun, B., Monts, D. L., and Plodinec, M. J.: Assessment of soil organic and carbonate carbon storage in China, Geoderma, 138, 119–126, 2007.
Liu, C. C., Liu, Y. G., Guo, K., Fan, D. Y., Yu, L. F., and Yang, R.: Exploitation of patchy soil water resources by the clonal vine Ficus tikoua in karst habitats of southwestern China, Acta Physiol. Plant., 33, 93–102, 2011.
Long, S. P. and Bernacchi, C. J.: Gas exchange measurements, what can they tell us about the underlying limitations to photosynthesis? Procedures and sources of error, J. Exp. Bot., 54, 2393–2401, 2003.
Loreto, F., Harley, P. C., Dimarco, G., and Sharkey, T. D.: Estimation of mesophyll conductance to CO2 flux by three different methods, Plant Physiol., 98, 1437–1443, 1992.
Lu, X. T., Yin, J. X., Jepsen, M. R., and Tang, J. W.: Ecosystem carbon storage and partitioning in a tropical seasonal forest in Southwestern China, Forest Ecol. Manag. 260, 1798–1803, 2010.
Moreno-Gutierrez, C., Dawson, T. E., Nicolas, E., and Querejeta, J. I.: Isotopes reveal contrasting water use strategies among coexisting plant species in a Mediterranean ecosystem, New Phytol., 196, 489–496, 2012.
Nie, Y. P., Chen, H. S., Wang, K. L., and Ding, Y. L.: Seasonal variations in leaf δ13C values: implications for different water-use strategies among species growing on continuous dolomite outcrops in subtropical China, Acta Physiol. Plant., 36, 2571–2579, 2014.
Niinemets, U., Diaz-Espejo, A., Flexas, J., Galmes, J., and Warren, C. R.: Role of mesophyll diffusion conductance in constraining potential photosynthetic productivity in the field, J. Exp. Bot., 60, 2249–2270, 2009a.
Niinemets, U., Wright, I. J., and Evans, J. R.: Leaf mesophyll diffusion conductance in 35 Australian sclerophylls covering a broad range of foliage structural and physiological variation, J. Exp. Bot., 60, 2433–2449, 2009b.
Olsovska, K., Kovar, M., Brestic, M., Zivcak, M., Slamka, P., and Shao, H. B.: Genotypically identifying Wheat mesophyll conductance regulation under progressive drought stress, Front. Plant Sci., 7, 1111, https://doi.org/10.3389/fpls.2016.01111, 2016.
Peguero-Pina, J. J., Flexas, J., Galmes, J., Niinemets, U., Sancho-Knapik, D., Barredo, G., Villarroya, D., and Gil-Pelegrin, E.: Leaf anatomical properties in relation to differences in mesophyll conductance to CO2 and photosynthesis in two related Mediterranean Abies species, Plant Cell Environ., 35, 2121–2129, 2012.
Peguero-Pina, J. J., Siso, S., Flexas, J., Galmes, J., Garcia-Nogales, A., Niinemets, U., Sancho-Knapik, D., Saz, M. A., and Gil-Pelegrin, E.: Cell-level anatomical characteristics explain high mesophyll conductance and photosynthetic capacity in sclerophyllous Mediterranean oaks, New Phytol., 214, 585–596, 2017a.
Peguero-Pina, J. J., Siso, S., Flexas, J., Galmes, J., Niinemets, U., Sancho-Knapik, D., and Gil-Pelegrin, E.: Coordinated modifications in mesophyll conductance, photosynthetic potentials and leaf nitrogen contribute to explain the large variation in foliage net assimilation rates across Quercus ilex provenances, Tree Physiol., 37, 1084–1094, 2017b.
Pons, T. L., Flexas, J., Von Caemmerer, S., Evans, J. R., Genty, B., Ribas-Carbo, M., and Brugnoli, E.: Estimating mesophyll conductance to CO2: methodology, potential errors, and recommendations, J. Exp. Bot., 60, 2217–2234, 2009.
Prentice, I. C., Dong, N., Gleason, S. M., Maire, V., and Wright, I. J.: Balancing the costs of carbon gain and water transport: testing a new theoretical framework for plant functional ecology, Ecol. Lett., 17, 82–91, 2014.
Saez, P. L., Bravo, L. A., Cavieres, L. A., Vallejos, V., Sanhueza, C., Font-Carrascosa, M., Gil-Pelegrin, E., Peguero-Pina, J. J., and Galmes, J.: Photosynthetic limitations in two Antarctic vascular plants: importance of leaf anatomical traits and Rubisco kinetic parameters, J. Exp. Bot., 68, 2871–2883, 2017.
Sharkey, T. D.: Mesophyll conductance: constraint on carbon acquisition by C3 plants, Plant Cell Environ., 35, 1881–1883, 2012.
Sharkey, T. D., Vassey, T. L., Vanderveer, P. J., and Vierstra, R. D.: Carbon metabolism enzymes and photosynthesis in transgenic tobacco (Nicotiana tabacum L.) having excess phytochrome, Planta, 185, 287–296, 1991.
Sharkey, T. D., Bernacchi, C. J., Farquhar, G. D., and Singsaas, E. L.: Fitting photosynthetic carbon dioxide response curves for C3 leaves, Plant Cell Environ., 30, 1035–1040, 2007.
Sullivan, P. L., Wymore, A., McDowell, W. H., Aarons, S., Aciego, S., Anders, A. M., Anderson, S., Aronson, E., Arvin, L., Bales, R., Berhe, A. A., Billings, S., Brantley, S. L., Brooks, P., Carey, C., Chorover, J., Comas, X., Covington, M., Dere, A., Derry, L., Dietrich, W. E., Druhan, J., Fryar, A., Giesbrecht, I., Groffman, P., Hall, S., Harman, C., Hart, S., Hayes, J., Herndon, E., Hirmas, D., Karwan, D., Kinsman-Costello, L., Kumar, P., Li, L., Lohse, K., Ma, L., Macpherson, G. L., Marshall, J., Martin, J. B., Miller, A. J., Moore, J., Papnicolauo, T., Prado, B., Richter, D. B., Riebe, C., Rempe, D., Ward, A., Ward, D., West, N., Welty, C., White, T., and Yang, W.: New Opportunities for Critical Zone Science, Report of 2017 Arlington CZO All Hands Meeting white booklet: Discuss new opportunities for CZ Science, available at: https://criticalzone.org/images/national/associated-files/1National/CZO_2017_White_Booklet_Final.pdf (last access: 11 July 2018), 2017.
Terashima, I., Araya, T., Miyazawa, S., Sone, K., and Yano, S.: Construction and maintenance of the optimal photosynthetic systems of the leaf, herbaceous plant and tree: an eco-developmental treatise, Ann. Bot., 95, 507–519, 2005.
Terashima, I., Hanba, Y. T., Tazoe, Y., Vyas, P., and Yano, S.: Irradiance and phenotype: comparative eco-development of sun and shade leaves in relation to photosynthetic CO2 diffusion, J. Exp. Bot., 57, 343–354, 2006.
Terashima, I., Hanba, Y. T., Tholen, D., and Niinemets, U.: Leaf Functional Anatomy in Relation to Photosynthesis, Plant Physiol., 155, 108–116, 2011.
Tomas, M., Flexas, J., Copolovici, L., Galmes, J., Hallik, L., Medrano, H., Ribas-Carbo, M., Tosens, T., Vislap, V. and Niinemets, U.: Importance of leaf anatomy in determining mesophyll diffusion conductance to CO2 across species: quantitative limitations and scaling up by models, J. Exp. Bot., 64, 2269–2281, 2013.
Tosens, T., Nishida, K., Gago, J., Coopman, R.E., Cabrera, H.M., Carriqui, M., Laanisto, L., Morales, L., Nadal, M., Rojas, R., Talts, E., Tomas, M., Hanba, Y., Niinemets, U., and Flexas, J.: The photosynthetic capacity in 35 ferns and fern allies: mesophyll CO2 diffusion as a key trait, New Phytol., 209, 1576–1590, 2016.
Veromann-Jurgenson, L. L., Tosens, T., Laanisto, L., and Niinemets, U.: Extremely thick cell walls and low mesophyll conductance: welcome to the world of ancient living!, J. Exp. Bot., 68, 1639–1653, 2017.
Wang, J., Wen, X. F., Zhang, X. Y., Li, S. G., and Zhang, D. Y.: Magnesium enhances the photosynthetic capacity of a subtropical primary forest in the Karst critical zone, Sci. Rep.-UK, 8, 7406,https://doi.org/10.1038/s41598-018-25839-1, 2018.
Warren, C.: Estimating the internal conductance to CO2 movement, Funct. Plant Biol., 33, 431–442, 2006.
Warren, C. R. and Adams, M. A.: Internal conductance does not scale with photosynthetic capacity: implications for carbon isotope discrimination and the economics of water and nitrogen use in photosynthesis, Plant Cell Environ., 29, 192–201, 2006.
Wen, L., Li, D. J., Yang, L. Q., Luo, P., Chen, H., Xiao, K. C., Song, T. Q., Zhang, W., He, X. Y., Chen, H. S., and Wang, K. L.: Rapid recuperation of soil nitrogen following agricultural abandonment in a karst area, southwest China, Biogeochemistry, 129, 341–354, 2016.
Zeng, C., Liu, Z. H., Zhao, M., and Yang, R.: Hydrologically driven variations in the karst-related carbon sink fluxes: Insights from high-resolution monitoring of three karst catchments in Southwest China, J. Hydrol., 533, 74–90, 2016.
Zhang, X. B., Bai, X. Y., and He, X. B.: Soil creeping in the weathering crust of carbonate rocks and underground soil losses in the karst mountain areas of southwest china, Carbonate. Evaporite., 26, 149–153, 2011.