the Creative Commons Attribution 4.0 License.
the Creative Commons Attribution 4.0 License.
 | 20 Nov 2018
Effects of elevated CO2 and phytoplankton-derived organic matter on the metabolism of bacterial communities from coastal waters
Antonio Fuentes-Lema
Henar Sanleón-Bartolomé
Luis M. Lubián
Cristina Sobrino
Microcosm experiments to assess the bacterioplankton's response to phytoplankton-derived organic matter obtained under current and future ocean CO2 levels were performed. Surface seawater enriched with inorganic nutrients was bubbled for 8 days with air (current CO2 scenario) or with a 1000 ppm CO2 air mixture (future CO2 scenario) under solar radiation. The organic matter produced under the current and future CO2 scenarios was subsequently used as an inoculum. Triplicate 12 L flasks filled with 1.2 µm of filtered natural seawater enriched with the organic matter inocula were incubated in the dark for 8 days under CO2 conditions simulating current and future CO2 scenarios, to study the bacterial response. The acidification of the media increased bacterial respiration at the beginning of the experiment, while the addition of the organic matter produced under future levels of CO2 was related to changes in bacterial production and abundance. This resulted in a 67 % increase in the integrated bacterial respiration under future CO2 conditions compared to present CO2 conditions and 41 % higher integrated bacterial abundance with the addition of the acidified organic matter compared to samples with the addition of non acidified organic matter. This study demonstrates that the increase in atmospheric CO2 levels can impact bacterioplankton metabolism directly, by changes in the respiration rate, and indirectly, by changes on the organic matter, which affected bacterial production and abundance.
- Article
(9464 KB) - Full-text XML
-
Supplement
(481 KB) - BibTeX
- EndNote


The increase in fossil fuel burning, cement production and deforestation together with changes in land use have resulted in an accumulation of atmospheric CO2 at levels never seen before in the past 2 million years (Caldeira and Wickettt, 2008; Le Quéré et al., 2015). Atmospheric gases can freely diffuse into the ocean surface, which has already absorbed about 30 % of the emitted anthropogenic CO2, perturbing the carbonate system and decreasing ocean pH in a process known as ocean acidification (Sabine et al., 2004; IPPC, 2014).
The latest IPCC report shows that the pH of ocean surface waters has already decreased by 0.1, corresponding to a 26 % increase in acidity. If mitigation strategies for global change are not adopted and CO2 emissions continue as usual, ocean pH values will drop about 0.3–0.7 units by the end of the 21st century (IPPC, 2014). The decrease in seawater pH has strong effects on the ecosystem, the aquatic organisms and the interactions among them. Studies about its consequences in the surface ocean have been primarily focused on calcifying organisms such as corals or coralline algae, because they participate in the formation of habitats and human services (Fabry et al., 2008; Langdon et al., 2003). Recent meta-analysis studies also revealed decreased survival, growth, development and an abundance of a broad range of marine organisms, although the magnitude of these responses varies between taxonomic groups, including variation within similar species (Kroeker et al., 2013). Additionally, other authors have demonstrated that ocean acidification can increase growth, primary production and N2 fixation rates in some phytoplankton species (Barcelos e Ramos et al., 2007; Fu et al., 2007; Iglesias-Rodriguez et al., 2008; Levitan et al., 2007). In contrast with the abundant information about phytoplankton, very little is known about the response of bacterioplankton.
Heterotrophic bacteria play an important role in the planktonic community, since they are responsible for the majority of the organic matter remineralization (Azam et al., 1998; Cole et al., 1988; Nagata et al., 2000), allowing the primary producers to make use of the recycled inorganic nutrients. They also return dissolved organic carbon (DOC) to the marine food web via its incorporation into bacterial biomass through what is called the microbial loop (Azam et al., 1983). However, the microbial response can change depending on the phytoplankton's taxonomic composition and the nutrient levels, and therefore the productivity, of the water (Bunse et al., 2016; Sala et al., 2016; Teira et al., 2012). Despite this important role of bacterioplankton in the marine food web and biogeochemical cycles, only a few studies have been designed to elucidate the effects of ocean acidification on bacteria metabolism or its interaction with the abiotic (i.e., temperature, ultraviolet radiation, mixing, etc.) and biotic factors (i.e., algae-derived organic matter, microbial community composition, trophic interactions, etc.). Some of these studies suggest an absence of significant metabolic responses in experiments where CO2 levels were manipulated (Allgaier et al., 2008; Newbold et al., 2012; Rochelle-Newall et al., 2004). The fast acclimation of the metabolic machinery to low pH values might have occurred in those experiments, since bacteria and other heterotrophic organisms occasionally suffer lower pH values than those predicted by ocean acidification scenarios (Joint et al., 2011). On the contrary, other authors have reported that a decrease in seawater pH can potentially influence bacterial metabolism by changes in bacterial production and growth rates in natural communities, although the results show different responses depending on the study (Coffin et al., 2004; Grossart et al., 2006; Motegi et al., 2013; Spilling et al., 2016). More recently, results from a phytoplankton-bloom mesocosm study have demonstrated, through metatranscriptomic analysis, that acidification can enhance the expression of genes that encode proton pumps to maintain homeostasis under high CO2 conditions (Bunse et al., 2016).
An interesting point is that the experimental design in most of the published CO2 studies did not allow for distinguishing between direct effects on the bacteria per se and indirect effects, for example, due to changes in phytoplankton community composition or to changes in organic matter. Therefore, indirect pathways such as those affecting the availability of organic matter in terms of quantity (because of an increase in phytoplankton primary production; Hein and Sand-Jensen, 1997; Riebesell et al., 2007) or in terms of quality (because of changes in the composition of phytoplankton-derived organic matter; Engel et al., 2014), should be also studied to determine the effect of ocean acidification on bacterioplankton. For example, recent results have demonstrated that pH values predicted for future ocean acidification scenarios were close to the optimum values for extracellular enzyme activity (Grossart et al., 2006; Piontek et al., 2010; Yamada and Suzumura, 2010). Higher enzymatic activity resulted in a higher rate of organic matter transformation and increases in bacteria performance. It has been also demonstrated that decreases in pH might increase the rate of extracellular dissolved organic carbon production from phytoplankton (DOCp) and the formation of transparent exopolymer particles (TEPs) (Engel, 2002; Engel et al., 2004), although the contrary has also been observed, and there is not a clear response to this matter (Sobrino et al., 2014). In addition, a higher CO2 concentration in seawater could modify the ratios of particulate organic matter, which may substantially affect the activity of bacteria and the carbon fluxes in the future ocean (Engel et al., 2014; Riebesell et al., 2007).
The main goal of our study was to investigate the direct and indirect effects of ocean acidification on the interaction between phytoplankton-derived organic matter and bacterial metabolism. We analyzed the changes in bacterial abundance, production and respiration in a coastal plankton community from an upwelling system.
2.1 Experimental setup
The experiment to determine the response of bacterioplankton communities to phytoplankton-derived organic matter produced under current and future CO2 scenarios were performed in two phases at the Toralla Marine Science Station, from now on referred to as ECIMAT (Estación de Ciencias Mariñas de Toralla, University of Vigo, http://ecimat.uvigo.es, last access: 9 November 2018; Fig. 1). The first phase consisted in an 8-day incubation under full solar radiation (UV radiation included) of a natural phytoplankton community enriched with inorganic nutrients under current and future CO2 conditions. In the second phase, the organic matter obtained from the previous incubation was added to a natural bacterioplankton community to assess the interactions between organic matter amendments and acidification on bacterial metabolism for 8 days (Fig. 2).
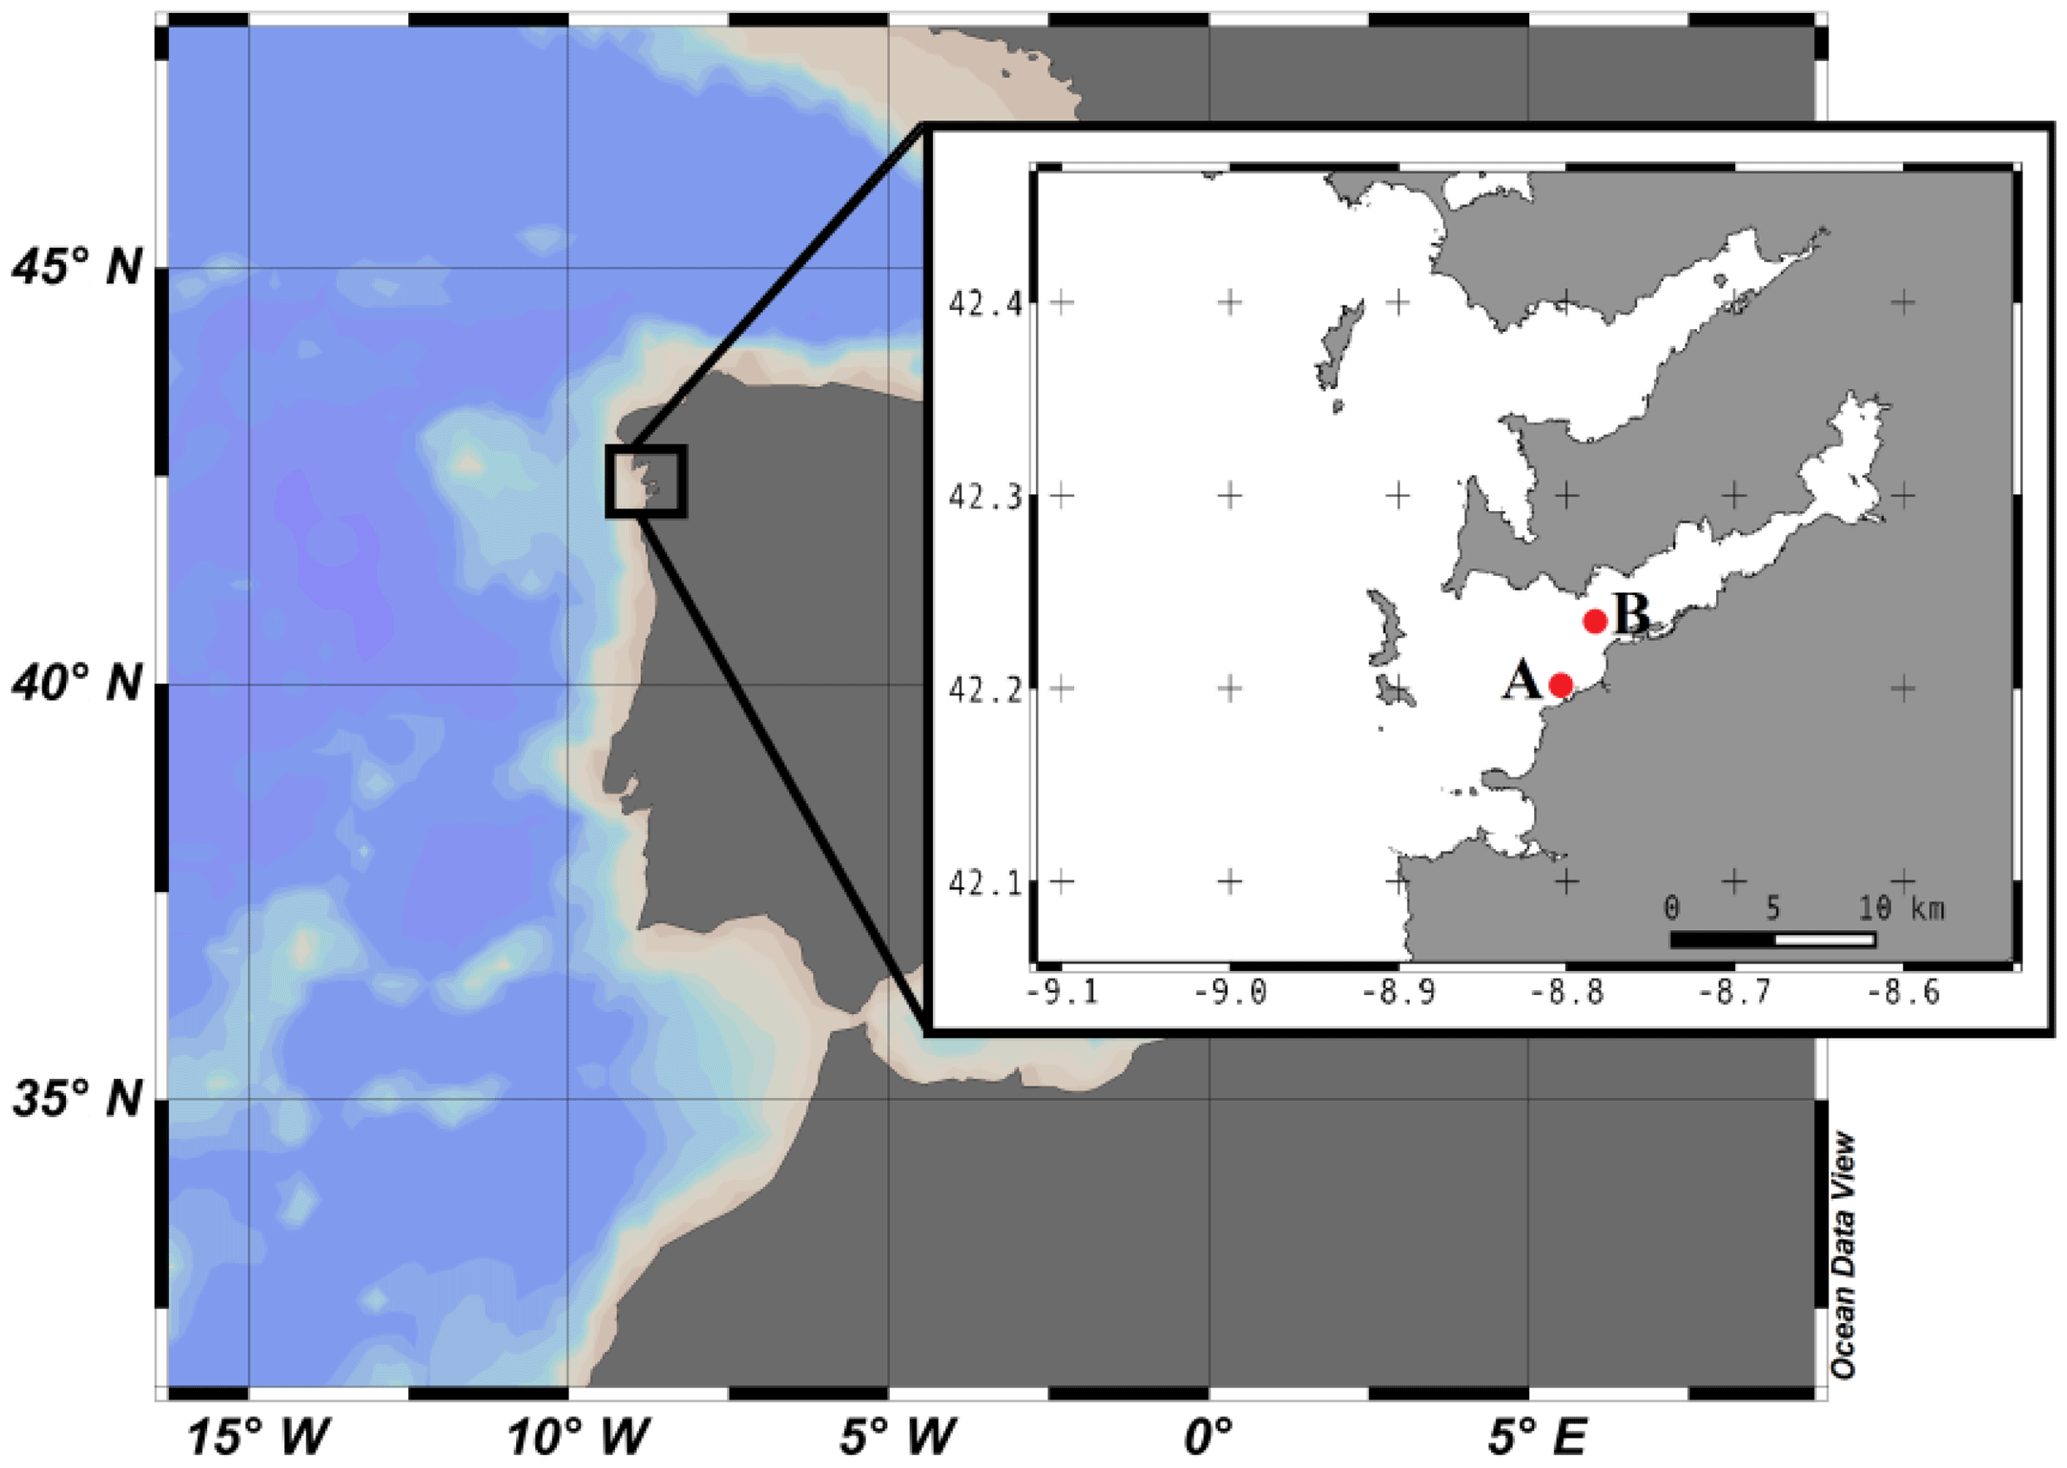
Figure 1Geographical location of Ría de Vigo in the NW Iberian Peninsula. The insert shows a more detailed map of the Ría de Vigo and the locations of (A) ECIMAT and (B) the sampling station.
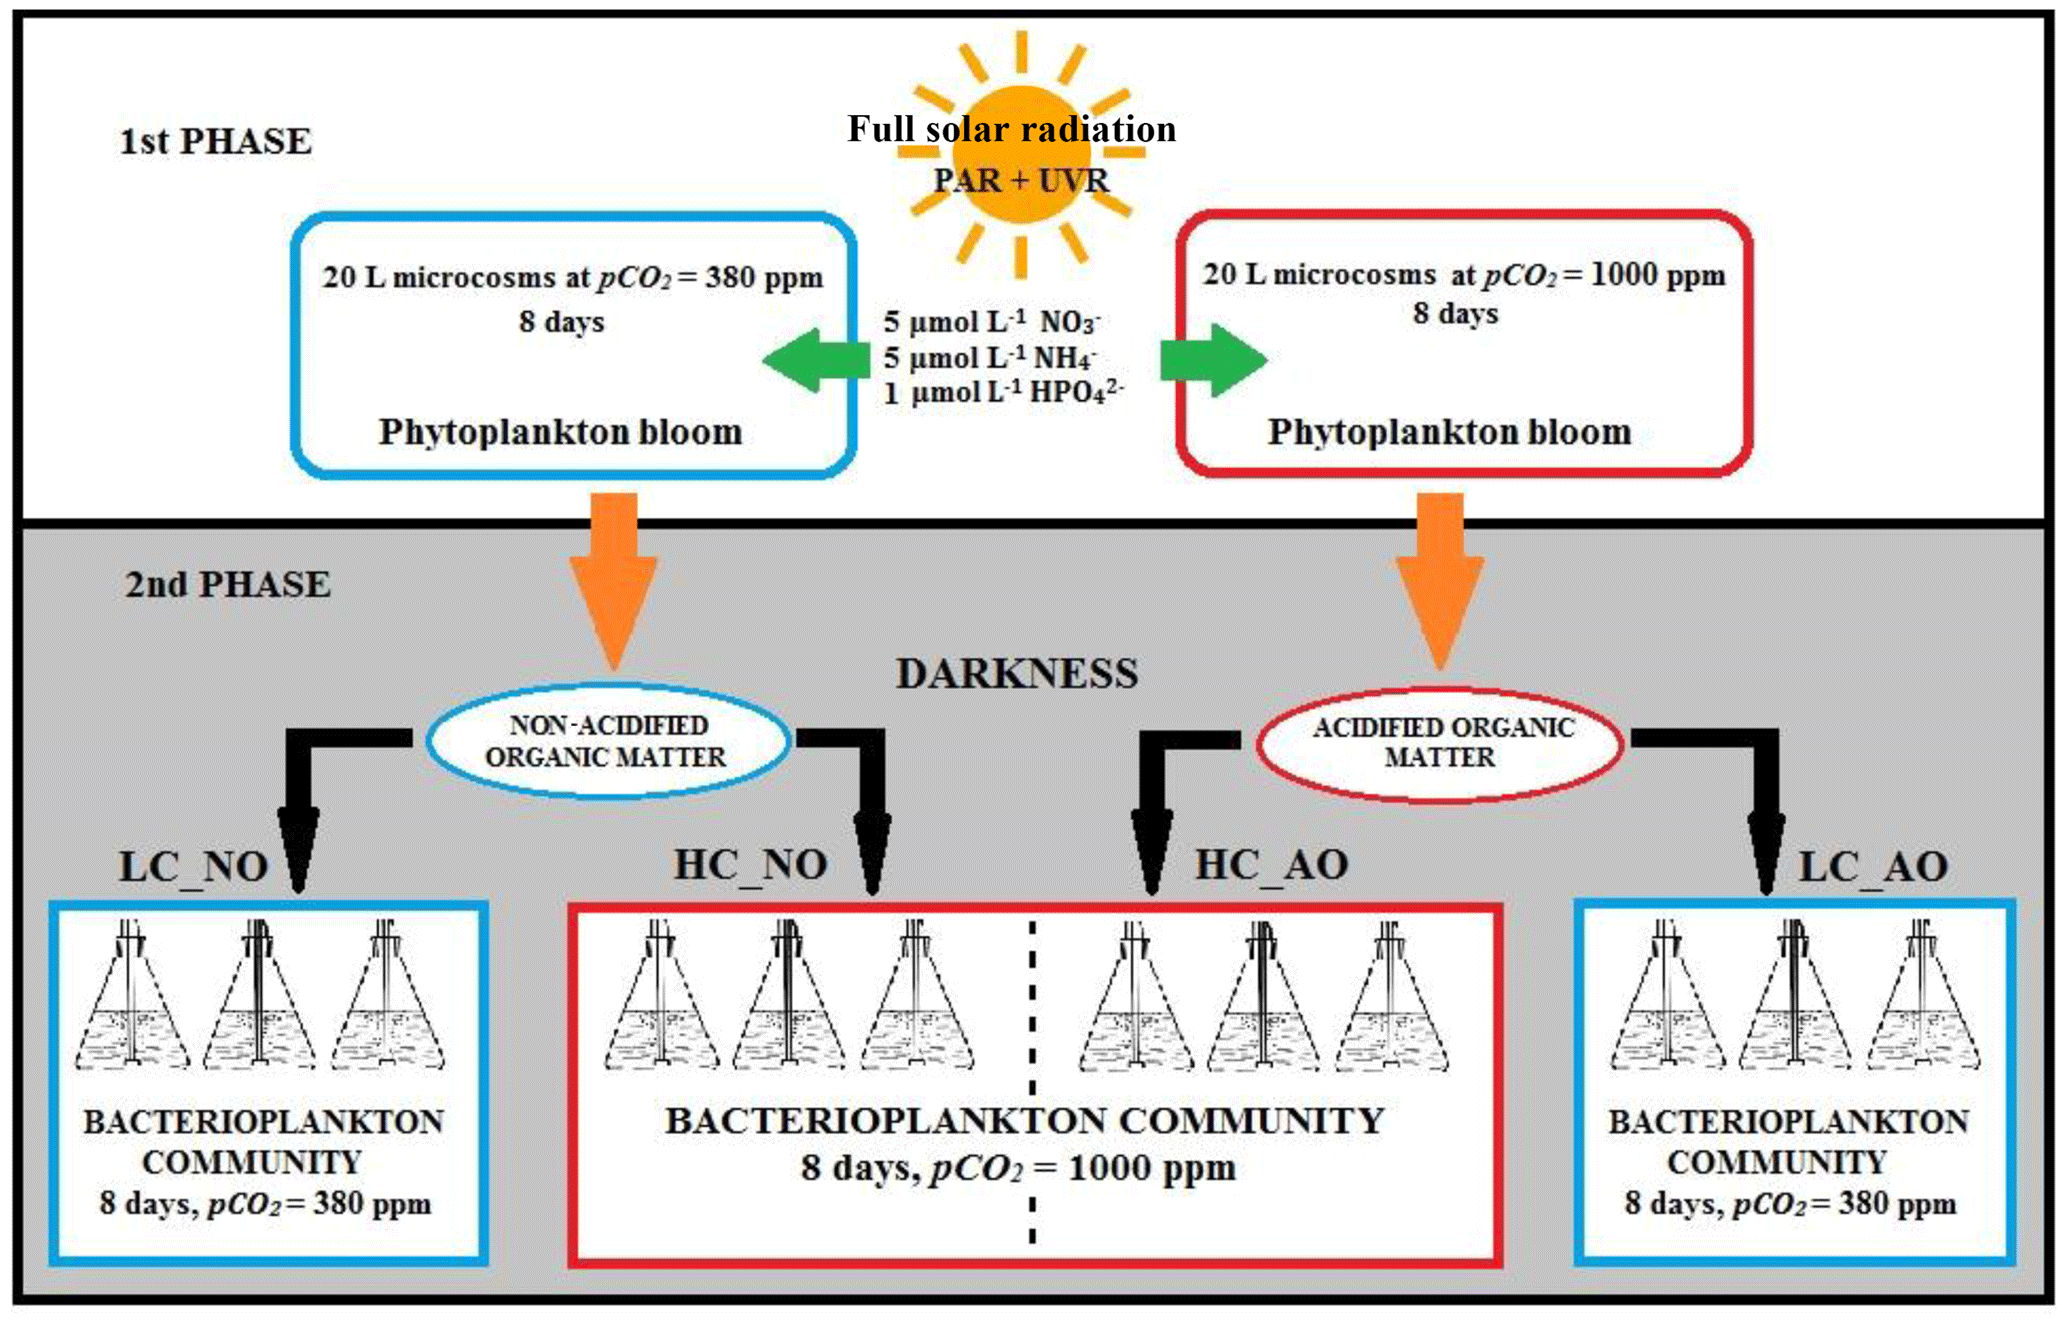
Water from 5 m depth was collected with a Niskin bottle on board of the R/V Mytilus from a fixed central station at the Ría de Vigo (42.23∘ N; Long: 8.78∘ W, Fig. 1) on 27 June 2013 and immediately transported to the ECIMAT (approx. 30 min). The Ría de Vigo is a highly productive and dynamic embayment located in the northwestern Iberian Peninsula, characterized by the intermittent upwelling of cold and inorganic nutrient-rich eastern North Atlantic central water (Fraga, 1981). Upwelled water in the Iberian system also brings high CO2 concentrations, so annual pCO2 can oscillate between maximum values of 750 ppm CO2 during the upwelling events and minimum values of 270 ppm CO2 during the downwelling season (Alvarez et al., 1999; Gago et al., 2003). The sample was prescreened using a 200 µm sieve to avoid zooplankton grazing and was distributed in six aged and acid-washed UVR transparent 20 L Cubitainers (Nalgene I-Chem Certified Series™ 300 LDPE Cubitainers). The Cubitainers were submerged in two 1500 L tanks located outdoors, in an open area free of shadows. The tanks were connected to a continuous seawater pumping system and covered by a neutral density screen (75 % transmittance) to assure cooling at the in situ temperature and to avoid photoinhibition by the highly damaging summer irradiances under the static conditions of the Cubitainers, respectively. Nitrate, ammonium and phosphate were added the first and fifth day of the experiment to maintain the saturated nutrient conditions, namely the final concentrations of 5 µmol L−1 nitrate (), 5 µmol L−1 ammonium () and 1 µmol L−1 phosphate (). Triplicate samples were bubbled with regular atmospheric air (low carbon treatment – LC; approx. 380 ppm CO2) or with a mixture of the atmospheric air and CO2 from a gas tank from Air Liquide Spain (high carbon treatment – HC; 1000 ppm CO2). At the end of the incubation, the samples grown under present and future levels of CO2 were stored frozen at −20 ∘C until the start of the second phase, ten days later, to be used as a naturally derived organic matter inocula. The inocula included both dissolved and particulate organic matter, as observed in nature, but since bacteria preferentially use the labile dissolved organic matter pool for growth (Lechtenfeld et al., 2015; Nagata et al., 2000), we focused our measurements of the organic matter on the dissolved fraction.
For the second phase, water collection was similar to the previous one. Once at ECIMAT, seawater was filtered through glass fiber filters with a 1.2 µm pore size (GF/C Whatman Filters) to separate the bacterioplankton community from the other plankton cells. The bacterioplankton sample was distributed in 12 acid washed polycarbonate NALGENE 12 L bottles together with the phytoplankton-derived organic-matter inoculum and 0.2 µm filtered seawater (FSW), following a volume ratio, respectively. This proportion aimed to reach 10 µmol L−1 of organic carbon, which represents around 25 %–30 % of the mean excess of organic carbon observed in the surface layer of the middle Ría de Vigo, as compared with the bottom waters (Doval et al., 1997; Nieto-Cid et al., 2005). Half of the bottles were inoculated with the organic matter produced under current CO2 conditions in the previous incubation (herein named non-acidified organic matter – NO; n=6), and the other half was inoculated with the organic matter produced under future CO2 conditions by acidifying the media as explained above (herein named acidified organic matter – AO; n=6). In each case, three replicates were aerated with ambient CO2 levels (low carbon treatment – LC; LC_NO and LC_AO) or air with 1000 ppm CO2 (high carbon treatment – HC; HC_NO and HC_AO). This experimental setup produced four different treatments from the least modified sample (LC_NO) to the most altered sample (HC_AO; Fig. 2). The bottles were located in a walk-in growth chamber under dark conditions at 15 ∘C, similar to the in situ temperature. The dark incubation for the bacterioplankton samples aimed to focus the experiment on the two factors of the study, CO2 and the addition of organic matter, avoiding the potential effects of solar radiation on bacterioplankton and organic matter that might complicate the interpretation of the results, therefore redirecting the paper from the objectives of the study.
2.2 DIC, pH and CO2 analysis
Triplicate 30 mL samples were filtered daily through nitrocellulose filters with a 0.2 µm pore size. The filtrate was encapsulated without air bubbles in 10 mL serum vials and stored at 4 ∘C in dark conditions until analysis, which occurred immediately after the incubation ended. A dissolved inorganic carbon (DIC) analysis was carried out through acidification with 10 % HCl using a N2 bubbler connected to an infrared gas analyzer (LICOR 7000), and calibration was performed using a Na2CO3 standard curve. pH and temperature were measured daily with a Crison pH 25 pH meter and salinity with a thermosalinometer Pioneer 30. The pH meter was calibrated to the total hydrogen ion concentration pH scale with a 2-amino-2-hydroxymethyl-1,3-propanediol (tris) buffer prepared in synthetic seawater (Dickson and Goyet, 1994). The partial pressure of CO2 (pCO2) in the samples was calculated from salinity, temperature, pH and DIC using the software csys.m from Zeebe and Wolf-Gladrow (2001).
2.3 Chlorophyll a concentration
Seawater samples for Chl a analysis were taken every day during the first incubation. A volume of 150 mL from each Cubitainer was gently filtered through GF/F filters under dim light and immediately stored at −20 ∘C until further analysis. For Chl a extraction, the filters were kept at 4 ∘C overnight in acetone 90 %. Chl a concentration was estimated with a Turner Design Fluorometer TD-700 and a pure Chl a standard solution was used for calibration.
2.4 Bacterial production and respiration
Bacterial production (BP) was measured following the (3H) leucine incorporation method (Smith and Azam, 1992). Three replicates and one killed control were sampled (1 mL) from each experimental unit on days 0, 1, 2, 3, 4 and 7 of the second incubation. Samples were spiked with 40 µL leucine (47 µCi mL−1 specific activity stock solution), and incubated for 80 min in the same chamber and growth conditions as the bacterioplankton assemblages. Processed samples were analyzed in a Wallac Win-Spectral 1414 Scintillation Counter, and the BP was calculated from the leucine uptake rates employing a theoretical leucine to a carbon conversion factor of 3.1 kg C mol Leu−1 (Teira et al., 2012). This conversion factor was obtained from natural bacterioplankton communities sampled at the two different sampling sites of the Ría de Vigo, characterized by different CO2 concentrations (Ría and shelf; Gago et al., 2003) and subjected to additions of organic and inorganic nutrients (Martínez-García et al., 2010). The inner station (Ría) is the same sampling site than the location chosen for our study. No significant differences in conversion factors were found between both sampling locations or between the control and the treatment with organic matter additions (Martínez-García et al., 2010).
Samples for bacterial respiration (BR) were taken on days 0, 2, 4 and 7 of the second incubation. BR in each sample was determined from the difference of the dissolved oxygen concentration consumed between the start and the end of a 24 h dark incubation using 50 mL Winkler bottles, duplicated for each incubation time and replicated for each treatment (i.e., 12 Winkler bottles per treatment). The 24 h incubation was carried out at the same temperature as the experiment. Dissolved oxygen concentrations were determined by automated high-precision Winkler titration, using a potentiometric end point detector, Metrohm 721 DMS Titrino, as described in Serret et al. (1999). Bacterial carbon demand (BCD; µmol C L−1 d−1) was calculated as the sum of BP and BR. Bacterial growth efficiency (BGE) was obtained from the proportion of the BCD that was used for bacterial production ().
2.5 Flow cytometry analysis
For bacterioplankton counts (i.e., second incubation), samples were stained with 2.5 µM of SYTO-13 (Molecular Probes) dissolved in dimethyl sulfoxide. The samples were incubated for 10 min at room temperature in the dark, followed by the addition of 10 µL of a calibrated suspension of microspheres (FluoSpheres Carboxylate-Modified Microspheres – 1.0 µm nominal diameter; ThermoFisher Scientific) as an internal standard for instrument performance. Samples were then immediately analyzed in a FACSCalibur flow cytometer (Becton Dickinson). The threshold was set on the green fluorescence (FL1). Stained bacteria were discriminated and counted in a bivariate plot of side-scattered light (SSC), which is related to particle size and complexity, vs. FL1.
The viability of bacterioplankton community was measured on day 7 using the 5-Cyano-2,3-ditolyl tetrazolium chloride (CTC) dye (Gasol and Arístegui, 2007; Sieracki et al., 1999). The CTC can freely diffuse into the cells where it is reduced by healthy respiring bacteria, producing a precipitated colored orange-red formazan product. This product is detectable and quantifiable by flow cytometry (Rodriguez et al., 1992). Samples were stained with 45 mM of CTC for 60 min and then analyzed. The threshold was set on the FL3, and bacteria showing active respiration were counted in a bivariate plot of SSC vs. FL3.
All data were acquired and analyzed with the software CellQuest (Becton–Dickinson) as Flow Cytometry Standard files.
2.6 DOC concentration
Dissolved organic carbon samples were taken in 250 mL acid-washed all-glass flasks and were gently filtered through acid rinsed 0.2 µm Pall Supor filters. This entire process was done in an acid-cleaned all-glass device under low N2 flow pressure. About 10 mL of the filtrates were distributed in pre-combusted (450 ∘C for 24 h) glass ampoules acidified with 50 µL of 25 % H3PO4. The ampoules were heat sealed immediately and stored at 4 ∘C until analysis with a Shimadzu TOC-VCS analyzer following the high-temperature catalytic oxidation method (Álvarez-Salgado and Miller, 1998).
2.7 Statistical analysis
Data followed a normal distribution and homoscedasticity, tested by the Jarque–Bera test and Bartlett test, respectively. Thus, a parametric one-way analysis of variance (ANOVA) or two-way ANOVA statistical tests were used to determine differences between one or two experimental factors, respectively (i.e., CO2 in the first incubation, CO2 and organic matter addition in the second incubation). If the interaction between the two factors was significant, a multiple-comparison post-test (MCP-test) was carried out. The confidence level was established at 95 %. Statistical analysis was performed using the software package MatLab R2012b.
During the first incubation, aimed at obtaining the organic matter inocula under current and future CO2 conditions, the LC treatment pCO2 values were close to the atmospheric equilibrium, with values ranging from 419±21 ppm CO2 on day 0 to 226±38 ppm CO2 on day 3 (mean and SD, n=3; Fig. 3a). In the HC treatment, pCO2 values increased from the beginning of the incubation until they reached values of around 1200 ppm in the last 4 days. Maximum values were observed at day 5, with 1227±149 ppm CO2. The Chl a used as an indicator of the phytoplankton biomass showed similar trends in the two treatments. It increased with the initial addition of inorganic nutrients showing an early bloom on day 1, with Chl a values of 21±4 and 22±9 µg L−1 for LC and HC treatments, respectively. The Chl a concentration decreased after the bloom, keeping values close to the lowest concentrations on day 6 for the HC treatment, with 3.0±0.4 µg L−1, and on day 5 for the LC treatment, with 3.1±0.5 µg L−1 (Fig. 3a). The analysis of phytoplankton composition by flow cytometry did not show significant differences in community structure between LC and HC treatments (data not shown).
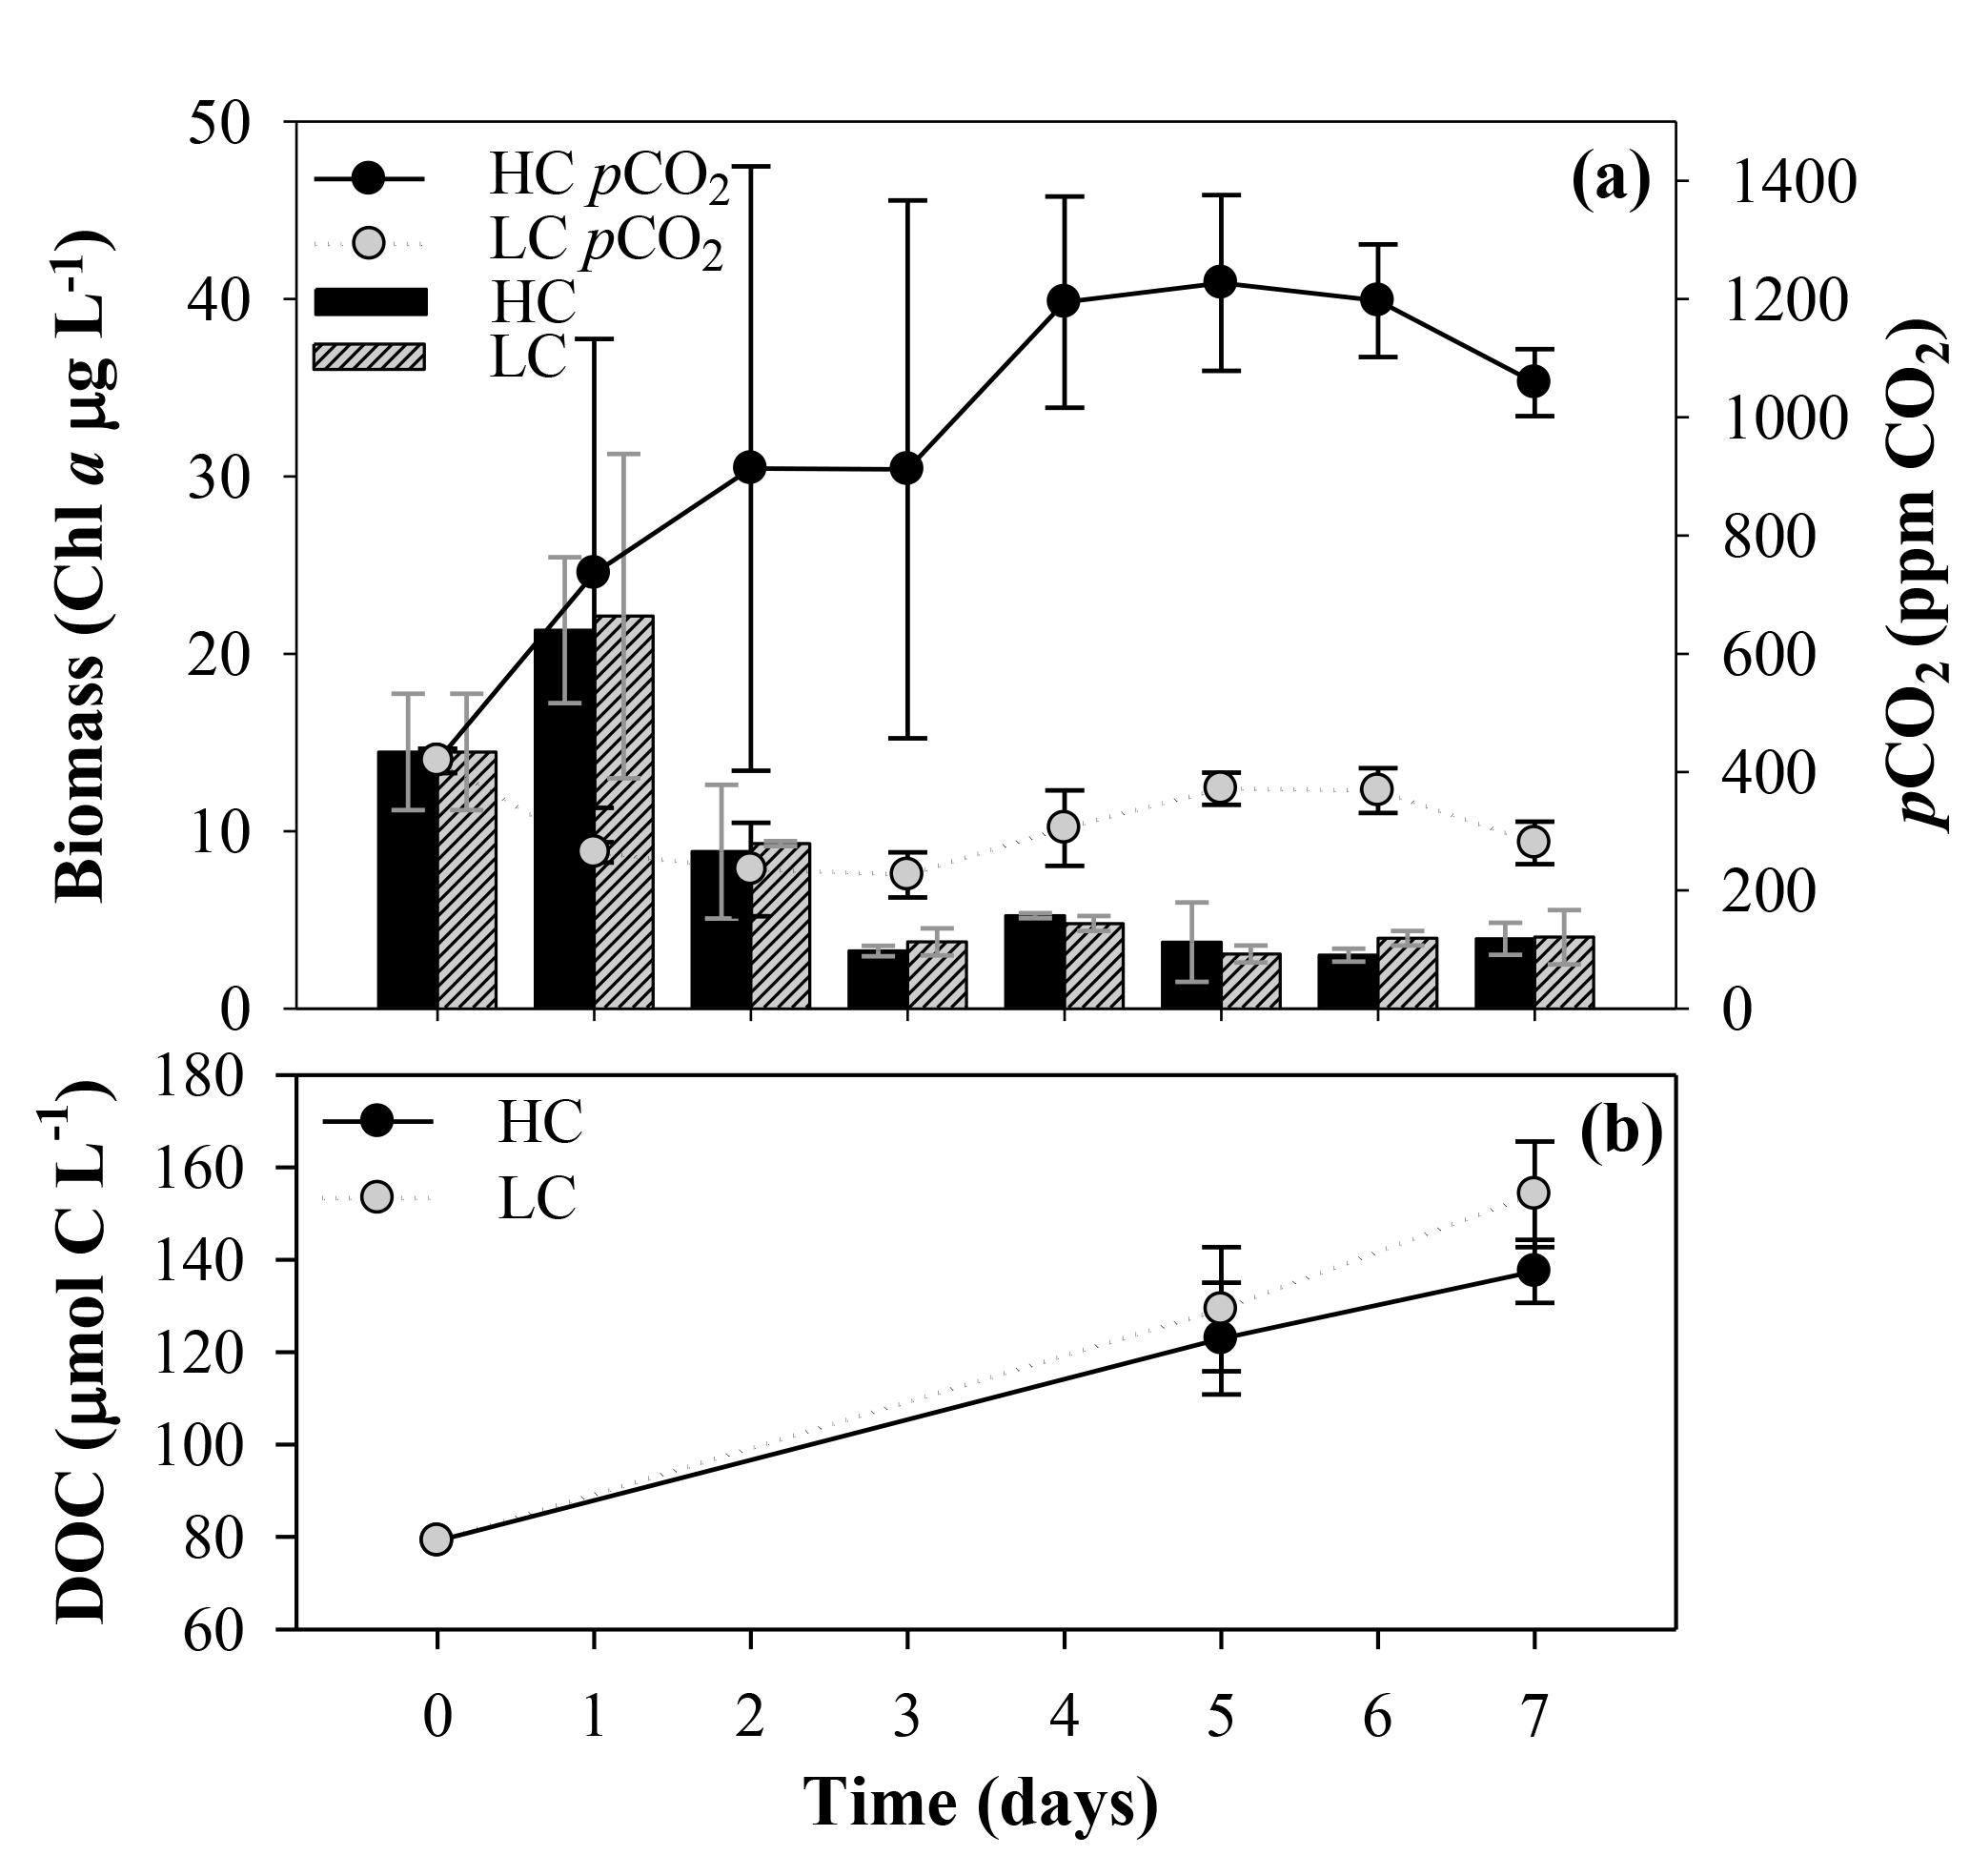
Figure 3(a) Phytoplankton biomass measured as Chl a concentration and pCO2 evolution along the first incubation period, aiming to obtain the organic matter inocula under current and future CO2 conditions. Black and striped vertical bars correspond to the Chl a mean ± SD (n=3; µg L−1) obtained under high and low carbon (HC and LC) treatments, respectively. Black and grey circles correspond to the pCO2 mean ± SD (n=3; ppm CO2) in HC and LC treatments, respectively. (b) Temporal evolution of the dissolved organic carbon (DOC) concentration (µmol C L−1) during this first incubation. The black and grey dots indicate the mean ± SD (n=3) of DOC from HC and LC treatments, respectively.
Primary production rates followed the Chl a pattern, with a marked peak blooming on the first incubation day followed by a decline afterwards in all the treatments (Fig. S1 in the Supplement). The increase in total carbon fixation during the bloom was due to an increase in both particulate organic carbon (POC) and DOCp production, but it was mainly due to POC assimilation. The percentage of extracellular release of dissolved carbon () ranged from 18 % to 77 %. DOCp, POC and therefore TOC were higher during the bloom under the LC treatment but were not significantly different from the rates observed in the HC treatment (one-way ANOVA, TOC is p=0.307, POC is p=0.242, DOCp is p=0.527 and n=6). Differences in the production rates between both treatments became negligible after the second incubation day (Fig. S1 in the Supplement).
Bulk DOC concentration increased from day 0 to maximum values on day 7, and similar to Chl a concentration and production rates, there were no significant differences between the two CO2 treatments at the end of the incubation (for the one-way ANOVA, p=0.096 and n=6; Fig. 3b). A parallel analysis of DOM fluorescence (i.e., protein-like and humic-like substances) also supported the later results (data not shown).
In the second incubation, aimed to assess the effects of CO2 and the organic matter additions on bacterioplankton, pCO2 and pH were similar within the same CO2 treatment (i.e., LC_NO and LC_AO vs. HC_NO and HC_AO), but they were significantly different between LC and HC treatments (Fig. 4a and b). pCO2 in the LC ranged between 350±28 ppm and 568±187 ppm CO2 (mean and SD, n=3) on day 5 and 2, respectively. In contrast, HC treatments increased from 397±18 ppm on day 0 to a maximum value of 2213±229 ppm on day 3, significantly different than the expected 1000 ppm pCO2 in the HC treatments. The maximum was followed by a pronounced decrease on day 4; subsequently, the values were similar to the bubbled air concentrations (1011±75 ppm on day 5; Fig. 4a). As expected from the pCO2, pH values in the LC treatments were fairly constant, with a mean value of 8.07, but decreased markedly from 8.03 on day 0 to 7.51 on day 3 in the HC treatment. After this minimum, pH increased to values around 7.8 until the end of the experiment (Fig. 4b).
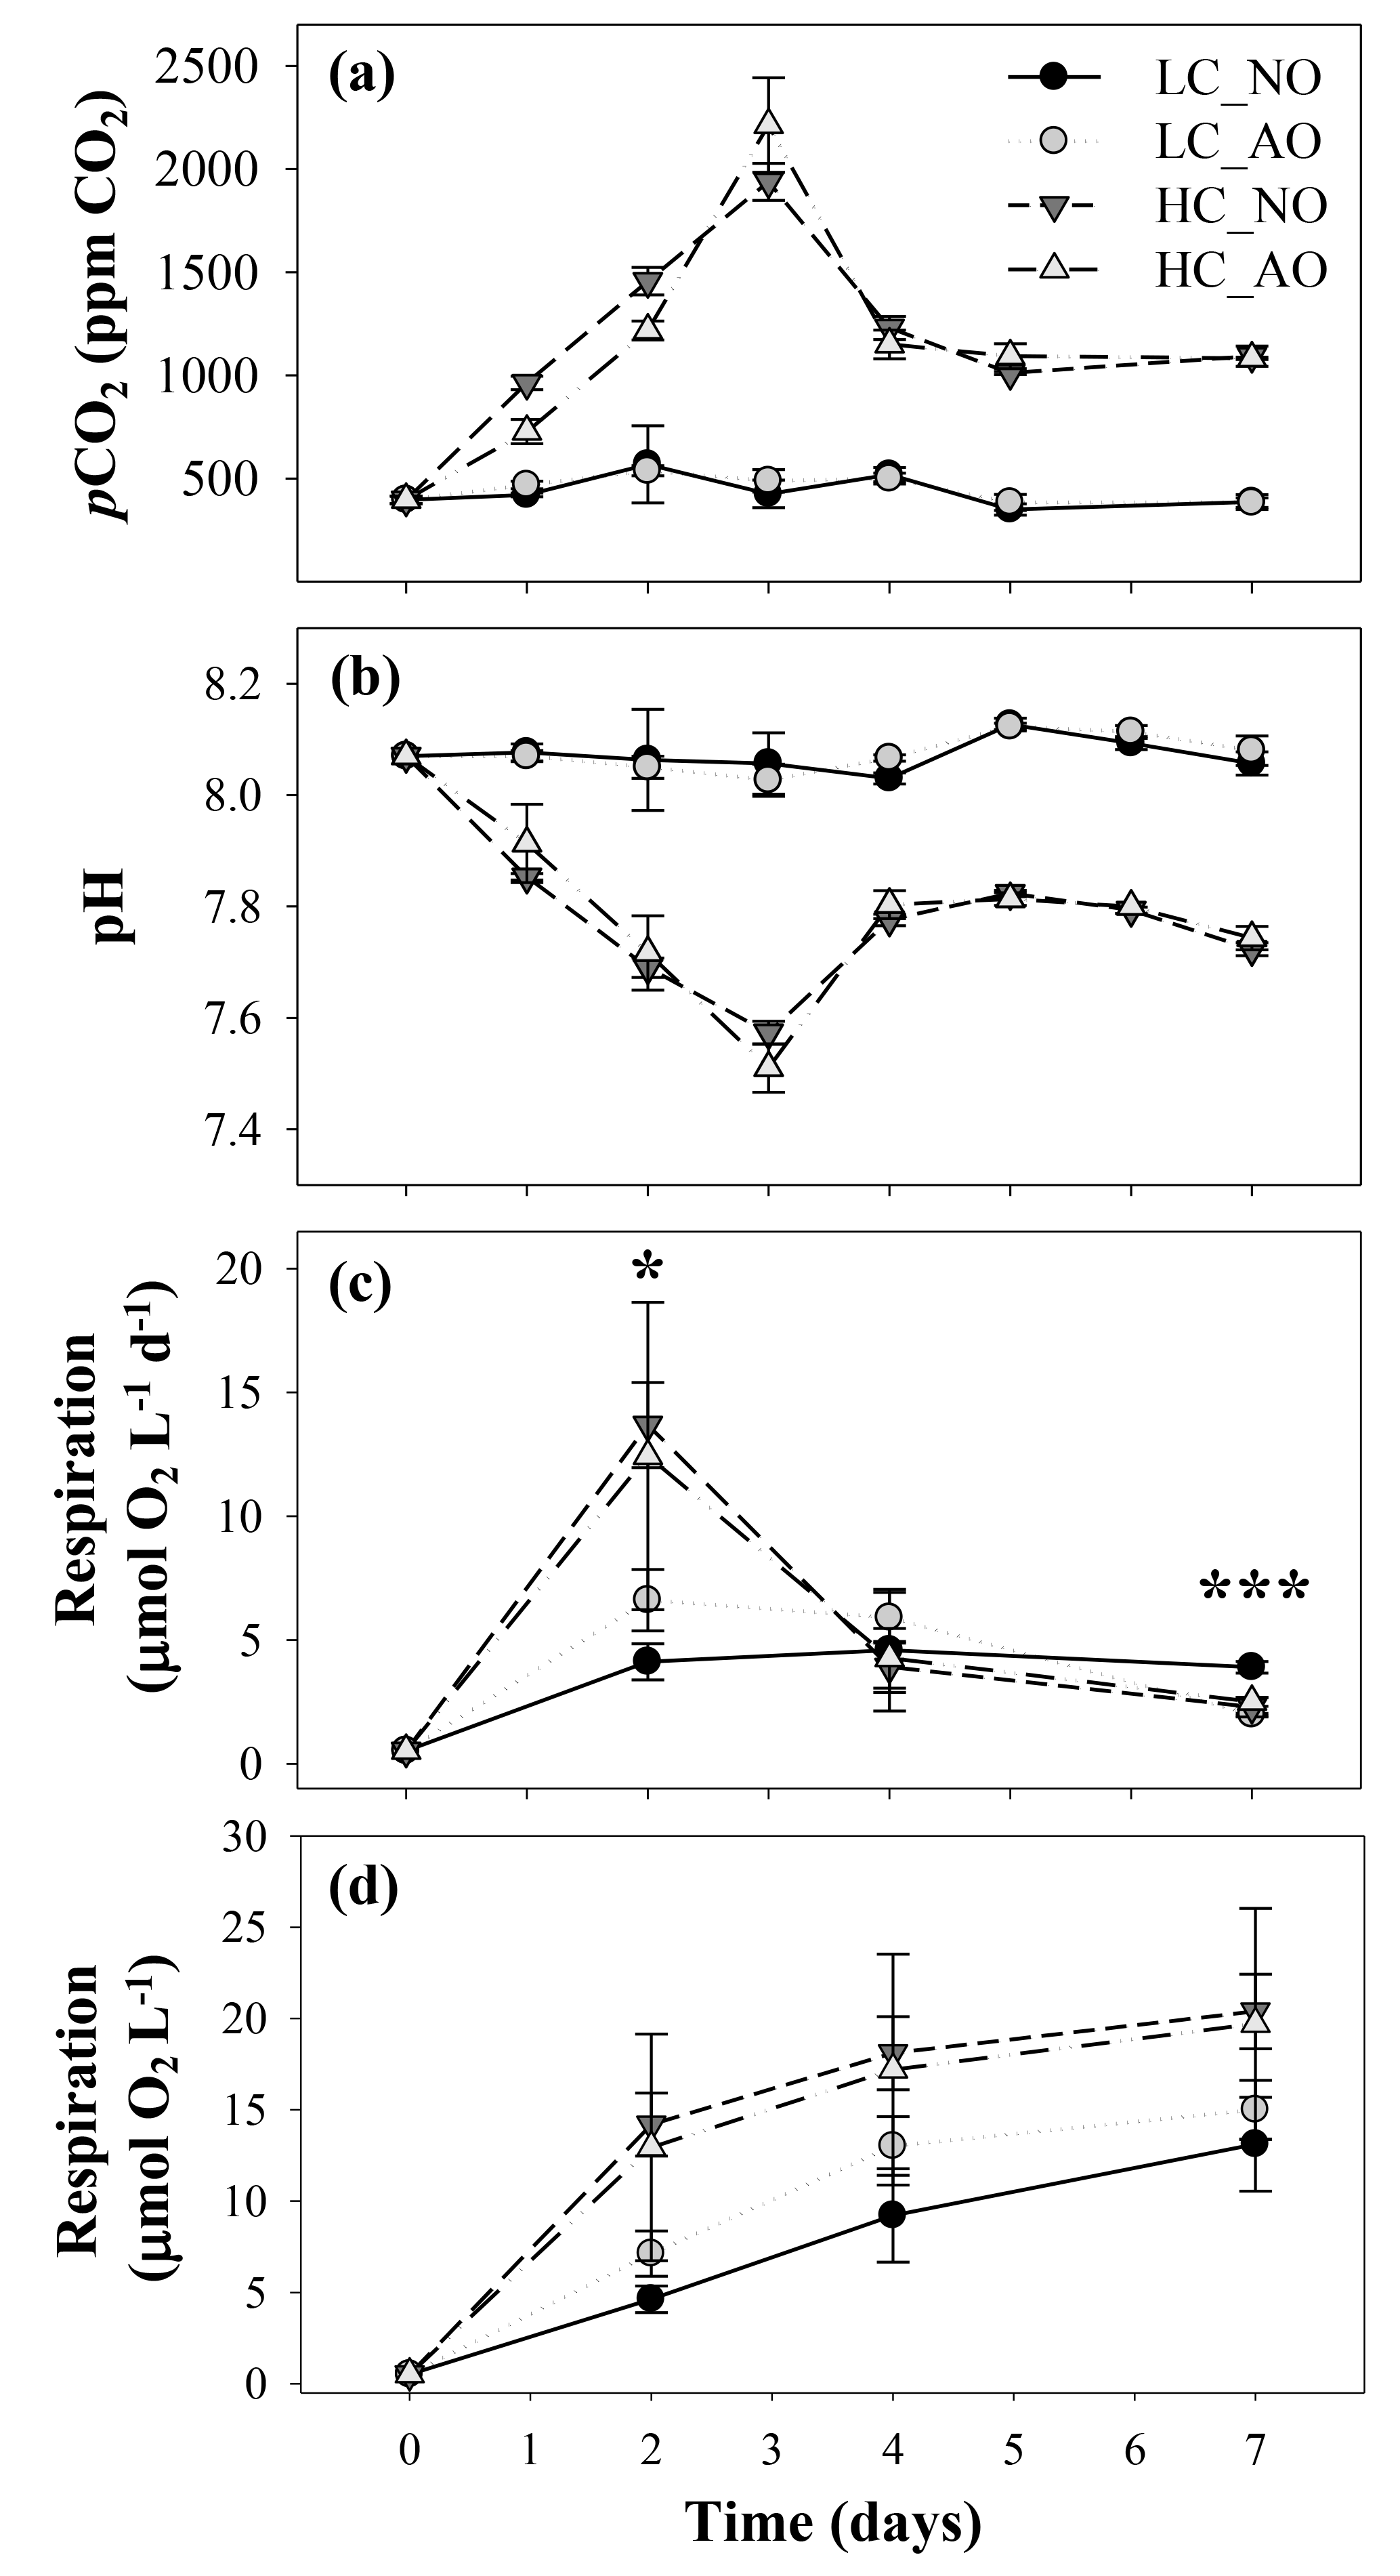
Figure 4(a) pCO2 (ppm CO2) and (b) pH values in the four treatments of the second incubation period (mean ± SD; n=3). (c) Temporal evolution of bacterial respiration (µmol O2 L−1 d−1) and (d) cumulative bacterial respiration (µmol O2 L−1) during the second incubation period in the four treatments (mean ± SD; n=3). In all figures, black and grey triangles represent HC_NO and HC_AO treatments, respectively. Black and grey circles correspond to LC_NO and LC_AO treatments, respectively. The asterisk in (c) indicates significant differences between LC vs. HC treatments with p-value < 0.05. The three asterisks indicate a significant difference between LC_NO with respect to the other treatments with p-value < 0.001.
The changes in CO2 concentration and pH were accompanied with an increase in BR in the HC treatments (Fig. 4c). BR was also fairly constant in the LC treatments, but it showed a pronounced increase from day 0 to day 2, being significantly different in the HC treatments (for the two-way ANOVA, p=0.048 and n=12). After reaching the maximum, bacterial respiration dropped to similar values than those observed in the LC treatments (Fig. 4c). Among the LC treatments, the LC_NO treatment showed the lowest variability in the respiration rates and the highest values at the end of the incubation (for the one-way ANOVA and MCP-test, p<0.001 and n=6). A flow cytometry analysis of the CTC-positive bacteria, which have been previously related to actively respiring bacteria, also showed that the LC_NO treatment had significantly higher values than the other treatments on day 7 (for the one-way ANOVA and MCP-test, p=0.007 and n=6). In contrast, the other three treatments did not show significant differences among them (Fig. 5). Similar to pCO2 and pH, statistical differences between samples with organic matter inocula produced under current and future CO2 scenarios within each CO2 treatment were not significant regarding respiration rates. The analysis of the cumulative responses, measured as the integrated bacterial respiration during the whole incubation, showed 67 % higher values under HC than under LC conditions (for the two-way ANOVA, p=0.010 and n=6; Fig. 4d).

Figure 5Bacterial viability (active bacterial mL−1) measured with the CTC dye on day 7 (mean ± SD; n=3). The two asterisks indicate mean significant difference with the other treatments with p-value < 0.01.
The initial concentration of dissolved organic carbon (DOC, µmol C L−1) in the samples was quite similar among the four treatments until the peak in respiration (Fig. 6). DOC before the addition of the organic matter inocula was 89 µmol C L−1 and increased in all the treatments to maximum values of 111±5 and µmol C L−1 in treatments LC_AO and HC_NO on day 3, respectively. Afterwards DOC in the LC treatments remained approximately constant but decreased by 27 % in the HC treatments compared to the LC treatments (81±3 and 81±2 µmol C L−1 in HC_NO and HC_AO, respectively). Statistical analysis showed significant differences between both pCO2 treatments on day 7 (for the two-way ANOVA, p<0.001 and n=12; Fig. 6).

Figure 6Temporal evolution of the dissolved organic carbon (DOC) concentration (µmol C L−1) during the second incubation period (mean ± SD; n=3). Black and grey triangles represent HC_NO and HC_AO treatments, respectively. Black and grey circles correspond to LC_NO and LC_AO treatments, respectively. The three asterisks indicate significant differences between LC and HC treatments with p-value < 0.001.
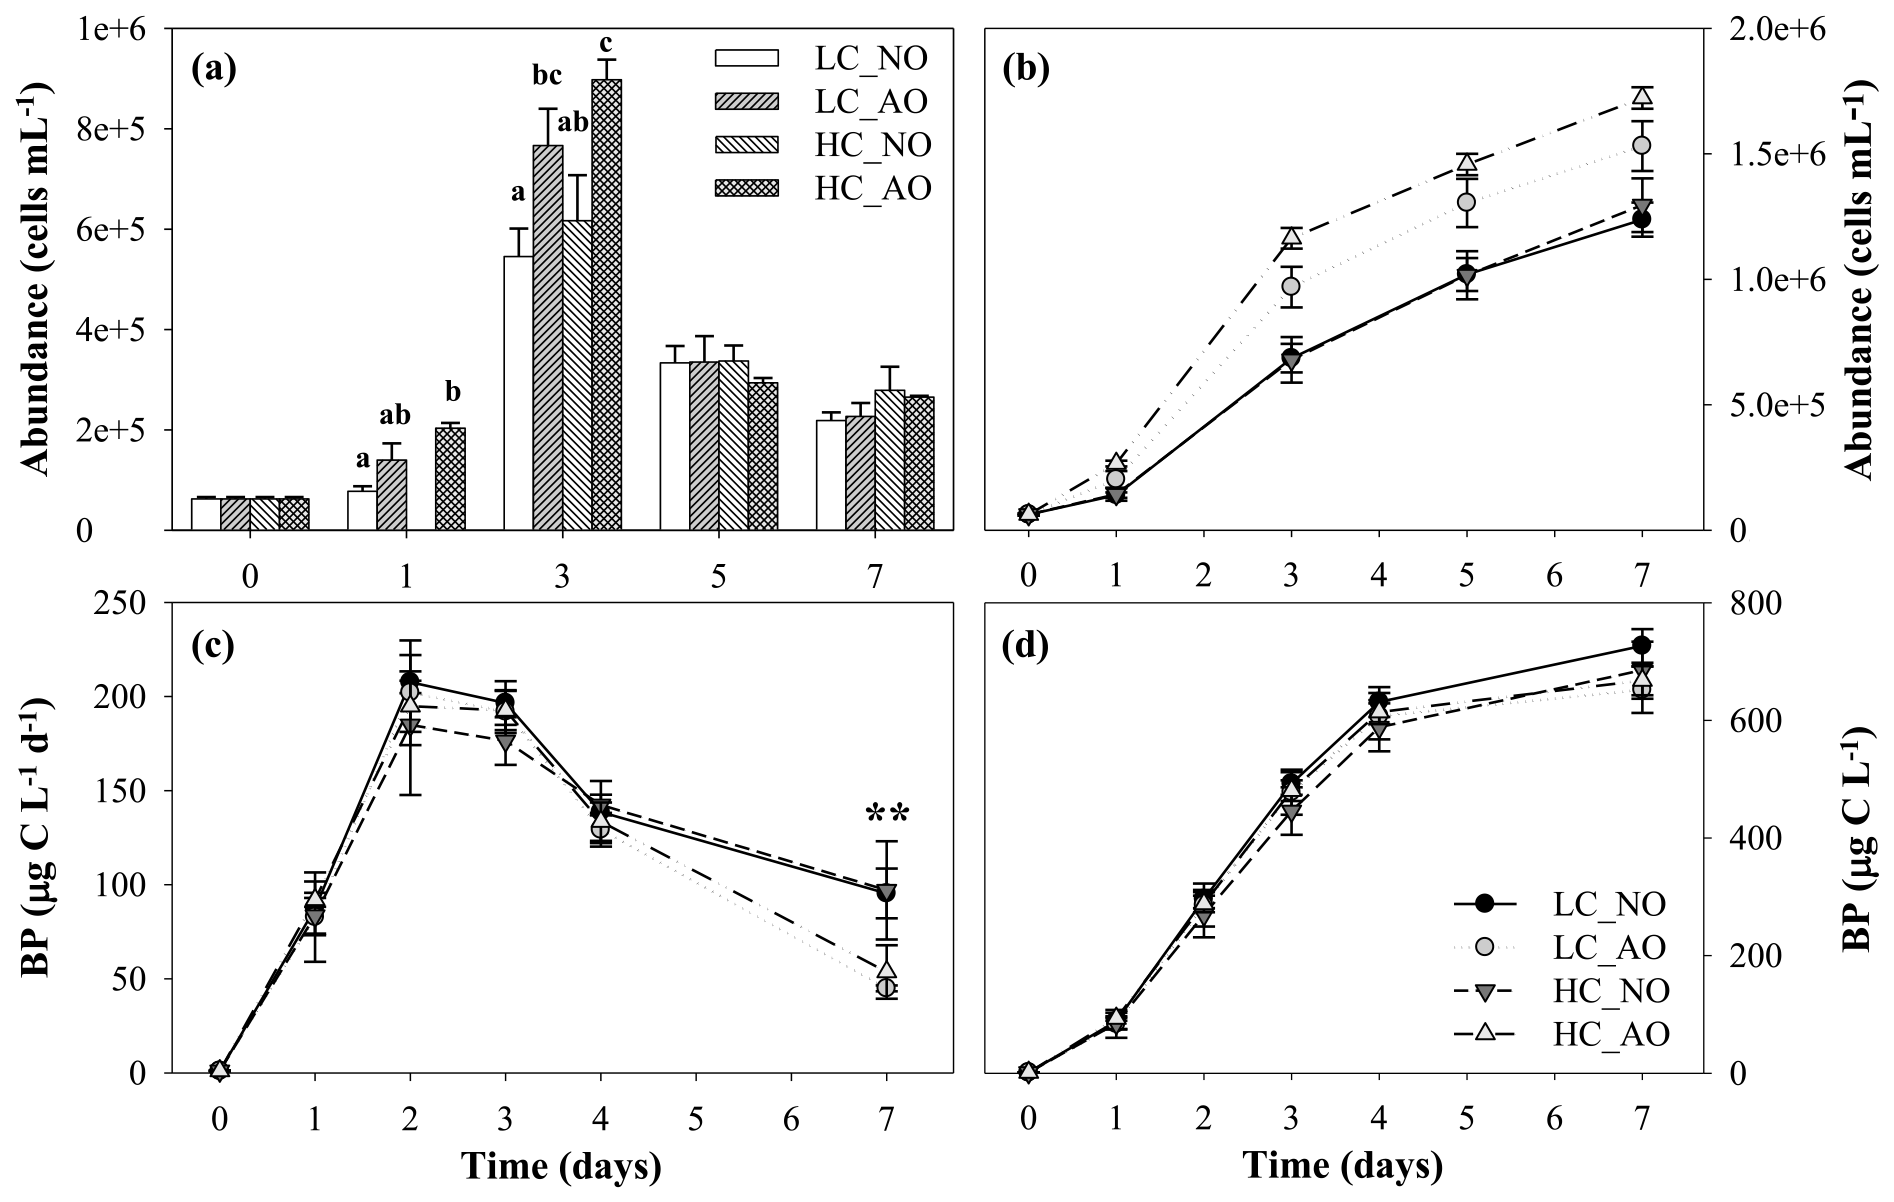
Figure 7(a) Histogram of bacterial abundance evolution (cells mL−1), with treatments with different letters indicating significant differences (p-value < 0.01), and (b) cumulative response of bacterial abundance (cells mL−1) in the four treatments during the course of the second incubation period (mean ± SD; n=3). (c) Bacterial production (µg C L−1 d−1) and (d) cumulative bacterial production (µg C L−1) from the four treatments during the second incubation period (mean ± SD; n=3). The two asterisks indicate significant differences between NO and AO treatments with p-value < 0.01. Black and grey triangles represent HC_NO and HC_AO treatments, respectively. Black and grey circles correspond to LC_NO and LC_AO treatments, respectively.
Unlike pCO2, pH, respiration and DOC, bacterial abundance and production showed differences regarding the origin of the organic matter. The addition of the organic matter inocula produced a fast increase in production and abundance from day 0 to day 3 in all the treatments. Cell abundance increased from bacteria mL−1 before the addition of the organic matter inocula to a maximum of bacteria mL1 in the HC_AO treatment (Fig. 7a). Differences in the bacterial abundance started to be significant in day 1 (for the one-way ANOVA and MCP-test, p=0.012 and n=6), but they were more clearly observed during the maximum at day 3 (for the one-way ANOVA and MCP-test, p<0.001 and n=6). Bacterial abundances were 29 % and 31 % higher in samples in which the acidified organic matter was added than in those with the addition of organic matter produced under the current CO2 scenario in the LC and HC treatments, respectively (Fig. 7a). This resulted in a 41 % higher integrated bacterial abundance with the addition of the acidified organic matter than in samples with the addition of non-acidified organic matter (for two-way ANOVA, p<0.001 and n=12; Fig. 7b).
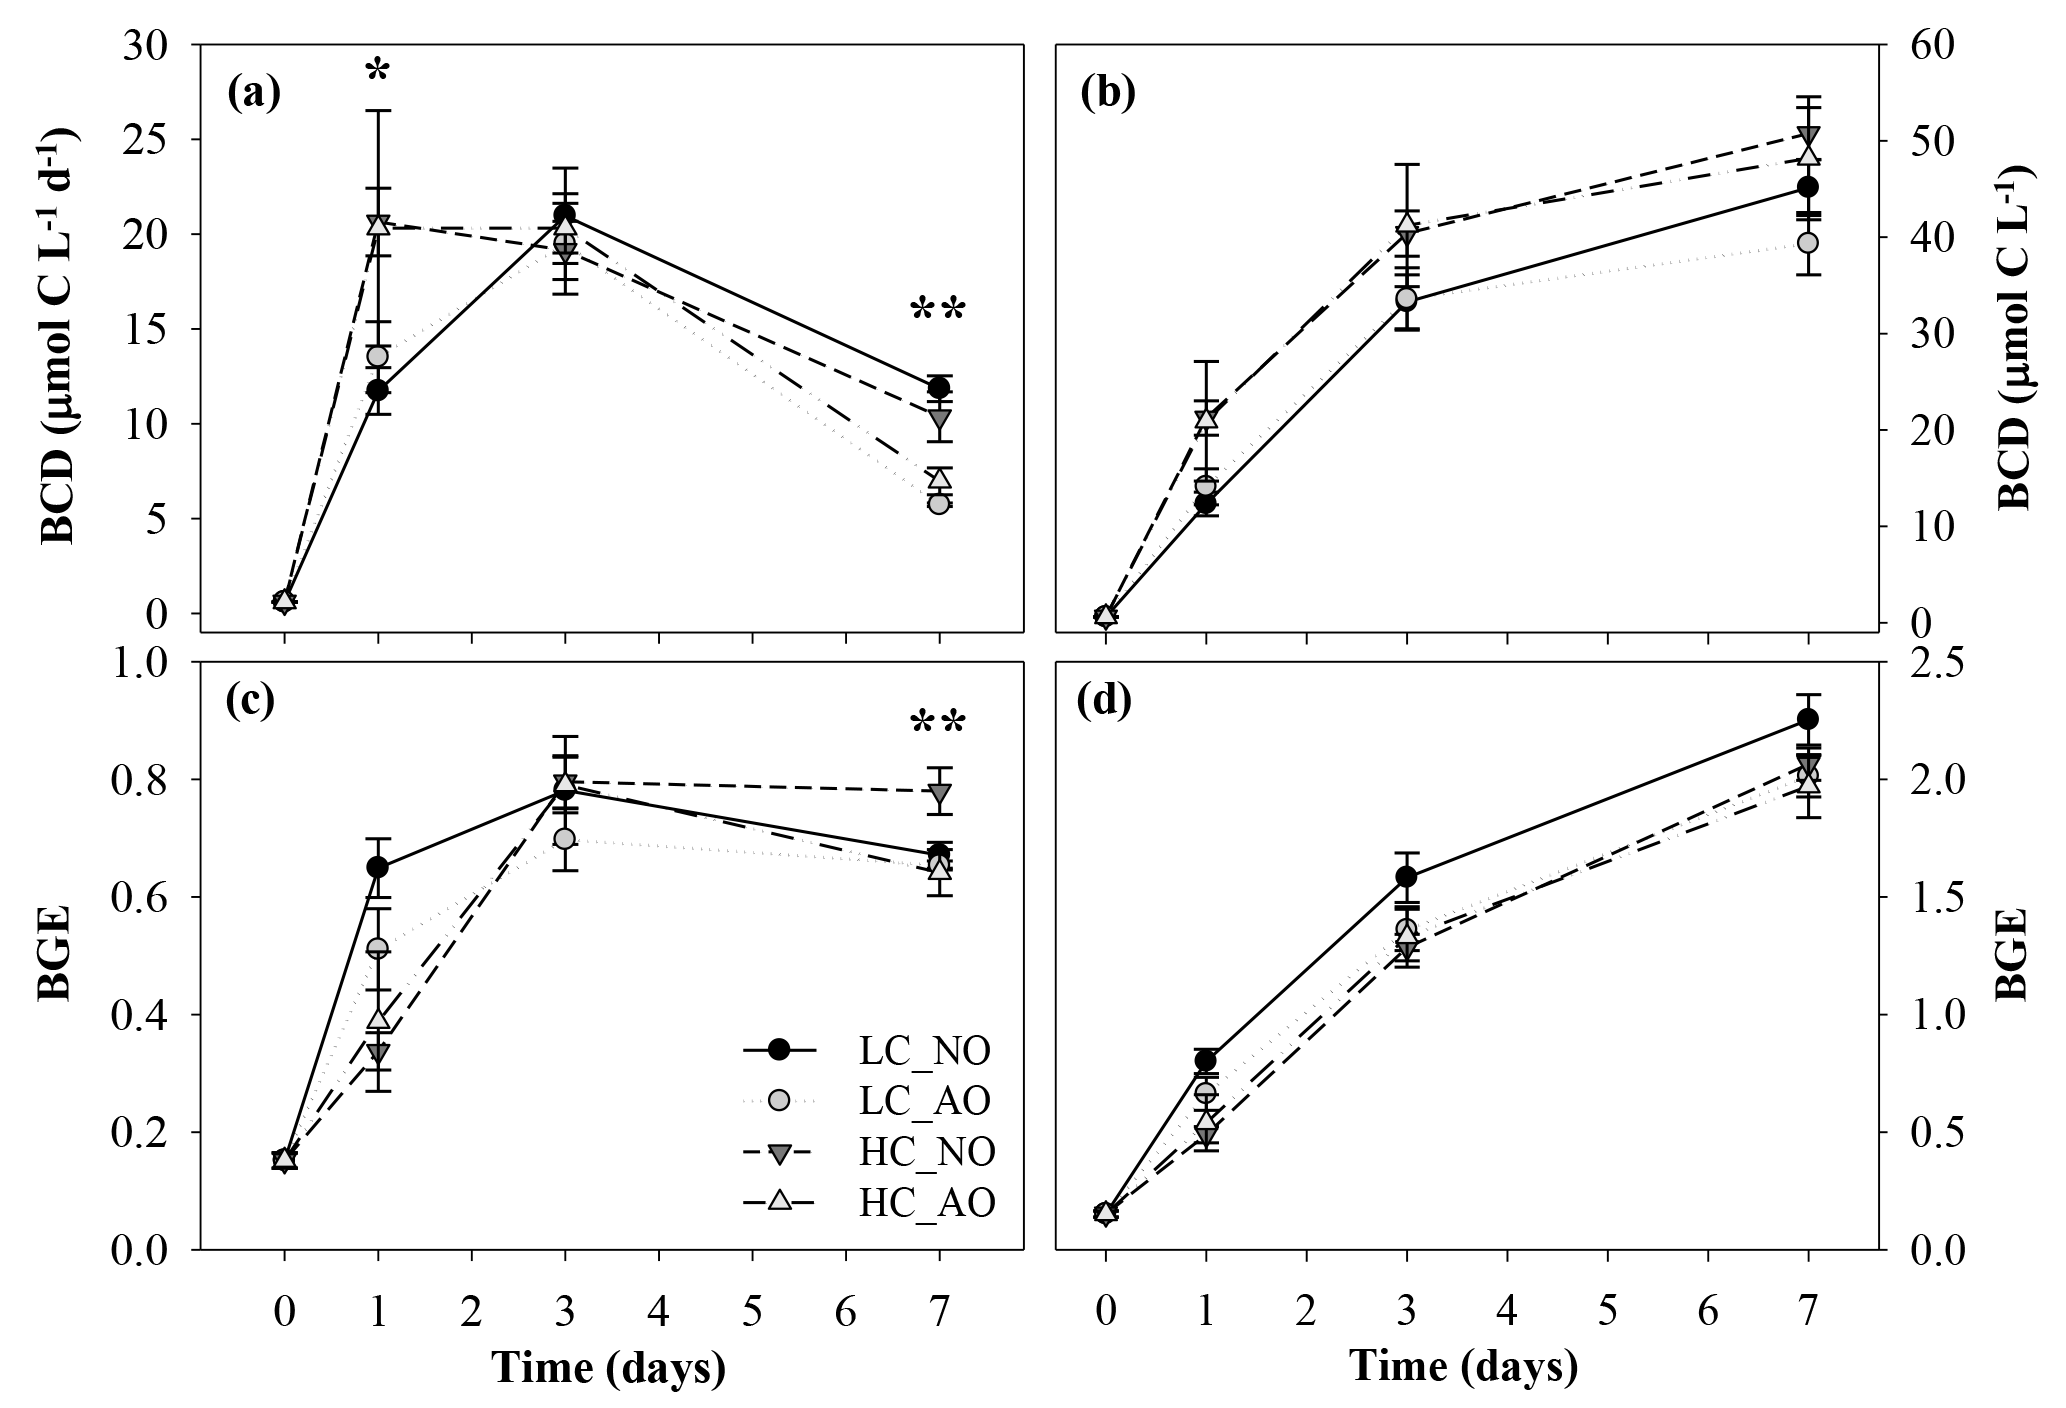
Figure 8Temporal evolution of (a) bacterial carbon demand (BCD, µmol C L−1 d−1), (b) cumulative BCD (µmol C L−1), (c) bacterial growth efficiency (BGE) and (d) cumulative BGE during the second incubation phase. One asterisk indicates significant differences in p-value < 0.05 between HC and LC treatments. Two asterisks indicate significant differences with p-value < 0.01 between NO and AO treatments for the BCD and between HC_NO and the rest of the treatments (LC_NO, LC_AO and HC_AO) for the BGE. Black and grey triangles represent HC_NO and HC_AO treatments, respectively. Black and grey circles correspond to LC_NO and LC_AO treatments, respectively.
Additionally, bacterial production increased from a minimum value of 1.1±0.1 µg C L−1 d−1 on day 0 to maximum values on day 2 for the four treatments, ranging between 185±37 and 208±4 µg C L−1 d−1 for HC_NO and LC_NO, respectively. However, the analysis of the integrated response did not show significant differences among treatments (Fig. 7d). Only punctually, the treatments with the addition of acidified organic matter (LC_AO and HC_AO) showed a higher decrease in the production rates than those with the addition of the non-acidified organic matter, resulting in significant differences later on (for the two-way ANOVA, p=0.001 and n=12). On day 7, treatments LC_NO and HC_NO produced 53 % and 45 % more than treatments LC_AO and HC_AO, respectively (Fig. 7c).
The BCD was affected by the respiratory activity at the beginning of the incubation (on day 1 for the two-way ANOVA, p=0.041 and n=12) and by the production at the end (on day 7 for the two-way ANOVA, p=0.002 and n=12; Fig. 8a). As a consequence, the BGE was higher for the LC treatments at the beginning of the incubation during the activity peak but decreased at the end of the incubation. On day 7 the HC treatment, with the addition of non-acidified organic matter (HC_NO), showed significantly higher efficiency than the other treatments (for the one-way ANOVA and MCP-test, p=0.002 and n=6; Fig. 8c). Overall, integrated BCD resulted 24 % higher under HC conditions, while the BGE was 11 % lower in the same conditions, compared to LC conditions (for the two-way ANOVA, p=0.011, p=0.019 and n=6; Fig. 8b, d).
The main goal of the current study was to distinguish between the direct and indirect effects of ocean acidification on natural bacterial assemblages. To achieve this objective, we performed a 2×2 experimental design combining the acidification of seawater and the addition of phytoplankton-derived organic matter produced under current and future CO2 conditions and natural solar exposures. UVR induces the photomineralization of colored dissolved organic matter (CDOM), increasing the biological availability of the resulting DOM (Moran and Zepp, 1997), and can also increase DOCp production in surface waters (Carrillo et al., 2002; Fuentes-Lema et al., 2015; Helbling et al., 2013).
Although different methodologies to modify the seawater pH to simulate an ocean acidification scenario have been described, the continuous bubbling of the natural plankton communities with a target CO2 concentration of 1000 ppm CO2 was chosen in the present study to simulate the pCO2 and pH conditions expected for the end of the century. This method simulates the natural variations of sea surface pCO2 driven by differences between atmospheric and sea water CO2 concentration providing quite realistic responses of the organisms to this environmental factor (Rost et al., 2008). It also allows changes in the biological activity of the samples to enable the modification of the pCO2 values, for example, if the photosynthetic or respiratory rates become faster than the rates needed to achieve the CO2 chemical equilibrium in seawater. Changes in pCO2 values due to microbial activity are usually observed in natural waters during bloom events in surface waters or in areas with high amount of organic matter (Joint et al., 2011). pCO2 also increases with depth due to the increase in heterotrophic activity compared to the autotrophic activity in surface (Dore et al., 2009; Pukate and Rim-Rukeh, 2008) and can change due to upwelling events, for example, in the same area where the samples were collected, reaching values close to those observed in the present work (Alvarez et al., 1999; Gago et al., 2003).
In our study, the CO2 enrichment did not produce a significant effect on phytoplankton production or biomass, measured as 14C incorporation or Chl a concentration, respectively. Phytoplankton community composition changed from bigger to smaller phytoplankton cells, as has been observed in similar microcosm studies (Grear et al., 2017; Reul et al., 2014), but differences between present and future CO2 treatments were not observed. DOCp production increased during the bloom that evolved at the beginning of the incubation, but bulk DOC concentration showed similar values between CO2 treatments, as expected based on the lack of differences observed in the biological and metabolic variables. Despite several studies indicating an increase in phytoplankton carbon production and biomass under future scenarios of CO2 (Kroeker et al., 2013), in our study, the exposure of the cells to natural conditions including solar UVR might have counteracted the stimulatory effect of the high CO2, since it increases the sensitivity of phytoplankton to photoinhibition (Gao et al., 2012; Sobrino et al., 2008, 2009).
The addition of the organic matter and the start of the aeration in the second incubation produced a burst in the metabolic activity of the bacteria. However this increase in bacterial activity was not followed by a significant decrease in DOC. Taking into account the experimental design of the study, keeping both the particulate and the dissolved fractions of the organic matter from the first phase incubation, it is likely that the production of DOC exceeded its consumption of heterotrophic bacteria, leading to a net accumulation of DOC in the microcosms. The particulate fraction could potentially have been degraded during the second phase of the experiment due to the elevated CO2 concentrations or the enzymatic activity (Piontek et al., 2010). Enzymatic activity on POC depends on the type of substrate and relates to the metabolic capabilities of the microbial community but can act as the temporal interval of our experiment (Arnosti et al., 2005). Counterintuitively, the high metabolic activity observed after adding the organic matter might have also contributed to the net accumulation of DOC, since it has been recently demonstrated that micro-heterotrophs can release part of the substrate as the new DOM (Lønborg et al., 2009). Freezing the sample with the organic matter produced in the first incubation might have also contributed to the DOC production during the second incubation. Freezing was necessary to avoid an excessive consumption of the acidified and non acidified organic matter for later use, since the DOC released by marine phytoplankton is highly labile to bacterial utilization and can be degraded significantly within hours (Chen and Wangersky, 1996). However, results from Peacock et al. (2015) suggest that changes in DOC concentrations by freeze–thaw cycles in samples stored no longer than 6 months are less than 5 % and do not show a clear pattern of increase or decrease (Peacock et al., 2015). Such changes are within the range of typical precision for DOC analysis and should not be significantly different among the experimental treatments, since all the samples were processed in a similar way.
Bacterioplankton growing in the HC treatments showed higher rates of respiration the first 2 days. This response was opposite to that described for some bacterial cultures (Teira et al., 2012) and seems to be related to an acclimation to the new pH values, somehow similar to observed for phytoplankton (Sobrino et al., 2008). Consequently, pCO2 in the HC treatments increased more than expected due to the biological activity carried out by bacterioplankton. The increase in respiration was also parallel to an increase in bacterial abundance and production. However, the results indicate that while changes in respiration were related to pCO2 values, changes in bacterial abundance were mainly related to the origin of the organic matter amendments. The bacterial abundance was stimulated by the presence of organic matter from a phytoplankton community grown under high CO2 conditions, compared to the addition of organic matter from a phytoplankton community grown under current CO2 conditions. On the other hand, differences in bacterial production were only significant at the end of the experiment (day 7).
Possible explanations for the preference of the organic matter produced under future CO2 conditions by bacteria are changes in the composition and quality of this organic matter, changes in the capability of bacteria to use this organic matter via extracellular enzymatic activity, or a combination of both. Several mesocosm studies have also shown that the rate of the extracellular release of phytoplankton-dissolved organic matter production and the formation of transparent exopolymer particles (TEPs) is higher under high CO2 conditions (Endres et al., 2014; Engel, 2002; Liu et al., 2010). TEPs are mostly carbon rich, can be easily consumed by heterotrophic bacteria, and can aggregate and coagulate in larger gel-like structures that provide nutrients and an attachment surface for bacteria, finally acting as hotspots where bacteria can grow and develop (Azam and Malfatti 2007). However, our results from the initial incubation aiming to obtain phytoplankton-derived organic matter inocula for bacteria neither suggest differences on DOC concentration under current and future CO2 conditions (Fig. 3b) nor suggest composition, since the phytoplankton community, productivity and fluorescence DOM properties were similar in both treatments at the end of the experiment (Fig. S1 in the Supplement). Recent results from mesocosm experiments showing no significant differences in DOM concentration and composition between current and future CO2 levels also corroborate these findings (Zark et al., 2015). Other than this, very little was found in the literature about the direct impact of ocean acidification on the DOM pool, particularly regarding its molecular composition and long-term reactivity.
Despite the significant effect on bacterial abundance during the activity peak, bacterial production only showed significant differences among treatments later during the incubation, resulting in lower production rates in those bacteria inoculated with the organic matter produced under higher CO2 conditions than those observed in the bacteria inoculated with the organic matter produced under low CO2 conditions. These results might be due to a higher bioavailability of the organic matter produced under high CO2 conditions for bacteria earlier during the incubation, increasing bacterial abundance, and decreasing production later, at the end of the experiment. The lower DOC values in the HC treatments at the end of the experiment compared to the LC treatments partially support this contention in the HC_AO treatment. However, they mainly indicate a clear effect of the pH, independent of the origin of the organic matter inocula. The lower DOC in the HC treatments compared to the LC treatments at the end of the experiment could be an indirect consequence of the higher respiration rates, which lowered the pH values (i.e., pCO2 values above the expected 1000 ppm) in these treatments during the activity peak. It has been recently described in metatranscriptomic analyses that marine bacteria maintain pH homeostasis by enhancing the expression of genes encoding proton pumps, such as respiration complexes, proteorhodopsin and membrane transporters, which might affect the cellular energy demand (Bunse et al., 2016). Between the two incubations performed for this study, the significant effect of the pH on the DOC content might have only been observed in the second incubation, because it reached almost double de pCO2 than the first one (i.e., minimum pH = 7.48 for the bacterioplankton incubation vs. minimum pH = 7.71 for the phytoplankton incubation). Following this contention, if acidification increases the degradation rate and bioavailability of the organic matter, that would explain why respiration in the control treatment (LC_NO) was only significantly higher at the end of the experiment, where neither the organic carbon added nor the environment were modified by the acidification with CO2. Flow cytometry results confirmed the highest rates of respiration in the LC_NO treatment, since the CTC dye is reduced to a quantifiable fluorescent CTC-formazan inside cells when the electron transport system is active (Gasol and Arístegui, 2007; Sieracki et al., 1999).
Furthermore, previous studies have confirmed that many enzymes involved in the hydrolysis of organic matter are sensitive to pH variations. It has been reported that important enzymes for bacterial metabolism such as leucine aminopeptidase or the α- and β-glucosidase enhance their activity and transformation rates with small decreases in pH, similar to the values measured in this study (Grossart et al., 2006; Piontek et al., 2010, 2013). The effects of ocean acidification on enzyme activity is not constant and could vary depending on enzyme type and geographical location (Yamada and Suzumura, 2010). Despite our results showing that the increase in bacterial abundance is mainly related to the presence of organic matter produced under future CO2 conditions and is not as related to the decrease in pH, a trend that supports a synergistic effect of both acidified organic matter and pH can be observed. This trend shows the biggest effects under the most extreme HC_AO treatment and the smallest effects under the less aggressive LC_NO treatment (i.e., for bacterial abundance on the third day of incubation and partially for production and viability on day 7). It can be also possible that the enhanced activity of the extracellular enzymes produced by the microbial community under HC conditions during the first incubation, aimed to obtain the organic matter inocula, came with the frozen acidified organic matter, since there is evidence that β-glucosidase, leucine aminopeptidase and phosphatase enzymes are stable in cold waters for weeks (Steen and Arnosti, 2011).
The uncoupling between the pH and organic matter's effects on bacterial respiration and production means that the carbon demand was biased by the most significant effect in the incubation. Nonetheless, further studies are needed to disentangle the lack of agreement among bacterial production, abundance and growth efficiency, more specially during the peaks of activity, since they seem to show the biggest uncoupling between the measured parameters (del Giorgio and Cole, 1998). Lack of total agreement regarding the statistical analysis might be related to differences in methodological sensitivity and variability. Moreover, ratios of leucine (or thymidine) to carbon can change dramatically in different environmental conditions (Teira et al., 2015), and bacteria cultures under controlled conditions in the lab have shown that CO2 fixation can increase under high carbon conditions, representing 8 % to 9 % of the bacterial production (Teira et al., 2012). All these factors can affect the bacterial production calculation. Although our work used a conversion factor that had being empirically tested for natural samples collected from the same area without significant differences between stations with different CO2 concentrations (Martínez-García et al., 2010), other factors, such as the bacterial composition or the nature of organic matter additions, might be affecting the final production rates. An attempt to empirically estimate the leucine-to-carbon conversion factors should be addressed in order to decrease uncertainties related to the bacterial production and the BCD and to finally enhance our understanding in this topic.
In summary, the results from this investigation show that ocean acidification can significantly affect bacterioplankton metabolism directly by changes in the respiration rate and indirectly by changes on the organic matter, which affected bacterial production and abundance.
Data are available from the authors upon request (sobrinoc@uvigo.es).
The supplement related to this article is available online at: https://doi.org/10.5194/bg-15-6927-2018-supplement.
HSB, LL, CS and AFL carried out the experimental work. AFL and CS wrote the paper with support of LL. CS supervised the project and conceived the original idea.
The authors declare that they have no conflict of interest.
This study was possible thanks to the financial support from
Xunta de Galicia (7MMA013103PR project and ED431G/06 Galician Singular Research Center),
the Spanish Ministry of Economy and Competitiveness (CTM2014-59345-R
project and Henar Sanleón-Bartolomé fellowship – FPI-IEO fellowship
2011/06), and the technical assistance from
Maria José Fernández Pazó, Vanesa Vieitiez and ECIMAT staff. The
authors are especially grateful to Xosé A. Alvarez-Salgado and
Marta Álvarez for their scientific support and suggestions on the
paper and to María Pérez Lorenzo and Marta Ruiz Hernández
for their help with the respiration and bacterial production techniques,
respectively.
Edited by: Gerhard
Herndl
Reviewed by: two anonymous referees
Allgaier, M., Riebesell, U., Vogt, M., Thyrhaug, R., and Grossart, H.-P.: Coupling of heterotrophic bacteria to phytoplankton bloom development at different pCO2 levels: a mesocosm study, Biogeosciences, 5, 1007–1022, https://doi.org/10.5194/bg-5-1007-2008, 2008.
Alvarez, M., Fernandez, E., and Perez, F. F.: Air-sea CO2 fluxes in a coastal embayment affected by upwelling: Physical versus biological control, Oceanol. Acta, 22, 499–515, https://doi.org/10.1016/S0399-1784(00)87683-5, 1999.
Álvarez-Salgado, X. A. and Miller, A. E. J.: Simultaneous determination of dissolved organic carbon and total dissolved nitrogen in seawater by high temperature catalytic oxidation: Conditions for precise shipboard measurements, Mar. Chem., 62, 325–333, https://doi.org/10.1016/S0304-4203(98)00037-1, 1998.
Arnosti, C., Durkin, S., and Jeffrey, W.: Patterns of extracellular enzyme activities among pelagic marine microbial communities: implications for cycling of dissolved organic carbon, Aquat. Microb. Ecol., 38, 135–145, https://doi.org/10.3354/ame038135, 2005.
Azam, F. and Malfatti, F.: Microbial structuring of marine ecosystems, Nat. Rev. Microbiol., 5, 782–791, https://doi.org/10.1038/nrmicro1747, 2007.
Azam, F., Fenchel, T., Field, J. G., Gray, J. S., Meyer-Reil, L. A., and Thingstad, F.: The Ecological Role of Water-Column Microbes in the Sea, Mar. Ecol.-Prog. Ser., 10, 257–263, 1983.
Azam, F., Grossart, L. B. F. H., Long, R. A., San, C., La, D., and California, J.: Microbial loop?: its significance in oceanic productivity and global change, Rapp. Comm. Int. Mer Mediterr., 35, 2–3, 1998.
Barcelos e Ramos, J., Biswas, H., Schulz, K. G., LaRoche, J., and Riebesell, U.: Effect of rising atmospheric carbon dioxide on the marine nitrogen fixer Trichodesmium, Global Biogeochem. Cy., 21, 1–6, https://doi.org/10.1029/2006GB002898, 2007.
Bunse, C., Lundin, D., Karlsson, C. M. G., Vila-Costa, M., Palovaara, J., Akram, N., Svensson, L., Holmfeldt, K., González, J. M., Calvo, E., Pelejero, C., Marrasé, C., Dopson, M., Gasol, J. M., and Pinhassi, J.: Response of marine bacterioplankton pH homeostasis gene expression to elevated CO2, Nat. Clim. Change, 6, 483–487, https://doi.org/10.1038/nclimate2914, 2016.
Caldeira, K. and Wickettt, M. E.: Anthropogenic carbon and ocean pH, Nature, 425, 2100–2100, https://doi.org/10.1038/425365a, 2008.
Carrillo, P., Medina-Sánchez, J. M., and Villar-Argaiz, M.: The interaction of phytoplankton and bacteria in a high mountain lake: Importance of the spectral composition of solar radiation, Limnol. Oceanogr., 47, 1294–1306, https://doi.org/10.4319/lo.2002.47.5.1294, 2002.
Chen, W. and Wangersky, P. J.: Rates of microbial degradation of dissolved organic carbon from phytoplankton cultures, J. Plankton Res., 18, 1521–1533, https://doi.org/10.1093/plankt/18.9.1521, 1996.
Coffin, R. B., Montgomery, M. T., Boyd, T. J., and Masutani, S. M.: Influence of ocean CO2 sequestration on bacterial production, Energy, 29, 1511–1520, https://doi.org/10.1016/j.energy.2003.06.001, 2004.
Cole, J., Findlay, S., and Pace, M.: Bacterial production in fresh and saltwater ecosystems: a cross-system overview, Mar. Ecol.-Prog. Ser., 43, 1–10, https://doi.org/10.3354/meps043001, 1988.
Dickson, A. G. and Goyet, C. (Eds.): Handbook of methods for the analysis of the various parameters of the carbon dioxide system in sea water, Version 2, ORNL/CDIAC-74, 1994.
Dore, J. E., Lukas, R., Sadler, D. W., Church, M. J., and Karl, D. M.: Physical and biogeochemical modulation of ocean acidification in the central North Pacific, P. Natl. Acad. Sci. USA, 106, 12235–12240, https://doi.org/10.1073/pnas.0906044106, 2009.
Doval, M. D., Álvarez-Salgado, X. A., and Pérez, F. F.: Dissolved organic matter in a temperate embayment affected by coastal upwelling, Mar. Ecol.-Prog. Ser., 157, 21–37, https://doi.org/10.3354/meps157021, 1997.
Endres, S., Galgani, L., Riebesell, U., Schulz, K. G., and Engel, A.: Stimulated bacterial growth under elevated pCO2: Results from an off-shore mesocosm study, PLoS One, 9, 1–8, https://doi.org/10.1371/journal.pone.0099228, 2014.
Engel, A.: Direct Relationship between CO2 Uptake and Transparent Exopolymer Particles Production in Natural Phytoplankton, J. Plankton Res., 24, 49–53, https://doi.org/10.1093/plankt/24.1.49, 2002.
Engel, A., Delille, B., Jacquet, S., Riebesell, U., Rochelle-Newall, E., Terbrüggen, A. and Zondervan, I.: Transparent exopolymer particles and dissolved organic carbon production by Emiliania huxleyi exposed to different CO2 concentrations: A mesocosm experiment, Aquat. Microb. Ecol., 34, 93–104, https://doi.org/10.3354/ame034093, 2004.
Engel, A., Piontek, J., Grossart, H. P., Riebesell, U., Schulz, K. G., and Sperling, M.: Impact of CO2 enrichment on organic matter dynamics during nutrient induced coastal phytoplankton blooms, J. Plankton Res., 36, 641–657, https://doi.org/10.1093/plankt/fbt125, 2014.
Fabry, V. J., Seibel, B. A., Feely, R. A., and Orr, J. C.: Impacts of ocean acidification on marine fauna and ecosystem processes, ICES J. Mar. Sci., 65, 414–432, 2008.
Fraga, F.: Upwelling off the Galician Coast, Northwest Spain, in: Coastal Upwelling, 176–182, American Geophysical Union, 1981.
Fu, F. X., Warner, M. E., Zhang, Y., Feng, Y., and Hutchins, D. A.: Effects of increased temperature and CO2 on photosynthesis, growth, and elemental ratios in marine Synechococcus and Prochlorococcus (Cyanobacteria), J. Phycol., 43, 485–496, https://doi.org/10.1111/j.1529-8817.2007.00355.x, 2007.
Fuentes-Lema, A., Sobrino, C., González, N., Estrada, M., and Neale, P.: Effect of solar UVR on the production of particulate and dissolved organic carbon from phytoplankton assemblages in the Indian Ocean, Mar. Ecol.-Prog. Ser., 535, 47–61, https://doi.org/10.3354/meps11414, 2015.
Gago, J., Gilcoto, M., Pérez, F., and Ríos, A.: Short-term variability of fCO2 in seawater and air-sea CO2 fluxes in a coastal upwelling system (Ría de Vigo, NW Spain), Mar. Chem., 80, 247–264, https://doi.org/10.1016/S0304-4203(02)00117-2, 2003.
Gao, K., Helbling, E. H., Häder, D. P., and Hutchins, D. A.: Responses of marine primary producers to interactions between ocean acidification, solar radiation, and warming, Mar. Ecol.-Prog. Ser., 470, 167–189, 2012.
Gasol, J. and Arístegui, J.: Cytometric evidence reconciling the toxicity and usefulness of CTC as a marker of bacterial activity, Aquat. Microb. Ecol., 46, 71–83, https://doi.org/10.3354/ame046071, 2007.
del Giorgio, P. A. and Cole, J. J.: Bacterial growth efficiency in natural aquatic systems, Annu. Rev. Ecol. Syst., 29, 503–541, https://doi.org/10.1146/annurev.ecolsys.29.1.503, 1998.
Grear, J. S., Rynearson, T. A., Montalbano, A. L., Govenar, B., and Menden-Deuer, S.: pCO2 effects on species composition and growth of an estuarine phytoplankton community, Estuar. Coast. Shelf S., 190, 40–49, https://doi.org/10.1016/J.ECSS.2017.03.016, 2017.
Grossart, H., Fischerhuette, A., Allgaier, M., and Passow, U.: Testing the effect of CO2 concentration on the dynamics of marine heterotrophic bacterioplankton, Limnol. Oceanogr., 51, 1–11, 2006.
Hein, M. and Sand-Jensen, K.: CO2 increases oceanic primary production, structural biology and phylogenetic estimation, Nature, 388, 526–527, https://doi.org/10.1038/41453, 1997.
Helbling, E. W., Carrillo, P., Medina-Sánchez, J. M., Durán, C., Herrera, G., Villar-Argaiz, M., and Villafañe, V. E.: Interactive effects of vertical mixing, nutrients and ultraviolet radiation: in situ photosynthetic responses of phytoplankton from high mountain lakes in Southern Europe, Biogeosciences, 10, 1037–1050, https://doi.org/10.5194/bg-10-1037-2013, 2013.
Iglesias-Rodriguez, M. D., Halloran, P. R., Rickaby, R. E. M., Hall, I. R., Colmenero-Hidalgo, E., Gittins, J. R., Green, D. R. H., Tyrrell, T., Gibbs, S. J., von Dassow, P., Rehm, E., Armbrust, E. V., and Boessenkool, K. P.: Phytoplankton Calcification in a High-CO2 World, Science, 320, 336–340, https://doi.org/10.1126/science.1154122, 2008.
IPCC: Climate Change 2014: Synthesis Report, Contribution of Working Groups I, II and III to the Fifth Assessment Report of the Intergovernmental Panel on Climate Change, edited by: Core Writing Team, Pachauri, R. K., and Meyer, L. A., IPCC, Geneva, Switzerland, 151 pp., 2014.
Joint, I., Doney, S. C., and Karl, D. M.: Will ocean acidification affect marine microbes?, ISME J., 5, 1–7, https://doi.org/10.1038/ismej.2010.79, 2011.
Kroeker, K. J., Kordas, R. L., Crim, R., Hendriks, I. E., Ramajo, L., Singh, G. S., Duarte, C. M., and Gattuso, J. P.: Impacts of ocean acidification on marine organisms: Quantifying sensitivities and interaction with warming, Glob. Change Biol., 19, 1884–1896, https://doi.org/10.1111/gcb.12179, 2013.
Langdon, C., Broecker, W. S., Hammond, D. E., Glenn, E., Fitzsimmons, K., Nelson, S. G., Peng, T.-H., Hajdas, I., and Bonani, G.: Effect of elevated CO2 on the community metabolism of an experimental coral reef, Global Biogeochem. Cy., 17, 1011, https://doi.org/10.1029/2002GB001941, 2003.
Lechtenfeld, O. J., Hertkorn, N., Shen, Y., Witt, M., and Benner, R.: Marine sequestration of carbon in bacterial metabolites, Nat. Commun., 6, 6711, https://doi.org/10.1038/ncomms7711, 2015.
Le Quéré, C., Moriarty, R., Andrew, R. M., Peters, G. P., Ciais, P., Friedlingstein, P., Jones, S. D., Sitch, S., Tans, P., Arneth, A., Boden, T. A., Bopp, L., Bozec, Y., Canadell, J. G., Chini, L. P., Chevallier, F., Cosca, C. E., Harris, I., Hoppema, M., Houghton, R. A., House, J. I., Jain, A. K., Johannessen, T., Kato, E., Keeling, R. F., Kitidis, V., Klein Goldewijk, K., Koven, C., Landa, C. S., Landschützer, P., Lenton, A., Lima, I. D., Marland, G., Mathis, J. T., Metzl, N., Nojiri, Y., Olsen, A., Ono, T., Peng, S., Peters, W., Pfeil, B., Poulter, B., Raupach, M. R., Regnier, P., Rödenbeck, C., Saito, S., Salisbury, J. E., Schuster, U., Schwinger, J., Séférian, R., Segschneider, J., Steinhoff, T., Stocker, B. D., Sutton, A. J., Takahashi, T., Tilbrook, B., van der Werf, G. R., Viovy, N., Wang, Y.-P., Wanninkhof, R., Wiltshire, A., and Zeng, N.: Global carbon budget 2014, Earth Syst. Sci. Data, 7, 47–85, https://doi.org/10.5194/essd-7-47-2015, 2015.
Levitan, O., Rosenberg, G., Setlik, I., Setlikova, E., Grigel, J., Klepetar, J., Prasil, O., and Berman-Frank, I.: Elevated CO2 enhances nitrogen fixation and growth in the marine cyanobacterium Trichodesmium, Glob. Change Biol., 13, 531–538, https://doi.org/10.1111/j.1365-2486.2006.01314.x, 2007.
Liu, J., Weinbauer, M. G., Maier, C., Dai, M. and Gattuso, J. P.: Effect of ocean acidification on microbial diversity and on microbe-driven biogeochemistry and ecosystem functioning, Aquat. Microb. Ecol., 61, 291–305, https://doi.org/10.3354/ame01446, 2010.
Lønborg, C., Álvarez-Salgado, X. A., Davidson, K., and Miller, A. E. J.: Production of bioavailable and refractory dissolved organic matter by coastal heterotrophic microbial populations, Estuar. Coast. Shelf S., 82, 682–688, https://doi.org/10.1016/J.ECSS.2009.02.026, 2009.
Martínez-García, S., Fernández, E., Álvarez-Salgado, X.-A., González, J., Lønborg, C., Marañón, E., Morán, X.-A. G., and Teira, E.: Differential responses of phytoplankton and heterotrophic bacteria to organic and inorganic nutrient additions in coastal waters off the NW Iberian Peninsula, Mar. Ecol.-Prog. Ser., 416, 17–33, https://doi.org/110.3354/meps08776, 2010.
Moran, M. A. and Zepp, R. G.: Role of Photoreactions in the Formation of Biologically Labile Compounds from Dissolved Organic Matter, Limnol. Oceanogr., 42, 1307–1316, https://doi.org/10.4319/lo.1997.42.6.1307, 1997.
Motegi, C., Tanaka, T., Piontek, J., Brussaard, C. P. D., Gattuso, J.-P., and Weinbauer, M. G.: Effect of CO2 enrichment on bacterial metabolism in an Arctic fjord, Biogeosciences, 10, 3285–3296, https://doi.org/10.5194/bg-10-3285-2013, 2013.
Nagata, T., Fukuda, H., Fukuda, R., and Koike, I.: Bacterioplankton distribution and production in deep Pacific waters: Large-scale geographic variations and possible coupling with sinking particle fluxes, Limnol. Oceanogr., 45, 426–435, https://doi.org/10.4319/lo.2000.45.2.0426, 2000.
Newbold, L. K., Oliver, A. E., Booth, T., Tiwari, B., Desantis, T., Maguire, M., Andersen, G., van der Gast, C. J., and Whiteley, A. S.: The response of marine picoplankton to ocean acidification, Environ. Microbiol., 14, 2293–2307, https://doi.org/10.1111/j.1462-2920.2012.02762.x, 2012.
Nieto-Cid, M., Álvarez-Salgado, X. A., Gago, J., and Pérez, F. F.: DOM fluorescence, a tracer for biogeochemical processes in a coastal upwelling system (NW Iberian Peninsula), Mar. Ecol.-Prog. Ser., 297, 33–50, https://doi.org/10.3354/meps297033, 2005.
Peacock, M., Freeman, C., Gauci, V., Lebron, I., and Evans, C. D.: Investigations of freezing and cold storage for the analysis of peatland dissolved organic carbon (DOC) and absorbance properties, Environ. Sci. Process. Impacts, 17, 1290–1301, https://doi.org/10.1039/C5EM00126A, 2015.
Piontek, J., Lunau, M., Händel, N., Borchard, C., Wurst, M., and Engel, A.: Acidification increases microbial polysaccharide degradation in the ocean, Biogeosciences, 7, 1615–1624, https://doi.org/10.5194/bg-7-1615-2010, 2010.
Piontek, J., Borchard, C., Sperling, M., Schulz, K. G., Riebesell, U., and Engel, A.: Response of bacterioplankton activity in an Arctic fjord system to elevated pCO2: results from a mesocosm perturbation study, Biogeosciences, 10, 297–314, https://doi.org/10.5194/bg-10-297-2013, 2013.
Pukate, Y. and Rim-Rukeh, A.: Variability with depth of some physico-chemical and biological parameters of Atlantic Ocean water in part of the coastal area of Nigeria, J. Appl. Environ. Manag., 12, 87–91, https://doi.org/10.4314/jasem.v12i1.55578, 2008.
Reul, A., Muñoz, M., Bautista, B., Neale, P., Sobrino, C., Mercado, J., Segovia, M., Salles, S., Kulk, G., León, P., van de Poll, W., Pérez, E., Buma, A., and Blanco, J.: Effect of CO2, nutrients and light on coastal plankton. III. Trophic cascade, size structure and composition, Aquat. Biol., 22, 59–76, https://doi.org/10.3354/ab00585, 2014.
Riebesell, U., Schulz, K. G., Bellerby, R. G. J., Botros, M., Fritsche, P., Meyerhöfer, M., Neill, C., Nondal, G., Oschlies, A., Wohlers, J., and Zöllner, E.: Enhanced biological carbon consumption in a high CO2 ocean, Nature, 450, 545–548, https://doi.org/10.1038/nature06267, 2007.
Rochelle-Newall, E., Delille, B., Frankignoulle, M., Gattuso, J. P., Jacquet, S., Riebesell, U., Terbruggen, A., and Zondervan, I.: Chromophoric dissolved organic matter in experimental mesocosms maintained under different pCO2 levels, Mar. Ecol.-Prog. Ser., 272, 25–31, https://doi.org/10.3354/meps272025, 2004.
Rodriguez, G. G., Phipps, D., Ishiguro, K., and Ridgway, H. F.: Use of a fluorescent redox probe for direct visualization of actively respiring bacteria, Appl. Environ. Microb., 58, 1801–1808, 1992.
Rost, B., Zondervan, I., and Wolf-Gladrow, D.: Sensitivity of phytoplankton to future changes in ocean carbonate chemistry: Current knowledge, contradictions and research directions, Mar. Ecol.-Prog. Ser., 373, 227–237, https://doi.org/10.3354/meps07776, 2008.
Sabine, C. L., Feely, R. A., Gruber, N., Key, R. M., Lee, K., Bullister, J. L., Wanninkhof, R., Wong, C. S., Wallace, D. W. R., Tilbrook, B., Millero, F. J., Peng, T.-H., Kozyr, A., Ono, T., and Rios, A. F.: The Oceanic Sink for Anthropogenic CO2, Science, 305, 367–371, https://doi.org/10.1126/science.1097403, 2004.
Sala, M. M., Aparicio, F. L., Balagué, V., Boras, J. A., Borrull, E., Cardelús, C., Cros, L., Gomes, A., López-Sanz, A., Malits, A., Martínez, R. A., Mestre, M., Movilla, J., Sarmento, H., Vázquez-Domínguez, E., Vaqué, D., Pinhassi, J., Calbet, A., Calvo, E., Gasol, J. M., Pelejero, C., and Marrasé, C.: Contrasting effects of ocean acidification on the microbial food web under different trophic conditions, ICES J. Mar. Sci. J. du Cons., 73, 670–679, https://doi.org/10.1093/icesjms/fsv130, 2016.
Serret, P., Fernández, E., Sostres, J. A., and Anadón, R.: Seasonal compensation of microbial production and respiration in a temperate sea, Mar. Ecol.-Prog. Ser., 187, 43–57, https://doi.org/10.3354/meps187043, 1999.
Sieracki, M. E., Cucci, T. L., and Nicinski, J.: Flow Cytometric Analysis of 5-Cyano-2,3-Ditolyl Tetrazolium Chloride Activity of Marine Bacterioplankton in Dilution Cultures, Appl. Environ. Microb., 65, 2409–2417, 1999.
Smith, D. C. and Azam, F.: A simple, economical method for measuring bacterial protein synthesis rates in seawater using tritiated-leucine, Mar. Microb. Food Webs, 6, 107–114, 1992.
Sobrino, C., Ward, M. L., and Neale, P. J.: Acclimation to elevated carbon dioxide and ultraviolet radiation in the diatom Thalassiosira pseudonana: effects on growth, photosynthesis, and spectral sensitivity of photoinhibition, Limnol. Oceanogr., 53, 494–505, 2008.
Sobrino, C., Neale, P. J., Phillips-kress, J. D., Moeller, R. E., and Porter, J. A.: Elevated CO2 increases sensitivity to ultraviolet radiation in lacustrine phytoplankton assemblages, Limnol. Oceanogr., 54, 2448–2459, 2009.
Sobrino, C., Segovia, M., Neale, P., Mercado, J., Garc'a-Gómez, C., Kulk, G., Lorenzo, M., Camarena, T., Van de Poll, W., Spilling, K., and Ruan, Z.: Effect of CO2, nutrients and light on coastal plankton. IV. Physiological responses, Aquat. Biol., 22, 77–93, 2014.
Spilling, K., Schulz, K. G., Paul, A. J., Boxhammer, T., Achterberg, E. P., Hornick, T., Lischka, S., Stuhr, A., Bermúdez, R., Czerny, J., Crawfurd, K., Brussaard, C. P. D., Grossart, H.-P., and Riebesell, U.: Effects of ocean acidification on pelagic carbon fluxes in a mesocosm experiment, Biogeosciences, 13, 6081–6093, https://doi.org/10.5194/bg-13-6081-2016, 2016.
Steen, A. D. and Arnosti, C.: Long lifetimes of B-glucosidase, leucine aminopeptidase, and phosphatase in Arctic seawater, Mar. Chem., 123, 127–132, https://doi.org/10.1016/j.marchem.2010.10.006, 2011.
Teira, E., Fernández, A., Álvarez-Salgado, X. A., García-Martín, E. E., Serret, P., and Sobrino, C.: Response of two marine bacterial isolates to high CO2 concentration, Mar. Ecol.-Prog. Ser., 453, 27–36, https://doi.org/10.3354/meps09644, 2012.
Teira, E., Hernando-Morales, V., Cornejo-Castillo, F. M., Alonso-Sáez, L., Sarmento, H., Valencia-Vila, J., Serrano Catalá, T., Hernández-Ruiz, M., Varela, M. M., Ferrera, I., Gutiérrez Morán, X. A., and Gasol, J. M.: Sample dilution and bacterial community composition influence empirical leucine-to-carbon conversion factors in surface waters of the world's oceans, Appl. Environ. Microb., 81, 8224–8232, https://doi.org/10.1128/AEM.02454-15, 2015.
Yamada, N. and Suzumura, M.: Effects of seawater acidification on hydrolytic enzyme activities, J. Oceanogr., 66, 233–241, https://doi.org/10.1007/s10872-010-0021-0, 2010.
Zark, M., Riebesell, U., and Dittmar, T.: Effects of ocean acidification on marine dissolved organic matter are not detectable over the succession of phytoplankton blooms, Sci. Adv., 1, e1500531, https://doi.org/10.1126/sciadv.1500531, 2015.
Zeebe, R. E. and Wolf-Gladrow, D. A.: CO2 in seawater: equilibrium, kinetics, isotopes, Elsev. Oceanogr. Serie., 65, 346, https://doi.org/10.1016/S0924-7963(02)00179-3, 2001.