the Creative Commons Attribution 4.0 License.
the Creative Commons Attribution 4.0 License.
 | 22 Nov 2018
Export flux of unprocessed atmospheric nitrate from temperate forested catchments: a possible new index for nitrogen saturation
Fumiko Nakagawa
Yusuke Obata
Kenta Ando
Naoyuki Yamashita
Tatsuyoshi Saito
Shigeki Uchiyama
Masayuki Morohashi
Hiroyuki Sase
To clarify the biological processing of nitrate within temperate forested catchments using unprocessed atmospheric nitrate exported from each catchment as a tracer, we continuously monitored stream nitrate concentrations and stable isotopic compositions, including 17O excess (Δ17O), in three forested catchments in Japan (KJ, IJ1, and IJ2) for more than 2 years. The catchments showed varying flux-weighted average nitrate concentrations of 58.4, 24.4, and 17.1 µmol L−1 in KJ, IJ1, and IJ2, respectively, which correspond to varying export fluxes of nitrate: 76.4, 50.1, and 35.1 mmol m−2 in KJ, IJ1, and IJ2, respectively. In addition to stream nitrate, nitrate concentrations and stable isotopic compositions in soil water were determined for comparison in the most nitrate-enriched catchment (site KJ). While the 17O excess of nitrate in soil water showed significant seasonal variation, ranging from +0.1 ‰ to +5.7 ‰ in KJ, stream nitrate showed small variation, from +0.8 ‰ to +2.0 ‰ in KJ, +0.7 ‰ to +2.8 ‰ in IJ1, and +0.4 ‰ to +2.2 ‰ in IJ2. We conclude that the major source of stream nitrate in each forested catchment is groundwater nitrate. Additionally, the significant seasonal variation found in soil nitrate is buffered by the groundwater nitrate. The estimated annual export flux of unprocessed atmospheric nitrate accounted for 9.4 %±2.6 %, 6.5 %±1.8 %, and 2.6 %±0.6 % of the annual deposition flux of atmospheric nitrate in KJ, IJ1, and IJ2, respectively. The export flux of unprocessed atmospheric nitrate relative to the deposition flux showed a clear normal correlation with the flux-weighted average concentration of stream nitrate, indicating that reductions in the biological assimilation rates of nitrate in forested soils, rather than increased nitrification rates, are likely responsible for the elevated stream nitrate concentration, probably as a result of nitrogen saturation. The export flux of unprocessed atmospheric nitrate relative to the deposition flux in each forest ecosystem is applicable as an index for nitrogen saturation.
- Article
(5474 KB) - Full-text XML
-
Supplement
(659 KB) - BibTeX
- EndNote


1.1 Stream nitrate being exported from forested watersheds
Nitrate is one of the most important nitrogen nutrients for primary production in aquatic environments. As a result, an excess of nitrate in stream water can cause significant ecological and economic problems, such as eutrophication in downstream areas, including lakes, estuaries, and oceans (McIsaac et al., 2001; Paerl, 2009).
Forested ecosystems have traditionally been considered nitrogen limited. However, because of elevated nitrogen loading through atmospheric deposition, some forested ecosystems become nitrogen saturated (Aber et al., 1989), from which elevated levels of nitrate are exported (Peterjohn et al., 1996; Wright and Tietema, 1995). Either increased nitrification rates in forested soils or reductions in N retention are assumed to be responsible for both enhanced nitrogen leaching from soils and the increased export flux of nitrate in nitrogen-saturated watersheds (Peterjohn et al., 1996).
Nitrate concentrations in stream water are controlled through the complicated interplay between several processes within a catchment, including (1) the addition of atmospheric nitrate () through deposition, (2) the production of nitrate through microbial nitrification in soils, (3) the removal of nitrate through assimilation by plants and microbes, and (4) the removal of nitrate through dissimilatory nitrate reduction by microbes. Therefore, interpretation of the processes regulating nitrate concentrations in stream water is not always straightforward. The detailed processes enhancing nitrate concentrations in streams eluted from nitrogen-saturated forested catchments have not yet been clarified.
The natural stable isotopic composition of nitrate (δ15N and δ18O) has been widely used to determine the origin and behavior of nitrate in stream water (Durka et al., 1994; Kendall, 1998; Kendall et al., 2007). In addition to these traditional isotopes, 17O excess (Δ17O; the definition will be presented in Sect. 1.2) of nitrate has been used as an additional, more robust tracer for unprocessed (nitrate supplied via atmospheric deposition that has not been involved in the N cycle through the biological processing of nitrate, such as assimilation and denitrification, within surface ecosystems) in stream water in recent years (Bourgeois et al., 2018b; Michalski et al., 2004; Riha et al., 2014; Sabo et al., 2016; Tsunogai et al., 2010, 2014, 2016). By determining the 17O excess of stream nitrate, we can quantify the proportion of unprocessed within stream nitrate accurately and precisely. Additionally, by determining both the concentration and the 17O excess of stream nitrate, we can quantify the concentration of unprocessed in stream water (Tsunogai et al., 2014). Recent studies on unprocessed exported from forested catchments via streams during the base flow period have revealed that the export flux of unprocessed increases in accordance with increases in the stream nitrate concentration (Rose et al., 2015a, b; Tsunogai et al., 2014). In addition, Tsunogai et al. (2014) successfully used the directly exported flux of unprocessed relative to the entire deposition flux of as an index to evaluate the biological metabolic rate of nitrate in forest soils in catchment areas. These results imply that unprocessed exported from forested catchments can be used as a robust tracer to evaluate the biological processing of nitrate in each catchment area and to clarify the processes regulating nitrate concentrations in stream water.
In this study, we monitored both the concentrations and stable isotopic compositions (including Δ17O) of stream nitrate exported from three forested catchments in Japan for more than 2 years. The catchments showing various average nitrate concentrations in the streams were chosen as the targets in this study. In addition to nitrate in streams, the nitrate concentrations and stable isotopic compositions in soil water were determined over the same observation period for comparison in one catchment. Based on the differences in the direct export flux of unprocessed relative to the entire deposition flux of between the catchments, we aimed to clarify the processes regulating nitrate concentrations in stream water exported from temperate forested watersheds, with special emphasis on the relationship with nitrogen saturation. That is to say, through observation in this study, we will quantify the extent of changes in the biological metabolic processes of nitrate in temperate forested watersheds under nitrogen saturation, which show an elevated export flux of nitrate.

Figure 1A map showing the locations of the studied watersheds (Kajikawa and Lake Ijira) in Japan (a) and a color altitude map of site KJ (b), together with both catchment areas, shown by a white line, and the stream water sampling point, shown by a red circle (weir). The green and blue circles denote the locations of soil water sampling (SLS and SMS, respectively), and the black square denotes the location where the deposition sampler was set.
1.2 17O excess of nitrate
The natural stable isotopic composition of nitrate is represented by its δ15N, δ17O, and δ18O values. The delta (δ) values are calculated as Rsample / Rstandard−1, where R is the 18O ∕ 16O ratio for δ18O (or the 17O ∕ 16O ratio for δ17O or the 15N ∕ 14N ratio for δ15N) in both the sample and the respective international standard (air N2 for nitrogen and Vienna standard mean ocean water (VSMOW) for oxygen). Atmospheric nitrate (), most of which is produced via photochemical reactions between atmospheric NO and O3, can be characterized by an anomalous enrichment in 17O compared to remineralized nitrate (), which is produced from organic nitrogen through general chemical reactions, including microbial N mineralization and microbial nitrification in the biosphere (Alexander et al., 2009; Michalski et al., 2003; Morin et al., 2008; Tsunogai et al., 2010, 2016). Note that also applies to atmospheric nitrate that has been involved in the N cycle, undergoing a full cycle of assimilation, remineralization, and nitrification. Using the Δ17O signature (the magnitude of 17O excess) defined by the following equation (Kaiser et al., 2007; Miller, 2002), we can distinguish unprocessed (Δ17O >0 ‰) from (Δ17O =0 ‰; Nakagawa et al., 2013):
where the constant β is 0.5279 (Kaiser et al., 2007; Miller, 2002).
Continuous monitoring of the Δ17O value of deposited at the midlatitudes of East Asia has clarified that the annual average Δ17O values of are almost constant at 26.6 ‰±0.9 ‰ (the average and the 1σ variation range; Nelson et al., 2018; Tsunogai et al., 2010, 2016). In addition, Δ17O is stable during the mass-dependent isotope fractionation processes within surface ecosystems (Miller, 2002; Thiemens et al., 2001). Therefore, while the δ15N or δ18O signature of can be overprinted by biological processes subsequent to deposition, Δ17O can be used as a robust tracer of unprocessed to reflect its accurate mole fraction within total , regardless of partial metabolism (partial removal of nitrate through denitrification and assimilation) subsequent to deposition (Michalski et al., 2004; Tsunogai et al., 2011, 2014), using the following equation:
where Catm and Ctotal denote the concentrations of unprocessed and in each water sample, respectively, and Δ17Oatm and Δ17O denote the Δ17O values of and total nitrate in each water sample, respectively. This is the primary advantage of using the 17O ∕ 16O ratio as an additional tracer of unprocessed . In this study, we used the average Δ17O value of obtained at the nearby Sado–Seki monitoring station during the observation period from April 2009 to March 2012 ( ‰; Tsunogai et al., 2016) for Δ17Oatm in Eq. (2) to estimate Catm in the study streams, allowing for an error range of 3 ‰, in which the factor changes in Δ17Oatm from +26.3 ‰ caused by both areal and seasonal variation in the Δ17O values of have been considered (Tsunogai et al., 2016).
Moreover, additional measurements of the Δ17O values of nitrate together with δ18O enable us to exclude the contribution of unprocessed in the determined δ18O values and to estimate the corrected δ18O values (δ18Ore) for an accurate evaluation of the source and behavior of , including anthropogenically produced (Dejwakh et al., 2012; Liu et al., 2013; Riha et al., 2014; Tsunogai et al., 2011, 2010).
2.1 Site description
In this study, we determined the export flux of unprocessed by monitoring stream water in three forested catchments in Japan in which forest coverage rates exceed 99 %: a catchment (site KJ) in the Kajikawa forested watershed and two subcatchments (sites IJ1 and IJ2) in the Lake Ijira watershed (Fig. 1a). The deposition rate of was determined for each catchment by collecting samples of deposition outside the forest canopy. Soil water samples were also collected from site KJ.
Site KJ is located in the northern part of Shibata city, Niigata Prefecture, near the coast of the Sea of Japan (Fig. 1a). The bedrock consists of granodiorite, and brown forest soils have developed (Kamisako et al., 2008; Sase et al., 2008). The forest is composed of Japanese cedars (Cryptomeria japonica) that were approximately 40 years old in 2012 (Sase et al., 2012). This site is characterized by perhumid climate conditions with no clear dry season during the year. The daily air temperature in the region varies from −2 to +34 ∘C, with an annual mean of 13 ∘C during the observation period of this study. The annual mean precipitation is approximately 2500 mm, approximately 17 % of which occurs during spring (from March to May), approximately 20 % occurs during summer (from June to August), approximately 28 % occurs during fall (from September to November), and approximately 35 % occurs during winter (from December to February). The site usually experiences snowfall from late December to March, with the maximum depth exceeding 100 cm, even on the slope. The studied catchment area is 3.84 ha, with an elevation from 60 to 170 m above sea level (Fig. 1b). The catchment is characterized by a high loading rate of atmospheric nitrogen (more than 120 mmolN m−2 yr−1; Kamisako et al., 2008) and elevated nitrate concentration (45 µmol L−1 on average) in the stream water eluted from the catchment. In the same Niigata Prefecture in which KJ is located, Koshikawa et al. (2011) determined stream chemistry from streams (n=62) with various catchment areas ranging from 0.7 to 1800 ha. They performed a principal component analysis (PCA) of the various factors related to the stream chemistry, including nitrate concentration, but could not find any significant relationship between stream nitrate concentration and catchment area. Thus, the differences in the catchment area (from 0.7 to 1800 ha) had little impact on the stream nitrate concentration. Additionally, Kamisako et al. (2008) concluded that atmospheric nitrogen inputs are exceeding the biological demand at site KJ and proposed that the site was under nitrogen saturation (Aber et al., 1989). As a result, we chose this catchment to study unprocessed as a tracer, as it is an example of a catchment enriched in stream nitrate, while the catchment area (3.94 ha) was relatively smaller than the other sites targeted in this study.
Lake Ijira (Fig. 2) is a reservoir constructed on one of the tributaries of the Nagara River in the Gifu Prefecture, Honshu, Japan. The mean annual precipitation is approximately 3300 mm. The precipitation regime is characterized by relatively wet springs and summers (340 mm month−1 from April to September) and relatively dry winters (approximately 190 mm month−1 from December to February). The daily air temperature in the region varies from −3 to +31 ∘C, with an annual mean of 13 ∘C. The site is covered with snow from December to March every year.
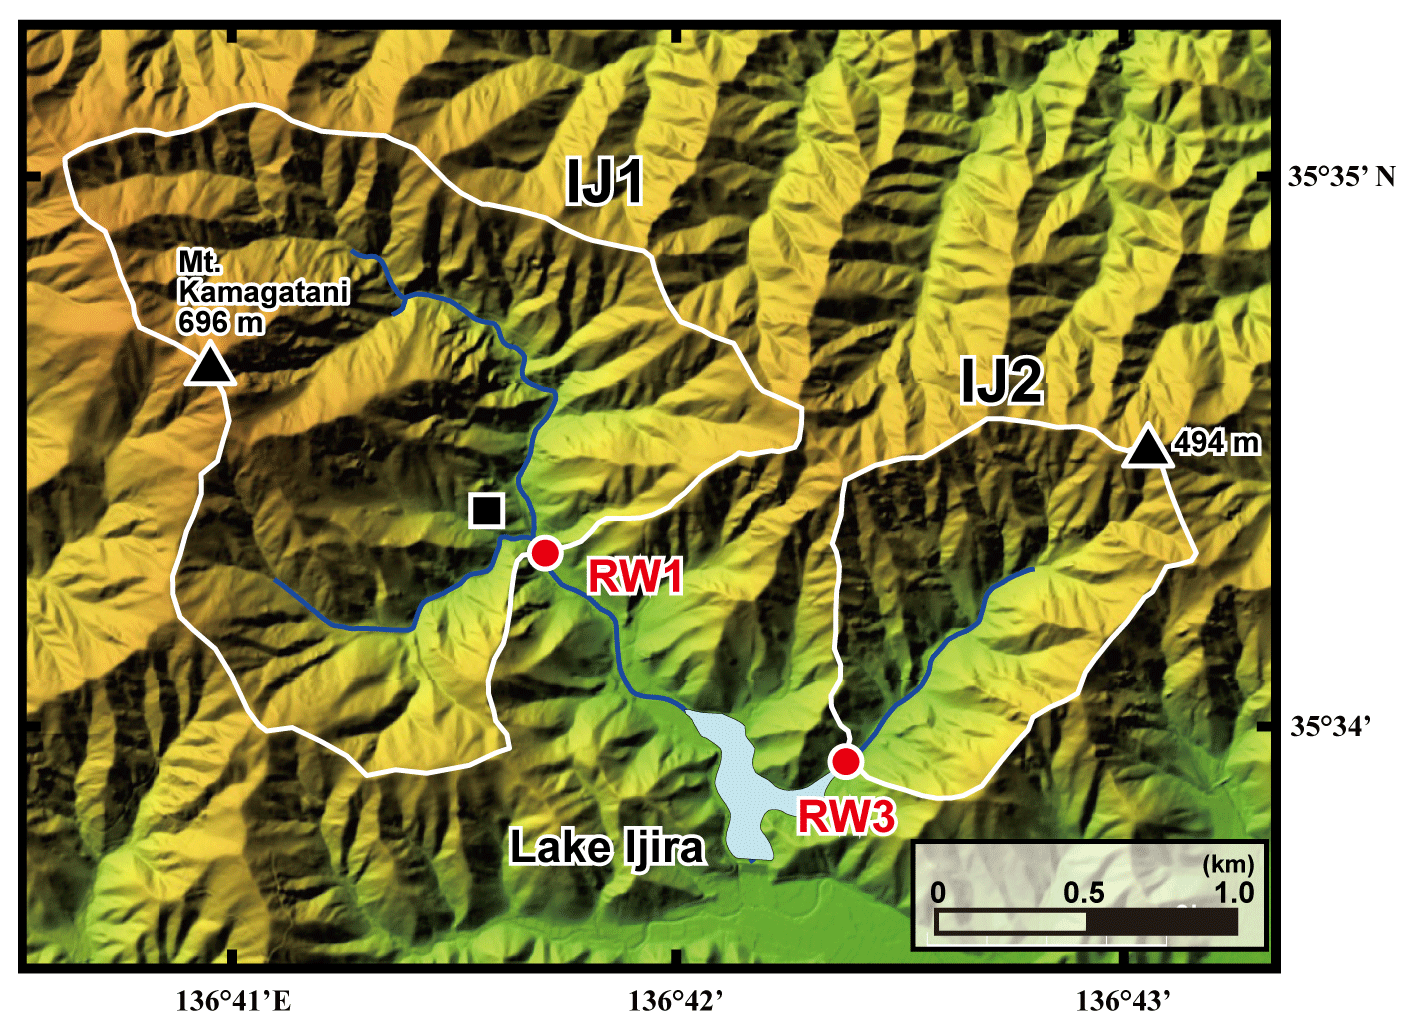
Figure 2A color altitude map of the Lake Ijira watershed, together with the catchment areas, shown by a white line for the studied sites (IJ1 and IJ2), and the stream water sampling points, shown by red circles (RW1 for IJ1 and RW3 for IJ2). The black square denotes the location where the deposition sampler was set.
The Kamagadani catchment (Site IJ1; 298 ha) and the Kobora catchment (Site IJ2; 108 ha) in the Lake Ijira watershed were studied (Fig. 2). The bedrock consists of chert (90 %) and mudstone (10 %) from the Middle Jurassic to Early Cretaceous age at these sites, and the dominant soil type is brown forest soils (Nakahara et al., 2010). The dominant vegetation in the Kamagadani catchment (IJ1) is Japanese cypress (Chamaecyparis obtusa, 49 %), followed by broadleaf trees (29 %), Japanese red pine (Pinus densiflora, 13 %), and Japanese cedar (Cryptomeria japonica, 8 %), while the dominant vegetation in the Kobora catchment (IJ2) is Japanese red pine (Pinus densiflora, 46 %), followed by broadleaf trees (30 %), Japanese cypress (Chamaecyparis obtusa, 17 %), and Japanese cedar (Cryptomeria japonica, 7 %). Japanese cypress and Japanese cedar stands are plantation forests, with ages ranging from 15 to 25 years and 30 to 45 years, respectively, in 1998. The red pine and broadleaf stands are secondary forests. Major tree species in the secondary broadleaf forests are Clethra barbinervis, Quercus serrata, Ilex pedunculosa, Quercus variabilis, Carpinus tschonoskii, Acer mono, and Quercus glauca.
The annual wet deposition flux of in the Lake Ijira watershed was the highest of all EANET deposition monitoring sites in Japan (Yamada et al., 2007), probably because the catchment is located only approximately 40 km north of Nagoya and the surrounding industrial area (Chukyo industrial area). As a result, the discharge rate, water temperature, pH, electrical conductivity (EC), and alkalinity have been measured continuously at the outlets of IJ1 and IJ2 (RW1 and RW3, respectively, in Fig. 2) since 1988 (Nakahara et al., 2010). Nakahara et al. (2010) also proposed that site IJ1 has been under nitrogen saturation (stage 2; Aber et al., 1989) since 1997. For this reason, we chose the Lake Ijira watershed for this study. Details on the Lake Ijira watershed have been described in past studies (Nakahara et al., 2010; Yamada et al., 2007).
2.2 Stream water and discharge rates
Samples of stream water were collected manually in bottles that were rinsed at least twice with the sample itself at the outlet of each catchment (the weir in KJ, RW1 in IJ1, and RW3 in IJ2; Figs. 1 and 2) approximately once a month from May 2012 to December 2014 in KJ and from March 2012 to December 2014 in IJ1 and IJ2. In this study, 1 or 2 L polyethylene bottles, washed using chemical detergents, rinsed at least thrice using deionized water, and then dried in the laboratory, were used.
At site KJ, a V-notch weir (half angle: 30∘) and a Parshall flume were installed at the bottom of the catchment (Fig. 1b) where the stream water was collected. The data from the V-notch weir were used to measure the discharge rate. At site IJ1, the discharge rates were calculated from both water depth and flow velocity at RW1 in Fig. 2. The water depth was measured at 100 cm intervals across the river flow, and the flow velocity was measured at the midpoints of each 100 cm split using a flow meter (CM-10S; Toho Dentan, Tokyo, Japan). At site IJ2, the discharge rates were estimated from the calculated values from IJ1, assuming that the discharge rates from both sites varied in proportion to the area of the catchments.
2.3 Soil water
Soil water samples (n=45) were collected into 500 mL pre-evacuated glass bottles at two stations (SLS and SMS; Fig. 1b) within the KJ catchment on average once every 6 weeks from December 2012 to December 2014 using porous cup soil solution samplers (DIK-8390-11/DIK-8390-58; Daiki, Japan). Because the site is covered with snow in winter, however, a limited number of samples were taken between December and March (n=9).
The SLS station is located by the stream side, while the SMS station is located approximately 20 m away from the SLS station in the northeast direction (Fig. 1b). The SMS station is 23 m higher than the SLS station in altitude. The soil water samples were collected at a depth of 20 cm at each station (SLS 20 and SMS 20). Soil water samples were also collected at a depth of 60 cm at the SLS station (SLS 60).
2.4 Atmospheric nitrate deposition rates
For site KJ, a filtering-type bulk deposition sampler with a funnel (200 mm diameter) installed in an open field outside the forest canopy on the northern ridge of the catchment (Fig. 1b) was used to determine the areal deposition flux of (Kamisako et al., 2008; Sase et al., 2008). Using the sampler, bulk depositions were collected into sample bottles at intervals of approximately 4 weeks. Sample bottles were covered with aluminium foil or enclosed in a polystyrene foam box to avoid light and suppress algal growth during storage in the field. The volume of each sample was determined using plastic cylinders in the field, and portions of each sample were brought to the laboratory for further analysis. Please note that the dry deposition flux, especially for gaseous HNO3, is underestimated in the deposition flux determined through this method (Aikawa et al., 2003), while the deposition flux of may be overestimated as a result of the progress of nitrification in sample bottles during storage in the field until recovery (Clow et al., 2015). Errors in the deposition flux of will be discussed in Sect. 3.1.
For sites IJ1 and IJ2, data on the areal deposition flux, determined separately for wet and dry deposition at the outlet of IJ1 (140 m a.s.l.; Fig. 2) and reported by EANET (EANET, 2014, 2015), were used in this study. The dry deposition flux was calculated from the concentrations of particulate nitrate and gaseous HNO3 in air.
2.5 Analysis
Samples of stream water (KJ, IJ1, and IJ2), soil water (KJ), and deposition (KJ) were transported to the laboratory within 1 h after collection and were passed through a membrane filter (pore size 0.45 µm) and stored in a refrigerator (4 ∘C) until chemical analysis was performed. The concentrations of were measured by ion chromatography (DX-500; Dionex Inc., USA), together with major anions and cations. Samples were analyzed within a few weeks of sampling, then sealed in 50 or 100 mL polyethylene bottles for further analysis, including measurement of the isotopes in the stream and soil water samples reported in this study. Because the stream water samples were analyzed for various components, the number of samples for measurement on the isotopes of was approximately half of the entire stream water samples. Prior to isotope analysis, the concentration of each stream water sample for measurement of the isotopes of was determined again by ion chromatography to exclude samples that had been altered during storage. The longest storage period between bottling and isotope analysis was 2 years. None of the samples determined in this study showed significant deterioration or contamination during storage.
The δ2H and δ18O values of H2O in the stream and soil water samples were analyzed using the cavity ring-down spectroscopy method by employing an L2120-i instrument (Picarro Inc., Santa Clara, CA, USA) equipped with an A0211 vaporizer and autosampler. The errors (standard errors of the mean) in this method were ±0.5 ‰ for δ2H and ±0.1 ‰ for δ18O. Both the VSMOW and standard light Antarctic precipitation (SLAP) were used to calibrate the values to the international scale.
To determine the stable isotopic compositions of in the stream and soil water samples, in each sample was chemically converted to N2O using a method originally developed to determine the 15N ∕ 14N and 18O ∕ 16O ratios of seawater and freshwater (McIlvin and Altabet, 2005) that was later modified (Konno et al., 2010; Tsunogai et al., 2008, 2018; Yamazaki et al., 2011). In brief, 11 mL of each sample solution was pipetted into a vial with a septum cap. Then, 0.5 g of spongy cadmium was added, followed by 150 µL of a 1 M NaHCO3 solution. The sample was then shaken for 18–24 h at a rate of 2 cycles s−1. Then, the sample solution (10 mL) was decanted into a different vial with a septum cap. After purging the solution using high-purity helium, 0.4 mL of an azide–acetic acid buffer, which had also been purged using high-purity helium, was added. After 45 min, the solution was alkalinized by adding 0.2 mL of 6 M NaOH.
Then, the stable isotopic compositions (δ15N, δ18O, and Δ17O) of the N2O in each vial were determined using the continuous-flow isotope ratio mass spectrometry (CF-IRMS) system at Nagoya University. The analytical procedures performed using the CF-IRMS system were the same as those detailed in previous studies (Hirota et al., 2010; Komatsu et al., 2008). The obtained values of δ15N, δ18O, and Δ17O for the N2O derived from the in each sample were compared with those derived from our local laboratory standards to calibrate the values of the sample to an international scale and to correct for both isotope fractionation during the chemical conversion to N2O and the progress of oxygen isotope exchange between the -derived reaction intermediate and water (ca. 20 %). The local laboratory standards were calibrated using internationally distributed isotope reference materials (USGS-34 and USGS-35). In this study, we adopted the internal standard method (Nakagawa et al., 2013; Tsunogai et al., 2014, 2018) for the calibration of sample .
To determine whether the conversion rate from to N2O was sufficient, the concentration of in the samples was determined each time we analyzed the isotopic composition using CF-IRMS based on the N2O+ or outputs. We adopted the δ15N, δ18O, or Δ17O values only when the concentration measured via CF-IRMS correlated with the concentration measured via ion chromatography prior to isotope analysis within a difference of 10 %. Approximately 10 % of all isotope analyses showed conversion efficiencies lower than this criterion. The in these samples was converted to N2O again and reanalyzed to determine stable isotopic composition.
We repeated the analysis of δ15N, δ18O, and Δ17O values for each sample at least three times to attain high precision. Most of the samples had a concentration of greater than 10 µmol L−1, which corresponded to a quantity greater than 100 nmol in a 10 mL sample. This amount was sufficient for determining the δ15N, δ18O, and Δ17O values with high precision. For cases in which the concentration was less than 10 µmol L−1, the number of analyses was increased. Thus, all isotope values presented in this study have an error (standard error of the mean) better than ±0.2 ‰ for δ15N, ±0.3 ‰ for δ18O, and ±0.1 ‰ for Δ17O.
Nitrite () in the samples interferes with the final N2O produced from because the chemical method also converts to N2O (McIlvin and Altabet, 2005). Therefore, it is sometimes necessary to remove prior to converting to N2O. However, in this study, all the stream and soil water samples analyzed for stable isotopic composition had concentrations lower than the detection limit (0.05 µmol L−1). Because the minimum concentration in the samples was 6.5 µmol L−1 in this study, the ∕ ratios in the samples must be less than 0.8 %. Thus, we skipped the processes for removing .
2.6 Possible variations in Δ17O during partial removal and mixing
Because we used the power law shown in Eq. (1) for the definition of Δ17O, the Δ17O values differ from those based on the linear definition (Michalski et al., 2002). The differences in the Δ17O values would have been less than 0.1 ‰ higher for the stream and soil water if we had used the linear definition for calculation.
Compared with Δ17O values based on the linear definition, Δ17O values based on the power-law definition are more stable during mass-dependent isotope fractionation processes, so we considered the Δ17O values of to be stable, irrespective of any biological partial removal processes after deposition, such as assimilation or denitrification. Conversely, Δ17O values based on the power-law definition are not conserved during mixing processes between fractions with different Δ17O values, so the Catm ∕ Ctotal ratio estimated using Eq. (2) deviates slightly from the actual Catm ∕ Ctotal ratio in the samples. However, in this study, the extent of the deviations of the Catm ∕ Ctotal ratios of the stream was less than 0.2 %, so we have disregarded this effect in the discussion.
2.7 Calculation of the atmospheric nitrate export flux from each catchment
To quantify the export flux of unprocessed from each catchment, the daily export flux of unprocessed per unit area of the catchment (Fatm) was calculated for each day on which the Δ17O value of nitrate was determined by applying Eq. (3) (Tsunogai et al., 2014):
where Catm denotes the concentration of unprocessed , V denotes the daily average flow rate of stream water, and S denotes the total area of each catchment studied. The daily export fluxes of (Ftotal) and (Fre) per unit area of catchment were also calculated from the concentration (Ctotal) and the daily average flow rate of the stream water (V) by applying Eqs. (4) and (5):
Assuming Fatm was stable during the period from the previous observation (Δt), we can estimate the annual export flux of unprocessed per unit area of the catchment (Matm) by integrating the Fatm values for each year of observation using Eq. (6).
We can also obtain the annual export flux for (Mtotal) and (Mre) by integrating Ftotal and Fre for each year of observation using Eqs. (7) and (8).
By dividing Matm by the deposition flux of per unit area of the catchment, we can estimate the proportion of that survived biological processing in the catchment basin.
where Datm denotes the annual deposition flux of per unit area of the catchment.
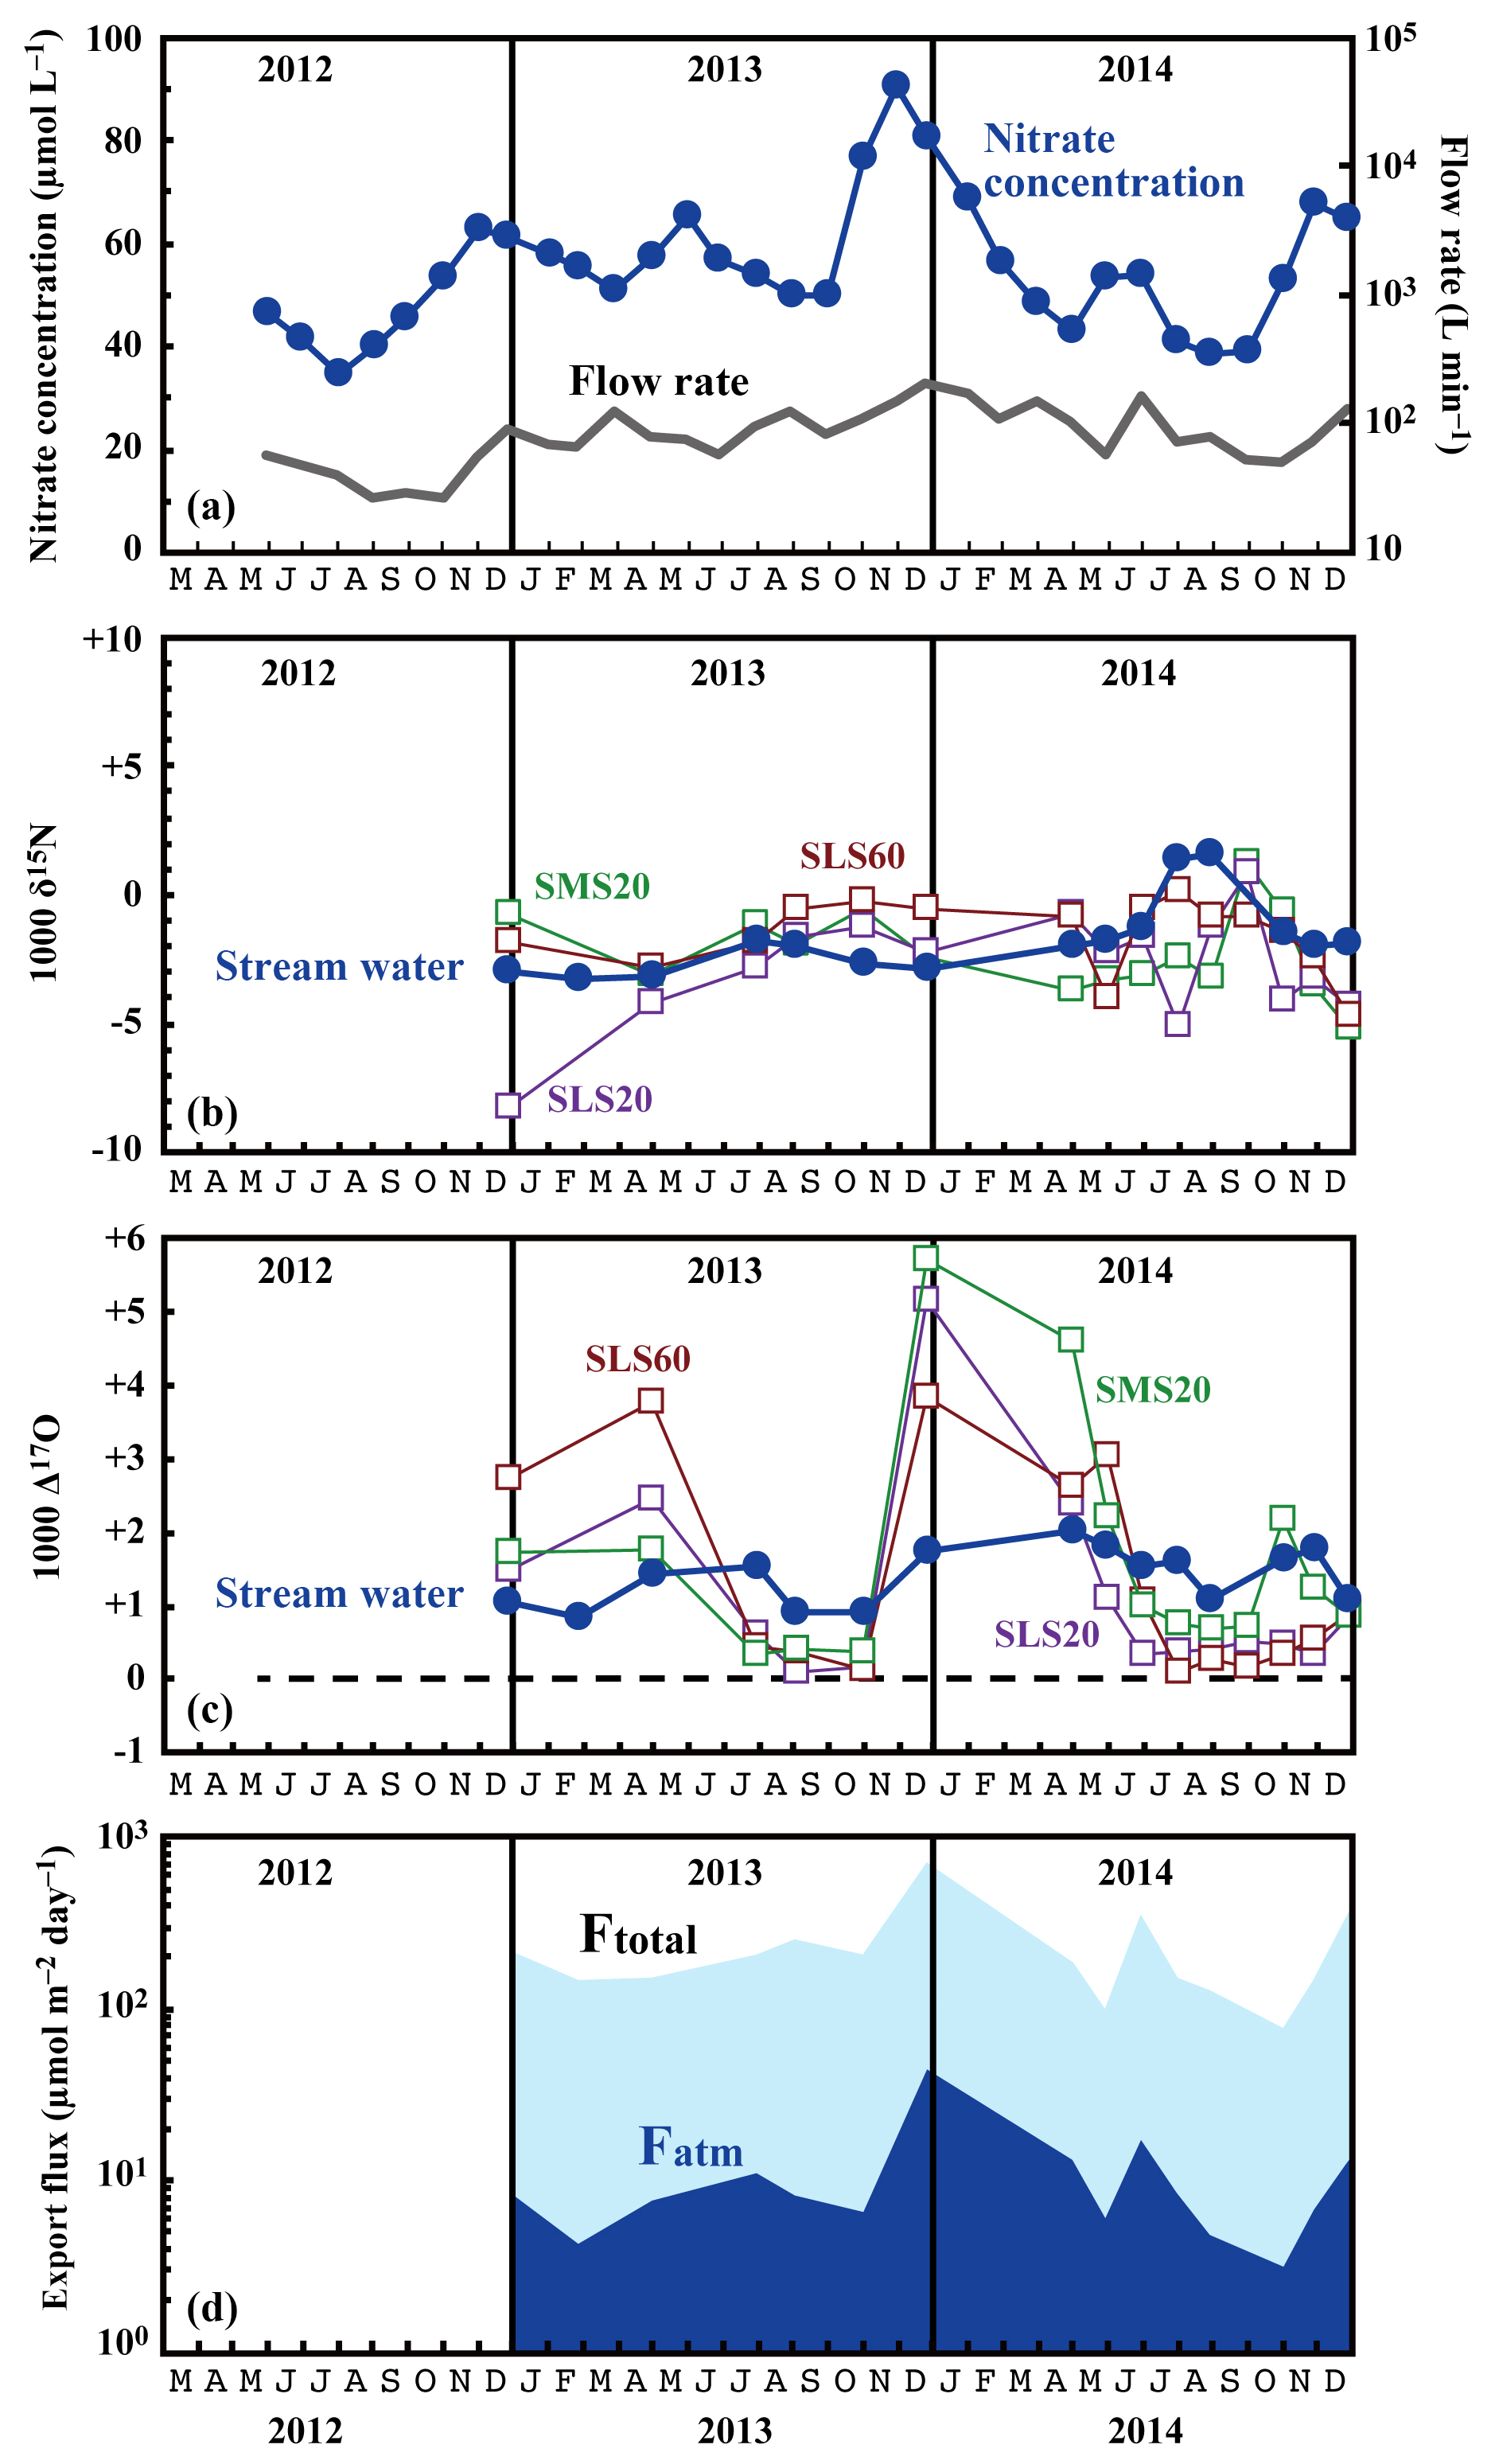
Figure 3Temporal variations in the running mean concentrations of nitrate (blue circles) and flow rates (grey line) in the stream water (a), together with those in the values of δ15N (b) and Δ17O (c) of the nitrate in stream water (blue circles) and soil water (SMS20: green squares, SLS20: purple squares, SLS60: brown squares), and in the export fluxes (running mean) of nitrate (Ftotal) and atmospheric nitrate (Fatm) (d) via the stream at site KJ.

Figure 4Relationship between Δ17O and δ18O values of nitrate in stream water at site KJ (red circles: June, July, August, and September; green circles: rest of the months), together with those in soil water at site KJ (SLS20: white squares, SLS60: white triangles, SMS20: white circles). A hypothetical mixing line between (Δ17O ‰, δ18O ‰; Tsunogai et al., 2016) and having the average δ18O value of (Δ17O =0 ‰, δ18O ‰) in both stream and soil water in the site is shown (mixing line A), together with a hypothetical mixing line between (the same with mixing line A) and having the possible lowermost δ18O value (Δ17O =0 ‰, δ18O ‰) that could be produced in the soils (mixing line B).
3.1 Site KJ: overview
The annual discharge rate via the stream estimated by integrating the daily average flow rate of stream water (V) was 1276 mm on average at site KJ during the observations undertaken between 2013 and 2014. This value corresponds to 52 % of the annual deposition rate determined at the meteorological station nearby (Nakajyo AMeDAS observatory; 2454 mm on average between 2012 and 2014). Kamisako et al. (2008) determined the annual discharge rate at site KJ to be 1439 mm during the observations undertaken between 2002 and 2007 using the same method as this study and estimated that approximately 61 % of the precipitation becomes stream outflow in this catchment. Because the evapotranspiration loss from forested catchments in Japan was estimated to be 30 % to 50 % of deposition for the annual deposition rate from 2000 to 2500 mm (Ogawa, 2003), we concluded that the estimated annual discharge via the stream was highly reliable at the site, within the error range of 10 %.
The determined export fluxes of nitrate in stream water (Ftotal) ranged from 74.7 to 698.4 , and the determined export fluxes of in stream water (Fatm) ranged from 3.3 to 46.1 (Fig. 3d). We identified a clear increase in Ftotal in winter, with the maximum flux occurring around December every year (Fig. 3d). A similar increase in the export fluxes of nitrate in winter was found in previous studies undertaken between 2002 and 2007 on the same stream (Kamisako et al., 2008). In accordance with the increase in Ftotal in winter, Fatm also increased. The continuous monitoring of Δ17O (Bourgeois et al., 2018a; Tsunogai et al., 2014) and δ18O (Kendall et al., 1995; Ohte et al., 2004; Pellerin et al., 2012; Piatek et al., 2005) of nitrate in past studies of streams eluted from forested catchments has often shown an increase in Fatm during spring, probably because of accumulated in the snowpack discharging to the streams. At site KJ, however, we could not find a significant Fatm increase in spring.
The flux-weighted average stream nitrate concentration was 58.4 µmol L−1. Compared with the average of 45.0 µmol L−1 determined during past observations (Kamisako et al., 2008), a further increase in nitrate concentration was found at site KJ in this study. Compared with the annual average stream nitrate concentrations eluted from forested catchments in Japan determined by Shibata et al. (2001) (n=18), that at site KJ corresponds to the highest, except for the two forested catchments near metropolitan Tokyo showing high stream nitrate concentrations. The stable isotopic composition of stream nitrate differed from the concentration, showing only small temporal variation from −3.2 ‰ to +1.6 ‰ for δ15N (Fig. 3b), from −2.3 ‰ to +2.2 ‰ for δ18O (Fig. 4), and from +0.8 ‰ to +2.0 ‰ for Δ17O (Fig. 3c). The flux-weighted averages for the δ15N, δ18O, and Δ17O values of nitrate were −2.2 ‰, +0.50 ‰, and +1.49 ‰, respectively. These values are typical for nitrate exported from temperate forested watersheds (Bourgeois et al., 2018b; Nakagawa et al., 2013; Riha et al., 2014; Sabo et al., 2016; Tsunogai et al., 2014, 2016).
Compared with the stream water, the soil water displayed higher nitrate concentrations up to 1.6 mmol L−1 (Fig. 5). The soil nitrate concentration showed significant seasonal variation irrespective of the locations or depths of sampling, with the maximum occurring in summer (August to September) and minimum in winter (December) in our dataset (Fig. 5). Because we could not obtain data for soil water during January to March because of heavy snow at the site, nitrate concentration may be much lower during those months.
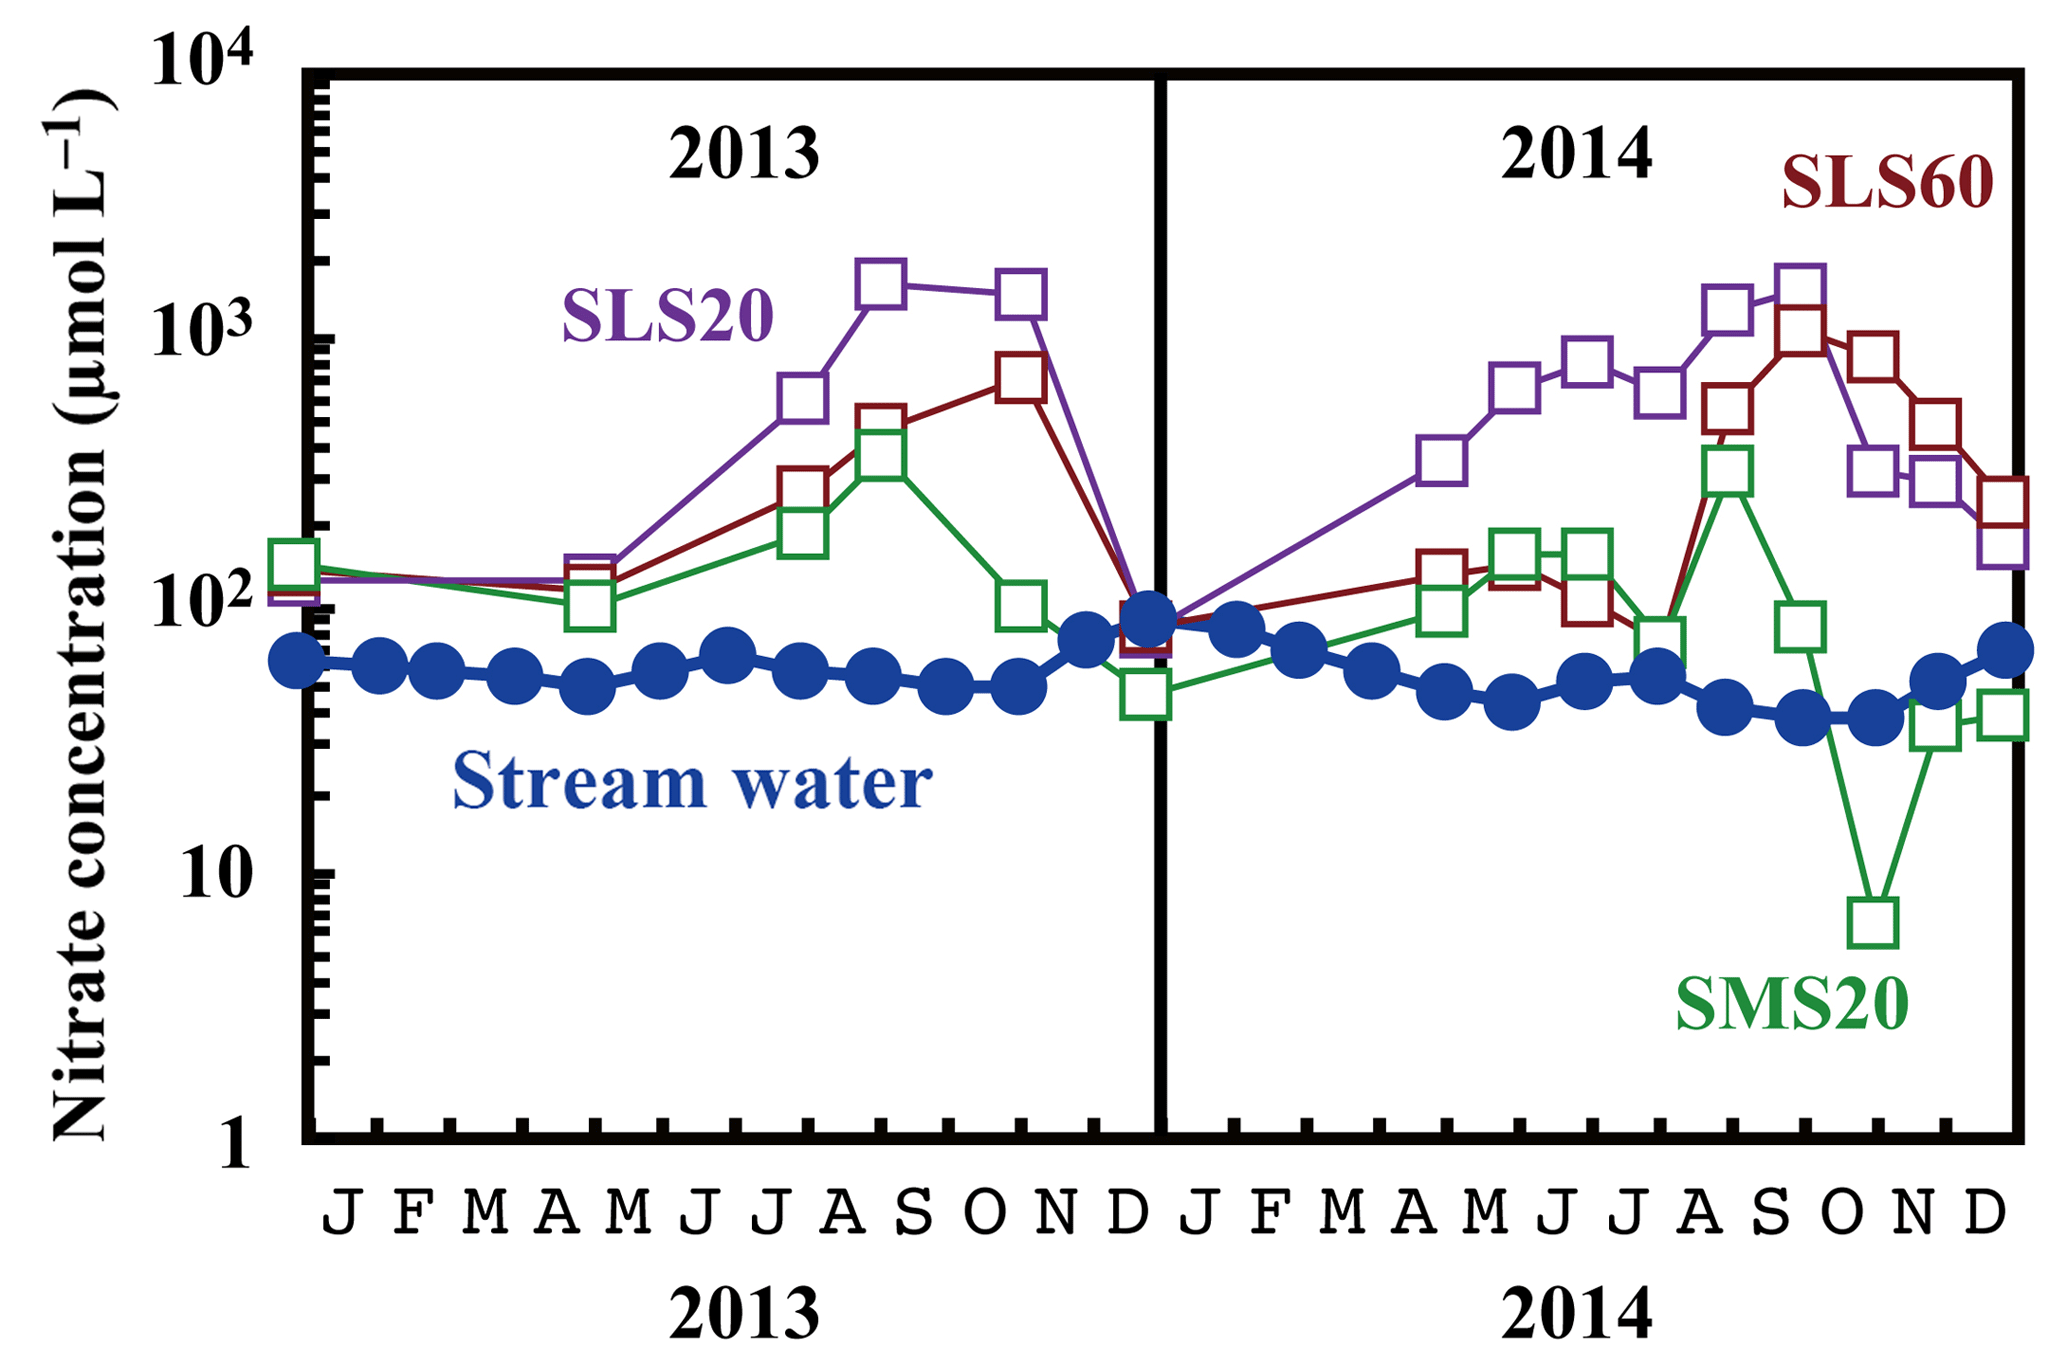
Figure 5Temporal variations in the concentrations of nitrate in stream water (blue circles) and those in soil water (SMS20: green squares, SLS20: purple squares, SLS60: brown squares) at site KJ on a logarithmic scale.
The stable oxygen isotopic compositions (δ18O and Δ17O) of nitrate in the soil water also showed large seasonal variation, irrespective of the locations or depths of sampling, from −7.1 ‰ to +11.1 ‰ for δ18O and from +0.1 ‰ to +5.7 ‰ for Δ17O (Figs. 3c and 4), with the maximum occurring in winter and minimum in summer (Fig. 3c). In addition, the stable oxygen isotopic compositions (δ18O and Δ17O) of nitrate showed a linear correlation on the Δ17O–δ18O plot (Fig. 4). Because is enriched in both Δ17O and δ18O and is the only possible source of nitrate with Δ17O values higher than 0 ‰, mixing ratios between and were primarily responsible for the variation in both Δ17O and δ18O in the soil nitrate (Costa et al., 2011). Moreover, the soil nitrate that was enriched during summer is mostly remineralized nitrate produced through nitrification in soils. The stable nitrogen isotopic composition (δ15N) of nitrate in the soil water samples also showed a larger temporal variation compared to the stream water nitrate, from −8.2 ‰ to +0.5 ‰ (Fig. 3b).
The areal bulk deposition flux of determined for site KJ was 0.125 mmol m−2 day−1 (45.6 mmol m−2 yr kgN ha−1 yr−1) on average during the observation period. As presented in Sect. 2.4, the deposition flux could be either underestimated because of insufficient inclusion of the dry deposition flux (Aikawa et al., 2003) or overestimated because of the progress of nitrification in sample bottles during storage in the field until recovery (Clow et al., 2015). Nevertheless, the deposition flux almost corresponds to the average areal total (wet + dry) deposition flux of atmospheric nitrate determined at the nearby Sado–Seki National Acid Rain Monitoring Station on Sado Island (38∘14′59 N, 138∘24′00 E; Fig. 1a) in 2013 (49.2 mmol m−2 yr kgN ha−1 yr−1) and 2014 (48.3 mmol m−2 yr kgN ha−1 yr−1), for which the wet deposition flux of nitrate (30.6 and 27.1 mmol m−2 yr−1 in 2013 and 2014, respectively), dry deposition flux of gaseous HNO3 (13.5 and 15.3 mmol m−2 yr−1 in 2013 and 2014, respectively), and dry deposition flux of particulate nitrate (5.1 and 5.9 mmol m−2 yr−1 in 2013 and 2014, respectively) were integrated (EANET, 2014, 2015). As a result, we use the bulk deposition flux determined in this study (45.6 mmol m−2 yr−1) as the areal total (wet + dry) deposition flux of (Datm) at site KJ by allowing an error range of 10 %.
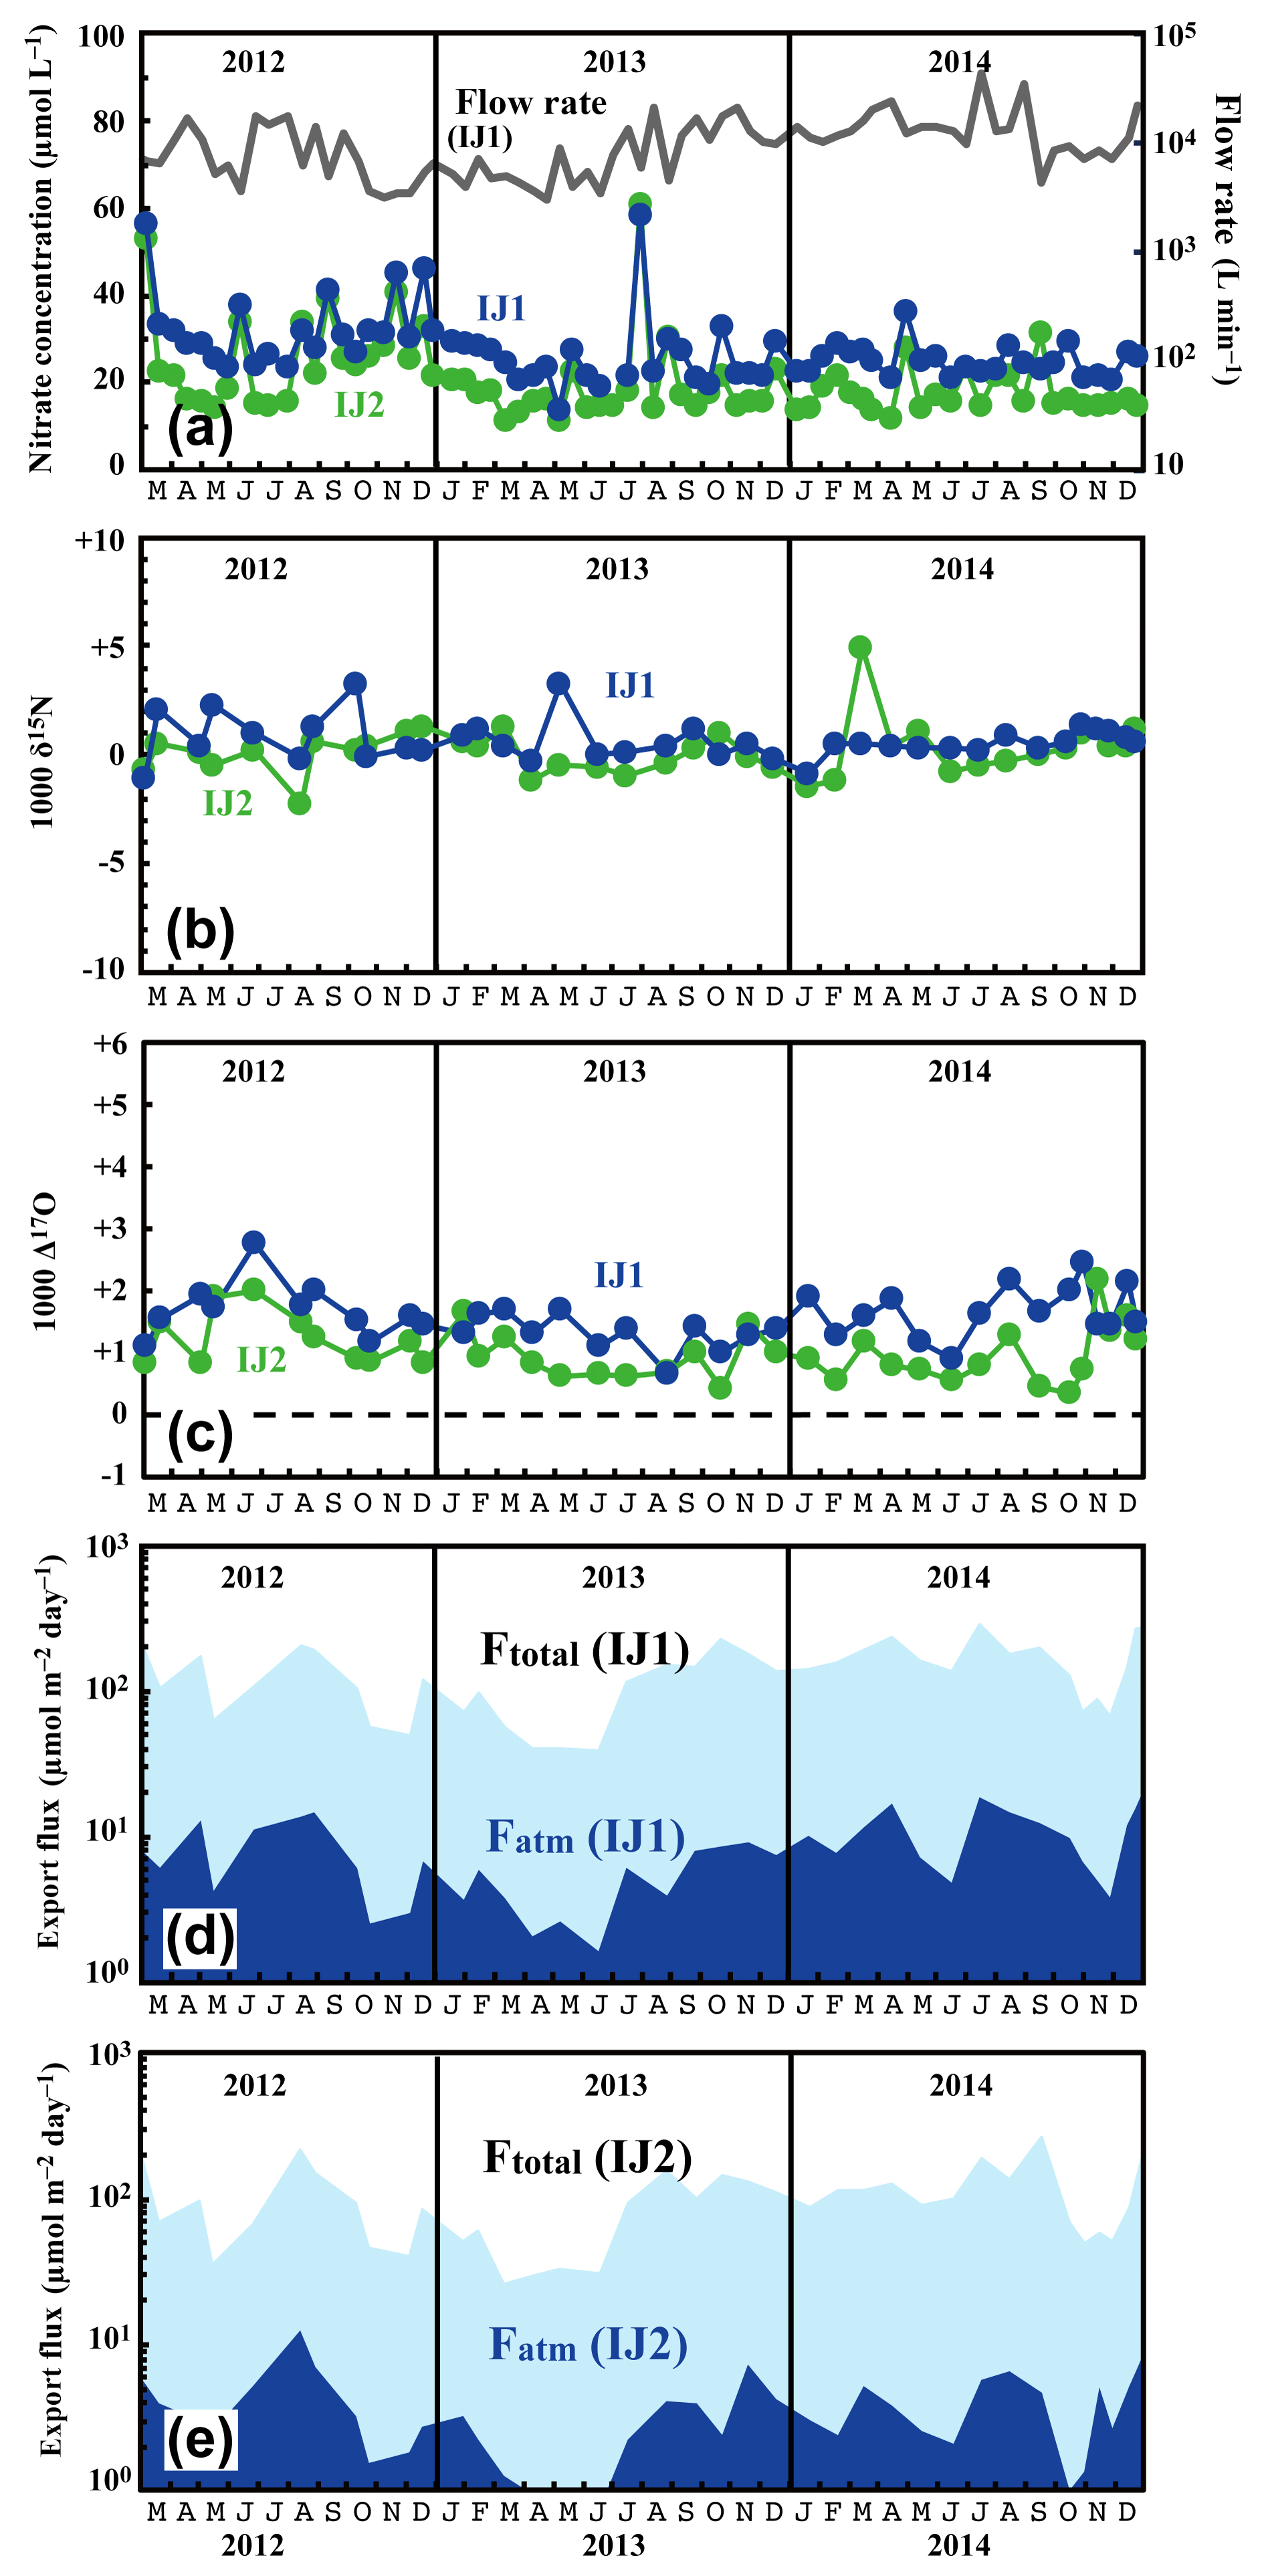
Figure 6Temporal variations in concentrations of nitrate (IJ1: blue circles, IJ2: green circles) and flow rates at IJ1 (grey line) (a), together with those in the values of δ15N (b) and Δ17O (c) of nitrate at sites IJ1 and IJ2, in the export fluxes (running mean) of nitrate (Ftotal) and atmospheric nitrate (Fatm) via the stream at site IJ1 (d), and in Ftotal and Fatm via the stream at site IJ2 (e).
3.2 Sites IJ1 and IJ2: overview
The annual discharge rate via the streams estimated by integrating the daily average flow rates of stream water (V) was 2057 mm on average at the sites during the observations. This value corresponds to 62 % of the annual deposition rate (3310 mm on average during the observations undertaken between 2013 and 2014). Because the evapotranspiration loss from forested catchments in Japan was estimated to be 30 % to 40 % of deposition for the annual deposition rate of 3000 mm (Ogawa, 2003), we concluded that the estimated annual discharge via the stream was highly reliable in the sites, within the error range of 10 %.
The determined export fluxes of nitrate in stream water (Ftotal) ranged from 39.3 to 293 and from 26.1 to 267 in IJ1 and IJ2, respectively, and the determined export fluxes of in stream water (Fatm) ranged from 1.6 to 18.3 and from 0.75 to 12.3 in IJ1 and IJ2, respectively (Fig. 6d and e). The values ranged from 13.6 to 58.4 µmol L−1 for nitrate concentration (Fig. 6a), −2.2 ‰ to +5.0 ‰ for δ15N (Fig. 6b), +1.0 ‰ to +9.8 ‰ for δ18O, and +0.7 ‰ to +2.8 ‰ for Δ17O (Fig. 6c) in IJ1. They ranged from 11.1 to 60.9 µmol L−1 for nitrate concentration (Fig. 6a), −1.1 ‰ to +3.3 ‰ for δ15N (Fig. 6b), −2.1 ‰ to +8.0 ‰ for δ18O, and +0.4 ‰ to +2.2 ‰ for Δ17O (Fig. 6c) in IJ2.
Different from site KJ, we could not find any clear seasonal variation in the concentration of nitrate, the stable isotopic compositions of nitrate, or the export fluxes of nitrate (Ftotal) and (Fatm) in the stream water from IJ1 and IJ2. We could not identify a spring maximum in these catchments either. Conversely, we did find sporadic, short-term increases in nitrate of approximately 40 µmol L−1 during the observation period. The increases were observed simultaneously at IJ1 and IJ2. Similar sporadic increases in nitrate concentration were found in August 1994 during observations from 1988 to 2003 on the stream IJ1 (Nakahara et al., 2010). Except for the sporadic, short-term increases in nitrate concentration, the stream water nitrate concentration and isotopic composition were almost constant at each site during the observation period. The flux-weighted average for the δ15N, δ18O, and Δ17O values of stream nitrate were +0.23 ‰, +3.76 ‰, and +1.50 ‰ at IJ1, respectively, and +0.42 ‰, +1.57 ‰, and +0.85 ‰ at IJ2, respectively. These values are typical for nitrate exported from temperate forested watersheds (Bourgeois et al., 2018b; Nakagawa et al., 2013; Riha et al., 2014; Sabo et al., 2016; Tsunogai et al., 2014, 2016).
One of the striking features of the stream nitrate concentration at these sites is that nitrate concentrations at IJ1 were approximately 7±5 µmol L−1 higher than those for IJ2 determined at the same time throughout the observation period. Amongst the 71 pairs of data points, the reverse relationship (lower nitrate concentration in IJ1 compared with IJ2) was found only three times (August 2012, July 2013, and September 2013). Even during the sporadic, short-term increases in nitrate, the nitrate concentrations in IJ1 were generally higher than IJ2. Furthermore, not only the stream nitrate concentration but also the Δ17O values of nitrate at IJ1 were higher than those at IJ2 (Fig. 6c). Amongst the 38 pairs of data points, the reverse relationship (lower Δ17O values of nitrate in IJ1 compared with IJ2) was found only five times.
The flux-weighted average stream nitrate concentrations during the observation period were 24.4 and 17.1 µmol L−1 in IJ1 and IJ2, respectively. Compared with the annual average stream nitrate concentrations eluted from forested catchments in Japan that were determined by Shibata et al. (2001) (n=18), those at sites IJ1 and IJ2 correspond to the eighth and ninth highest concentration, respectively. While the stream nitrate concentration in IJ1 showed an increasing trend from year to year, from 22 µmol L−1 in the late 1980s to 42 µmol L−1 in the early 2000s (Nakahara et al., 2010), the recent result (almost stable at 24.4 µmol L−1 on average during the observations undertaken between 2012 and 2014; Fig. 6a) revealed that the trend in stream nitrate concentration had already changed from increasing to decreasing.
The areal deposition flux of was 0.122 mmol m−2 day−1 (44.5 mmol m−2 yr−1) on average during the observation period (EANET, 2014, 2015). This value almost corresponds with the observed value from the KJ monitoring site.
3.3 Origin of stream nitrate in site KJ
The runoff paths of water from the forested slope to the stream can be classified into (1) overland flow, (2) through flow (shallow subsurface flow above the water table), and (3) groundwater flow (movement through the saturated zone; Berner and Berner, 1987). The Δ17O values of stream nitrate (+0.8 ‰ to 2.0 ‰) indicated that the major portion of stream nitrate was remineralized nitrate () produced through nitrification in soils, and thus unprocessed atmospheric nitrate () contributed a minor portion of the total nitrate. This means that nitrate supplied via overland flow was a minor portion of stream nitrate. While stream nitrate showed similar Δ17O values to soil nitrate (nitrate in the soil water samples of SLS20, SLS60, and SMS20), the variation in stream nitrate was much smaller than soil nitrate (Fig. 4), from +0.8 ‰ to +2.0 ‰ for stream nitrate, while it ranged from +0.1 ‰ to +5.7 ‰ for soil nitrate. Because Δ17O is stable during partial metabolism in soils (such as assimilation and denitrification), the present results imply that nitrate in the catchment groundwater was the major source of stream nitrate, while nitrate in through flow, in which the Δ17O values must be similar to those of soil nitrate, was a minor contributor to the stream nitrate. That is, while the Δ17O values of soil nitrate represented the original Δ17O values of nitrate now in the groundwater and the stream water, the large seasonal variation in the Δ17O values of soil nitrate was buffered by nitrate reserves in the groundwater (Kabeya et al., 2007; Tsunogai et al., 2016). Therefore, little seasonal variation in the Δ17O values of stream nitrate and only a small increase in Fatm during spring were observed.
This hypothesis was supported by the δ2H, δ18O, and d-excess (; Dansgaard, 1964) values of stream and soil water. The values of δ2H, δ18O, and d-excess in stream water showed little temporal variation at ‰, ‰, and ‰, respectively (the average and the 1σ variation range of each), while larger temporal variation was seen in the corresponding values in soil water (Fig. S1 in the Supplement). The values of δ2H, δ18O, and d-excess in rainwater (and snow water) in these regions (Sea of Japan side of eastern Japan) show large seasonal variation every year. In the case of d-excess, for instance, d-excess values greater than +30 ‰ in winter and less than +10 ‰ in summer are seen in the rainwater in these regions (Tanoue et al., 2013). As a result, the observed large temporal variation in soil water reflected the large temporal variation in rainwater (and snow water). Conversely, the small seasonal variation found in the values of δ2H, δ18O, and d-excess in stream water indicates that the large temporal variation in rainwater (and snow water) and soil water was buffered by groundwater. Additionally, the contribution of both overland flow and through flow should be minor in the stream.
This hypothesis was supported by the δ18O values of nitrate as well. While the δ18O values of nitrate could change during partial metabolism, the range of δ18O variation in stream nitrate (−2.3 ‰ to +2.2 ‰) was within the range of soil nitrate (−7.1 ‰ to +11.1 ‰) (Fig. 4). In addition, stream nitrate data were plotted along the hypothetical mixing line between and for soil nitrate (Fig. 4). We concluded that soil nitrate was the primary source of stream nitrate, but the temporal variation in the concentration and isotopic compositions of soil nitrate had been buffered by the huge nitrate reserve in the groundwater.
By extrapolating the linear correlation between Δ17O and δ18O in stream and soil nitrate shown in Fig. 4 (r2=0.647, p<0.001) to Δ17O =0 ‰, we obtained the δ18O value of as the average δ18O value of in both stream and soil water. The δ18O value of correlated strongly with that of being exported from forested catchments. Examples include the following: exported from cool–temperate forested watersheds on Rishiri Island (δ18O ‰), where the δ18O(H2O) was approximately −13 ‰ (Tsunogai et al., 2010); exported from a cool–temperate forested catchment in Teshio (δ18O ), where the δ18O(H2O) was approximately −11 ‰ (Tsunogai et al., 2014); and exported from the temperate forested watersheds around Lake Biwa (δ18O ), where the δ18O(H2O) was ‰ (Tsunogai et al., 2016).
The possible δ18O value of produced through microbial nitrification can be estimated using the equation shown below (Buchwald et al., 2012):
where δ18OH2O denotes the δ18O value of H2O during nitrification, denotes the δ18O value of O2 during nitrification (+24.2 ‰ in this study), and x denotes the amount of O atom exchange between nitrite and H2O during nitrification. By changing x from 0 (no exchange) to 1 (full exchange), we can estimate the possible δ18O value of produced through microbial nitrification under an H2O of −9.1 ‰ (the average δ18O value of H2O in the stream water samples; Fig. S1) as ‰. Because the partial metabolism of nitrate would enhance the δ18O values of residual nitrate to some extent, the possible lowermost δ18O value of (−7.7 ‰) is the most probable δ18O value of originally produced through microbial nitrification in the forested soils at site KJ to explain the linear relation between Δ17O and δ18O values of both soil and stream nitrate shown in Fig. 4. Additionally, the observed average δ18O value ( ‰), showing a small difference from the possible lowermost original δ18O value of in both the stream and soil water, implies that 18O enrichment through partial metabolism subsequent to the production of was small, only +5 ‰ or less on average in the forested soils in KJ. The relationship between Δ17O and δ18O of nitrate shown in Fig. 4 is highly useful for determining the δ18O value of in each catchment and thus the behavior of produced within the catchment (Tsunogai et al., 2010).
3.4 Seasonal variation at site KJ
Nitrate at site KJ presented a clear export flux (Ftotal) increase in winter (Fig. 3d). High precipitation in winter is partially responsible for the increase in the export flux of water and thus the Ftotal increase in winter. However, it is difficult to explain a nitrate concentration greater than 80 µmol L−1 only by higher precipitation in winter. Kamisako et al. (2008) found the same trend during their observation period from 2002 to 2007 at the same site and proposed that active biological assimilation of nitrate during the growing season was responsible for the nitrate concentration decrease in summer and thus the nitrate concentration increase in winter. However, the present study revealed that the soil nitrate showed the opposite trend: a nitrate concentration increase in summer and nitrate concentration decrease in winter, probably because of active nitrification in the soil in summer (Breuer et al., 2002; Hoyle et al., 2006; Tsunogai et al., 2014; Zaman and Chang, 2004). A clear decrease in the Δ17O values of soil nitrate in summer (Fig. 3c) also supports the occurrence of active nitrification in summer (Tsunogai et al., 2014) because the Δ17O values of remineralized nitrate produced through nitrification are 0 ‰ (Michalski et al., 2004; Nakagawa et al., 2013). Moreover, if such biological assimilation was responsible for the decrease in nitrate concentration in summer, enrichment in the values of δ15N and δ18O could be expected in the residual portion of nitrate exported into the stream, while we could not find significant enrichment in summer (Figs. 3 and 4). As a result, it is difficult to assume the active biological assimilation of nitrate in summer as responsible for the seasonal variation in stream nitrate concentration.
As presented in Sect. 3.3, the major source of stream nitrate is likely groundwater nitrate that has been recharged by soil nitrate. The residence time of groundwater was estimated to be a few months for most of the catchments in Japan with a humid temperate climate using the deuterium excess as a tracer (Kabeya et al., 2007; Takimoto et al., 1994). While the soil nitrate concentration showed an increase in summer and decrease in winter, stream nitrate samples taken at the same time showed the opposite trend (Fig. 7). However, if we assume a time lag of 3 months between the samples, as presented in Fig. 7, the stream nitrate concentration shows a normal correlation with soil nitrate concentration (r2=0.49 and p<0.02 for SLS20, r2=0.25 and p<0.01 for SMS20).
The small increase–decrease in the Δ17O values of stream nitrate can be explained by the increase–decrease in the Δ17O values of soil nitrate 3 months earlier. This delay time reflects the magnitude and flow of the nitrate reservoir in the groundwater of this catchment. We conclude that active nitrification in summer is largely responsible for the increase in stream nitrate concentration in winter by increasing the nitrate concentration in groundwater that reflects nitrate accumulation over a few months prior to the observation.
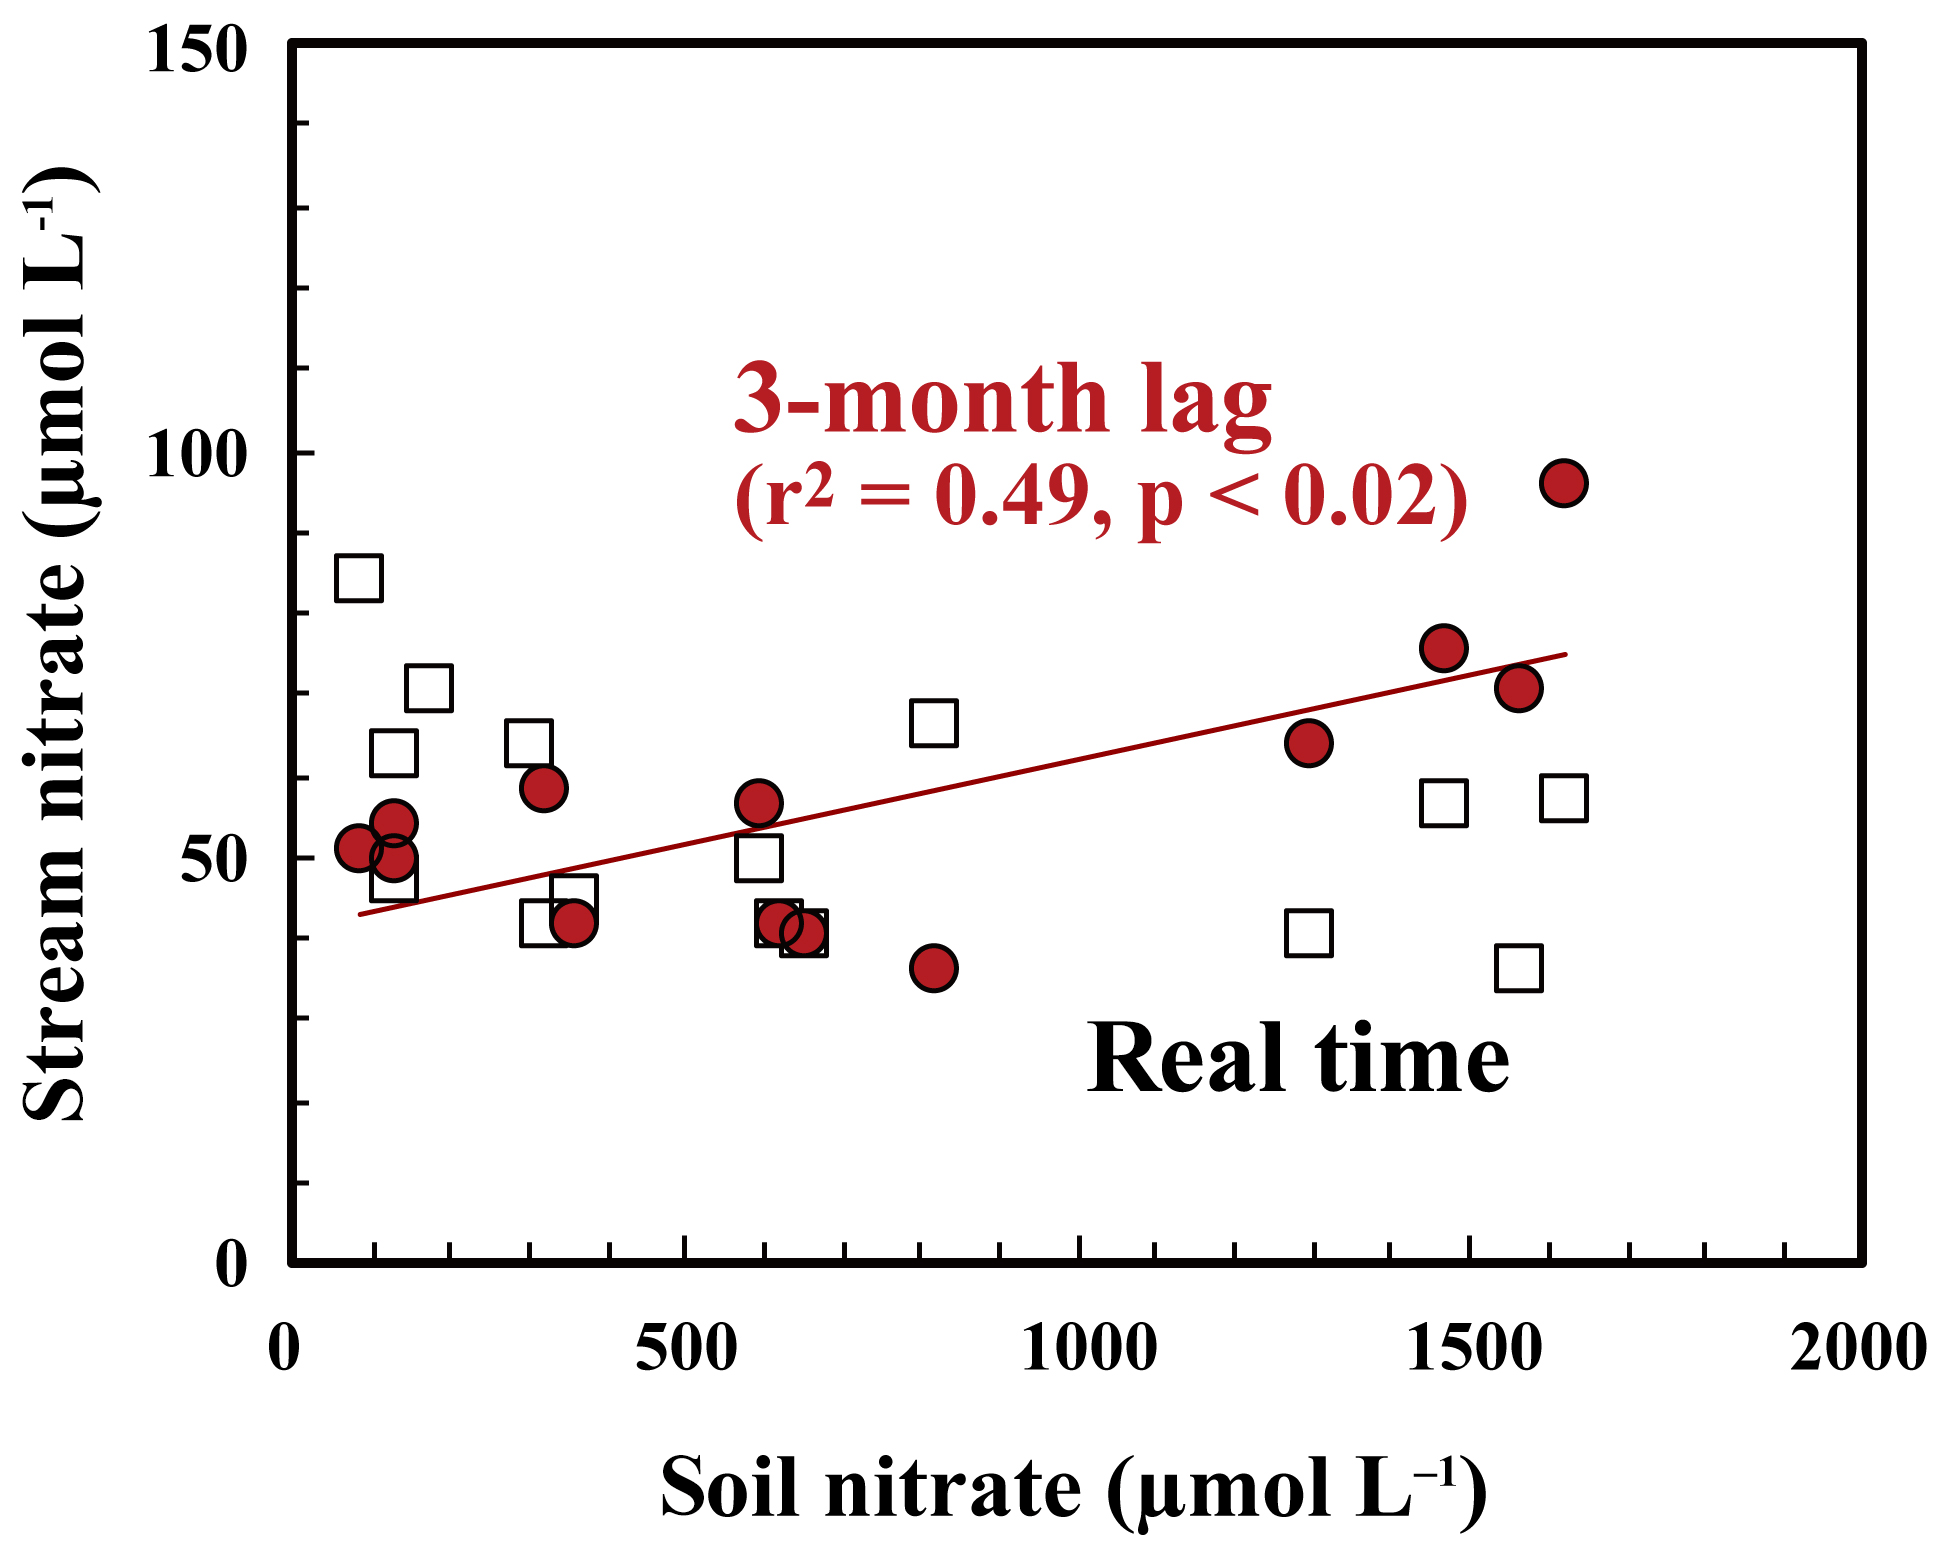
Figure 7Relationship between concentrations of nitrate in soil water taken at SLS20 in site KJ and those in stream nitrate taken at the same time (white squares), together with those in stream nitrate taken 3 months later (red circles).
3.5 The export flux of atmospheric nitrate and the relationship with nitrogen saturation
As already implied in previous studies at site KJ (Kamisako et al., 2008; Sase et al., 2015), stream nitrate at site KJ is characterized by elevated nitrate concentrations. Additionally, the stream water at site IJ1 is characterized by nitrate concentrations higher than the stream water at site IJ2. The flux-weighted annual average stream nitrate concentration determined in this study was 58.4 µmol L−1 at site KJ, and 24.4 and 17.1 µmol L−1 at sites IJ1 and IJ2, respectively (Table 1). The annual export flux of nitrate per unit area of the catchment (Mtotal) from site KJ (76.4 mmol m−2 yr−1) was also higher than the fluxes from sites IJ1 and IJ2 (50.1 and 35.1 mmol m−2 yr−1, respectively). In accordance with the variation in the export flux of nitrate, the unprocessed per unit area of the catchment (Matm) also varied: 4.26±0.78 (mmol m−2 yr−1) from KJ, 2.88±0.52 (mmol m−2 yr−1) from IJ1, and 1.15±0.13 (mmol m−2 yr−1) from IJ2 (Table 1). As a result, not only the export flux of produced through nitrification in forested soils but also the direct drainage flux of unprocessed increased in accordance with the increases in the export flux of nitrate between the catchments.
Table 1The average concentration in streams ([Ctotal]avg), the average unprocessed concentration in streams ([Catm]avg), the annual export flux of per unit area of catchment (Mtotal), the annual export flux of per unit area of catchment (Matm), the annual average Matm ∕ Mtotal ratios, and the deposition flux of per unit area of catchment (Datm) in the studied catchments.
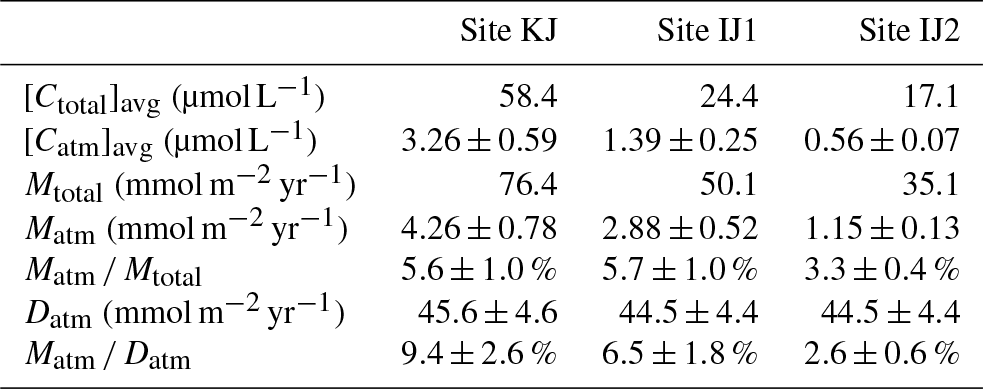
Because the differences in the deposition flux of (Datm) were small between the studied catchments (Table 1), regional changes in Datm cannot be the direct cause of the observed variation in Matm in accordance with variation in the stream nitrate concentrations. Moreover, the Matm ∕ Datm ratios estimated using Eq. (9) also varied in accordance with the stream nitrate concentrations (Fig. 8a): 9.4 %±2.6 % at site KJ, 6.5 %±1.8 % at site IJ1, and 2.6 %±0.6 % at site IJ2, and thus the residual portion (90.6 %±2.6 % in KJ, 93.5 %±1.8 % in IJ1, and 97.4 %±0.6 % in IJ2) underwent biological processing (such as assimilation and denitrification) before being exported from the surface ecosystem. The Matm ∕ Datm ratio, the directly exported flux of unprocessed relative to the entire deposition flux of in a catchment area, was used in our previous study as an index to evaluate the biological metabolic rate of nitrate in forested soils (Tsunogai et al., 2014) because the (Datm–Matm) ∕ Datm ratio increases in accordance with an increase in the biological metabolic rate of nitrate (total) in forested soils (Fig. 9). The normal correlation between stream nitrate concentrations and the Matm ∕ Datm ratios is an important finding to interpret the changes in stream nitrate concentrations between the catchments.
Rose et al. (2015a) determined Matm in forested catchments under various nitrogen saturation stages and found similar Matm variation in accordance with stream nitrate concentrations. When we estimated Matm ∕ Datm ratios for the catchments studied in Rose et al. (2015a) and plotted them as a function of the stream nitrate concentration in Fig. 8a together with our data, both results plotted on the same region showed a clear increasing trend in the Matm ∕ Datm ratios in accordance with increases in the stream nitrate concentration and thus increases in the stage of nitrogen saturation (Fig. 8a).
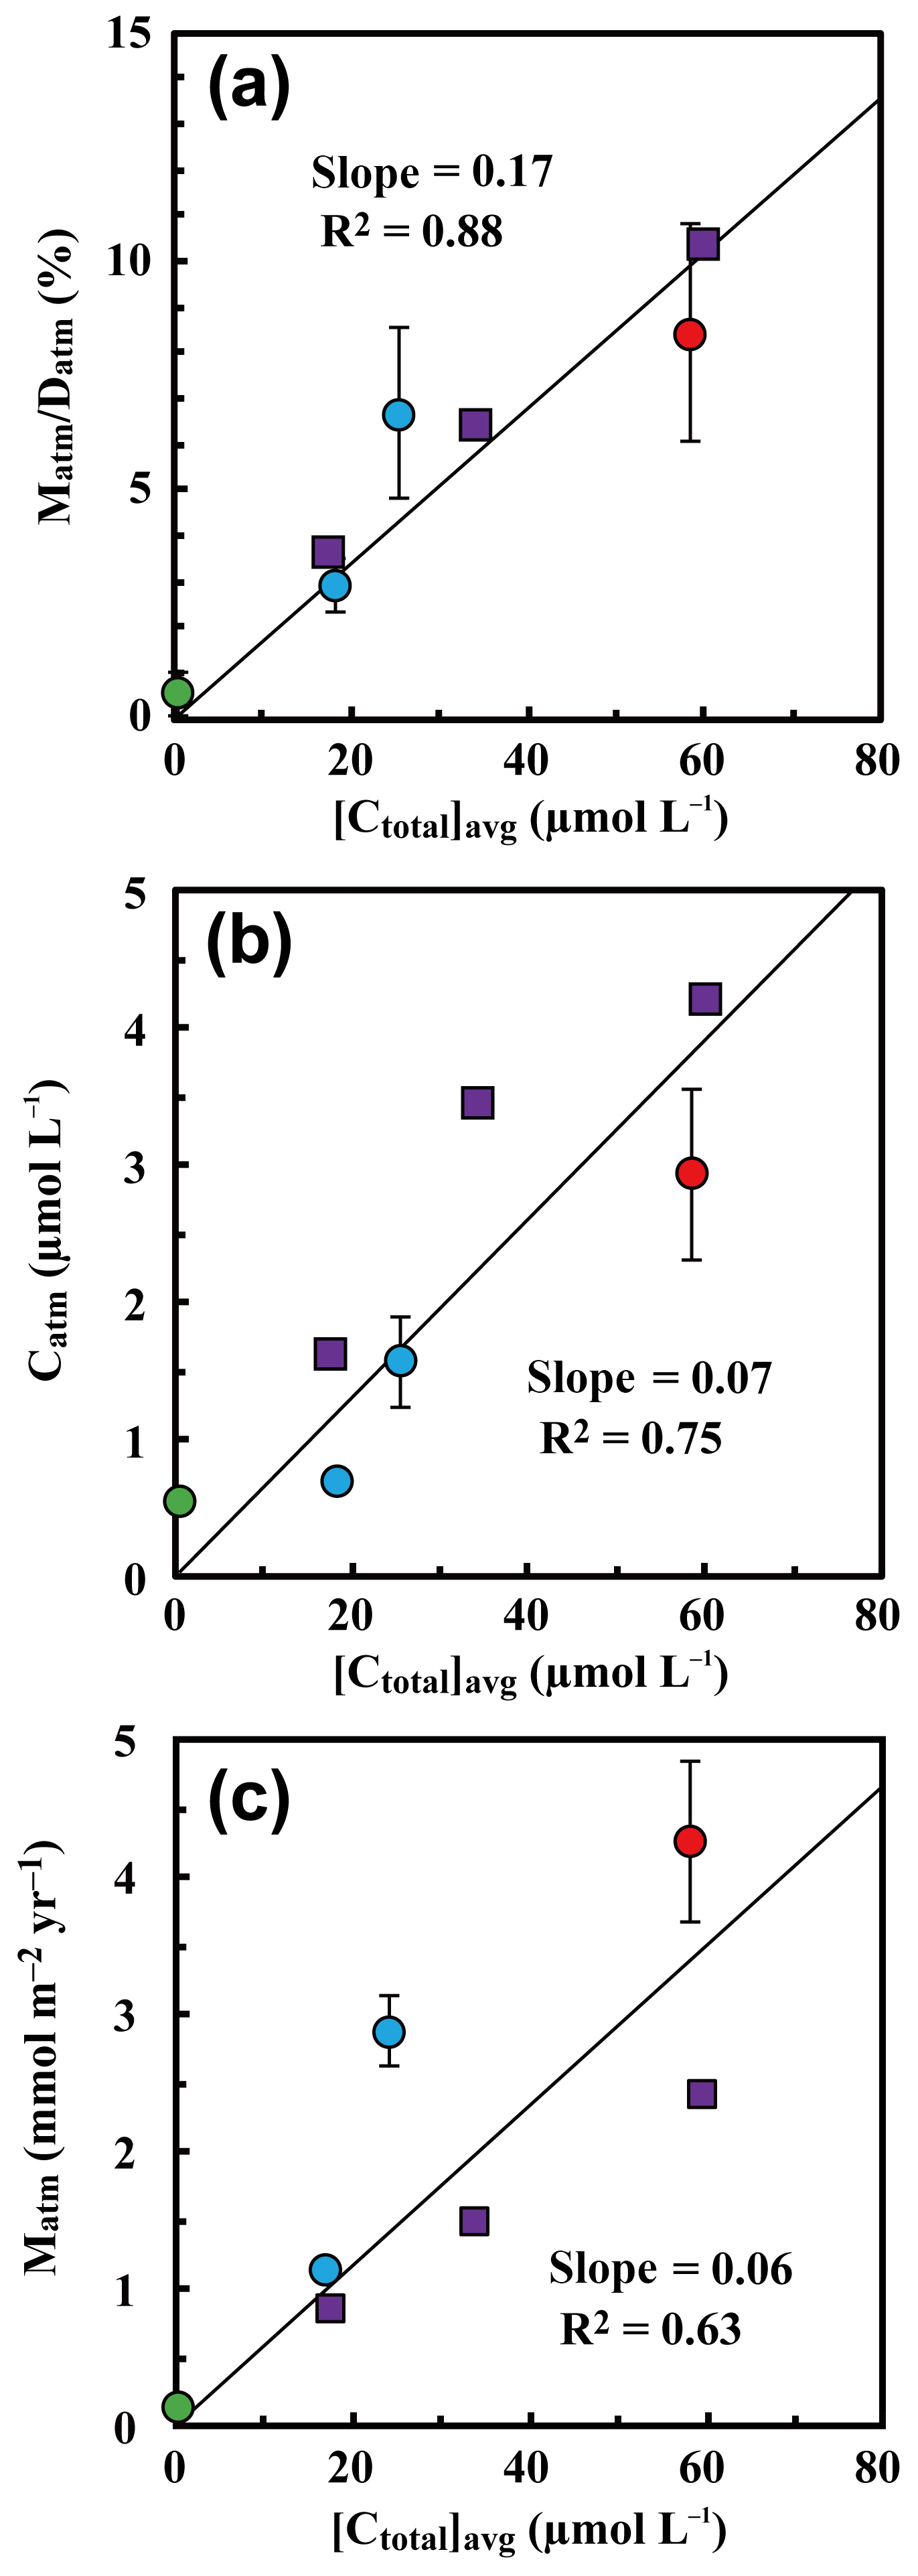
Figure 8The annual export flux of unprocessed relative to the annual deposition flux of (Matm ∕ Datm ratios) plotted as a function of the flux-weighted annual average concentration of nitrate in each stream water ([Ctotal]avg) (a); the flux-weighted annual average concentration of in each stream water ([Catm]avg) plotted as a function of [Ctotal]avg (b); and the annual export flux of (Matm) plotted as a function of [Ctotal]avg (c) (site KJ: red circles, sites IJ1 and IJ2: blue circles). Those determined at forested catchments in past studies are plotted as well, such as Fernow Experimental Forest in West Virginia, USA (purple squares; Rose et al., 2015a), and Teshio Experimental Forest in Hokkaido, Japan (green circle; Tsunogai et al., 2014).

Figure 9Schematic diagram showing the biological processing of nitrate in a forested catchment under nitrogen saturation (a) and that under nitrogen-limited, normal forest (b) (modified after Nakagawa et al., 2013). All the arrows (flows) related to the determination of the Matm ∕ Datm ratios are shown in red and pink, while the arrows (flows) related to nitrification in soils are shown in brown and yellow.
Either increased nitrification rates in forested soils or reductions in the N retention ability are assumed to be responsible for enhanced nitrogen leaching from soils and the increased export flux of nitrate in nitrogen-saturated catchments (Peterjohn et al., 1996). In the studied catchments, however, it is not possible to explain the variation in the export flux of unprocessed between the catchments only by the variation in the nitrification rates in forested soils because the Matm ∕ Datm ratios are stable during the progress of nitrification in forested soils (Fig. 9). In Fig. 9, all the arrows (flows) related to the determination of the Matm ∕ Datm ratios are shown in red and pink, while the arrows (flows) related to nitrification in soils are shown in brown and yellow. As represented by the differences in the colors, the Matm ∕ Datm ratios were determined independently of nitrification. Rather, varying N retention abilities (varying biological assimilation rates of nitrate, in particular) in forested soils are required to explain the observed variation in the stream nitrate concentration and Matm ∕ Datm ratios between the catchments simultaneously (Fig. 9).
The present results imply that the major impact of nitrogen saturation was on the biological assimilation processes of nitrate, rather than the biological nitrification processes in soils. Furthermore, in addition to the stream nitrate concentration, the Matm ∕ Datm ratio in each forested catchment can be used as an index for the nitrogen saturation stage. That is, the studied catchments were under nitrogen saturation in the stage order of KJ > IJ1 > IJ2 (Fig. 8a).
Kamisako et al. (2008) reported that the deposition rate of atmospheric nitrogen in site KJ was one of the highest levels in forested catchments in Japan and exceeds the threshold for nitrogen saturation proposed by previous studies in Europe and the US (Aber et al., 2003; Wright and Tietema, 1995). Kamisako et al. (2008) also found acidification of stream water during the periods with high concentrations of stream and proposed that site KJ was under nitrogen saturation as a result of the elevated deposition rate of atmospheric nitrogen. Nakahara et al. (2010) also proposed that site IJ1 has been under nitrogen saturation (stage 2) since 1997 based on observation of the atmospheric deposition rates, soil chemistry, stream water chemistry, and forest growth determined at the site. Our conclusion based on the Matm ∕ Datm ratios is supported by these past studies performed at the sites.
All nitrate other than unprocessed can be classified as , including nitrate produced through natural or anthropogenic processes in the biosphere, hydrosphere, and geosphere, as well as nitrate stored in soil, fertilizer, manure, and sewage. Therefore, except for those accompanied by secondary changes in biological assimilation processes of nitrate in forested soils, an increase in stream nitrate concentration resulting from artificial nitrate contamination processes in catchments does not increase Matm ∕ Datm ratios. As a result, the Matm ∕ Datm ratio in each forested catchment can be used as an index to differentiate an increase in stream nitrate concentration because of changes in biological assimilation processes of nitrate from an increase in stream nitrate concentration resulting from nitrate contamination processes.
Stoddard (1994) proposed the disappearance of seasonality in stream nitrate concentrations as an index for nitrogen saturation in forest ecosystems. However, because the seasonal changes in forested soils are buffered by groundwater in humid temperate climates such as Japan, the seasonality in stream nitrate concentrations is not clear even when exported from “normal” forest (i.e., forest under stage zero of nitrogen saturation; Mitchell et al., 1997). As a result, seasonality is not a reliable index of nitrogen saturation in forests in humid temperate climates. The present study implies that the Matm ∕ Datm ratio in each forested catchment, estimated from the 17O excess of stream nitrate, can be a robust alternative index for the stage of nitrogen saturation irrespective of the humidity of the climate.
To estimate Matm ∕ Datm ratios in a catchment, the export flux of nitrate (Mtotal), the 17O excess of stream nitrate, and the deposition rate of (Datm) must be estimated. The deposition rate of (Datm), however, is a difficult parameter to determine in forested catchments in general. An alternative parameter that we can determine more easily is the average concentration of in stream water ([Catm]avg); therefore, we plotted [Catm]avg as a function of the average concentration of nitrate ([Ctotal]avg) in Fig. 8b. While the correlation coefficient was poorer than the Matm ∕ Datm ratio, [Catm]avg also presented a normal correlation with the concentration of stream nitrate (Fig. 8b), probably because the differences in (1) concentration in wet deposition, (2) the dry deposition flux of , and (3) the evaporative loss flux of water deposited onto forested soils were small within the catchments. As a result, in forested catchments where we can assume the differences in (1), (2), and (3) from the studied catchments are minimal, we can use [Catm]avg as an alternative but less reliable index of the stage of nitrogen saturation instead of the Matm ∕ Datm ratios.
Previous studies also found that the relative mixing ratios of unprocessed to total nitrate (Matm ∕ Mtotal ratios) increased in proportion to the extent of both forest decline (Durka et al., 1994) and strip-cutting (Tsunogai et al., 2014). In the present study, however, we could not find clear changes in the Matm ∕ Mtotal ratios between the catchments: 5.6 % for site KJ, 5.7% for site IJ1, and 3.3 % for site IJ2 (Table 1). Rose et al. (2015a) also reported that the Matm ∕ Mtotal ratios were almost the same between forested catchments, irrespective of changes in their nitrogen saturation stages. While the annual export flux of nitrate and per unit area of the catchment increased by 6 and 20 times, respectively, in accordance with strip-cutting (Tsunogai et al., 2014), increases in Mtotal and Matm in KJ compared with IJ2 were only 3 and 4 times, respectively, so we could not find clear changes in Matm ∕ Mtotal ratios between the catchments. Even in forested catchments where it is difficult to determine Datm, the Matm ∕ Mtotal ratio is not a suitable alternative index to the Matm ∕ Datm ratio for the stages of nitrogen saturation.
Rose et al. (2015a) also found a linear correlation between Matm and stream nitrate concentrations. When we plotted Matm as a function of the stream nitrate concentration ([Ctotal]avg) together with our data, however, the correlation coefficient (R2=0.63) was poorer than the Matm ∕ Datm ratio (R2=0.92) and [Catm]avg (R2=0.80) (Fig. 8). While Datm was uniform at the sites studied by Rose et al. (2015a), Datm at sites KJ, IJ1, and IJ2 was different from Datm at the sites studied by Rose et al. (2015a). The Datm at site KJ, for instance, was about twice as much as that at the sites studied by Rose et al. (2015a). We concluded that normalizing Matm by Datm is indispensable to using them as an index for the stage of nitrogen saturation.
Using the 17O excess of nitrate as a tracer, we clarified that the major source of nitrate in stream water eluted from the studied forested catchments was nitrate in groundwater. The present results imply that nitrate in groundwater is the major source of nitrate in stream water eluted from forested catchments in humid temperate climates. Moreover, we clarified that the seasonal variation in the concentrations of soil water nitrate was buffered by groundwater. As a result, caution is needed in clarifying the causes of seasonal variations in chemical–isotopic compositions of stream water because a time lag from variations in soil water can be anticipated.
The export flux of unprocessed atmospheric nitrate relative to the entire deposition flux (Matm ∕ Datm ratio) showed a clear normal correlation with the flux-weighted average concentration of stream nitrate, not only in the forested catchments studied in this paper but also in all forested catchments studied using the 17O excess of nitrate as a tracer. As a result, reductions in the biological assimilation rates of nitrate in forested soils, rather than increased nitrification rates in forested soils, are largely responsible for the increase in stream nitrate concentration resulting from nitrogen saturation. Furthermore, in addition to the stream nitrate concentration, the export flux of unprocessed atmospheric nitrate relative to the entire deposition flux (Matm ∕ Datm ratio) in each forested catchment is applicable as a new index of nitrogen saturation. Further studies are needed for stream nitrate exported from various forested catchments around the world to verify the present results by using the 17O excess of nitrate as a tracer for the unprocessed atmospheric nitrate in stream nitrate.
Additionally, we should enhance accuracy and precision for both the flow rates (V in Eqs. 3 and 4) and the deposition rates (Datm) to estimate precise Matm ∕ Datm ratio in each catchment. While the errors associated with the Δ17O values directly influence the errors associated with the Catm ∕ Ctotal ratios and Matm ∕ Mtotal ratios, their influences on Matm ∕ Datm ratios were minor. Rather, the errors associated with the flow rates and Datm had a much larger impact on the Matm and Matm ∕ Datm ratios.
All the primary data are presented in the Supplement. The other data are available upon request to the corresponding author (Urumu Tsunogai).
The supplement related to this article is available online at: https://doi.org/10.5194/bg-15-7025-2018-supplement.
FN, UT, NY, and HS designed the study. NY, TS, SU, MM, and HS performed the field observations. NY, TS, SU, MM, and HS determined the concentrations of the samples. FN, YO, and KA determined the isotopic compositions of the samples. FN, YO, KA, and UT performed data analysis, and FN and UT wrote the paper with input from NY and HS.
The authors declare that they have no conflict of interest.
We thank anonymous referees for valuable remarks on an earlier version of
this paper. The samples analyzed in this study were collected through the
Long-term Monitoring of Transboundary Air Pollution and Acid Deposition by
the Ministry of the Environment in Japan. We thank Ayaka Ikegami for drawing
color altitude maps of the studied sites and Masanori Ito, Kosuke Ikeya, Koji
Takahashi, Takuya Ohyama, Shuichi Hara, Toshiyuki Matsushita, Takanori
Miyauchi, Yoshiumi Matsumoto, Rei Nakane, Lin Cheng, and the other present
and past members of the Biogeochemistry Group at Nagoya University for their
valuable support during this study. This work was supported by a Grant-in-Aid
for Scientific Research from the Ministry of Education, Culture, Sports,
Science, and Technology of Japan under grant numbers 15H02804, 16K14308,
15K12187, 17H00780, 26241006, and 24651002.
Edited by: Sébastien Fontaine
Reviewed by: two anonymous referees
Aber, J. D., Nadelhoffer, K. J., Steudler, P., and Melillo, J. M.: Nitrogen Saturation in Northern Forest Ecosystems, Bioscience, 39, 378–386, 1989.
Aber, J. D., Goodale, C. L., Ollinger, S. V., Smith, M.-L., Magill, A. H., Martin, M. E., Hallett, R. A., and Stoddard, J. L.: Is nitrogen deposition altering the nitrogen status of northeastern forests?, Bioscience, 53, 375–389, 2003.
Aikawa, M., Hiraki, T., Tamaki, M., and Shoga, M.: Difference between filtering-type bulk and wet-only data sets based on site classification, Atmos. Environ., 37, 2597–2603, 2003.
Alexander, B., Hastings, M. G., Allman, D. J., Dachs, J., Thornton, J. A., and Kunasek, S. A.: Quantifying atmospheric nitrate formation pathways based on a global model of the oxygen isotopic composition (Δ17O) of atmospheric nitrate, Atmos. Chem. Phys., 9, 5043–5056, https://doi.org/10.5194/acp-9-5043-2009, 2009
Berner, E. K. and Berner, R. A.: The global water cycle: geochemistry and environment, Englewood Cliffs, NJ, Prentice-Hall, 1987.
Bourgeois, I., Savarino, J., Caillon, N., Angot, H., Barbero, A., Delbart, F., Voisin, D., and Clément, J.-C.: Tracing the fate of atmospheric nitrate in a subalpine watershed using Δ17O, Environ. Sci. Technol., 52, 5561–5570, 2018a.
Bourgeois, I., Savarino, J., Némery, J., Caillon, N., Albertin, S., Delbart, F., Voisin, D., and Clément, J.-C.: Atmospheric nitrate export in streams along a montane to urban gradient, Sci. Total Environ., 633, 329–340, 2018b.
Breuer, L., Kiese, R., and Butterbach-Bahl, K.: Temperature and moisture effects on nitrification rates in tropical rain-forest soils, Soil Sci. Soc. Am. J., 66, 834–844, 2002.
Buchwald, C., Santoro, A. E., McIlvin, M. R., and Casciotti, K. L.: Oxygen isotopic composition of nitrate and nitrite produced by nitrifying cocultures and natural marine assemblages, Limnol. Oceanogr., 57, 1361–1375, 2012.
Clow, D. W., Roop, H. A., Nanus, L., Fenn, M. E., and Sexstone, G. A.: Spatial patterns of atmospheric deposition of nitrogen and sulfur using ion-exchange resin collectors in Rocky Mountain National Park, USA, Atmos. Environ., 101, 149–157, 2015.
Costa, A. W., Michalski, G., Schauer, A. J., Alexander, B., Steig, E. J., and Shepson, P. B.: Analysis of atmospheric inputs of nitrate to a temperate forest ecosystem from Δ17O isotope ratio measurements, Geophys. Res. Lett., 38, L15805, https://doi.org/10.1029/2011GL047539, 2011.
Dansgaard, W.: Stable isotopes in precipitation, Tellus, 16, 436–468, 1964.
Dejwakh, N. R., Meixner, T., Michalski, G., and McIntosh, J.: Using 17O to investigate nitrate sources and sinks in a semi-arid groundwater system, Environ. Sci. Technol., 46, 745–751, 2012.
Durka, W., Schulze, E.-D., Gebauer, G., and Voerkeliust, S.: Effects of forest decline on uptake and leaching of deposited nitrate determined from 15N and 18O measurements, Nature, 372, 765–767, 1994.
EANET: Data Report 2013, Network center for EANET (Acid Deposition Monitoring Network in East Asia), Nigata, Japan, 2014.
EANET: Data Report 2014, Network center for EANET (Acid Deposition Monitoring Network in East Asia), Nigata, Japan, 2015.
Hirota, A., Tsunogai, U., Komatsu, D. D., and Nakagawa, F.: Simultaneous determination of δ15N and δ18O of N2O and δ13C of CH4 in nanomolar quantities from a single water sample, Rapid Commun. Mass Sp., 24, 1085–1092, 2010.
Hoyle, F. C., Murphy, D. V., and Fillery, I. R. P.: Temperature and stubble management influence microbial CO2−C evolution and gross N transformation rates, Soil Biol. Biochem., 38, 71–80, 2006.
Kabeya, N., Katsuyama, M., Kawasaki, M., Ohte, N., and Sugimoto, A.: Estimation of mean residence times of subsurface waters using seasonal variation in deuterium excess in a small headwater catchment in Japan, Hydrol. Process., 21, 308–322, 2007.
Kaiser, J., Hastings, M. G., Houlton, B. Z., Röckmann, T., and Sigman, D. M.: Triple oxygen isotope analysis of nitrate using the denitrifier method and thermal decomposition of N2O, Anal. Chem., 79, 599–607, 2007.
Kamisako, M., Sase, H., Matsui, T., Suzuki, H., Takahashi, A., Oida, T., Nakata, M., Totsuka, T., and Ueda, H.: Seasonal and annual fluxes of inorganic constituents in a small catchment of a Japanese cedar forest near the Sea of Japan, Water Air Soil Poll., 195, 51–61, 2008.
Kendall, C.: Tracing Nitrogen Sources and Cycling in Catchments, in: Isotope Tracers in Catchment Hydrology, edited by: Kendall, C. and McDonnell, J. J., Elsevier Science B.V., Amsterdam, 519–576, 1998.
Kendall, C., Campbell, D. H., Burns, D. A., Schanley, J. B., Silva, S. R., and Chang, C. C. Y.: Tracing sources of nitrate in snowmelt runoff using the oxygen and nitrogen isotopic compositions of nitrate, in: Biogeochemistry of seasonally snow-covered catchments, Proceedings of a Boulder Symposium, Boulder, Co., 3–14 July 1995, IAHS Publication No. 228, 339–347, 1995.
Kendall, C., Elliott, E. M., and Wankel, S. D.: Tracing anthropogenic inputs of nitrogen to ecosystems, in: Stable Isotopes in Ecology and Environmental Science, 2nd edn., edited by: Michener, R. H. and Lajtha, K., Blackwell Publishing, Oxford, UK, 2007.
Komatsu, D. D., Ishimura, T., Nakagawa, F., and Tsunogai, U.: Determination of the 15N ∕ 14N, 17O ∕ 16O, and 18O ∕ 16O ratios of nitrous oxide by using continuous-flow isotope-ratio mass spectrometry, Rapid Commun. Mass Sp., 22, 1587–1596, 2008.
Konno, U., Tsunogai, U., Komatsu, D. D., Daita, S., Nakagawa, F., Tsuda, A., Matsui, T., Eum, Y.-J., and Suzuki, K.: Determination of total N2 fixation rates in the ocean taking into account both the particulate and filtrate fractions, Biogeosciences, 7, 2369–2377, https://doi.org/10.5194/bg-7-2369-2010, 2010.
Koshikawa, M., Watanabe, M., Takamatsu, T., Hayashi, S., Nohara, S., and Satake, K.: Relationships between stream water chemistry and watershed geology and topography in the Miomote River System, Niigata, Japan, Jap. J. Limnol., 72, 71–80, 2011 (in Japanese with English abstract).
Liu, T., Wang, F., Michalski, G., Xia, X., and Liu, S.: Using 15N, 17O, and 18O To Determine Nitrate Sources in the Yellow River, China, Environ. Sci. Technol., 47, 13412–13421, https://doi.org/10.1021/es403357m, 2013.
McIlvin, M. R. and Altabet, M. A.: Chemical conversion of nitrate and nitrite to nitrous oxide for nitrogen and oxygen isotope analysis in freshwater and seawater, Anal. Chem., 77, 5589–5595, 2005.
McIsaac, G. F., David, M. B., Gertner, G. Z., and Goolsby, D. A.: Eutrophication: Nitrate flux in the Mississippi River, Nature, 414, 166–167, 2001.
Michalski, G., Savarino, J., Böhlke, J. K., and Thiemens, M.: Determination of the total oxygen isotopic composition of nitrate and the calibration of a Δ17O nitrate reference material, Anal. Chem., 74, 4989–4993, 2002.
Michalski, G., Scott, Z., Kabiling, M., and Thiemens, M. H.: First measurements and modeling of Δ17O in atmospheric nitrate, Geophys. Res. Lett., 30, 1870, https://doi.org/10.1029/2003GL017015, 2003.
Michalski, G., Meixner, T., Fenn, M., Hernandez, L., Sirulnik, A., Allen, E., and Thiemens, M.: Tracing Atmospheric Nitrate Deposition in a Complex Semiarid Ecosystem Using Δ17O, Environ. Sci. Technol., 38, 2175–2181, 2004.
Miller, M. F.: Isotopic fractionation and the quantification of 17O anomalies in the oxygen three-isotope system: an appraisal and geochemical significance, Geochim. Cosmochim. Ac., 66, 1881–1889, 2002.
Mitchell, M. J., Iwatsubo, G., Ohrui, K., and Nakagawa, Y.: Nitrogen saturation in Japanese forests: an evaluation, Forest Ecol. Manag., 97, 39–51, 1997.
Morin, S., Savarino, J., Frey, M. M., Yan, N., Bekki, S., Bottenheim, J. W., and Martins, J. M. F.: Tracing the origin and fate of NOx in the Arctic atmosphere using stable isotopes in nitrate, Science, 322, 730–732, 2008.
Nakagawa, F., Suzuki, A., Daita, S., Ohyama, T., Komatsu, D. D., and Tsunogai, U.: Tracing atmospheric nitrate in groundwater using triple oxygen isotopes: evaluation based on bottled drinking water, Biogeosciences, 10, 3547–3558, https://doi.org/10.5194/bg-10-3547-2013, 2013.
Nakahara, O., Takahashi, M., Sase, H., Yamada, T., Matsuda, K., Ohizumi, T., Fukuhara, H., Inoue, T., Takahashi, A., Kobayashi, H., Hatano, R., and Hakamata, T.: Soil and stream water acidification in a forested catchment in central Japan, Biogeochemistry, 97, 141–158, 2010.
Nelson, D. M., Tsunogai, U., Ding, D., Ohyama, T., Komatsu, D. D., Nakagawa, F., Noguchi, I., and Yamaguchi, T.: Triple oxygen isotopes indicate urbanization affects sources of nitrate in wet and dry atmospheric deposition, Atmos. Chem. Phys., 18, 6381–6392, https://doi.org/10.5194/acp-18-6381-2018, 2018.
Ogawa, S.: Forests and water resources, chap. 3, in: Hydrological Cycle and Local Metabolic System of Water, edited by: Tambo, N. and Maruyama, T., Gihodo, 2003 (in Japanese).
Ohte, N., Sebestyen, S. D., Shanley, J. B., Doctor, D. H., Kendall, C., Wankel, S. D., and Boyer, E. W.: Tracing sources of nitrate in snowmelt runoff using a high-resolution isotopic technique, Geophys. Res. Lett., 31, L21506, https://doi.org/10.1029/2004GL020908, 2004.
Paerl, H. W.: Controlling eutrophication along the freshwater–marine continuum: Dual nutrient (N and P) reductions are essential, Estuar. Coast., 32, 593–601, 2009.
Pellerin, B., Saraceno, J., Shanley, J., Sebestyen, S., Aiken, G., Wollheim, W., and Bergamaschi, B.: Taking the pulse of snowmelt: in situ sensors reveal seasonal, event and diurnal patterns of nitrate and dissolved organic matter variability in an upland forest stream, Biogeochemistry, 108, 183–198, 2012.
Peterjohn, W. T., Adams, M. B., and Gilliam, F. S.: Symptoms of nitrogen saturation in two central Appalachian hardwood forest ecosystems, Biogeochemistry, 35, 507–522, 1996.
Piatek, K. B., Mitchell, M. J., Silva, S. R., and Kendall, C.: Sources of nitrate in snowmelt discharge: evidence from water chemistry and stable isotopes of nitrate, Water Air Soil Poll., 165, 13–35, 2005.
Riha, K. M., Michalski, G., Gallo, E. L., Lohse, K. A., Brooks, P. D., and Meixner, T.: High Atmospheric Nitrate Inputs and Nitrogen Turnover in Semi-arid Urban Catchments, Ecosystems, 17, 1309–1325, 2014.
Rose, L. A., Elliott, E. M., and Adams, M. B.: Triple Nitrate Isotopes Indicate Differing Nitrate Source Contributions to Streams Across a Nitrogen Saturation Gradient, Ecosystems, 18, 1209–1223, 2015a.
Rose, L. A., Sebestyen, S. D., Elliott, E. M., and Koba, K.: Drivers of atmospheric nitrate processing and export in forested catchments, Water Resour. Res., 51, 1333–1352, 2015b.
Sabo, R. D., Nelson, D. M., and Eshleman, K. N.: Episodic, seasonal, and annual export of atmospheric and microbial nitrate from a temperate forest, Geophys. Res. Lett., 43, 683–691, https://doi.org/10.1002/2015GL066758, 2016.
Sase, H., Takahashi, A., Sato, M., Kobayashi, H., Nakata, M., and Totsuka, T.: Seasonal variation in the atmospheric deposition of inorganic constituents and canopy interactions in a Japanese cedar forest, Environ. Pollut., 152, 1–10, 2008.
Sase, H., Matsuda, K., Visaratana, T., Garivait, H., Yamashita, N., Kietvuttinon, B., Hongthong, B., Luangjame, J., Khummongkol, P., Shindo, J., Endo, T., Sato, K., Uchiyama, S., Miyazawa, M., Nakata, M., and Lenggoro, I. W.: Deposition Process of Sulfate and Elemental Carbon in Japanese and Thai Forests, Asian Journal of Atmospheric Environment, 6, 246–258, 2012.
Sase, H., Ohizumi, T., Yamashita, N., Visaratana, T., Kietvuttinon, B., Garivait, H., and Majid, N. M.: Dynamics of Sulphur Derived from Atmospheric Deposition and its Possible Impacts on East Asian Forests, Final Report submitted to APN (Project Refence Number: ARCP2013-13CMY-Sase), Asia-Pacific Network for Global Change Research, Kobe, Japan, 2015.
Shibata, H., Kuraji, K., Toda, H., and Sasa, K.: Regional Comparison of Nitrogen Export to Japanese Forest Streams, Sci. World J., 1, 572–580, https://doi.org/10.1100/tsw.2001.371, 2001.
Stoddard, J. L.: Long-Term Changes in Watershed Retention of Nitrogen: Its Causes and Aquatic Consequences. In: Environmental Chemistry of Lakes and Reservoirs, Baker, L. A. (Ed.), Advances in Chemistry Series, American Chemical Society, Washington DC, 1994.
Takagi, K., Fukuzawa, K., Liang, N., Kayama, M., Nomura, M., Hojyo, H., Sugata, S., Shibata, H., Fukazawa, T., Takahashi, Y., Nakaji, T., Oguma, H., Mano, M., Akibayashi, Y., Murayama, T., Koike, T., Sasa, K., and Fujinuma, Y.: Change in CO2 balance under a series of forestry activities in a cool-temperate mixed forest with dense undergrowth, Glob. Change Biol., 15, 1275–1288, 2009.
Takimoto, H., Tanaka, T., and Horino, H.: Does forest conserve runoff discharge during drought?, Transactions of The Japanese Society of Irrigation, Drainage and Reclamation Engineering, 170, 75–81, https://doi.org/10.11408/jsidre1965.1994.170_75, 1994 (in Japanese with English abstract).
Tanoue, M., Ichiyanagi, K., and Shimada, J.: Seasonal variation and spatial distribution of stable isotopes in precipitation over Japan, Journal of Japanese Association of Hydrological Sciences, 43, 73–91, 2013 (in Japanese with English abstract).
Thiemens, M. H., Savarino, J., Farquhar, J., and Bao, H.: Mass-Independent Isotopic Compositions in Terrestrial and Extraterrestrial Solids and Their Applications, Accounts Chem. Res., 34, 645–652, 2001.
Tsunogai, U., Kido, T., Hirota, A., Ohkubo, S. B., Komatsu, D. D., and Nakagawa, F.: Sensitive determinations of stable nitrogen isotopic composition of organic nitrogen through chemical conversion into N2O, Rapid Commun. Mass Sp., 22, 345–354, 2008.
Tsunogai, U., Komatsu, D. D., Daita, S., Kazemi, G. A., Nakagawa, F., Noguchi, I., and Zhang, J.: Tracing the fate of atmospheric nitrate deposited onto a forest ecosystem in Eastern Asia using Δ17O, Atmos. Chem. Phys., 10, 1809–1820, https://doi.org/10.5194/acp-10-1809-2010, 2010.
Tsunogai, U., Daita, S., Komatsu, D. D., Nakagawa, F., and Tanaka, A.: Quantifying nitrate dynamics in an oligotrophic lake using Δ17O, Biogeosciences, 8, 687–702, https://doi.org/10.5194/bg-8-687-2011, 2011.
Tsunogai, U., Komatsu, D. D., Ohyama, T., Suzuki, A., Nakagawa, F., Noguchi, I., Takagi, K., Nomura, M., Fukuzawa, K., and Shibata, H.: Quantifying the effects of clear-cutting and strip-cutting on nitrate dynamics in a forested watershed using triple oxygen isotopes as tracers, Biogeosciences, 11, 5411–5424, https://doi.org/10.5194/bg-11-5411-2014, 2014.
Tsunogai, U., Miyauchi, T., Ohyama, T., Komatsu, D. D., Nakagawa, F., Obata, Y., Sato, K., and Ohizumi, T.: Accurate and precise quantification of atmospheric nitrate in streams draining land of various uses by using triple oxygen isotopes as tracers, Biogeosciences, 13, 3441–3459, https://doi.org/10.5194/bg-13-3441-2016, 2016.
Tsunogai, U., Miyauchi, T., Ohyama, T., Komatsu, D. D., Ito, M., and Nakagawa, F.: Quantifying nitrate dynamics in a mesotrophic lake using triple oxygen isotopes as tracers, Limnol. Oceanogr., 63, S458–S476, 2018.
Wright, R. F. and Tietema, A.: Ecosystem response to 9 years of nitrogen addition at Sogndal, Norway, Forest Ecol. Manag., 71, 133–142, 1995.
Yamada, T., Inoue, T., Fukuhara, H., Nakahara, O., Izuta, T., Suda, R., Takahashi, M., Sase, H., Takahashi, A., Kobayashi, H., Ohizumi, T., and Hakamata, T.: Long-term Trends in Surface Water Quality of Five Lakes in Japan, Water Air Soil Poll.: Focus, 7, 259–266, 2007.
Yamazaki, A., Watanabe, T., and Tsunogai, U.: Nitrogen isotopes of organic nitrogen in reef coral skeletons as a proxy of tropical nutrient dynamics, Geophys. Res. Lett., 38, L19605, https://doi.org/10.1029/2011GL049053, 2011.
Zaman, M. and Chang, S. X.: Substrate type, temperature, and moisture content affect gross and net N mineralization and nitrification rates in agroforestry systems, Biol. Fert. Soils, 39, 269–279, 2004.