the Creative Commons Attribution 4.0 License.
the Creative Commons Attribution 4.0 License.
 | 01 Apr 2019
Bio-optical characterization of subsurface chlorophyll maxima in the Mediterranean Sea from a Biogeochemical-Argo float database
Marie Barbieux
Julia Uitz
Bernard Gentili
Orens Pasqueron de Fommervault
Alexandre Mignot
Antoine Poteau
Catherine Schmechtig
Vincent Taillandier
Edouard Leymarie
Christophe Penkerc'h
Fabrizio D'Ortenzio
Hervé Claustre
Annick Bricaud
As commonly observed in oligotrophic stratified waters, a subsurface (or deep) chlorophyll maximum (SCM) frequently characterizes the vertical distribution of phytoplankton chlorophyll in the Mediterranean Sea. Occurring far from the surface layer “seen” by ocean colour satellites, SCMs are difficult to observe with adequate spatio-temporal resolution and their biogeochemical impact remains unknown. Biogeochemical-Argo (BGC-Argo) profiling floats represent appropriate tools for studying the dynamics of SCMs. Based on data collected from 36 BGC-Argo floats deployed in the Mediterranean Sea, our study aims to address two main questions. (1) What are the different types of SCMs in the Mediterranean Sea? (2) Which environmental factors control their occurrence and dynamics? First, we analysed the seasonal and regional variations in the chlorophyll concentration (Chl a), particulate backscattering coefficient (bbp), a proxy of the particulate organic carbon (POC) and environmental parameters (photosynthetically active radiation and nitrates) within the SCM layer over the Mediterranean Basin. The vertical profiles of Chl a and bbp were then statistically classified and the seasonal occurrence of each of the different types of SCMs quantified. Finally, a case study was performed on two contrasted regions and the environmental conditions at depth were further investigated to understand the main controls on the SCMs. In the eastern basin, SCMs result, at a first order, from a photoacclimation process. Conversely, SCMs in the western basin reflect a biomass increase at depth benefiting from both light and nitrate resources. Our results also suggest that a variety of intermediate types of SCMs are encountered between these two endmember situations.
- Article
(2430 KB) - Full-text XML
-
Supplement
(429 KB) - BibTeX
- EndNote


The vertical distribution of phytoplankton in the open ocean is often characterized by the occurrence of high chlorophyll a concentration (Chl a) beneath the mixed layer (Cullen and Eppley, 1981; Fasham et al., 1985; Raimbault et al., 1993; Letelier et al., 2004; Tripathy et al., 2015). This phenomenon is commonly referred to as deep chlorophyll maximum (DCM) or subsurface chlorophyll maximum (SCM). Although it always happens below the surface layer (approximately below the first 20 m), it does not necessarily settle very deep into the water column, thus sometimes making the notation DCM inappropriate. Hence, in the following, we will use the notation SCM. Commonly observed at depth in oligotrophic stratified regions (Anderson, 1969; Cullen, 1982; Furuya, 1990; Mignot et al., 2014), SCMs are also known to occur below the mixed layer in temperate- and high-latitude environments (Parslow et al., 2001; Uitz et al., 2009; Arrigo et al., 2011; Ardyna et al., 2013). The formation of a subsurface maximum of Chl a in these different ecosystems results from various underlying mechanisms leading to different types of SCMs. In stratified waters, SCMs often result from photoacclimation of the phytoplankton organisms, which induces an increase in the intracellular Chl a in response to low-light conditions (Kiefer et al., 1976; Winn et al., 1995; Fennel and Boss, 2003; Dubinsky and Stambler, 2009). However SCMs resulting from an actual increase in phytoplankton carbon biomass have also been reported in such ecosystems (Beckmann and Hense, 2007; Crombet et al., 2011; Mignot et al., 2014). In high-latitude regions with well-mixed surface waters, SCMs have been shown to result from the accumulation of particles sinking from the mixed layer (Quéguiner et al., 1997; Parslow et al., 2001), photophysiological acclimation of algal cells (Mikaelyan and Belyaeva, 1995) or phytoplankton growth at the depth of the nutricline (Holm-Hansen and Hewes, 2004; Tripathy et al., 2015). Hence, regional or local studies have highlighted underlying processes indicating that, under certain conditions, SCMs could contribute to carbon production and export and thus potentially have an important biogeochemical role. However, we have limited knowledge of their biogeochemical significance on large spatial and temporal scales. Their contribution to the depth-integrated primary production has been assessed for a limited number of regions and remains largely unknown. It has been reported to be underestimated from 40 % to 75 % in the Arctic Ocean (Ardyna et al., 2013; Hill et al., 2013), more than 40 % in the oligotrophic Atlantic (Perez et al., 2006), 40 %–50 % in the Celtic Sea (Hickman et al., 2012) and about 58 % in the North Sea (Weston et al., 2005). The biogeochemical contribution of the SCMs to the global ocean is also particularly hard to assess on large spatio-temporal scales, especially because SCMs usually settle at a depth far from the surface layer “seen” by ocean colour satellites. Remotely sensed estimates are restricted to the upper layer of the water column that represent only 0.2 of the euphotic layer where phytoplankton photosynthesis takes place (Gordon and McCluney, 1975). The exact biogeochemical role of SCMs, thus, needs to be further explored.
The Mediterranean Sea is considered an oligotrophic province where the vertical distribution of phytoplankton is, seasonally or permanently, characterized by the occurrence of a SCM (Kimor et al., 1987; Estrada et al., 1993; Videau et al., 1994; Christaki et al., 2001; Siokou-Frangou et al., 2010; Lavigne et al., 2015). It is also a low-nutrient concentration basin, one of the largest nutrient-depleted areas of the global ocean, and it is characterized by a west-to-east gradient in both nutrients and Chl a (Dugdale and Wilkerson, 1988; Bethoux et al., 1992; Antoine et al., 1995; Bosc et al., 2004; D'Ortenzio and Ribera d'Alcalà, 2009). While the eastern basin is defined as oligotrophic (Krom et al., 1991; Ignatiades et al., 2002; Lavigne et al., 2015), the western basin is more productive and behaves as a temperate system (Morel and André, 1991; Marty et al., 2002; Mayot et al., 2017b). Hence, this “miniature ocean” presents SCMs that may be encountered in both seasonally stratified environments and permanently stratified waters of the global ocean. This, coupled with an intensive effort of biogeochemical observations in this region, makes the Mediterranean Sea an ideal region for studying SCMs.
The biogeochemical and bio-optical community recently developed autonomous profiling floats that collect in situ vertical profiles of biogeochemical properties, such as the chlorophyll a fluorescence (i.e. a proxy of the Chl a) and the particulate backscattering coefficient (bbp) (i.e. a proxy of the particulate organic carbon, POC). Physical–chemical properties such as nitrate concentration ([]) or the photosynthetically available radiation (PAR), essential to understanding the functioning of SCMs, are also measured simultaneously (Johnson et al., 2009; Claustre et al., 2010; Johnson and Claustre, 2016). Thirty-six Biogeochemical-Argo (BGC-Argo) have been deployed in the Mediterranean Sea from 2012 to 2017, providing a database of 4050 in situ multivariable profiles. This extensive database gives us the unique opportunity to enhance our comprehension of the vertical distribution and seasonal variability of the phytoplankton biomass in the subsurface layer of the Mediterranean Sea and expand our understanding of the mechanisms involved in the occurrence of SCMs. Our study seeks to address two main questions. (1) What are the different types of SCMs in the Mediterranean Sea? (2) Which environmental factors control the occurrence and dynamics of the different types of SCMs in this region? To address these questions, three complementary approaches were used. First, based on a climatological approach, we analysed the spatial and seasonal variability of biogeochemical properties (i.e. Chl a and bbp) and environmental conditions at the SCM level. This should lead to the identification of the main mechanisms controlling SCMs in different regions of the Mediterranean Sea. Second, using a statistical method, we classified the vertical profiles of Chl a and bbp seasonally encountered in the various regions of the Mediterranean Sea. This approach allowed us to quantify the frequency of occurrence of distinct types of SCMs in these different regions. Finally, using two specific BGC-Argo floats deployed in the Gulf of Lion and the Levantine Sea, we conducted a case study of two contrasted regimes and investigated the environmental conditions that control the occurrence of SCMs in each regime.
2.1 The BGC-Argo profiling float database
Thirty-six BGC-Argo profiling floats were deployed in the Mediterranean Sea in five geographic areas, i.e. the northwestern (NW) and southwestern (SW) regions and the Tyrrhenian (TYR), Ionian (ION) and Levantine (LEV) seas. Our study was based on the analysis of a database comprising 4050 multivariable vertical profiles, corresponding to upward casts collected between 26 November 2012 and 27 September 2017 (Table 1 and Fig. 1). The PROVOR CTS-4 (NKE Marine Electronics, Inc.) is a profiling autonomous platform that has been specifically designed in the frame of the remOcean and NAOS projects. The physical variables (depth, temperature and salinity) were acquired by a SBE 41 CTD (Sea-Bird Scientific Inc.). Two optical packages, remA and remB, were developed to be specifically implemented on profiling floats. The remA is composed of an OCR-504 (SAtlantic, Inc.), a multispectral radiometer that measures the photosynthetically available radiation (PAR) and the downwelling irradiance at 380, 410 and 490 nm. The remA also includes an ECO3 sensor (Combined Three Channel Sensors; WET Labs, Inc.) measuring the fluorescence of the chlorophyll a and the coloured dissolved organic matter (CDOM) at excitation–emission wavelengths of 470–695 nm and 370–460 nm, respectively, and the angular scattering coefficient of particles (β(θ, λ)) at 700 nm and at an angle of 124∘. Finally, 15 floats were also equipped with a nitrate () (Deep SUNA, Sea-Bird Scientific, Inc.) and/or an oxygen (O2) sensor (optode 4330, Aanderaa, Inc.). Depending on the scientific objectives of the different projects, the measurements were collected during upward casts programmed every 1, 2, 3, 5 or 10 days. All casts started from a parking depth at 1000 m at a time that was sufficient for surfacing around local noon. The vertical resolution of data acquisition was 10 m between 1000 and 250 m, 1 m between 250 and 10 m, and 0.2 m between 10 m and the surface. Each time the floats surfaced, the raw data were transmitted to land through iridium two-way communication.
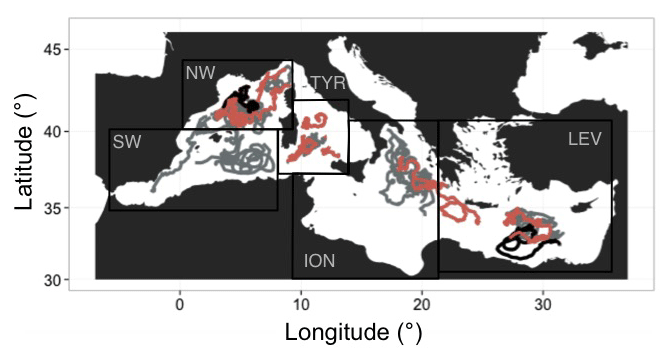
Figure 1Geographic location of the multivariable vertical profiles collected by the BGC-Argo profiling floats in the Mediterranean Sea. The boundaries of the regions considered in this study are indicated by the black rectangles. NW, SW and TYR correspond to the western basin regions, whereas ION and LEV represent the eastern basin regions. Red indicates BGC-Argo floats equipped with nitrate sensors. Black indicates the specific BGC-Argo floats equipped with nitrate sensors that are used in Figs. 10 and 11.
Table 1Regions with the corresponding abbreviation and number of available floats and profiles represented in the Mediterranean BGC-Argo database used in the present study.

2.2 Retrieval of key biogeochemical variables from optical measurements
For each bio-optical parameter, raw counts were converted into the desired quantities according to technical specifications and calibration coefficients provided by the manufacturer. These quantities were transformed into Chl a and particulate backscattering coefficient (bbp) following the BGC-Argo procedure (Schmechtig et al., 2015, 2016b; Organelli et al., 2017b). This procedure included a correction of non-photochemical quenching for Chl a following Xing et al. (2012) method. In addition, we applied a correction factor to Chl a fluorescence measurements from the BGC-Argo floats, following the recommendation of Roesler et al. (2017). Comparing estimates of Chl a from the WET Labs ECO fluorometers (used on BGC-Argo floats) with Chl a estimates from other methods, these authors evidenced a varying bias according to the region sampled. In order to quantify this bias, they calculated the slope of the relationship between the Chl a values from the ECO fluorometers and those estimated independently using HPLC analyses. This bias was further confirmed using optical proxies such as in situ radiometric measurements (Xing et al., 2011) or algal absorption measurements (Boss et al., 2013; Roesler and Barnard, 2013). On a global scale, Roesler et al. (2017) evidenced an overestimation of the Chl a concentration by a factor of 2, on which regional variations in the fluorescence : Chl a ratio are superimposed. This correction factor applied to BGC-Argo data was found to have little impact on the interpretation of the results on a global scale (Barbieux et al., 2017; Organelli et al., 2017a) and did not modify the interpretation of the present results, especially because the regional correction factors proposed by Roesler et al. (2017) for the Mediterranean Sea are very close to the global factor of 2 (1.62 and 1.72 for the western and eastern basins). Finally a quality-controlled procedure was performed following the BGC-Argo recommendations (Schmechtig et al., 2016a). All data were also visually checked in order to detect any drift over time or sensor deficiency. These data were made freely available by the International Argo Program (http://www.argo.ucsd.edu, last access: 1 September 2017, http://argo.jcommops.org, last access: 1 September 2017) and the Coriolis project (http://www.coriolis.eu.org, last access: 1 September 2017).
After binning the data at a 1 m resolution, the mixed layer depth (MLD) was derived from the CTD data using the density criterion of de Boyer Montégut (2004). The MLD was calculated as the depth at which the density difference compared to the surface (10 m) reference value is 0.03 kg m−3. The depth of the SCM and the subsurface bbp maximum (SbbpM) was identified as the depth at which the absolute value of Chl a or bbp reaches a maximum below the MLD. Large spikes associated with particle aggregates or zooplankton (Gardner et al., 2000; Briggs et al., 2011) were observed in the bbp profiles and made it sometimes difficult to identify the depth of the SbbpM. Hence, for the purpose of the SbbpM retrieval exclusively, the bbp values were smoothed with a mean filter (5-point window). To study the SCM dynamics and obtain the width of the SCM that may fluctuate in space and time, a Gaussian profile was adjusted to each Chl a vertical profile of the database that presented a SCM. This approach, first proposed by Lewis et al. (1983), has been widely used in oceanographic studies (e.g. Morel and Berthon, 1989; Uitz et al., 2006; Barbieux et al., 2017). The width of the Gaussian adjusted to the vertical profile of Chl a represented the width of the SCM. The SCM layer was defined as the layer extending across the entire width of the SCM. The upper (or lower) limit was retrieved by removing (or adding) half of the width of the SCM to the absolute depth of the SCM.
2.3 Estimation of nitrate concentration
The SUNA sensor measures the light absorption in the wavelength range from 217 to 240 nm. In this spectral band, the light absorption is dominated by nitrates and bromides and, to a much lesser extent, by organic matter (Johnson and Coletti, 2002). Various algorithms were developed to obtain the nitrate concentration ([]) from the measured light absorption spectrum (e.g. Arai et al., 2008; Zielinski et al., 2011). The TCSS algorithm was specifically developed to take into account the temperature dependency of the bromide spectrum, which significantly improved the accuracy of the retrieved [] (Sakamoto et al., 2009). This algorithm was recently modified to also take into account a pressure dependency (Pasqueron de Fommervault et al., 2015a; Sakamoto et al., 2017). Previous studies also evidenced the inaccuracy of standard calibration procedures (D'Ortenzio et al., 2014; Pasqueron de Fommervault et al., 2015a) and showed that SUNA sensors often undergo offset issues and drift over time (Johnson and Coletti, 2002). Johnson et al. (2017) proposed a method to correct these issues for the Southern Ocean. Using the GLODAP-V2 database (http://cdiac.ornl.gov/oceans/GLODAPv2, last access: April 2018) of in situ measurements, the authors determined an empirical relationship allowing the estimation of the [] at depth ([]deep_pred for nitrate concentration deep reference value) using a multiple linear regression (MLR) with physical and geolocation parameters as predictors (salinity, temperature, oxygen, latitude and longitude). BGC-Argo profiles of nitrate concentration were then corrected by adjusting the SUNA measurements to the retrieved deep reference value. Following a similar approach, we established a regional empirical relationship for the Mediterranean Sea (Eq. 1) allowing us to retrieve the []deep_pred values using parameters that were systematically measured by the BGC-Argo floats (i.e. latitude, longitude, temperature and salinity). For the Mediterranean Sea, oxygen was not used as an input parameter of the MLR as this parameter was not systematically available for the BGC-Argo floats of our database. Moreover, its absence in the MLR as an input parameter did not affect the retrieval of the nitrate concentrations. Comparing the nitrate concentrations predicted by the MLR to the nitrate concentrations from GLODAP-V2 data, the determination coefficients of the relationship presented very similar values for the model with and without oxygen (see Fig. S1 in Supplement 1).
Hence, the following equation was finally used:
A strong correlation was noticed between the nitrate concentrations predicted from the MLR model and the measurements provided in the GLODAP-V2 database. This correlation was associated with a strong determination coefficient (R2=0.89) and a small root mean square error (RMSE = 0.52 µmol L−1). Then, by comparing the predicted climatology with the observed BGC-Argo nitrate concentrations at depth and computing the adjusted nitrate concentration for each depth, we obtained the following equation:
with []raw(t,z) corresponding to the raw nitrate value from the SUNA sensor.
The BGC-Argo [] profiles of the Mediterranean database were compared with in situ measurements collected simultaneously to float deployment (see Taillandier et al., 2018 for more details), using the classic colorimetric method (Morris and Riley, 1963). We demonstrated that the retrieval of the BGC-Argo [] with the proposed calibration procedure was satisfying. The comparison of the nitrate concentrations retrieved from the BGC-Argo floats to the reference in situ measurements (Fig. 2) showed a robust relationship (R2=0.86 and slope =0.97, N=162).
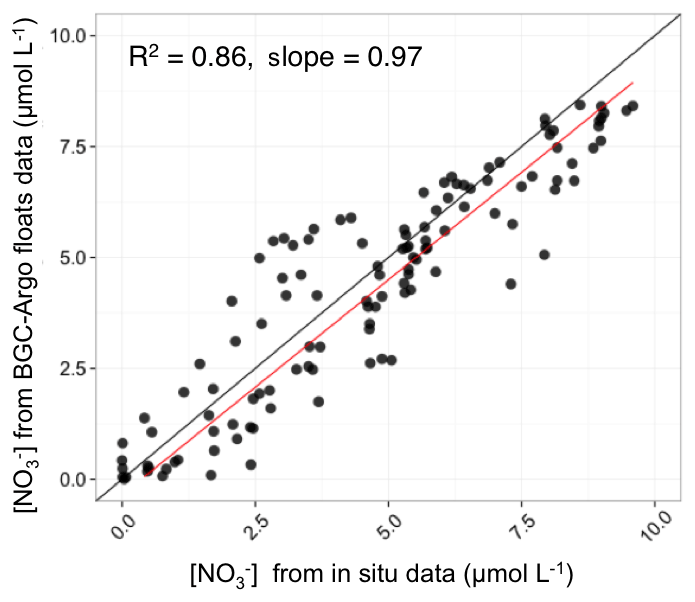
Figure 2Comparison of the nitrate concentrations retrieved from the BGC-Argo floats to the reference in situ measurements. The statistics (determination coefficient and slope) of the regression analysis between float-derived and in situ data are also indicated.
The nitracline that separates upper nitrate-depleted waters from lower repleted waters corresponds, in this paper, to the depth at which [] is 1 µM smaller than the median [] value in the first 10 m of the water column (Lavigne et al., 2013). The diffusive vertical supply of nitrates to the euphotic zone is not only influenced by the depth of the nitracline from the sunlit surface layer but also by the slope of the nitracline. The slope of the nitracline was calculated as the vertical [] gradient between the isocline 1 µM and the isocline 3 µM, as already done for the Mediterranean Sea by Pasqueron de Fommervault et al. (2015a).
2.4 Estimation of daily PAR
The BGC-Argo vertical profiles of PAR were quality-checked following Organelli et al. (2016). Only solar noon profiles were considered for our analysis because zenith measurements ensure the best retrieval of the isolume, i.e. depth corresponding to a chosen value of light (Organelli et al., 2017). BGC-Argo floats provide instantaneous PAR (iPAR) measurements just beneath the sea surface at local noon (iPAR(0−, noon)).
From iPAR measurements, a vertical profile of daily-averaged PAR was estimated following the method of Mignot et al. (2018). This method relies on a theoretical clear-sky estimate of iPAR just beneath the sea surface using the solar irradiance model SOLPOS developed by the National Renewable Energy Laboratory (NREL, 2000). Hence, we followed three main steps:
-
The instantaneous photosynthetically available radiation just beneath the sea surface at time t, iPAR(0−, t) in µmol photons m−2 s−1, was determined from Eq. (3):
with iPARclear(0−, t) the theoretical estimate of iPAR just beneath the sea surface at time t, iPAR(0−, noon) the float measurement of iPAR just beneath the sea surface at local noon, and iPARclear(0−, noon) the theoretical estimate of iPAR just beneath the sea surface at local noon for the same time and location as the float measurement. The ratio of iPAR(0−, noon) to iPARclear(0−, noon) represents an index of the cloud coverage at noon, which was applied to the clear-sky iPAR estimates at any time t. This approach thus assumes that the cloud coverage at noon is representative of the daily cloud coverage. Although the cloud coverage is unlikely to be constant throughout the entire day, this approach enabled us to account for the daily course of light through modelled estimates, rather than considering only the noontime instantaneous float measurements.
-
The daily-averaged PAR just beneath the sea surface, PAR(0−) in mol photons m−2 d−1, was obtained by averaging Eq. (3) over a day. In parallel, the diffuse attenuation coefficient for PAR, Kd(PAR) in m−1, was derived from the float iPAR measurements by fitting a linear least square regression forced through the origin between the data of and z taken in the upper 40 m of the water column (Mignot et al., 2018).
-
Finally, the daily-averaged PAR for each depth z of the water column PAR(z), in mol photons m−2 d−1, was calculated from Kd(PAR) and PAR(0−) as follows:
Additionally, the isolume 0.3 mol quanta m−2 d−1, which corresponds to the median daily PAR value at the SCM depth, was used as an indicator of the light available for photosynthesis at the SCM level. We also computed the euphotic layer depth (Zeu) as the depth at which the PAR is reduced to 1 % of its surface value (Gordon and McCluney, 1975) and the penetration depth (Zpd) is calculated as Zeu∕4.6. The surface layer corresponds to the layer extending from 0 to Zpd.
2.5 Definition of the SCM layer
To specifically study the dynamics of the bio-optical properties in the SCM layer, we adjusted a Gaussian profile to each vertical profile of Chl a of the database that presented a subsurface Chl a maximum and computed the width of this SCM. This parameterizing approach proposed by Lewis et al. (1983) has been widely used to fit vertical profiles of Chl a (e.g. Morel and Berthon, 1989; Uitz et al., 2006) such as the following:
where c(z) is the Chl a concentration at depth z, cmax is the Chl a concentration at the depth of the SCM (zmax), and Δz, the unknown, is the width of the SCM. In order to retrieve Δz, the unknown parameter, we performed an optimization of Eq. (5) with a maximum width set at 50 m so only the profiles with a relatively pronounced SCM are kept. Finally, in this study, the different biogeochemical variables are averaged in this SCM layer (cf. Figs. 3, 4, 6 and 11).
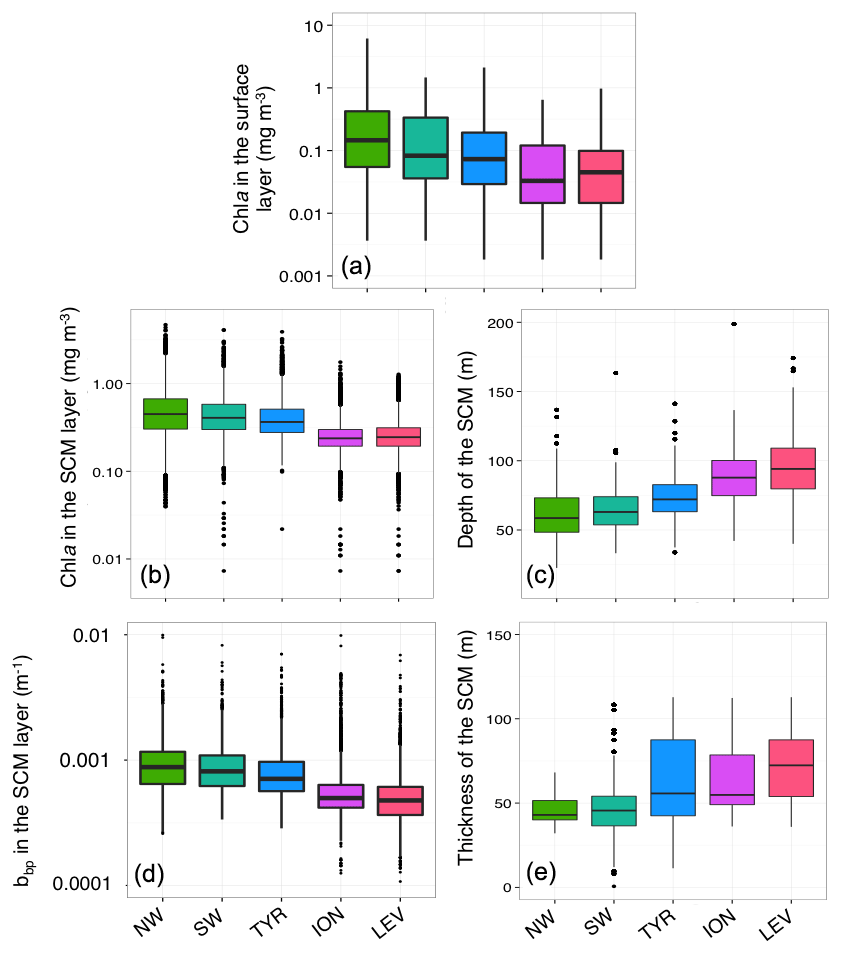
Figure 3Box plot of the distribution of the chlorophyll a concentration (Chl a) in the surface (a) and SCM layers (b), the particulate backscattering coefficient (bbp) in the SCM layer (c), and the depth (d) and thickness (e) of the SCM for each Mediterranean region considered in this study.
2.6 Statistical method of classification of the vertical profiles providing the identification of the SCM
A statistical method based on the singular value decomposition (SVD) algorithm (Golub and Van Loan, 1996) was used to identify the different types of SCMs in the Mediterranean Sea. The approach allowed us to tackle the large amount of data provided by the BGC-Argo floats and to simultaneously classify the Chl a and bbp vertical profiles of the database. Based on the shape of the Chl a or bbp vertical profile, the method did not require a priori knowledge of the considered profile, such as in previous studies (e.g. Uitz et al., 2006; Mignot et al., 2011; Lavigne et al., 2015). The present method involved three major steps summarized as follows (see Supplement 2 for more details):
-
Each vertical profile of Chl a and bbp was normalized by depth and magnitude. The depths were normalized by the euphotic depth (Zeu) and the Chl a and bbp values were normalized to the maximum value of each profile (i.e. Chl amax and bbpmax). Ultimately, the Chl a and bbp values of a profile were joined at one end to obtain a dimensionless, double-length “metaprofile” that was subsequently classified on the basis of its shape.
-
A principal component analysis (PCA) was performed using the singular value decomposition algorithm (Pearson, 1901). The singular values were ordered in decreasing order and only the first N values were kept. N was chosen so that the corresponding singular vectors capture 95 % of the variance of the data set and the resulting vertical profiles of Chl a and bbp were ecologically meaningful (see Supplement 2 provided as electronic supplementary material).
-
Each singular vector defined a profile shape. A dimensionless metaprofile can be represented as a linear combination of those shapes, each multiplied by a coefficient. To classify each metaprofile in a category of shape, we used a numerical optimization algorithm on the whole set of coefficients to maximize the value of one coefficient while minimizing the N-1 others for each metaprofile. The coefficient that was maximal for each metaprofile defined its class of shape. More details on the method are provided as electronic supplementary material.
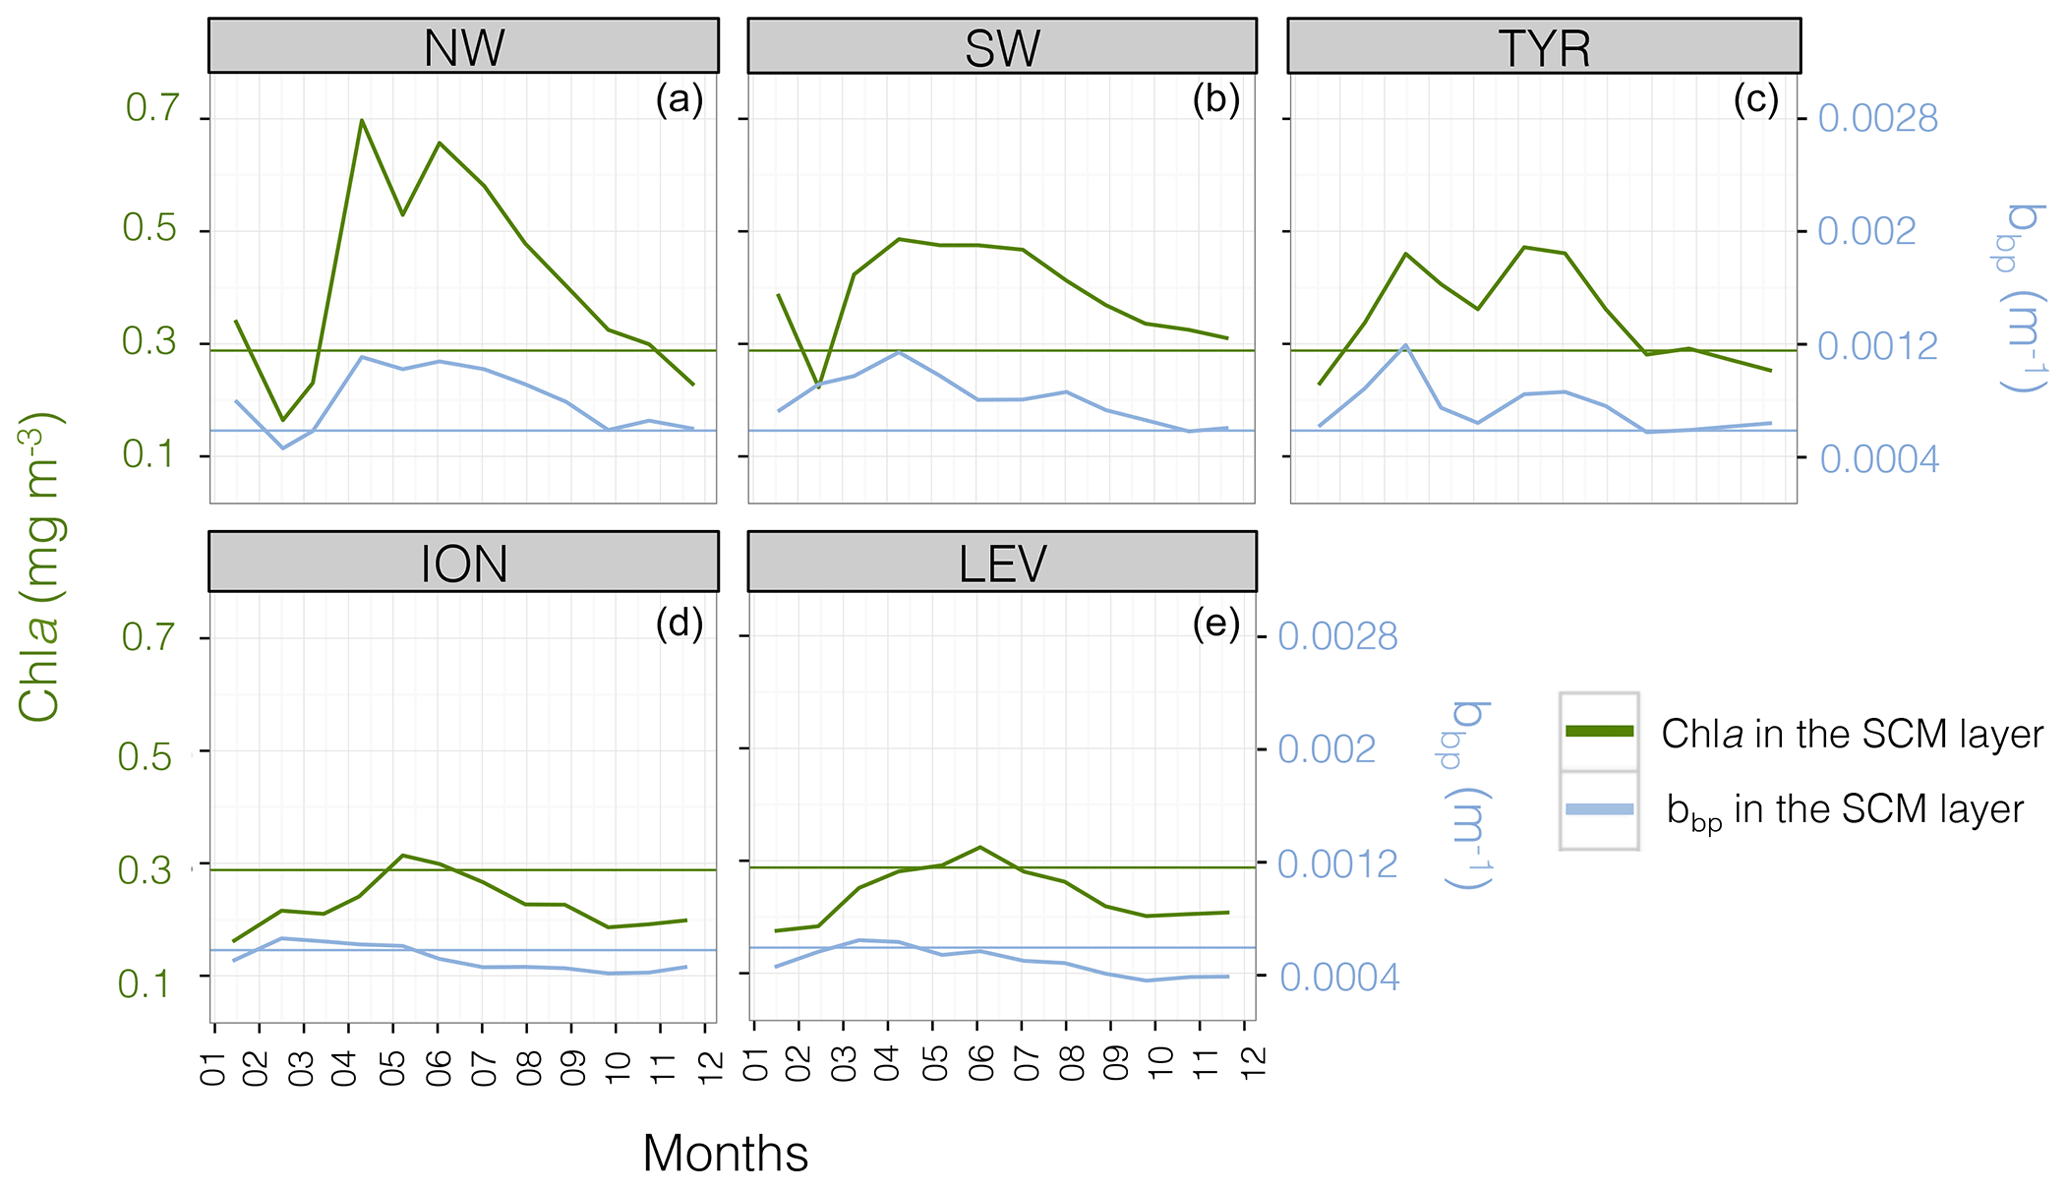
Figure 4Monthly median value of the chlorophyll a concentration, Chl a (in green) and the particulate backscattering coefficient, bbp (in blue) in the SCM layer for the five Mediterranean regions considered in this study. The annual median of Chl a (0.28 mg m−3) and bbp ( m−1) calculated for the SCM layer and over the entire Mediterranean Sea are indicated by the green and blue horizontal lines. Note the different scales of the y axes in panels (a–e).
For each of the five regions of the Mediterranean considered, we finally obtained the dominant shapes of vertical Chl a and bbp profiles, which are representative of the different situations encountered along an annual cycle. This approach allowed us to establish a typology of SCMs in the BGC-Argo database and to report their frequency of occurrence in each region.
3.1 Regional and seasonal variability of the SCM
Using a climatological approach, we first examined the characteristics of the SCMs such as their depth, thickness and amplitude in order to better apprehend their vertical dynamics in the water column along the Mediterranean west-to-east gradient. Then, the seasonal variations in the biogeochemical properties (Chl a and bbp) at the SCM level were studied in relation to environmental conditions. This ultimately led us to identify and describe the main types of SCMs in the five considered regions of the Mediterranean Sea.
3.1.1 Variability of the SCM along the west-to-east gradient
The well-known west-to-east trophic gradient of the Mediterranean was observed in the present data set, with a decrease in the surface Chl a from the NW region (median value of 0.15 mg m−3) to the LEV region (median value of 0.04 mg m−3; Fig. 3a). A decrease in the amplitude of the SCM paralleled the surface gradient, with decreasing mean Chl a and bbp values in the SCM from the NW to the LEV (0.45 to 0.24 mg m−3 and 0.00088 to 0.00050 m−1 for Chl a and bbp) (Fig. 3b–c). In the eastern basin (i.e. ION and LEV), only 27 % of the Chl a values were distributed above the median value calculated for the entire Mediterranean Basin (0.28 mg m−3), whereas 66 % of the Chl a values exceeded it in the western basin (i.e. NW, SW and TYR; Fig. 4). Similarly, in the eastern basin, only ∼30 % of the bbp values exceeded the median value calculated for the entire Mediterranean Sea in the SCM (0.00058 m−1) (i.e. 32 % and 29 % for the ION and LEV; Fig. 4d–e), whereas in the western basin, ∼75 % of the bbp values were distributed above the global median value (i.e. 81 %, 80 % and 71 % for NW, SW and TYR, Fig. 4a–c).
In parallel, from the NW to the LEV regions, a deepening of the SCM (median values of 58 and 95 m; Fig. 3d) and an increase in its thickness (median values of 43 and 72 m; Fig. 3e) was observed. A statistical Wilcoxon test revealed non-identical distributions of the considered variables (SCM amplitude, depth and thickness) among the different Mediterranean regions (significance level p<0.001). Our results suggest that the well-known west-to-east trophic gradient of the Mediterranean occurs not only at the surface but also at depth. As suggested by previous studies (Mignot et al., 2014; Lavigne et al., 2015), we confirm that the thickness and depth of the SCM are inversely related to its amplitude. The eastward weakening, deepening and increase in the thickness of the SCM is gradual across the Mediterranean Sea.
3.1.2 Seasonal variations in Chl a and bbp
The seasonal cycle of the Chl a in the SCM was more pronounced in the western basin than in the eastern basin. This was especially true for the NW (Fig. 4a) with median values of Chl a reaching ∼0.8 mg m−3 in June–July and ∼0.3 mg m−3 in January–February. Similarly, the seasonal cycle of bbp in the SCM was more pronounced in the western part of the Mediterranean Sea than in the eastern basin. Depending on the region and period of the year, the Chl a and bbp values showed synchronous or decoupled seasonal cycles. In the western basin, the bbp and Chl a seasonal cycles were coupled. The NW and TYR regions of the western basin showed a seasonal cycle characterized by two Chl a peaks at the SCM in March–April and June–July (the SW region presents a single maximum from April to July) and a simultaneous increase in bbp recorded in April–June (Fig. 4a–c). In contrast, the ION and the LEV presented a unique maximum of Chl a in June that is delayed compared to the bbp seasonal maximum occurring in February–April (Fig. 4d–e).
The Chl a is the most commonly used, yet imperfect, indicator of the phytoplankton biomass (Cleveland et al., 1989; Geider, 1993). Variations in Chl a may reflect changes in either phytoplankton carbon (Furuya, 1990; Hodges and Rudnick, 2004; Beckmann and Hense, 2007) or in intracellular content as a result of physiological processes occurring in phytoplankton cells, photoacclimation in particular (Geider et al., 1997; Fennel and Boss, 2003). The particulate backscattering coefficient is considered a proxy of the abundance of particles (Morel and Ahn, 1991; Stramski and Kiefer, 1991; Loisel and Morel, 1998; Stramski et al., 2004) and the stock of particulate organic carbon (POC) in the open-ocean waters (Stramski et al., 1999; Balch et al., 2001; Cetinić et al., 2012; Dall'Olmo and Mork, 2014). In contrast with Chl a, it provides information on the whole pool of particles, not specifically on phototrophic organisms. The backscattering coefficient also depends on several parameters such as the size distribution, nature, shape, structure and refractive index of the particles (Morel and Bricaud, 1986; Babin et al., 2003; Huot et al., 2007; Whitmire et al., 2010).
The vertical and seasonal coupling of Chl a and bbp has been shown to reflect an actual increase in carbon biomass, whereas a decoupling could result from photoacclimation or from a change in the nature or size distribution of the particle assemblage (Flory et al., 2004; Behrenfeld et al., 2005; Siegel et al., 2005). The results presented above indicate that the western basin presents higher values of Chl a and bbp in the SCM compared to the eastern basin and displays a coupling of the properties all year long (Fig. 4). Hence, we suggest that, in the NW, SW and TYR regions, the SCM sustains larger phytoplankton carbon biomass than in the ION and LEV regions. Furthermore, in this eastern part of the Mediterranean Sea, the SCM results, at first order, from physiological acclimation to low light and/or from a modification of the nature of the particle assemblage. In the next section, we will analyse the environmental conditions occurring at the SCM level and attempt to determine the factors underpinning the seasonal occurrence of SCMs in the different regions.
3.1.3 Environmental factors controlling the SCM
From a bottom-up perspective, it is the balance between light and nutrient limitations that influences the establishment of phytoplankton communities at depth (Kiefer et al., 1976; Cullen, 1982; Klausmeier and Litchman, 2001; Ryabov, 2012; Latasa et al., 2016). To explore the light-nutrient regime within the SCM layer, a monthly climatology of the isolume and nitracline in the different considered regions was represented along with the depth of the subsurface Chl a and bbp maxima (i.e. SCM and SbbpM). The MLD was also superimposed in order to illustrate physical forcings (Fig. 5).
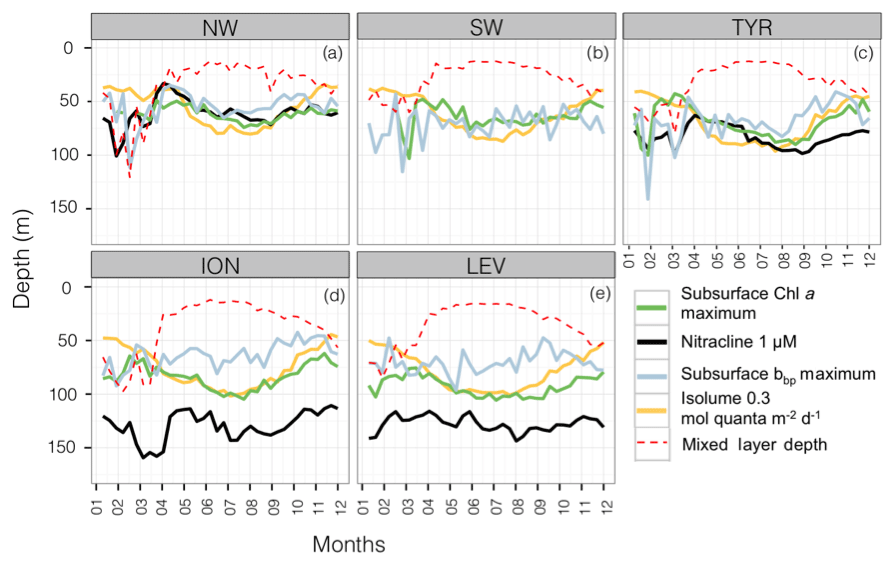
Figure 5Monthly median values of the depths of the subsurface Chl a maximum (in green), the nitracline (in black), the subsurface bbp maximum (in blue), the reference isolume (in yellow) and the mixed layer (in dotted red) for the five Mediterranean regions. The depth of the nitracline is not shown for the SW as there is no BGC-Argo float equipped with a nitrate sensor for this region.
In the western basin, the isolume of 0.3 mol quanta m−2 d−1, the nitracline of 1 µmol, the SbbpM and the SCM were all located at a similar depth during the oligotrophic period (maximum depth difference < 20 m; Fig. 5a–c). In accordance with previous findings (e.g. Pasqueron de Fommervault et al., 2015a), our results suggest that, in the NW region of the Mediterranean Sea, the deepest winter climatological mixed layer depth reached the nutricline, thus likely inducing nutrient input to the surface layer. In the TYR region, the MLD was always shallower than the nutricline during the winter season but the difference between the MLD and the nutricline remained very small all year long. Hence, in the western basin of the Mediterranean Sea both light and nutrient resources seem to be available and probably support an actual increase in phytoplankton biomass (Figs. 5 and 6a–b). In the northwestern part of the Mediterranean Sea, the MLD was deeper than the nutricline ∼20 % of the time during an annual cycle (Fig. 6e) essentially during the winter season (Fig. 5a–c). The shallowest (median of 61 m; Fig. 6c) and the steepest (slope of 90 µmol m−4; Fig. 6d) nitraclines were also recorded in this region, thus confirming an important upward diffusive flux of nitrates available to sustain phytoplankton biomass and eventually allowed the occurrence of a subsurface biomass maximum.
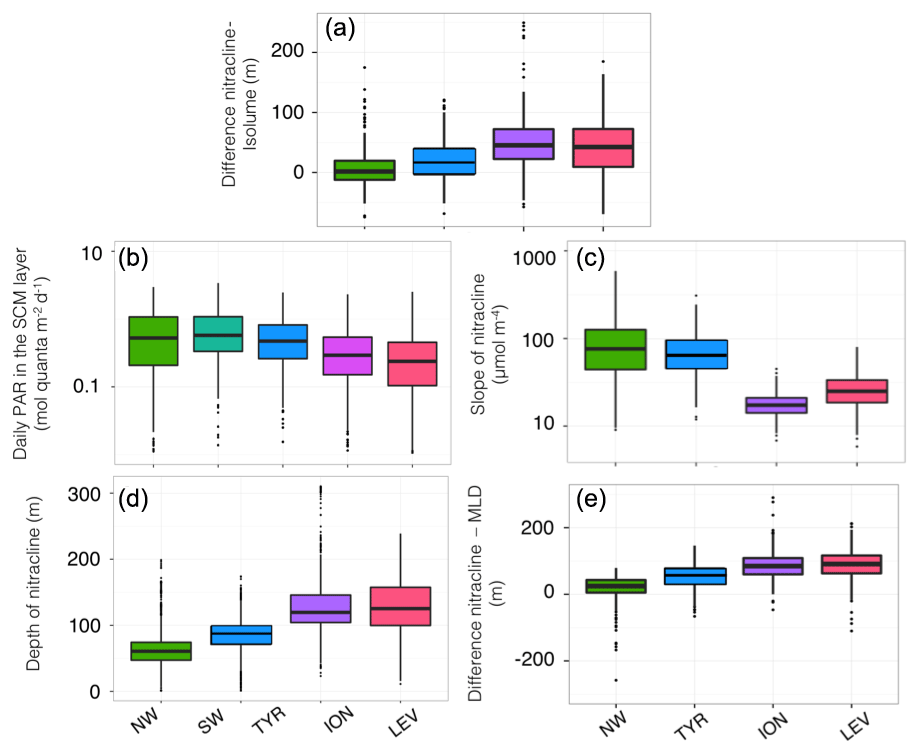
Figure 6Box plot of the distribution for each of the Mediterranean regions considered in this study, of the difference between the depths of the nitracline 1 µM and the isolume 0.3 mol quanta m−2 d−1 (a), of the daily PAR in the SCM layer (b), the depth (c) and slope (d) of the nitracline, and the difference between the depths of the nitracline 1 µM and the mixed layer depth (e). The SW is not always represented, as there is no BGC-Argo float equipped with a nitrate sensor in this region.
In contrast, in the ION and LEV regions, the isolume 0.3 mol quanta m−2 d−1, nitracline 1 µmol, SCM and SbbpM were not collocated in the water column (Fig. 5d–e). The difference between the depths of the SCM and nitracline was ∼50 m during the stratified period (Figs. 5d–e and 6a) and the SbbpM was shallower than the SCM (by ∼40 m), suggesting that the standing stock of carbon is maintained at a higher concentration above the depth of the SCM. In the eastern basin (Ionian and Levantine seas), the MLD almost never reached the nutricline, even during the winter period, as it was deeper than the nutricline only < 3 % of the time during an annual cycle (Fig. 6e). The nutricline was deeper (∼120 m in eastern basin vs. ∼70 m in western basin; Fig. 6c) and the nutrient gradient was also less sharp (nitracline slope of ∼40 µmol m−4 in eastern basin vs. ∼90 µmol m−4 in western basin; Fig. 6d) than in the western part of the Mediterranean Sea, suggesting a weak upward diffusive flux of nitrates that corroborates previous results (Tanhua et al., 2013; Pasqueron de Fommervault et al., 2015b). The inverse relationship between the nitracline steepness and the thickness of the SCM is also confirmed (Gong et al., 2017). The PAR at the SCM level was significantly lower in this eastern part than in the western part of the Mediterranean Sea (Wilcoxon test at a significance level of p<0.001; Fig. 6b). The development of the SCM in this system is thus likely to be limited by the availability of both light and nutrients. The SCM still settles at a depth at which light is available at a sufficient level to sustain photosynthesis but never reaches the nitracline.
3.1.4 Coupling and decoupling of bbp and Chl a in the SCM
We have seen that the SCM of the western basin benefits from both light and nutrient resources. In these conditions, the observed simultaneous increase in Chl a and bbp at the SCM most likely represents an actual development of phytoplankton biomass, as indicated by the concordance between the depths of the SCM and the SbbpM (Fig. 5). In contrast, in the eastern part of the Mediterranean Sea, the maxima of Chl a and bbp are not co-located. This result suggests that environmental conditions, typically the light conditions, might inhibit the increase in phytoplankton biomass.
In the eastern basin of the Mediterranean Sea, the microorganisms are most probably acclimated or even adapted to the environmental conditions. While photoacclimation is defined as a short-term acclimation of a photosynthetic organism to changing irradiance, photoadaptation refers to the long-term evolutionary adaptation of photosynthetic organisms to ambient light conditions through genetic selection. SCM species are known to use different strategies such as photoacclimation to low light (i.e. increase in the intracellular pigment content), mixotrophy or small-scale directed movements towards light (Falkowski and Laroche, 1991; Geider et al., 1997; Clegg et al., 2012). Phytoplankton species are also likely to have a different carbon : chlorophyll ratio (Falkowski et al., 1985; Geider, 1987; Cloern et al., 1995; Sathyendranath et al., 2009) and bbp properties (Vaillancourt et al., 2004; Whitmire et al., 2010), and a vertical shift toward species photoadapted to the particular environmental conditions prevailing in the SCM layer is a well-known phenomenon (e.g. Pollehne et al., 1993; Latasa et al., 2016). For example, two ecotypes of Prochlorococcus characterized by different accessory pigment contents are known to be adapted to either low-light or high-light conditions and to occupy different niches in the water column (Moore and Chisholm, 1999; Bouman et al., 2006; Garczarek et al., 2007). In particular, the low-light ecotype, characterized by increased intracellular pigmentation, has been frequently observed at the SCM level in the Mediterranean, especially in the eastern part (Brunet et al., 2006; Siokou-Frangou et al., 2010). A west-to-east modification in the composition of phytoplankton communities in the SCM toward a dominance of picophytoplankton species adapted to recurring light limitation has been observed (Christaki et al., 2001; Siokou-Frangou et al., 2010; Crombet et al., 2011). A vertical decoupling between bbp and Chl a could thus illustrate either photoacclimation of phytoplankton cells or the occurrence of specific phytoplankton communities adapted to the conditions prevailing in the SCM layer.
Although photoacclimation seems to be a widespread hypothesis in numerous studies that explain the vertical decoupling of Chl a and bbp (e.g. Brunet et al., 2006; Cullen, 1982; Mignot et al., 2014), we should be reminded that this decoupling could also result from a change in the nature or size distribution of the entire particle pool. Small particles are, for example, known to backscatter light more efficiently than large particles (Morel and Bricaud, 1986; Stramski et al., 2004). A higher proportion of non-algal particles in the eastern basin compared to the western basin could thus explain the decoupling between bbp and Chl a. The non-algal particles compartment is defined as the background of submicronic living biological cells (i.e. viruses or bacteria) and non-living particles (i.e. detritus or inorganic particles) and is typically known to represent a significant part of the particulate assemblage in oligotrophic ecosystems (Morel and Ahn, 1991; Claustre et al., 1999; Stramski et al., 2001).
Finally, photoacclimation processes as well as vertical gradients in phytoplankton species or in the non-phytoplankton particles, also contributing to bbp, could explain the vertical decoupling of bbp and Chl a we observed in the eastern basin. The different types of Chl a and bbp vertical profiles depend on both the nature of the particles present in the water column and the physiology of phytoplanktonic cells and their related bio-optical properties, yet our data set did not allow us to conclude on the dominance of one process compared to the other.
3.2 Classification of the Chl a and bbp vertical profiles
In the previous section, we identified the major environmental factors leading to the occurrence of two main types of SCM in the five considered regions of the Mediterranean Sea. While a concomitant maximum of Chl a and bbp suggested a carbon biomass maximum, a decoupling between the vertical distributions of these two properties may reflect photoacclimation, a modification of the algal community composition or a change in the nature and/or size of the particle assemblage. The seasonal and regional variability in this global picture of the SCM was explored using a statistical approach applied to the BGC-Argo data set. Our aim was here to classify the Chl a and bbp profiles based on their shape. This led us to propose a typology of the different types of SCMs seasonally encountered in the five regions of the Mediterranean Sea. The frequency of these different types of SCMs may also be assessed over the seasonal cycle and their characteristics compared among the various regions of the Mediterranean Sea.
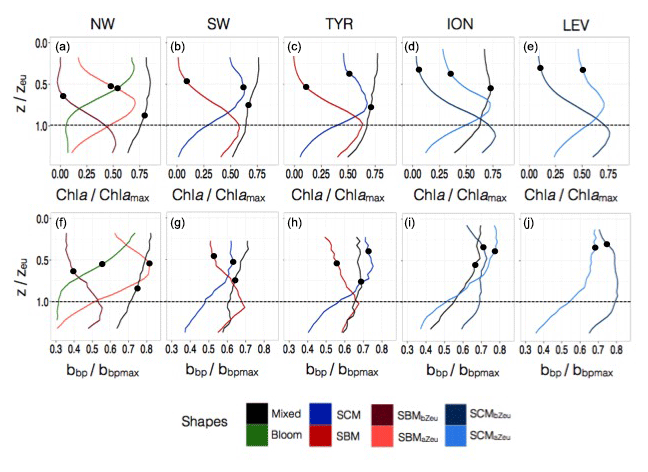
Figure 7Normalized vertical profiles of the chlorophyll a concentration (Chl a) (a, c, e, g, i) and particulate backscattering coefficient (bbp) (b, d, f, h, j) for each of the considered Mediterranean regions. The Chl a and bbp are normalized to their individual profile maximum values, Chl amax and bbpmax, while the depth is normalized to the euphotic depth (Zeu). The colour code indicates the different types of profiles; the different shapes are for bloom, mixed, SBM (subsurface biomass maximum) with a distinction between the SBMaZeu and the SBMbZeu (for SBM occurring above or below the euphotic depth), and the SCM (subsurface chlorophyll maximum) with a distinction between the SCMaZeu and the SCMbZeu (for SCM occurring or below the euphotic depth). The black dots indicate the positions of the mean mixed layer depth (MLD) for each type of profile.
3.2.1 The NW: a region with a specific trophic regime
In the NW, the vertical distributions of Chl a and bbp presented four different shapes over the annual cycle (Fig. 7a–b). The mixed shape was characterized by a homogeneous distribution of Chl a and bbp (as suggested by the deep mean MLD associated with this type of profile; Fig. 7a–b) and showed occurrence exceeding 60 % from December to March (Fig. 8a). The bloom shape exhibited high Chl a and bbp values at surface with maximum occurrence > 55 % in April. The coexistence of the mixed and the bloom shapes during winter and spring could result from intermittent mixing that alters the vertical distribution of Chl a and bbp (e.g. Chiswell, 2011; Lacour et al., 2017). The SBMaZeu and the SBMbZeu (SBM occurring above and below the euphotic depth) constituted two different cases of subsurface maximum. In both cases, Chl a and bbp covaried (Fig. 7a–b) and the maxima of Chl a and bbp were observed at nearly the same depth, suggesting an increase in carbon biomass in subsurface.
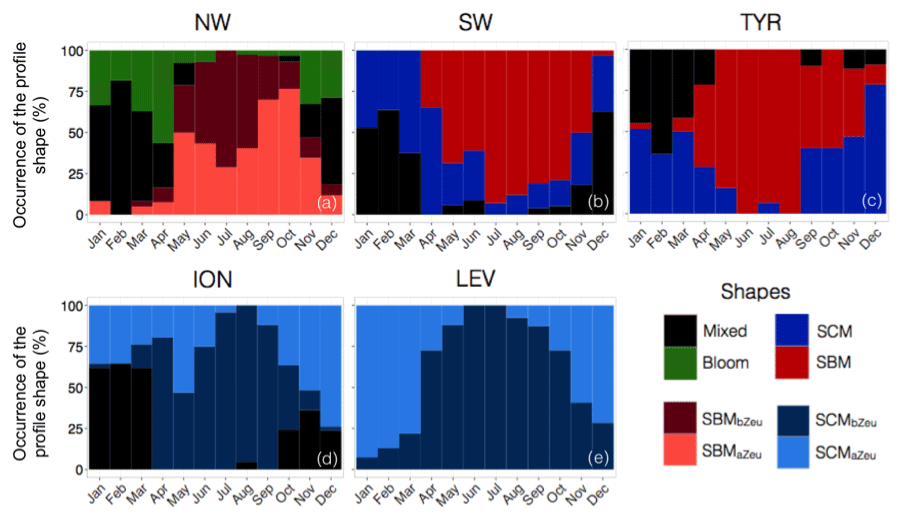
Figure 8Monthly occurrence of the different types of profile shape for each of the five considered Mediterranean regions. The colour code indicates the type of profile shape, namely bloom, mixed, SBM (subsurface biomass maximum) with a distinction between the SBMaZeu and the SBMbZeu (for SBM occurring above or below the euphotic depth), and the SCM (subsurface chlorophyll maximum) with a distinction between the SCMaZeu and the SCMbZeu (for SCM occurring above or below the euphotic depth).
The SBMaZeu was often observed in late spring and late summer, whereas the SBMbZeu occurred more frequently (> 50 %) in the middle of the oligotrophic period. This result suggests a deepening of the SCM along the oligotrophic season and corroborates the light-driven hypothesis previously formulated by Letelier et al. (2004) and Mignot et al. (2014). These authors observed that the seasonal variation of the depth of the SCM depicts the same displacement as the isolumes and consequently suggested that the SCM depth displacement is light-driven. In the NW region, the high surface Chl a of the bloom shape (Fig. 7a) probably results in increased light attenuation in the water column from autumn to spring. Consequently, the SCM was shallower in spring than in summer (Fig. 5a) and the SBMaZeu shape occurred relatively frequently in spring (Fig. 8a). Then, from spring to summer, the Chl a decrease in the surface layer of the water column resulted in decreased light attenuation and subsequent deepening of the SCM (Fig. 5a), which thus formed a subsurface maximum of Chl a and bbp below the euphotic layer (SBMbZeu, Fig. 8a). Therefore, our results are consistent with previous studies (e.g. Gutiérrez-Rodríguez et al., 2010; Mayot et al., 2017b) that highlighted the special status of the northwestern region, the only region to exhibit the bloom shape and predominantly SBMs during the oligotrophic season (Fig. 9a–b).
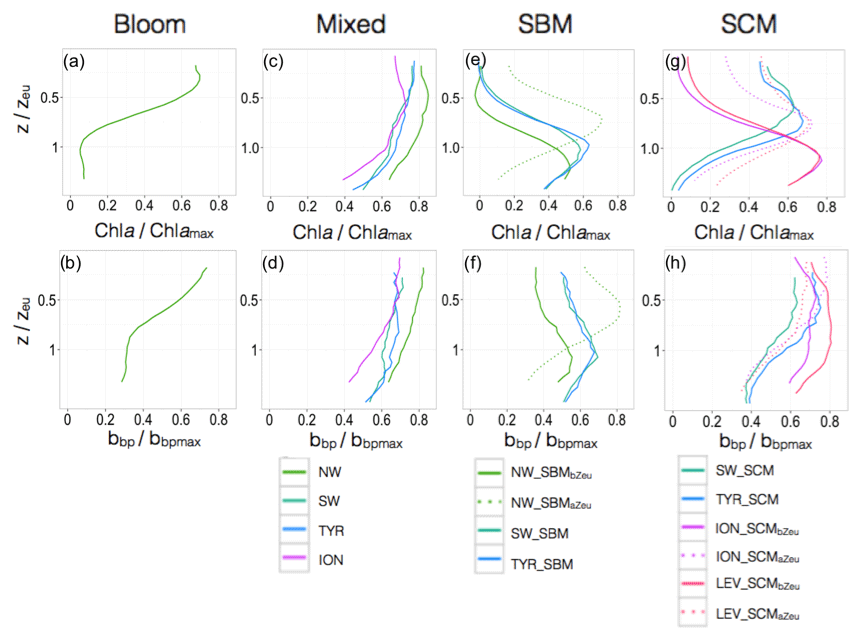
Figure 9Normalized vertical profiles of the chlorophyll a concentration (Chl a) (a, c, e, g) and particulate backscattering coefficient (bbp) (b, d, f, h) for each shape type. The Chl a and bbp are normalized to their individual profile maximum values, Chl amax and bbpmax, while the depth is normalized to the euphotic depth (Zeu). The colour code and the type of lines indicate the region of the Mediterranean Sea and the different shapes. The different shapes are for bloom, mixed, SBM (subsurface biomass maximum) with a distinction between the SBMaZeu and the SBMbZeu (for SBM occurring above or below the euphotic depth), and the SCM (subsurface chlorophyll maximum) with a distinction between the SCMaZeu and the SCMbZeu (for SCM occurring or below the euphotic depth). Note the different scales of the x axes.
3.2.2 The SW and the TYR: regions of transition
In the southwestern region as well as in the Tyrrhenian Sea, three shapes characterized the seasonal variability of the vertical distribution of Chl a and bbp (Fig. 7c–d and e–f). A mixed shape, similar to that observed in the NW (Fig. 9c–d), a SBM shape (Fig. 9e–f) and a SCM shape (decoupling between the maximum of Chl a and bbp at depth) were successively encountered over the seasonal cycle, with weak differences in their frequency of occurrence among the two regions. The SCM shape was shallower in the water column than the SBM shape (Fig. 7c–f). It was encountered mainly in winter and autumn (∼50 % of occurrence), alternating with the mixed shape (Fig. 8b–c). Thus, this shape probably illustrates the erosion of the SCM by the winter mixing as previously suggested, for example, in Lavigne et al. (2015). The SBM shape occurred mainly during spring and summer (> 75 %), when both light and nutrients were available for phytoplankton growth (Fig. 5b–c). The SBM shapes of the SW and the TYR were comparable to the SBMbZeu shape of the NW occurring at almost the same depth (∼Zeu). The SCM shapes of the SW and TYR were analogous to the SCMaZeu shape of the ION and LEV (Fig. 9e–h). Hence, our results suggest that the SW and TYR regions are transition regimes that present types of SCMs that can be found in both the western and eastern basins.
3.2.3 The ION and the LEV: oligotrophic endmembers
In the Ionian Sea, three different shapes were retrieved along the seasonal cycle, i.e. the mixed, the SCMaZeu and the SCMbZeu shapes (Fig. 7g–h). In this region, the Chl a maximum was always decorrelated from the bbp maximum that revealed higher values at surface than at depth. In the Levantine Sea, only two distinct shapes were encountered, i.e. the SCMaZeu and the SCMbZeu shapes, and associated with shallow MLDs (Fig. 7i–j). The subsurface maximum of Chl a was never associated with a subsurface maximum of bbp. Such SCMs constituted a permanent pattern with SCMbZeu and SCMaZeu reaching occurrences of 100 % in June–July and > 75 % in December–March (Fig. 8d–e). The SCMbZeu shape was a particularity of the eastern basin. This shape was very similar in the ION and LEV but very different from the shapes observed in the other regions (Fig. 9g–h). This SCMbZeu settled below the Zeu that, in such oligotrophic systems, occurs relatively deep within the water column (∼95 m; Fig. 3d). This type of SCM was also very thick (∼70 m) (Fig. 3e) and associated with low values of the nitracline slope (Fig. 6d).
3.3 A case study of the Gulf of Lion and Levantine Sea
Both the climatological and statistical approaches proposed in this study allowed us to characterize the SCM dynamics in five regions of the Mediterranean Sea on large spatial (interregional) and temporal (seasonal) scales. In the present section, we focused on the data provided by two BGC-Argo floats that simultaneously recorded bio-optical properties, PAR and nitrate concentration in two distinct regions, representing the two extremes of the Mediterranean trophic gradient. This helped us to gain an understanding of the dynamics of the SCM on weekly and regional scales and should give insights into the mechanisms underlying the occurrence of SCMs in these endmember regimes.

Figure 10Trajectory and Chl a time series of the float deployed in the Gulf of Lion (fGL; a–b) and the float deployed in the Levantine Sea (fLS; c–d). On panels b and d, the white line shows the isolume of 0.3 mol quanta m−2 d−1, the blue line indicates the mixed layer depth (MLD) and the black line the nitracline 1 µM.
3.3.1 Overview of the two contrasted systems
The float WMO 6901512 (fGL) was deployed in the Gulf of Lion on 11 April 2013 and recorded data until 4 May 2014 (Fig. 10a). The float WMO 6901528 (fLS) collected data in the Levantine Sea from 18 May 2013 to 23 May 2015 (Fig. 10c). The two regions presented very different seasonal Chl a distributions. The Gulf of Lion is a typical temperate-like system that exhibits a winter period characterized by large MLDs (Millot, 1999; Lavigne et al., 2015) (maximum MLD > 1000 m, Fig. 10d). The intense mixing induces a refuelling of nutrients (Gačić et al., 2002; D'Ortenzio et al., 2014; Severin et al., 2017), which allows the development of a spring bloom (Marty et al., 2002, 2008; Mayot et al., 2017a) as revealed by the high surface Chl a from April to May (Fig. 10b). A subsurface maximum of Chl a was established from the end of May to mid-November at a depth similar to that of the nitracline 1 µM and isolume 0.3 mol quanta m−2 d−1 and displayed maximum Chl a of ∼1 mg m−3 in July (Fig. 10b).
The Levantine Sea behaves, in contrast, like a tropical system. Winter mixing was weak (maximum MLD of 125 m; Fig. 10d) but still able to erode the SCM as suggested by the small increase in surface Chl a from November to February (Fig. 10b). The seasonal MLD deepening almost never reached the nitracline, thus limiting the nitrate supply to the upper layer of the water column (Dugdale and Wilkerson, 1988; Lavigne et al., 2013; Pasqueron de Fommervault et al., 2015a), hence leading to relatively low surface primary production in this area (Krom et al., 1991; Psarra et al., 2000; Bricaud et al., 2002; Siokou-Frangou et al., 2010). The SCM is a permanent feature in this region, settling below the isolume 0.3 mol quanta m−2 d−1 and far above the nitracline (Fig. 10d).
3.3.2 Factors limiting the SCM
For exploring the limiting factors at the level of the SCM, we used a nutrient vs. light resource-limitation diagram. This approach, employed in biogeochemical modelling (Cloern, 1999; Li and Hansell, 2016) simultaneously exploits PAR and [] data in order to understand which environmental factor limits phytoplankton growth (Fig. 11).
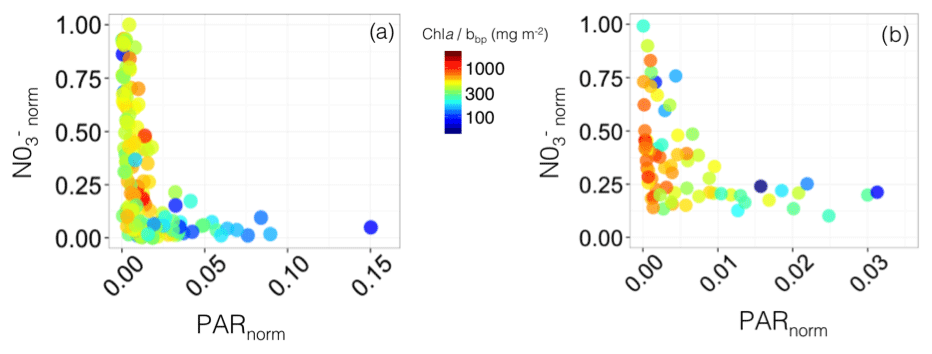
Figure 11Nutrient vs. light resource-limitation diagram for the two BGC-Argo floats deployed in the Gulf of Lion (a) and Levantine Sea (b). The colours of the data points indicate the Chl a:bbp ratio values. The x and y axes represent the PAR and [] values normalized to the maximum value calculated over the float lifetime in the layer extending from the surface to below the SCM. Note that the plots show only data collected within the SCM layer, thus corresponding to low normalized PAR values (i.e. under 25 % of the maximum PAR).
In the Gulf of Lion, two different types of situation occurred: (1) very low light compared to the maximum surface PAR (PARnorm < 0.025) coupled with between 0 and 1, indicative of light limitation and (2) low light compared to the maximum surface PAR (PARnorm within the range 0.025–0.15) associated with < 0.15, indicative of nitrate limitation, probably resulting from uptake by phytoplankton (Fig. 11a). On the contrary, in the eastern part of the Mediterranean Sea, the SCM was always associated with very low-light conditions compared to the maximum surface PAR (PARnorm < 0.025) and variable values comprised between 0.1 and 1 (Fig. 11b). This suggests that, even when the nitrate concentration is sufficient to sustain primary production at the SCM level, another factor limits phytoplankton growth. Phytoplankton growth at the SCM is probably limited by light or co-limited by both light and nutrients. Phosphate is also an important limiting factor for phytoplankton growth in the whole of the Mediterranean Sea (Marty et al., 2002; Pujo-Pay et al., 2011), the eastern basin in particular (Krom et al., 1991, 2010). Hence, in a non-nitrate-limited SCM of the Levantine Sea (Fig. 11b), phytoplankton may still be limited by either or both low phosphate concentrations and low-light levels. Since autonomous measurements of phosphate concentrations are not possible yet, our chemical data are restricted to nitrate so we cannot conclude on the role of phosphate in the settlement of the SCM.
The coupling between Chl a and bbp was studied using the Chl a:bbp ratio. In both the western and eastern basins, SCMs with prevailing very low-light conditions were accompanied by high values of the Chl a:bbp ratio (> 300 mg m−2). In contrast, in the SCM of the western basin associated with low values of , the Chl a:bbp ratio showed values < 300 mg m−2. This ratio is a proxy of the Chl a : POC ratio (Behrenfeld et al., 2015; Álvarez et al., 2016; Westberry et al., 2016) and constitutes an optical index of photoacclimation (Behrenfeld et al., 2005; Siegel et al., 2005) or of the phytoplankton communities (Cetinić et al., 2012, 2015). Hence, in both the western and eastern basins, the high values of the Chl a:bbp ratio occurring in the SCM, associated with very low-light conditions, could be attributed to either photoacclimation of phytoplankton cells to low-light intensity. In contrast, in the SCM of the western basin, where low values of were reported, the low Chl a:bbp ratio values could either indicate a higher proportion of detrital particles or an increase in biomass sustained by a specific phytoplankton assemblage dominated by communities of nano- or pico-sized cells, including very small diatoms (e.g. Leblanc et al., 2018).

Figure 12Schematic representation of the different situations of SCMs in the Mediterranean Sea during the oligotrophic summer period for the five considered regions of the Mediterranean Sea along the west-to-east gradient.
The present study is, to our knowledge, the first examination of the spatial and temporal variability of subsurface chlorophyll a maxima (SCMs) in the Mediterranean Sea using Biogeochemical-Argo profiling floats equipped with both light (PAR) and nitrate ([]) sensors. Our study aims to improve the understanding of the characteristics and dynamics of phytoplankton biomass in the subsurface layer of the Mediterranean Sea. We identified two major mechanisms controlling the occurrence of SCMs, i.e. (1) SCMs arising from an actual increase in carbon biomass most probably reflecting an increase in phytoplankton biomass benefiting from both light and nutrient resources (SBMs) with a potentially non-negligible contribution of non-phytoplankton particles at depth and (2) SCMs that stem from an increase in intracellular Chl a as a result of photoacclimation to low-light levels. In the temperate-like system of the western Mediterranean Sea, SBMs are recurrent, whereas in the subtropical-like system of the eastern Mediterranean Sea, SCMs are, at a first order, representative of photoacclimation process. Using a statistical classification of vertical profiles of Chl a and bbp collected over the entire Mediterranean, we have evidenced different intermediate SCM situations that can be summarized as follows (Fig. 12):
-
The SBMaZeu is a subsurface biomass maximum that settles above the euphotic zone in the northwestern Mediterranean Sea (NW). It is the thinnest (∼40 m) and shallowest (∼60 m) biomass maximum. It is also the most intense, probably because it benefits from adequate light and nutrient resources, with the deep mixed layer occurring in this region during the winter period, probably inducing a seasonal renewal of the nutrients in the surface layer.
-
The SBMbZeu is established below the euphotic zone in the NW. As well as the SBMs of the southwestern Mediterranean Sea (SW) and Tyrrhenian Sea (TYR), it is less intense than the SBMaZeu probably because nutrient conditions are less favourable than in the NW region as the winter MLD is close to the nutricline but never reaches it.
-
The SCM of the SW and TYR, as well as the SCMaZeu (i.e. settling above the euphotic depth) of the Ionian (ION) and Levantine (LEV) seas, are not biomass subsurface maxima but reflect Chl a maxima resulting from photoacclimation. Moving from the SW to LEV region, the amplitude of the SCM decreases, while its thickness increases.
-
The SCMbZeu of the ION and LEV settle below the euphotic depth and are deeper (∼95 m) than all the other subsurface maxima. They are most probably the consequence of a decoupling of the MLD and the nutricline and represent the oligotrophic endmember type of subsurface maxima in the Mediterranean Sea. In these types of SCMs, phytoplankton communities most probably establish themselves deep in the water column in order to reach the nutrient resources. These communities are likely photoacclimated, and also possibly photoadapted, to the low-light conditions encountered at such depths. The phytoplankton assemblage is likely composed of picophytoplankton (Casotti et al., 2003; Siokou-Frangou et al., 2010), including the low-light-adapted Prochlorococcus ecotype (Brunet et al., 2006; Garczarek et al., 2007).
In permanently stratified oligotrophic ecosystems, the SCM phytoplankton species may settle at an especially deep level and adapt to the prevailing low-light levels in order to benefit from more nutrients. On the contrary, when nitrates are not a limiting factor at the SCM level (e.g. in the northwestern region after the bloom period), the SCM is only controlled by the amount of light available at depth. In either case, light is a crucial forcing parameter that controls the depth of the SCM. Consistently with previous studies conducted in other open-ocean regions (Longhurst and Glen Harrison, 1989; Furuya, 1990; Severin et al., 2017), the present work suggests that shallower SCMs tend to display larger phytoplankton biomass than deeper SCMs. In our study, these biomass maxima are characterized by a coupling of Chl a and bbp that suggests an increase in carbon biomass. Finally, the present results indicate that SBMs represent a frequent feature in the Mediterranean Sea, which contrasts with the idea that SCMs in oligotrophic regions typically result from photoacclimation of phytoplankton cells. Thus, we suggest that the contribution of SCMs to primary production, which may be substantial, although ignored by current satellite-based estimates, should be further investigated.
These data were made freely available by the International Argo Program (http://www.argo.ucsd.edu, http://argo.jcommops.org) and the Coriolis project (http://www.coriolis.eu.org, last access: 1 September 2017) and are available in NetCDF format at the following https://doi.org/10.17882/42182 (Argo, 2018).
The supplement related to this article is available online at: https://doi.org/10.5194/bg-16-1321-2019-supplement.
MB designed the study and wrote the manuscript with contributions from all authors; JU designed the study, participated in the data analysis and in the redaction of the article; BG, OPDF and AM participated in the data process and analysis; AP, CS, VT, EL and CP allowed deployment of floats, provided calibration process and ensured data quality management and access; FDO contributed to the data analysis and deployment of floats; HC is the PI of the study; AB designed the study and participated in the redaction of the article.
The authors declare that they have no conflict of interest.
This paper represents a contribution to the following research projects: remOcean (funded by the European Research Council, grant 246777), NAOS (funded by the Agence Nationale de la Recherche in the frame of the French Equipement d'avenir programme, grant ANR J11R107-F), the SOCLIM (Southern Ocean and climate) project supported by the French research programme LEFE- CYBER of INSU-CNRS, the Climate Initiative of the foundation BNP Paribas and the French polar institute (IPEV), AtlantOS (funded by the European Union's Horizon 2020 Research and Innovation programme, grant 2014–633211), E-AIMS (funded by the European Commission's FP7 project, grant 312642), UK Bio-Argo (funded by the British Natural Environment Research Council – NERC, grant NE/ L012855/1), REOPTIMIZE (funded by the European Union's Horizon 2020 Research and Innovation programme, Marie Skłodowska-Curie grant 706781), Argo-Italy (funded by the Italian Ministry of Education, University and Research – MIUR), and the French Bio-Argo programme (BGC-Argo France; funded by CNES-TOSCA, LEFE Cyber, and GMMC). We thank the PIs of several BGC-Argo floats missions and projects: Giorgio Dall'Olmo (Plymouth Marine Laboratory, United Kingdom; E-AIMS and UK Bio-Argo), Kjell-Arne Mork (Institute of Marine Research, Norway; E-AIMS), Violeta Slabakova (Bulgarian Academy of Sciences, Bulgaria; E-AIMS), Emil Stanev (University of Oldenburg, Germany; E-AIMS), Claire Lo Monaco (Laboratoire d'Océanographie et du Climat: Expérimentations et Approches Numériques), Pierre-Marie Poulain (National Institute of Oceanography and Experimental Geophysics, Italy; Argo-Italy), Sabrina Speich (Laboratoire de Météorologie Dynamique, France; LEFE- GMMC), Virginie Thierry (Ifremer, France; LEFE-GMMC), Pascal Conan (Observatoire Océanologique de Banyuls sur mer, France; LEFE-GMMC), Laurent Coppola (Laboratoire d'Océanographie de Villefranche, France; LEFE-GMMC), Anne Petrenko (Mediterranean Institute of Oceanography, France; LEFE-GMMC), and Jean-Baptiste Sallée (Laboratoire d'Océanographie et du Climat, France; LEFE-GMMC). Louis Prieur and Jean-Olivier Irisson (Laboratoire d'Océanographie de Villefranche, France) are acknowledged for useful comments and fruitful discussions. We also thank the International Argo Program and the Coriolis project, which contributed to making the data freely and publicly available.
This paper was edited by Koji Suzuki and reviewed by two anonymous referees.
Álvarez, E., Morán, X. A. G., López-Urrutia, Á., and Nogueira, E.: Size-dependent photoacclimation of the phytoplankton community in temperate shelf waters (southern Bay of Biscay), Mar. Ecol. Prog. Ser., 543, 73–87, https://doi.org/10.3354/meps11580, 2016.
Anderson, G. C.: Subsurface Chlorophyll Maximum in the Northeast Pacific Ocean, Limnol. Oceanogr., 14, 386–391, 1969.
Antoine, D., Morel, A., and André, J.-M.: Algal pigment distribution and primary production in the eastern Mediterranean as derived from coastal zone color scanner observations, J. Geophys. Res., 100, 16193–16209, 1995.
Arai, R., Nishiyamal, N., Nakatani, N., and Okuno, T.: Measurement Method of Nutrient using Principal Component Regression, in: OCEANS 2008-MTS/IEEE Kobe Techno-Ocean, IEEE, 1–6, 2008.
Ardyna, M., Babin, M., Gosselin, M., Devred, E., Bélanger, S., Matsuoka, A., and Tremblay, J.-É.: Parameterization of vertical chlorophyll a in the Arctic Ocean: impact of the subsurface chlorophyll maximum on regional, seasonal, and annual primary production estimates, Biogeosciences, 10, 4383–4404, https://doi.org/10.5194/bg-10-4383-2013, 2013.
Argo: Argo float data and metadata from Global Data Assembly Centre (Argo GDAC), SEANOE, https://doi.org/10.17882/42182, 2018.
Arrigo, K. R., Matrai, P. A., and Van Dijken, G. L.: Primary productivity in the Arctic Ocean: Impacts of complex optical properties and subsurface chlorophyll maxima on large-scale estimates, J. Geophys. Res.-Oceans, 116, 1–15, https://doi.org/10.1029/2011JC007273, 2011.
Babin, M., Morel, A., Fournier-Sicre, V., Fell, F., and Stramski, D.: Light scattering properties of marine particles in coastal and open ocean waters as related to the particle mass concentration, Limnol. Oceanogr., 48, 843–859, https://doi.org/10.4319/lo.2003.48.2.0843, 2003.
Balch, W. M., Drapeau, D. T., Fritz, J. J., Bowler, B. C., and Nolan, J.: Optical backscattering in the Arabian Sea – continuous underway measurements of particulate inorganic and organic carbon, Deep-Sea Res. Pt. I, 48, 2423–2452, https://doi.org/10.1016/S0967-0637(01)00025-5, 2001.
Barbieux, M., Uitz, J., Bricaud, A., Organelli, E., Poteau, A., Schmechtig, C., Gentili, B., Penkerc'h, C., Leymarie, E., D'Ortenzio, F., and Claustre, H.: Assessing the Variability in the Relationship Between the Particulate Backscattering Coefficient and the Chlorophyll a Concentration From a Global Biogeochemical-Argo Database, J. Geophys. Res.-Oceans, 123, 1229–1250, https://doi.org/10.1002/2017JC013030, 2017.
Beckmann, A. and Hense, I.: Beneath the surface: Characteristics of oceanic ecosystems under weak mixing conditions – A theoretical investigation, Prog. Oceanogr, 75, 771–796, https://doi.org/10.1016/j.pocean.2007.09.002, 2007.
Behrenfeld, M. J., Boss, E., Siegel, D. A., and Shea, D. M.: Carbon-based ocean productivity and phytoplankton physiology from space, Global Biogeochem.l Cy., 19, 1–14, https://doi.org/10.1029/2004GB002299, 2005.
Behrenfeld, M. J., O'Malley, R. T., Boss, E. S., Westberry, T. K., Graff, J. R., Halsey, K. H., Milligan, A. J., Siegel, D. A., and Brown, M. B.: Revaluating ocean warming impacts on global phytoplankton, Nat. Clim. Change, 6, 323–330, https://doi.org/10.1038/nclimate2838, 2015.
Bethoux, J. P., Morin, P., Madec, C., and Gentili, B.: Phosphorus and nitrogen behaviour in the Mediterranean Sea, Deep-Sea Res., 39, 1641–1654, https://doi.org/10.1016/0198-0149(92)90053-V, 1992.
Bosc, E., Bricaud, A., and Antoine, D.: Seasonal and interannual variability in algal biomass and primary production in the Mediterranean Sea, as derived from 4 years of SeaWiFS observations, Global Biogeochem. Cy., 18, 1–17, https://doi.org/10.1029/2003GB002034, 2004.
Boss, E., Picheral, M., Leeuw, T., Chase, A., Karsenti, E., Gorsky, G., Taylor, L., Slade, W., Ras, J., and Claustre, H.: The characteristics of particulate absorption, scattering and attenuation coefficients in the surface ocean; Contribution of the Tara Oceans expedition, Methods in Oceanography, 7, 52–62, https://doi.org/10.1016/j.mio.2013.11.002, 2013.
Bouman, H., Ulloa, O., Scanlan, D. J., Zwirglmaier, K., Li, W. K. W., Platt, T., Stuart, V., Barlow, R., Leth, O., Clementson, L., Lutz, V. A., Fukasawa, M., Watanabe, S., and Sathyendranath, S.: Oceanographic Basis of the Global Surface Distribution of Prochlorococcus Ecotypes, Science, 312, 918–921, https://doi.org/10.1126/science.39.1002.398, 2006.
Bricaud, A., Bosc, E., and Antoine, D.: Algal biomass and sea surface temperature in the Mediterranean Basin Intercomparison of data from various satellite sensors, and implications for primary production estimates, Remote Sens. Environ., 81, 163–178, https://doi.org/10.1016/S0034-4257(01)00335-2, 2002.
Briggs, N., Perry, M. J., Cetinić, I., Lee, C., D'Asaro, E., Gray, A. M., and Rehm, E.: High-resolution observations of aggregate flux during a sub-polar North Atlantic spring bloom, Deep-Sea Res. Pt. I, 58, 1031–1039, https://doi.org/10.1016/j.dsr.2011.07.007, 2011.
Brunet, C., Casotti, R., Vantrepotte, V., Corato, F., and Conversano, F.: Picophytoplankton diversity and photoacclimation in the Strait of Sicily (Mediterranean Sea) in summer, I. Mesoscale variations, Aquat. Microb. Ecol., 44, 127–141, https://doi.org/10.3354/ame044127, 2006.
Casotti, R., Landolfi, A., Brunet, C., D'Ortenzio, F., Mangoni, O., and Ribera d'Alcalá, M.: Composition and dynamics of the phytoplankton of the Ionian Sea (eastern Mediterranean), J. Geophys. Res., 108, 1–19, https://doi.org/10.1029/2002JC001541, 2003.
Cetinić, I., Perry, M. J., Briggs, N. T., Kallin, E., D'Asaro, E. A., and Lee, C. M.: Particulate organic carbon and inherent optical properties during 2008 North Atlantic Bloom Experiment, J. Geophys. Res., 117, 1–18, https://doi.org/10.1029/2011JC007771, 2012.
Cetinić, I., Perry, M. J., D'Asaro, E., Briggs, N., Poulton, N., Sieracki, M. E., and Lee, C. M.: A simple optical index shows spatial and temporal heterogeneity in phytoplankton community composition during the 2008 North Atlantic Bloom Experiment, Biogeosciences, 12, 2179–2194, https://doi.org/10.5194/bg-12-2179-2015, 2015.
Chiswell, S. M.: Annual cycles and spring blooms in phytoplankton: Don't abandon Sverdrup completely, Mar. Ecol. Prog. Ser., 443, 39–50, https://doi.org/10.3354/meps09453, 2011.
Christaki, U., Giannakourou, A., Van Wambeke, F., and Grégori, G.: Nanoflagellate predation on auto- and heterotrophic picoplankton in the oligotrophic Mediterranean Sea, J. Plankton Res., 23, 1297–1310, https://doi.org/10.1093/plankt/23.11.1297, 2001.
Claustre, H., Morel, A., Babin, M., Cailliau, C., Marie, D., Marty, J.-C., Tailliez, D., and Vaulot, D.: Variability in particle attenuation and chlorophyll fluorescence in the tropical Pacific?: Scales, patterns, and biogeochemical implications, J. Geophys. Res., 104, 3401–3422, 1999.
Claustre, H., Bishop, J., Boss, E., Bernard, S., Berthon, J.-F., Coatanoan, C., Johnson, K. S., Lotiker, A., Ulloa, O., Perry, M. J., D'Ortenzio, F., Hembise Fanton D'Andon, O., and Uitz, J.: Bio-optical profiling floats as new observational tools for biogeochemical and ecosystem studies: Potential synergies with ocean color remote sensing, in: “Proceedings of the OceanObs'09: Sustained Ocean Observations and Information for Society” Conference, edited by: Hall, J., Harrison, D. E., and Stammer, D., ESA Publ. WPP-306, 21–25 September 2010, Venice, Italy, 2010.
Clegg, M. R., Gaedke, U., Boehrer, B., and Spijkerman, E.: Complementary ecophysiological strategies combine to facilitate survival in the hostile conditions of a deep chlorophyll maximum, Oecologia, 169, 609–622, https://doi.org/10.1007/s00442-011-2225-4, 2012.
Cleveland, J. S., Perry, M. J., Kiefer, D. A., and Talbot, M. C.: Maximal quantum yield of photosynthesis in the northwest Sargasso Sea, J. Mar. Res., 47, 869–886, 1989.
Cloern, J. E.: The relative importance of light and nutrient limitation of phytoplankton growth: A simple index of coastal ecosystem sensitivity to nutrient enrichment, Aquat. Ecology, 33, 3–16, https://doi.org/10.1023/A:1009952125558, 1999.
Cloern, J. E., Grenz, C., and Videgar-Lucas, L.: An empirical model of the phytoplankton chlorophyll: carbon ration-the conversion factor between productivity and growth rate., Limnol. Oceanogr., 40, 1313–1321, 1995.
Crombet, Y., Leblanc, K., Quéguiner, B., Moutin, T., Rimmelin, P., Ras, J., Claustre, H., Leblond, N., Oriol, L., and Pujo-Pay, M.: Deep silicon maxima in the stratified oligotrophic Mediterranean Sea, Biogeosciences, 8, 459–475, https://doi.org/10.5194/bg-8-459-2011, 2011.
Cullen, J. J.: The Deep Chlorophyll Maximum: Comparing Vertical Profiles of Chlorophyll a, Can. J. Fish. Aquat. Sci., 39, 791–803, https://doi.org/10.1139/f82-108, 1982.
Cullen, J. J. and Eppley, R. W.: Chlorophyll Maximum Layers of the Southern-California Bight and Possible Mechanisms of their Formation and Maintenance, Oceanol. Acta, 4, 23–32, 1981.
de Boyer Montégut, C.: Mixed layer depth over the global ocean: An examination of profile data and a profile-based climatology, J. Geophys. Res., 109, 1–20, https://doi.org/10.1029/2004JC002378, 2004.
D'Ortenzio, F. and Ribera d'Alcalà, M.: On the trophic regimes of the Mediterranean Sea: a satellite analysis, Biogeosciences, 6, 139–148, https://doi.org/10.5194/bg-6-139-2009, 2009.
D'Ortenzio, F., Lavigne, H., Besson, F., Claustre, H., Coppola, L., Garcia, N., Laës-Huon, A., Le Reste, S., Malardé, D., Migon, C., Morin, P., Mortier, L., Poteau, A., Prieur, L., Raimbault, P., and Testor, P.: Observing mixed layer depth, nitrate and chlorophyll concentrations in the northwestern Mediterranean: Acombined satellite and NO3 profiling floats experiment, Geophys. Res. Lett., 41, 6443–6451, https://doi.org/10.1002/2014GL061020, 2014.
Dall'Olmo, G. and Mork, K. A.: Carbon export by small particles in the Norwegian Sea, Geophys. Res. Lett., 41, 2921–2927, https://doi.org/10.1002/2014GL059244, 2014.
Dubinsky, Z. and Stambler, N.: Photoacclimation processes in phytoplankton: Mechanisms, consequences, and applications, Aquat. Microb. Ecol., 56, 163–176, https://doi.org/10.3354/ame01345, 2009.
Dugdale, R. C. and Wilkerson, F. P.: Nutrient sources and primary production in the Eastern Mediterranean, in: Oceanologica Acta, edited by: Minas, H. J. and Nival, P., 179–184, 1988.
Estrada, M., Marrasé, C., Latasa, M., Berdalet, E., Delgado, M., and Riera, T.: Variability of deep chlorophyll maximum in the Northwestern Mediterranean, Mar. Ecol. Prog. Ser., 92, 289–300, https://doi.org/10.3354/meps092289, 1993.
Falkowski, P. G. and Laroche, J.: Acclimation to spectral irradiance in algae, J. Phycol., 27, 8–14, https://doi.org/10.1111/j.0022-3646.1991.00008.x, 1991.
Falkowski, P. G., Dubinsky, Z., and Wyman, K.: Growth-irradiance relationships in phytoplankton, Limnol. Oceanogr., 30, 311–321, 1985.
Fasham, M. J. R., Platt, T., Irwin, B., and Jones, K.: Factors affecting the spatial pattern of the deep chlorophyll maximum in the region of the Azores front, Prog. Oceanogr., 14, 129–165, https://doi.org/10.1016/0079-6611(85)90009-6, 1985.
Fennel, K. and Boss, E.: Subsurface maxima of phytoplankton and chlorophyll: Steady-state solutions from a simple model, Limnol. Oceanogr., 48, 1521–1534, https://doi.org/10.4319/lo.2003.48.4.1521, 2003.
Flory, E. N., Hill, P. S., Milligan, T. G., and Grant, J.: The relationship between floc area and backscatter during a spring phytoplankton bloom, Deep-Sea Res. Pt. I, 51, 213–223, https://doi.org/10.1016/j.dsr.2003.09.012, 2004.
Furuya, K.: Subsurface chlorophyll maximum in the tropical and subtropical western Pacific Ocean: Vertical profiles of phytoplankton biomass and its relationship with chlorophyll a and particulate organic carbon, Mar. Biol., 107, 529–539, https://doi.org/10.1007/bf01313438, 1990.
Gačić, M., Civitarese, G., Miserocchi, S., Cardin, V., Crise, A., and Mauri, E.: The open-ocean convection in the Southern Adriatic: A controlling mechanism of the spring phytoplankton bloom, Cont. Shelf Res., 22, 1897–1908, https://doi.org/10.1016/S0278-4343(02)00050-X, 2002.
Garczarek, L., Dufresne, A., Rousvoal, S., West, N. J., Mazard, S., Marie, D., Claustre, H., Raimbault, P., Post, A. F., Scanlan, D. J., and Partensky, F.: High vertical and low horizontal diversity of Prochlorococcus ecotypes in the Mediterranean Sea in summer, FEMS Microbiol. Ecol., 60, 189–206, https://doi.org/10.1111/j.1574-6941.2007.00297.x, 2007.
Gardner, W. D., Richardson, M. J., and Smith, W. O.: Seasonal patterns of water column particulate organic carbon and fluxes in the Ross Sea, Antarctica, Deep-Sea Res. Pt. II, 47, 3423–3449, https://doi.org/10.1016/S0967-0645(00)00074-6, 2000.
Geider, R. J.: Light and temperature dependence of the carbon to chlorophyll a ratio in microalgae and cyanobacteria: Implications for physiology and growth of phytoplankton, New Phytol., 106, 1–34, 1987.
Geider, R. J.: Quantitative phytoplankton physiology: implications for primary production and phytoplankton growth, ICES Marine Science Symposium, 197, 52–62, 1993.
Geider, R. J., MacIntyre, H. L., and Kana, T. M.: Dynamic model of phytoplankton growth and acclimation: Responses of the balanced growth rate and the chlorophyll a: carbon ratio to light, nutrient-limitation and temperature, Mar. Ecol. Prog. Ser., 148, 187–200, https://doi.org/10.3354/meps148187, 1997.
Golub, G. H. and Van Loan, C. F.: Matrix Computations, The Johns, Baltimore, USA and London, UK, 1996.
Gong, X., Jiang, W., Wang, L., Gao, H., Boss, E., Yao, X., Kao, S.-J., and Shi, J.: Analytical solution of the nitracline with the evolution of subsurface chlorophyll maximum in stratified water columns, Biogeosciences, 14, 2371–2386, https://doi.org/10.5194/bg-14-2371-2017, 2017.
Gordon, H. R. and McCluney, W. R.: Estimation of the Depth of Sunlight Penetration in the Sea for Remote Sensing, Appl. Optics, 14, 413–416, https://doi.org/10.1364/AO.14.000413, 1975.
Gutiérrez-Rodríguez, A., Latasa, M., Estrada, M., Vidal, M., and Marrasé, C.: Carbon fluxes through major phytoplankton groups during the spring bloom and post-bloom in the Northwestern Mediterranean Sea, Deep-Sea Res. Pt. I, 57, 486–500, https://doi.org/10.1016/j.dsr.2009.12.013, 2010.
Hickman, A. E., Moore, C. M., Sharples, J., Lucas, M. I., Tilstone, G. H., Krivtsov, V., and Holligan, P. M.: Primary production and nitrate uptake within the seasonal thermocline of a stratified shelf sea, Mar. Ecol. Prog. Ser., 463, 39–57, https://doi.org/10.3354/meps09836, 2012.
Hill, V. J., Matrai, P. A., Olson, E., Suttles, S., Steele, M., Codispoti, L. A., and Zimmerman, R. C.: Synthesis of integrated primary production in the Arctic Ocean: II. In situ and remotely sensed estimates, Prog. Oceanogr., 110, 107–125, https://doi.org/10.1016/j.pocean.2012.11.005, 2013.
Hodges, B. A. and Rudnick, D. L.: Simple models of steady deep maxima in chlorophyll and biomass, Deep-Sea Res. Pt. I, 51, 999–1015, https://doi.org/10.1016/j.dsr.2004.02.009, 2004.
Holm-Hansen, O. and Hewes, C. D.: Deep chlorophyll a maxima (DCMs) in Antarctic waters: I. Relationships between DCMs and the physical, chemical, and optical conditions in the upper water column, Polar Biol., 27, 699–710, https://doi.org/10.1007/s00300-004-0641-1, 2004.
Huot, Y., Babin, M., Bruyant, F., Grob, C., Twardowski, M. S., and Claustre, H.: Relationship between photosynthetic parameters and different proxies of phytoplankton biomass in the subtropical ocean, Biogeosciences, 4, 853–868, https://doi.org/10.5194/bg-4-853-2007, 2007.
Ignatiades, L., Psarra, S., Zervakis, V., Pagou, K., Souvermezoglou, E., Assimakopoulou, G., and Gotsis-Skretas, O.: Phytoplankton size-based dynamics in the Aegean Sea (Eastern Mediterranean), J. Marine Syst., 36, 11–28, https://doi.org/10.1016/S0924-7963(02)00132-X, 2002.
Johnson, K. and Claustre, H.: Bringing Biogeochemistry into the Argo Age, Eos, 1–7, https://doi.org/10.1029/2016EO062427, 2016.
Johnson, K., Berelson, W., Boss, E., Chase, Z., Claustre, H., Emerson, S., Gruber, N., Körtzinger, A., Perry, M. J., and Riser, S.: Observing Biogeochemical Cycles at Global Scales with Profiling Floats and Gliders: Prospects for a Global Array, Oceanography, 22, 216–225, https://doi.org/10.5670/oceanog.2009.81, 2009.
Johnson, K. S. and Coletti, L. J.: In situ ultraviolet spectrophotometry for high resolution and long-term monitoring of nitrate, bromide and bisulfide in the ocean, Deep-Sea Res. Pt. I, 49, 1291–1305, https://doi.org/10.1016/S0967-0637(02)00020-1, 2002.
Johnson, K. S., Plant, J. N., Coletti, L. J., Jannasch, H. W., Sakamoto, C. M., Riser, S. C., Swift, D. D., Williams, N. L., Boss, E., Haëntjens, N., Talley, L. D., and Sarmiento, J. L.: Biogeochemical sensor performance in the SOCCOM profiling float array, J. Geophys. Res.-Oceans, 122, 6416–6436, https://doi.org/10.1002/2017JC012838, 2017.
Kiefer, D. A., Olson, R. J., and Holm-Hansen, O.: Another look at the nitrite and chlorophyll maxima in the central North Pacific, Deep-Sea Research and Oceanographic Abstracts, 23, 1199–1208, https://doi.org/10.1016/0011-7471(76)90895-0, 1976.
Kimor, B., Berman, T., and Schneller, A.: Phytoplankton assemblages in the deep chlorophyll maximum layers off the Mediterranean coast of Israel, J. Plankton Res., 34, 433–443, https://doi.org/10.1016/0198-0254(87)90913-7, 1987.
Klausmeier, C. A. and Litchman, E.: Algal games: The vertical distribution of phytoplankton in poorly mixed water columns, Limnol. Oceanogr., 46, 1998–2007, https://doi.org/10.4319/lo.2001.46.8.1998, 2001.
Krom, M. D., Kress, N., Brenner, S., and Gordon, L. I.: Phosphorus Limitation of Primary Productivity in the Eastern Mediterranean-Sea, Limnol. Oceanogr., 36, 424–432, https://doi.org/10.4319/lo.1991.36.3.0424, 1991.
Krom, M. D., Emeis, K. C., and Van Cappellen, P.: Why is the Eastern Mediterranean phosphorus limited?, Prog. Oceanogr., 85, 236–244, https://doi.org/10.1016/j.pocean.2010.03.003, 2010.
Lacour, L., Ardyna, M., Stec, K. F., Claustre, H., Prieur, L., Poteau, A., Ribera D'Alcala, M., and Iudicone, D.: Unexpected winter phytoplankton blooms in the North Atlantic subpolar gyre, Nat. Geosci., 10, 836–839, https://doi.org/10.1038/NGEO3035, 2017.
Latasa, M., Gutiérrez-rodríguez, A., Cabello, A. M., and Scharek, R.: Influence of light and nutrients on the vertical distribution of marine phytoplankton groups in the deep chlorophyll maximum, Planet Ocean, 80, 57–62, https://doi.org/10.3989/scimar.04316.01A, 2016.
Lavigne, H., D'Ortenzio, F., Migon, C., Claustre, H., Testor, P., D'Alcalà, M. R., Lavezza, R., Houpert, L., and Prieur, L.: Enhancing the comprehension of mixed layer depth control on the Mediterranean phytoplankton phenology, J. Geophys. Res.-Oceans, 118, 3416–3430, https://doi.org/10.1002/jgrc.20251, 2013.
Lavigne, H., D'Ortenzio, F., Ribera D'Alcalà, M., Claustre, H., Sauzède, R., and Gacic, M.: On the vertical distribution of the chlorophyll a concentration in the Mediterranean Sea: a basin-scale and seasonal approach, Biogeosciences, 12, 5021–5039, https://doi.org/10.5194/bg-12-5021-2015, 2015.
Leblanc, K., Quéguiner, B., Diaz, F., Cornet, V., Michel-Rodriguez, M., Durrieu de Madron, X., Bowler, C., Malviya, S., Thyssen, M., Grégori, G., Rembauville, M., Grosso, O., Poulain, J., de Vargas, C., Pujo-Pay, M., and Conan, P.: Nanoplanktonic diatoms are globally overlooked but play a role in spring blooms and carbon export, Nat. Commun., 9, 1–12, https://doi.org/10.1038/s41467-018-03376-9, 2018.
Letelier, R. M., Karl, D. M., Abbott, M. R., and Bidigare, R. R.: Light driven seasonal patterns of chlorophyll and nitrate in the lower euphotic zone of the North Pacific Subtropical Gyre, Limnol. Oceanogr., 49, 508–519, https://doi.org/10.4319/lo.2004.49.2.0508, 2004.
Lewis, M. R., Cullen, J. J., and Platt, T.: Phytoplankton and thermal structure in the upper ocean: Consequences of nonuniformity in chlorophyll profile, J. Geophys. Res.-Oceans, 88, 2565–2570, https://doi.org/10.1029/JC088iC04p02565, 1983.
Li, Q. P. and Hansell, D. A.: Mechanisms controlling vertical variability of subsurface chlorophyll maxima in a mode-water eddy, J. Marine Res., 74, 175–199, https://doi.org/10.1357/002224016819594827, 2016.
Loisel, H. and Morel, A.: Light scattering and chlorophyll concentration in case 1 waters: A reexamination, Limnol. Oceanogr., 43, 847–858, https://doi.org/10.4319/lo.1998.43.5.0847, 1998.
Longhurst, A. R. and Glen Harrison, W.: The biological pump: Profiles of plankton production and consumption in the upper ocean, Prog. Oceanogr., 22, 47–123, https://doi.org/10.1016/0079-6611(89)90010-4, 1989.
Marty, J. C., Chiavérini, J., Pizay, M. D., and Avril, B.: Seasonal and interannual dynamics of nutrients and phytoplankton pigments in the western Mediterranean Sea at the DYFAMED time-series station (1991–1999), Deep-Sea Res. Pt. II, 49, 1965–1985, https://doi.org/10.1016/S0967-0645(02)00022-X, 2002.
Marty, J. C., Garcia, N., and Raimbault, P.: Phytoplankton dynamics and primary production under late summer conditions in the NW Mediterranean Sea, Deep-Sea Res. Pt. I, 55, 1131–1149, https://doi.org/10.1016/j.dsr.2008.05.001, 2008.
Mayot, N., D'Ortenzio, F., Uitz, J., Gentili, B., Ras, J., Vellucci, V., Golbol, M., Antoine, D., and Claustre, H.: Influence of the phytoplankton community structure on the spring and annual primary production in the Northwestern Mediterranean Sea, J. Geophys. Res.-Oceans, 122, 1–17, https://doi.org/10.1002/2016JC012668, 2017a.
Mayot, N., D'Ortenzio, F., Taillandier, V., Prieur, L., Pasqueron de Fommervault, O., Claustre, H., Bosse, A., Testor, P., and Conan, P.: Physical and biogeochemical controls of the phytoplankton blooms in North-Western Mediterranean Sea: A multiplatform approach over a complete annual cycle (2012-2013 DEWEX experiment), J. Geophys. Res.-Oceans, 122, https://doi.org/10.1002/2016JC012052, 2017b.
Mignot, A., Claustre, H., D'Ortenzio, F., Xing, X., Poteau, A., and Ras, J.: From the shape of the vertical profile of in vivo fluorescence to Chlorophyll-a concentration, Biogeosciences, 8, 2391–2406, https://doi.org/10.5194/bg-8-2391-2011, 2011.
Mignot, A., Claustre, H., Uitz, J., Poteau, A., D'Ortenzio, F., and Xing, X.: Understanding the seasonal dynamics of phytoplankton biomass and the deep chlorophyll maximum in oligotrophic environments: A Bio-Argo float investigation, Global Biogeochem. Cy., 28, 1–21, https://doi.org/10.1002/2013GB004781, 2014.
Mignot, A., Ferrari, R., and Claustre, H.: Floats with bio-optical sensors reveal what processes trigger the North Atlantic bloom, Nat. Commun., 9, 1–9, https://doi.org/10.1038/s41467-017-02143-6, 2018.
Mikaelyan, A. S. and Belyaeva, G. A.: Chlorophyll a content in cells of Antarctic phytoplankton, Polar Biol., 15, 437–445, https://doi.org/10.1007/BF00239721, 1995.
Millot, C.: Circulation in the Western Mediterranean Sea, J. Marine Syst., 20, 423–442, https://doi.org/10.1016/S0924-7963(98)00078-5, 1999.
Moore, L. R. and Chisholm, S. W.: Photophysiology of the marine cyanobacterium Prochlorococcus: Ecotypic differences among cultured isolates, Limnol. Oceanogr., 44, 628–638, https://doi.org/10.4319/lo.1999.44.3.0628, 1999.
Morel, A. and Ahn, Y.: Optics of heterotrophic nanoftagellates and ciliates: A tentative assessment of their scattering role in oceanic waters compared to those of bacterial and algal cells, J. Marine Res., 49, 177–202, 1991.
Morel, A. and André, J.-M.: Pigment distribution and Primary Production in the Western Mediterranean as Derived and Modeled From Coastal Zone Color Scanner Observations, J. Geophys. Res., 96, 12685–12698, https://doi.org/10.1029/91JC00788, 1991.
Morel, A. and Berthon, J.-F.: Surface pigments, algal biomass profiles, and potential production of the euphotic layer: Relationships reinvestigated in view of remote-sensing applications, Limnol. Oceanogr., 34, 1545–1562, https://doi.org/10.4319/lo.1989.34.8.1545, 1989.
Morel, A. and Bricaud, A.: Inherent optical properties of algal cells including picoplankton: theoretical and experimental results, Can. B. Fish. Aquat. Sci., 214, 521–559, 1986.
Morris, A. W. and Riley, J. P.: The determination of nitrate in sea water, Anal. Chim. Acta, 29, 272–279, https://doi.org/10.1016/S0003-2670(00)88614-6, 1963.
NREL: SOLPOS 2.0 Documentation, Technical Report, 2000.
Organelli, E., Claustre, H., Bricaud, A., Schmechtig, C., Poteau, A., Xing, X., Prieur, L., D'Ortenzio, F., Dall'Olmo, G., and Vellucci, V.: A novel near real-time quality-control procedure for radiometric profiles measured by Bio-Argo floats: protocols and performances, J. Atmos. Ocean. Tech., 33, 937–951, https://doi.org/10.1175/JTECH-D-15-0193.1, 2016.
Organelli, E., Claustre, H., Bricaud, A., Barbieux, M., Uitz, J., D'Ortenzio, F., and Dall'Olmo, G.: Bio-optical anomalies in the world's oceans: An investigation on the diffuse attenuation coefficients for downward irradiance derived fromBiogeochemical Argo float measurements, J. Geophys. Res.-Oceans, 122, 2017–2033, https://doi.org/10.1002/2016JC012629, 2017a.
Organelli, E., Barbieux, M., Claustre, H., Schmechtig, C., Poteau, A., Bricaud, A., Boss, E., Briggs, N., Dall'Olmo, G., D'Ortenzio, F., Leymarie, E., Mangin, A., Obolensky, G., Penkerc'h, C., Prieur, L., Roesler, C., Serra, R., Uitz, J., and Xing, X.: Two databases derived from BGC-Argo float measurements for marine biogeochemical and bio-optical applications, Earth Syst. Sci. Data, 9, 861–880, https://doi.org/10.5194/essd-9-861-2017, 2017b.
Parslow, J. S., Boyd, P. W., Rintoul, S. R., and Griffiths, F. B.: A persistent subsurface chlorophyll maximum in the Interpolar Frontal Zone south of Australia: Seasonal progression and implications for phytoplankton-light-nutrient interactions, J. Geophys. Res.-Oceans, 106, 31543–31557, https://doi.org/10.1029/2000JC000322, 2001.
Pasqueron de Fommervault, O., D'Ortenzio, F., Mangin, A., Serra, R., Migon, C., Claustre, H., Lavigne, H., Ribera d'Alcala, M., Prieur, L., Taillandier, V., Schmechtig, C., Poteau, A., Leymarie, E., Dufour, A., Besson, F., and Obolensky, G.: Seasonal variability of nutrient concentrations in the Mediterranean Sea: Contribution of Bio-Argo floats, J. Geophys. Res.-Oceans, 120, 8528–8550, https://doi.org/10.1002/2015JC011103, 2015a.
Pasqueron de Fommervault, O., Migon, C., D'Ortenzio, F., Ribera d'Alcalà, M., and Coppola, L.: Temporal variability of nutrient concentrations in the northwestern Mediterranean sea (DYFAMED time-series station), Deep-Sea Res. Pt. I, 100, 1–12, https://doi.org/10.1016/j.dsr.2015.02.006, 2015b.
Pearson, K.: On lines and planes of closest fit to systems of points in space, Philos. Mag., 2, 559–572, https://doi.org/10.1080/14786440109462720, 1901.
Perez, V., Fernandez, E., Maranon, E., Moran, X. A. G., and Zubkov, M. V.: Vertical distribution of phytoplankton biomass, production and growth in the Atlantic subtropical gyres, Deep-Sea Res. Pt. I, 53, 1616–1634, https://doi.org/10.1016/j.dsr.2006.07.008, 2006.
Pollehne, F., Klein, B., and Zeitzschel, B.: Low light adaptation and export production in the deep chlorophyll maximum layer in the northern Indian Ocean, Deep-Sea Res. Pt. II, 40, 737–752, https://doi.org/10.1016/0967-0645(93)90055-R, 1993.
Psarra, S., Tselepides, A., and Ignatiades, L.: Primary productivity in the oligotrophic Cretan Sea (NE Mediterranean): seasonal and interannual variability, Prog. Oceanogr., 46, 187–204, https://doi.org/10.1016/S0079-6611(00)00018-5, 2000.
Pujo-Pay, M., Conan, P., Oriol, L., Cornet-Barthaux, V., Falco, C., Ghiglione, J.-F., Goyet, C., Moutin, T., and Prieur, L.: Integrated survey of elemental stoichiometry (C, N, P) from the western to eastern Mediterranean Sea, Biogeosciences, 8, 883–899, https://doi.org/10.5194/bg-8-883-2011, 2011.
Quéguiner, B., Tréguer, P., Peeken, I., and Scharek, R.: Biogeochemical dynamics and the silicon cycle in the Atlantic sector of the Southern Ocean during austral spring 1992, Deep-Sea Res. Pt. II, 44, 69–89, https://doi.org/10.1016/S0967-0645(96)00066-5, 1997.
Raimbault, P., Coste, B., Boulhadid, M., and Boudjellal, B.: Origin of high phytoplankton concentration in deep chlorophyll maximum (DCM) in a frontal region of the Southwestern Mediterranean Sea (algerian current), Deep-Sea Res. Pt. I, 40, 791–804, https://doi.org/10.1016/0967-0637(93)90072-B, 1993.
Roesler, C., Uitz, J., Claustre, H., Boss, E., Xing, X., Organelli, E., Briggs, N., Bricaud, A., Schmechtig, C., Poteau, A., D'Ortenzio, F., Ras, J., Drapeau, S., Haëntjens, N., and Barbieux, M.: Recommendations for obtaining unbiased chlorophyll estimates from in situ chlorophyll fluorometers: A global analysis of WET Labs ECO sensors, Limnol. Oceanogr.-Meth., 15, 572–585, https://doi.org/10.1002/lom3.10185, 2017.
Roesler, C. S. and Barnard, A. H.: Optical proxy for phytoplankton biomass in the absence of photophysiology: Rethinking the absorption line height, Methods in Oceanography, 7, 79–94, https://doi.org/10.1016/j.mio.2013.12.003, 2013.
Ryabov, A. B.: Phytoplankton competition in deep biomass maximum, Theor. Ecol., 5, 373–385, https://doi.org/10.1007/s12080-012-0158-0, 2012.
Sakamoto, C. M., Johnson, K. S., and Coletti, L. J.: Improved algorithm for the computation of nitrate concentrations in seawater using an in situ ultraviolet spectrophotometer, Limnol. Oceanogr.-Meth., 7, 132–143, https://doi.org/10.4319/lom.2009.7.132, 2009.
Sakamoto, C. M., Johnson, K. S., Coletti, L. J., and Jannasch, H. W.: Pressure correction for the computation of nitrate concentrations in seawater using an in situ ultraviolet spectrophotometer, Limnol. Oceanogr.-Meth., 15, 897–902, https://doi.org/10.1002/lom3.10209, 2017.
Sathyendranath, S., Stuart, V., Nair, A., Oka, K., Nakane, T., Bouman, H., Forget, M. H., Maass, H., and Platt, T.: Carbon-to-chlorophyll ratio and growth rate of phytoplankton in the sea, Mar. Ecol. Prog. Ser., 383, 73–84, https://doi.org/10.3354/meps07998, 2009.
Schmechtig, C., Poteau, A., Claustre, H., D'Ortenzio, F., and Boss, E.: Processing Bio-Argo chlorophyll a concentration at the DAC Level, Argo Data Management, 1–22, https://doi.org/10.13155/39468, 2015.
Schmechtig, C., Thierry, V., and The Bio-Argo Team: Argo Quality Control Manual for Biogeochemical Data, Argo Data Management, 1–54, https://doi.org/10.13155/40879, 2016a.
Schmechtig, C., Poteau, A., Claustre, H., D'Ortenzio, F., Dall'Olmo, G., and Boss, E.: Processing Bio-Argo particle backscattering at the DAC level Version, Argo Data Management, 1–13, https://doi.org/10.13155/39459, 2016b.
Severin, T., Kessouri, F., Rembauville, M., Sánchez-Pérez, E. D., Oriol, L., Caparros, J., Pujo-Pay, M., Ghiglione, Jean-François D'Ortenzio, F., Taillandier, V., Mayot, N., Durrieu De Madron, X., Ulses, C. Estournel, C., and Conan, P.: Open-ocean convection process: a driver of the winter nutrient supply and the spring phytoplankton distribution in the Northwestern Mediterranean Sea, J. Geophys. Res., 122, 4587–4601, https://doi.org/10.1002/2014JC010094, 2017.
Siegel, D. A., Maritorena, S., Nelson, N. B., and Behrenfeld, M. J.: Independence and interdependencies among global ocean color properties: Reassessing the bio-optical assumption, J. Geophys. Res.-Oceans, 110, 1–14, https://doi.org/10.1029/2004JC002527, 2005.
Siokou-Frangou, I., Christaki, U., Mazzocchi, M. G., Montresor, M., Ribera d'Alcalá, M., Vaqué, D., and Zingone, A.: Plankton in the open Mediterranean Sea: a review, Biogeosciences, 7, 1543–1586, https://doi.org/10.5194/bg-7-1543-2010, 2010.
Stramski, D. and Kiefer, D. A.: Light scattering by microorganisms in the open ocean, Prog. Oceanogr., 28, 343–383, https://doi.org/10.1016/0079-6611(91)90032-H, 1991.
Stramski, D., Reynolds, R. A., Kahru, M., and Mitchell, B. G.: Estimation of Particulate Organic Carbon in the Ocean from Satellite Remote Sensing, Science, 285, 239–242, 1999.
Stramski, D., Bricaud, A., and Morel, A.: Modeling the inherent optical properties of the ocean based on the detailed composition of the planktonic community, Appl. Optics, 40, 2929–2945, https://doi.org/10.1364/AO.40.002929, 2001.
Stramski, D., Boss, E., Bogucki, D., and Voss, K. J.: The role of seawater constituents in light backscattering in the ocean, Prog. Oceanogr., 61, 27–56, https://doi.org/10.1016/j.pocean.2004.07.001, 2004.
Taillandier, V., Wagener, T., D'Ortenzio, F., Mayot, N., Legoff, H., Ras, J., Coppola, L., Pasqueron de Fommervault, O., Schmechtig, C., Diamond, E., Bittig, H., Lefevre, D., Leymarie, E., Poteau, A., and Prieur, L.: Hydrography and biogeochemistry dedicated to the Mediterranean BGC-Argo network during a cruise with RV Tethys 2 in May 2015, Earth Syst. Sci. Data, 10, 627–641, https://doi.org/10.5194/essd-10-627-2018, 2018.
Tanhua, T., Hainbucher, D., Schroeder, K., Cardin, V., Álvarez, M., and Civitarese, G.: The Mediterranean Sea system: a review and an introduction to the special issue, Ocean Sci., 9, 789–803, https://doi.org/10.5194/os-9-789-2013, 2013.
Tripathy, S. C., Pavithran, S., Sabu, P., Pillai, H. U. K., Dessai, D. R. G., and Anilkumar, N.: Deep chlorophyll maximum and primary productivity in Indian ocean sector of the southern ocean: Case study in the subtropical and polar front during austral summer 2011, Deep-Sea Res. Pt. II, 118, 240–249, https://doi.org/10.1016/j.dsr2.2015.01.004, 2015.
Uitz, J., Claustre, H., Morel, A., and Hooker, S. B.: Vertical distribution of phytoplankton communities in open ocean: An assessment based on surface chlorophyll, J. Geophys. Res., 111, 1–23, https://doi.org/10.1029/2005JC003207, 2006.
Uitz, J., Claustre, H., Griffiths, F. B., Ras, J., Garcia, N., and Sandroni, V.: A phytoplankton class-specific primary production model applied to the Kerguelen Islands region (Southern Ocean), Deep-Sea Res. Pt. I, 56, 541–560, https://doi.org/10.1016/j.dsr.2008.11.006, 2009.
Vaillancourt, R. D., Brown, C. W., Guillard, R. R. L., and Balch, W. M.: Light backscattering properties of marine phytoplankton: relationships to cell size, chemical composition and taxonomy, J. Plankton Res., 26, 191–212, https://doi.org/10.1093/plankt/fbh012, 2004.
Videau, C., Sournia, A., Prieur, L., and Fiala, M.: Phytoplankton and primary production characteristics at selected sites in the geostrophic Almeria-Oran front system (SW Mediterranean Sea), J. Marine Syst., 5, 235–250, https://doi.org/10.1016/0924-7963(94)90049-3, 1994.
Westberry, T. K., Schultz, P., Behrenfeld, M. J., Dunne, J. P., Hiscock, M. R., Maritorena, S., Sarmiento, J. L., and Siegel, D. A.: Annual cycles of phytoplankton biomass in the subarctic Atlantic and Pacific Ocean, Global Biogeochem. Cy., 30(2), 175–190, https://doi.org/10.1002/2015GB005276, 2016.
Weston, K., Fernand, L., Mills, D. K., Delahunty, R., and Brown, J.: Primary production in the deep chlorophyll maximum of the central North Sea, J. Plankton Res., 27, 909–922, https://doi.org/10.1093/plankt/fbi064, 2005.
Whitmire, A. L., Pegau, W. S., Karp-Boss, L., Boss, E., and Cowles, T. J.: Spectral backscattering properties of marine phytoplankton cultures, Opt. Express, 18, 15073–15093, https://doi.org/10.1364/OE.18.015073, 2010.
Winn, C. D., Campbell, L., Christian, J. R., Letelier, R. M., Hebel, D. V, Dore, J. E., Fujieki, L., and Karl, D. M.: Seasonal variability in the phytoplankton community of the North Pacific Subtropical Gyre, Global Biogeochem. Cy., 9, 605–620, https://doi.org/10.1029/95gb02149, 1995.
Xing, X., Morel, A., Claustre, H., Antoine, D., D'Ortenzio, F., Poteau, A., and Mignot, A.: Combined processing and mutual interpretation of radiometry and fluorimetry from autonomous profiling Bio-Argo floats: Chlorophyll a retrieval, J. Geophys. Res., 116, 1–14, https://doi.org/10.1029/2010JC006899, 2011.
Xing, X., Claustre, H., Blain, S., D'Ortenzio, F., Antoine, D., Ras, J., and Guinet, C.: Quenching correction for in vivo chlorophyll fluorescence acquired by autonomous platforms: A case study with instrumented elephant seals in the Kerguelen region (Southern Ocean), Limnol. Oceanogr.-Meth., 10, 483–495, https://doi.org/10.4319/lom.2012.10.483, 2012.
Zielinski, O., Voß, D., Saworski, B., Fiedler, B., and Körtzinger, A.: Computation of nitrate concentrations in turbid coastal waters using an in situ ultraviolet spectrophotometer, J. Sea Res., 65, 456–460, https://doi.org/10.1016/j.seares.2011.04.002, 2011.