the Creative Commons Attribution 4.0 License.
the Creative Commons Attribution 4.0 License.
 | 07 May 2019
The importance of mineral determinations to PROFILE base cation weathering release rates: a case study
Sophie Casetou-Gustafson
Cecilia Akselsson
Stephen Hillier
Bengt A. Olsson
Accurate estimates of base cation weathering rates in forest soils are crucial for policy decisions on sustainable biomass harvest levels and for calculations of critical loads of acidity. The PROFILE model is one of the most frequently used methods to quantify weathering rates, where the quantitative mineralogical input has often been calculated by the A2M (“Analysis to Mineralogy”) program based solely on geochemical data. The aim of this study was to investigate how uncertainties in quantitative mineralogy, originating from modeled mineral abundance and assumed stoichiometry, influence PROFILE weathering estimate, by using measured quantitative mineralogy by X-ray powder diffraction (XRPD) as a reference. Weathering rates were determined for two sites, one in northern (Flakaliden) and one in southern (Asa) Sweden. At each site, 3–4 soil profiles were analyzed at 10 cm depth intervals. Normative quantitative mineralogy was calculated from geochemical data and qualitative mineral data with the A2M program using two sets of qualitative mineralogical data inputs to A2M: (1) a site-specific mineralogy based on information about mineral identification and mineral chemical composition as determined directly by XRPD and electron microprobe analysis (EMPA), and (2) regional mineralogy, representing the assumed minerals present and assumed mineral chemical compositions for large geographical areas in Sweden, as per previous published studies. Arithmetic means of the weathering rates determined from A2M inputs (WA2M) were generally in relatively close agreement with those (WXRPD) determined by inputs based on direct XRPD and EMPA measurements. The hypothesis that using site-specific instead of regional mineralogy will improve the confidence in mineral data input to PROFILE was supported for Flakaliden. However, at Asa, site-specific mineralogies reduced the discrepancy for Na between WA2M and WXRPD but produced larger and significant discrepancies for K, Ca and Mg. For Ca and Mg the differences between weathering rates based on different mineralogies could be explained by differences in the content of some specific Ca- and Mg-bearing minerals, in particular amphibole, apatite, pyroxene and illite. Improving the accuracy in the determination of these minerals would reduce weathering uncertainties. High uncertainties in mineralogy, due for example to different A2M assumptions, had surprisingly little effect on the predicted weathering of Na- and K-bearing minerals. This can be explained by the fact that the weathering rate constants for the minerals involved, e.g. K feldspar and micas, are similar in PROFILE. Improving the description of the dissolution rate kinetics of the plagioclase mineral group as well as major K-bearing minerals (K feldspars and micas) should be a priority to help improve future weathering estimates with the PROFILE model.
- Article
(2411 KB) - Full-text XML
-
Supplement
(2397 KB) - BibTeX
- EndNote


The dissolution of minerals in soils and rocks during weathering represents, together with deposition, the most important long-term supply of base cations for plant growth that also acts as a buffer against soil and water acidification. Quantifying weathering rates is therefore of key importance to guide modern forestry demands on biomass removal by helping to identify threshold levels that are sustainable for base cation removal from soils and waters. With the introduction of the harvest of forest biomass for energy production that includes whole-tree harvest and stump extraction, about 2–3 times more nutrients are exported from the forest compared to stem-only harvest. As a result, issues of acidification and base cation supply are exacerbated and the sustainability of this practice is questioned (Röser, 2008; de Jong et al., 2017). Regional nutrient balance calculations for Sweden have indicated that net losses of base cations from forest soils can occur in stem-only harvest scenarios, and this trend would be substantially exacerbated and more frequent in whole-tree harvesting scenarios, largely due to low weathering rates (Sverdrup and Rosén, 1998; Akselsson et al., 2007a, b). Furthermore, the same effect occurs both under current and projected future climate conditions (Akselsson et al., 2016).
The weathering rates included in these nutrient balance calculations are in most cases based on the PROFILE model. This is a process-oriented model calculating steady-state weathering rates using transition state theory and physical and geochemical properties of the soil such as temperature; soil moisture; soil mineralogy and concentrations of base cation, hydrogen and organic acids (Sverdrup, 1996). This model has been widely applied in Europe, Canada and the US during the last several decades or more of weathering research (Olsson et al., 1993; Langan et al., 1995; Kolka et al., 1996; Starr et al., 1998; Sverdrup and Rosén, 1998; Whitfield et al., 2006; Akselsson et al., 2007a; Koseva et al., 2010; Stendahl et al., 2013). In some cases nutrient balance calculations have also been based on the depletion method (Olsson et al., 1993).
Reliable weathering rate estimates are crucial for the accuracy of future nutrient budget calculations (Futter et al., 2012). Regarding the accuracy of the PROFILE model, the importance of high accuracy in physical input parameters for the modeled weathering rate outputs has been highlighted by Hodson et al. (1996) and Jönsson et al. (1995). Among the various parameters Hodson et al. (1996) noted that the weathering response of the entire soil profile depends critically on its mineralogy and as such any choice of the model user about mineralogical input data may affect the model outcome significantly (Hodson et al., 1997). In most cases the mineralogical input to the PROFILE model is also derived by modeling yet little attention has been given to the influence of modeled versus directly measured mineralogical input data on calculated base cation release rates.
The most widely used method for direct quantitative mineralogical analysis of soil samples is X-ray powder diffraction, and the accuracy that can be achieved has been demonstrated in round robin tests, most notably in the Reynolds Cup competition (McCarty, 2002; Kleeberg, 2005; Omotoso et al., 2006, Raven and Self, 2017). Casetou-Gustafson et al. (2018) made some independent assessment of the accuracy of their own XRPD data by geochemical cross validation (i.e., the mineral budgeting approach of Andrist-Rangel et al., 2006). Nonetheless, we should stress that like all analytical methods the determined weight fractions of minerals identified in a soil sample by XRPD will have an associated uncertainty. Additionally, minerals present in minor amounts, nominally <1 % by weight, may fall below the lower limit of detection of the XPRD method.
Due mainly to the relative ease of measurement and consequent ready availability of total element geochemical data on soils, indirect methods of determining quantitative soil mineralogy, such as so-called “normative” geochemical calculations have been widely used to generate mineralogical data for use in the PROFILE model. One such method is the normative “Analysis to Mineralogy” (A2M) program (Posch and Kurz, 2007) that has commonly been used in PROFILE applications (Stendahl et al., 2013; Zanchi et al., 2014; Yu et al., 2016, 2018; Kronnäs et al., 2019). Based on a quantitative geochemical analysis of a soil sample, typically expressed in weight percent oxides, as well as on some assessment of the available minerals in the soil sample (minerals present) and their stoichiometry (chemical compositions), A2M calculates all possible mineralogical compositions for the soil sample. Thus the A2M output for a given soil sample input has multiple solutions and can be described as a multidimensional mineralogical solution space. This necessitates a choice when using A2M output in applications such as weathering rate studies, the convention for which has been to use the geometric mean mineralogical compositions (e.g. Stendahl et al., 2013). Casetou-Gustafson et al. (2018) compared the output of A2M with directly determined XRPD mineralogies at two sites, applying A2M in two different ways. In the first case the information on available minerals in the model input was obtained from direct XRPD mineral identifications and information on mineral stoichiometry from direct microprobe analysis of the minerals at the specific site (hereafter denoted “site-specific”). In the second case the mineral stoichiometry and mineral identity were both assumed based on an expert assessment of the probable mineralogy at the regional scale as given by Warfvinge and Sverdrup (1995), hereafter denoted “regional”. Casetou-Gustafson et al. (2018) concluded that using A2M in combination with regional input data yielded results with large deviations from directly (XRPD) measured quantitative mineralogy, particularly for two of the major minerals, K feldspar and dioctahedral mica. When site-specific mineralogical input data were used, measured and modeled quantitative mineralogy showed a better correspondence for most minerals. For a specific mineral and a specific site, however, the bias in determination of quantitative mineralogy might be significant depending on the accuracy of input data to A2M, i.e., total geochemistry and/or mineral stoichiometry (Casetou-Gustafson et al., 2018). Potential errors like these in mineralogical input data might be assumed to affect the calculated weathering for different base cations significantly.
Table 1Characteristics of the study sites.
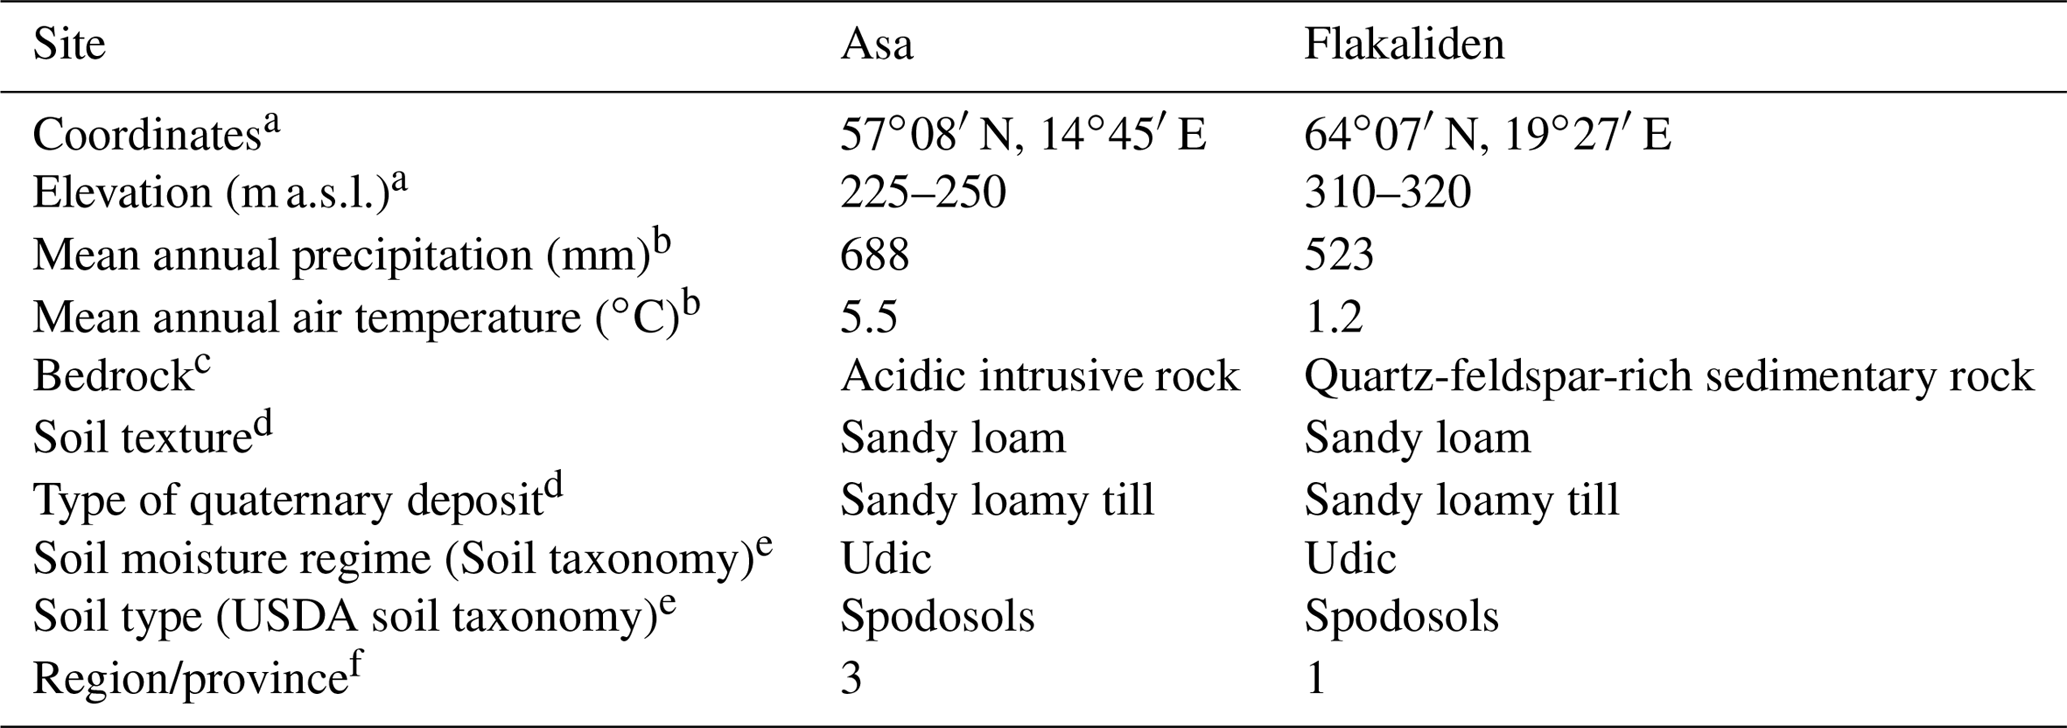
a Bergh et al. (2005). b Long-term averages of annual precipitation and temperature data (1961–1990) from the nearest SMHI meteorological stations (Asa: Berg; Flakaliden: Kulbäcksliden). c SGU bedrock map (1 : 50 000). dSoil texture based on own particle size distribution analysis by wet sieving according to ISO 11277. e USDA Soil Conservation service (2014). f Warfvinge and Sverdrup (1995).
In the present study, we used the different mineralogical data from Casetou-Gustafson et al. (2018) to model weathering rates of soils with the PROFILE model. Rates calculated based on measured mineral abundances using quantitative XRPD in combination with measured mineral elemental compositions are taken as “reference” weathering rates to which other rates are compared. Samples for this study were collected from podzolized till soils from eight soil profiles at two forest sites in northern and southern Sweden, respectively.
The primary objective of this study was to describe and quantify the effect of differences in mineralogy input on PROFILE weathering rates, leaving all other input parameters of the PROFILE model constant to isolate the effects of variation in input of mineral stoichiometry and abundance. The first specific aim was to determine the uncertainties in weathering rates caused by uncertainties in normative quantitative mineralogy. This was approached by comparing PROFILE runs using modeled mineralogies based on the presence of minerals of a specific site or a larger geographic region (i.e., site-specific and regional mineralogy) with PROFILE runs using the directly measured mineralogy. The latter was assumed to represent the “true” mineralogy at each site. The comparison of PROFILE weathering rates, based on XRPD versus A2M mineralogy, was done using 1000 random solutions per sample from the entire multidimensional A2M mineralogical solution space. In the following, weathering rates calculated by PROFILE based on XRPD and A2M mineralogies are denoted WXRPD and WA2M, respectively.
A second specific aim was to investigate how the over- or underestimation of WA2M in relation to WXRPD mirrors the over- or underestimation of mineral contents estimated with A2M.
The following hypotheses were made:
-
PROFILE weathering rates obtained with normative quantitative mineralogy, calculated based on site-specific mineralogical information about mineral identity and mineral stoichiometry, are more similar to the reference weathering rates than PROFILE runs obtained with normative quantitative mineralogy calculated based on regional information only.
-
Over- and underestimations of weathering rates of different base cations by the PROFILE model can be explained by over- or underestimations of mineral contents of a few specific minerals.
2.1 Study sites
Two experimental forest sites, Asa in southern and Flakaliden in northern Sweden, were used for the study (Table 1). Both sites have Norway spruce (Picea abies (L.) Karst) stands of uniform age, but differ in climate. Flakaliden is located in the boreal zone with long cold winters, whereas Asa is located in the hemiboreal zone. The soils have similar texture (sandy loamy till), soil types (Spodosols) and moisture conditions. According to the geographical distribution of mineralogy types in Sweden the sites belong to different regions (Warfvinge and Sverdrup, 1995). The experiments, which started in 1986, aimed at investigating the effects of optimized water and nutrient supply on tree growth and carbon cycling in Norway spruce forests (Linder, 1995; Albaugh et al., 2009). The sites are incorporated in the Swedish Infrastructure for Ecosystem Science (SITES).
2.2 Soil sampling and stoniness determination
Soil sampling was performed in October 2013 and March 2014 in the border zone of four plots each of the sites. Plots selected for sampling were untreated control plots (K1 and K4 at Asa, 10B and 14B at Flakaliden) and fertilized “F” plots (F3 and F4 at Asa, 15A and 11B at Flakaliden). A rotary drill was used in order to extract one intact soil core per plot (17 cm inner diameter) expect for plots K4, F3 and F4 at the Asa site. A 1 m × 1 m soil pit was excavated at each of the three latter plots due to inaccessible terrain for forest machinery. The maximum mineral soil depth varied between 70 and 90 cm in Flakaliden and between 90 and 100 cm in Asa.
The volume of stones and boulders was determined with the penetration method by Viro (1952), and by applying penetration data to the functions by Stendahl et al. (2009). A metal rod was penetrated at 16 points per plot into the soil until it was not possible to penetrate the underground any further, or to the depth 30 cm. There was a higher average stoniness at Flakaliden than Asa (39 % vol compared to 29 % vol in Asa) that could partially explain the lower maximum sampling depth at Flakaliden.
2.3 Sample preparation
Soils samples for chemical analyses were taken at 10 cm depth intervals in the mineral soil. Prior to analysis all soil samples were dried at 30–40 ∘C and sieved at 2 mm mesh. Soil chemical analyses were performed on the fine-earth fraction (<2 mm).
2.4 Analysis of geochemistry, total carbon and soil texture
Total carbon was determined using a LECO elemental analyzer according to ISO 10694. Analysis of total geochemical composition, conducted by ALS Scandinavia AB, was carried out by inductively coupled plasma spectrometry (ICP-MS). Prior to analyses, the samples were ignited at 1000 ∘C to oxidize organic matter and ground with an agate mortar. Particle size distribution was analyzed by wet sieving and sedimentation (Pipette method) in accordance with ISO 11277. More detail about the analytical procedure was given by Casetou-Gustafson et al. (2018).
2.5 Determination of quantitative mineralogy
A detailed description of methods used to quantify mineralogy of the samples was given by Casetou et al. (2018) and these are described in brief below.
2.5.1 Measured mineralogy
Quantitative soil mineralogy was determined with the X-ray powder diffraction technique, XRPD (MXRPD) (Hillier, 1999, 2003) (Table S1a, b). Preparation of samples for determination of XRPD patterns was made from spray-drying slurries of micronized soil samples (<2 mm) in ethanol. Quantitative mineralogical analysis of the diffraction data was performed using a full pattern fitting approach (Omotoso et al., 2006). In the fitting process, the measured diffraction pattern is modeled as a weighted sum of previously recorded and carefully verified standard reference patterns of the prior identified mineral components. The chemical composition of the various minerals present in the soils was determined by electron microprobe analysis (EMPA) (Table S6).
2.5.2 Calculated mineralogy
The A2M program (Posch and Kurz, 2007) was used to calculate quantitative mineralogical composition (MA2M) from geochemical data. Based on a set of pre-determined data on mineral identity and stoichiometry, the model outcome is a range of equally possible mineralogical compositions. The multidimensional structure of this normative mineralogy model is a consequence of the number of minerals larger than the number of analyzed elements, where a specific element can often be contained in several different minerals. A system of linear equations is used to construct an M–N dimensional solution space (dimension M= number of minerals, dimension N= number of oxides). In this study we used 1000 solutions to cover the range of possible quantitative mineralogies that may occur at a specific site.
A2M was used to calculate 1000 quantitative mineralogies each for two different sets of mineral identity and element stoichiometry, MA2M-reg (regional) and MA2M-site (site-specific). Regional mineralogy refers to the mineral identity and stoichiometry for the four major mineralogical provinces in Sweden as suggested by Warfvinge and Sverdrup (1995), of which Asa and Flakaliden belong to different regions (Table S5). Site-specific mineralogy refers to the measured mineral identity and stoichiometry determined by the XRPD and electron microprobe analyses of the two sites (Table S6) (Casetou-Gustafson et al., 2018).
2.6 Estimation of weathering rates with PROFILE
2.6.1 PROFILE model description
The biogeochemical PROFILE model can be used to study the steady-state weathering (i.e., stoichiometric mineral dissolution) of soil profiles, as weathering is known to be primarily determined by the physical soil properties at the interface of wetted mineral surfaces and the soil solution. PROFILE is a multilayer model, and thus, for each soil layer, parameters are specified based on field measurements and estimation methods (Warfvinge and Sverdrup, 1995). Furthermore, isotropic, well mixed soil solution conditions are assumed to prevail in each layer as well as surface limited dissolution in line with early views by Aagard and Helgeson (1982) and Cou and Wollast (1985) (Sverdrup, 1996). Based on these major assumptions, PROFILE calculates chemical weathering rates from a series of kinetic reactions that are described by laboratory-determined dissolution rate coefficients and soil solution equilibria (i.e., transition state theory) (Sverdrup and Warfvinge, 1993). The PROFILE version (September 2018) that was used in this study is coded to produce information on the weathering contribution of specific minerals, which allowed us to test our second hypothesis. This version is based on the weathering rates of 15 minerals. Of these, apatite, pyroxene, illite, dolomite and calcite were not found at the two study sites according to XRPD data (Table S1).
2.6.2 PROFILE parameter estimation
The only parameter that was changed between different PROFILE runs was the quantitative mineralogy for each soil layer, as described above. Hence, PROFILE estimated weathering rates (W) based on measured mineralogy (WXRPD), and the two versions of A2M calculated mineralogy, regional (WA2M-reg), and site-specific (WWA2M-site). In the regional mineralogy, plagioclase is assumed to occur as pure anorthite and pure albite for simplification, as has been done in previous studies (Stendahl et al., 2013; Zanchi et al., 2014). This simplification was done in order to avoid having a number of minerals containing different amounts of Ca and Na, as a result of plagioclase forming a continuous solid solution series, since it would not affect the weathering rates.
The physical soil-layer-specific parameters, which were kept constant between different profile runs, were exposed mineral surface area, stoniness, soil bulk density and soil moisture (Table 2). Exposed mineral surface area was estimated from soil bulk density and texture analyses in combination with an algorithm specified in Warfvinge and Sverdrup (1995) and critically discussed in Hodson et al. (1998). The volumetric field soil water content in Flakaliden and Asa was estimated to be 0.25 m3 m−3 according to the moisture classification scheme described in Warfvinge and Sverdrup (1995). It was used to describe the volumetric water content for each soil pit.
Another group of parameters kept constant was chemical soil-layer-specific parameters. The aluminum solubility coefficient needed for solution equilibrium reactions, defined as , was estimated by applying a function developed from previously published data (Simonsson and Berggren, 1998) to our own total carbon and oxalate extractable aluminum measurements. The function is based on the finding that the Al solubility in the upper B horizon of podzols is closely related to the molar ratio of aluminum to carbon in pyrophosphate extracts, and that below the threshold value of 0.1, Al solubility increases with the Alp∕Cp ratio (Simonsson and Berggren, 1998). Thus, a function was developed for application to our own measurements of Alox and Ctot based on the assumption that it is possible to use the Alox∕Ctot ratio instead of the Alp∕Cp ratio. Data on soil solution dissolved organic carbon (DOC) were available from lysimeters installed at 50 cm depth for plot K4 and K1 in Asa and 10B and 14B in Flakaliden, and these values were also applied to soil depths below 50 cm (Harald Grip, unpublished data, 2019). The E horizon (0–10 cm at Flakaliden) and A horizon (0–10 cm at Asa) were characterized by higher DOC values based on previous findings (Fröberg et al., 2013) and the classification scheme of DOC in Warfvinge and Sverdrup (1995). Partial CO2 pressure values in the soil were taken from the default estimate of Warfvinge and Sverdrup (1995).
Other site-specific parameters that were kept constant between PROFILE runs were evapotranspiration, temperature, atmospheric deposition, precipitation, runoff and nutrient uptake. Temperature is one of the important factors that regulate the weathering rate, and for steady-state calculations in PROFILE the mean annual temperature is used. Kronnäs et al. (2019) demonstrates how weathering rates varies between seasons, due to variations in temperature for example. Precipitation is used in PROFILE to calculate vertical water flow through the soil profile. The main effect of precipitation on weathering rates is its impact on soil moisture, but in PROFILE soil moisture is not internally modeled, but given as input. An estimate of the average evaporation per site was derived from annual averages of precipitation and runoff data using a general water balance equation. Deposition data from two sites of the Swedish ICP Integrated Monitoring catchments, Aneboda (for Asa) and Gammtratten (for Flakaliden) (Löfgren et al., 2011), were used to calculate the total deposition. The canopy budget method of Staelens et al. (2008) was applied as in Zetterberg et al. (2014) for Ca2+, Mg2+, K+ and Na+. The canopy budget model is commonly used for elements that are prone to canopy leaching (Ca2+, Mg2+, K+, Na+, ) or canopy uptake (, ) and calculates the total deposition (TD) as the sum of dry deposition (DD) and wet deposition (WD). Wet deposition was estimated based on the contribution of dry deposition to bulk deposition, both for base cations and anions, using dry deposition factors from Karlsson et al. (2012, 2013). Base cation and nitrogen accumulation rate in above-ground tree biomass (i.e., bark, stemwood, living and dead branches, needles) was estimated as the average accumulation rate over a 100-year rotation length in Flakaliden compared to a 73-year rotation length in Asa. These calculations were based on Heureka simulations using the StandWise application (Wikström et al., 2011) for biomass estimates in combination with measured nutrient concentrations in above-ground biomass (Sune Linder, unpublished data, 2019).
2.7 A definition of significant discrepancies between WA2M and WXRPD
A consequence of the mathematical structure of the A2M program is that the final solution space of possible quantitative mineralogies produces an uncertainty range of weathering estimates, but in a different sense than the uncertainty caused by uncertainties in chemical analyses for example, because all mineralogies produced within this range are equally likely. Thus, here we define a significant discrepancy between WXRPD and WA2M as occurring when the former is outside the range of the latter, as illustrated in Fig. 1a. The opposite case is a nonsignificant discrepancy, when the weathering rates based on XPRD are contained in the weathering range based on A2M (Fig. 1b).
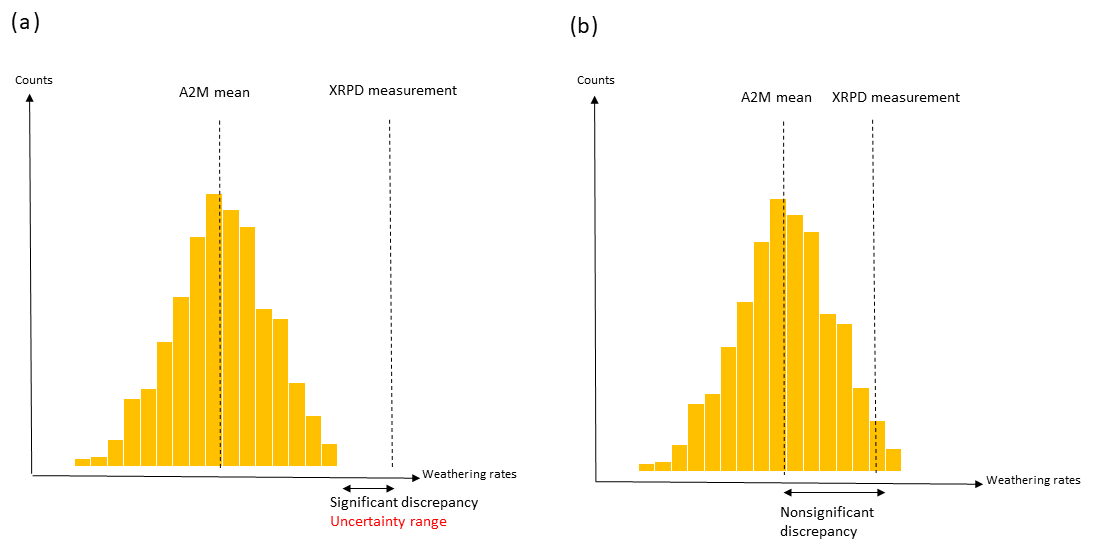
Figure 1The first scenario for describing the effect of mineralogy on weathering rates in the upper mineral soil for a specific soil profile (a) happens when the PROFILE weathering rate based on XRPD (reference weathering rates) is not contained in the weathering range produced using PROFILE in combination with the full A2M solution space. There are two possible explanations of why a significant discrepancy introduces an uncertainty range, i.e., (1) due to uncertainties related to the mineralogical A2M input and (2) due to uncertainties related to the limitation of the XRPD method itself (i.e., detection limit). The second scenario (b) occurs when the reference weathering rate is contained in the full A2M weathering span. In this case we speak of “nonsignificant discrepancies”.
The uncertainty range of WA2M can potentially be reduced by reducing uncertainties in analyses of soil geochemistry but most particularly by definitions of available minerals and their stoichiometry. Furthermore, some discrepancies between WXRPD and WA2M might also arise due to limitations of the XRPD method, particularly when minerals occur near or below the detection limit.
2.8 Statistical analyses
In order to quantify the effect of mineralogy on PROFILE weathering rates two statistical measures were used to describe the discrepancies between WXRPD and WA2M. Firstly, root mean square errors (RMSEs) of the differences between WXRPD and the arithmetic mean of weathering rates based on regional and site-specific mineralogy, i.e., WA2M-reg and WA2M-site, were calculated:
RMSEs were calculated individually for each element, soil layer and soil profile for two data sets. An RMSE expressing the error of the aggregated, total weathering rates in the 0–50 cm soil horizon was calculated to test our first hypothesis (RMSE of total weathering). In addition, an RMSE expressing the errors originating from discrepancies between WXRPD and WA2M for individual minerals was also calculated (RMSE of weathering by mineral). In the latter case, sums of RMSEs by mineral were calculated for each element and soil profile by analogy with the summing up of weathering rates for the whole 0–50 cm soil profile.
Secondly, relative discrepancies (i.e., average percentage of over- or underestimation of WA2M compared to WXRPD) were calculated as the absolute discrepancy divided by the measured value.
Relative errors were calculated for each site by comparing the average sum of WA2M in the upper mineral soil (0–50 cm) with the sum of WXRPD in the upper mineral soil.
Statistical plotting of results was performed using R (version 3.3.0) (R Core Team, 2016) and Excel 2016.
3.1 Weathering rates based on XRPD mineralogy
Weathering estimates with PROFILE are hereafter presented as the sum of weathering rates in the 0–50 cm soil horizon, since this soil depth is commonly used in weathering rate studies. Information on individual and deeper soil layers (50–100 cm) is given in Table S2.
Weathering rates of the base cations based on quantitative XRPD mineralogy (WXRPD), i.e., the reference weathering rates, were ranked in the same order at both sites, with Na > Ca > K > Mg (Table S2). On average, weathering rates of Na, Ca, K and Mg at Asa were 17.7, 8.4, 5.6 and 3.6 mmolc m−2 yr−1, respectively. Corresponding figures for Flakaliden were of similar magnitude, i.e., 14.8, 9.8, 5.7 and 5.6 mmolc m−2 yr−1. The variation in weathering rates between soil profiles was smaller at Asa than at Flakaliden, as the standard deviation in relation to the means for different elements ranged between 0.2 and 2.3 at Asa, and between 2.0 and 5.7 at Flakaliden (Table S2).
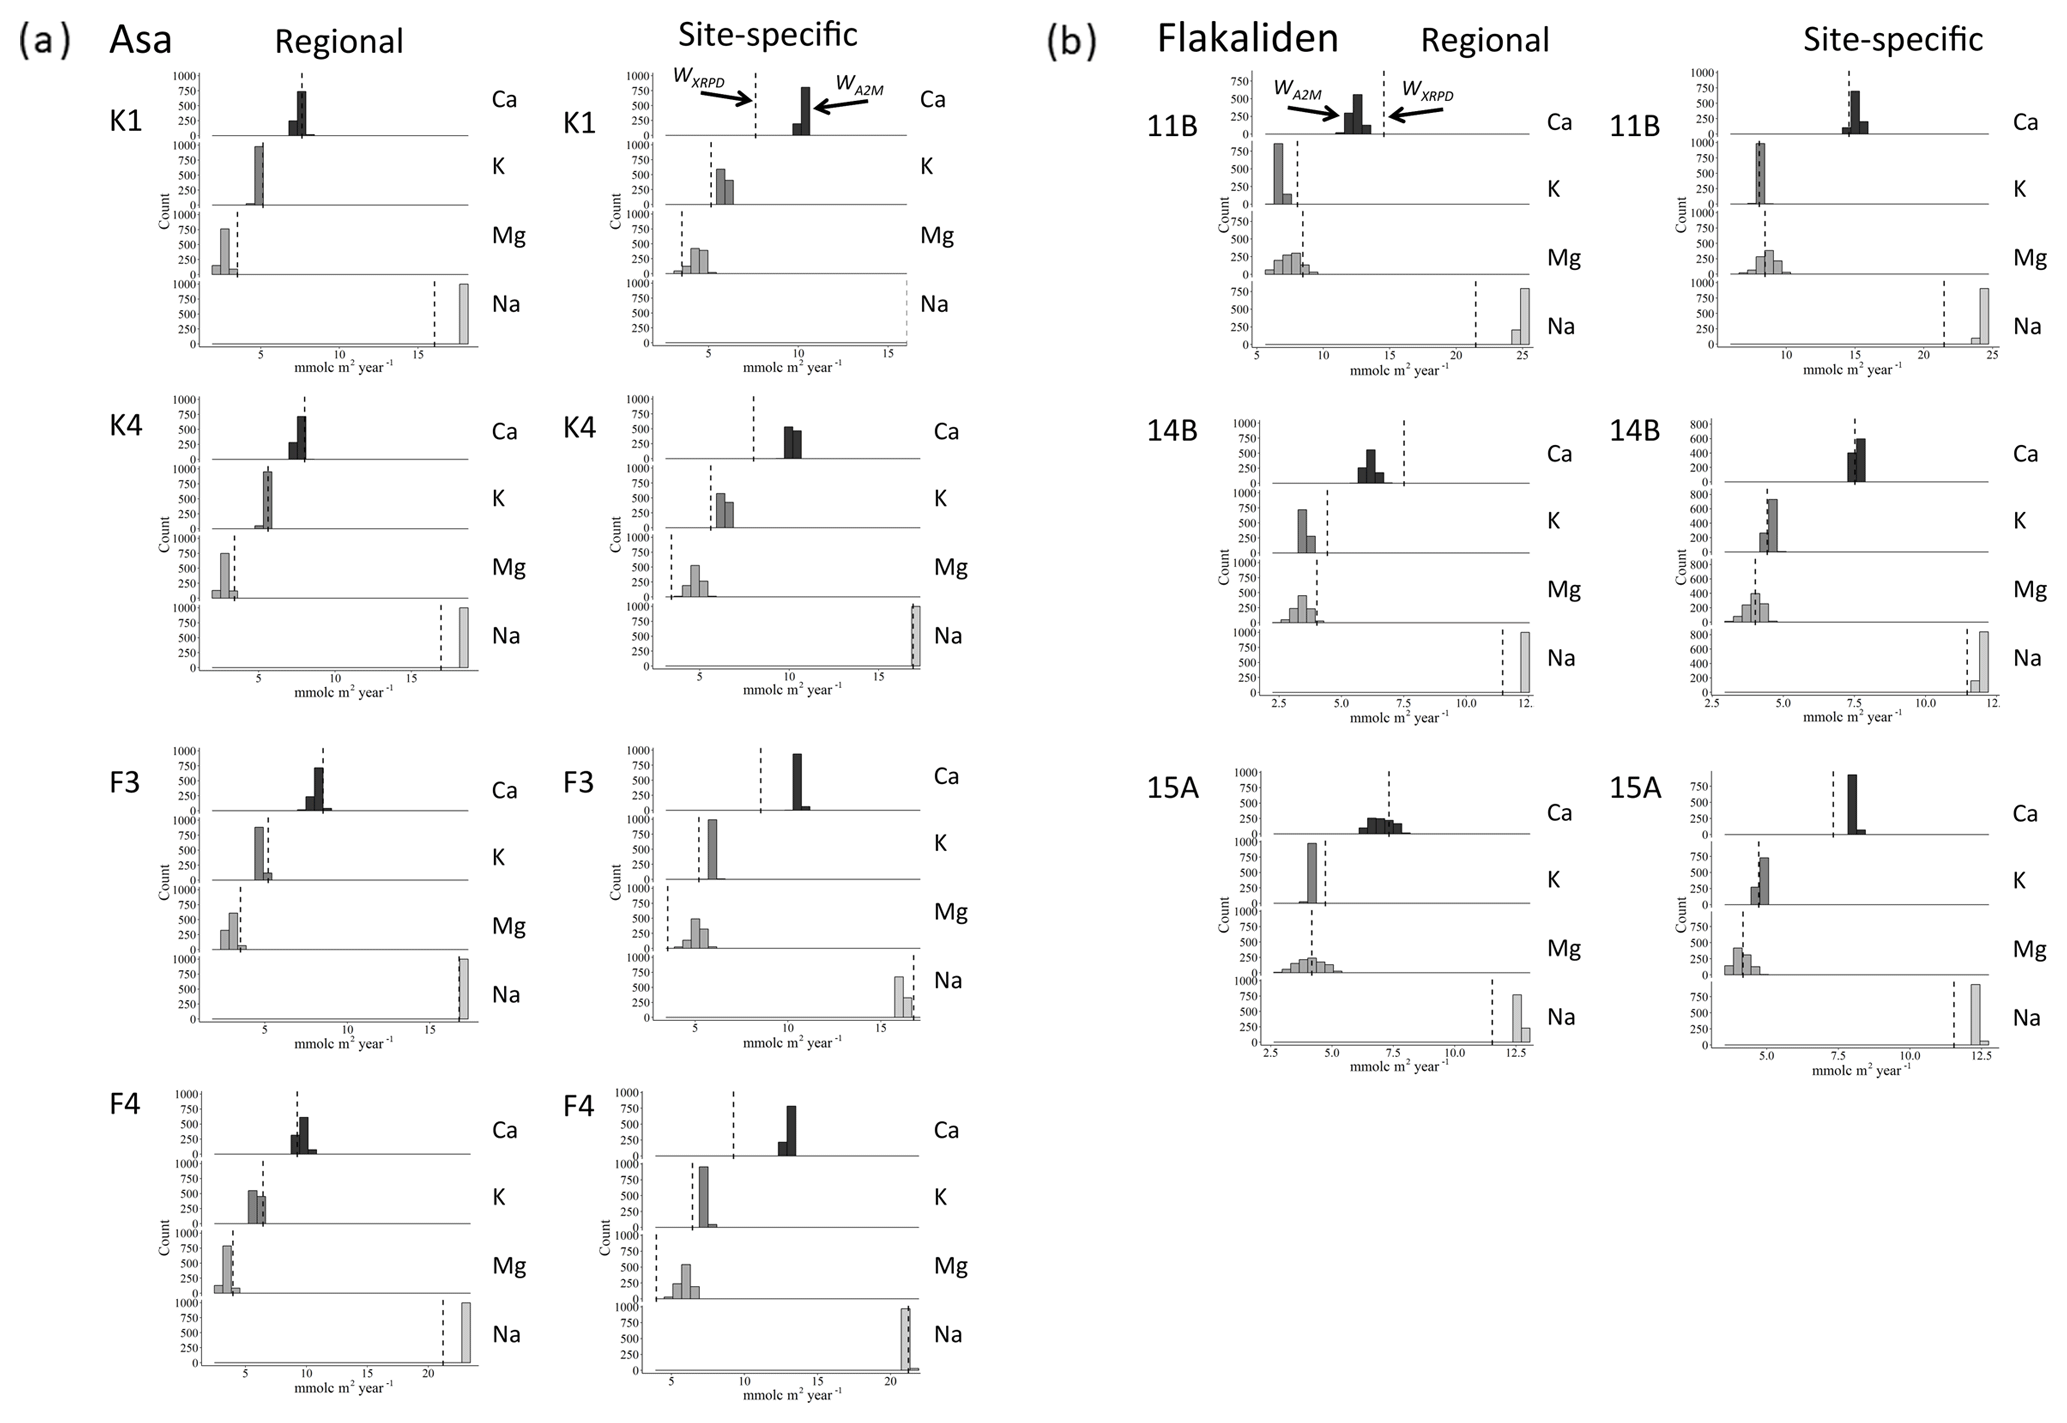
Figure 2Comparison of PROFILE weathering rates of base cations (mmolc m−2 yr−1) at Asa (a) and Flakaliden (b) sites in the 0–50 cm horizon based on XRPD mineralogy (vertical dashed lines) with PROFILE weathering rates based on 1000 random regional A2M mineralogies versus 1000 random site-specific A2M mineralogies. Data presented are from four different soil profiles per site. Regional graph for soil profile 10B at Flakaliden is missing since A2M did not calculate 1000 solutions for soil layer 20–30, due to a “nonpositive solution”.
3.2 Comparison between weathering rates based on XRPD and A2M mineralogy
At Flakaliden, WA2M-site was generally in closer agreement with WXRPD than WA2M-reg (Fig. 2b), in line with the first hypothesis. The discrepancies between WXRPD and WA2M were small and nonsignificant for Mg regardless of the mineralogy input used in A2M, although the estimated discrepancies were reduced when site-specific mineralogy was used. The use of regional mineralogy in A2M underestimated K release rates compared to WXRPD, and the discrepancy was significant. Using site-specific mineralogy resulted in smaller and nonsignificant discrepancy for K release rates. A similar response to different mineralogies was revealed for Ca, although the result varied more among soil profiles. In contrast to K and Ca, the release of Na was overestimated by both WA2M-site and WA2M-reg compared to WXRPD. The discrepancies were significant regardless of the mineralogy input used in A2M, although using site-specific mineralogy slightly reduced the discrepancy. The generally closer agreement between WA2M-site and WXRPD than WA2M-reg at Flakaliden was also indicated by the lower RMSEs of total weathering for all base cations when site-specific mineralogy was used (Fig. 3a). Relative RMSEs were below 20 % for WA2M-reg, but below 10 % for WA2M-site. However, RMSE for Na was only slightly smaller for WA2M-site than WA2M-reg (16 % for WA2M-site).
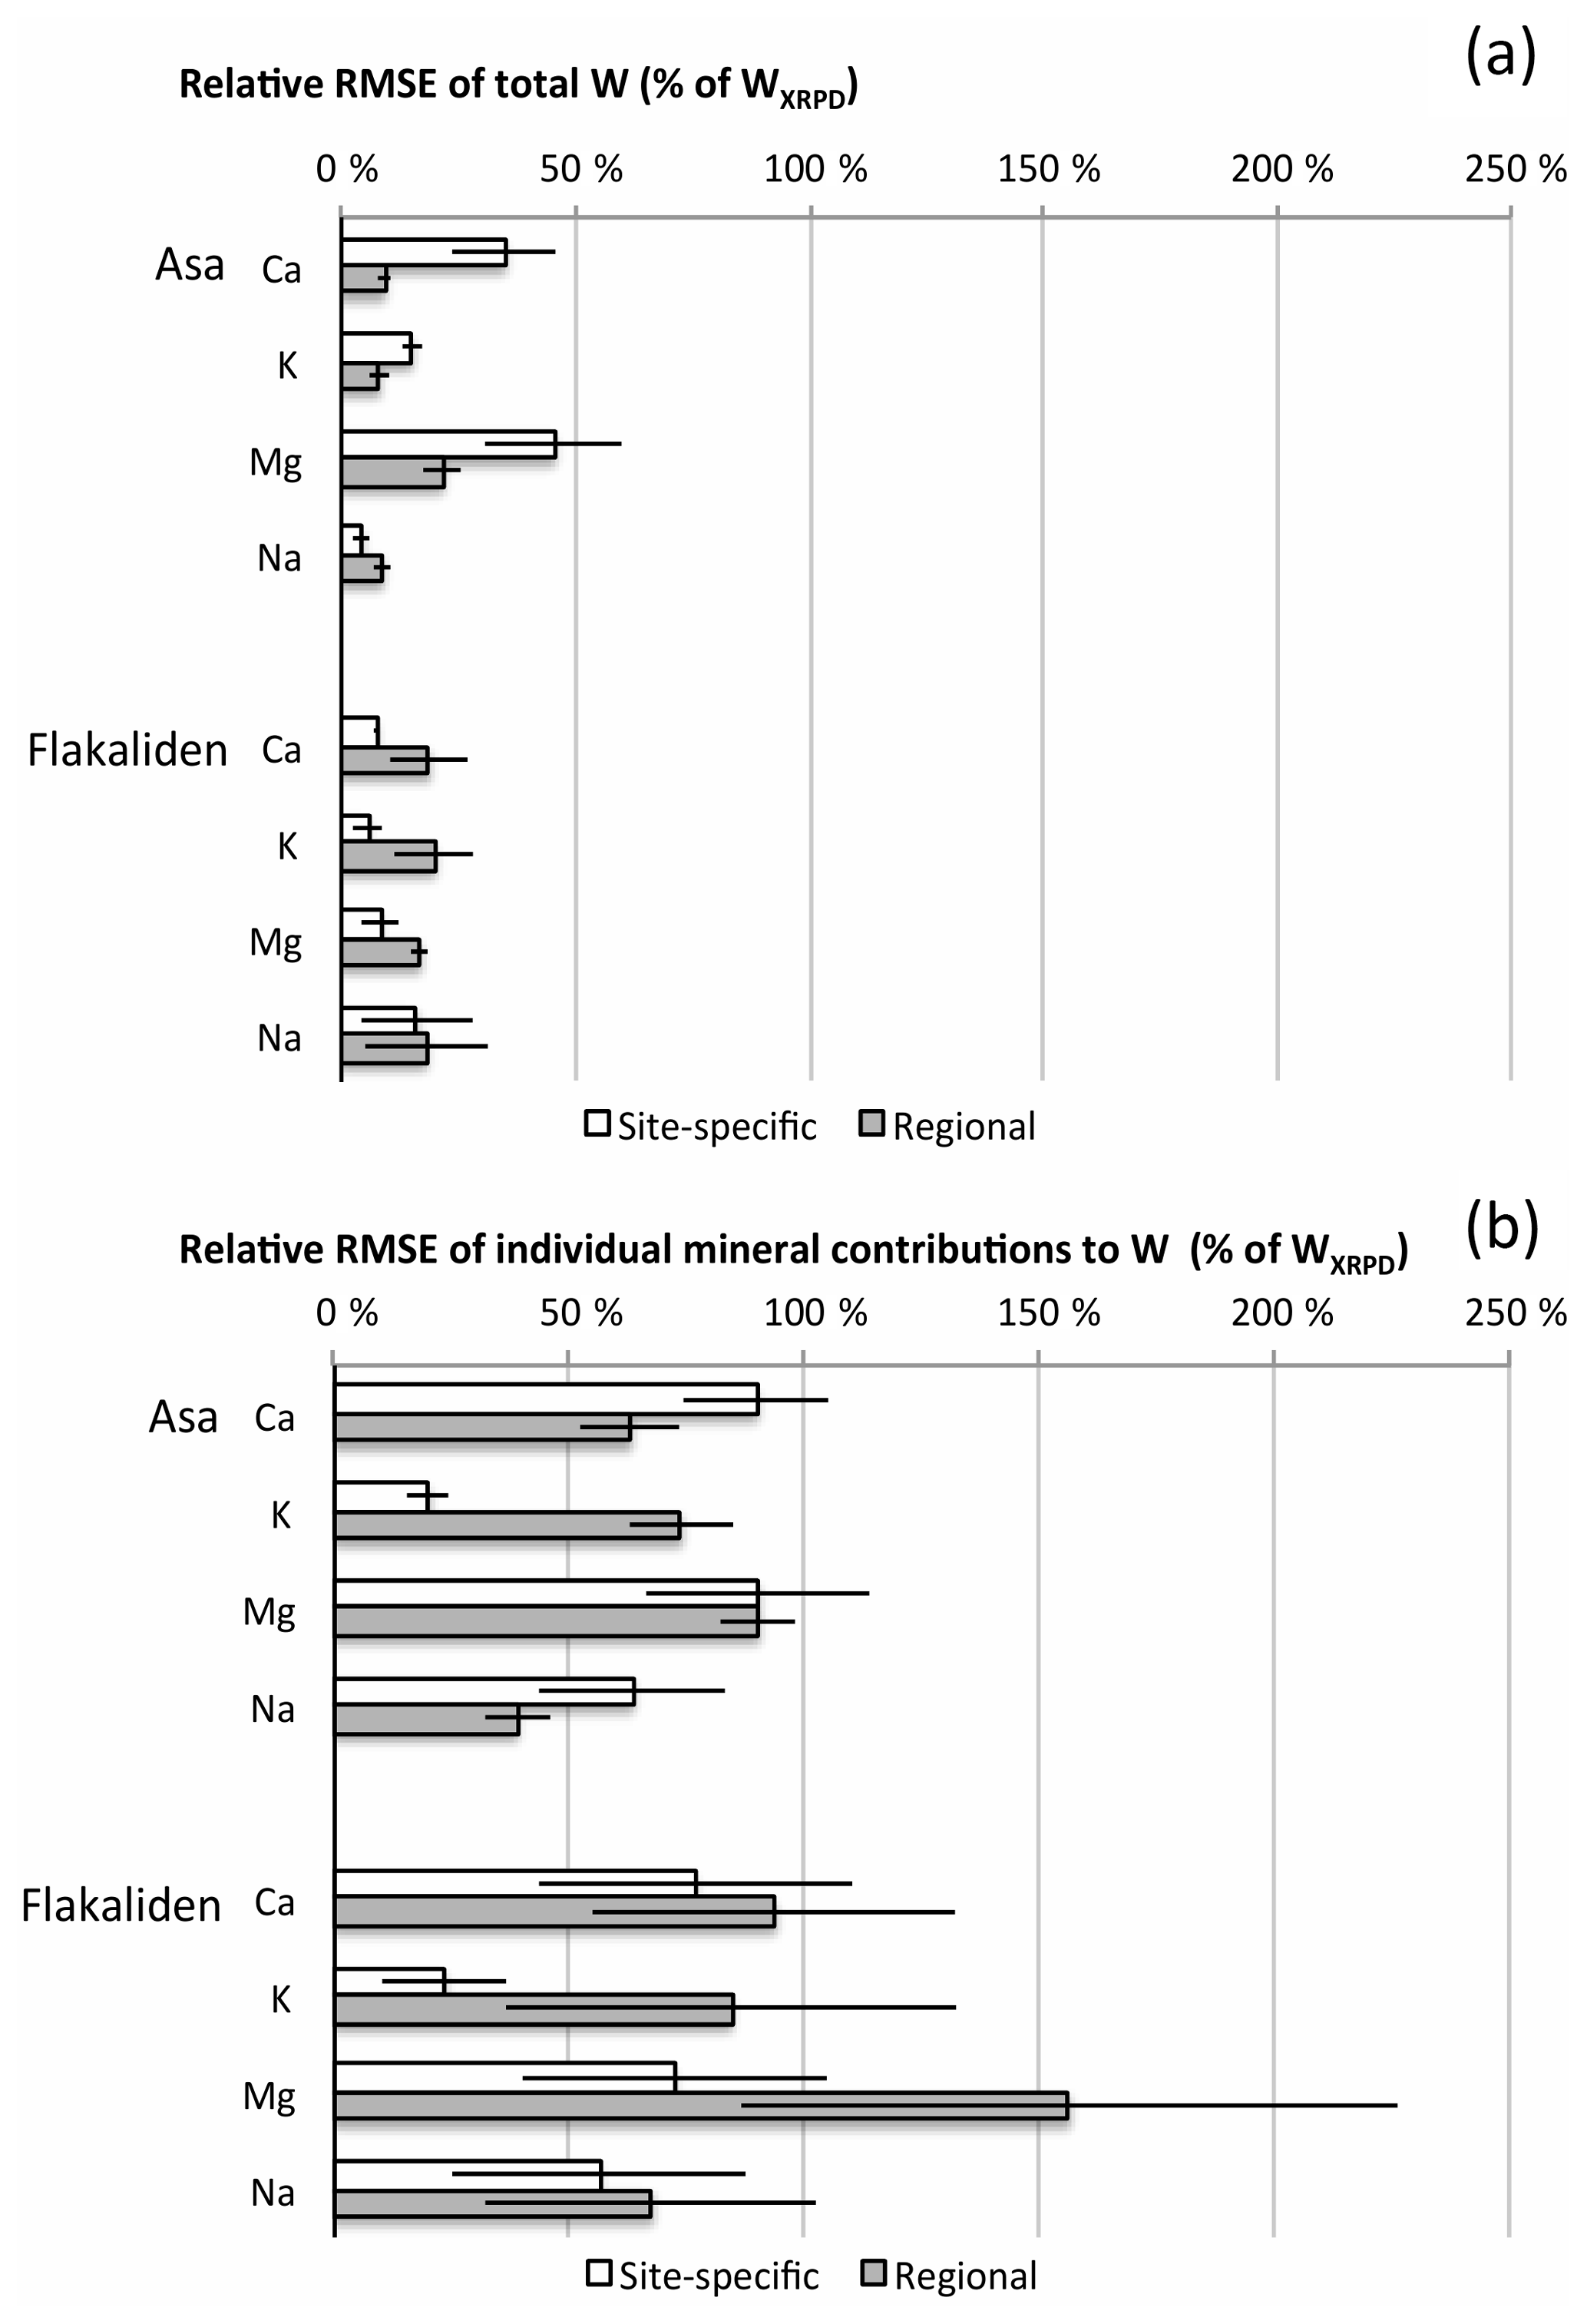
Figure 3Root-mean square error (RMSE) of average PROFILE weathering rates (mmolc m−2 yr−1) of 1000 A2M mineralogies per soil layer, compared to weathering rates based on XRPD mineralogy per soil layer. Comparisons are based on the total weathering per element (a) and on the sum of mineral contributions to total weathering per element (b). RMSE describes the prediction accuracy for a single soil layer.
PROFILE weathering rates for Asa revealed a different pattern compared to Flakaliden, and the results for Ca, Mg and K were contradictory to hypothesis one. WA2M-reg was in close agreement with WXRPD for K, Ca and Mg, and the small discrepancies were nonsignificant (Fig. 2a). However, WA2M-reg for Na was consistently overestimated compared to WXRPD and the discrepancies were significant. Using site-specific mineralogy improved the fit between WXRPD and WA2M for Na but had rather the opposite effect on the other base cations at this site. For K, Ca and Mg, WA2M-site overestimated weathering rates and resulted in significant discrepancies and larger RMSEs, whereas the discrepancies for Na were reduced and nonsignificant (Fig. 3a). At Asa, the highest relative RMSEs of total weathering occurred for Ca and Mg with WA2M-site (>30 %) (Fig. 3a). Large standard deviations were due to a single soil profile, F4. The better consistency with WA2M-reg was indicated by RMSE below 10 % for Ca and Mg, and that RMSE for Mg was half of the error with WA2M-site. Only for Na was RMSE lower for WA2M-site than with WA2M-reg.
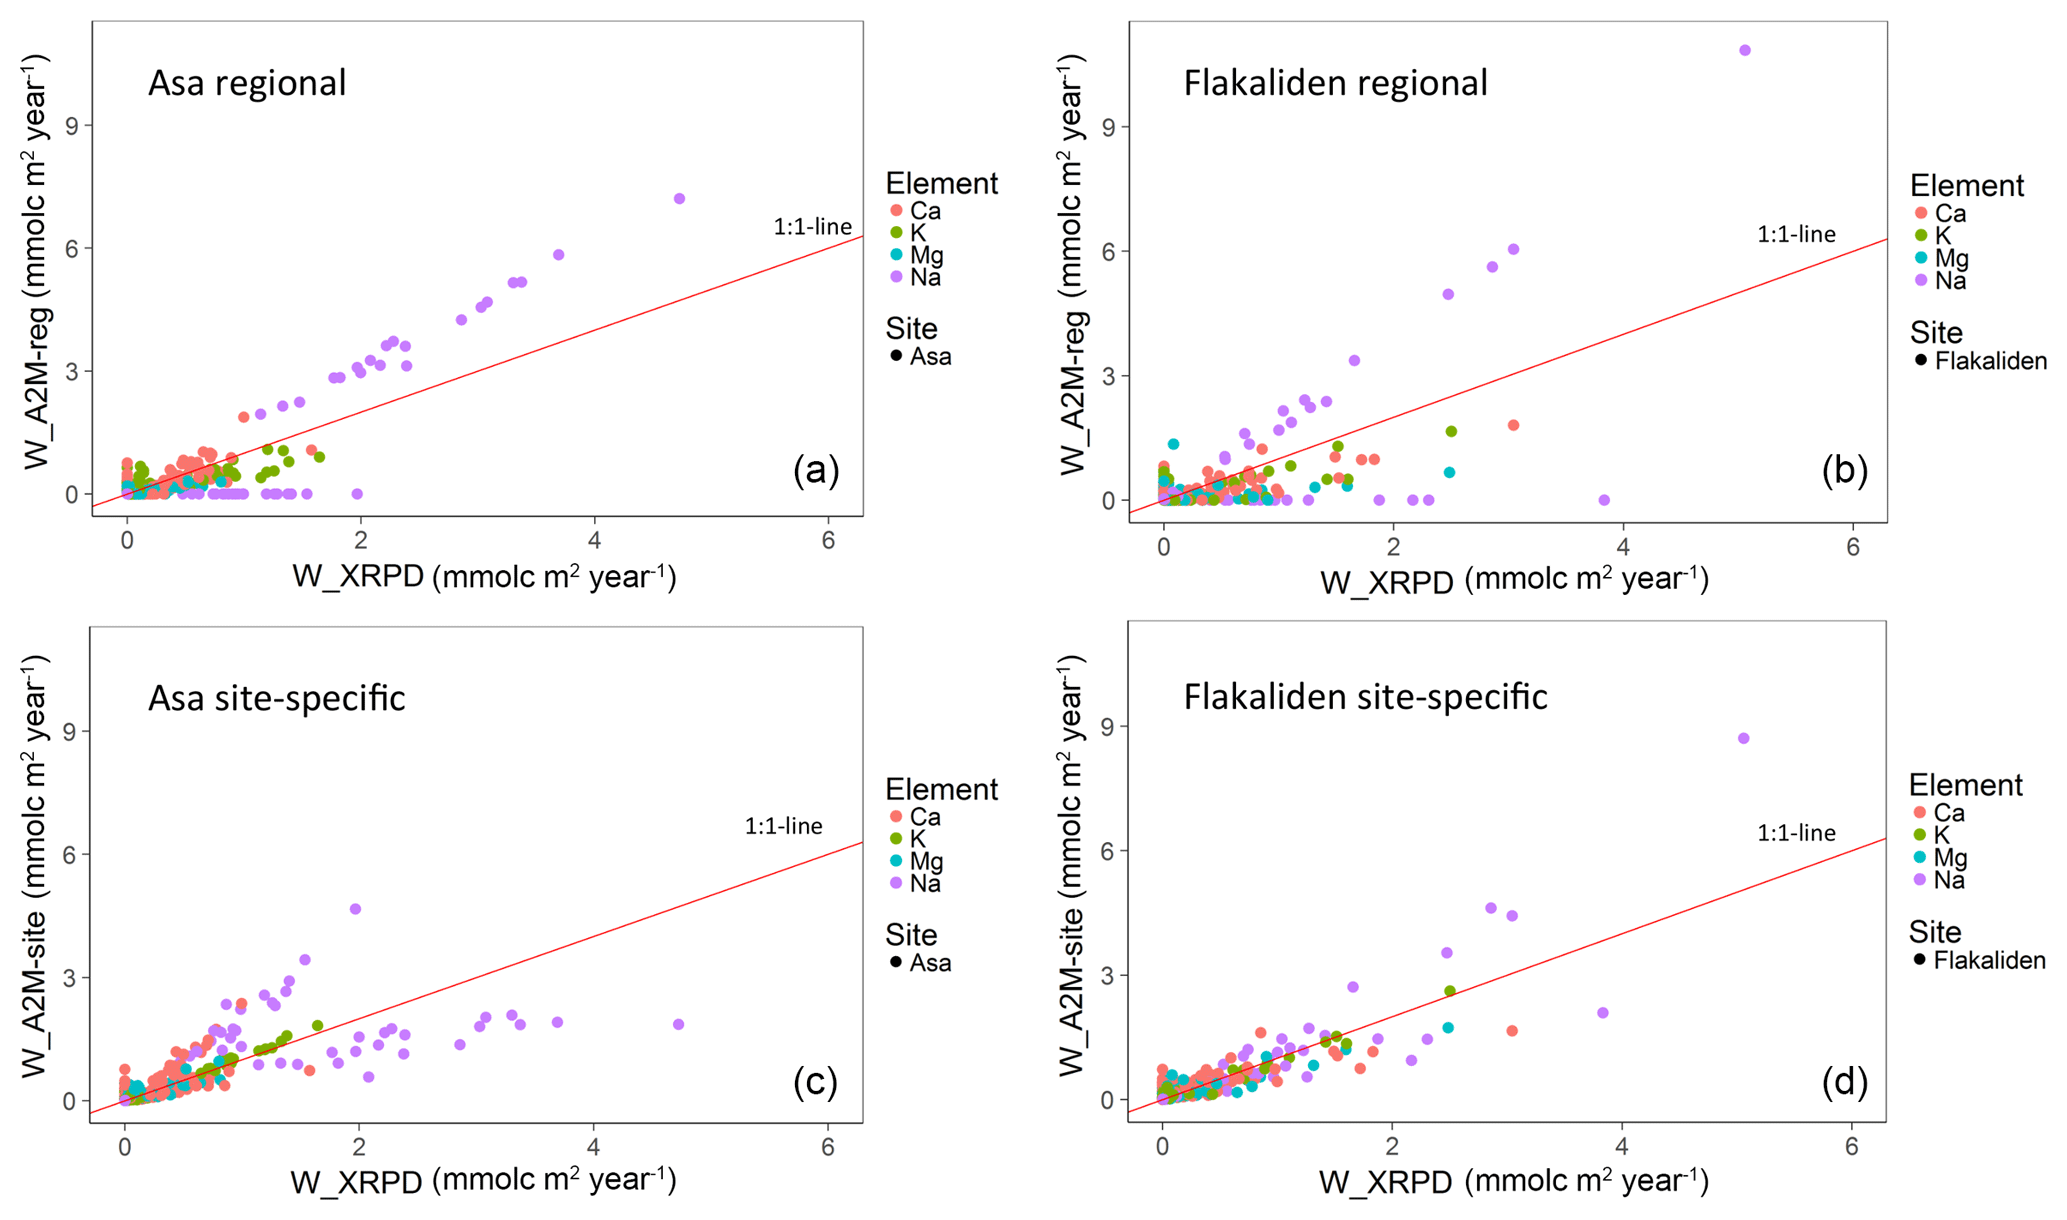
Figure 4Comparison of PROFILE weathering rates based on XRPD mineralogy (mmolc m−2 yr−1) with PROFILE weathering rates based on regional A2M mineralogy (a, b) versus site-specific mineralogy (c, d). Each data point represents a mean of 1000 PROFILE weathering rates for a specific soil depth of one of four soil profiles per site.
A complementary illustration of the relationships between weathering rates based on XRPD and A2M is shown in Fig. 4 and provided as Tables S3 and S4, which includes all data from individual soil layers 0–50 cm. A general picture is that WA2M-site was less dispersed along the 1 : 1 line than WA2M-reg, in particular for Flakaliden. On the other hand, for weathering rates in the lower range (<5 mmolc m−2 yr−1) site-specific mineralogy tended to generate both over- and underestimated weathering rates. In most soil profiles, deviations from the 1 : 1 line were frequent in soil layers below 20 cm. For Na, under- and overestimations occurred in the whole range of weathering estimates.
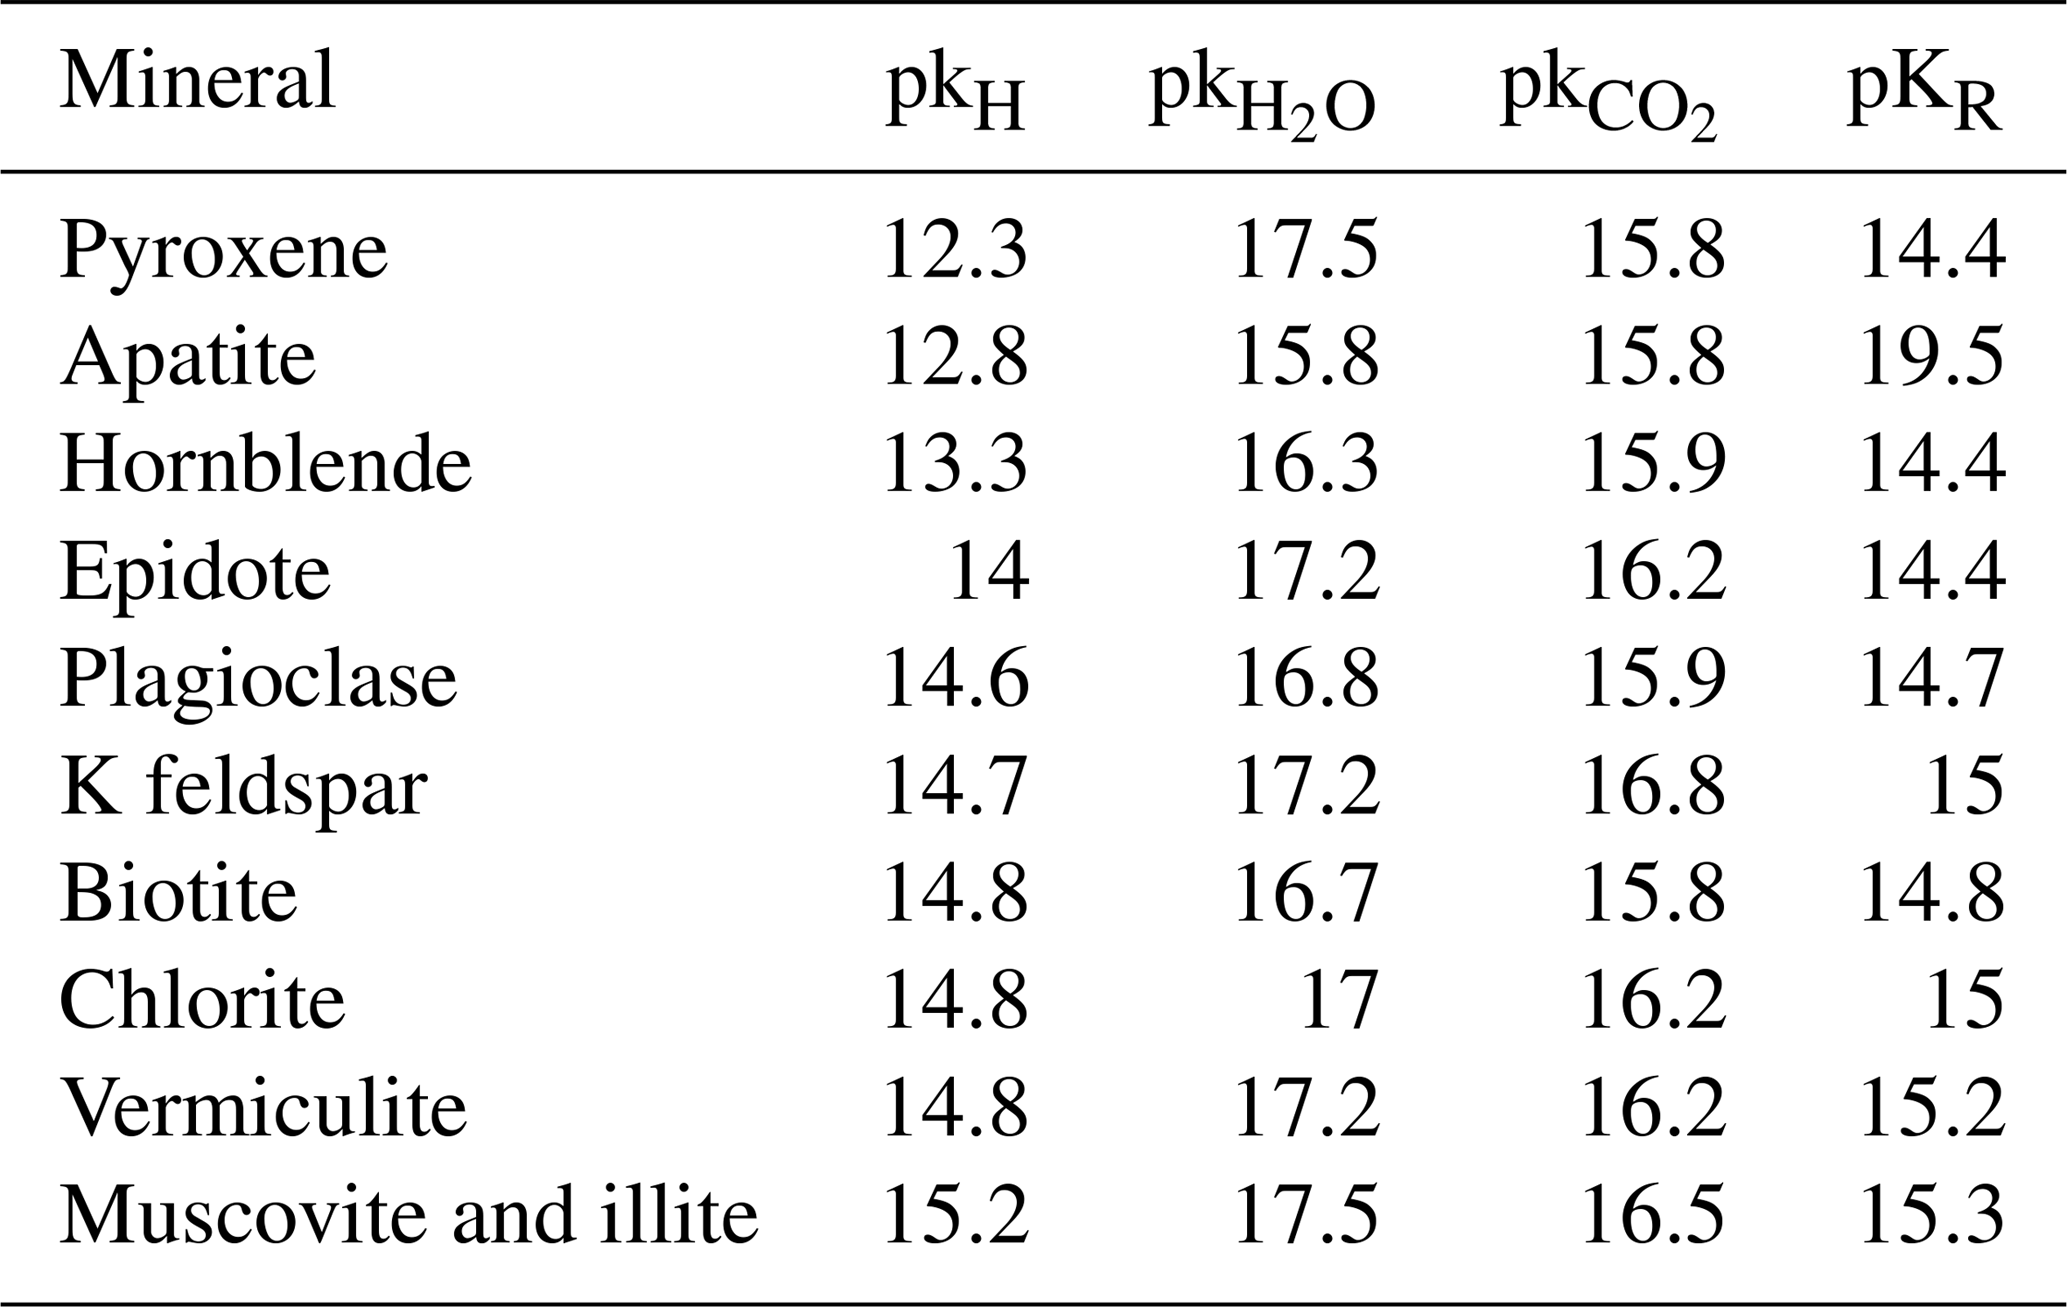
Table 3Mineral dissolution rate coefficients (kmolc m−2 s−1) used in PROFILE for the reactions with H+, H2O, CO2 and organic ligands (R−) (Warfvinge and Sverdrup, 1995).
3.3 Mineral-specific contribution to weathering rates
In spite of its intermediate dissolution rate, plagioclase was, due to its abundance, the most important Na-bearing mineral determined in this study (Table 3 and Fig. 5). Plagioclase is a variable group of minerals with different stoichiometric proportions of Ca and Na, from the purely sodic albite on the one hand to the purely calcic anorthite on the other hand (Table S5) as well as with intermediate compositions (Table S6). For simplicity, they will be referred to in this study as sodic and calcic plagioclase. Based on the same quantitative mineralogy (i.e., same elemental compositions and identity of minerals), WXRPD and WA2M-site gave strong weight to both calcic and sodic plagioclase in estimating Na release rates, but WA2M-site gave stronger weight to calcic versus sodic plagioclase at Asa, and vice versa at Flakaliden (Fig. 5). In spite of these differences, the resultant release rates of Na according to WA2M-site and WXRPD were rather similar (Fig. 5).
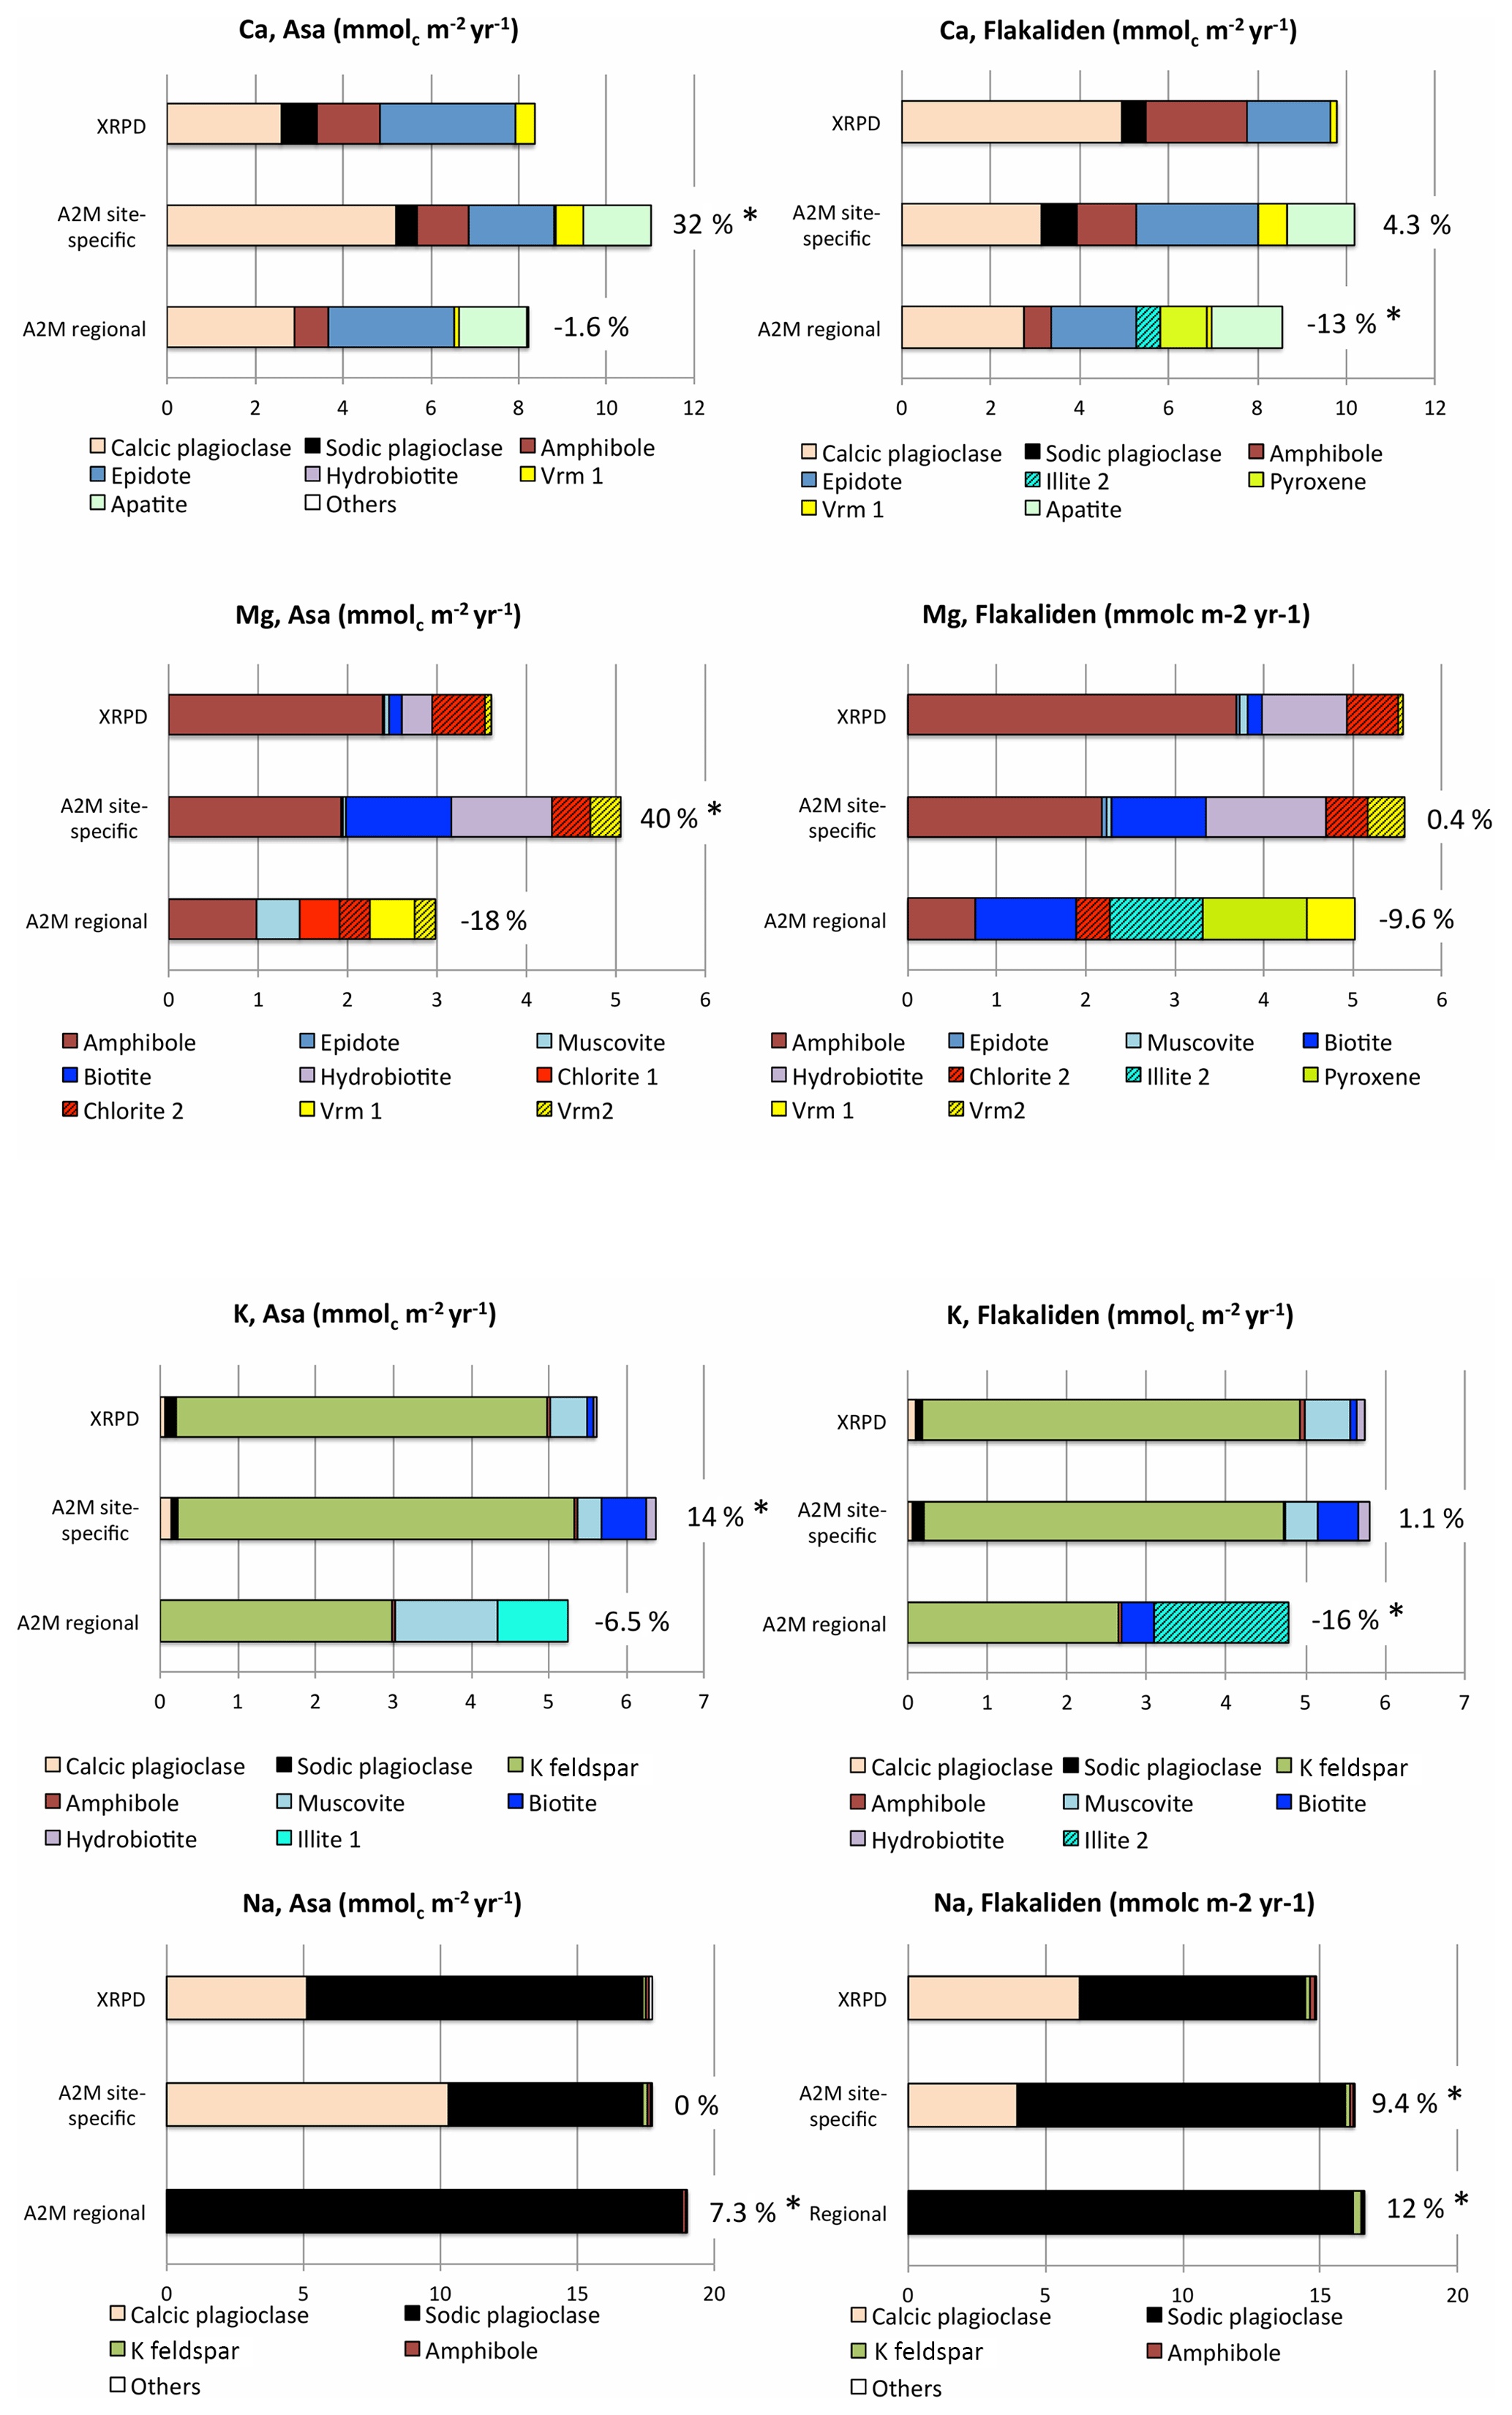
Figure 5Comparison of sums of PROFILE base cation weathering rates for different minerals in the upper mineral soil (0–50 cm) based on XRPD mineralogy and the average PROFILE base cation weathering rate (i.e., based on 1000 input A2M mineralogies per mineral) according to the two normative mineralogical methods and for each study site (i.e., Asa site-specific, Flakaliden site-specific, Asa regional, Flakaliden regional). For WA2M, relative error (percentage of WXRPD estimate) is given at the end of each bar to illustrate the average deviation of WA2M and WXRPD in the upper mineral soil. The asterisk (*) denotes a significant discrepancy as defined in Sect. 2.7. Vrm1 = trioctahedral vermiculite; Vrm2 = dioctahedral vermiculite. Information on chemical compositions of minerals are given in Tables S5 and S6.
Total Na release rates of WA2M-reg compared to WXRPD were moderately overestimated. The relative RMSE of weathering by specific Na-containing minerals were of more similar magnitude for Na at Flakaliden compared to Asa (Fig. 3b). However, the standard deviations of RMSE were relatively large at Flakaliden, due to large RMSE for albite in one specific soil profile (11B) (Table S7). Contrary to relative RMSE of total weathering, the relative RMSE of weathering by specific minerals was lower for Na at Asa with regional than site-specific mineralogy.
According to WXRPD, calcic plagioclase weathering was the most important source to Ca release at Flakaliden, and the second most important source at Asa after epidote (Fig. 5). As for Na, WA2M-site gave stronger weight to calcic plagioclase than WXRPD at Asa. It was the other way around for WA2M-site at Flakaliden and the regional mineralogy (i.e., WXRPD gave stronger weight to calcic plagioclase than WA2M-site). Another important Ca source in weathering estimates based on A2M was apatite. This mineral was not detected in the XRPD analyses but was included in both A2M mineralogies as a necessary means to allocate measured total phosphorus content to a specific mineral (Casetou-Gustafson et al., 2018).
Similar to Na, relative RMSE of weathering by Ca-containing minerals were several magnitudes larger than RMSE of the total weathering of Ca. In other words, although an overall similar weathering rates might be generated by the PROFILE model based on different quantitative mineralogies, the underlying modeled contributions from different minerals can be markedly different. At Flakaliden, the mean relative RMSE by specific minerals were larger for regional than site-specific mineralogy at Flakaliden (Fig. 3b). However, the difference was not significant since the standard deviations were high, probably due to larger RMSE for Ca-bearing minerals in soil profile 11B (Table S7).
A general picture of the mineral contribution to Mg release is that WXRPD placed most weight to amphibole whereas, in WA2M, Mg release was more equally distributed among other minerals, notably hydrobiotite, trioctahedral mica and vermiculite. At Asa, and to an even larger extent at Flakaliden, Mg release by A2M mineralogies was determined by a higher contribution of minerals with high dissolution rates (Fig. 5 and Table 3) (i.e., in WA2M-site, hydrobiotite and trioctahedral mica; in WA2M-reg, muscovite and vermiculite at Asa and biotite and illite at Flakaliden). At Asa, less weight was given to amphibole by WA2M-site compared to WXRPD. At Flakaliden, the WA2M-site was close WXRPD in spite of the very different allocations of weathering rates to different minerals. The underestimation of Mg release by WA2M-reg was largely explained by the lower weight given to amphibole in both A2M scenarios (Fig. 5). However, A2M gave larger weight to other minerals. The sums of RMSEs of weathering from specific Mg-bearing minerals were much larger for regional than site-specific mineralogy at Flakaliden and reached a maximum value of 156 %. A contributing factor was generally larger RMSE for the mineral contribution of amphibole to Mg weathering and the fact that pyroxene contributed to the RMSEs of the total weathering of Mg. Furthermore, a large standard deviation for the sum of RMSE of specific minerals (Fig. 3b) was caused by soil profile 11B, where more weight was placed on amphibole and biotite in contributing to Mg weathering (Table S7). The two A2M mineralogies resulted in the same RMSEs for Mg-bearing minerals at Asa (Fig. 3b).
Potassium release rates were largely dominated by K feldspar weathering in both WXRPD and WA2M-site. However, K release by WA2M-reg (Fig. 5) was largely determined by micas at both sites. Together with Mg, these elements had also the lowest weathering rates, indicating that differences between WA2M-reg and WXRPD in relative terms were not correlated with the magnitude of weathering. Unlike the other base cations, relative RMSEs of K-bearing minerals were lower at both sites when site-specific mineralogy was used instead of regional (Fig. 3b), and the mineral-specific RMSEs were also of similar magnitude to the RMSE of the total weathering (Fig. 3a). WA2M-site of K (Fig. 3b) was not several magnitudes larger than RMSE of the total weathering (Fig. 3a). The largest relative RMSEs of K-containing minerals were reached by WA2M-reg at Flakaliden in soil profile 11B, indicated by the high standard deviation.
4.1 General range of weathering rates in relation to expectations from other sensitivity studies, and the range of discrepancies between WXRPD and WA2M
To our knowledge, the present study is the first to have examined the sensitivity of the PROFILE model on real case study differences of directly measured mineralogy versus indirectly determined normative mineralogy. However, a few systematic studies have been made previously to test the influence of mineralogy inputs, amongst other input parameters, to PROFILE weathering rates. Jönsson et al. (1995) concluded that uncertainty in quantitative mineralogy could account for a variation from the best weathering estimate of about 20 %, and that variations in soil physical and chemical parameters could be more important. The sensitivity analysis of Jönsson et al. (1995) was made by a Monte Carlo simulation where mineralogical inputs were varied by ±20 % of abundant minerals, and up to ±100 % of minor minerals. Shortly after, Hodson et al. (1996) examined the sensitivity of the PROFILE model with respect to the sensitivity of weathering of specific minerals and concluded that large uncertainties, especially in soil mineralogy, moisture, bulk density, temperature and surface area determinations, will have a larger effect on weathering rates than was reported by Jönsson et al. (1995).
Compared with the sensitivity analyses by Jönsson et al. (1995), the range of uncertainty in dominating mineral inputs used in the present study was of similar order of magnitude. For this study we used the XRPD-measured (MXRPD) and A2M-estimated mineralogies (MA2M) determined by Casetou-Gustafson et al. (2018). For example, they concluded that MA2M-reg produced a low relative RMSE of total plagioclase (7 %–11 %) but higher relative RMSE for less abundant minerals, such as dioctahedral mica (90 %–106 %). They also showed that when regional mineral identity and assumed stoichiometry was replaced by site-specific mineralogy (MA2M-site), the bias in quantitative mineralogy was reduced.
Thus, given this bias in quantitative mineralogy input to PROFILE, discrepancies of WA2M from WXRPD at our study sites should have been on the order of 20 % or less, and site-specific mineralogy inputs should produce weathering rates with lower discrepancies than regional mineralogy. The result of this study was in agreement with this expectation for all elements at Flakaliden but only for Na at Asa. The different quantitative mineralogies resulted in discrepancies between WA2M and WXRPD that differed by site (Figs. 3a, 5).
4.2 Is WA2M-site more consistent than WA2M-reg?
Our first hypothesis, that using site-specific mineralogy in the PROFILE model compared to regional mineralogy should result in weathering rates closer to XRPD-based mineralogy and thus be more consistent, was generally supported for Flakaliden, but only for Na at Asa. This result was revealed from both the occurrence of significant discrepancies as well as the RMSE of the total weathering rates. Thus, the results did not support our first hypothesis in a consistent way. The possible reasons for this outcome are discussed below, based on the analysis of how different minerals contributed to the overall weathering rates.
4.3 How are discrepancies between WA2M and WXRPD correlated to bias in determinations of quantitative mineralogy
The version of the PROFILE model used in this study allowed a close examination of the per-element weathering rate contributions obtained from different minerals that provide some insight into the causes to the total WA2M discrepancies.
4.3.1 Sodium release rates
A biased determination of mineralogy may not necessarily result in a corresponding bias of PROFILE weathering estimates if the discrepancies are canceling each other out, and if dissolution rates of the different minerals are rather similar. This was probably the case for Na. At both study sites and for both WXRPD and WA2M, Na release rates were largest for plagioclase minerals. The Na release from WA2M-site and WA2M-reg were close to WXRPD at both study sites (i.e., all weathering rates were in the range of 17–19 mmolc m−2 yr−1); nonetheless WA2M-site placed more weight on calcic plagioclase and WA2M-reg more weight on albitic plagioclase (Fig. 5). Contrary to our second hypothesis, the relatively high precision in total release rates (i.e., <10 %; Fig. 3a) of Na was not correlated to the actual low precision in mineral contribution to the total Na release rates (i.e., >30 %; Fig. 3b). The latter can be explained by the fact that in PROFILE all types of plagioclase have the same dissolution rate coefficients (Table 3). Due to this, and in combination with the fact that plagioclase-type minerals are a major source for Na, the mineralogical uncertainty in estimating Na release rates with PROFILE was relatively low in this study (i.e., <20 %). In context, however, we note that it is generally accepted that under natural conditions different plagioclase minerals weather at different rates (Allen and Hajek, 1989, Blum and Stillings, 1995).
4.3.2 Calcium release rates
According to WXRPD and WA2M, a key mineral for Ca release rates was calcic plagioclase at Flakaliden and epidote at Asa. In line with our second hypothesis, the overestimation of calcic plagioclase in MA2M-site at Asa at the expense of epidote and amphibole (Casetou-Gustafson et al., 2018) was directly reflected in the significant discrepancy and overestimated weathering rates of Ca by WA2M-site compared to WXRPD (Figs. 5 and 1a). This discrepancy was due to differences between WA2M-site and WXRPD in the mineral stoichiometry of calcic plagioclases, and not in geochemistry, as the same geochemical analyses were also used for WA2M-reg.
At Flakaliden, A2M based on site-specific mineralogy overestimated epidote at the expense of amphibole (Casetou-Gustafson et al., 2018), leading to an underestimation of Ca weathering rates from amphibole compared to epidote (Fig. 5). On the other hand, at Asa, it was the regional mineralogy input to A2M that resulted in overestimated amounts of epidote at the expense of dioctahedral vermiculite and amphibole, and this bias was directly reflected in the underestimated release of Ca from amphibole in WA2M-reg. Conversely, the relatively small and nonsignificant discrepancies of Ca release by WA2M-site at Flakaliden and by WA2M-reg at Asa did not depend on a high precision in estimating the contribution from different minerals, since the precision was actually low. In these cases, the good fits seem to be simply coincidental. Owing to differences in dissolution rates, Ca-bearing minerals tend to compensate each other in terms of the total weathering rate that is calculated. This compensatory effect is perhaps the reason why by coincidence, both WA2M-reg and WA2M-site discrepancies for Ca diverge in different directions at Asa compared to Flakaliden.
Another source of uncertainty associated with the release of Ca is the role of minerals with high dissolution rates that occur in low abundance, for example apatite, pyroxene and calcite. Apatite was included in MA2M, but if present in the soils studied it was below the detection limit of 1 wt % in the XRPD analyses as were pyroxene and calcite (Casetou-Gustafson et al., 2018). Additionally, the assumption made in the A2M calculations that all P determined in the geochemical analyses is allocated to apatite will likely overestimate the abundance of this mineral, since soil P can also bind to Fe and Al oxides and soil organic matter in acidic mineral soils (Weil and Brady, 2016). The relatively high abundance of paracrystalline Fe-oxyhydroxide and Al-containing allophane and imogolite at Flakaliden indicates that this could be the case, at least at Flakaliden.
Regarding pyroxene, XRPD might also have failed to detect and quantify pyroxene due to low abundance at Flakaliden (Casetou-Gustafson et al., 2018). Analytical limitations of XRPD would thus imply that WXRPD of Ca might be underestimated at Flakaliden and Asa. However, in the absence of XRPD detection it is also possible that MA2M-reg overestimated the pyroxene contents at Flakaliden. Thus, apatite and pyroxene added relatively large uncertainties to the weathering estimates of Ca at Flakaliden due to the fact that they have a low abundance in combination with very high dissolution rates. In terms of other reactive trace mineral phases, White et al. (1996, 2017) has highlighted the importance of small amounts of calcite in intact granitoid rocks and its significance for Ca found in watershed studies. They also noted that in laboratory leaching experiments on the rocks they studied, reactive calcite became exhausted after just 1.5 years. Given the trace concentrations involved and the high solubility of calcite, it is doubtful that calcite is or has been of any long-lived significance in the soil profiles studied, even though they are derived largely from rocks of granitic composition. Despite this, the results of White et al. (1996, 2017) do suggest that calcite present in the in situ granitoid rocks underlying the soils may well contribute to Ca export from the catchment. Additionally, the overestimation of the slowly weatherable mineral illite by MA2M-reg (Casetou-Gustafson et al., 2018) resulted in an underestimation of Ca release by WA2M-reg at Flakaliden, since less Ca was allocated to the more weatherable minerals, although it should also be noted parenthetically that Ca can only occur as an exchangeable cation in illite; it is not an element that occurs as part of the illite crystal structure, such that the “illite” composition used in PROFILE is in need of some revision.
4.3.3 Magnesium release rates
At both study sites, a large number of Mg-containing minerals contributed to the release of Mg, but amphibole was the predominant mineral according to WXRPD and WA2M-site. The only significant discrepancy in the Mg release rates was revealed for WA2M-site at Asa, which resulted in an overestimation by 41 %. This overestimation was an effect of an underestimated contribution from amphibole in combination with overestimated contributions from hydrobiotite and trioctahedral mica. This result for Asa supported our second hypothesis. At Flakaliden, WA2M-site produced the same shift in the contribution of Mg by minerals, but the net effect was a very small and nonsignificant discrepancy to WXRPD. As was noted for Ca, the different outcomes of using site-specific mineralogies at Asa and Flakaliden has no systematic underlying pattern.
Using PROFILE based on regional mineralogy resulted in surprisingly low and nonsignificant discrepancies in Mg release rate, despite both the qualitative and quantitative mineralogies being very different from XRPD, particularly at Flakaliden. For example, both pyroxene and illite were included in MA2M-reg, but not in MXRPD. Thus, at Flakaliden, the overestimation of illite in MA2M-reg caused an underestimation of Mg release rates comparable to the underestimation of Ca release rates.
4.3.4 Potassium release rates
Weathering of K feldspar was the most important source of K release by PROFILE regardless of the different types of mineralogy input. Casetou-Gustafson et al. (2018) showed a strong negative correlation between MA2M-reg and MXRPD for two of the major K-bearing minerals observed at both study sites, i.e., illite (or dioctahedral mica, muscovite) and K feldspar. Contrary to our second hypothesis, the results of the present study demonstrate that over- or underestimation of WA2M-reg compared to WXRPD cannot be explained by significant negative correlation of illite and K feldspar in MA2M-reg. However, this is likely related to the fact that illite and K feldspar have the lowest and also quite similar dissolution rates among minerals included in PROFILE (i.e., the highest dissolution coefficients, Table 3). Although very different inputs in relation to K-bearing minerals produced very similar outputs, we note that this appears contradictory to differences in the behavior of K feldspars and K micas as sources of K via weathering to plants, as reviewed for example by Thompson and Ukrainczyk (2002). Additionally we note that Hodson et al. (1997) compared reaction rate constants for different minerals from Sverdrup et al. (1990) with their own calculations and the discrepancies were relatively large for some minerals, e.g. muscovite.
Based on comparing the full solution span of normative mineralogy from the A2M program to measured reference mineralogy from XRPD, overall similar weathering rates were generated by the different mineralogical inputs to the PROFILE model. However, the underlying contributions from different minerals to the overall rates differed markedly. Although the similarity of overall rates lends some support to the use of normative mineralogy as input to weathering models, the details of the comparison reveal potential short-comings and room for improvements in the use of normative mineralogies.
Compared with regional mineralogy, weathering rates based on site-specific mineralogy were more comparable to the reference rates generated from XRPD mineralogy, in line with hypothesis 1, at one of the study sites (Flakaliden), but not at the other (Asa). Thus, although intuitively the more detailed site-specific quantitative mineralogy data might be expected to give more comparable results, this is not supported by this study.
For Ca and Mg the differences between weathering rates based on different mineralogies could be explained by differences in the content (modeled or actual) of some specific Ca- and Mg-bearing minerals, e.g. amphibole, apatite, pyroxene, calcite and illite. Improving certainty in relation to presence versus absence of some of these minerals and if present accurate quantification at low levels would reduce weathering rate calculation uncertainties.
High uncertainties in mineralogy, due for example to different A2M assumptions, had a surprisingly weak effect on the weathering from Na- and K-bearing minerals. This can be explained by the fact that the weathering rate constants for the minerals involved, e.g. the plagioclase feldspars and K feldspar and dioctahedral micas, are similar in PROFILE such that they compensate each other in the overall weathering rate outputs for these elements, a situation that is unlikely to reflect reality.
For more in-depth analysis of the uncertainties in weathering rates caused by mineralogy, the rate coefficients of minerals should be revisited and their uncertainties assessed. A revision of rate constants could lead to results more in line with hypothesis 1.
Data on geochemistry and mineralogical compositions are available in the supplement of Casetou-Gustafson et al. (2018, https://doi.org/10.1016/j.geoderma.2017.09.004). Nutrient content data of tree biomass were made available for this study by Sune Linder (sune.linder@slu.se). PROFILE output data and statistical outputs are available at https://doi.org/10.6084/m9.figshare.8052467.v1 (Casetou-Gustafson et al., 2019).
| Mineralogy | the identity (specific mineral or mineral group) and stoichiometry (specific mineral chemical composition) of minerals that are present at a certain geographic unit, a particular site (site-specific mineralogy) or a larger geographic province (regional mineralogy) |
| Quantitative | the quantitative information (wt %) on the abundance of specific minerals in the soil |
| mineralogy |
| Abbreviations | |
| MXRPD | quantitative mineralogy based on XRPD (amount) and electron microprobe analysis (composition) |
| MA2M-reg | quantitative mineralogy calculated with the A2M model and using regional mineralogy input |
| MA2M-site | quantitative mineralogy calculated with the A2M model and using site-specific mineralogy input |
| WXRPD | weathering rate based on quantitative mineralogy determined by direct XRPD and electron microprobe analysis |
| WA2M | weathering rate based on quantitative mineralogy determined by the A2M model (unspecific mineralogy input) |
| WA2M-reg | weathering rate based on quantitative mineralogy determined by the A2M model, and assuming regional mineralogy input |
| WA2M-site | weathering rate based on quantitative mineralogy determined by the A2M model and assuming site-specific mineralogy input |
The supplement related to this article is available online at: https://doi.org/10.5194/bg-16-1903-2019-supplement.
SCG carried out the study design, data treatment, PROFILE model analyses, interpretation and writing. CA helped design the study and developed the PROFILE model. BAO helped design the study. CA, BAO and SH contributed to interpretation and writing.
The authors declare that they have no conflict of interest.
This article is part of the special issue “Quantifying weathering rates for sustainable forestry (BG/SOIL inter-journal SI)”. It is not associated with a conference.
Financial support came from The Swedish research Council for Environment, Agricultural Sciences and Spatial Planning (212-2011-1691) (FORMAS) (Strong Research Environment, QWARTS) and the Swedish Energy Agency (p36151-1). Stephen Hillier acknowledges the support of the Scottish Government's Rural and Environment Science and Analytical Services Division (RESAS). We thank Salim Belyazid for his contribution to the design of the study. We also acknowledge the constructive comments of the anonymous reviewers which helped to improve the paper.
This paper was edited by Suzanne Anderson and reviewed by Paul Schroeder and one anonymous referee.
Aagaard, P. and Helgeson, H. C.: Thermodynamic and kinetic constraints on rection rates among minerals and aqueous solutions: 1. Theoretical considerations, Am. J. Sci., 282, 237–285, 1982.
Akselsson, C., Olsson, J., Belyazid, S., and Capell, R.: Can increased weathering rates due to future warming compensate for base cation losses following whole-tree harvesting in spruce forests?, Biogeochemistry, 128, 89–105, 2016.
Akselsson, C., Westling, O., Sverdrup, H., and Gundersen, P.: Nutrient and carbon budgets in forest soils as decision support in sustainable forest management, Forest Ecol. Manag., 238, 167–174, 2007a.
Akselsson, C., Westling, O., Sverdrup, H., Holmqvist, J., Thelin, G., Uggla, E., and Malm, G.: Impact of harvest intensity on long-term base cation budgets in Swedish forest soils, Water Air Soil Poll., 7, 201–210, 2007b.
Albaugh, T. J., Bergh, J., Lundmark, T., Nilsson, U., Stape, J. L., Allen, H. L., and Linder, S.: Do biological expansion factors adequately estimate stand-scale aboveground component biomass for Norway spruce?, Forest Ecol. Manag., 258, 2628–2637, 2009.
Allen, B. L. and Hajek, B. F.: Mineral occurrence in soil environments, in: Minerals in Soil Environments, edited by: Dixon, J. B., and Weed, S. B., SSSA Book series, No. 1, Soil Sci. Soc. Am. J., Madison, USA, 199–278, 1989.
Andrist-Rangel, Y., Simonsson, M., Andersson, S., Öborn, I., and Hillier, S.: Mineralogical budgeting of potassium in soil: a basis for understanding standard measures of reserve potassium, J. Plant Nutr. Soil Sc., 169, 605–615, 2006.
Bergh, J., Linder, S., and Bergstrom, J.: Potential production of Norway spruce in Sweden, Forest Ecol. Manag., 204, 1–10, 2005.
Blum, A. E. and Stillings, L. L.: Feldspar dissolution kinetics, in: Chemical Weathering Rates of Silicate Minerals, edited by: White, A. F. and Brantley, S. L., Reviews Mineral., Mineralogical Soc. Amer., Chantilly, USA, 291–351, 1995.
Casetou-Gustafson, S., Hillier, S., Akselsson, C., Simonsson, M., Stendahl, J., and Olsson, B. A.: Comparison of measured (XRPD) and modeled (A2M) soil mineralogies: A study of some Swedish forest soils in the context of weathering rate predictions, Geoderma, 310, 77–88, 2018.
Casetou-Gustafson, S., Akselsson, C., Hillier, S., and Olsson, B.: The importance of mineral determinations to PROFILE base cation weathering rates, figshare, https://doi.org/10.6084/m9.figshare.8052467.v1, 2019.
Chou, L. and Wollast, R.: Steady-state kinetics and dissolution mechanisms of albite, Am. J. Sci., 285, 963–993, 1985.
de Jong, J., Akselsson, C., Egnell, G., Löfgren, S., and Olsson, B. A.: Realizing the energy potential of forest biomass in Sweden–How much is environmentally sustainable?, Forest Ecol. Manag., 383, 3–16, 2017.
Fröberg, M., Grip, H., Tipping, E., Svensson, M., Stromgren, M., and Kleja, D. B.: Long-term effects of experimental fertilization and soil warming on dissolved organic matter leaching from a spruce forest in Northern Sweden, Geoderma, 200, 172–179, 2013.
Futter, M. N., Klaminder, J., Lucas, R. W., Laudon, H., and Kohler, S. J.: Uncertainty in silicate mineral weathering rate estimates: source partitioning and policy implications, Environ. Res. Lett., 7, 024025, https://doi.org/10.1088/1748-9326/7/2/024025, 2012.
Hellsten, S., Helmisaari, H. S., Melin, Y., Skovsgaard, J. P., Kaakinen, S., Kukkola, M., Saarsalmi, A., Petersson, H., and Akselsson, C.: Nutrient concentrations in stumps and coarse roots of Norway spruce, Scots pine and silver birch in Sweden, Finland and Denmark, Forest Ecol. Manag., 290, 40–48, 2013.
Hillier, S.: Use of an air brush to spray dry samples for X-ray powder diffraction, Clay Miner., 34, 127–127, 1999.
Hillier, S.: Quantitative analysis of clay and other minerals in sandstones by X-ray powder diffraction (XRPD), in: Clay mineral cements in sandstones, edited by: Worden, R. and Morad, S., Int. As. Sed., John Wiley and Sons Ltd., Oxford, UK, 34, 213–251, 2003.
Hodson, M. E., Langan, S. J., and Meriau, S.: Determination of mineral surface area in relation to the calculation of weathering rates, Geoderma, 83, 35–54, 1998.
Hodson, M. E., Langan, S. J., and Wilson, M. J.: A sensitivity analysis of the PROFILE model in relation to the calculation of soil weathering rates, Appl. Geochem., 11, 835–844, 1996.
Hodson, M. E., Langan, S. J., and Wilson, M. J.: A critical evaluation of the use of the PROFILE model in calculating mineral weathering rates, Water Air Soil Poll., 98, 79–104, 1997.
Jönsson, C., Warfvinge, P., and Sverdrup, H.: Uncertainty in predicting weathering rate and environmental stress factors with the PROFILE model, Water Air Soil Poll., 81, 1–23, 1995.
Karlsson, P.-E., Ferm, M., Hultberg, H., Hellsten, S., Akselsson, C., and Karlsson, G. P.: Totaldeposition av kväve till skog, IVL Swedish Environmental Research Institute, Stockholm, Sweden 35 pp., 2012.
Karlsson, P.-E., Ferm, M., Hultberg, H., Hellsten, S., Akselsson, C., and Karlsson, G. P.: Totaldeposition av baskatjoner till skog, IVL Swedish Environmental Research Institute, Stockholm, Sweden, 63 pp., 2013.
Kleeberg, R.: Results of the second Reynolds Cup contest in quantitative mineral analysis, International Union of Crystallography, Commission on Powder Diffraction Newsletter, 30, 22–24, 2005.
Kolka, R. K., Grigal, D. F., and Nater, E. A.: Forest soil mineral weathering rates: Use of multiple approaches, Geoderma, 73, 1–21, 1996.
Koseva, I. S., Watmough, S. A., and Aherne, J.: Estimating base cation weathering rates in Canadian forest soils using a simple texture-based model, Biogeochemistry, 101, 183–196, 2010.
Kronnäs, V., Akselsson, C., and Belyazid, S.: Dynamic modelling of weathering rates – the benefit over steady-state modelling, SOIL, 5, 33–47, https://doi.org/10.5194/soil-5-33-2019, 2019.
Langan, S. J., Sverdrup, H. U., and Coull, M.: The calculation of base cation release from the chemical weathering of Scottish soils using the PROFILE model, Water Air Soil Poll., 85, 2497–2502, 1995.
Linder, S.: Foliar analysis for detecting and correcting nutrient imbalances in Norway spruce, Ecol. Bull., 178–190, 1995.
Löfgren, S., Aastrup, M., Bringmark, L., Hultberg, H., Lewin-Pihlblad, L., Lundin, L., Karlsson, G. P., and Thunholm, B.: Recovery of Soil Water, Groundwater, and Streamwater From Acidification at the Swedish Integrated Monitoring Catchments, Ambio, 40, 836–856, 2011.
McCarty, D. K.: Quantitative mineral analysis of clay-bearing mixtures: the “Reynolds Cup” contest, IUCr CPD Newsletter, 27, 12–16, 2002.
Olsson, M., Rosén, K., and Melkerud, P.-A.: Regional modelling of base cation losses from Swedish forest soils due to whole-tree harvesting, Appl. Geochem., 8, 189–194, 1993.
Omotoso, O., McCarty, D. K., Hillier, S., and Kleeberg, R.: Some successful approaches to quantitative mineral analysis as revealed by the 3rd Reynolds Cup contest, Clay Clay Miner., 54, 748–760, 2006.
Posch, M. and Kurz, D.: A2M – A program to compute all possible mineral modes from geochemical analyses, Comput. Geosci., 33, 563–572, 2007.
Raven, M. D. and Self, P. G.: Outcomes of 12 years of the Reynolds Cup quantitative mineral analysis round robin, Clay Clay Miner., 65, 122–134, 2017.
R Core Team: R: A Language and Environment for Statistical Computing, R Foundation for Statistical Computing, Vienna, Austria, 2016.
Röser, D., Asikainen, A., Raulund-Rasmussen, K., and Møller, I. (Eds.): Sustainable use of wood for energy – a synthesis with focus on the Nordic–Baltic region, Springer, Berlin, 2008.
Simonsson, M. and Berggren, D.: Aluminium solubility related to secondary solid phases in upper B horizons with spodic characteristics, Eur. J. Soil Sci., 49, 317–326, 1998.
Staelens, J., Houle, D., De Schrijver, A., Neirynck, J., and Verheyen, K.: Calculating dry deposition and canopy exchange with the canopy budget model: Review of assumptions and application to two deciduous forests, Water Air Soil Poll., 191, 149–169, 2008.
Starr, M., Lindroos, A.-J., Tarvainen, T., and Tanskanen, H.: Weathering rates in the Hietajärvi Integrated Monitoring catchment, Boreal Environ. Res., 3, 275–285, 1998.
Stendahl, J., Lundin, L., and Nilsson, T.: The stone and boulder content of Swedish forest soils, Catena, 77, 285–291, 2009.
Stendahl, J., Akselsson, C., Melkerud, P.-A., and Belyazid, S.: Pedon-scale silicate weathering: comparison of the PROFILE model and the depletion method at 16 forest sites in Sweden, Geoderma, 211, 65–74, 2013.
Sverdrup, H., De Vries, W., and Henriksen, A.: Mapping critical loads, Nordic Council of Ministers, Copenhagen, Denmark, Environmental Report 14, 124 pp., 1990.
Sverdrup, H.: Geochemistry, the key to understanding environmental chemistry, Sci. Total Environ., 183, 67–87, 1996.
Sverdrup, H. and Rosen, K.: Long-term base cation mass balances for Swedish forests and the concept of sustainability, Forest Ecol. Manag., 110, 221–236, 1998.
Sverdrup, H. and Warfvinge, P.: Calculating Field Weathering Rates Using a Mechanistic Geochemical Model Profile, Appl. Geochem., 8, 273–283, 1993.
Thompson, M. L. and Ukrainczyk, L.: Micas, in: Soil mineralogy with environmental applications, edited by: Dixon, J. B. and Schulze, D. G., SSSA Book series, No. 7, Soil Sci. Soc. Am. J., Madison, USA, 431–466, 2002.
Viro, P. J.: On the determination of stoniness, Communicationes Instituti Forestalis Fenniae, 40, 23 pp., 1952.
Warfvinge, P. and Sverdrup, H.: Critical loads of acidity to Swedish forest soils: methods, data and results, Lund University, 1995.
Weil, R. R. and Brady, N. C. (Eds.): Soil phosphorus and potassium, in: The nature and properties of soils, 15th edn., Pearson Education, Upper Saddle River, USA, 643–693, 2016.
White, A. F., Blum, A. E., Schulz, M. S., Bullen, T. D., Harden, J. W., and Peterson, M. L.: Chemical weathering rates of a soil chronosequence on granitic alluvium: 1. Quantification of mineralogical and surface area changes and calculation of primary silicate reaction rates, Geochim. Cosmochim. Ac., 60, 2533–2550, 1996.
White, A. F., Schulz, M. S., Lawrence, C. R., Vivit, D. V., and Stonestrom, D. A.: Long-term flow-through column experiments and their relevance to natural granitoid weathering rates, Geochim. Cosmochim. Ac., 202, 190–214, 2017.
Whitfield, C., Watmough, S., Aherne, J., and Dillon, P.: A comparison of weathering rates for acid-sensitive catchments in Nova Scotia, Canada and their impact on critical load calculations, Geoderma, 136, 899–911, 2006.
Wikstrom, P., Edenius, L., Elfving, B., Eriksson, L. O., Lamas, T., Sonesson, J., Ohman, K., Wallerman, J., Waller, C., and Klinteback, F.: The Heureka forestry decision support system: an overview, Mathematical and Computational Forestry and Natural Resources Sciences, 3, 87–94, 2011.
Yu, L., Belyazid, S., Akselsson, C., van der Heijden, G., and Zanchi, G.: Storm disturbances in a swedish forest – A case study comparing monitoring and modelling, Ecol. Model., 320, 102–113, 2016.
Yu, L., Zanchi, G., Akselsson, C., Wallander, H., and Belyazid, S.: Modeling the forest phosphorus nutrition in a southwestern Swedish forest site, Ecol. Model., 369, 88–100, 2018.
Zanchi, G., Belyazid, S., Akselsson, C., and Yu, L.: Modelling the effects of management intensification on multiple forest services: a Swedish case study, Ecol. Model., 284, 48–59, 2014.
Zetterberg, T., Kohler, S. J., and Lofgren, S.: Sensitivity analyses of MAGIC modelled predictions of future impacts of whole-tree harvest on soil calcium supply and stream acid neutralizing capacity, Sci. Total Environ., 494–495, 187–201, 2014.