the Creative Commons Attribution 4.0 License.
the Creative Commons Attribution 4.0 License.
 | 12 Jul 2019
Nutrient distribution and nitrogen and oxygen isotopic composition of nitrate in water masses of the subtropical southern Indian Ocean
Natalie C. Harms
Niko Lahajnar
Birgit Gaye
Tim Rixen
Kirstin Dähnke
Markus Ankele
Ulrich Schwarz-Schampera
Kay-Christian Emeis
The Indian Ocean subtropical gyre (IOSG) is one of five extensive subtropical gyres in the world's ocean. In contrast to those of the Atlantic and Pacific oceans, the IOSG has been sparsely studied. We investigate the water mass distributions based on temperature, salinity and oxygen data, and the concentrations of water column nutrients and the stable isotope composition of nitrate, using water samples collected between ∼30∘ S and the Equator during two expeditions: MSM 59/2 in 2016 and SO 259 in 2017. Our results are the first from this oceanic region and provide new information on nitrogen sources and transformation processes. We identify the thick layer of nutrient-depleted surface waters of the oligotrophic IOSG with nitrate () and phosphate () concentrations of < 3 and < 0.3 µmol kg−1, respectively (< 300 m; σ < 26.4 kg−1 m−3). Increased nutrient concentrations towards the Equator represent the northern limb of the gyre, which is characterized by typical strong horizontal gradients of the outcropping nutriclines. The influx of the Subantarctic Mode Water (SAMW) from the Southern Ocean injects oxygen-saturated waters with preformed nutrients, indicated by the increased N and O isotope composition of nitrate (δ15N > 7 ‰; δ18O > 4 ‰) at 400–500 m (26.6–26.7 kg−1 m−3), into the subtropical thermocline. These values reflect partial N assimilation in the Southern Ocean. Moreover, in the northern study area, a residue of nitrate affected by denitrification in the Arabian Sea is imported into intermediate and deep water masses (> 27.0 kg−1 m−3) of the gyre, indicated by an N deficit (N* 1 to −4 µmol kg−1) and by elevated isotopic ratios of nitrate (δ15N > 7 ‰; δ18O > 3 ‰). Remineralization of partially assimilated organic matter, produced in the subantarctic, leads to a decoupling of N and O isotopes in nitrate and results in a relatively low Δ(15–18) value of < 3 ‰ within the SAMW. In contrast, remineralization of 15N-enriched organic matter from the Arabian Sea indicates higher Δ(15–18) values of > 4 ‰ within the Red Sea–Persian Gulf Intermediate Water (RSPGIW). Thus, the subtropical southern Indian Ocean is supplied by preformed nitrate from the lateral influx of water masses from regions exhibiting distinctly different N-cycle processes documented in the dual isotope composition of nitrate. Additionally, a significant contribution of N2 fixation between 20.36 and 23.91∘ S is inferred from reduced δ15N– values towards surface waters (upward decrease of δ15N ∼2.4 ‰), N* values of > 2 µmol kg−1 and a relatively low Δ(15–18) value of < 3 ‰. A mass and isotope budget implies that at least 32 %–34 % of the nitrate in the upper ocean between 20.36 and 23.91∘ S is provided from newly fixed nitrogen, whereas N2 fixation appears to be limited by iron or temperature south of 26∘ S.
- Article
(2153 KB) - Full-text XML
-
Supplement
(509 KB) - BibTeX
- EndNote


The southern Indian Ocean is dominated by a subtropical anticyclonic gyre (Sarmiento and Gruber, 2006; Williams and Follows, 2003), the Indian Ocean subtropical gyre (IOSG), one of the major five subtropical gyres in the world's ocean. In contrast to those of the Atlantic and Pacific oceans, where subtropical gyres occur north and south of the Equator, the Indian Ocean developed only one subtropical gyre south of the Equator. In comparison with other subtropical gyres, the IOSG has been sparsely investigated. Between 10 and 20∘ S, the South Equatorial Current marks the northern limb of the IOSG (SEC; Duing, 1970; Pickard and Emery, 1982; Woodberry et al., 1989) and separates the subtropical gyre of the southern Indian Ocean from the southern equatorial Indian Ocean. In the centre of the subtropical gyre, Ekman transport leads to an intensive downwelling (Williams and Follows, 1998), which results in a deepening of thermoclines, pycnoclines and nutriclines. These layers shoal towards the fringe of the IOSG causing steep horizontal gradients (McClain et al., 2004). Due to the intense downwelling and the resulting deepening of nutriclines, subtropical gyres form extensive oligotrophic regions, which occupy ∼40 % of the Earth's surface (McClain et al., 2004). As the biological productivity within these oligotrophic regions is relatively low, they are often referred to as “oceanic deserts” (Clark et al., 2008). However, due to their immense size they contribute significantly to atmosphere–ocean carbon fluxes (McClain et al., 2004).
Future global warming is assumed to strengthen stratification in low-latitude oceans and to expand the low-productivity subtropical gyres, accompanied by a decrease of the net primary production (Behrenfeld et al., 2006). This might have crucial impacts on the marine nitrogen cycle. To study the marine nitrogen cycle, we use nitrate and phosphate concentrations as well as the isotopic signature of nitrate (Deutsch et al., 2001, 2007; Gruber and Sarmiento, 1997; Lehmann et al., 2005; Sigman et al., 2005). The dominant source and sink of fixed, reactive nitrogen in the ocean are diazotrophic N2 fixation and heterotrophic denitrification, respectively (Deutsch et al., 2001). N2 fixation by diazotrophs, such as Trichodesmium is observed over much of the tropical and oligotrophic subtropical oceans (Karl et al., 1995; Michaels et al., 1996; Capone et al., 1997; Emerson et al., 2001). N2 fixation compensates for the loss of reactive nitrogen during the heterotrophic denitrification if the ocean's marine nitrogen cycle is in a steady state (Deutsch et al., 2001).
The inputs of nitrogen (N) via N2 fixation are detached from inputs of phosphorus (P), leading to a decoupling of the nitrate () and phosphate () pool. Deviations in the to relationship from the Redfield stoichiometry are used to study rates of both N2 fixation and denitrification (Gruber and Sarmiento, 1997; Sigman et al., 2005). Therefore, the tracer N* is used as an indicator of excesses and deficits in relative to the global ratio and is expressed using the following formula: N* = []–16*[] + 2.9 µmol kg−1. The concept of N* has been discussed in detail by Gruber and Sarmiento (1997) and slightly modified by Deutsch et al. (2001). The concentration of 2.9 µmol kg−1 was added to bring the global mean of N* to about zero (Sarmiento and Gruber, 2006). However, the use of N* has limitations. First, the deviation from the Redfield stoichiometry may not always be a result of N inputs or outputs (N2 fixation and denitrification) but may also reflect variations in the uptake and remineralization processes (Sigman et al., 2005). Second, input and losses partially overprint each other when they occur simultaneously in the same water body.
We use stable isotopes of nitrate (N and O) to overcome the weakness associated with the N* approach and distinguish between sources and sinks of fixed nitrogen to study transfer processes in the nitrogen cycle (e.g. N assimilation, denitrification, nitrification and N2 fixation), also when they occur simultaneously. Isotope ratios are reported in per mille (‰) using the δ-notation (δ15N = ; δ18O = , with air N2 and VSMOW as references for 15N∕14N and 18O∕16O, respectively). During the consumption processes of nitrate, e.g. N assimilation or denitrification, lighter isotopes are preferentially assimilated, leaving the substrate enriched in 15N and 18O according to its isotope effect (15ε and 18ε, e.g. 15ε is defined as , where 14k and 15k are the rate coefficients of the reactions for the 14N- and 15N-bearing forms of nitrate). Several culture experiments indicate that δ15N and δ18O of the residual nitrate pool rise equally as consumption proceeds; consequently, the O-to-N isotope effect (18ε:15ε) is close to one (Granger et al., 2004; Rafter et al., 2013; Sigman et al., 2003, 2005).
While nitrate consumption processes such as N assimilation and denitrification lead to indistinguishable imprints on N and O isotope compositions, nitrate production processes (nitrification and N2 fixation) have very different effects on the N and O isotopes of nitrate (Rafter et al., 2013; Sigman et al., 2005). While almost all of the ammonium generated from organic N is oxidized to nitrate in the oxic subsurface waters of the open ocean, the N isotope effect associated with ammonium production and nitrification does not affect the δ15N–. Therefore, the N isotope effect depends more on the biomass being remineralized (Rafter et al., 2013; Sigman et al., 2005). In contrast, the δ18O of newly nitrified nitrate is independent of the isotopic composition of the organic matter and leads to counteracting behaviour to that of δ15N and δ18O. Consequently, the decoupling of the N and O isotopes provides a better understanding of nitrate assimilation and regeneration processes in marine environments (Casciotti et al., 2008; DiFiore et al., 2009; Sigman et al., 2005, 2009; Wankel et al., 2007).
Our investigations in the southern Indian Ocean are part of environmental studies in the INDEX (Indian Ocean Exploration) program for marine resource exploration by the Federal Institute for Geosciences and Natural Resources (BGR), Germany, and the International Seabed Authority (ISA). We use CTD (conductivity, temperature and depth) measurements and analyse seawater samples to determine nutrient concentrations and stable isotopes of nitrate (δ15N and δ18O) along a transect from the IOSG to the southern equatorial Indian Ocean. The main goal of this study is to investigate the relatively unknown hydrology and the unexplored distribution of nutrients and stable isotopes of nitrate to identify N-cycle processes within the IOSG towards the equatorial southern Indian Ocean. First, we identify the water masses and their provenance by their unique characteristic physical properties and establish the first water mass distribution model for this ocean region. In a second step, we use new nutrient and stable isotope data to determine nutrient sources for the IOSG and their role in the marine nitrogen cycle. Furthermore, we demonstrate the influence of water masses on the nutrient distribution and the isotopic composition of water column nitrate by the influx of preformed nutrients. Our results of nutrient and isotope measurements are the first in the IOSG and bridge the gap between several investigations in the Arabian Sea (e.g. Brandes et al., 1998; Gaye-Haake et al., 2005; Gaye et al., 2013; Ward et al., 2009) and in the Indian section of the Southern Ocean (e.g. Bianchi et al., 1997; DiFiore et al., 2006, 2010; Sigman et al., 1999, 2000).
2.1 CTD measurement and sample collection
In total, 313 seawater samples were collected at 15 CTD stations (Fig. 1) during two expeditions, one with R/V Maria S. Merian (MSM 59/2 “INDEX 2016-2”; November–December 2016) and one with R/V Sonne (SO 259 “INDEX 2017”; August–October 2017). The CTD was equipped with sensors to determine density, temperature, salinity and oxygen at a total of 17 CTD stations from the surface down to the sea floor; however, no water samples were collected at stations 07 and 11.
The study area covers the region of the IOSG from 30∘ S, to the SEC at 10–20∘ S and towards the Equator. A total of 14 CTD stations are located within the IOSG from 20.36 to 27.78∘ S and 67.07 to 73.92∘ E. CTD 05 is located in the region of the SEC (15.08∘ S, 74.05∘ E) and at the northern end of the IOSG. The northernmost CTD stations (CTD 01, 03; 2017) at 8.81∘ S, 75.67∘ E and 2.98∘ S, 77.16∘ E are positioned in the southern equatorial Indian Ocean, north of the SEC. Seawater samples were collected for measurements of nutrients and stable isotopes of nitrate. Samples were filtered through a Nucleopore polycarbonate filter (0.4 µm) with a metal- and silicon-free Nalgene filtration unit. The filtered water was bottled in Falcon PE tubes (45 mL) and immediately stored at −20 ∘C during the cruise. The samples were shipped as frozen airfreight (−20 ∘C) to Germany. Nutrient concentrations and stable isotopes of nitrate (N and O) were determined in the home lab immediately after arrival.
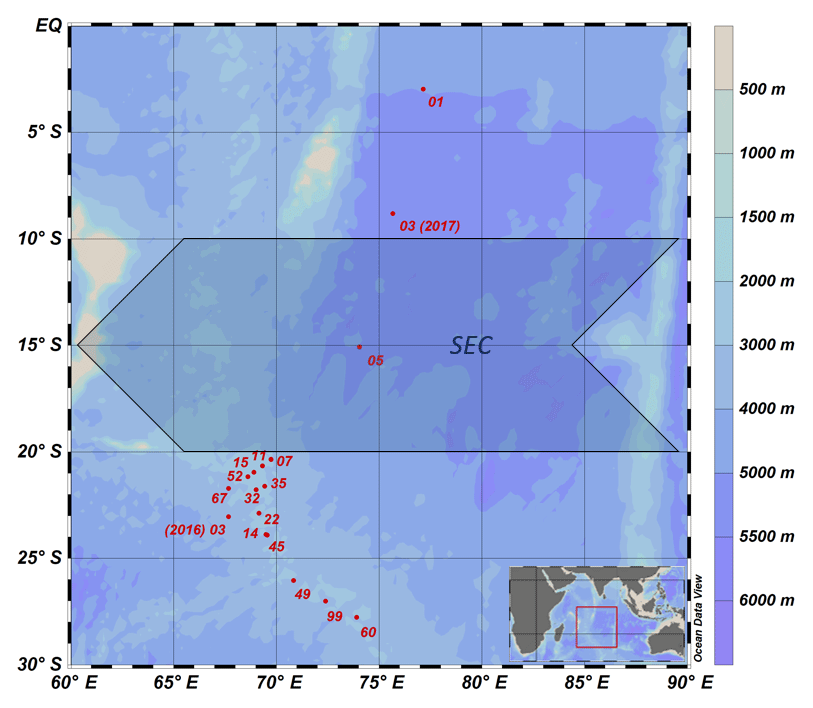
Figure 1Sampling location during the MSM 59/2 (INDEX 2016-2) and SO 259 (INDEX 2017) cruises. The shaded arrow represents the westward-directed, broad South Equatorial Current (SEC) following Woodberry (1989) from 10 to 20∘ S. Colours denote water depths.
2.2 Nutrient analyses
Nutrient concentrations (NOx, , , ) were measured with a SEAL AutoAnalyzer 3 HR using standard colourimetric methods (Grasshoff et al., 2009). Ammonia and nitrite concentrations were below the detection limit. Nitrate determination included reduction of nitrate to nitrite with a cadmium reduction column. Nitrite ions reacted with sulfanilamide to form a diazo compound, followed by a reaction to an azo dye with N-(1-naphtyl-)ethylenediamine (NEDD) and was measured at 520–560 nm. Phosphate determination followed the method of Murphy and Riley (1962). Under acid conditions a phosphomolybdic complex was formed of ortho- phosphate, antimony and molybdate ions (Wurl, 2009). Followed by the reduction of ascorbic acid, the blue colour complex was measured at 880 nm. The relative error of duplicate sample measurements was below 1.5 % for nitrate and phosphate concentrations and the detection limit was < 0.5 µmol kg−1 for NOx, and > 0.1 µmol kg−1 for .
2.3 Measurements of N and O isotopes of nitrate
Isotope measurements were only conducted for samples with nitrate concentrations > 1.7 µmol kg−1. Stable isotopes of nitrate (δ15N and δ18O) were determined using the “denitrifier” method (Casciotti et al., 2002; Sigman and Casciotti, 2001). Nitrate was converted to N2O gas using denitrifying bacteria (Pseudomonas aureofaciens). Based on nitrate concentrations, sample volumes were adjusted to yield 10 nmol N2O and were injected into suspensions of Pseudomonas aureofaciens (ATCC no. 13985) for combined analysis of δ15N and δ18O. The resulting N2O gas in the headspace was purged into a GasBench II (Thermo Finnigan), and analysed in a Delta V Advantage and a Delta V Plus mass spectrometer. The results were calibrated using IAEA-N3 (δ15N– = +4.7 ‰ and δ18O– = +25.6 ‰) and USGS-34 (δ15N– = −1.8 ‰ and δ18O– = −27.9 ‰) (Böhlke et al., 2003). A further internal potassium nitrate standard (KBI) was analysed within each run for quality assurance (δ15N– = +7.1 ‰). Isotope values were corrected using the “bracketing scheme” from Sigman et al. (2009) for δ18O– and a two-point correction referred to IAEA-N3 and USGS-34 for δ15N– and δ18O–. The standard deviation for IAEA-N3 was better than 0.2 ‰ for δ15N– and 0.3 ‰ for δ18O–, which is within the same specification for δ15N– and δ18O– for at least duplicate measurements of the samples.
3.1 Physical water column properties
South of 25∘ S the upper 170 m is characterized by an intense salinity maximum with values of > 35.5 PSU and temperatures above 15 ∘C (Figs. 2a, 3). The salinity maximum is carried northwards and is subducted underneath the surface layer within a temperature range of 22–15 ∘C and with a core density of σ= 25.5 kg−1 m−3 (∼250 m). Further north (CTD 03, 2017; 8.81∘ S) at the same density level, the salinity is significantly lower and reveals values of 35.2 PSU. The northernmost station (CTD 01, 2017; 2.89∘ S) again indicates a slight increase in salinity (> 35.3 PSU). Between 22 and 10∘ S, less saline surface water (< 35.1 PSU) lies above the density level of the salinity maximum with temperatures of > 23 ∘C and densities above 24.0 kg−1 m−3 (< 150 m). South of 15∘ S, directly underneath the salinity maximum, an oxygen maximum with values of > 4.7 mL L−1 occurs at a density range of 26.4–26.9 kg−1 m−3 (250–750 m; Fig. 2b) and temperatures between 8 and 15 ∘C (Fig. 3). The lower limit of the oxygen maximum coincides with a temperature level of 8–9 ∘C at σ= 26.9–27.0 kg−1 m−3 and marks the permanent thermocline at a depth of ∼750 m in the south and at a depth of ∼500 m in the north. Oxygen concentrations decrease towards the north and fall below 2 mL L−1 at the northernmost stations (CTD 01, CTD 03; 2017; Figs. 2b, 3). Below the permanent thermocline (< 9 ∘C), an absolute salinity minimum with values less than 34.6 PSU is found in the southern region (Figs. 2a, 3), within a density range of 26.9–27.4 kg−1 m−3 (core density σ=27.2 kg−1 m−3), which is strongly diluted further north, and temperatures are below 8 ∘C (Fig. 3). In the southern equatorial Indian Ocean at CTD 01, an increase in salinity (> 34.9 PSU; σ=27.2 kg−1 m−3) corresponds to reduced oxygen concentrations of < 1.1 mL L−1. Overall, low oxygen concentrations dominate the northern study area and extend to deeper water masses at the southernmost stations (< 3.5 mL L−1; Figs. 2b, 3).
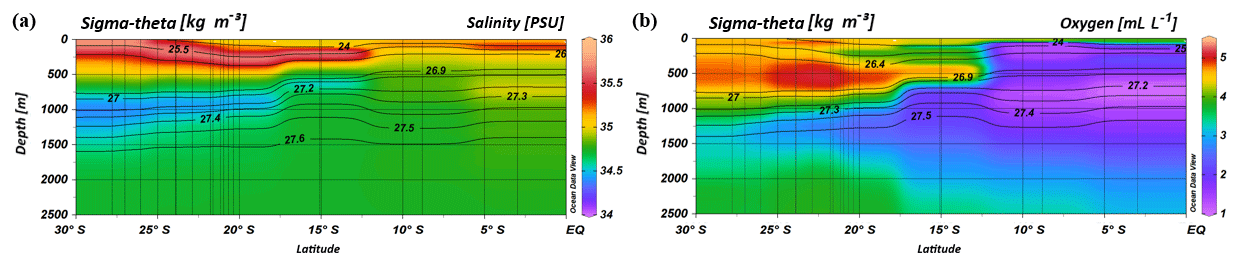
Figure 2Profiles of salinity (a) and oxygen distribution (b) from CTD measurements during the MSM 59/2 (2016) and SO 259 (2017) cruises. Contour lines indicate the potential density sigma-theta in kilograms per cubic metre (kg m−3).
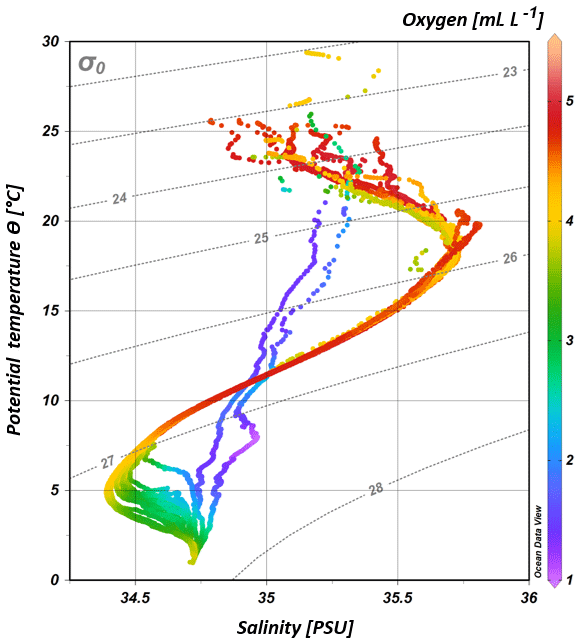
Figure 3T–S (potential temperature vs. salinity) diagram from CTD measurements during the MSM 59/2 (2016) and SO 259 (2017) cruises. The colour bar indicates oxygen concentrations, and the grey, dotted lines represent density surfaces in sigma-theta (kg m−3). The northernmost CTD stations (CTD 01, CTD 03; 2017) are characterized by low oxygen concentrations (< 2 mL L−1) and less variation in the salinity distribution, whereas the water column profiles in the IOSG indicate a distinct salinity maximum and minimum, respectively.
3.2 Nutrient concentration
Within the subtropical gyre, the upper 100 m is strongly depleted in nitrate and phosphate with concentrations less than 1 µmol kg−1 of nitrate and less than 0.1 µmol kg−1 of phosphate (Fig. 4a, b; Table 1). Within the depth range of the salinity maximum (24.9–26.4 kg−1 m−3; < 300 m), nutrient concentrations are still minor with and values of < 3 and < 0.3 µmol kg−1, respectively (Table 1). Nutrient concentrations rise within the depth range of the oxygen maximum (σ= 26.4–26.9 kg−1 m−3), where we observe concentrations of ∼11 µmol kg−1 and < 0.9 µmol kg−1 before they reach typical respective deep-sea values of > 30 µmol kg−1 and > 2 µmol kg−1 (Sarmiento and Gruber, 2006) within intermediate waters (> 26.9 kg−1 m−3; > 750 m). Across the northern fringe of the gyre, in surface waters, (CTD 05, 2017; 15.08∘ S) nutrient concentrations slightly increase (Fig. 4a, b).
Further north, at stations CTD 01 and 03 (2.98–8.81∘ S), nutrient concentrations in the upper water column reach values typical for open ocean areas that are unaffected by gyral downwelling or high biological production (Fig. 4a, b). At a water depth of 90 m, concentrations were ∼11 µmol kg−1 for nitrate and ∼1 µmol kg−1 for phosphate. Within the thermocline (23.0–27.0 kg−1 m−3; < 550 m), nutrient concentrations attain values of > 20 µmol kg−1 for nitrate and > 1.5 µmol kg−1 for phosphate, before they level out at values of > 35 µmol kg−1 for nitrate and > 2.5 µmol kg−1 for phosphate at greater depth (Table 1).
3.3 N and O isotopes of nitrate
In the upper 750 m (< 26.9 kg−1 m−3), distinct N and O isotope maxima with δ15N of > 7.0 ‰ and δ18O of > 4.0 ‰ are found at latitudes between 27.78 and 15.08∘ S (Table 1; Fig. 4c, d). N and O isotope maxima are observed at ∼400–500 m (26.6–26.7 kg−1 m−3) and correlate with the oxygen maximum of > 4.7 mL L−1. At latitudes between 23.91 and 20.96∘ S, the N isotope maximum is found at 400 m, whereas the O isotope maximum is observed at 500 m. Consequently, N and O isotope maxima indicate an offset of ∼100 m (see Supplement Tables S2 and S3). Above the isotopic maxima, both δ15N and δ18O decrease to values of ∼5.4 ‰ and ∼2.1 ‰ , respectively, in the upper 300 m; the southernmost stations (CTD 49, 60, 99; 2017) are an exception to this, as elevated δ15N values extend up to the surface (Fig. 4c). In surface waters further north (< 250 m), δ15N and δ18O increase to values of > 7.0 ‰ and > 4 ‰, respectively, at the northernmost station (CTD 01, 2017; Fig. 4c, d). Underneath this surface layer, N and O isotope ratios slightly decrease at ∼180 m, before δ15N and δ18O again rise to > 7.0 and > 3.0 ‰, with an extended maximum in the depth interval from 300 to 900 m (< 27.3 kg−1 m−3) that coincides with elevated salinities. Below the isotopic maxima in the southern region at ∼400–500 m and below the depth interval with high δ-values in the northernmost CTD station, δ15N and δ18O decrease towards deeper waters and have average respective values of 5.8 ‰ and 2.3 ‰ (Fig. 4c, d).
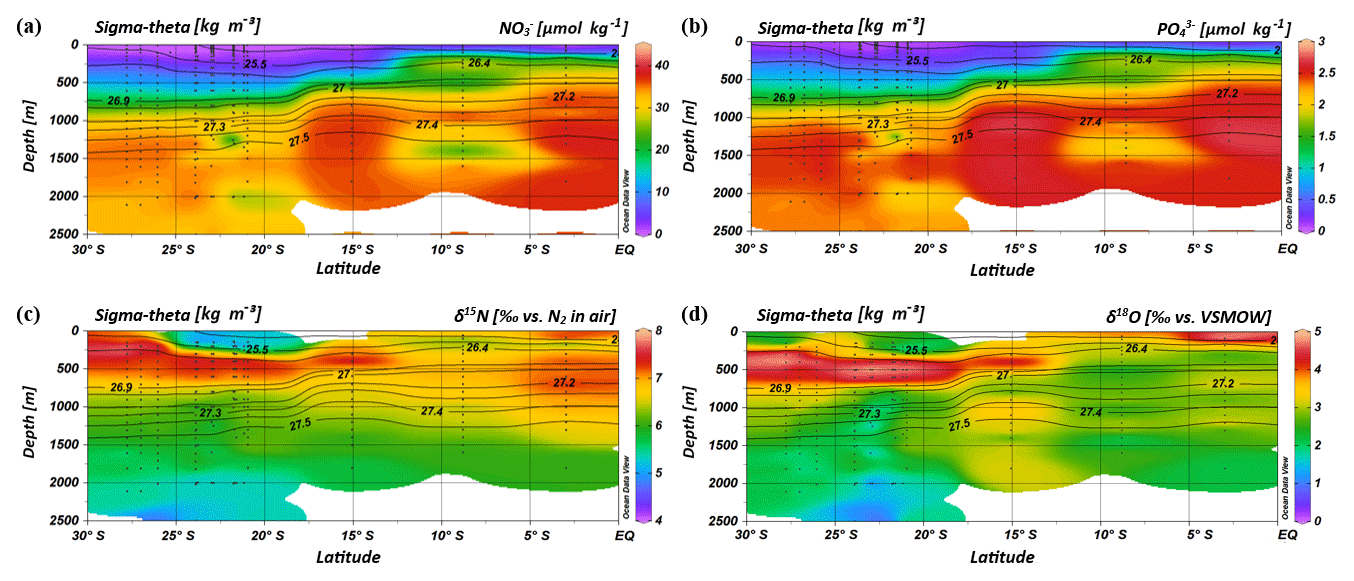
Figure 4Profiles of nitrate (a) and phosphate concentrations (b), and δ15N– (c) and δ18O– (d) of seawater samples collected during the MSM 59/2 (2016) and SO 259 (2017) cruises. Contour lines indicate the potential density sigma-theta in kilograms per cubic metre (kg m−3).
4.1 Water mass distribution
Water masses in the study area are easily discerned by their densities, salinities and oxygen concentrations (Fig. 5). In accordance with definitions from the literature, we identified water masses from the IOSG towards the southern equatorial Indian Ocean and established the first water mass distribution model for this ocean region (Fig. 6). To generate the water mass distribution model, we use salinity and oxygen distributions along sigma-theta surfaces. We separate our study area in three latitudinal sections, which demonstrate the alteration of water masses along the latitudinal transect and between the different ocean regimes (Fig. 5). We present the provenance of water masses of Antarctic and subantarctic origin converging and mixing with water masses from the southern equatorial Indian Ocean and the Arabian Sea. The water mass distribution model serves as a basis for the understanding of our nutrient and coupled N and O isotope measurements of nitrate.
4.1.1 Surface and thermocline waters (< 26.9 kg−1 m−3; < 800 m)
A high salinity surface layer (> 35.5 PSU) centred at ∼25.5 kg−1 m−3 (Fig. 5a) is described in several studies. It has been termed “southern subtropical surface water” by Muromtsev (1959), “subtropical surface water” by Wyrtki (1973) and “subtropical subsurface water” (SSW) by Schott and McCreary (2001). For further descriptions, we adopt the definition of Wyrtki (1973) and use the abbreviation SSW. The SSW is formed in the subtropical gyre of the Southern Hemisphere due to an excess of evaporation over precipitation (Schott and McCreary, 2001) at latitudes between 25 and 35∘ S (Baumgartner and Reichel, 1975). It is subducted into the thermocline of the subtropical gyre (Schott and McCreary, 2001), is detectable as far north as 15.08∘ S at CTD 05 (Fig. 3b) and is not discernable further north in the southern equatorial Indian Ocean (Figs. 5c, 6).
Less saline surface water (< 35.1 PSU) occurs above the density level of the salinity maximum (> 23 ∘C; < 24.0 kg−1 m−3; Fig. 5b) and is described by Wyrtki (1971) and Warren (1981). These low salinity values reflect an excess of precipitation over evaporation at latitudes between 0 and 10∘ S (Baumgartner and Reichel, 1975) accompanied by the influx of low salinity water (34.0–34.5 PSU) from the Pacific Ocean through the Indonesian Archipelago, called “Indonesian Throughflow” (ITF). The ITF carries less saline water westwards via the SEC within the entire thermocline (Wyrtki, 1971; You and Tomczak, 1993). Emery (2001) named this less saline surface water (34.4–35.0 PSU) “Indonesian Upper Water” (IUW; Fig. 6).
Table 1Average nitrate and phosphate concentrations and average δ15N– and δ18O– values within water masses of the southern Indian Ocean, defined along their potential density surfaces (sigma-theta) and separated into four latitudinal sections (27.78–26.05∘ S; 23.91–20.36∘ S; 15.08∘ S; and 8.81–2.98∘ S). Water mass abbreviations are as follows: Indonesian Upper Water (IUW), Subtropical Surface Water (SSW), Subantarctic Mode Water (SAMW), Indian Equatorial Water (IEW), Antarctic Intermediate Water (AAIW), Indonesian Intermediate Water (IIW), Red Sea–Persian Gulf Intermediate Water (RSPGIW), Indian Deep Water (IDW), and Circumpolar Deep Water (CDW).
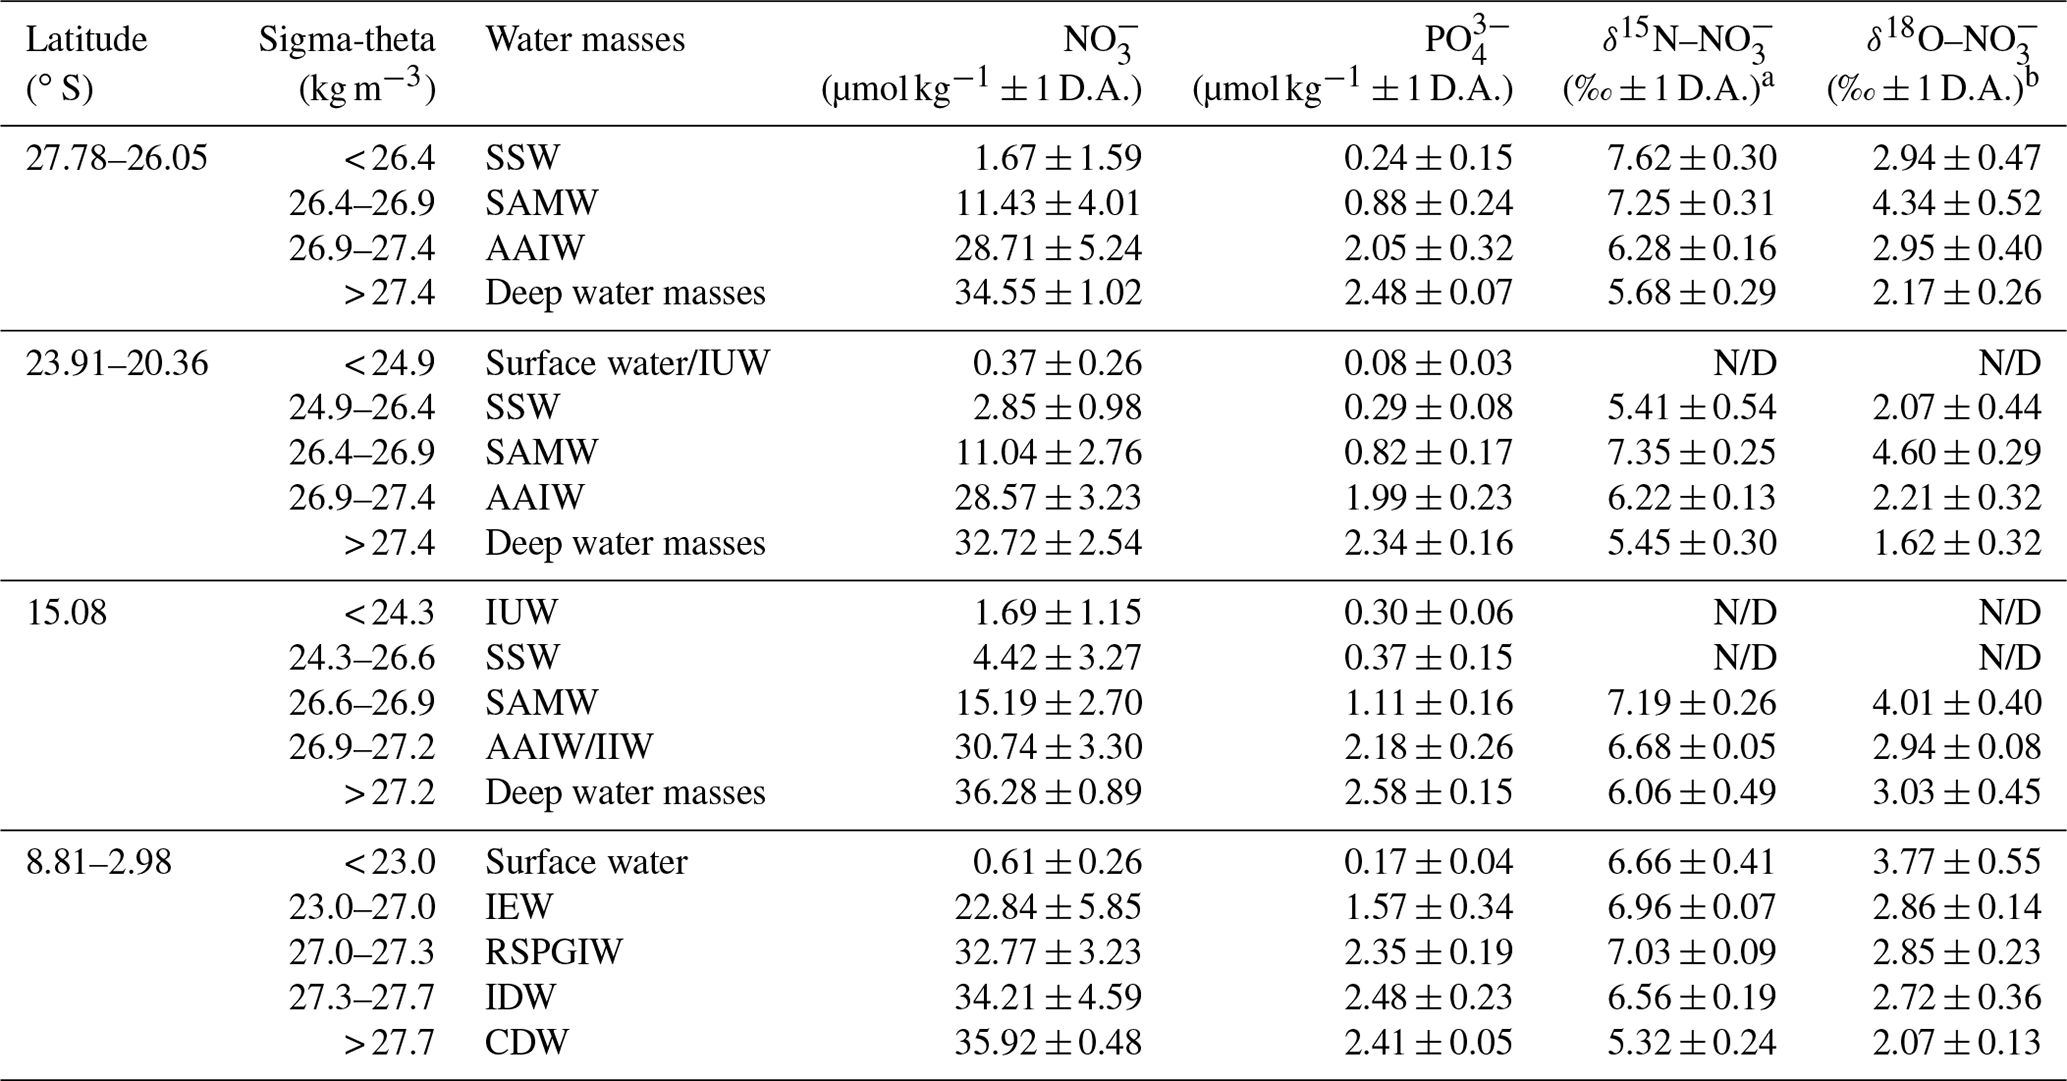
a δ15N– in per mille (‰) vs. air and b δ18O– in per mille (‰) vs. VSMOW; D.A. refers to “deviation from the average value”; N/D represents “not detectable due to insufficient nitrate concentrations”.
The oxygen maximum south of 20∘ S in a density range of 26.4–26.9 kg−1 m−3(250–750 m; Fig. 5d) corresponds to the “Subantarctic Mode Water” (SAMW; Figs 5, 6), described by McCartney (1977). It is formed at latitudes between 40 and 50∘ S and injects oxygen saturated waters at a temperature range of 6–14 ∘C into the subtropical gyre. The SAMW in the southern Indian Ocean can be separated into three modes by slightly different density distributions (Herraiz-Borreguero and Rintoul, 2011) which originate in different ocean regions. For example, a lighter mode of the SAMW is formed in the western Indian basins and is limited to the southwest portion of the subtropical gyre, whereas the denser mode is found south off Australia and is carried further north by the outer portion of the subtropical gyre, ventilating a larger fraction of the gyre interior (Herraiz-Borreguero and Rintoul, 2011). However, for our purposes we assume the SAMW to be one homogenous water mass flowing above the density surface of 26.9 kg−1 m−3. On its transition to the north, the oxygen concentrations rapidly decrease from > 4.6 mL L−1 (CTD 05; Fig. 5e) to < 1.9 mL L−1 (CTD 01, 03; Fig. 5f) due to respiration and the absence of effective ventilation in the northern Indian Ocean. The reduced vertical changes in salinity north of ∼15∘ S mark the “Indian Equatorial Water” (IEW; Fig. 6). This is described by Sharma (1976), Warren (1981), Quadfasel and Schott (1982), You and Tomczak (1993) and Schott and McCreary (2001) as a mixture of thermocline water masses from the northern and southern Indian Ocean.
4.1.2 Intermediate water masses (26.9–27.4 kg−1 m−3; 800–1000 m)
The salinity minimum (< 34.6 PSU) south of 15∘ S, in a density range of 26.9–27.4 kg−1 m−3(core density σ= 27.2 kg−1 m−3; Fig. 5a) is associated with the “Antarctic Intermediate Water” (AAIW; Fig.4; Bindoff and McDougall, 2000; Deacon, 1933; Fine, 1993; Schott and McCreary, 2001; Toole and Warren, 1993; Warren, 1981; Wyrtki, 1973; You, 1998). The AAIW is transported eastwards by the “Antarctic Circumpolar Current” (ACC), penetrates into all three oceans and extends towards the Equator to feed the intermediate waters (Fine, 1993; McCartney, 1977; Piola and Gordon, 1989; Reid, 1986, 1989; Sverdrup et al., 1942; Talley, 1996; Wüst, 1935).

Figure 5Water mass properties represented as salinity vs. sigma-theta diagrams (a, b, c) and as oxygen vs. sigma-theta diagrams (d, e, f) for CTD stations at latitudes between 20.36 and 27.78∘ S, 15.08∘ S, and 2.98 and 8.81∘ S. For water mass abbreviations see Table 1.
The salinity minimum (< 34.6 PSU) observed at station CTD 05 (15.08∘ S; Fig. 5b) has a slightly divergent core density (27.0 kg−1 m−3) compared with the AAIW (Fig. 5a). This implies a further source for the salinity minimum of the AAIW. A low-salinity water mass (∼34.8 PSU) flows along 10–15∘ S (Schott and McCreary, 2001; Wyrtki, 1971; You and Tomczak, 1993) and originates from the ITF. At intermediate depths it has been called “Indonesian Intermediate Water” (IIW; Fig. 6) by Emery and Meincke (1986) and Emery (2001).
The increase in salinity (> 34.9 PSU; Fig. 5c) further north, at the same density level as the AAIW, is caused by the inflow of saline water from the Arabian Sea, mainly from the Red Sea outflow (Warren, 1981) and is additionally fed by the outflow of the Persian Gulf (Emery and Meincke, 1986). Therefore, this water mass is called “Red Sea–Persian Gulf Intermediate Water” (RSPGIW; Fig. 6). The RSPGIW is transported towards the Equator and beyond to as far south as 10∘ S (You, 1998), recirculates in the tropical gyre, and creates the absolute oxygen minimum (< 1.1 mL L−1) caused by biogeochemical processes in the Arabian Sea (see Sect. 4.2.1).
4.1.3 Deep water masses (> 27.4 kg−1 m−3; > 1000 m)
Overall, low oxygen concentrations in the northern study area underneath the AAIW (> 27.4 kg m−3; Fig. 5f) are caused by in situ consumption (Wyrtki, 1962) and reduced ventilation in the northern Indian Ocean. The deep oxygen minimum extends towards the south (∼3.0 mL L−1) and is associated with the water mass of the “Indian Deep Water” (IDW). The IDW has higher salinities than the overlying AAIW (Bindoff and McDougall, 2000; Mantyla and Reid, 1995; Schott and McCreary, 2001; Talley, 2013) with values of > 34.6 PSU below the density range of the AAIW (Fig. 5a). The IDW ( kg−1 m−3) flows in the density range just above the “Circumpolar Deep Water” (CDW; Fig. 6) and a further increase in salinity (34.62–34.73 PSU) and in the oxygen concentration at the 2 ∘C temperature level (Emery, 2001) marks the transition between the IDW and the underlying CDW.

Figure 6Water mass distribution model from 30∘ S to the Equator. The CTD stations taken into account for this transect ranged between 67.07 and 77.16∘ E. Dotted lines represent N–S current directions and circled crosses indicate latitudinal directions from E to W. For water mass abbreviations see Table 1.
4.2 Nutrient distribution and N-cycle processes
4.2.1 Nutrient supply in the oligotrophic subtropical gyre and lateral transfer across the gyre boundaries
Intense downwelling in the centre of the IOSG is induced by the convergence of horizontal Ekman volume flux (Williams and Follows, 2003) and creates the thick layer of nutrient-depleted surface waters within the IUW and SSW (Fig. 7a, b, Table 1), and also within the underlying SAMW. The northward increase in nutrients at ∼15∘ S (CTD 05, 2017) marks the northern boundary of the subtropical gyre and the maximum extension of the IUW, SSW and SAMW (Table 1). Further increase in nutrient concentrations within the IEW indicates the transition from the subtropical gyre towards the southern equatorial Indian Ocean identified by the characteristic shoaling of the nutricline at the northern fringe of the gyre (Table 1, Fig. 7a, b). The IEW is not a well-defined water mass, but rather a mixture of thermocline waters from the southern Indian Ocean and from the nutrient-enriched northern Indian Ocean. Therefore, just below the upper 100 m nutrient concentrations increase up to ∼23 µmol kg−1 nitrate and ∼1.6 µmol kg−1 phosphate (Table 1) at the northernmost stations (CTD 01, 03; 2017) and indicate the increasing influence of the nutrient-enriched northern Indian Ocean (Gaye et al., 2013). This increased northern influence is also reflected by the ratios, which exhibit values of less than 8 in the upper 200 m of the subtropical gyre, but increase towards the southern equatorial Indian Ocean, tracking the outcropping nutriclines (Fig. 7c). Low ratios are typical in surface waters of oligotrophic regions because nitrate commonly becomes depleted prior to phosphate (Sarmiento and Gruber, 2006; Deutsch et al., 2007). Due to the intense downwelling in the centre of the IOSG, the supply of nutrients by vertical mixing is reduced or absent in the gyre (Williams and Follows, 1998). Thus, lateral transfer across the gyre boundaries and biological N2 fixation are major processes supplying nutrients to the euphotic zone of the subtropical gyre.

Figure 7Latitudinal profiles from south to north with an overlay of the water mass distribution model (white contour lines) in the southern Indian Ocean for nitrate (a) and phosphate (b) concentrations, the ratio (c), N* (d), δ15N– (e) and δ18O– of nitrate (f) and nitrate Δ(15–18) as the difference between δ15N– and δ18O–. For water mass abbreviations see Fig. 6.
The water masses entering the study area from the Southern Ocean and from the northern Indian Ocean have characteristic nutrient concentrations and isotope fingerprints of reactive nitrogen, so that some of the water masses are clearly discernible by the distribution of nutrients and the isotopic composition of nitrate within the IOSG. Our samples show ratios of 14.56 on average (Fig. 8). These ratios are lower than the global ocean mean of 16:1 (Redfield, 1934, 1963). Furthermore, measurements in the Arabian Sea reveal typical ratios of 12.81 (Codispoti et al., 2001), even lower than our detected ratios. Consequently, the average ratio of 14.56 falls between the global ocean mean of 16:1 (Redfield, 1934, 1963) and the typical ratio in the Arabian Sea of 12.81 (Codispoti et al., 2001). This alone indicates the mixing of water masses of southern and northern Indian Ocean origin.
The deviation from the Redfield stoichiometry (Redfield, 1934, 1963) is quantified by the tracer N*. The analytical error on N* estimate based on the relative error for nitrate and phosphate analysis was below 1.5 % for duplicate sample measurements. The Arabian Sea is characterized by an extensive oxygen deficit zone (ODZ) that induces denitrification in mid-water depths (150–400 m) (Gaye et al., 2013) and leads to an N deficit and, in turn, to negative N* values (e.g. Bange et al., 2005; Rixen et al., 2005; Gaye et al., 2013). Our data set reveals values of about −1 µmol kg−1 within the RSPGIW and values lower than −4 µmol kg−1 within the IDW (Fig. 7d), which coincide with the oxygen minimum (see Sect. 4.1). Consequently, negative N* values are a result of the influx of water masses from the Arabian Sea, which are affected by denitrification. To strengthen this assumption and to compensate for the limitations of the previously mentioned N* approach, we use stable isotope measurements.
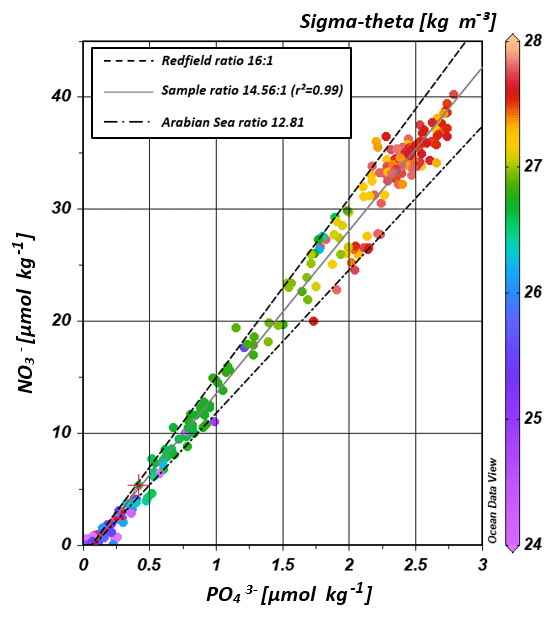
Figure 8Correlation of nitrate vs. phosphate concentrations. Regression line of the sample pool (solid, grey line) indicates a ratio of ∼14.56 (r2=0.99), intermediate between the Redfield ratio of 16:1 (black, dashes line) and the mean ratio in the Arabian Sea with a slope of ∼12.81 (grey, dotted-dashed line) following Codispoti et al. (2001). Colour coding of dots indicates the potential density sigma-theta in kilograms per cubic metre (kg m−3).
We observe elevated δ15N– and δ18O– values of > 7 and > 3 ‰ within the RSPGIW at CTD 01 and 03 (Table 1, Fig. 7e, f) accompanied by nitrate concentrations of > 30 µmol kg−1 (Fig. 7a). Denitrification discriminates against the heavier isotope of nitrate (15N, 18O) and raises δ15N– as well as δ18O–. In the Arabian Sea average δ15N– and δ18O– values of > 20 and > 15 ‰, respectively, are observed at mid-water depths (150–400 m), within the oxygen minimum zone (Gaye et al., 2013; Martin and Casciotti, 2017). The significant progressive reduction of δ15N– and δ18O– towards the southern Indian Ocean is a result of mixing with subtropical thermocline water masses and remineralization/N-assimilation processes along the flow path.
Within the RSPGIW and the lower IEW, we observe a deviation from the O-to-N isotope effect of , which is typical for consumption processes like denitrification (Granger et al., 2004; Rafter et al., 2013; Sigman et al., 2003, 2005). The difference between N and O isotopes (δ15N, δ18O) can be quantified by the tracer Δ(15–18) that indicates values of > 4 ‰ within the RSPGIW and the lower IEW (Fig. 7g). The RSPGIW injects nitrate that is remineralized from 15N-enriched organic matter, and originates in a region of strong denitrification. During remineralization of organic matter, the N isotope effect associated with ammonium production and nitrification does not affect the δ15N– but depends on the biomass being remineralized (Rafter et al., 2013). In contrast, the δ18O of newly nitrified nitrate is independent of the isotopic composition of the organic matter. However, δ18O– depends on the isotope effect during and oxidation, water incorporation (δ18O–H2O of ∼0 ‰), and the exchange of oxygen atoms with water that should generate a δ18O of newly produced between −8 ‰ and −1 ‰ (Buchwald and Casciotti, 2010; Casciotti et al., 2010). Therefore, the RSPGIW adds nitrate that is enhanced in δ15N compared with the ambient water and has a relative lower δ18O, which consequently drives the decoupling of N and O isotopes. Furthermore, the source nitrate for N assimilation in the lower IEW is this regenerated nitrate and also results in the decoupling of N and O isotopes in this depth range. Consequently, the elevated Δ(15–18) can be explained by a remineralisation/N-assimilation cycle and by the lateral influx of 15N-enriched nitrate induced by strong denitrification in the oxygen minimum zone of the Arabian Sea. Furthermore, alteration processes within the oxygen minimum zone have the possibility to modify the Δ(15–18). However, it is still unclear how this signal is preserved along the flow path, and we suggest that the dominant mechanism that elevates Δ(15–18) values is due to the influx of 15N-enriched nitrate due to denitrification.
In the IOSG, we observe elevated δ15N– and δ18O– values of > 7 ‰ and > 4 ‰ (Table 1, Fig. 7e, f), respectively, within the SAMW (400–500 m), which originates in the subantarctic thermocline of the Southern Ocean. In general, N assimilation has an isotopic effect of about 5 ‰–10 ‰ (Montoya and McCarthy, 1995; Sigman et al., 2005; Waser et al., 1998) and produces biomass that is relatively depleted in 15N and 18O in comparison with the nitrate source. Consequently, this drives the elevation in δ15N and δ18O of the remaining nitrate as uptake proceeds. However, in oligotrophic waters, such as in the IOSG, this isotopic effect is not observable (Montoya et al., 2002), as nitrate is typically drawn down to the limit of detection by complete N assimilation. Nitrate in surface waters of the Southern Ocean is only partially assimilated due to light limitation and lower iron availability (Boyd et al., 2000; DiFiore et al., 2006, 2010; Hutchins et al., 2001; Sigman et al., 1999) and leads to δ15N– values of up to ∼13 ‰ (DiFiore et al., 2006; Sigman et al., 1999, 2000). Seasonal mixing and remineralization processes result in δ15N– values of 5 ‰–9 ‰ within subantarctic thermocline waters (McCartney, 1977; Sigman et al., 1999). On its flow path towards the north, this isotope trace of incomplete assimilation causes the elevated isotope values within the SAMW, which enters the subtropical Indian Ocean thermocline with δ15N– values of > 7 ‰ (Table 1, Figs. 4c, 7e, 9a).
Because subantarctic thermocline waters are the source water of the SAMW and the underlying AAIW in the IOSG, we compare the nitrate isotope properties of subantarctic thermocline waters with our results. Sigman et al. (1999, 2000) and DiFiore et al. (2006) use the correlation of δ15N– and the fraction of nitrate remaining – ln() – to quantify the isotope fractionation effect during N assimilation in the Antarctic and subantarctic region. If N assimilation occurs with a constant effect and no new nitrate is added to the surface ocean, then the uptake process can be described in terms of Rayleigh fractionation kinetics (Mariotti et al., 1981). To fulfil the conditions of Rayleigh fractionation, the nitrate samples plot along a straight line in δ15N∕ln(NO3) space, where the slope of the line represents the isotope effect of N uptake or mixing of different nitrate pools. Sigman et al. (1999, 2000) and DiFiore et al. (2006) compare the theoretical Rayleigh utilization trend of δ15N∕ln(NO3) =5 ‰ with their measured nitrate utilization trend within the subantarctic thermocline, where Sigman et al. (1999, 2000) determined a slope of δ15N∕ln(NO3) ∼1.3 ‰ (Fig. 9b). Our results reveal a similar, but even shallower slope of δ15N∕ln(NO3)∼0.93 ‰ (Fig. 9b). It is clearly a mixing signal that causes the moderate slopes of δ15N∕ln(NO3) in both the gyre region and in the subantarctic, as biological utilization of nitrate is unlikely at this depth range. The explanation for the slightly shallower slope in our data set compared with the results in the subantarctic is vertical mixing with the overlying SSW that has lower δ15N– values (< 6 ‰) with nitrate concentrations of < 5 µmol kg−1. This process does not fulfil the conditions of Rayleigh fractionation due to fundamentally different formation background (Table 1, Fig. 9a; see Sect. 4.2.2). Deep-water nitrate concentrations vary little and δ15N– increases towards shallower water depths; in addition, the nitrate signal also slightly differs from that of the Southern Ocean due to the influence of the IDW, which originates in the northern Indian Ocean.
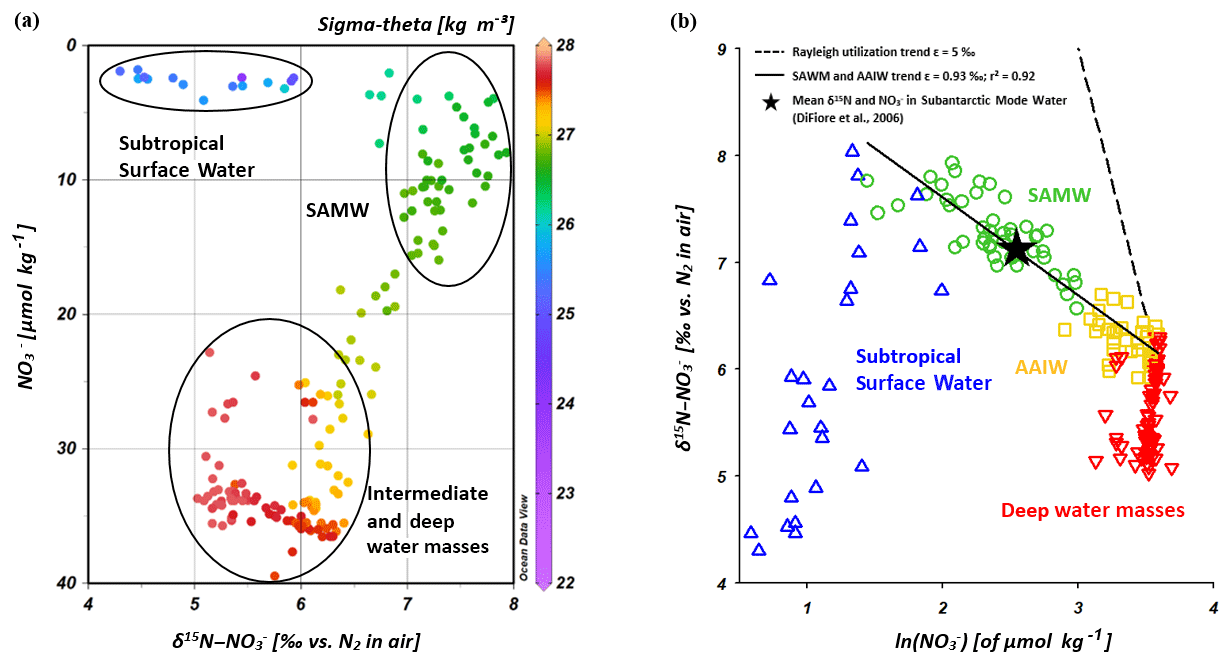
Figure 9Nitrate concentrations vs. δ15N– (a) and δ15N– vs. ln() (b) for CTD stations within the IOSG (20.36–27.78∘ S). The colour code of dots in Fig. 9a indicates the potential density sigma-theta (kg m−3). In Fig. 9b, data are grouped for the Subtropical Surface Water (blue), SAMW (green), AAIW (yellow) and deep water masses (red).
Within the isotope maxima of the SAMW (∼500 m), the uniform evolution of N and O isotopes of nitrate breaks down and reveals an offset of about 100 m between the N and O isotopic maxima at 23.91–20.36∘ S (Fig. 4c, d; see Supplement Tables S2 and S3). Both, δ15N– and δ18O–, are elevated within the SAMW, but δ15N– is less elevated than δ18O–. The decoupling of N and O isotopes leads to low Δ(15–18) values of < 3 ‰ (Fig. 7g) within the SAMW, which originates in the partially assimilated subantarctic region. Isotope fractionation during the initial phase of partial N assimilation leads to sinking organic matter that is more depleted in 15N than the source nitrate (Sigman et al., 1999; Rafter et al., 2013). The influx of the SAMW into the subtropical gyre injects 15N-depleted organic matter and its remineralization adds nitrate that lowers the δ15N of the ambient nitrate, leading to low Δ(15–18) in subtropical thermocline waters (Fig. 7g). To conclude, remineralization of organic matter produced by partial N assimilation in the Southern Ocean is reflected in lower Δ(15–18) and leads to the deviation of the isotope maxima with an offset of 100 m within the depth range of the SAMW. However, the remineralization of 15N-depleted organic matter formed out of newly fixed nitrogen from N2 fixation in surface waters may also influence the decrease of Δ(15–18) (see the following Sect. 4.2.2).
4.2.2 Evidence for N2 fixation in the IOSG
The mixing of source water signals from the lateral influx of the neighbouring northern Indian Ocean and Southern Ocean significantly affects the nutrient distribution and isotopic composition of nitrate in the gyre region. However, N* and δ15N– suggest that N2 fixation introduces new nitrate into the surface waters of the IOSG. The increase in N* up to 2 µmol kg−1 at 60–200 m indicates a positive deviation of the ratio from the Redfield stoichiometry (Gruber and Sarmiento, 1997; Redfield, 1934, 1963) and is evidence for the input of newly fixed N into the surface water. Studies in the southwestern Pacific Ocean also indicate positive N* anomalies of ∼2 µmol kg−1 in the productive layer, reflecting diazotrophic N2 fixation (Fumenia et al., 2018). Although N2 fixation is the first-order driver of positive N* (Bourbonnais et al., 2009; Monteiro and Follows, 2006), other processes, such as atmospheric deposition or the preferential remineralization of N over P, may also be responsible for excess N and result in an overestimation of N*-based N2 fixation (Bourbonnais et al., 2009; Monteiro and Follows, 2006). However, the southern Indian Ocean is less affected by the influx of nutrient-enriched mineral aerosols from atmospheric deposition (Duce at al., 2008; Duce and Tindale, 1991) and we neglect this factor in our further discussion. Furthermore, we use δ15N and δ18O of nitrate, as well as Δ(15–18), as additional indicators of N sources to overcome the weakness associated with the N* approach.
Diazotrophic N2 fixation produces organic matter that has a low δ15N– relative to average oceanic combined nitrogen (Carpenter et al., 1997; Minagawa and Wada, 1986; Montoya et al., 2002; Wada and Hattori, 1976). Within the upper 200 m of the IOSG (20.36–23.91∘ S), the δ15N of nitrate varies between 4.3 ‰ and 5.9 ‰ with a mean of ∼5.0 ‰ (Figs. 7e, 9a, b). These values are higher compared with other regions of intense N2 fixation, such as in the subtropical northeastern Atlantic, where values of 2 ‰–5 ‰ occur in surface waters (Bourbonnais et al., 2009). At first sight, the high values of surface waters in the IOSG do not speak for significant N2 fixation in surface waters. However, considering that SAMW is the source of nitrate with elevated δ15N– values of 7.4 ‰ on average (20.36–23.91∘ S) and peak values of 7.9 ‰ (Fig. 9a, b, see also Table S2), the δ15N– in surface waters (4.3 ‰–5.9 ‰) is lowered by ∼2.4 ‰. This is similar to the decrease of ∼3 ‰ in surface waters of the north Atlantic, where N2 fixation is verified (Bourbonnais et al., 2009; Knapp et al., 2008). Therefore, N2 fixation is most likely the main driver of the upward decrease of δ15N– in surface waters and adds isotopically light nitrogen from the atmosphere into the gyre region. To prove this, we take the nitrate δ18O into account, which exhibits values of < 3 ‰ and shows a minor decrease compared to δ15N. The resulting decoupling of N and O isotopes of nitrate leads to smaller differences between δ15N and δ18O and reveals a Δ(15–18) of < 3 ‰ (Fig. 7g). To conclude, positive N* values, the distinct upward decrease of δ15N–, reduced Δ(15–18) and the distance from any external nitrate sources are unambiguous signs of diazotrophic activity within the surface layer.

Figure 10 ratio vs. nitrate concentrations of seawater samples at 20.36–23.91∘ S and 26.05–27.78∘ S (a). The solid grey line indicates the calculated N assimilation (cal vs. ∕ cal) with a preformed ∕ in ratio of 13.25 for the region of the IOSG and 14.25 for the southern equatorial Indian Ocean in addition to progressive nutrient assimilation with a Redfield ratio of 16 ( ∕ ass). In (b) we present the portion of nitrate formed out of newly fixed N (new) vs. depth at latitudes between 20.36 and 23.91∘ S.
To estimate the supply of newly fixed N to the nitrate pool within the IOSG, we can calculate the fraction of nitrate coming from atmospheric N2 fixation and the fraction that is added from the underlying source water using the observed δ15N– within the upper 200 m and the following equation modified after Bourbonnais et al. (2009, 2013):
where “δ15Nsurface” is the detected δ15N–, which shows an average of ∼5.0 ‰ in the upper 200 m (range 4.3 ‰–5.9 ‰) at latitudes between 20.36 and 23.91∘ S; the “δ15Nfix” is the isotope value of atmospheric N2, assumed to be about 0 ‰; the factor “a” is the percentage of nitrate coming from atmospheric N2 fixation; the δ15N– of the source water, which is the SAMW, with values about 7.4 ‰, is represented by “δ15Nsource”; and “b” is the corresponding percentage.
In this equation we neglect the point of isotope fractionation via N assimilation due to the fact that in oligotrophic environments a complete N assimilation takes place (Montoya et al., 2002). Thus, no net expression of the isotope fractionation occurs. Consequently, the organic matter produced, which is again remineralized, also has a similar isotope signal to the assimilated nitrate. This assimilated nitrate is the mixing product of newly fixed nitrogen from the atmosphere and the input from the underlying SAMW, which is expressed by Eq. (1). We resolve the equation to a () and b (); hence, we calculate that about 32 % of the assimilated nitrate is provided from newly fixed nitrogen by N2 fixation.
To prove this first approach, indicating that about 32 % of the assimilated nitrate results from atmospheric N input by N2 fixation, we can calculate the ratio resulting from nutrient assimilation without any external N input by N2 fixation and compare this with our measured ratio within surface waters. To provide an estimate of the excess nitrogen in surface waters supplied by the remineralization of cyanobacterial biomass, we use the following equations:
where “in” is the initial nitrate concentration of the source water (SAMW within the IOSG), “ass” denotes the assimilated nitrate (in-sample) and “sample” represents the sample concentrations. The initial nitrate to phosphate pool in is defined as the mean ratio of the source water. For the region of the IOSG, we presume that the mean ratio within the SAMW is 13.25. For the general N assimilation in the euphotic zone we assume Redfield conditions of ass=16. To calculate the residual nitrate, we multiply the calculated nitrate to phosphate ratio (cal) by the measured phosphate concentrations:
The difference of sample and cal represents the portion of the nitrate supplied by nitrification out of newly fixed N. At latitudes between 20.36 and 23.91∘ S, our samples indicate elevated ratios and a resulting positive deviation from the calculated line of N assimilation at nitrate concentrations of < 10 µmol kg−1 (Fig. 10a), which indicates an external input of N into the surface waters of the IOSG. We presume that N2 fixation leads to the local elevation in the ratios due to the input of new N and coincides with the decrease of δ15N– and the decoupling of N and O isotopes, leading to low Δ(15–18). The quantity of newly fixed nitrate (new) is given by the formula:
which is presented in Fig. 10b. This indicates a distinct upward increase in the upper 200 m at 20.36–23.91∘ S with an average portion of fixed nitrate of about 34 %. Consequently, our first approach that suggests that 32 % of the nitrate measured in the upper 200 m is derived from newly fixed nitrogen agrees quite well with the 34 % calculated using ratios. Bourbonnais et al. (2009) stated that N2 fixation accounts for ∼40 % of newly supplied nitrate in the subtropical North Atlantic. This is slightly higher than our assumption for the subtropical southern Indian Ocean. However, in the subtropical North Atlantic higher N* values (3.5 µmol kg−1), a slightly stronger upward decrease of δ15N– and a stronger decoupling of N and O isotopes are observed in surface waters, suggesting higher fixation rates.
Further south at 26.05–27.78∘ S, samples plot close to the line of N assimilation and no significant input of fixed nitrate is indicated (Fig. 10a). This agrees with the δ15N– values in surface waters, which demonstrate an abrupt increase at about 26∘ S to similar values as in the underlying SAMW (> 7 ‰), whereas δ18O– still shows low values of < 3 ‰. Consequently, N and O isotopes reveal a counteracting behaviour that differs from the region at 20.36–23.91∘ S, resulting in a high Δ(15–18) of > 4.5 ‰ (Fig. 7g). This is a strong indication of the absence of N2 fixation in this region but also leads to the assumption that δ18O remains low due to ongoing nitrate production by nitrification. This sudden termination of N2 fixation may be due to a temperature-limiting factor, mentioned by Capone et al. (1997) and Breitbarth et al. (2007). They argue that N2 fixation by Trichodesmium, which is the dominant nitrogen-fixing cyanobacteria in subtropical oligotrophic waters (Berman-Frank et al., 2001; Pearl et al., 1994), decreases dramatically at seawater temperatures below 22 ∘C (Berman-Frank et al., 2001). Thus, modelling N2 fixation with this assumption resulted in very low fixation rates south of about 25∘ S in the Indian Ocean (Paulsen et al., 2017). However, N2 fixation by other diazotrophs (e.g. unicellular diazotrophic cyanobacteria) has been shown to occur at higher latitudes than Trichodesmium (Moisander et al., 2010). Another reason for the decline of N2 fixation south of 26∘ S may be the limited availability of iron and other micronutrients. Atmospheric iron deposition is low in the Southern Hemisphere oceans, and iron availability gradually decreases towards high southern latitudes (Boyd et al., 2000; Duce and Tindale, 1991; Duce et al., 2008). Reduced iron availability is suggested to limit the growth of nitrogen-fixing organisms in regions where iron availability is already restricted (Sanudo-Wilhelmy et al., 2001). Berman-Frank et al. (2001) calculated the potential of nitrogen fixation by Trichodesmium and suggested that iron availability limits nitrogen fixation in 75 % of the global ocean. However, until now no concrete studies on iron or other micronutrient availability and N2 fixation have been conducted within the southern Indian Ocean.
The southern Indian Ocean gyre is the only oligotrophic gyre in the Indian Ocean due to the land-locked nature of the northern Indian Ocean. Compared with the gyres of the Atlantic and Pacific oceans the IOSG is less explored and is poorly understood in terms of nutrient distribution and the isotopic composition of nitrate.
This work compiles the general distribution of water masses from 30∘ S, within the IOSG, across the South Equatorial Current (SEC), and towards the southern equatorial Indian Ocean. We establish the first water mass distribution model in this ocean region that provides a basis for the identification of nutrient sources and the isotopic signatures of nitrate. Water masses in our study area are diverse and originate in two fundamentally different ocean regimes: the Southern Ocean (SAMW and AAIW) and the northern Indian Ocean (RSPGIW and IDW). These different water masses have a major influence on the nutrient distribution and stable isotope composition of nitrate in the IOSG.
Our nutrient and isotopic data, which are among the first reported for the subtropical southern Indian Ocean, demonstrate the lateral influx from the Arabian Sea, characterized by strong denitrification at mid-water depths, which leads to a N deficit in intermediate and deep waters accompanied by elevated isotope ratios of nitrate within the RSPGIW. The lateral influx from the Southern Ocean is via the oxygen saturated SAMW, with characteristically elevated isotope ratios of nitrate due to partial N assimilation in high southern latitudes. Additionally, our data mirror an external input of N by N2 fixation that is indicated by positive N* and low Δ(15–18) values in surface waters. In the upper 200 m in the 20.36–23.91∘ S region, we calculate that approximately 32 %–34 % of the nitrate consumed by N assimilation is provided from newly fixed nitrogen.
The IOSG has been sparsely investigated and is an area representing those oceanic oligotrophic regions that are likely to adjust to continued warming by deepening stratification, reduced upward nutrient supply across the thermocline and decreasing biological production. Whether this will be offset by enhanced N2 fixation in warming layers remains an open question that requires dedicated follow-up studies, i.e. in terms of experimental approaches, time series observation, remote sensing and biogeochemical modelling.
All data from the SO 259 and MSM 59/2 cruises are available at https://doi.pangaea.de/10.1594/PANGAEA.897503 (Harms et al., 2019a) and https://doi.pangaea.de/10.1594/PANGAEA.897504 (Harms et al., 2019b).
The supplement related to this article is available online at: https://doi.org/10.5194/bg-16-2715-2019-supplement.
NL and NCH collected the samples on board. USS conceived the INDEX program in the IOSG and led the cruises. NL, BG, TR and KCE designed the nutrient and nitrogen cycle study. NCH, NL, KD and MA participated in the sample analyses. NCH, NL and BG analysed the data. NCH wrote the first draft of the paper. All authors contributed substantially to the final paper.
The authors declare that they have no conflict of interest.
Cruises and sampling were conducted within the framework of the INDEX program of the Federal Institute for Geosciences and Natural Resources (BGR). The INDEX program explores polymetallic sulfides on the ocean floor, based on a 15-year contract between the BGR and the International Seabed Authority. The Federal Institute for Geosciences and Natural Resources requests acknowledgement in any future use of the data or results from this publication. We thank the crew of the German research vessels Maria S. Merian and Sonne for their outstanding support of our work on board. Furthermore, we thank our colleagues from the Helmholtz Institute Geesthacht, especially Tina Sanders, for supporting our analyses of nutrients and the stable isotopes of nitrate.
This paper was edited by Markus Kienast and reviewed by Annie Bourbonnais and one anonymous referee.
Bange, H. W., Naqvi, S. W. A., and Codispoti, L.: The nitrogen cycle in the Arabian Sea, Prog. Oceanogr., 65, 145–158, https://doi.org/10.1016/j.pocean.2005.03.002, 2005.
Baumgartner, A. and Reichel, E.: The world water balance: Mean annual global, continental and maritime precipitation evaporation and run-off, Elsevier Science Inc., 179 pp., 1975.
Behrenfeld, M. J., O'Malley, R. T., Siegel, D. A., McClain, C. R., Sarmiento, J. L., Feldman, G. C., Milligan, A. J., Falkowski, P. G., Letelier, R. M., and Boss, E. S.: Climate-driven trends in contemporary ocean productivity, Nature, 444, 752–755, 2006.
Berman-Frank, I., Cullen, J. T., Shaked, Y., Sherrell, R. M., and Falkowski, P. G.: Iron availability, cellular iron quotas, and nitrogen fixation in Trichodesmium, Limnol. Oceanogr., 46, 1249–1260, https://doi.org/10.4319/lo.2001.46.6.1249, 2001.
Bianchi, M., Feliatra, F., Tréguer, P., Vincendeau, M.-A., and Morvan, J.: Nitrification rates, ammonium and nitrate distribution in upper layers of the water column and in sediments of the Indian sector of the Southern Ocean, Deep-Sea Res. Pt. II, 44, 1017–1032, https://doi.org/10.1016/S0967-0645(96)00109-9, 1997.
Bindoff, N. L. and McDougall, T. J.: Decadal changes along an Indian Ocean section at 32∘ S and their interpretation, J. Phys. Oceanogr., 30, 1207–1222, 2000.
Böhlke, J. K., Mroczkowski, S. J., and Coplen, T. B.: Oxygen isotopes in nitrate: new reference materials for measurements and observations on nitrate-water equilibration, Rapid Commun. Mass Sp., 17, 1835–1846, https://doi.org/10.1002/rcm.1123, 2003.
Bourbonnais, A., Lehmann, M. F., Waniek, J. J., and Schulz-Bull, D. E.: Nitrate isotope anomalies reflect N2 fixation in the Azores Front region (subtropical NE Atlantic), J. Geophys. Res.-Ocean., 114, 1–16, https://doi.org/10.1029/2007JC004617, 2009.
Bourbonnais, A., Lehmann, M. F., Hamme, R. C., Manning, C. C., and Juniper, S. K.: Nitrate elimination and regeneration as evidenced by dissolved inorganic nitrogen isotopes in Saanich Inlet, a seasonally anoxic fjord, Mar. Chem., 157, 194–207, https://doi.org/10.1016/j.marchem.2013.09.006, 2013.
Boyd, P. W., Watson, A. J., Law, C. S., Abraham, E. R., Trull, T., Murdoch, R., Bakker, D. C. E., Bowie, A. R., Buesseler, K. O., Chang, H., Charette, M., Croot, P., Downing, K., Frew, R., Gall, M., Hadfield, M., Hall, J., Harvey, M., Jameson, G., LaRoche, J., Liddicoat, M., Ling, R., Maldonado, M. T., McKay, R. M., Nodder, S., Pickmere, S., Pridmore, R., Rintoul, S., Safi, K., Sutton, P., Strzepek, R., Tanneberger, K., Turner, S., Waite, A., and Zeldis, J.: A mesoscale phytoplankton bloom in the polar Southern Ocean stimulated by iron fertilization, Nature, 407, 695–702, https://doi.org/10.1038/35037500, 2000.
Brandes, J. A., Devol, A. H., Yoshinari, T., Jayakumar, D. A., and Naqvi, S. W. A: Isotopic composition of nitrate in the central Arabian Sea and eastern tropical North Pacific: A tracer for mixing and nitrogen cycles, Limnol. Oceanogr., 43, 1680–1689, https://doi.org/10.4319/lo.1998.43.7.1680, 1998.
Breitbarth, E., Oschlies, A., and LaRoche, J.: Physiological constraints on the global distribution of Trichodesmium – effect of temperature on diazotrophy, Biogeosciences, 4, 53–61, https://doi.org/10.5194/bg-4-53-2007, 2007.
Buchwald, C. and Casciotti, K. L.: Oxygen isotopic fractionation and exchange during bacterial nitrite oxidation, Limnol. Oceanogr., 55, 1064–1074, https://doi.org/10.4319/lo.2010.55.3.1064, 2010.
Capone, D. G., Zehr, J. P., Paerl, H. W., Bergman, B., and Carpenter, E. J.: Trichodesmium, a Globally Significant Marine Cyanobacterium, Science, 276, 1221–1229, https://doi.org/10.1126/science.276.5316.1221, 1997.
Carpenter, E. J., Harvey, H. R., Fry, B., and Capone, D. G.: Biogeochemical tracers of the marine cyanobacterium Trichodesmium, Deep-Sea Res. Pt. I, 44, 27–38, https://doi.org/10.1016/S0967-0637(96)00091-X, 1997.
Casciotti, K. L., Sigman, D. M., Hastings, M. G., Böhlke, J., and Hilkert, A.: Measurement of the oxygen isotopic composition of nitrate in seawater and freshwater using the denitrifier method, Anal. Chem., 74, 4905–4912, https://doi.org/10.1021/ac020113w, 2002.
Casciotti, K. L., Trull, T., Glover, D., and Davies, D.: Constraints on nitrogen cycling at the subtropical North Pacific Station ALOHA from isotopic measurements of nitrate and particulate nitrogen, Deep-Sea Res. Pt. II, 55, 1661–1672, https://doi.org/10.1016/j.dsr2.2008.04.017, 2008.
Casciotti, K. L., McIlvin, M., and Buchwald, C.: Oxygen isotopic exchange and fractionation during bacterial ammonia oxidation, Limnol. Oceanogr., 55, 753–762, 2010.
Clark, D. R., Rees, A. P., and Joint, I.: Ammonium regeneration and nitrification rates in the oligotrophic Atlantic Ocean: Implications for new production estimates, Limnol. Oceanogr., 53, 52–62, https://doi.org/10.4319/lo.2008.53.1.0052, 2008.
Codispoti, L., Brandes, J. A., Christensen, J., Devol, A., Naqvi, S., Paerl, H. W., and Yoshinari, T.: The oceanic fixed nitrogen and nitrous oxide budgets: Moving targets as we enter the anthropocene?, Sci. Mar., 65, 85–105, 2001.
Deacon, G. E.: A general account of the hydrology of the South Atlantic Ocean, Discovery Reports, 7, 171–238, 1933.
Deutsch, C., Gruber, N., Key, R. M., and L., S. J.: Denitrification and N2 fixation in the Pacific Ocean, Global Biogeochem. Cy., 15, 483–506, https://doi.org/10.1029/2000GB001291, 2001.
Deutsch, C., Sarmiento, J. L., Sigman, D. M., Gruber, N., and Dunne, J. P.: Spatial coupling of nitrogen inputs and losses in the ocean, Nature, 445, 163–167, https://doi.org/10.1038/nature05392, 2007.
DiFiore, P. J., Sigman, D. M., Trull, T. W., Lourey, M. J., Karsh, K., Cane, G., and Ho, R.: Nitrogen isotope constraints on subantarctic biogeochemistry, J. Geophys. Res.-Ocean., 111, 1–19, https://doi.org/10.1029/2005JC003216, 2006.
DiFiore, P. J., Sigman D. M., Karsh Kristen, L., Trull Thomas, W., Dunbar Robert, B., and Robinson Rebecca, S.: Poleward decrease in the isotope effect of nitrate assimilation across the Southern Ocean, Geophys. Res. Lett., 37, 1–5, https://doi.org/10.1029/2010GL044090, 2010.
Duce, R. A. and Tindale, N. W.: Atmospheric transport of iron and its deposition in the ocean, Limnol. Oceanogr., 36, 1715–1726, https://doi.org/10.4319/lo.1991.36.8.1715, 1991.
Duce, R., LaRoche, J., Altieri, K., Arrigo, K., Baker, A., Capone, D., Cornell, S., Dentener, F., Galloway, J., and Ganeshram, R.: Impacts of atmospheric anthropogenic nitrogen on the open ocean, Science, 320, 893–897, https://doi.org/10.1126/science.1150369, 2008.
Duing, W.: The monsoon regime of the currents in the Indian Ocean: Hawaii inst of Geophysics Honolulu, No. HIG-Contrib-303, 1970.
Emerson, S., Mecking, S., and Abell, J.: The biological pump in the subtropical North Pacific Ocean: Nutrient sources, Redfield ratios, and recent changes, Global Biogeochem. Cy., 15, 535–554, https://doi.org/10.1029/2000GB001320, 2001.
Emery, W. J.: Water types and water masses, Encyclopedia of Ocean Sciences, 6, 3179–3187, https://doi.org/10.1006/rwos.2001.0108, 2001.
Emery, W. J., and Meincke, J.: Global water masses: summary and review, Oceanol. Acta, 9, 383–391, 1986.
Fine, R. A.: Circulation of Antarctic intermediate water in the South Indian Ocean, Deep-Sea Res. Pt. I, 40, 2021–2042, https://doi.org/10.1016/0967-0637(93)90043-3, 1993.
Fumenia, A., Moutin, T., Bonnet, S., Benavides, M., Petrenko, A., Helias Nunige, S., and Maes, C.: Excess nitrogen as a marker of intense dinitrogen fixation in the Western Tropical South Pacific Ocean: impact on the thermocline waters of the South Pacific, Biogeosciences Discuss., https://doi.org/10.5194/bg-2017-557, 2018.
Gaye, B., Nagel, B., Dähnke, K., Rixen, T., and Emeis, K. C.: Evidence of parallel denitrification and nitrite oxidation in the ODZ of the Arabian Sea from paired stable isotopes of nitrate and nitrite, Global Biogeochem. Cy., 27, 1059–1071, https://doi.org/10.1002/2011GB004115, 2013.
Gaye-Haake, B., Lahajnar, N., Emeis, K.-C., Unger, D., Rixen, T., Suthhof, A., Ramaswamy, V., Schulz, H., Paropkari, A., and Guptha, M.: Stable nitrogen isotopic ratios of sinking particles and sediments from the northern Indian Ocean, Mar. Chem., 96, 243–255, https://doi.org/10.1016/j.marchem.2005.02.001, 2005.
Granger, J., Sigman D. M., Needoba Joseph, A., and Harrison Paul, J.: Coupled nitrogen and oxygen isotope fractionation of nitrate during assimilation by cultures of marine phytoplankton, Limnol. Oceanogr., 49, 1763–1773, https://doi.org/10.4319/lo.2004.49.5.1763, 2004.
Grasshoff, K., Kremling, K., and Ehrhardt, M.: Methods of seawater analysis: John Wiley and Sons, 632 pp., 2009.
Gruber, N. and Sarmiento, J. L.: Global patterns of marine nitrogen fixation and denitrification, Global Biogeochem. Cy., 11, 235–266, https://doi.org/10.1029/97GB00077, 1997.
Harms, N., Lahajnar, N., Gaye, B., Rixen, T., Dähnke, K., Ankele, M., Schwarz-Schampera, U., and Emeis, K.-C.: Physical oceanography, nutrients, and nitrogen and oxygen isotopic composition of nitrate measured on water bottle samples during Maria S. Merian cruise MSM59/2, PANGAEA, available at: https://doi.pangaea.de/10.1594/PANGAEA.897503 (last access: 3 July 2019), 2019a.
Harms, N., Lahajnar, N., Gaye, B., Rixen, T., Dähnke, K., Ankele, M., Schwarz-Schampera, U., and Emeis, K.-C.: Physical oceanography, nutrients, and nitrogen and oxygen isotopic composition of nitrate measured on water bottle samples during SONNE cruise SO259, PANGAEA, available at: https://doi.pangaea.de/10.1594/PANGAEA.897504 (last access: 3 July 2019), 2019b.
Herraiz-Borreguero, L. and Rintoul, S. R.: Subantarctic mode water: distribution and circulation, Ocean Dynam., 61, 103–126, https://doi.org/10.1007/s10236-010-0352-9, 2011.
Hutchins, D., Sedwick, P., DiTullio, G., Boyd, P., Queguiner, B., Griffiths, F., and Crossley, C.: Control of phytoplankton growth by iron and silicic acid availability in the subantarctic Southern Ocean: Experimental results from the SAZ Project, J. Geophys. Res.-Ocean., 106, 31559–31572, https://doi.org/10.1029/2000JC000333, 2001.
Karl, D. M., Letelier, R., Hebel, D., Tupas, L., Dore, J., Christian, J., and Winn, C.: Ecosystem changes in the North Pacific subtropical gyre attributed to the 1991–92 El Niño, Nature, 373, 230–234, https://doi.org/10.1038/373230a0, 1995.
Knapp, A. N., DiFiore, P. J., Deutsch, C., Sigman, D. M., and Lipschultz, F.: Nitrate isotopic composition between Bermuda and Puerto Rico: Implications for N2 fixation in the Atlantic Ocean, Global Biogeochem. Cy., 22, 1–14, https://doi.org/10.1029/2007GB003107, 2008.
Lehmann, M. F., Sigman, D. M., McCorkle, D. C., Brunelle, B. G., Hoffmann, S., Kienast, M., Cane, G., and Clement, J.: Origin of the deep Bering Sea nitrate deficit: Constraints from the nitrogen and oxygen isotopic composition of water column nitrate and benthic nitrate fluxes, Global Biogeochem. Cy., 19, 1–15, https://doi.org/10.1029/2005GB002508, 2005.
Mantyla, A. W. and Reid, J. L.: On the origins of deep and bottom waters of the Indian Ocean, J. Geophys. Res.-Ocean., 100, 2417–2439, https://doi.org/10.1029/94JC02564, 1995.
Mariotti, A., Germon, J., Hubert, P., Kaiser, P., Letolle, R., Tardieux, A., and Tardieux, P.: Experimental determination of nitrogen kinetic isotope fractionation: some principles; illustration for the denitrification and nitrification processes, Plant soil, 62, 413–430, https://doi.org/10.1007/BF02374138, 1981.
Martin, T. and Casciotti, K.: Paired N and O isotopic analysis of nitrate and nitrite in the Arabian Sea oxygen deficient zone, Deep-Sea Res. Pt. I, 121, 121–131, https://doi.org/10.1016/j.dsr.2017.01.002, 2017.
McCartney, M. S.: Subantarctic Mode Water, A Voyage of Discovery, George Deacon 70th Anniversary, edited by: Angel, M., Pergamon, New York, 103–119, 1977.
McClain, C. R., Signorini, S. R., and Christian, J. R.: Subtropical gyre variability observed by ocean-color satellites, Deep-Sea Res. Pt. II, 51, 281–301, https://doi.org/10.1016/j.dsr2.2003.08.002, 2004.
Michaels, A., Olson, D., Sarmiento, J., Ammerman, J., Fanning, K., Jahnke, R., Knap, A., Lipschultz, F., and Prospero, J.: Inputs, losses and transformations of nitrogen and phosphorus in the pelagic North Atlantic Ocean, Biogeochemistry, 35, 181–226, https://doi.org/10.1007/BF02179827, 1996.
Minagawa, M. and Wada, E.: Nitrogen isotope ratios of red tide organisms in the East China Sea: A characterization of biological nitrogen fixation, Mar. Chem., 19, 245–259, https://doi.org/10.1016/0304-4203(86)90026-5, 1986.
Moisander, P. H., Beinart, R. A., Hewson, I., White, A. E., Johnson, K. S., Carlson, C. A., Montoya, J. P., and Zehr, J. P.: Unicellular cyanobacterial distributions broaden the oceanic N2 fixation domain, Science, 327, 1512–1514, https://doi.org/10.1126/science.1185468, 2010.
Monteiro, F. M. and Follows, M.: Nitrogen fixation and preferential remineralization of phosphorus in the North Atlantic: Model insights, Eos Trans. AGU, 87, Ocean Sci. Meet. Suppl., Abstract OS35A–06, 2006.
Montoya, J. P. and McCarthy, J. J.: Isotopic fractionation during nitrate uptake by phytoplankton grown in continuous culture, J. Plankton Res., 17, 439–464, https://doi.org/10.1093/plankt/17.3.439, 1995.
Montoya, J. P., Carpenter, E. J., and Capone, D. G.: Nitrogen fixation and nitrogen isotope abundances in zooplankton of the oligotrophic North Atlantic, Limnol. Oceanogr., 47, 1617–1628, https://doi.org/10.4319/lo.2002.47.6.1617, 2002.
Muromtsev, A.: Osnovnye cherty gidrologii Indiiskogo okeana (The Main Features of Indian Ocean Hydrology), Gidrometeoizdat, Leningrad, 160 charts, 1959.
Murphy, J. and Riley, J. P.: A modified single solution method for the determination of phosphate in natural waters, Anal. Chim. Ac., 27, 31–36, https://doi.org/10.1016/S0003-2670(00)88444-5, 1962.
Paulsen, H., Ilyina, T., Six, K. D., and Stemmler, I.: Incorporating a prognostic representation of marine nitrogen fixers into the global ocean biogeochemical model HAMOCC, J. Adv. Model. Earth Sy., 9, 438–464, https://doi.org/10.1002/2016MS000737, 2017.
Pickard, G. and Emery, W.: Descriptive physical Oceanography, Pcrgamon, Tanytown, NY, 249 pp., 1982.
Piola, A. R. and Gordon, A. L.: Intermediate waters in the southwest South Atlantic, Deep-Sea Res., 36, 1–16, https://doi.org/10.1016/0198-0149(89)90015-0, 1989.
Quadfasel, D. R. and Schott, F.: Water-mass distributions at intermediate layers off the Somali Coast during the onset of the southwest monsoon, 1979, J. Phys. Oceanogr., 12 1358–1372, 1982.
Rafter, P. A., DiFiore, P. J., and Sigman, D. M.: Coupled nitrate nitrogen and oxygen isotopes and organic matter remineralization in the Southern and Pacific Oceans, J. Geophys. Res.-Ocean., 118, 4781–4794, https://doi.org/10.1002/jgrc.20316, 2013.
Redfield, A. C.: On the proportions of organic derivatives in sea water and their relation to the composition of plankton, James Johnstone memorial, James Johnstone memorial volume, 176–192, 1934.
Redfield, A. C.: The influence of organisms on the composition of seawater, The Sea, 2, 26–77, 1963.
Reid, J. L.: On the total geostrophic circulation of the South Pacific Ocean: Flow patterns, tracers and transports, Prog. Oceanogr., 16, 1–61, https://doi.org/10.1016/S0079-6611(97)00012-8, 1986.
Reid, J. L.: On the total geostrophic circulation of the South Atlantic Ocean: Flow patterns, tracers, and transports, Prog. Oceanogr., 23, 149–244, https://doi.org/10.1016/0079-6611(89)90001-3, 1989.
Rixen, T. and Ittekkot, V.: Nitrogen deficits in the Arabian Sea, implications from a three component mixing analysis, Deep-Sea Res. Pt. II, 52, 1879–1891, https://doi.org/10.1016/j.dsr2.2005.06.007, 2005.
Sanudo-Wilhelmy, S. A., Kustka, A. B., Gobler, C. J., Hutchins, D. A., Yang, M., Lwiza, K., Burns, J., Capone, D. G., Raven, J. A., and Carpenter, E. J.: Phosphorus limitation of nitrogen fixation by Trichodesmium in the central Atlantic Ocean, Nature, 411, 66–69, https://doi.org/10.1038/35075041, 2001.
Sarmiento, J. L. and Gruber, N.: Ocean biogeochemical dynamics: Princeton University Press, 503 pp., 2006.
Schlitzer, R.: Ocean Data View, https://odv.awi.de (last access: 10 July 2019), 2017.
Schott, F. A. and McCreary, J. P.: The monsoon circulation of the Indian Ocean. Prog. Oceanogr., 51, 1–123, https://doi.org/10.1016/S0079-6611(01)00083-0, 2001.
Sharma, G.: Transequatorial movement of water masses in the Indian Ocean, J. Mar. Res., 34, 143–154, 1976.
Sigman, D. M. and Casciotti, K. L.: Nitrogen isotopes in the Ocean, in: Encyclopedia of ocean sciences, edited by: Steele, J. H., Turekian, K. K., and Thorpe, S. A., New York, Elsevier, 1884–1894, 2001.
Sigman, D. M., Altabet, M. A., McCorkle, D. C., Francois, R., and Fischer, G.: The δ15N of nitrate in the southern ocean: Consumption of nitrate in surface waters, Global Biogeochem. Cy., 13, 1149–1166, https://doi.org/10.1029/1999GB900038, 1999.
Sigman, D. M., Altabet, M. A., McCorkle, D. C., Francois, R., and Fischer, G.: The δ15N of nitrate in the Southern Ocean: Nitrogen cycling and circulation in the ocean interior, J. Geophys. Res.-Ocean., 105, 19599–19614, https://doi.org/10.1029/2000JC000265, 2000.
Sigman, D. M., Robinson, R., Knapp, A., Van Geen, A., McCorkle, D., Brandes, J., and Thunell, R.: Distinguishing between water column and sedimentary denitrification in the Santa Barbara Basin using the stable isotopes of nitrate, Geochem. Geophy. Geosy., 4, 1040, 1–20, https://doi.org/10.1029/2002GC000384, 2003.
Sigman, D. M., Granger, J., DiFiore, P. J., Lehmann, M. M., Ho, R., Cane, G., and van Geen, A.: Coupled nitrogen and oxygen isotope measurements of nitrate along the eastern North Pacific margin, Global Biogeochem. Cy., 19, 1–14, https://doi.org/10.1029/2005GB002458, 2005.
Sigman, D. M., Karsh, K. L., and Casciotti, K. L.: Ocean process tracers: nitrogen isotopes in the ocean, Elsevier Ltd., 1–16, 2009.
Sverdrup, H. U., Johnson, M. W., and Fleming, R. H.: The Oceans: Their Physics, Chemistry, and General Biology, Prenlice Hall NY, Vol. 7, p. 1087, 1942.
Talley, L. D.: Antarctic intermediate water, in: the South Atlantic The South Atlantic Springer, edited by: Wefer, G., Berger, W. H., Siedler, G., and Webb, J. D., Springer Verlag, New York, 219–238, 1996.
Talley, L. D.: Closure of the Global Overturning Circulation Through the Indian, Pacific, and Southern Oceans, Schematics and Transports, Oceanography, 26, 80–97, 2013.
Toole, J. M. and Warren, B. A.: A hydrographic section across the subtropical South Indian Ocean, Deep-Sea Res. Pt. I, 40, 1973–2019, https://doi.org/10.1016/0967-0637(93)90042-2, 1993.
Wada, E., and Hattori, A.: Natural abundance of 15N in particulate organic matter in the North Pacific Ocean, Geochim. Cosmochim. Ac., 40, 249–251, https://doi.org/10.1016/0016-7037(76)90183-6, 1976.
Wankel, S. D., Kendall, C., Pennington, J. T., Chavez, F. P., and Paytan, A.: Nitrification in the euphotic zone as evidenced by nitrate dual isotopic composition: Observations from Monterey Bay, California, Global Biogeochem. Cy., 21, 1–13, https://doi.org/10.1029/2006GB002723, 2007.
Ward, B., Devol, A., Rich, J., Chang, B., Bulow, S., Naik, H., Pratihary, A., and Jayakumar, A.: Denitrification as the dominant nitrogen loss process in the Arabian Sea, Nature, 461, 78–82, 2009.
Warren, B. A.: Transindian hydrographic section at Lat. 18 S: Property distributions and circulation in the South Indian Ocean, Deep-Sea Res., 28, 759–788, https://doi.org/10.1016/S0198-0149(81)80001-5, 1981.
Waser, N., Harrison, P., Nielsen, B., Calvert, S., and Turpin, D.: Nitrogen isotope fractionation during the uptake and assimilation of nitrate, nitrite, ammonium, and urea by a marine diatom, Limnol. Oceanogr., 43, 215–224, https://doi.org/10.4319/lo.1998.43.2.0215, 1998.
Williams, R. G. and Follows, M. J.: The Ekman transfer of nutrients and maintenance of new production over the North Atlantic, Deep-Sea Res. Pt. I, 45, 461–489, https://doi.org/10.1016/S0967-0637(97)00094-0, 1998.
Williams, R. G. and Follows, M. J.: Physical transport of nutrients and the maintenance of biological production Ocean biogeochemistry, Springer, 19–51, 2003.
Woodberry, K. E., Luther, M. E., and O'Brien, J. J.: The wind-driven seasonal circulation in the southern tropical Indian Ocean, J. Geophys. Res.-Ocean., 94, 17985–18002, https://doi.org/10.1029/JC094iC12p17985, 1989.
Wurl, O.: Practical guidelines for the analysis of seawater: CRC press, 1–32, 2009.
Wüst, G.: Die Stratosphäre. Wissenschaftliche Ergebnisse der Deutschen Atlantischen Expedition auf dem Vermessungs- und Forschungsschiff “Meteor”, 1925–1927, 6, 109–288, 1935.
Wyrtki, K.: The oxygen minima in relation to ocean circulation, Paper presented at the Deep Sea Research and Oceanographic Abstracts, Deep-Sea Res., 9, 11–23, https://doi.org/10.1016/0011-7471(62)90243-7, 1962.
Wyrtki, K.: Oceanographic atlas of the international Indian Ocean expedition: National Science Foundation, 1971.
Wyrtki, K.: Physical oceanography of the Indian Ocean The biology of the Indian Ocean, Springer, 18–36, https://doi.org/10.1007/978-3-642-65468-8_3, 1973.
You, Y.: Intermediate water circulation and ventilation of the Indian Ocean derived from water-mass contributions, J. Mar. Res., 56, 1029–1067, https://doi.org/10.1357/002224098765173455, 1998.
You, Y. and Tomczak, M.: Thermocline circulation and ventilation in the Indian Ocean derived from water mass analysis, Deep-Sea Res. Pt. I, 40, 13–56, https://doi.org/10.1016/0967-0637(93)90052-5, 1993.