the Creative Commons Attribution 4.0 License.
the Creative Commons Attribution 4.0 License.
 | 30 Aug 2019
Dissolved organic nutrients dominate melting surface ice of the Dark Zone (Greenland Ice Sheet)
Alexandra T. Holland
Christopher J. Williamson
Fotis Sgouridis
Andrew J. Tedstone
Jenine McCutcheon
Joseph M. Cook
Ewa Poniecka
Marian L. Yallop
Martyn Tranter
Alexandre M. Anesio
The Black & Bloom Group
Glaciers and ice sheets host abundant and dynamic communities of microorganisms on the ice surface (supraglacial environments). Recently, it has been shown that Streptophyte glacier algae blooming on the surface ice of the south-western coast of the Greenland Ice Sheet are a significant contributor to the 15-year marked decrease in albedo. Currently, little is known about the constraints, such as nutrient availability, on this large-scale algal bloom. In this study, we investigate the relative abundances of dissolved inorganic and dissolved organic macronutrients (N and P) in these darkening surface ice environments. Three distinct ice surfaces, with low, medium and high visible impurity loadings, supraglacial stream water and cryoconite hole water, were sampled. Our results show a clear dominance of the organic phase in all ice surface samples containing low, medium and high visible impurity loadings, with 93 % of the total dissolved nitrogen and 67 % of the total dissolved phosphorus in the organic phase. Mean concentrations in low, medium and high visible impurity surface ice environments are 0.91, 0.62 and 1.0 µM for dissolved inorganic nitrogen (DIN), 5.1, 11 and 14 µM for dissolved organic nitrogen (DON), 0.03, 0.07 and 0.05 µM for dissolved inorganic phosphorus (DIP) and 0.10, 0.15 and 0.12 µM for dissolved organic phosphorus (DOP), respectively. DON concentrations in all three surface ice samples are significantly higher than DON concentrations in supraglacial streams and cryoconite hole water (0 and 0.7 µM, respectively). DOP concentrations are higher in all three surface ice samples compared to supraglacial streams and cryoconite hole water (0.07 µM for both). Dissolved organic carbon (DOC) concentrations increase with the amount of visible impurities present (low: 83 µM, medium: 173 µM and high: 242 µM) and are elevated compared to supraglacial streams and cryoconite hole water (30 and 50 µM, respectively). We speculate that the architecture of the weathering crust, which impacts on water flow paths and storage in the melting surface ice and/or the production of extracellular polymeric substances (EPS), containing both N and P in conjunction with C, is responsible for the temporary retention of DON and DOP in the melting surface ice. The unusual presence of measurable DIP and DIN, principally as , in the melting surface ice environments suggests that factors other than macronutrient limitation are controlling the extent and magnitude of the glacier algae.
- Article
(1539 KB) - Full-text XML
- BibTeX
- EndNote


There has been a significant increase in the net mass loss of the Greenland Ice Sheet (GrIS) during the past 2 decades (Rignot and Kanagaratnam, 2006; Rignot et al., 2011; Shepherd et al., 2012), from 34 to 215 Gt yr−1 between 1992 and 2011, respectively (Sasgen et al., 2012). Surface melt is the primary driver of the increase in ice mass loss (∼68 %) since 2009, with the rest (∼32 %) coming from solid ice discharge or calving (Enderlin et al., 2014). There are two major reasons for this marked increase in surface melting. First, the extent of bare, melting surface ice increased, on average, by 7158 km2 per year from 2000 to 2014 (Enderlin et al., 2014; Shimada et al., 2016). Second, the albedo of bare surface ice areas declined between 2000 and 2012, with south-western Greenland exhibiting the greatest decrease of up to 18 % (Box et al., 2012). A persistent Dark Zone in this region, some 20–30 km inland and ∼50 km wide, has reoccurred annually since at least 2001 (Wientjes and Oerlemans, 2010; Box et al., 2012; Stroeve et al., 2013; Tedstone et al., 2017). There is significant variability in the annual extent of the Dark Zone (Shimada et al., 2016), which may be the result of both inter-annual climatic variability and factors associated with the ice surface, such as melt-out of ancient Holocene dust particles (Wientjes et al., 2011; Tedstone et al., 2017).
Both snow and bare ice albedo are reduced by light-absorbing impurities (LAIs) of both biological and mineralogical origin (Gardner and Sharp, 2010), which include atmospheric dust and black carbon, cryoconite, and particulates within the meteoric ice that melt out during the ablation season (Warren and Wiscombe, 1980, 1985; Warren, 1984; Gardner and Sharp, 2010; Wientjes et al., 2012; Cook et al., 2016a). The importance of biological LAIs, particularly Streptophyte glacier algae, which bloom in surface ice environments during summer ablation seasons, as a factor in albedo decline has been identified in recent years (Yallop et al., 2012). The effect has become known as “bioalbedo”, which is derived from the original term “biological albedo reduction” (Kohshima et al., 1993; Cook et al., 2017). Bioalbedo is attributed to a combination of the high abundance of cells that grow during the bloom (up to ∼104 cells mL−1 surface ice) and the heavily pigmented nature of ice algal cells, which include a unique dark UV-VIS absorbing pigment, purpurogallin, that provides photo-protection from the extreme solar radiation in supraglacial environments (Remias et al., 2012; Williamson et al., 2018). Tedstone et al. (2017) concluded that ice algal blooms are the main factors responsible for inter-annual variability in the extent, magnitude and duration of the Dark Zone, which seem to be regulated by climatic drivers, including the June–July–August sensible heat flux anomaly and the timing of snowline retreat. The spatial extent of ice algal blooms may also be linked to the availability of mineralogic LAIs, such as late Holocene dust particles melting out of the meteoric ice (Wientjes et al., 2012). However, the linkage between particles and algae is not presently understood (Tedstone et al., 2017).
C, N and P are essential for all living organisms, providing the basis for cellular mass and all metabolic activity (Redfield et al., 1963; Hessen et al., 2013). Carbon is usually in ready supply in surface ice environments, both from the atmosphere and from bubbles trapped in snow and ice, and so nitrogen and phosphorus are more likely the limiting factors for growth and activity of microorganisms (Stibal et al., 2009; Lutz et al., 2017). Bioavailable forms of N are less readily available, being largely confined to and in dry and wet deposition from the atmosphere (Wolff, 2013), and from snowmelt and ice melt (Telling et al., 2011). Dissolved inorganic phosphorous (DIP) is typically the least available nutrient in supraglacial environments, since it is a largely rock-derived and is only released by chemical weathering or bio-mining (Stibal et al., 2008b, 2009). P sources in remote glaciated environments, such as the Dark Zone, are largely confined to the small quantities of particulates deposited from the atmosphere and the melt-out of debris in snow and ice (Wientjes and Oerlemans, 2010).
The presence of such large-scale algal blooms in the Dark Zone might suggest that these environments are nutrient-rich. This would contrast with the current literature, which suggests that supraglacial environments in the Dark Zone, similar to those found in Svalbard, the margins of the Greenland Ice Sheet and Antarctica, are extremely oligotrophic (Stibal et al., 2008b, 2009; Telling et al., 2011, 2012; Bagshaw et al., 2013; Hawkings et al., 2016; Wadham et al., 2016). Mean dissolved inorganic nitrogen (DIN) concentrations in Greenland ice are ∼1.4 µM, with and composing 0.97 and 0.39 µM, respectively (Wolff, 2013). There are relatively few measurements of nutrient concentrations in the surface ice environments of the Dark Zone (Telling et al., 2012; Wadham et al., 2016), but the average concentration in surface ice along the K transect east of Kangerlussuaq, which passes through the Dark Zone, has been reported to be 0.6±0.1 µM between 17 and 79 km from the ice sheet margin (Telling et al., 2012), while DIP concentrations were below the detection limit, 0.33 µM P (Telling et al., 2012). DIN concentrations in snow sampled before the start of the ablation season at the margin of the GrIS had higher concentrations, with an average of 1.4 µM (Telling et al., 2012), similar to those of Wolff (2013). Hence, there is no real evidence that neither N nor P concentrations in snow and ice sampled in the vicinity of the Dark Zone are higher than for average Greenland ice. The relatively low concentrations of macronutrients in the snow and ice of the south-western Greenland Ice Sheet means that algal blooms are likely to rapidly sequester N and P from snowmelt and ice melt, particularly as the blooms reach their zenith at the height of the ablation season. For example, NPP (net primary production) values in the wet, melting surface ice (also called rotten ice, or the weathering crust) during blooms range from 21 to 100 µmol C L−1 d−1 (Chandler et al., 2015; Williamson et al., 2018). Should the mean DIN concentration of the ice melt be 1.4 µM, this implies a C:N molar ratio of 15–71 if all the DIN is sequestered into new organic matter and no other sources of DIN are present. There is no readily available C:N ratio of glacier algae in the literature, but typical C:N ratios of sea ice algae are in the range of 12–46 (Niemi and Michel, 2015). It is even more difficult to find ratios of glacier algae, but should the C:P ratio be in the region of 100:1 to 1000:1, the P demand will be 0.02–1 µM.
Blooms in other aquatic ecosystems are associated with efficient recycling of nutrients when new sources of N and P are in scarce supply, often with a balance between nutrient uptake and remineralization (Dodds, 1993), allowing nutrient accumulation in biomass over time. This balance does not appear to arise in the surface ice environments of other High Arctic and polar glaciers studied to date. These are predominantly in cryoconite holes, which are water-filled cylindrical holes with an organic-rich basal sediment in the ice surface that host a range of microbes, including cyanobacteria (Christner et al., 2003; Anesio and Laybourn-Parry, 2012; Telling et al., 2012). Dissolved macronutrients tend to become concentrated in organic phases (Stibal et al., 2008b; Telling et al., 2014), suggesting an imbalance in the uptake and remineralization of dissolved inorganic nutrients in cryoconite hole environments. Indeed, the only ratio of primary production to remineralization measured in the Dark Zone is 30:1 (Nicholes et al., 2019). To date, dissolved organic nitrogen (DON) concentrations in the Dark Zone have only been reported in two studies (Telling et al., 2012; Wadham et al., 2016), but neither focus on ice populated by Streptophyte glacier algae. Telling et al. (2012) reported a near 1:1 relationship between and total dissolved nitrogen (TDN), suggesting that DON comprised only a small portion of the TDN pool in snow and ice samples. By contrast, Wadham et al. (2016) suggested mineralization of organic matter by microbial activity, either within the cryoconite holes themselves or in debris- and cryoconite-rich “dirty” surface ice contributed to DON concentrations that could reach 0.7 and 3.0 µM, respectively. No dissolved organic phosphorous (DOP) concentrations in the surface ice environments in the Dark Zone have been reported to date.
Several studies have noted the heterogeneity in the spatial distribution of glacier algae in the melting surface ice of the Dark Zone (Yallop et al., 2012; Williamson et al., 2018). This heterogeneity occurs on length scales of centimetres to tens of metres (Yallop et al., 2012). This might well signify that macronutrient concentrations are also variable on this scale, yet no studies to date have examined variability on these length scales. We contend that it is important to determine the concentrations and relative proportions of dissolved inorganic and organic nutrients in melting surface ice environments of the Dark Zone, particularly during Streptophyte glacier algae blooms, since a knowledge of DIN, DON, DIP and DOP may be crucial to better understand how glacier algae and bacteria can retain, utilize and recycle their limited nutrients to sustain the large-scale blooms observed in this region of the Greenland Ice Sheet. The aims and objectives of this study, therefore, are 3-fold. First, we aim to quantify dissolved nutrient concentrations in the supraglacial environments of the Dark Zone during the peak ablation season. Second, we determine the relative abundance of dissolved inorganic and organic nutrients during the peak ablation season when microbial recycling is likely to have the greatest influence on the dissolved inorganic and organic ratios. Finally, we investigate whether there are systematic changes in the relative proportions of dissolved macronutrients during increased colonization of melting surface ice, which might shed light on the limiting nutrients on algal blooms.
2.1 Field site and sampling
A field camp was established within the Dark Zone, adjacent to Kangerlussuaq, during the summer of 2016. The camp was located approximately 30 km inland from the ice margin, near the “S6” weather station on the K transect (Fig. 1; 67∘04′43.3′′ N, 49∘20′29.7′′ W). Samples were collected from a designated area of approximately 500×500 m, which included surface ice, supraglacial stream and cryoconite hole habitats. Sampling occurred at intervals of approximately 3 days from 15 July to 14 August 2016. A categorical sampling strategy was employed, given the evident spatial heterogeneity apparent in ice algal distributions. Five different habitats were sampled; melting surface ice with three differing amounts of visible impurities, referred to here as surface ice with “low” (n=19), “medium” (n=19), and “high” (n=19) visible impurities) (Fig. 2) (Yallop et al., 2012). Water from supraglacial streams (n=10) and cryoconite holes (n=14) was randomly collected, both to act as a comparison with the melting surface ice and to examine how dissolved nutrients were transported through the weathering crust, which is the melting layer of surface ice that has a different physical architecture to the underlying ice (Fig. 2). Surface ice habitats were sampled from a 1×1 m area chosen at random, from which the top ∼2 cm of ice was removed using a pre-cleaned ice saw.
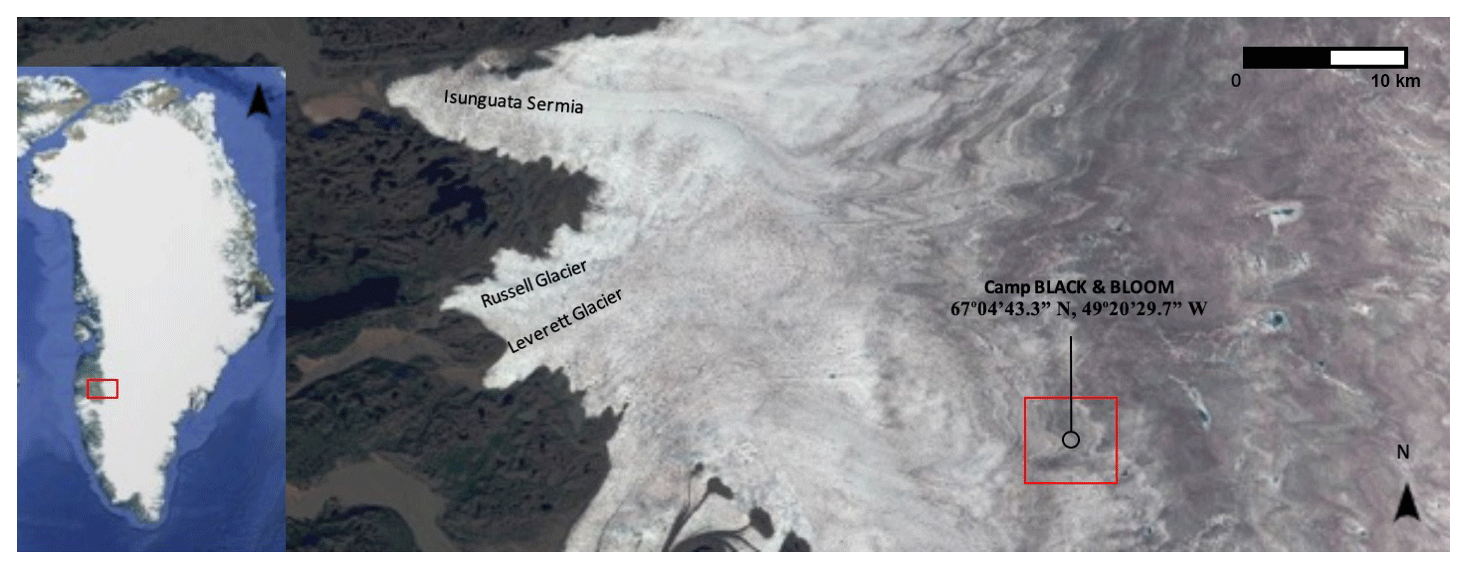
Figure 1Map showing location of Camp Black & Bloom 2016 (67∘04′43.3′′ N, 49∘20′29.7′′ W). Background image sourced from Sentinel 2, taken on 26 July 2016. The left panel was created with ©Google.
Samples from all five categories were collected for the analysis of dissolved inorganic and organic nutrients and dissolved organic carbon (DOC). Algal cell abundances were determined on surface ice samples only. Ice collected for nutrient analysis and algal cell abundance was placed in a clean/sterile Whirl-pak™ bag, while that collected for DOC analysis was transferred into a glass jar that was first rinsed three times with sample. Ice samples were left to melt overnight in the lab tent, typically taking 4–5 h. Supraglacial stream water samples for nutrient analysis were collected using high-density polyethylene plastic bottles (Nalgene™), whereas those for DOC analysis were collected in glass jars. Both sampling containers were rinsed three times with sample prior to collection. Cryoconite hole water used for nutrient and DOC analysis was collected using a large pipette and transferred into a Nalgene™ bottle or glass jar, respectively. The large pipette and collection vessels were rinsed three times with sample prior to collection. All high-density polyethylene plastic bottles (Nalgene™) for nutrient samples were acid washed in ∼10 % HCl solution prior to first use and all glass jars for DOC samples were furnaced at 500 ∘C for 4 h prior to first use.

Figure 2The five supraglacial habitats sampled: (a) ice with low visible impurities, (b) ice with medium visible impurities, (c) ice with high visible impurities, (d) supraglacial stream, and (e) cryoconite hole.
Some 15 mL of the homogenized, unfiltered ice melt and water samples were subsampled and fixed using 25 % glutaraldehyde at 2 % final concentration for quantifying algal cell abundance. These fixed samples were stored outside in the dark at ambient ice sheet temperatures. Ice melt and water samples for nutrient analysis were filtered through a 25 mm, 0.22 µm cellulose nitrate inline syringe filter (Whatman™) and stored in high-density polyethylene plastic bottles (Nalgene™; 30 mL). The bottles were immediately frozen and stored at a temperature of −20 ∘C using a Waeco 32 L freezer. Ice melt and water samples for DOC analysis were filtered using a glass filtration column and a furnaced 47 mm, 0.7 µm GF/F. The filtration column was washed three times with sample water prior to collection of the filtrate. The filtrate was stored in pre-furnaced amber glass vials and acidified with 100 µL of 1 M HCl. They were chilled to a temperature of ∼3 ∘C by storing the samples in a box at ambient air temperature. The samples were maintained at this temperature during transport and in storage at the LowTex Laboratory at the University of Bristol. Nutrient samples were thawed immediately prior to analysis using a ∼40 ∘C hot water bath. Procedural blanks (n=9) were collected over the course of the sampling season by processing deionized water in place of a sample.
2.2 Analytical methods
Algal cell abundance was quantified using a Fuchs–Rosenthal haemocytometer (Lancing, UK) on a Leica DM 2000 epifluorescence microscope with an attached MC120 HD microscope camera (Leica, Germany). For samples containing sufficient cell abundance, a minimum of 300 cells were counted to ensure adequate assessment of assemblage diversity (Williamson et al., 2018).
DIN species include , and and were quantified as follows. First, was quantified spectrophotometrically using a Lachat QuickChem® 8500 Series 2 Flow Injector Analyzer (FIA; QuickChem® Method 31-107-06-1-I). Measurements were based on a phenolate–hypochlorite alkaline reaction method measured at 630 nm (Solorzano, 1969). The limit of detection (LoD) was 0.62 µM, determined by dividing the standard deviation of the response of the calibration curve by the slope of the calibration curve and then multiplying the result by 3 (Shrivastava and Gupta, 2011). Precision was ±2.1 % and accuracy was +8.5 %, as determined from comparison with gravimetrically diluted 1000 mg L−1 –N certified stock standards to a concentration of 1.1 µM. (Sigma TraceCERT®). Second, and total oxidized nitrogen (TON) ( + ) were quantified spectrophotometrically using a Gallery Plus Automated Photometric Analyzer (Thermo Fisher Scientific, UK). This combination of analysis allows the original concentration to be determined by subtracting from TON.
TDN is the sum of DIN and DON, and was determined by digesting the samples with a potassium persulfate, sodium hydroxide and boric acid reagent and autoclaving at 121 ∘C for 30 min (Grasshoff et al., 1999). This process causes the oxidation of organic nitrogen compounds, which can then be measured as TON as above. Purification of the potassium persulfate was conducted via recrystallization in order to remove any N contamination. Measurements were based on the hydrazine–sulfanilamide reaction method measured at 540 nm. DON was then estimated by subtracting DIN from TDN (i.e. DON = TDN–DIN). LoDs were 0.14 µM (), 0.64 µM (TON) and 0.87 µM (TDN/DON). Precision was ±0.87 % (), ±1.17 % () and ±0.63 % (TDN/DON), and accuracy was −4.04 % (), −8.07 % () and −5.7 % (TDN/DON), as determined from comparison with gravimetrically diluted 1000 mg L−1 and certified stock standards to concentrations of 0.71 µM (), 1.4 µM () and 7.1 µM (TDN/DON) (Sigma TraceCERT®).
TDP (total dissolved phosphorus) is the sum of DIP (principally ) and DOP. The same persulfate digestion method described for TDN was used to measure TDP as . in both undigested and digested samples was quantified using a Lachat QuickChem® 8500 Series 2 Flow Injector Analyzer (FIA; QuickChem® Method 31-115-01-1-I) using the molybdenum blue method measured at 880 nm. DOP was determined by the subtraction of DIP in the undigested sample from the TDP in the digested sample (i.e. DOP = TDP–DIP). The LoD was 0.02 µM ( and TDP/DOP). Precision was ±1.6 % () and ±3.1 % (TDP/DOP), and accuracy was +2.3 % () and +5.0 % (TDP/DOP), as determined from comparison with gravimetrically diluted 1000 mg L−1 PO4–P certified stock standards to a concentration of 0.65 µM (Sigma TraceCERT®).
DOC concentrations were quantified using a Shimadzu TOC-L Organic Carbon Analyzer with a high-sensitivity catalyst. Non-purgeable organic carbon (NPOC) was measured after acidification of samples with HCl and catalytic combustion (680 ∘C) of dissolved organic carbon to carbon dioxide, which was then measured by infrared absorption. The LoD was 9.5 µM. Precision was ±2.4 % and accuracy was −5.9 %, as determined from comparison with gravimetrically diluted 1000 mg L−1 TOC certified stock standards to a concentration of 83.3 µM (Sigma TraceCERT®).
2.3 Data analysis
All measurements below the LoD were considered to be 0 for all statistical analyses. All DIN, DON, DIP, DOP and DOC data were water blank-corrected using values from the respective field procedural blanks (Table 1). Additionally, all blank-corrected values that were negative were assumed to be 0 for all statistical analyses. Statistical analysis was performed in RStudio v.1.1.414 (RStudio, Inc 2018). Identification of statistical differences between the nutrient content, DOC concentration and algal cell abundance in different habitats was achieved using one-way analysis of variance (ANOVA) or t test comparisons, with post hoc Tukey honestly significant difference (HSD) analysis applied to all significant ANOVA results. Pearson's product-moment correlations were used to identify correlations between DON, DOC and algal cell abundance. Homogeneity of variance and normality of distribution were tested prior to all parametric analyses, and model assumptions were verified by examination of model criticism plots.
Table 1Summary statistics for dissolved macronutrient (N and P) and DOC concentrations in the five supraglacial habitats. DON, DIP, DOP and DOC denote dissolved organic nitrogen, dissolved inorganic phosphorus, dissolved organic phosphorus and dissolved organic carbon, respectively. For each nutrient, the mean ± SD is provided, followed by the range of values. Concentrations are expressed in µM; nutrient ratios are in µM µM−1.
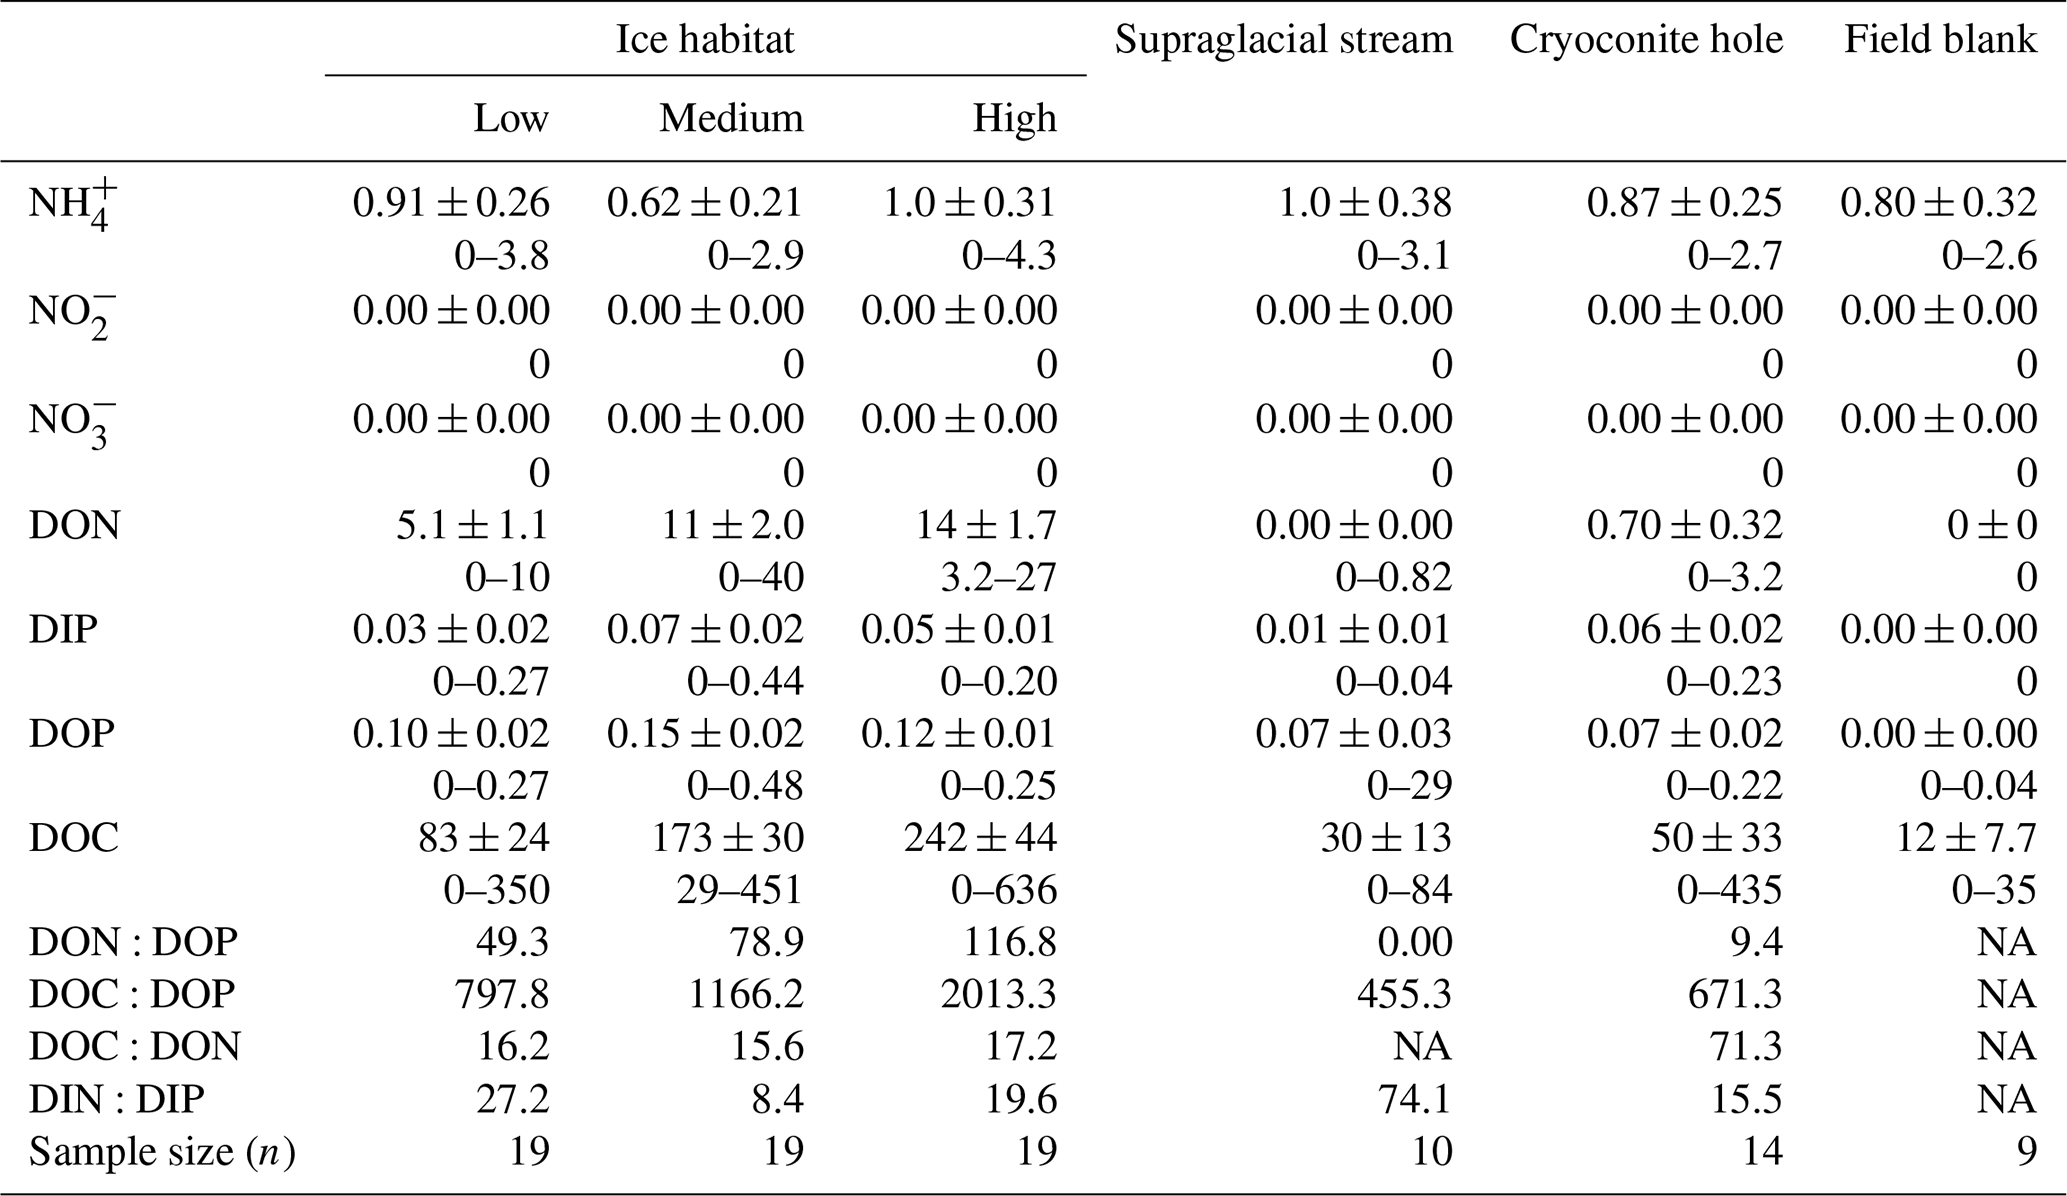
NA – not available.
3.1 Dissolved nutrient concentrations in surface ice with differing levels of visible impurities
Supraglacial environments are extremely oligotrophic, making measurements of dissolved nutrients difficult. Dissolved nutrient concentrations reported in previous studies of supraglacial environments are typically below or just above instrument limit of detections. Some 54 DON, 41 DIN, 74 DOP, 40 DIP and 59 DOC samples out of a total of 81 samples for all five supraglacial habitats had concentrations above the LoD.
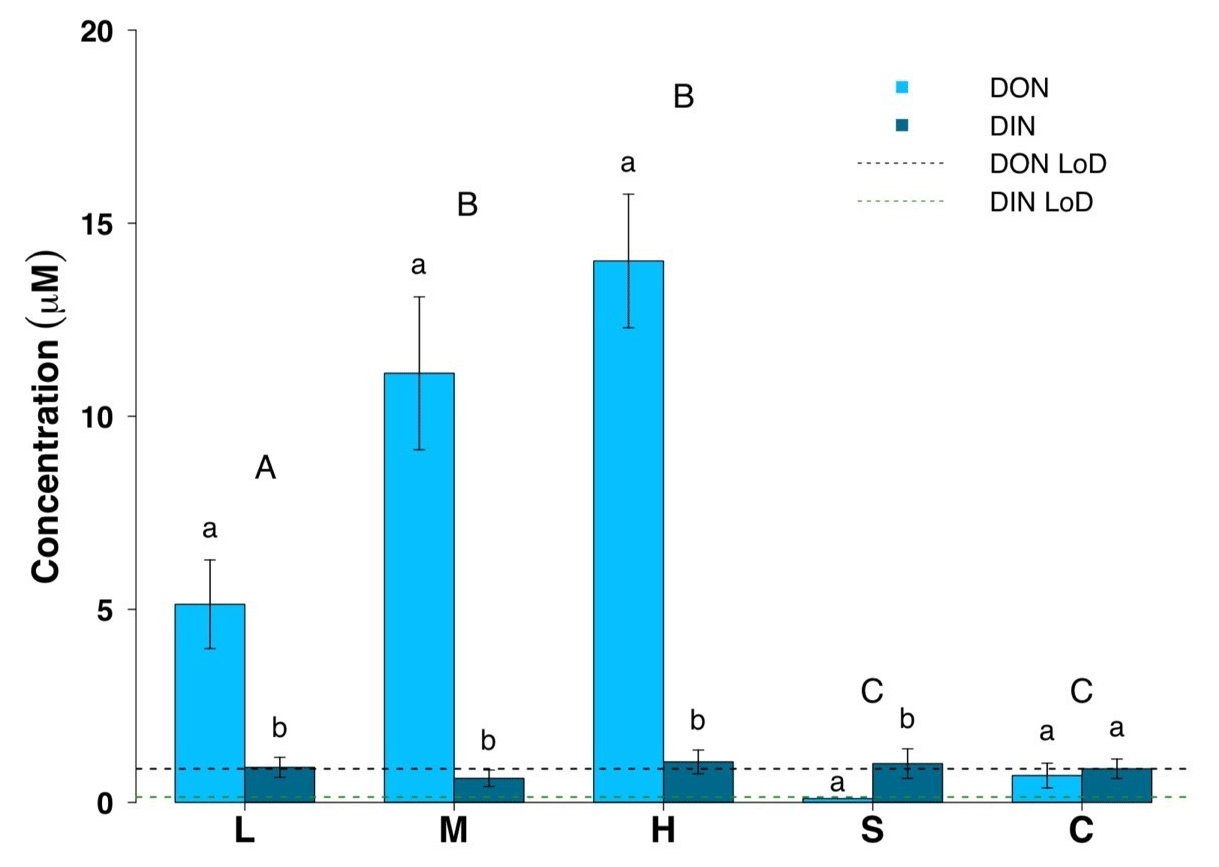
Figure 3Dissolved organic nitrogen (DON) and dissolved inorganic nitrogen (DIN) concentrations for all surface habitats (mean ± SE, n=19 for L, M, H, n=10 for S and n=14 for C). L – ice with low visible impurities, M – ice with medium visible impurities, H – ice with high visible impurities, S – supraglacial stream water and C – cryoconite hole water. The LoD line depicts the limit of detection of the instrument. Uppercase letters denote homogeneous subsets derived from post hoc Tukey HSD analysis on a significant one-way ANOVA in relation to the dissolved nitrogen phase. Lowercase letters denote t test comparisons in relation to habitat type.
Dissolved organic concentrations were significantly higher than dissolved inorganic concentrations for nitrogen and phosphorus. Some 93 % of the TDN was in the form of DON and about 67 % of TDP was present in the form of DOP in all three surface ice habitats. Mean DON concentrations for the three surface ice habitats range from 5.1 to 14.0 µM, while those for DIN range from 0.62 to 1.0 µM (Fig. 3, Table 1). Overall, mean DON concentrations for the three ice surface habitats were significantly higher (, p<0.0001) than mean DIN concentrations. Similarly, DOP concentrations were usually at least twice those of DIP concentrations for the three ice surface habitats, with mean values ranging from 0.10 to 0.15 µM and from 0.03 to 0.07 µM, respectively (Fig. 4, Table 1). t tests revealed significant differences between DON and DIN in all three surface ice habitats (low: t36=3.6, p<0.001, medium: t36=5.3, p<0.0001, high: t36=7.4, p<0.0001, (Fig. 3) and DOP concentrations as significantly higher than DIP concentrations for all three surface ice habitats (low: t36=3.1, p<0.01, medium: t36=2.1, p<0.05, high: t36=3.7, p<0.001) (Fig. 4). DON and DOC concentrations in the three surface ice habitats showed clear trends with increasing visible impurities (Figs. 3 and 5). DON concentrations increased significantly from low to medium and low to high visible impurity loadings (, p<0.05, , p<0.001, respectively), while DOC concentrations increased significantly in ice with high and low visible impurity loading (, p<0.01).

Figure 4Dissolved organic phosphorus (DOP) and dissolved inorganic phosphorus (DIP) concentrations for all surface ice habitats (mean ± SE, n=19 for L, M, H, n=10 for S and n=14 for C). L – ice with low visible impurities, M – ice with medium visible impurities, H – ice with high visible impurities, S – supraglacial stream water and C – cryoconite hole water. The LoD line depicts the limit of detection of the instrument. Lowercase letters denote t test comparisons in relation to habitat type.
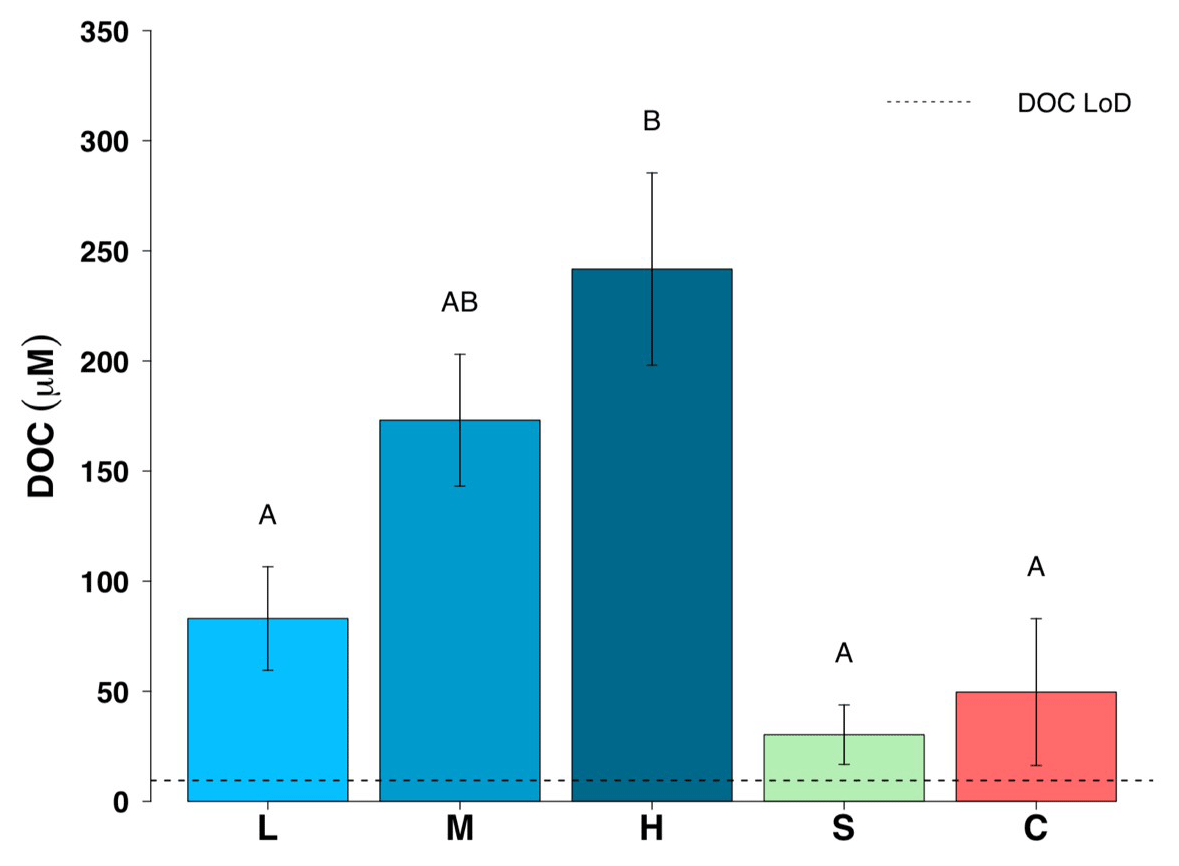
Figure 5Dissolved organic carbon (DOC) concentrations for all five surface habitats (mean ± SE, n=19 for L, M, H, n=10 for S and n=14 for C). L – ice with low visible impurities, M – ice with medium visible impurities, H – ice with high visible impurities, S – supraglacial stream water and C – cryoconite hole water. The LoD line depicts the limit of detection of the instrument. Uppercase letters denote homogeneous subsets derived from post hoc Tukey HSD analysis on a significant one-way ANOVA in relation to habitat type.
3.2 Links between algal abundance and dissolved organic nutrients
Algal cell abundance, which ranged from 90 cells mL−1 to 0.98×10⁴ cells mL−1, increased significantly with the amount of visible impurities seen on the ice surface, as shown in Fig. 6 (, p<0.0001). No determination of the mineralogic composition of the visible impurities was conducted. A Pearson product-moment correlation was undertaken to illustrate the relationship between average algal abundance and average DOC and DON concentrations, as DOC and DON concentrations also increased with the amount of visible impurities present. Correlations between average algal cell counts versus both DON and DOC surface ice concentrations were significant (t3=3.5, p<0.05, r=0.9 and t3=5.4, p<0.01, r=0.95, respectively). Comparison of DOP surface ice concentrations and algal cell counts were not significant.

Figure 6Algal cell abundance in ice surface ice habitats (mean ± SE, n=19 for each habitat). L – ice with low visible impurities, M – ice with medium visible impurities and H – ice with high visible impurities. Uppercase letters denote homogeneous subsets derived from post hoc Tukey HSD analysis on a significant one-way ANOVA in relation to habitat type.
Dissolved organic nutrient ratios were assessed to investigate the presence of a limiting nutrient. Molar DON : DOP ratios, ranging from 49 to 120, were elevated for all three surface ice environments compared to the 16 : 1 Redfield ratio, and DOC : DOP ratios for all three surface ice habitats, which ranged from 800 to 2000, were considerably higher, as much as ∼19 times the Redfield ratio, 106 : 1 (Table 1). DOC : DON ratios, which ranged from 16 to 17, were, on average, twice the balanced 6.6 : 1 ratio (Table 1). DON : DOP and DOC : DOP ratios also increased with the amount of visible impurities present, while DOC : DON ratios remain relatively constant for the three surface ice habitats (Table 1).
3.3 Low transport of dissolved organic nutrients within the water table
Mean DON and DOP concentrations were significantly lower in supraglacial streams (0 and 0.07 µM, respectively) and cryoconite hole water (0.7 and 0.07 µM, respectively) compared to low, medium and high visible impurity ice. All DON concentrations for cryoconite hole and supraglacial stream water were below the LoD (Fig. 3). DIN concentrations were relatively constant over all supraglacial habitats, with mean concentrations ranging from 0.62 to 1.0 µM. DOP concentrations in supraglacial stream (0.07±0.03 µM) and cryoconite hole water (0.07±0.02 µM) were not significantly different from DIP concentrations (0.01±0.01 and 0.06±0.02 µM, respectively). DIP concentrations in low (0.03±0.02 µM), medium (0.07±0.02 µM) and high (0.05±0.01 µM) visible impurity ice were only slightly elevated compared to supraglacial streams, whereas cryoconite hole water concentrations were comparable to the three surface ice habitats. Mean DOC concentrations in supraglacial stream and cryoconite hole water (30 and 50 µM, respectively) were significantly lower than ice with high visible impurities (, p<0.001, in both cases) (Fig. 5).
4.1 Dominance of dissolved organic over dissolved inorganic phases in melting ice surface environments
Dissolved organic nutrients (DON and DOP) dominate dissolved inorganic nutrients (DIN and DIP) in the melting surface ice environments of this region of the Dark Zone (Figs. 3 and 4), in contrast with the dominance of DIN in studies of fresh snow or ice cores from the GrIS (Telling et al., 2012; Wolff, 2013), which has a mean concentration of 1.4 µM. Further, DIN also dominates on the margins of the ice sheet, where Telling et al. (2012) found DIN concentrations in snow to be 1.4±0.2 µM but DON concentrations to be non-detectable. Wadham et al. (2016) reported relatively similar DIN (1.3 µM) and DON (∼1.6 µM, assuming DON = TDN-DIN in their tabulated data) concentrations in a small number (n=7) surface and debris-rich ice in the Dark Zone of the GrIS during the main ablation season, but these values were thought likely to be associated with dispersed cryoconite, the dark organic-rich sediment that accumulates on the bottom of cryoconite holes and larger supraglacial water bodies. Otherwise, DON was not measurable in snow and surface ice, prior to melting. In summary, this suggests that potential input of dissolved N species to supraglacial environments from fresh snow and melting meteoric ice are dominated by DIN, rather than DON. There are too little data on DIP and DOP to be confident that this is also the case for P species. By contrast, dissolved N species in the melting ice surface of the Dark Zone shifts to a domination of DON during the peak ablation season (July and August), when blooming of glacier algae occurs. We therefore hypothesize that the algae present in these blooms drive the shift in nutrients during the peak ablation season from the dissolved inorganic phase to the dissolved organic phase.
4.2 Association of dissolved organic nutrients and algal abundance
Figure 6 shows that algal abundance increases in the ice with low, medium and high visible impurities. The blooming of the algal cells is also associated with trapping of other mineral particulates at the surface. Yallop et al. (2012) reported a 3:2 mineral particle to algal cell ratio for surface ice collected in the Dark Zone, although these particles have only a minor impact on the albedo reduction at the surface (Cook et al., 2019). It is clear from Fig. 3 that the mean DON concentration increases from low to high visible impurities, consistent with DON formation being linked to glacier algae blooms. This is most likely due to a combination of extracellular exudation of polymeric substances and the decomposition of glacier algal cells within the supraglacial system. Concentrations of and are zero (Table 1), and is the only measurable DIN species (mean values range from 0.6 to 1 µM). The absence of measurable and is consistent with the uptake of these species by glacier algae, and the emergence of as the dominant DIN species is consistent with heterotrophic remineralization of organic matter (Telling et al., 2012). We note that the mass of N held in the microbial biomass is likely increasing over time, since the sum of the mean DIN and DON concentrations (1.0 and 0.0 µM, respectively) in the supraglacial stream water, which is the ultimate sink of macronutrients from the melting ice surface, is less than the average DIN concentration of the melting ice (1.4 µM) (Telling et al., 2012; Wolff, 2013; Wadham et al., 2016). The only measurable DIN species in supraglacial meltwater is , which points to ammonification being an important process in terms of N dynamics and loss of labile N from the melting surface ice. Previous studies of the relative rates of primary production and bacterial production in both the margins and the Dark Zone have produced ratios of 30:1 (Yallop et al., 2012; Nicholes et al., 2019). The dominance of dissolved organic nutrients and in surface ice environments documented here, in combination with reduced secondary production relative to net primary production in the same environments, indicates an inefficiency in the microbial loop for remineralization of organic nutrient N stocks (Fig. 7).
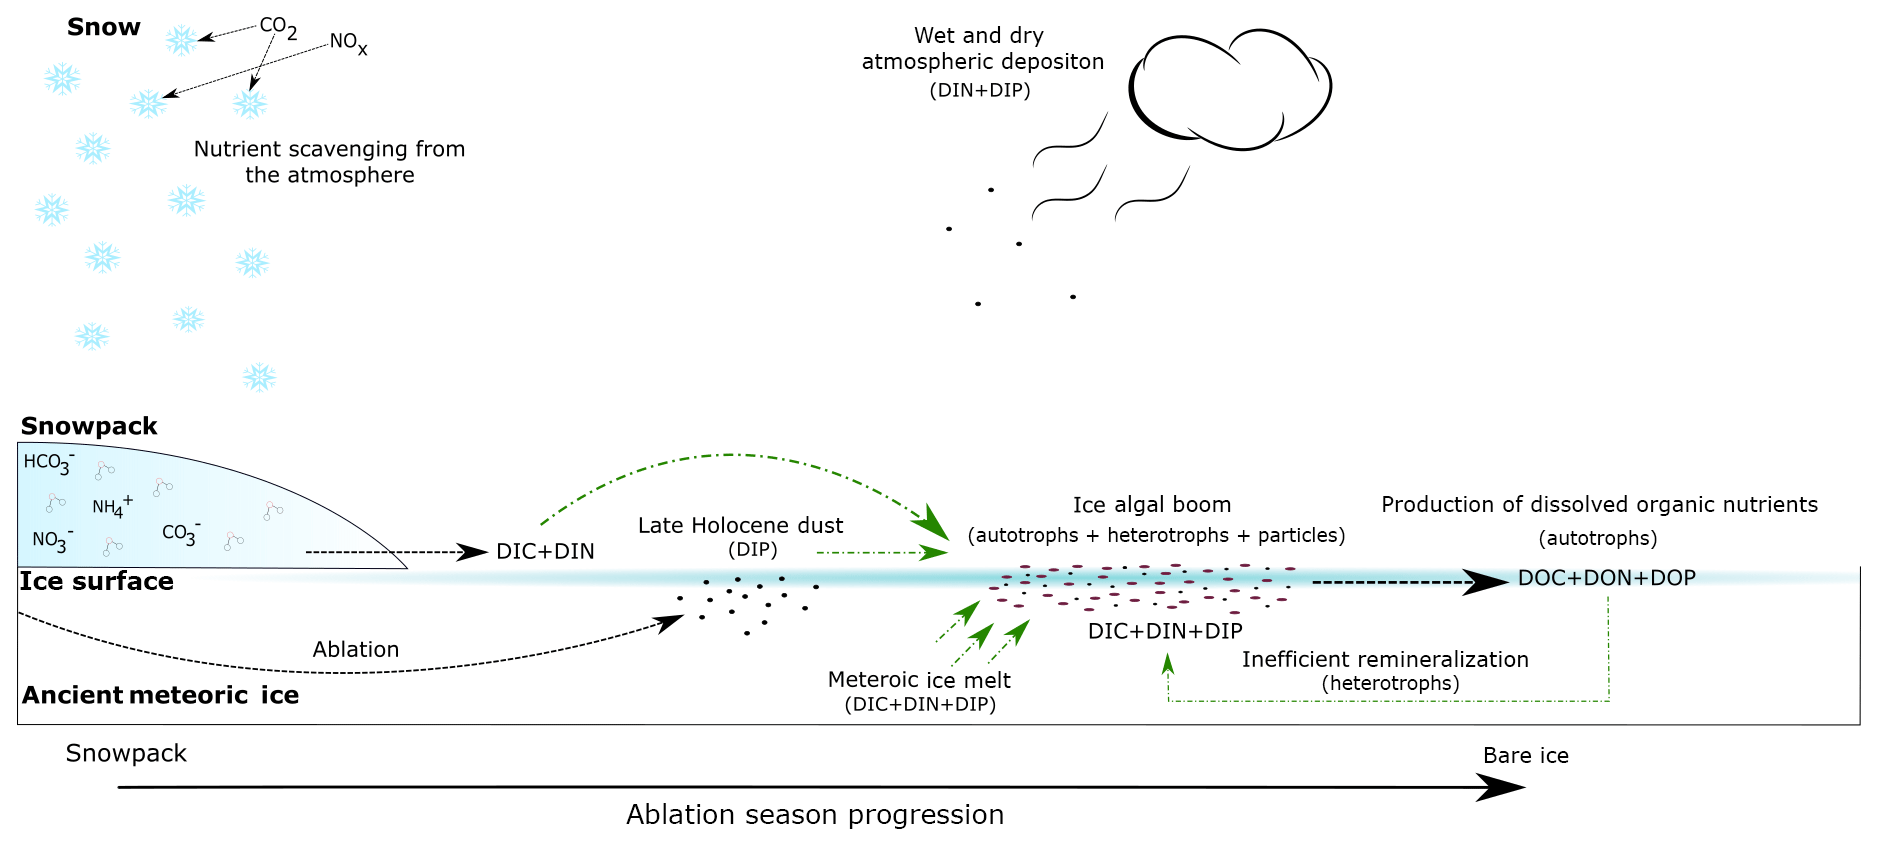
Figure 7Conceptual diagram of the supraglacial environment in the Dark Zone of the GrIS. Black dashed lines represent nutrient inputs to all supraglacial environments. Green lines represent hypothesized nutrient inputs utilized by ice algal blooms. Arrow thickness represents relative nutrient concentration.
There are fewer data in the literature on the relative abundance of DIP and DOP in snow and ice, but here we show that there are similarities between the accumulation of dissolved N into DON and P into DOP species (Figs. 3 and 4). Mean DOP concentrations in the five sampled environments are higher than mean DIP. This is consistent with uptake of P by glacier algae and subsequent recycling of P into organic forms. An interesting observation is that there is usually some measurable DIP found in the particulate-rich environments that were sampled (surface ice and cryoconite hole water), whereas the mean DIP in the supraglacial stream water is the lowest value recorded and below the limit of detection. This suggests two things, first, that particulates are the source of DIP, and second, that export of P from the melting surface ice is largely by DOP. We noted above that particulates are associated with glacier algae in the melting surface ice, and it appears that as algal blooms develop, more particulates become trapped in the surface layer (Yallop et al., 2012). It may well be that there is an “inorganic symbiosis” between the glacier algae and the trapped particulates, which provide a P source for algal growth.
Our results on the dominance of DON and DOP are consistent with findings of previous studies in polar glacier surface aquatic environments (Stibal et al., 2008a, b, 2009; Wadham et al., 2016). For example, Stibal et al. (2008b) reported that DON (∼72 %) and DOP (∼89 %) in waters in cryoconite holes on a Svalbard glacier dominated the total dissolved N and P pools. Wadham et al. (2016) found elevated DON concentrations in water in cryoconite holes and debris-rich surface ice in the Dark Zone, suggesting either mineralization of organic matter by microbial activity or leaching of allochthonous organic matter in debris. These observations suggest that conversion of dissolved inorganic to dissolved organic nutrients by microbial communities in melting surface ice environments may be a common process on glacier surfaces.
4.3 Retention of nutrients at the ice sheet surface
The low concentration of DIN, DIP, DON and DOP in the supraglacial meltwaters relative to the melting surface ice suggests that macronutrients are retained in these surface environments. Melting ice surfaces in the Dark Zone often have a veneer of low density, wet porous ice, which may reach depths of 1–2 m, known as the “weathering crust” (LaChapelle, 1959; Müller and Keeler, 1969; Munro, 1990; Irvine-Fynn et al., 2012). The intense shortwave radiation during summer often causes internal melt along ice crystal boundaries, resulting in a surface ice layer with heterogeneous thickness, density, porosity and water content (Müller and Keeler, 1969; Cook et al., 2016b; Christner et al., 2018). The porous nature of the weathering crust allows flow paths to form through the water table that exists within the surface ice (Irvine-Fynn et al., 2012; Cook et al., 2016b; Rassner et al., 2016; Christner et al., 2018), which act as important links between different supraglacial environments and are believed to transport microbes and nutrients via subsurface flow (Irvine-Fynn et al., 2012; Hoffman et al., 2014; Karlstrom et al., 2014; Cook et al., 2016b). Water is often in temporary storage in the weathering crust (Irvine-Fynn et al., 2012), particularly at depths where connectivity of flow paths can be low. It follows that the first explanation for retention of dissolved organic nutrients in the weathering crust is that they accumulate in water stored in the weathering crust.
DOC concentrations in supraglacial stream water were lower than the DOC in all surface ice habitats, particularly surface ice with high visible impurities (Fig. 5). This suggests a second possible mechanism of retention of DON and DOP in the weathering crust, via the production of extracellular polymeric substances (EPS). Algae and bacteria produce EPS which can alter the physical and chemical environment around their cells (Stibal et al., 2012a; Angelaalincy et al., 2017). For example, it has been shown that EPS are used by cyanobacteria in cryoconite holes to bind mineral particles together, creating the cryoconite granules at the bottom of the hole (Stibal et al., 2012b; Yallop et al., 2012; Musilova et al., 2016). EPS are often colloidal (here, operationally defined as passing through 0.4 µm but not 0.02 µm filter membranes) (Raiswell et al., 2018), and when analysed from filtered (through 0.4 µm membranes), melted surface ice samples will be in the dissolved organic fraction (Pereira et al., 2009; Hodson et al., 2010). The chemical composition of EPS exuded by glacier algae is unknown. We note that the EPS of bacteria living in sewage sludge can have a molar ratio that approaches (Guibaud et al., 2008), in order to illustrate that EPS can contain N and P. It is likely that the EPS of glacier algae contains relatively more C than N and P, given the depauperate nature of the melting ice surface. EPS certainly seem to be associated with the binding and retention of particulates in the weathering crust, and it follows that at least some of the DON and DOP may also be associated with these EPS.
These two mechanisms of retention of dissolved organic nutrients in the weathering crust, either in temporarily stored water or as EPS, mean that DOC, DON and DOP storage in the weathering crust is transitory, and given the dynamic response of the weathering crust to climatic perturbations, it is very likely that export of these species from the weathering crust will be pulsed, rather than constant. For example, large melt events, accompanying summer storms, may result in wholesale melting of the weathering crust (Tedstone et al., 2019) and export of significant quantities of the dissolved organic phases contained within them. By contrast, that stored in the weathering crust towards the end of the ablation season, when the crust is freezing and water flow paths are closing, may be retained in the frozen ice surface over winter. For example, Musilova et al. (2017) reported that at the margin of the GrIS, DOC remaining in surface ice at the end of the ablation season likely froze over winter and was released the following ablation season through ice melt.
4.4 Stoichiometry of different supraglacial environments
ratios in melted surface ice samples may provide information on whether N or P is the limiting nutrient within supraglacial environments in the Dark Zone. For example, Table 1 shows that DON:DOP ratios increase systematically, from 49, 78 to 120, for low, medium and high impurity surface ice environments, respectively, as do DOC:DOP ratios (800, 1200, 2000). By contrast, DOC:DON ratios remain relatively stable for the surface ice habitats (16, 16 and 17, respectively). This could indicate that P is limiting for the glacier algal community. However, this does not quite tie in with the DIP data presented in Fig. 4, which show that measurable, if low, concentrations of P are usually present in the melting surface ice. Rather, and are below detection, presumably as a result of uptake by phototrophs, and is the only measurable DIN species, presumably as a result of heterotrophic activity. Phototrophs preferentially utilize both and , and the presence of both DIN and DIP in melting surface ice environments, irrespective of visible particulate loading, and therefore of algal cell abundance, suggests that a factor other than macronutrient concentration is limiting algal growth. Table 1 shows that mean concentrations in the melting surface ice are in the range of 0.6–1.0 µM. We noted above that there is no readily available C:N ratio of glacier algae in the literature, but typical C:N ratios of sea ice algae are in the range of 12–46 (Niemi and Michel, 2015). This implies that somewhere in the range of 7.2–26 µM of C could be additionally fixed, if all the N was taken up by phototrophs with this range of C:N ratios. We also noted that it is even more difficult to find ratios of glacier algae, but should the C:P ratio be in the region of 100:1 to 1000:1, then P demand will be 0.007–0.46 µM. Table 1 shows that the mean concentration of DIP in melting surface ice is in the range of 0.03 to 0.05 µM, which suggests that P is not a limiting macronutrient on primary production. The systematic change in DON:DOP and DOC:DOP ratios with increasing visible impurities, a proxy for algal cell abundance, could be driven by the amount of P per cell that is potentially available at the high light intensity of the ablation season (>1500 µmol photons m2 s−1). The DIP content of the surface ice is relatively constant (Table 1) given the much larger change in cell abundance as the visible impurities increase. The combination of lower P availability at high light intensity results in an increase in the C:P ratio of phototrophs in other aquatic environments (Hessen et al., 2013). It is plausible that this too happens with glacier algae and that subsequent decomposition products and EPS will likewise have higher DOC:DOP ratios as a consequence.
We conclude that DIN and DON concentrations in the melting surface ice of the Dark Zone on the GrIS are markedly different from those documented in ice cores to date. Wolff (2013) reported DIN, principally in the form of , dominating the initial composition of ice melt, yet in the present study, DON dominates the melting surface ice environments which host blooming glacier algae. Furthermore, DIN in these environments is exclusively present as , and is below the detection limit (0.64 µM). There are relatively few data on the P content of Greenland ice, but we find that DOP dominates DIP in melting surface ice habitats, although DIP is usually present in measurable quantities (LoD = 0.02 µM). The presence of both and DIP, even in heavily colonized melting surface ice, suggests that factors other than macronutrient limitation control the blooms. We speculate that dissolved macronutrients are held in the melting surface ice because of the architecture of the weathering crust and/or because EPS are retained within the melting ice latticework. The former controls the hydrology and the connectivity of water flow paths and water storage in the surface ice, and the latter may be involved with the retention of particulates in the surface. There are currently no data on ratios of EPS exuded by glacier algae, but EPS of other autotrophs do contain both N and P in association with C. DOC:DON ratios are relatively constant in melting surface ice, but DOC:DOP ratios increase markedly with increasing algal cell counts. This may be attributable to the increasing cell-to-DIP ratio, which, at high light intensity, increases the C:P ratio of autotrophs in other freshwater environments (Hessen et al., 2013). This could be seen as a beneficial adaption to algal life in melting ice surfaces, where P sources are limited, since blooms are not so dependent on P as a consequence.
Data are available at https://doi.org/10.5285/d8369a2f-8b50-4711-b492-ae773bfafd95 (Holland et al., 2019).
Liane G. Benning (GFZ German Research Centre for Geosciences, Potsdam, Germany), James B. McQuaid (University of Leeds, Leeds, UK), Andrew J. Hodson (University Centre in Svalbard, Longyearbyen, Norway, and Western Norway University of Applied Sciences, Bergen, Norway), Edward Hanna (University of Lincoln, Lincoln, UK), Tristram D. L. Irvine-Fynn (Aberystwyth University, Aberystwyth, UK), Jonathan L. Bamber (University of Bristol, Bristol, UK), Stefanie Lutz (GFZ German Research Centre for Geosciences, Potsdam, Germany), Miranda J. Nicholes (University of Bristol, Bristol, UK), Marek Stibal (Charles University, Prague, Czech Republic), Jason E. Box (Geological Survey of Denmark and Greenland, Copenhagen, Denmark).
MT, AA, and MY conceived and designed the study. AH, CW, MT, AA, AT, JM, and JC and the Black & Bloom group collected the samples. CW provided algal counts for the mid to late ablation periods. AH conducted all the nutrient analysis and was aided by FS in the instrument maintenance and data analysis. AH wrote the paper with inputs from MT, CW, AT and AA. All the authors reviewed the final manuscript.
The authors declare that they have no conflict of interest.
The authors would like to thank and acknowledge the entire Black & Bloom team, especially those involved in the sample collection conducted in the 2016 field season. The manuscript was considerably improved following the constructive commentary of two anonymous reviewers.
This project has received funding from the European Commission (Horizon 2020 Marie Sklodowska-Curie Actions, grant no. 675546). This work was also funded in part by the UK Natural Environment Research Council Consortium (Black & Bloom (NE/M021025/1)).
This paper was edited by Tom J. Battin and reviewed by two anonymous referees.
Anesio, A. M. and Laybourn-Parry, J.: Glaciers and ice sheets as a biome, Trends Ecol. Evol., 27, 219–225, 2012.
Angelaalincy, M., Senthilkumar, N., Karpagam, R., Kumar, G. G., Ashokkumar, B., and Varalakshmi, P.: Enhanced Extracellular Polysaccharide Production and Self-Sustainable Electricity Generation for PAMFCs by Scenedesmus sp. SB1, ACS Omega, 2, 3754–3765, https://doi.org/10.1021/acsomega.7b00326, 2017.
Bagshaw, E. A., Tranter, M., Fountain, A. G., Welch, K., Basagic, H. J., and Lyons, W. B.: Do Cryoconite Holes have the Potential to be Significant Sources of C, N, and P to Downstream Depauperate Ecosystems of Taylor Valley, Antarctica?, Arct. Antarct. Alp. Res., 45, 440–454, https://doi.org/10.1657/1938-4246-45.4.440, 2013.
Box, J. E., Fettweis, X., Stroeve, J. C., Tedesco, M., Hall, D. K., and Steffen, K.: Greenland ice sheet albedo feedback: thermodynamics and atmospheric drivers, The Cryosphere, 6, 821–839, https://doi.org/10.5194/tc-6-821-2012, 2012.
Chandler, D. M., Alcock, J. D., Wadham, J. L., Mackie, S. L., and Telling, J.: Seasonal changes of ice surface characteristics and productivity in the ablation zone of the Greenland Ice Sheet, The Cryosphere, 9, 487–504, https://doi.org/10.5194/tc-9-487-2015, 2015.
Christner, B. C., Kvitko, B. H., and Reeve, J. N. J. E.: Molecular identification of bacteria and eukarya inhabiting an Antarctic cryoconite hole, Extremophiles, 7, 177–183, 2003.
Christner, B. C., Lavender, H. F., Davis, C. L., Oliver, E. E., Neuhaus, S. U., Myers, K. F., Hagedorn, B., Tulaczyk, S. M., Doran, P. T., and Stone, W. C.: Microbial processes in the weathering crust aquifer of a temperate glacier, The Cryosphere, 12, 3653–3669, https://doi.org/10.5194/tc-12-3653-2018, 2018.
Cook, J. M., Edwards, A., Bulling, M., Mur, L. A., Cook, S., Gokul, J. K., Cameron, K. A., Sweet, M., and Irvine-Fynn, T. D.: Metabolome-mediated biocryomorphic evolution promotes carbon fixation in Greenlandic cryoconite holes, Environ. Microbiol., 18, 4674–4686, https://doi.org/10.1111/1462-2920.13349, 2016a.
Cook, J. M., Hodson, A. J., and Irvine-Fynn, T. D.: Supraglacial weathering crust dynamics inferred from cryoconite hole hydrology, Hydrol. Process., 30, 433–446, https://doi.org/10.1002/hyp.10602, 2016b.
Cook, J., Hodson, A. J., Taggart, A., Mernild, S. H., and Tranter, M.: A predictive model for the spectral “bioalbedo” of snow, J. Geophys. Res.-Earth, 122, 434–454, https://doi.org/10.1002/2016JF003932, 2017.
Cook, J. M., Tedstone, A. J., Williamson, C., McCutcheon, J., Hodson, A. J., Dayal, A., Skiles, M., Hofer, S., Bryant, R., McAree, O., McGonigle, A., Ryan, J., Anesio, A. M., Irvine-Fynn, T. D. L., Hubbard, A., Hanna, E., Flanner, M., Mayanna, S., Benning, L. G., van As, D., Yallop, M., McQuaid, J., Gribbin, T., and Tranter, M.: Glacier algae accelerate melt rates on the western Greenland Ice Sheet, The Cryosphere Discuss., https://doi.org/10.5194/tc-2019-58, in review, 2019.
Dodds, W. K.: What controls levels of dissolved phosphate and ammonium in surface waters?, Aquat. Sci., 55, 132–142, 1993.
Enderlin, E. M., Howat, I. M., Jeong, S., Noh, M. J., Van Angelen, J. H., and Van Den Broeke, M. R.: An improved mass budget for the Greenland ice sheet, Geophys. Res. Lett., 41, 866–872, https://doi.org/10.1002/2013GL059010, 2014.
Gardner, A. S. and Sharp, M. J.: A review of snow and ice albedo and the development of a new physically based broadband albedo parameterization, J. Geophys. Res.-Earth, 115, F01009, https://doi.org/10.1029/2009JF001444, 2010.
Grasshoff, K., Kremling, K., and Ehrhardt, M.: Methods of seawater analysis, John Wiley & Sons, Weinheim, New York, Chiester, Brisbane, Singapore, Toronto, 1999.
Guibaud, G., Bordas, F., Saaid, A., D'abzac, P., and Van Hullebusch, E.: Effect of pH on cadmium and lead binding by extracellular polymeric substances (EPS) extracted from environmental bacterial strains, Colloid. Surface. B, 63, 48–54, 2008.
Hawkings, J., Wadham, J., Tranter, M., Telling, J., Bagshaw, E., Beaton, A., Simmons, S.-L., Chandler, D., Tedstone, A., and Nienow, P.: The Greenland Ice Sheet as a hot spot of phosphorus weathering and export in the Arctic, Global Biogeochem. Cy., 30, 191—210, https://doi.org/10.1002/2015gb005237, 2016.
Hessen, D. O., Elser, J. J., Sterner, R. W., and Urabe, J.: Ecological stoichiometry: an elementary approach using basic principles, Limnol. Oceanogr., 58, 2219–2236, 2013.
Hodson, A., Cameron, K., Bøggild, C., Irvine-Fynn, T., Langford, H., Pearce, D., and Banwart, S.: The structure, biological activity and biogeochemistry of cryoconite aggregates upon an Arctic valley glacier: Longyearbreen, Svalbard, J. Glaciol., 56, 349–362, 2010.
Hoffman, M. J., Fountain, A. G., and Liston, G. E.: Near-surface internal melting: a substantial mass loss on Antarctic Dry Valley glaciers, J. Glaciol., 60, 361–374, https://doi.org/10.3189/2014JoG13J095, 2014.
Holland, A., Williamson, C., Tranter, M., and Anesio, A.: Dissolved nutrient, carbon and algal abundance in the Dark Zone (Greenland Ice Sheet), July-August 2016 (Version 1.0) [Data set], UK Polar Data Centre, Natural Environment Research Council, UK Research & Innovation, https://doi.org/10.5285/d8369a2f-8b50-4711-b492-ae773bfafd95, 2019.
Irvine-Fynn, T., Edwards, A., Newton, S., Langford, H., Rassner, S., Telling, J., Anesio, A., and Hodson, A.: Microbial cell budgets of an A rctic glacier surface quantified using flow cytometry, Environ. Microbiol., 14, 2998–3012, https://doi.org/10.1111/j.1462-2920.2012.02876.x, 2012.
Karlstrom, L., Zok, A., and Manga, M.: Near-surface permeability in a supraglacial drainage basin on the Llewellyn Glacier, Juneau Icefield, British Columbia, The Cryosphere, 8, 537–546, https://doi.org/10.5194/tc-8-537-2014, 2014.
Kohshima, S., Seko, K., and Yoshimura, Y.: Biotic Acceleration of Glacier Melting in Yala Glacier, Langtang Region, Nepal Himalaya, Snow and Glacier Hydrology, 218, 309–316, 1993.
LaChapelle, E.: Errors in ablation measurements from settlement and sub-surface melting, J. Glaciol., 3, 458–467, 1959.
Lutz, S., Anesio, A. M., Edwards, A., and Benning, L. G.: Linking microbial diversity and functionality of arctic glacial surface habitats, Environ. Microbiol., 19, 551–565, https://doi.org/10.1111/1462-2920.13494, 2017.
Müller, F. and Keeler, C. M.: Errors in short-term ablation measurements on melting ice surfaces, J. Glaciol., 8, 91–105, 1969.
Munro, D. S.: Comparison of melt energy computations and ablatometer measurements on melting ice and snow, Arctic Alpine Res., 22, 153–162, 1990.
Musilova, M., Tranter, M., Bamber, J. L., Takeuchi, N., and Anesio, A.: Experimental evidence that microbial activity lowers the albedo of glaciers, Geochemical Perspectives Letters, 2, 106–116, https://doi.org/10.7185/geochemlet.1611, 2016.
Musilova, M., Tranter, M., Wadham, J., Telling, J., Tedstone, A., and Anesio, Alexandre, M.: Microbially driven export of labile organic carbon from the Greenland ice sheet, Nat. Geosci., 10, 360–365, https://doi.org/10.1038/ngeo2920, 2017.
Nicholes, M. J., Williamson, C. J., Tranter, M., Holland, A., Poniecka, E., Yallop, M. L., The Black & Bloom Group, and Anesio, A.: Bacterial Dynamics in Supraglacial Habitats of the Greenland Ice Sheet, 10, 1366, https://doi.org/10.3389/fmicb.2019.01366, 2019.
Niemi, A. and Michel, C.: Temporal and spatial variability in sea-ice carbon: nitrogen ratios on Canadian Arctic shelves, Elem. Sci. Anth., 3, https://doi.org/10.12952/journal.elementa.000078, 2015.
Pereira, S., Zille, A., Micheletti, E., Moradas-Ferreira, P., De Philippis, R., and Tamagnini, P.: Complexity of cyanobacterial exopolysaccharides: composition, structures, inducing factors and putative genes involved in their biosynthesis and assembly, FEMS Microbiol. Rev., 33, 917–941, https://doi.org/10.1111/j.1574-6976.2009.00183.x, 2009.
Raiswell, R., Hawkings, J., Elsenousy, A., Death, R., Tranter, M., and Wadham, J.: Iron in Glacial Systems: Speciation, Reactivity, Freezing Behaviour and Alteration during Transport, Front. Earth Sci., 6, 222, https://doi.org/10.3389/feart.2018.00222, 2018.
Rassner, S. M., Anesio, A. M., Girdwood, S. E., Hell, K., Gokul, J. K., Whitworth, D. E., and Edwards, A.: Can the bacterial community of a high Arctic glacier surface escape viral control?, Front. Microbiol., 7, 956, https://doi.org/10.3389/fmicb.2016.00956, 2016.
Redfield, A., Ketchum, B., and Richards, F.: The influence of organisms on the composition of sea water, in: The sea, edited by: Hill, M. H., Intersci. Publ., Wiley, New York, 554 pp., 1963.
Remias, D., Schwaiger, S., Aigner, S., Leya, T., Stuppner, H., and Lütz, C.: Characterization of an UV-and VIS-absorbing, purpurogallin-derived secondary pigment new to algae and highly abundant in Mesotaenium berggrenii (Zygnematophyceae, Chlorophyta), an extremophyte living on glaciers, FEMS Microbiol. Ecol., 79, 638–648, https://doi.org/10.1111/j.1574-6941.2011.01245.x, 2012.
Rignot, E. and Kanagaratnam, P.: Changes in the velocity structure of the Greenland Ice Sheet, Science, 311, 986–990, https://doi.org/10.1126/science.1121381, 2006.
Rignot, E., Velicogna, I., van den Broeke, M. R., Monaghan, A., and Lenaerts, J. T.: Acceleration of the contribution of the Greenland and Antarctic ice sheets to sea level rise, Geophys. Res. Lett., 38, L05503, https://doi.org/10.1029/2011GL046583, 2011.
Sasgen, I., van den Broeke, M., Bamber, J. L., Rignot, E., Sørensen, L. S., Wouters, B., Martinec, Z., Velicogna, I., and Simonsen, S. B.: Timing and origin of recent regional ice-mass loss in Greenland, Earth Planet. Sc. Lett., 333, 293–303, https://doi.org/10.1016/j.epsl.2012.03.033, 2012.
Shepherd, A., Ivins, E. R., Geruo, A., Barletta, V. R., Bentley, M. J., Bettadpur, S., Briggs, K. H., Bromwich, D. H., Forsberg, R., and Galin, N.: A reconciled estimate of ice-sheet mass balance, Science, 338, 1183–1189, https://doi.org/10.1126/science.1228102, 2012.
Shimada, R., Takeuchi, N., and Aoki, T.: Inter-annual and geographical variations in the extent of bare ice and dark ice on the Greenland Ice Sheet derived from MODIS satellite images, Front. Earth Sci., 4, 43, https://doi.org/10.3389/feart.2016.00043, 2016.
Shrivastava, A. and Gupta, V. B.: Methods for the determination of limit of detection and limit of quantitation of the analytical methods, Chronicles of Young Scientists, 2, 21, https://doi.org/10.4103/2229-5186.79345, 2011.
Solorzano, L.: Determination of Ammonia in Natural Waters by the Phenolhypochlorite Method, Limnol. Oceanogr., 14, 799–801, 1969.
Stibal, M., Tranter, M., Benning, L. G., and Rehak, J.: Microbial primary production on an Arctic glacier is insignificant in comparison with allochthonous organic carbon input, Environ. Microbiol., 10, 2172–2178, https://doi.org/10.1111/j.1462-2920.2008.01620.x, 2008a.
Stibal, M., Tranter, M., Telling, J., and Benning, L. G.: Speciation, phase association and potential bioavailability of phosphorus on a Svalbard glacier, Biogeochemistry, 90, 1–13, https://doi.org/10.1007/s10533-008-9226-3, 2008b.
Stibal, M., Anesio, A. M., Blues, C. J. D., and Tranter, M.: Phosphatase activity and organic phosphorus turnover on a high Arctic glacier, Biogeosciences, 6, 913–922, https://doi.org/10.5194/bg-6-913-2009, 2009.
Stibal, M., Šabacká, M., and Žárský, J.: Biological processes on glacier and ice sheet surfaces, Nat. Geosci., 5, 771–774, https://doi.org/10.1038/ngeo1611, 2012a.
Stibal, M., Telling, J., Cook, J., Mak, K. M., Hodson, A., and Anesio, A. M.: Environmental controls on microbial abundance and activity on the greenland ice sheet: a multivariate analysis approach, Microb. Ecol., 63, 74–84, https://doi.org/10.1007/s00248-011-9935-3, 2012b.
Stroeve, J., Box, J. E., Wang, Z., Schaaf, C., and Barrett, A.: Re-evaluation of MODIS MCD43 Greenland albedo accuracy and trends, Remote Sens. Environ., 138, 199–214, https://doi.org/10.1016/j.rse.2013.07.023, 2013.
Tedstone, A. J., Bamber, J. L., Cook, J. M., Williamson, C. J., Fettweis, X., Hodson, A. J., and Tranter, M.: Dark ice dynamics of the south-west Greenland Ice Sheet, The Cryosphere, 11, 2491–2506, https://doi.org/10.5194/tc-11-2491-2017, 2017.
Tedstone, A. J., Cook, J. M., Williamson, C. J., Hofer, S., McCutcheon, J., Irvine-Fynn, T., Gribbin, T., and Tranter, M.: Algal growth and weathering crust structure drive variability in Greenland Ice Sheet ice albedo, The Cryosphere Discuss., https://doi.org/10.5194/tc-2019-131, in review, 2019.
Telling, J., Anesio, A. M., Tranter, M., Irvine-Fynn, T., Hodson, A., Butler, C., and Wadham, J.: Nitrogen fixation on Arctic glaciers, Svalbard, J. Geophys. Res., 116, G03039, https://doi.org/10.1029/2010jg001632, 2011.
Telling, J., Stibal, M., Anesio, A. M., Tranter, M., Nias, I., Cook, J., Bellas, C., Lis, G., Wadham, J. L., Sole, A., Nienow, P., and Hodson, A.: Microbial nitrogen cycling on the Greenland Ice Sheet, Biogeosciences, 9, 2431–2442, https://doi.org/10.5194/bg-9-2431-2012, 2012.
Telling, J., Anesio, A. M., Tranter, M., Fountain, A. G., Nylen, T., Hawkings, J., Singh, V. B., Kaur, P., Musilova, M., and Wadham, J. L.: Spring thaw ionic pulses boost nutrient availability and microbial growth in entombed Antarctic Dry Valley cryoconite holes, Front. Microbiol., 5, 694, https://doi.org/10.3389/fmicb.2014.00694, 2014.
Wadham, J. L., Hawkings, J., Telling, J., Chandler, D., Alcock, J., O'Donnell, E., Kaur, P., Bagshaw, E., Tranter, M., Tedstone, A., and Nienow, P.: Sources, cycling and export of nitrogen on the Greenland Ice Sheet, Biogeosciences, 13, 6339–6352, https://doi.org/10.5194/bg-13-6339-2016, 2016.
Warren, S. G.: Impurities in snow: Effects on albedo and snowmelt, Ann. Glaciol., 5, 177–179, 1984.
Warren, S. G. and Wiscombe, W. J.: A model for the spectral albedo of snow. II: Snow containing atmospheric aerosols, J. Atmos. Sci., 37, 2734–2745, 1980.
Warren, S. G. and Wiscombe, W. J.: Dirty snow after nuclear war, Nature, 313, 467–470, 1985.
Wientjes, I. G. M. and Oerlemans, J.: An explanation for the dark region in the western melt zone of the Greenland ice sheet, The Cryosphere, 4, 261–268, https://doi.org/10.5194/tc-4-261-2010, 2010.
Wientjes, I. G. M., Van de Wal, R. S. W., Reichart, G. J., Sluijs, A., and Oerlemans, J.: Dust from the dark region in the western ablation zone of the Greenland ice sheet, The Cryosphere, 5, 589–601, https://doi.org/10.5194/tc-5-589-2011, 2011.
Wientjes, I. G. M., Van De Wal, R. S. W., Schwikowski, M., Zapf, A., Fahrni, S., and Wacker, L.: Carbonaceous particles reveal that Late Holocene dust causes the dark region in the western ablation zone of the Greenland ice sheet, J. Glaciol., 58, 787–794, https://doi.org/10.3189/2012JoG11J165, 2012.
Williamson, C. J., Anesio, A. M., Cook, J., Tedstone, A., Poniecka, E., Holland, A., Fagan, D., Tranter, M., and Yallop, M. L.: Ice algal bloom development on the surface of the Greenland Ice Sheet, FEMS Microbiol. Ecol., 94, fiy025, https://doi.org/10.1093/femsec/fiy025, 2018.
Wolff, E. W.: Ice sheets and nitrogen, Philos. T. Roy. Soc. B, 368, 20130127, https://doi.org/10.1098/rstb.2013.0127, 2013.
Yallop, M. L., Anesio, A. M., Perkins, R. G., Cook, J., Telling, J., Fagan, D., MacFarlane, J., Stibal, M., Barker, G., Bellas, C., Hodson, A., Tranter, M., Wadham, J., and Roberts, N. W.: Photophysiology and albedo-changing potential of the ice algal community on the surface of the Greenland ice sheet, ISME J., 6, 2302–2313, https://doi.org/10.1038/ismej.2012.107, 2012.