the Creative Commons Attribution 4.0 License.
the Creative Commons Attribution 4.0 License.
 | 15 May 2020
Large-scale biospheric drought response intensifies linearly with drought duration in arid regions
Georgia Destouni
Martin Jung
Markus Reichstein
Soil moisture droughts have comprehensive implications for terrestrial ecosystems. Here we study time-accumulated impacts of the strongest observed droughts on vegetation. The results show that drought duration, the time during which surface soil moisture is below seasonal average, is a key diagnostic variable for predicting drought-integrated changes in (i) gross primary productivity, (ii) evapotranspiration, (iii) vegetation greenness, and (iv) crop yields. Drought-integrated anomalies in these vegetation-related variables scale linearly with drought duration with a slope depending on climate. In arid regions, the slope is steep such that vegetation drought response intensifies with drought duration, whereas in humid regions, it is small such that drought impacts on vegetation are weak even for long droughts. These emergent large-scale linearities are not well captured by state-of-the-art hydrological, land surface, and vegetation models. Overall, the linear relationship of drought duration versus vegetation response and crop yield reductions can serve as a model benchmark and support drought impact interpretation and prediction.
- Article
(2709 KB) - Full-text XML
-
Supplement
(1877 KB) - BibTeX
- EndNote


Drought has complex and potentially severe impacts on the terrestrial biosphere (Seneviratne et al., 2012a; Ciais et al., 2005; Reichstein et al., 2013; Schwalm et al., 2017). In particular, it affects the vegetation and can thereby reduce or even reverse carbon uptake from the atmosphere (Ciais et al., 2005), increase (heat wave) temperatures through reduced evaporative cooling (Seneviratne et al., 2010), increase wildfire activity (Gudmundsson et al., 2014), and reduce food production (Rosenzweig et al., 2001). These multifaceted drought effects on vegetation are relevant for the economy and society, as well as for natural ecosystems. However, these effects are complex (Reichstein et al., 2013; Knapp et al., 2015; Bartlett et al., 2016), with the drought response of plants (partly) non-linearly depending on various factors. These comprise vegetation characteristics, such as root depth, leaf area, and plant physiology; soil characteristics, such as water holding capacity; and hydrological and terrain characteristics, which in turn affect groundwater level and thereby also soil moisture conditions above (Destouni and Verrot, 2014; Verrot and Destouni, 2016). Moreover, drought history can also play a role through legacy effects (Seneviratne et al., 2012a). The interplay of these factors in determining vegetation responses to drought is not yet well understood, in particular over large spatial scales and with respect to different and changing climate conditions. As of recently, modern Earth observation through satellites and ground station networks in combination with radiative transfer modelling and/or upscaling approaches provides unprecedented large-scale datasets. Using such datasets, it has become possible to identify dominant connections between key observed variables during droughts, such as a strong and fast relationship between soil moisture and runoff deficits, emerging at large scales across hydrological catchments and climate zones of Europe (Orth and Destouni, 2018). Following and expanding this investigation pathway, the present study compiles and analyses worldwide data, revealing simple and useful relationship(s) that integrate the complex large-scale vegetation response to droughts of different magnitude.
Drought in this study is determined through surface soil moisture deficits, a simple and widely used drought indicator that is directly related to vegetation-accessible water availability (Seneviratne et al., 2012a). For this purpose we use ESA CCI soil moisture data (Gruber et al., 2017, 2019; Dorigo et al., 2017). Further, in order to characterize the meteorological drought forcing, we employ precipitation from ERA-Interim (Dee et al., 2012) and net radiation data from the SRB and CERES datasets. Moreover, to infer the vegetation drought response, we consider data for gross primary productivity (GPP), evapotranspiration (ET) from the FLUXCOM-RS dataset (Jung et al., 2019), and normalized differential vegetation index data (NDVI) from the GIMMS3g dataset (Zhu et al., 2013). All employed datasets are derived from observations and provide global coverage (see Table 1 for an overview, and the Supplement for further details). We employ satellite-derived datasets where available, namely for surface soil moisture, net radiation, and NDVI. For robust drought-effect assessment, these are complemented by precipitation, GPP, and ET datasets, obtained from upscaled/interpolated site observations.
In addition to observational data, we use state-of-the-art modelled datasets. In particular, we consider (surface) soil moisture and ET from the GLEAM dataset (Martens et al., 2017) and from six models from the Earth2Observe model ensemble (version 1, (Schellekens et al., 2017); see also Supplement), which provide these two required variables. GLEAM is a land surface model that assimilates observations of soil moisture, vegetation optical depth, and snow water equivalent. The Earth2Observe ensemble includes ordinary land surface models as well as hydrological models. These models provide estimates of surface soil moisture, typically representing the top 2–10 cm (exact values are model-dependent (Schellekens et al., 2017)), and can as such be compared with the satellite-derived product. In addition, the models provide total column soil moisture (typically representing 1–5 m; exact depths are model-dependent), which is used to assess the impact of considered soil moisture depth on our results. Besides these models, we further consider an ensemble of land surface and vegetation models from the TRENDY project (version 3, (Le Quéré et al., 2015; Sitch et al., 2015); see also Supplement). These models provide ET and total column soil moisture. All model simulations considered here are uncoupled and forced with observation-based gridded meteorological data.
Constrained by concurrent availability of different required data streams, we consider the time period 2001–2015, half-degree spatial resolution, and half-monthly temporal resolution of the data for the observation-based analyses (see Supplement). While we use the same temporal and spatial resolution for the model-based analyses, the time period considered in this context is slightly shifted, 1998–2012. This is because the Earth2Observe simulations only extend until 2012. All time series are de-trended prior to further analyses, with trends determined using a 3-year moving average window. To study the biospheric drought response, we focus on droughts that peak during the local growing season. This is determined for each location (half-degree grid cell) as the 5 consecutive months with the highest multi-year average NDVI, or ET in the case of the model-based analyses.
We consider for each grid cell the strongest drought in terms of surface soil moisture within the study period 2001–2015. This drought is identified in three steps: (i) we compute soil moisture anomalies by removing the mean seasonal cycle from the actual time series, (ii) we determine the driest anomaly in each year's growing season, and (iii) we select the drought with the greatest dry anomaly out of the total 15 peak anomalies over the whole time period. The duration of each drought is then the period before and after drought peak, during which the soil moisture anomalies are negative, i.e. when soil moisture is drier than the seasonal mean. Note that our drought definition therefore does not include an indication for vegetation water stress; furthermore, rain events may occur during diagnosed drought periods.
Anomalies are also computed for the other investigated variables, in the same way as for soil moisture. To enable direct comparison of anomalies across variables, and across observations and models, we compute z scores. This is done by standardizing all anomaly values by dividing them with a characteristic variability value. This value is computed for each variable and each grid cell as the standard deviation across all half-monthly growing season values. This way, all anomalies discussed and illustrated in this study are scaled by inter-annual standard deviations to be expressed as z scores.
Whenever vegetation-related anomalies are integrated over the course of particular droughts, the integration is performed across a time window of 8 months. It starts 3 months before the half-monthly period denoting drought peak and finishes 4.5 months after the peak period. Not using the specific actual duration of each drought for the integrations ensures spurious correlations between drought duration and the drought-integrated vegetation response are avoided. Also for this purpose, the above-described standardization is performed after the time integration.
Finally, to characterize the climate, and to measure the relative roles of water versus energy limitation for the water use by the vegetation, we compute an aridity index (Fig. S1 in the Supplement). This index was originally introduced as the ratio between mean potential evapotranspiration over the study period and the respective mean precipitation, with the latter scaled by the latent heat of vaporization to yield a unitless index value (Budyko et al., 1974). We use an adapted form where we replace the potential evapotranspiration with satellite-derived net radiation.
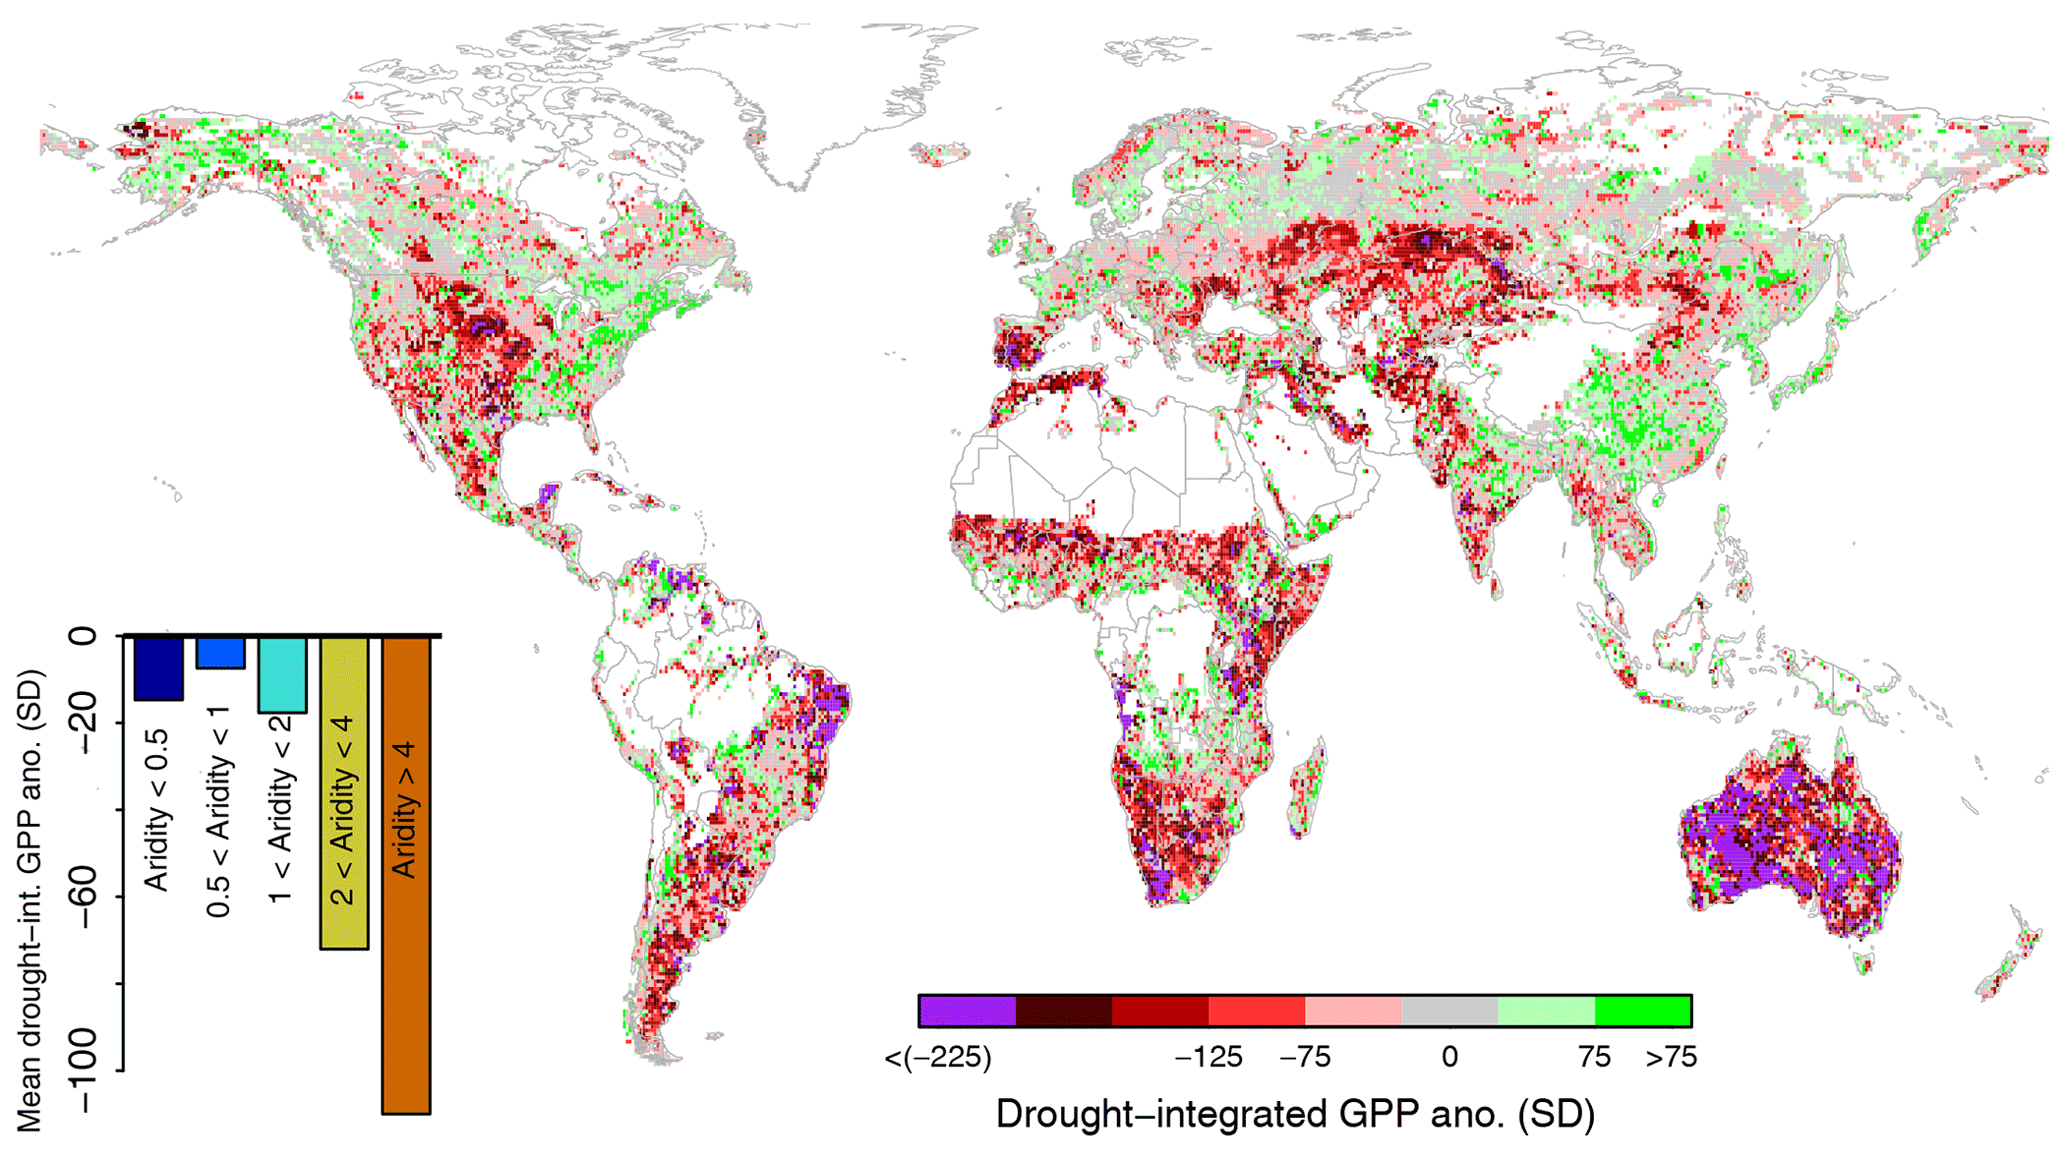
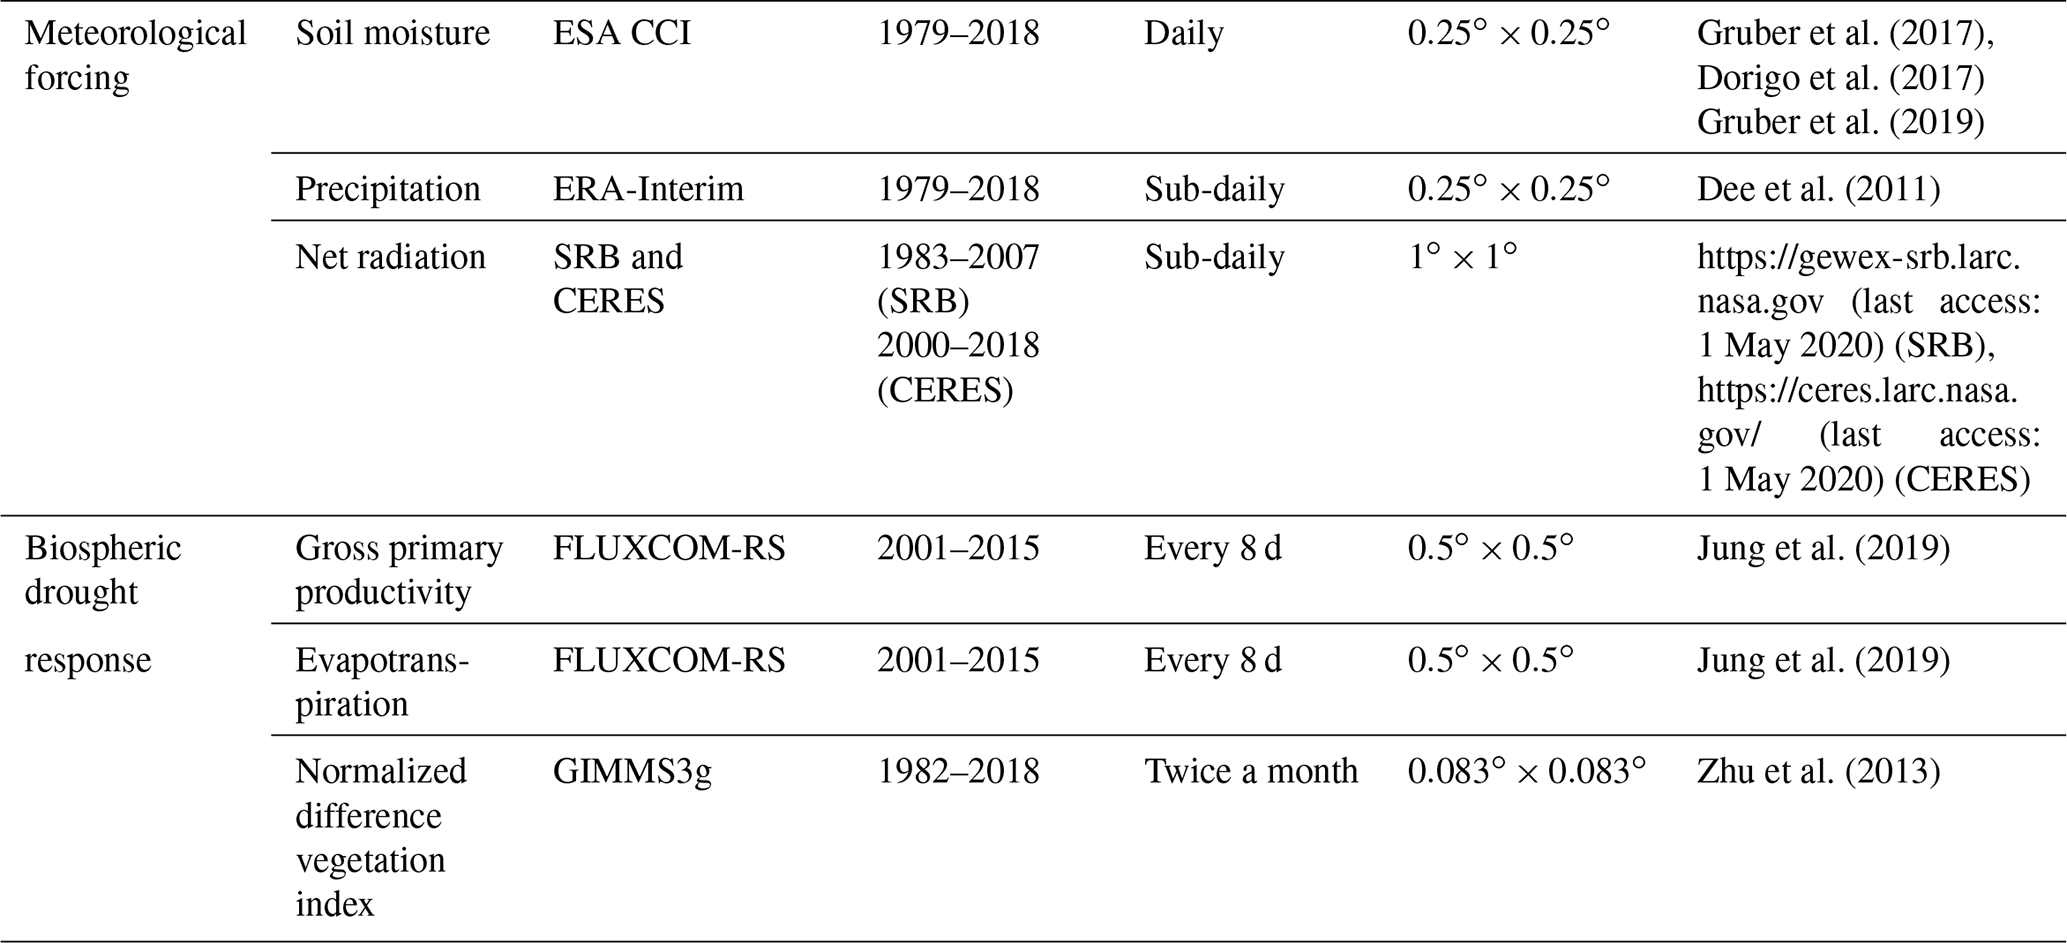
Figure 1GPP anomalies integrated over 8 months during the strongest soil moisture drought observed during the study period 2001–2015, expressed as accumulated z scores. The bar plot denotes mean anomalies across aridity regions. Regions shown in white have too little soil moisture and/or vegetation data to obtain meaningful results (less than 8 years of at least 50 % growing season data availability).
3.1 Global vegetation drought response
The global GPP response to the respective strongest grid-cell drought during the study period 2001–2015 is displayed in Fig. 1. The strongest negative anomalies are found across central North America, eastern South America, southern Africa, and Australia. Note that these are normalized anomalies; especially in very dry regions with low inter-annual vegetation variability, such as inner Australia, the actual absolute anomalies are comparatively low. In contrast, we find positive GPP anomalies across eastern China, northern Europe, central Russia, and eastern North America, even though the magnitude is overall smaller compared with the aforementioned negative anomalies. In these regions, GPP anomalies are mostly insensitive to soil moisture drought but are induced by covariations in dry soil moisture with other, in this case more relevant, GPP-limiting factors such as radiation and temperature (Zhang et al., 2017). Averaging the results across grid cells with similar aridity reveals a strong dependency of the vegetation drought response on climate. This is the first main result of our study; whereas anomalies are small in energy-limited conditions (aridity index <1, i.e. more precipitation than (equivalent) net radiation), they increase markedly for increasingly water-limited conditions (aridity index >1).
This aridity finding is consistent with results in (Walther et al., 2019) and is mechanistically explainable by more water being available as deeper soil water and groundwater in wetter regions. Further, this greater water amount is also (more) accessible to the vegetation because the fraction of tree cover is higher in wetter regions, implying deeper rooting systems. Accessing these water reservoirs can help vegetation to bridge surface soil drought conditions, while also benefitting from a surplus in net radiation which is often associated with less precipitation (Teuling et al., 2013). Similar results as for GPP are also obtained for ET and NDVI (see Figs. S2 and S3), illustrating the robustness of these findings.
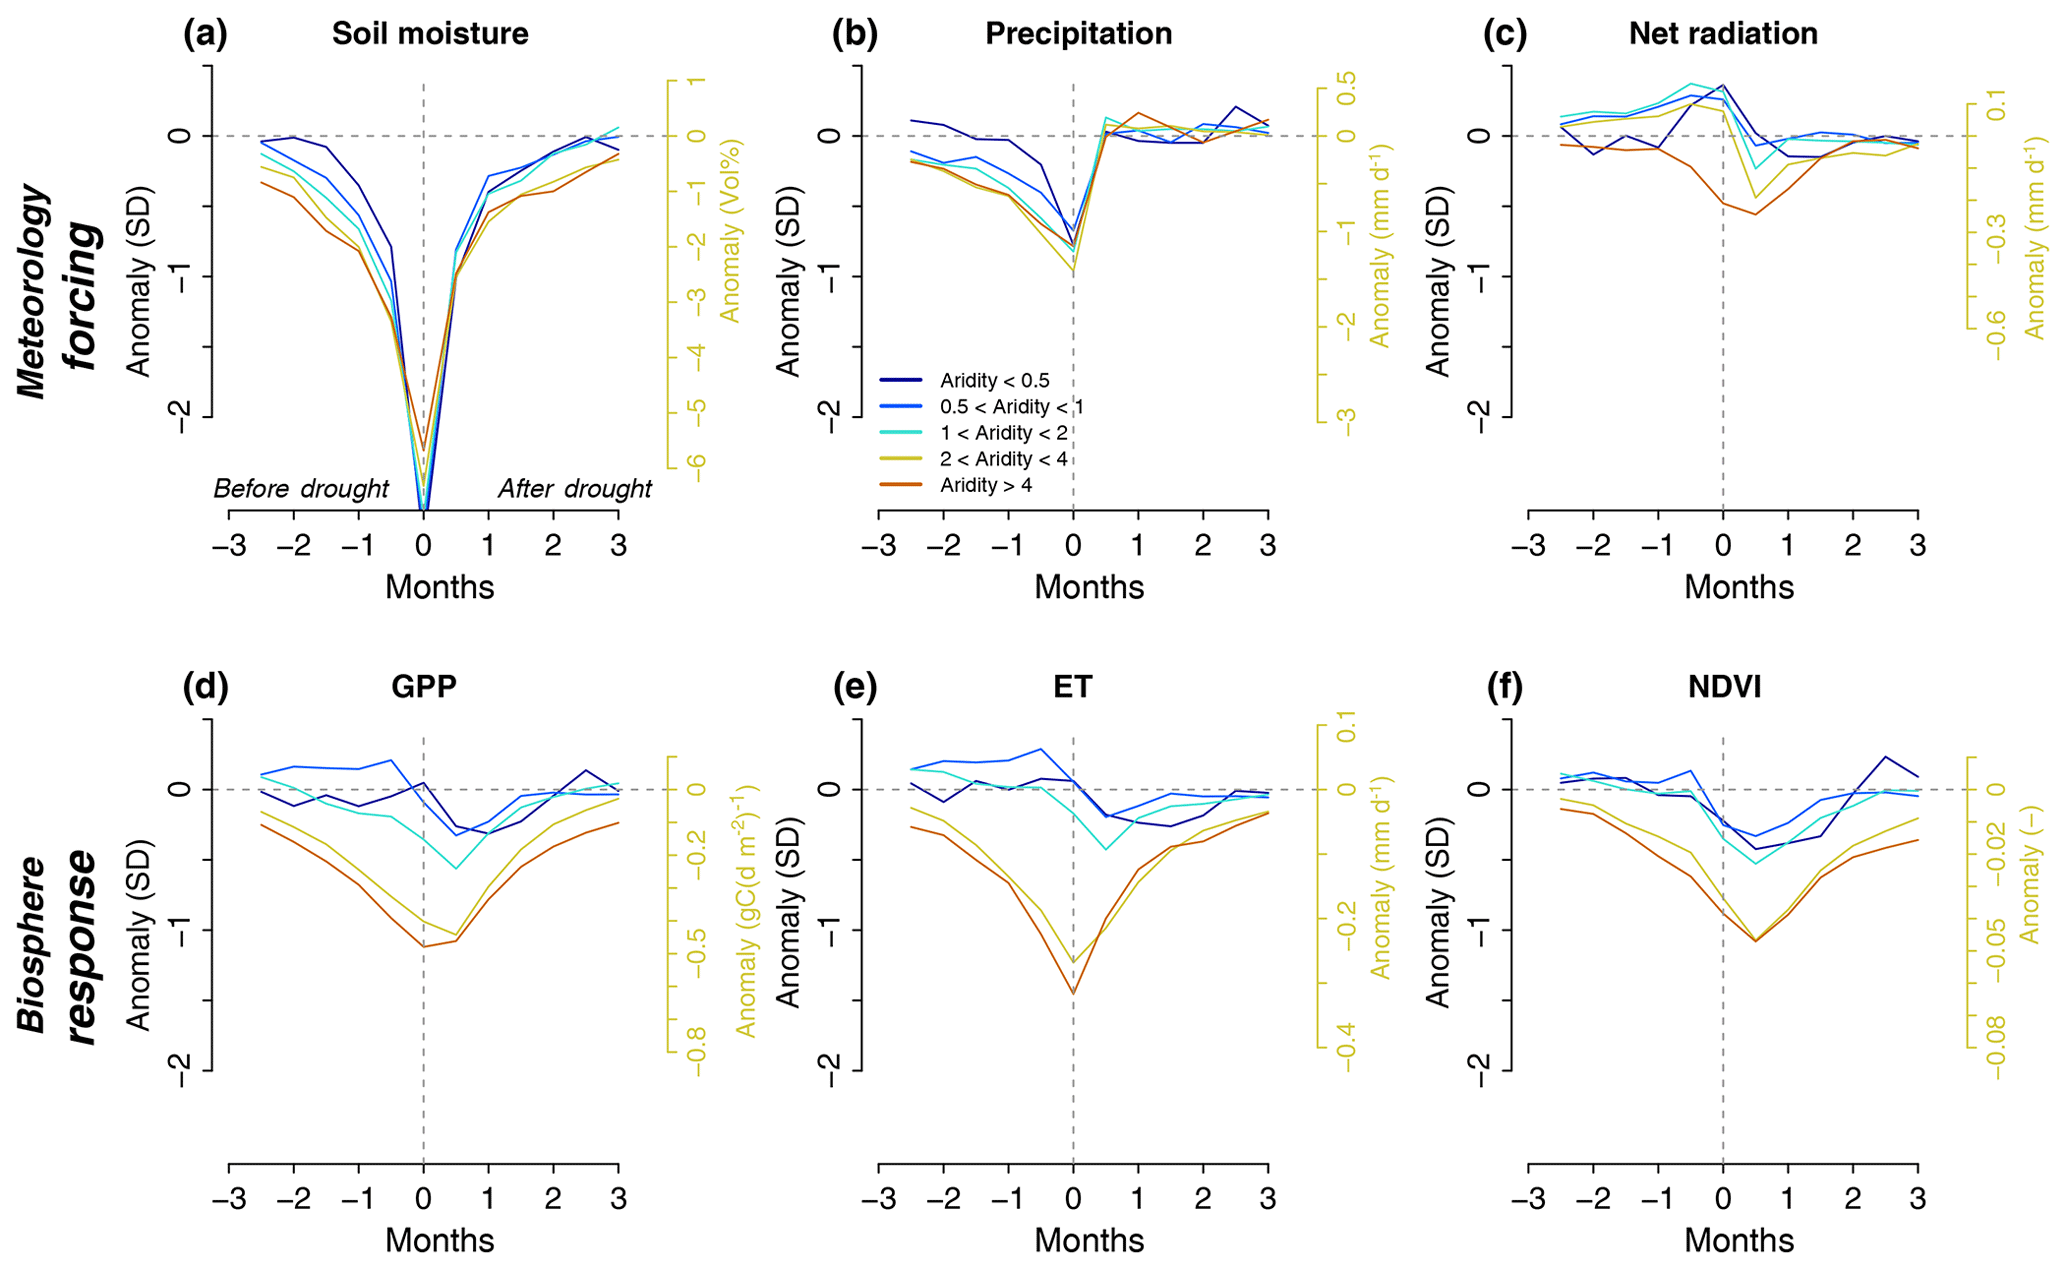
Figure 2Aridity-specific time evolution of meteorological forcing (a–c) and biospheric response (d–e) during drought. Evolution for each variable computed as a composite across all grid cells of the respective aridity regions. To ensure comparability of anomalies across variables, values are normalized by and expressed as the inter-annual standard deviation of each variable (z scores, left axes). Normalization is performed by dividing the actual anomalies (right axes, example for aridity values between 2 and 4) through the typical aridity-specific variability as expressed by the inter-annual standard deviation across all absolute, half-monthly growing season anomalies averaged across all grid cells of each aridity region.
3.2 Time evolution of drought and biospheric response
The evolution of drought across climate regions is analysed by averaging data for each investigated variable across grid cells with similar aridity. The results of this composite approach (Nicolai-Shaw et al., 2017) are displayed in Fig. 2 for all meteorological forcing and biospheric response variables. The precipitation deficits during drought buildup are commonly accompanied by a net radiation surplus. They jointly lead to soil moisture deficits. The comparatively large soil moisture anomalies result from our drought definition based on the driest soil moisture anomalies. Only in the driest considered climate is no net radiation surplus found. This might have to do with drought-induced albedo changes, which enhance the outgoing radiation. Interestingly, the peak vegetation responses are delayed and occur after drought peak. This is consistent with site- and/or time-specific findings in earlier studies, analysing particular drought events (Nicolai-Shaw et al., 2017; Wolf et al., 2016). Aside from plant-physiological reasons, this can be explained by the pre-peak radiation surplus which tends to enhance vegetation functioning. By contrast, in the post-peak period, with both soil water deficit and radiation deficit, the vegetation functioning is decreased. The radiation deficit follows from the recovery precipitation and the associated clouds that occur by definition after drought peak.
While the drought forcing shown in Fig. 2a–c is comparable in regions with similar aridity, the vegetation drought response changes strongly as aridity exceeds 2. This non-linear response is consistent with findings in Fig. 1. Finally, the GPP and NDVI signals are similar, illustrating robustness in observed vegetation response to drought across these different vegetation-related variables and associated data products.
Figure 3Drought duration controls integrated biospheric drought response across global aridity regions. Lines obtained through averaging within a 1-month moving window, i.e. GPP anomaly at 4 months of drought duration is inferred with data between 3.5 and 4.5 months of drought duration. GPP anomalies are expressed as accumulated z scores. Lines are computed if more than 50 values are available within the moving window. Shadows denote the interquartile range determined within moving window.
3.3 Drought duration shaping the biospheric drought response
In Fig. 3 we analyse the role of drought duration (i.e. the time period with below-normal soil moisture). Drought duration has no systematic influence on the vegetation drought response in wet areas (aridity index <1), where GPP anomalies are comparatively small anyway. By contrast, the emerging linearity between the drought-integrated GPP anomalies and the mean drought duration with increasing slope towards drier conditions is another main result of this study. The slope does not increase further between dry and very dry regions (aridity index >4) as already the shortest droughts lead to negative impacts due to limited (ground)water availability. The relatively large interquartile range underlying the relationships shown in Fig. 3 is likely due to the considerable aridity condition variety within each considered aridity class that spans across a factor of 2. The range also illustrates that other processes and conditions than just aridity and drought duration contribute to the vegetation drought responses locally. These results are not sensitive to the chosen drought definition; using the longest growing season drought duration instead of the strongest half-monthly soil moisture anomaly to determine the strongest drought at each grid cell, we obtain similar linearity relationships (Fig. S4). Further, as the choice of an 8-month time period for integrating the vegetation drought response is necessarily arbitrary, we repeat the analysis from Fig. 3 with an integration period of 6 months and find very similar results (Fig. S5).
Overall, these findings indicate that in addition to a region's mean aridity, drought duration is a key diagnostic variable for characterizing the large-scale vegetation drought response and consequently also for inferring drought impact on the land–atmosphere exchanges of carbon and water. While the relevance of drought duration has been recognized in previous studies (von Buttlar et al., 2018; Frank et al., 2015), the simple linear relationships identified here are an essential new step for straightforward representation and advancement in understanding of drought impacts on vegetation, e.g. comparatively between different historic time periods (Charpentier Ljungqvist et al., 2019), and associated ecosystem functioning and land–atmosphere exchanges. Drought duration as a main diagnostic variable integrates different interacting factors in vegetation functioning during drought. These include higher (lower) general and initial-drought soil moisture levels in a wetter (drier) climate, in which shorter (longer) droughts can develop, while water stresses are also smaller (greater) and induce less (more) severe drought effects on vegetation.
The emergent linearity between vegetation response and drought duration is not trivial, given the complex interacting processes contributing to biospheric drought responses (Seneviratne et al., 2012b; Reichstein et al., 2013). This complexity is, for example, illustrated by the delayed peak in the vegetation drought response in Fig. 2d–e. Further research is needed to better understand why and how such simple large-scale relationships can capture the interplay of various small(er)-scale processes.
Figure S6 compares the explanatory power of drought duration to infer the large-scale GPP response to drought with that of several alternative controls. It is computed by (i) obtaining the drought-related GPP anomaly accumulated over an 8-month time window containing the drought period (see Methods) and the respective drought metric values for each grid cell and its respective strongest drought and (ii) calculating the correlation between the drought-related GPP anomalies and the respective drought metric values across all grid cells of each aridity class. The results confirm the role of drought duration as a simple and efficient prediction measure for biospheric drought impacts in semi-humid to arid regions (aridity index >1), for which significant slopes are found (Fig. 3). Other common drought description metrics fail to achieve similar explanatory power in these climate regions, including the number of consecutive dry days, which was proposed as a preferred drought index (in addition to the soil moisture anomalies used to derive drought duration in this study) by the IPCC special report on extremes (Seneviratne et al., 2012b). Only the number of dry days (within the soil-moisture-diagnosed drought duration) yields slightly higher correlations as in the case of drought duration, which results from the additional precipitation-based information contained in the number of dry days.

Figure 4Drought duration control on biospheric drought response in observations and models. Response of drought-integrated biospheric anomalies across observation-based reference data (ET, NDVI, and GPP as displayed in Fig. 3), as well as for modelled ET (GLEAM and Earth2Observe models).
3.4 Modelled versus observed vegetation drought response
While the large-scale vegetation response to drought duration was analysed with GPP data in the previous sections, in Fig. 4 we additionally consider ET and NDVI as alternative observation-based variables, which also indicate the functioning of the vegetation. Overall, similar relationships are found for the three variables; this highlights the significance of the emerging linear pattern in summarizing various influences contributing to the biospheric drought response. However, in a semi-humid climate (0.5 < aridity index < 2) the ET drought response differs somewhat from the NDVI and GPP responses, possibly due to changes in water use efficiency. Further, the NDVI drought response is slightly less pronounced than that of GPP and ET in very dry regions (aridity index > 4).
In a further step, we evaluate the vegetation drought response from several state-of-the-art hydrological and land surface models in relation to the observation-based results. Note that a different time period is used in the model-based analyses, 1998–2012 instead of 2001–2015. While we cannot exclude an impact of this period shift on our conclusions, we can assume that it is minimal as the observational and modelled time periods are of the same length, and they largely overlap.
In particular, we compare the state-of-the-art GLEAM model dataset with simulation results from the Earth2Observe model comparison project (see Sect. 2). In general, the modelled ET responses to drought are overestimated in wet climate and underestimated in dry climate compared with the observation-based relationships. This result implies relatively low sensitivity to climate in the modelled vegetation drought response. The sensitivity is slightly higher for GLEAM than for the Earth2Observe models, leading to generally better GLEAM agreement with the observation-based relationships. Interestingly, the models capture the observed linearity in the vegetation drought response only for short-to-medium drought durations. As such, in a dry climate they fail to capture the further intensification of the ET drought response towards droughts longer than 6 months. The individual model results are broadly similar (see Table S1 in the Supplement), with a spread comparable to the interquartile range of the observation-based ET relationship.
In order to test the role of surface versus total-column soil moisture, we also recompute Fig. 4 with root-zone (GLEAM) and total-column soil moisture (Earth2Observe models). The results in Fig. S7 (see Table S2 for individual model results) show a slightly weaker ET response to deeper soil moisture drought than to surface soil moisture drought. Overall, there is remarkable similarity across the drought response relationships for both soil moisture depths, indicating relatively small soil moisture depth impact on our results. This finding suggests that, while plant water availability is actually determined by deep(er) soil moisture, surface soil moisture is a reasonable proxy for meaningful estimation of the drought duration–vegetation response relationships studied here. In addition to the models used above, we also consider TRENDY models that only provide total soil moisture (see Sect. 2). The results found for these models confirm the results of the Earth2Observe models; the TRENDY models generally do not capture the differences in the drought response relationships for different climates. Also, the spread across the drought response patterns of the TRENDY models is comparable to that of the Earth2Observe models.
Overall, the difficulties of models to capture the linearity between vegetation drought response and drought duration emerging from observations likely arise from the complex interplay of several small-scale processes leading to the large-scale relationships. Further model development efforts are required to improve simulated drought responses; the emergent linear relationships identified in this study can serve as a straightforward guideline and constraint in this context.
3.5 Drought duration and food production
The global vegetation drought responses emerging in the previous sections for GPP, ET, and NDVI should also be reflected in crop yields, with high social relevance. As crop yield data with consistent format and quality are only available across Europe, we correspondingly focus in the crop yield analysis in this section on Europe. Specifically, we analyse agricultural yield anomalies averaged across five common crops (see Supplement), in the strongest drought year for various European countries. In the grid-cell analyses above, the year of the strongest drought has been determined at each grid cell through the strongest half-monthly soil moisture anomaly. While the strongest droughts therefore might occur in different years across the grid cells of a country, we select the year in which most of the strongest grid-cell droughts occur as the country-based drought year (see Supplement, (Friedl et al., 2010)). The drought duration in this country-based drought year is then determined as the mean across all grid-cell-based drought durations, weighted by the fraction of agricultural area in each grid cell (Friedl et al., 2010).
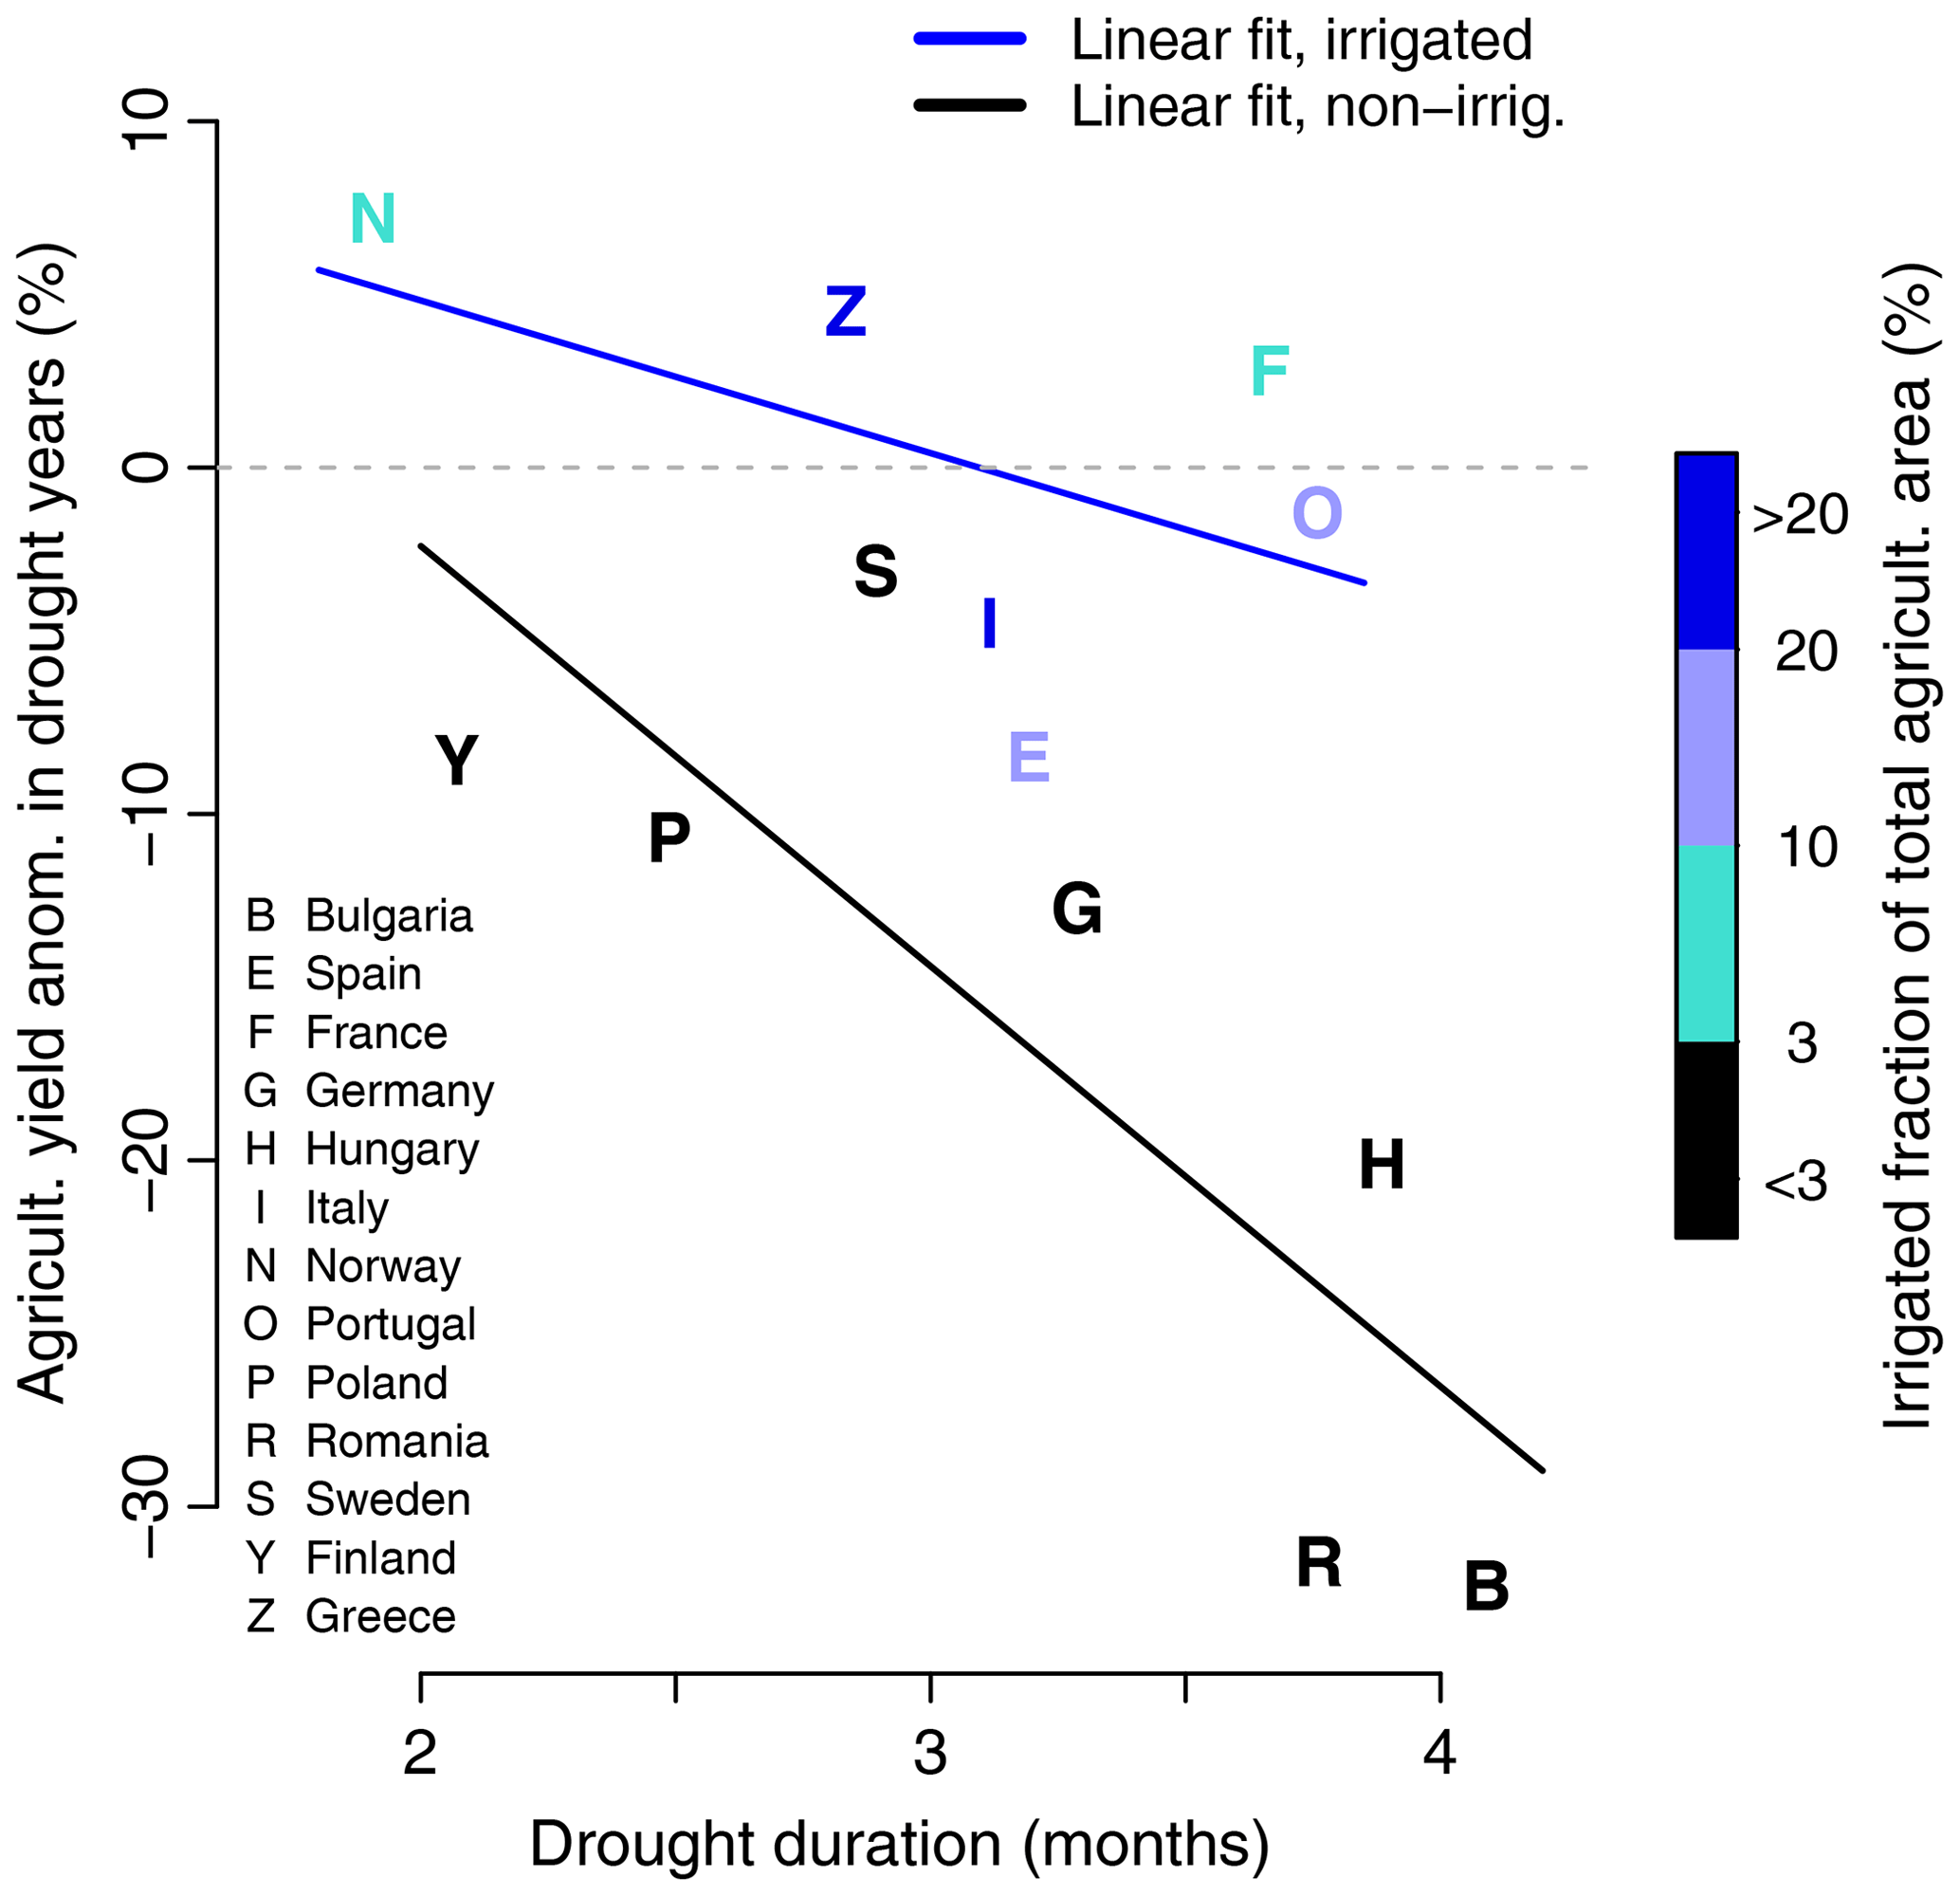
Figure 5Drought duration further controls drought-induced yearly agricultural yield anomalies across various European countries. Different line slopes are found for countries where irrigation is applied in agriculture (light blue least-squares fit) than for countries without large-scale agricultural irrigation (grey least-squares fit).
As shown in Fig. 5, we find that, in addition to the drought-integrated GPP and NDVI anomalies, the agricultural yield anomalies in drought years are also linearly related to drought duration. Short droughts can even be beneficial for food production, due to the associated net radiation surplus. Significantly different linear regression slopes (t test, 5 % level) are found for countries with and without large-scale irrigation. Countries without irrigation exhibit a steeper line slope and a higher explained fraction of variance (0.65 versus 0.25) than countries with irrigation, where the added irrigation water tends to mitigate drought impacts, as reflected by the associated less steep line slope. These differences are well in line with the contrast seen between arid and humid regions in Figs. 3 and 4. Overall, these results highlight the important socio-economic relevance of drought duration as a key diagnostic variable for predicting vegetation drought response and associated crop yield anomalies.
The identified large-scale, aridity-dependent linearity in biosphere responses to drought has important practical implications, especially as it is found globally and robustly across different ecosystem-response variables. Drought duration as a key diagnostic variable in this context is (i) straightforward to measure and monitor and (ii) efficient for representation and comparative understanding of observed/interpreted vegetation responses to droughts (Charpentier Ljungqvist et al., 2019), as well as for anticipation and planning for adaptation to impacts on agricultural crop yields of possible/projected forthcoming drought years. This diagnostic also enables us to infer associated implications for water and carbon cycling and consequently also for atmospheric feedbacks. Such knowledge can complement existing drought monitors (http://droughtmonitor.unl.edu, last access: 2 August 2018) and support efficient irrigation efforts (McCready et al., 2009). Moreover, the identified linear relationships can serve as constraints that inform future model developments; such observation-based references are required to improve modelled vegetation responses to drought, which are currently largely insufficient. These model improvements can in turn also contribute to improve weather forecasting through a more accurate representation of (drought-related) water and carbon fluxes on land (Orth et al., 2015).
Caveats of our analysis include, firstly, that observation-based global soil moisture is only available for the surface soil, as microwave remote sensing only penetrates into the upper few centimetres of the soil. In fact, the vegetation drought response rather depends on the root-zone soil moisture, where the depth and extent of the root zone is also species-dependent. Nevertheless, our conclusions are still valid due to the close soil hydraulics links between soil moisture at the surface and in deeper soil. At daily timescales, surface soil moisture has been reported to reflect the moisture dynamics across the top 10–20 cm (Akbar et al., 2018), and this depth is likely even greater at the monthly-seasonal timescales considered in this study, thereby capturing (at least part of) the actual root zones of many plant species. Moreover, we have tested the impact of using surface versus total-column soil moisture in our model analyses, finding only minor differences in the results (Figs. 4 and S7). Secondly, due to limited observation data availability, we could, in this study, only consider the strongest drought over 15 years. Hence the investigated droughts represent relatively weak extreme events, and it remains unclear if and how this affects the (strength) of the emergent linear relationships found in our study. Nevertheless, in some grid cells, droughts with return periods clearly exceeding 15 years occurred during the study period, for example in 2003 and 2015 in Europe (Laaha et al., 2017; Orth et al., 2016). While we may have only captured a few very extreme droughts, future research is needed to revisit our analysis with longer observational records capturing more extreme droughts. Thirdly, when analysing the link between the vegetation drought response and drought duration, it is inevitable that both variables are assessed over (partly) overlapping time periods. To avoid introducing a spurious relationship in this context, we use, in this study, a constant time window for the integration of the vegetation drought response (8 months, and comparatively also 6 months), independent of the actual diagnosed drought duration. Further, the results obtained for the independent country-wise anomalies of yearly crop yield confirm the linearity resulting from the grid-cell-based analyses using the 8-month (or 6-month) window.
Finally, while we have found aridity and drought duration to be main controls of the vegetation drought response at large spatial scales (climate regions), this is not necessarily the case at smaller scales. In fact, the spread around the moving average relationships shown in Figs. 3 and 4 suggests more drivers at play. These may include vegetation types, soil characteristics, and/or legacy effects. These drivers can intensify or dampen the local vegetation drought response compared with the large-scale response induced by the identified large-scale controls.
Overall, our results highlight an important role of climate (aridity) in shaping the large-scale biospheric drought response, in addition to the drought duration. While droughts in energy-limited regions (aridity index <1) usually have no or even beneficial impacts, droughts in water-limited regions (aridity index <1) have major implications. These contrasting drought impacts imply a critical need for future climate projections to accurately capture regions where the climate can be expected to change from transitional (aridity index ≈1) to water-limited (aridity index >11) conditions. In such regions, the vegetation drought response will likely become much more pronounced, assuming that the relationships identified here also hold for increased future CO2 levels.
All data used in this study are freely accessible, and our code is available on request.
The supplement related to this article is available online at: https://doi.org/10.5194/bg-17-2647-2020-supplement.
RO performed the analyses for the figures. All authors conceived the study and analyses and contributed to the writing.
The authors declare that they have no conflict of interest.
We acknowledge the E-OBS dataset from the EU-FP6 project ENSEMBLES (https://www.ecmwf.int/en/research/projects/ensembles, last access: 1 May 2020) and the data providers in the ECA&D project (http://www.ecad.eu, last access: 1 May 2020), the NASA/GEWEX SRB project (http://gewex-srb.larc.nasa.gov/ last access: 1 May 2020), and the NASA CERES experiment (http://ceres.larc.nasa.gov/index.php, last access: 1 May 2020) for sharing radiation data and the European Space Agencies' Climate Change Initiative for sharing surface soil moisture data (http://www.esa-soilmoisture-cci.org, last access: 1 May 2020). Moreover, we acknowledge all modelling teams contributing simulations to the Earth2Observe and TRENDY projects. Further, we thank Ulrich Weber and Sujan Koirala for help with the model data handling and the two anonymous reviewers for helpful comments to clarify and improve the manuscript.
This research has been supported by the German Research Foundation (DFG) (grant no. 391059971) and the Swedish Research Council Formas (grant no. 2016-02045).
The article processing charges for this open-access
publication were covered by the Max Planck Society.
This paper was edited by Eyal Rotenberg and reviewed by two anonymous referees.
Akbar, R., Gianotti, D. S., McColl, K. A., Haghighi, E., Salvucci, G. D., and Entekhabi, D.: Hydrological Storage Length Scales Represented by Remote Sensing Estimates of Soil Moisture and Precipitation, Water Resour. Res., 54, 1476–1492, 2018.
Bartlett, M. K., Klein, T., Jansen, S., Choat, B., and Sack, L.: The correlations and sequence of plant stomatal, hydraulic, and wilting responses to drought, P. Natl. Acad. Sci. USA, 113, 13098–13103, 2016.
Budyko, M. I.: Climate and Life, Academic Press, 507 pp., 1974.
von Buttlar, J., Zscheischler, J., Rammig, A., Sippel, S., Reichstein, M., Knohl, A., Jung, M., Menzer, O., Arain, M. A., Buchmann, N., Cescatti, A., Gianelle, D., Kiely, G., Law, B. E., Magliulo, V., Margolis, H., McCaughey, H., Merbold, L., Migliavacca, M., Montagnani, L., Oechel, W., Pavelka, M., Peichl, M., Rambal, S., Raschi, A., Scott, R. L., Vaccari, F. P., van Gorsel, E., Varlagin, A., Wohlfahrt, G., and Mahecha, M. D.: Impacts of droughts and extreme-temperature events on gross primary production and ecosystem respiration: a systematic assessment across ecosystems and climate zones, Biogeosciences, 15, 1293–1318, https://doi.org/10.5194/bg-15-1293-2018, 2018.
Charpentier Ljungqvist, F., Seim, A., Krusic, P. J., González-Rouco, J. F., Werner, J. P., Cook, E. R., Zorita, E., Luterbacher, J., Xoplaki, E., Destouni, G., García-Bustamante, E., Melo Aguilar, C. A., Seftigen, K., Wang, J., Gagen, M. H., Esper, J., Solomina, O., Fleitmann, D., and Büntgen, U.: European warm-season temperature and hydroclimate since 850 CE, Environ. Res. Lett., 14, 084015, https://doi.org/10.1088/1748-9326/ab2c7e, 2019.
Ciais, P., Reichstein, M., Viovy, N., Granier, A., Ogee, J. ,Allard, V., Aubinet, M., Buchmann, N., Bernhofer, C., Carrara, A., Chevallier, F., De Noblet, N., Friend, A. D., Friedlingstein, P., Gruenwald, T., Heinesch, B., Keronen, P., Knohl, A., Krinner, G., Loustau, D., Manca, G., Matteucci, G., Miglietta, F., Ourcival, J. M., Papale, D., Pilegaard, K., Rambal, S., Seufert, G., Soussana, J. F., Sanz, M. J., Schulze, E. D., Vesala, T., and Valentini, R.: Europe-wide reduction in primary productivity caused by the heat and drought in 2003, Nature, 437, 529–533, 2005.
Dee, D. P., Uppala, S. M., Simmons, A. J., Berrisford, P., Poli, P., Kobayashi, S., Andrae, U., Balmaseda, M. A., Balsamo, G., Bauer, P., Bechtold, P., Beljaars, A. C. M., van de Berg, L., Bidlot, J., Bormann, N., Delsol, C., Dragani, R., Fuentes, M., Geer, A. J., Haimberger, L., Healy, S. B., Hersbach, H., Hólm, E. V., Isaksen, L., Kållberg, P., Koöhler, M., Matricardi, M., McNally, A. P., Monge-Sanz, B. M., Morcrette, J.-J., Park, B.-K., Peubey, C., de Rosnay, P., Tavolato, C., Thépaut, J.-N., and Vitart, F.: The ERA-Interim reanalysis: configuration and performance of the data assimilation system, Q. J. Roy. Meteor. Soc., 137, 553–597, 2011.
Destouni, G. and Verrot, L.: Screening long-term variability and change of soil moisture in a changing climate, J. Hydrol., 516, 131–139, 2014.
Dorigo, W. A., Wagner, W., Albergel, C., Albrecht, F., Balsamo, G., Brocca, L., Chung, D., Ertl, M., Forkel, M., Gruber, A., Haas, E., Hamer, D. P., Hirschi, M., Ikonen, J., De Jeu, R. A. M., Kidd, R., Lahoz, W., Liu, Y. Y., Miralles, D. G., and Lecomte, P.: ESA CCI Soil Moisture for improved Earth system understanding: State-of-the art and future directions, Remote Sens. Environ., 203, 185–215, 2017.
Frank, D., Reichstein, M., Bahn, M., Frank, D., Mahecha, M. D., Smith, P., Thonicke, K., van der Velde, M., Vicca, S., Babst, F., Beer, C., Buchmann, N., Canadell, J. G., Ciais, P., Cramer, W., Ibrom, A., Miglietta, F., Poulter, B., Rammig, A., Seneviratne, S. I., Walz, A., Wattenbach, M., Zavala, M. A., and Zscheischler, J.: Effects of climate extremes on the terrestrial carbon cycle: concepts, processes and potential future impacts, Glob. Change Biol., 2, 2861–2880, 2015.
Friedl, M. A., Sulla-Menashe, D., Tan, B., Schneider, A., Ramankutty, N., Sibley, A., and Huang, X.: MODIS collection 5 global land cover: algorithm refinements and characterization of new datasets. Remote Sens. Environ., 114, 168–182, 2010.
Gruber, A., Dorigo, W. A., Crow, W., and Wagner, W.: Triple Collocation-Based Merging of Satellite Soil Moisture Retrievals, IEEE T. Geosci. Remote, 55, 1–13, 2017.
Gruber, A., Scanlon, T., van der Schalie, R., Wagner, W., and Dorigo, W.: Evolution of the ESA CCI Soil Moisture climate data records and their underlying merging methodology, Earth Syst. Sci. Data, 11, 717–739, https://doi.org/10.5194/essd-11-717-2019, 2019.
Gudmundsson, L., Rego, F. C., Rocha, M., and Seneviratne, S. I.: Predicting above normal wildfire activity in southern Europe as a function of meteorological drought, Environ. Res. Lett. 9, 084008, https://doi.org/10.1088/1748-9326/9/8/084008, 2014.
Jung, M., Koirala, S., Weber, U., Ichii, K., Gans, F., Camps-Valls, G., Papale, D., Schwalm, C., Tramontana, G., and Reichstein, M.: The FLUXCOM ensemble of global land-atmosphere energy fluxes, Scientific Data, 6, 74, https://doi.org/10.1038/s41597-019-0076-8, 2019.
Knapp, A. K., Carroll, C. J. W., Denton, E. M., La Pierre, K. J., Collins, S. L., and Smith, M. D.: Differential sensitivity to regional-scale drought in six central US grasslands, Oecologia, 177, 949–957, 2015.
Laaha, G., Gauster, T., Tallaksen, L. M., Vidal, J.-P., Stahl, K., Prudhomme, C., Heudorfer, B., Vlnas, R., Ionita, M., Van Lanen, H. A. J., Adler, M.-J., Caillouet, L., Delus, C., Fendekova, M., Gailliez, S., Hannaford, J., Kingston, D., Van Loon, A. F., Mediero, L., Osuch, M., Romanowicz, R., Sauquet, E., Stagge, J. H., and Wong, W. K.: The European 2015 drought from a hydrological perspective, Hydrol. Earth Syst. Sci., 21, 3001–3024, https://doi.org/10.5194/hess-21-3001-2017, 2017.
McCready, M. S., Dukes, M. D., and Miller, G. L.: Water conservation potential of smart irrigation controllers on St. Augustinegrass, Agr. Water Manage., 96, 1623–1632, 2009.
Martens, B., Miralles, D. G., Lievens, H., van der Schalie, R., de Jeu, R. A. M., Fernández-Prieto, D., Beck, H. E., Dorigo, W. A., and Verhoest, N. E. C.: GLEAM v3: satellite-based land evaporation and root-zone soil moisture, Geosci. Model Dev., 10, 1903–1925, https://doi.org/10.5194/gmd-10-1903-2017, 2017.
Nicolai-Shaw, N., Zscheischler, J., Hirschi, M., Gudmundsson, L., and Seneviratne, S. I.: A drought event composite analysis using satellite remote-sensing based soil moisture, Remote Sens. Environ., 203, 216–225, 2017.
Orth, R., Dutra, E., and Pappenberger, F.: Improving weather predictability by including land-surface model parameter uncertainty, Mon. Weather Rev., 144, 1551–1569, 2015.
Orth, R., Zscheischler, J., and Seneviratne, S. I.: Record dry summer in 2015 challenges precipitation projections in Central Europe, Sci. Rep., 6, 28334, https://doi.org/10.1038/srep28334, 2016.
Orth, R. and Destouni, G.: Drought reduces blue-water fluxes more strongly than green-water fluxes in Europe, Nat. Commun., 9, 3602, https://doi.org/10.1038/s41467-018-06013-7, 2018.
Le Quéré, C., Moriarty, R., Andrew, R. M., Peters, G. P., Ciais, P., Friedlingstein, P., Jones, S. D., Sitch, S., Tans, P., Arneth, A., Boden, T. A., Bopp, L., Bozec, Y., Canadell, J. G., Chini, L. P., Chevallier, F., Cosca, C. E., Harris, I., Hoppema, M., Houghton, R. A., House, J. I., Jain, A. K., Johannessen, T., Kato, E., Keeling, R. F., Kitidis, V., Klein Goldewijk, K., Koven, C., Landa, C. S., Landschützer, P., Lenton, A., Lima, I. D., Marland, G., Mathis, J. T., Metzl, N., Nojiri, Y., Olsen, A., Ono, T., Peng, S., Peters, W., Pfeil, B., Poulter, B., Raupach, M. R., Regnier, P., Rödenbeck, C., Saito, S., Salisbury, J. E., Schuster, U., Schwinger, J., Séférian, R., Segschneider, J., Steinhoff, T., Stocker, B. D., Sutton, A. J., Takahashi, T., Tilbrook, B., van der Werf, G. R., Viovy, N., Wang, Y.-P., Wanninkhof, R., Wiltshire, A., and Zeng, N.: Global carbon budget 2014, Earth Syst. Sci. Data, 7, 47–85, https://doi.org/10.5194/essd-7-47-2015, 2015.
Reichstein, M., Bahn, M., Ciais, P., Frank, D., Mahecha, M. D., Seneviratne, S. I., Zscheischler, J., Beer, C., Buchmann, N., Frank, D. C., Papale, D., Rammig, A., Smith, P., Thonicke, K., van der Velde, M., Vicca, S., Walz, A., and Wattenbach, M.: Climate extremes and the carbon cycle, Nature, 500, 287–295, 2013.
Rosenzweig, C., Iglesias, A., and Yang, X.: Climate change and extreme weather events; implications for food production, plant diseases, and pests, Global Change Hum. Health, 2, 90–104, 2001.
Schellekens, J., Dutra, E., Martínez-de la Torre, A., Balsamo, G., van Dijk, A., Sperna Weiland, F., Minvielle, M., Calvet, J.-C., Decharme, B., Eisner, S., Fink, G., Flörke, M., Peßenteiner, S., van Beek, R., Polcher, J., Beck, H., Orth, R., Calton, B., Burke, S., Dorigo, W., and Weedon, G. P.: A global water resources ensemble of hydrological models: the eartH2Observe Tier-1 dataset, Earth Syst. Sci. Data, 9, 389–413, https://doi.org/10.5194/essd-9-389-2017, 2017.
Schwalm, C. R., Anderegg, W. R. L., Michalak, A. M., Fisher, J. B., Biondi, F., Koch, G., Litvak, M., Ogle, K., Shaw, J. D., Wolf, A., Huntzinger, D. N., Schaefer, K., Cook, R., Wei, Y., Fang, Y., Hayes, D., Huang, M., Jain, A., and Tian, H.: Global patterns of drought recovery, Nature, 548, 202–205, 2017.
Seneviratne, S. I., Corti, T., Davin, E. L., Hirschi, M., Jaeger, E. B., Lehner, I., Orlowsky, B., and Teuling, A. J.: Investigating soil moisture-climate interactions in a changing climate: A review, Earth-Sci. Rev., 99, 125–161, 2010.
Seneviratne, S. I., Nicholls, N., Easterling, D., Goodess, C. M., Kanae, S., Kossin, J., Luo, Y., Marengo, J., McInnes, K., Rahimi, M., Reichstein, M., Sorteberg, A., Vera, C., and Zhang, X.: “Changes in climate extremes and their impacts on the natural physical environment” in: Managing the Risks of Extreme Events and Disasters to Advance Climate Change Adaptation. A Special Report of Working Groups I and II of the Intergovernmental Panel on Climate Change (IPCC), edited by: Field, C. B., Barros, V., Stocker, T. F., Qin, D., Dokken, D. J., Ebi, K. L., Mastrandrea, M. D., Mach, K. J., Plattner, G.-K., Allen, S. K., Tignor, M., and Midgley, P. M., Cambridge University Press, Chap. 3, 109–230, 2012a.
Seneviratne, S. I., Lehner, I., Gurtz, J., Teuling, A. J., Lang, H., Moser, U., Grebner, D., Menzel, L., Schroff, K., Vitvar, T., and Zappa, M.: Swiss prealpine Rietholzbach research catchment and lysimeter: 32 year time series and 2003 drought event, Water Resour. Res., 48, W06526, https://doi.org/10.1029/2011WR011749, 2012b.
Sitch, S., Friedlingstein, P., Gruber, N., Jones, S. D., Murray-Tortarolo, G., Ahlström, A., Doney, S. C., Graven, H., Heinze, C., Huntingford, C., Levis, S., Levy, P. E., Lomas, M., Poulter, B., Viovy, N., Zaehle, S., Zeng, N., Arneth, A., Bonan, G., Bopp, L., Canadell, J. G., Chevallier, F., Ciais, P., Ellis, R., Gloor, M., Peylin, P., Piao, S. L., Le Quéré, C., Smith, B., Zhu, Z., and Myneni, R.: Recent trends and drivers of regional sources and sinks of carbon dioxide, Biogeosciences, 12, 653–679, https://doi.org/10.5194/bg-12-653-2015, 2015.
Teuling, A. J., Van Loon, A. F., Seneviratne, S. I., Lehner, I., Aubinet, M., Heinesch, B., Bernhofer, C., Grünwald, T., Prasse, H., and Spank, U.: Evapotranspiration amplifies European summer drought, Geophys. Res. Lett., 40, 2071–2075, 2013.
Verrot, L. and Destouni, G.: Data-model comparison of temporal variability in long-term time series of large-scale soil moisture, J. Geophys. Res.-Atmos., 121, 10056–10073, 2016.
Walther, S., Duveiller, G., Jung, M., Guanter, L., Cescatti, A., and Camps-Valls, G.: Satellite Observations of the Contrasting Response of Trees and Grasses to Variations in Water Availability, Satellite Observations of the Contrasting Response of Trees and Grasses to Variations in Water Availability, Geophys. Res. Lett., 46, 1429–1440, 2019.
Wolf, S., Keenan, T. F., Fisher, J. B., Baldocchi, D. D., Desai, A. R., Richardson, A. D., Scott, R. L., Law, B. E., Litvak, M. E., Brunsell, N. A., and Peters, W.: Warm spring reduced carbon cycle impact of the 2012 US summer drought, P. Natl. Acad. Sci. USA, 113, 5880–5885, 2016.
Zhang, Z., Zhang, R., Cescatti, A., Wohlfahrt, G., Buchmann, N., Zhu, J., Chen, G., Moyano, F., Pumpanen, J., Hirano, T., Takagi, K., and Merbold, L.: Effect of climate warming on the annual terrestrial net ecosystem CO2 exchange globally in the boreal and temperate regions, Sci. Rep., 7, 3108, https://doi.org/10.1038/s41598-017-03386-5, 2017.
Zhu, Z., Bi, J., Pan, Y., Ganguly, S., Anav, A., Xu, L., Samanta, A., Piao, S., Nemani, R. R., and Myneni, R. B.: Global Data Sets of Vegetation Leaf Area Index (LAI)3g and Fraction of Photosynthetically Active Radiation (FPAR)3g Derived from Global 510 Inventory Modeling and Mapping Studies (GIMMS) Normalized Difference Vegetation Index (NDVI 3g) for the Period 1981 to 2011, Remote Sens., 5, 927–948, 2013.