the Creative Commons Attribution 4.0 License.
the Creative Commons Attribution 4.0 License.
 | 09 Oct 2020
Risk of crop failure due to compound dry and hot extremes estimated with nested copulas
Andreia Filipa Silva Ribeiro
Ana Russo
Célia Marina Gouveia
Patrícia Páscoa
Jakob Zscheischler
The interaction between co-occurring drought and hot conditions is often particularly damaging to crop's health and may cause crop failure. Climate change exacerbates such risks due to an increase in the intensity and frequency of dry and hot events in many land regions. Hence, here we model the trivariate dependence between spring maximum temperature and spring precipitation and wheat and barley yields over two province regions in Spain with nested copulas. Based on the full trivariate joint distribution, we (i) estimate the impact of compound hot and dry conditions on wheat and barley loss and (ii) estimate the additional impact due to compound hazards compared to individual hazards. We find that crop loss increases when drought or heat stress is aggravated to form compound dry and hot conditions and that an increase in the severity of compound conditions leads to larger damage. For instance, compared to moderate drought only, moderate compound dry and hot conditions increase the likelihood of crop loss by 8 % to 11 %, while when starting with moderate heat, the increase is between 19 % to 29 % (depending on the cereal and region). These findings suggest that the likelihood of crop loss is driven primarily by drought stress rather than by heat stress, suggesting that drought plays the dominant role in the compound event; that is, drought stress is not required to be as extreme as heat stress to cause similar damage. Furthermore, when compound dry and hot conditions aggravate stress from moderate to severe or extreme levels, crop loss probabilities increase 5 % to 6 % and 6 % to 8 %, respectively (depending on the cereal and region). Our results highlight the additional value of a trivariate approach for estimating the compounding effects of dry and hot extremes on crop failure risk. Therefore, this approach can effectively contribute to design management options and guide the decision-making process in agricultural practices.
- Article
(4582 KB) - Full-text XML
- BibTeX
- EndNote


The assessment of the adverse social, economic and environmental impacts associated with a combination of multiple climate hazards has recently become a focus of high interest (Leonard et al., 2014; Zscheischler et al., 2020). Such compound events often lead to larger impacts compared to when hazards occur separately (Zscheischler et al., 2018). For instance, compound dry and hot conditions reduce carbon uptake more strongly compared to the sum of the individual hazards (Zscheischler et al., 2014). Dry and hot conditions often co-occur. For instance in Europe, the extreme 2003, 2010 and 2018 heatwaves were accompanied by strong soil moisture deficits (Bastos et al., 2014; Schumacher et al., 2019; Buras et al., 2020). In 2010, the compound event was particularly strong in Russia (Schumacher et al., 2019), while in 2003 the extreme drought and heatwave affected mostly central Europe, extending to west Mediterranean countries like Portugal and Spain (Garcia-Herrera et al., 2010), with critical consequences in several sectors. In 2010, widespread crop yield declines and failures occurred over the major grain-producing regions of Russia, northeastern Ukraine and northwestern Kazakhstan (Loboda et al., 2017). Previously, the shortages in crop yields in 2003 also caused major financial losses in the agricultural sector, and when compared to the previous year, the cereal productions in the European Union (EU) decreased 23×106 t (COPA-COGECA, 2003). The decline in the harvests was both in quantity and quality, as was the case for winter cereals whose maturation was accelerated due to compound extreme dry and hot conditions, forming grains with insufficient water content (COPA-COGECA, 2003). The 2018 event strongly impacted pastures and arable land north of the Alps (Buras et al., 2020). As the occurrence of climate extremes such as heatwaves, droughts, and compound dry and hot events is expected to increase in intensity and frequency in many land regions due to climate change (IPCC, 2012; Zscheischler and Seneviratne, 2017), associated adverse impacts such as widespread harvest failures threatening global cereal supplies may also increase.
Among the panoply of multivariate approaches applied to assess the impacts of multiple climate hazards, the use of copulas has become quite popular in studies focused on analysing the social, environmental and economic risks associated with adverse climate conditions (Bokusheva et al., 2016; Gaupp et al., 2019; Madadgar et al., 2017; Ribeiro et al., 2019b, a; Zscheischler et al., 2017). With copulas nonlinear dependency structures can be modelled, which offers more flexibility and possibly a more adequate fit for different dependence types at the extremes (Durante and Sempi, 2015; Nelsen, 2006; Salvadori and De Michele, 2007; Salvadori et al., 2016). Among all types of copulas described in the literature, the popularity of the class of elliptical copulas comes from the fact that they are derived from well-known distributions associated with the widely used Pearson's correlation, but the elliptical dependence is only able to capture radial symmetry and the respective mathematical expressions do not have a closed form. One of the copula classes that overcomes this drawback is the Archimedean, which has a simpler mathematical form and can capture different kinds of tail dependence and radial symmetry or asymmetry.
Archimedean copulas (ACs) are exchangeable, which means that the copula is the same if we permute the respective margins. For the bivariate case this may not be a limitation, but as the number of dimensions increase, it is unlikely that exchanging across the involved variables allows for the “true” dependence structure to be well-defined. To avoid exchangeability, nested Archimedean copulas (NACs) have been proposed (Okhrin and Ristig, 2014), also referred to as hierarchical Archimedean copulas (HACs), obtained by nesting lower-dimensional Archimedean copulas into each other and/or using marginal distributions. Okhrin and Ristig (2014) introduced NACs where all copulas belong to the same family with a nesting condition that requires decreasing dependence strength from the highest to the lowest hierarchical level. Here we make use of this NAC approach, taking advantage of the balance between flexibility (modelling different types of dependence structures) and usability in higher dimensions (limiting the number of parameters).
The present work aims to identify how compound dry and hot conditions affect wheat and barley yields over two regions of provinces in Spain based on the trivariate dependence between precipitation, maximum temperature and yields using a NAC approach. In particular, we are interested in quantifying the additional risk associated with compound dry and hot conditions compared to only dry or only hot conditions. Wheat and barley are chosen as they are two of the major rainfed crops in the Iberian Peninsula (Peña-Gallardo et al., 2019; Vicente-Serrano et al., 2006). Moreover, we build here on prior work which has estimated wheat and barley losses in the same area but related to a single hazard, namely droughts (Ribeiro et al., 2019a, b).
Using NACs, we estimate the conditional probabilities of crop loss under different severity levels of dry and hot conditions based on the full trivariate joint distribution. We focus on annual wheat and barley yield data at the sub-national scale, thus overcoming drawbacks related to assessing climate-related crop risks at the national scale. Based on the proposed approach we (i) characterise the dependence structures between the dry and hot conditions and the crop yields, (ii) estimate the conditional probability of crop loss under different compound dry and hot severity levels, and (iii) evaluate how much the compound dry and hot conditions increase the risk of crop failure in comparison to the individual hazards.
2.1 Crop yield data
Wheat and barley yields were obtained for nine provinces in Spain from the Spanish Ministry of Agriculture, Fisheries and Food (available at https://www.mapa.gob.es/es/estadistica/temas/publicaciones/anuario-de-estadistica/, last access: 9 November 2019). Those nine provinces were aggregated into two distinct regions (Fig. 1), which are dominated by rainfed agricultural practices following the non-irrigated arable land classification from the CORINE Land Cover dataset based on an earlier regionalisation (Ribeiro et al., 2019c, b). The provincial regionalisation consisted in the application of three main criteria: first the provinces with land use dominated by agricultural practices were identified (Fig. 1), and from those provinces, the ones dominated by non-irrigated practices and contiguous in space were selected for analysis (Fig. 1 – bold black contours). Figure 1 shows the Iberian provinces with <50 % agricultural pixels coloured white, the provinces with >50 % agricultural pixels coloured with the respective agricultural CORINE classes and the selected two regions of contiguous provinces dominated by rainfed agriculture delineated in bold black contours. This aggregation of provinces allowed for the identification of two major breadbaskets where rainfed systems supply the predominant crops among the provinces with higher percentage of agricultural land use in the Iberian Peninsula.

Figure 1Iberian provinces dominated by agricultural land use (>50 % agricultural pixels belonging to all agricultural CORINE classes; see legend) according to the CORINE Land Cover dataset and respective categories. The contiguous provinces dominated by rainfed practices (>50 % non-irrigated pixels in yellow) are delineated in bold black contours and grouped into two regions. Northern region (Region 1) provinces: Burgos, Palencia, Segovia, Valladolid and Zamora. Southern region (Region 2) provinces: Albacete, Ciudad Real, Cuenca and Toledo.
Crop yields were obtained as the ratio between production and harvested area during the period of 1986–2016. We computed crop yield anomalies by removing longer-term trends based on locally estimated scatterplot smoothing (LOESS, a method for local regression) to account for yield increases due to technological development (Ben-Ari et al., 2016). We pooled crop yields from the provinces over each region, resulting in sample sizes N1=155 for Region 1 (31 years of annual data over five provinces) and N2=124 for Region 2 (31 years of annual data over four provinces). Pooling time series greatly expands the sample size, allowing greater robustness in three-dimensional statistical analysis that otherwise would be compromised. This type of assessment is a compromise between the use of a sub-national resolution of crop data and the sample size to evaluate the number of cases of simultaneous occurrence of dry and hot conditions.
2.2 Weather data
The vegetative cycle of the winter crops in Spain is mainly driven by precipitation and temperature: sowing occurs around autumn (from September through November, SON), followed by the vegetative phase in winter (from December through January, DJF) and reproductive phase (more photosynthetically active phase) in spring (from March through May, MAM), and crop harvest occurs in the early summer (around June). Therefore, monthly accumulated precipitation (P) and monthly maximum temperature (Tmax) were extracted from the Climatic Research Unit (CRU) TS4.01 dataset (Harris et al., 2014) spanning the same time period. Given the importance of assessing crop's water and temperature requirements at different moments of the vegetative cycle, we conducted a correlation analysis between the annual yields and the 3-monthly means of P and 3-monthly means of Tmax during the whole growing season, as shown in Fig. 2. The identification of the moment of the vegetative cycle of the crop's highest water and temperature requirements was assessed based on the strongest statistically significant correlation value (denoted by filled circles in Fig. 2). Figure 2 suggests that the greatest influence of P and Tmax in crop yields is observed during spring (MAM in both regions and cereals), corresponding to the reproductive phase of plant development, when vegetation is photosynthetically more active. Therefore, for the remaining analysis we focus on 3-monthly means of Tmax and 3-monthly means of P during spring (PMAM and , respectively), which has also been identified in previous studies as a growth stage sensitive to the effects of water content and high temperatures (Ferrise et al., 2011; Del Moral et al., 2003; Iglesias and Quiroga, 2007; Ribeiro et al., 2019c). This selection of climate variables allows for the maximisation of the dependence between climate conditions and yields as also shown by previous work based on the same data (Ribeiro et al., 2019c).
We considered three severity levels of dry and/or hot conditions – moderate (+), severe (++) and extreme (+++) – based on percentile thresholds as shown in Table 1. Besides these three severity levels, we further considered all combinations of 10 categories of severity levels of dry and hot conditions exceeding the 50th to 5th and 50th to 95th percentiles for PMAM and , respectively. We further considered the 20th percentile of the crop anomaly time series as the lower exceedance threshold for crop failure (Ben-Ari et al., 2016; Ribeiro et al., 2019a, b).
Table 1Categories of severity levels of dry and hot conditions based on PMAM and percentiles.

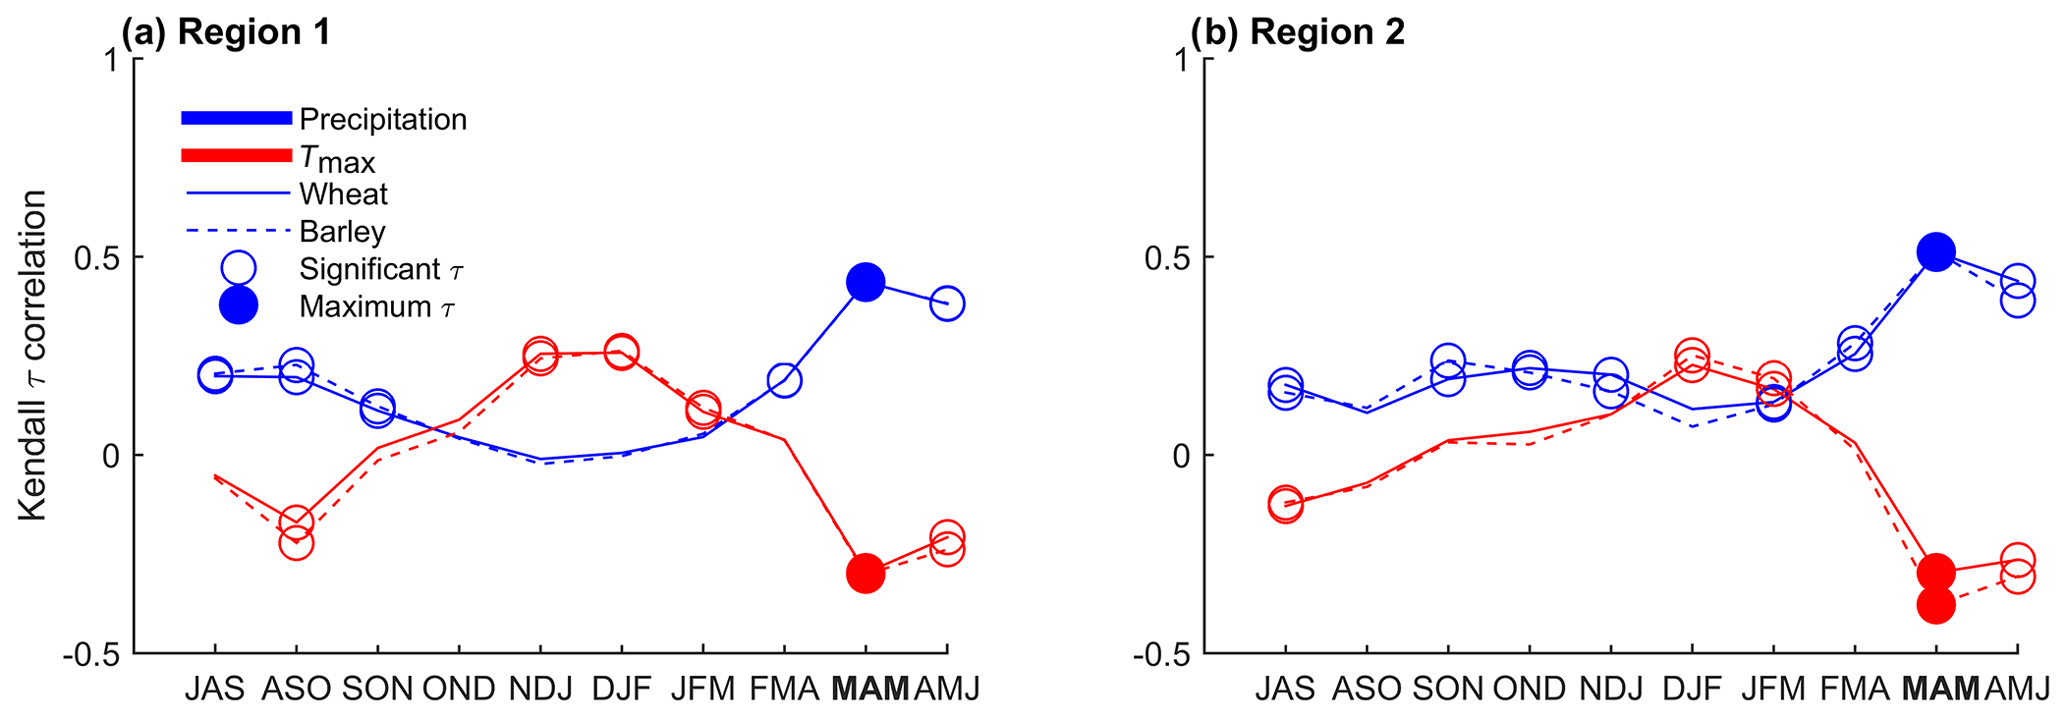
Figure 2Kendall correlation τ between 3-monthly means of maximum temperature (Tmax, red) and precipitation (blue) with wheat (solid lines) and barley (dashed lines) yield anomalies. Correlations were computed during the crop-growing period (September to June) over 1986–2016 for Region 1 (a) and 2 (b; Fig. 1). The letters on the x axis denote the 3-month averaging periods. Circles indicate statistically significant correlations at α=0.05. The strongest correlation (positive or negative) is denoted by filled circles (PMAM and ).
2.3 Modelling trivariate distributions with nested Archimedean copulas
We model the trivariate relationship between temperature, precipitation and crop yields with nested copulas. Consider a vector of crop yield annual anomalies Y and the climate variables X1=PMAM and with marginal cumulative distribution functions (CDFs) FY, and , respectively. We aim to estimate and compare three conditional CDFs with the scalars and corresponding to the dry and hot thresholds, respectively:
With the above equations we can estimate the crop yield impacts under dry conditions (Eq. 1), under hot conditions (Eq. 2), and under compound dry and hot conditions (Eq. 3), respectively. In other words, if the compound dry and hot conditions cause more damage than the individual hazards, it is expected that suggests higher probabilities of crop loss (i.e. for a low y*) than or . Furthermore, we can study the relative role of PMAM and for crop loss with Eqs. (1) and (2).
To compare the additional impact of compound dry and hot conditions with the impacts caused by the individual hazards, Eqs. (1)–(3) are used to estimate
where 0.2 is the threshold of crop loss (y*) corresponding to the 20th percentile of the crop yield anomalies. These changes can be estimated for different severity levels of dry () and hot () conditions.
Following the theorem of Sklar (1959) we can decompose a multivariate probability distribution into its marginals and a copula C which describes the dependence structure between the margins. To estimate the multivariate distribution , the respective copula C is fitted, which is then a joint CDF whose marginal distributions are uniform in the interval [0,1] (Durante and Sempi, 2015; Nelsen, 2006; Salvadori and De Michele, 2007). Transforming the margins to uniform variables through their CDFs, that is, u1=FY, and , the trivariate CDF can be written as (Sklar, 1959)
Within the copula families, ACs are extensively used due to their flexibility and applicability to a variety of tail dependence structures, as well as their analytical tractability. An AC can be written in terms of the respective generator function φ, which belongs to a parametric family φθ dependent on the parameter θ, e.g. for the three-dimensional case,
Due to the symmetry of bivariate ACs, the above trivariate form can be expressed in terms of an NAC, where two of the margins are first coupled by their bivariate copula and then coupled with the third margin, via the same generator on each level but different parameters θ12 and θ1, respectively, e.g.
Equation (8) can also be expressed in terms of the other possible pair copulas and that are coupled with u2 and u1 by C2 and C3, with expressions and , respectively. Like Eq. (8), in each structure of the NAC the same generator is required for each level but with potentially different parameters. Hence, both the optimal structure and respective parameters must be determined.
Most structures of NACs require decreasing parameters from the inner to the outer hierarchical level to attain a properly fitted copula. As for most ACs, the larger the parameter, the stronger the dependence; this means that most structures of NACs require that the marginal copulas in the inner level should correspond to the pair with the strongest dependence, i.e. satisfying θ12≥θ1 in the case of Eq. (8). This requirement applies to NACs with generators from the same family, providing a flexible estimation of the NAC, which allows for specifying the full distribution with at most d−1 parameters, where d is the number of copula dimensions or marginal distributions (Okhrin and Ristig, 2014).
In our study we focus on a total of four Archimedean families that capture different kinds of joint dependence structures: Clayton, Gumbel, Frank and Joe. The Clayton, Gumbel and Joe copulas describe an asymmetrical tail behaviour, while the Frank copula, in a similar way to the Gaussian copula, captures joint symmetric dependence. While Gumbel and Joe copulas can represent upper tail dependence, Clayton copulas can represent lower tail dependence. The estimation of the copula parameters is based on maximum likelihood based on the R package “HAC” (Okhrin and Ristig, 2014).
The main steps of the trivariate approach used in this study can be summarised as follows (Okhrin and Ristig, 2014). First, the marginal distributions u1, u2 and u3 are estimated non-parametrically by simple ranking, using the empirical distribution functions of the data through the pobs function in the R package “copula” (Kojadinovic and Yan, 2010), a common approach for copula modelling. Afterwards, the fit of bivariate copula models is performed to every pair of variables to estimate , and . For each pair, the copula selection is performed based on Akaike's information criterion (AIC), and the goodness of fit is checked by comparing the empirical copula based on the Cramér–von Mises distance (Sn). The bivariate copula with the strongest dependence, with the lowest AIC and the lowest Sn, is selected to define the structure of the NAC. Afterwards, the marginal distribution that is not part of the selected bivariate copula is joined and the parameter of the upper-level copula of the same family is estimated (Eq. 8). As a final step, the estimated NAC with two parameters is compared with the same Archimedean family with one parameter (Eq. 7) in terms of the AIC, which penalises the number of estimated parameters.
2.4 Diagnostics and uncertainties in the estimation procedure
The visual diagnostics of the quality of the selected models are performed analogously to a Q–Q plot by comparing the empirical estimate of the Kendall function (cumulative distribution of the copula) with the theoretical estimate of the Kendall function based on the selected parametric trivariate copulas (Okhrin and Ristig, 2014).
Best estimates of all conditional probabilities (i.e. Eqs. 1–5) are estimated by drawing N=100 000 samples from the fitted trivariate copula. Using the same single-parameter generator function on each level of the NAC (but with a potentially different value of θ) satisfies the required complete monotonicity of the AC generators to construct NACs following Okhrin and Ristig (2014), which also implies that the possible pairs are positively dependent. Therefore, due to the negative dependence between and both crop yields and PMAM, we inverted the margins of for copula modelling (i.e. multiplication by −1). For more details on complete monotonicity of the AC generators and NAC constructions, see e.g. Górecki et al. (2017).
Uncertainties in the statistical modelling are estimated by repeated sampling (10 000 times) of the fitted model with sample sizes equal to the number of observations (i.e. N1 in the case of Region 1 and N2 in the case of Region 2). From these samples, 95 % confidence intervals of Kendall's rank correlation are estimated and compared with the observed pairs (u1,u2), (u1,u3) and (u2,u3). This validation step intends to verify if the generated pairs of copula-based samples preserve the level of dependence found in the observations. Furthermore, this approach is used to estimate uncertainties related to the conditional probabilities (Eqs. 1–5).
In both cereals and both regions the most dependent pair of variables corresponds to crop yields and PMAM; hence the pair of variables u1,u2 defines the optimal NAC structure (Fig. 3). Results for all possible variable pairs and the respective bivariate copulas are shown in Table A1.
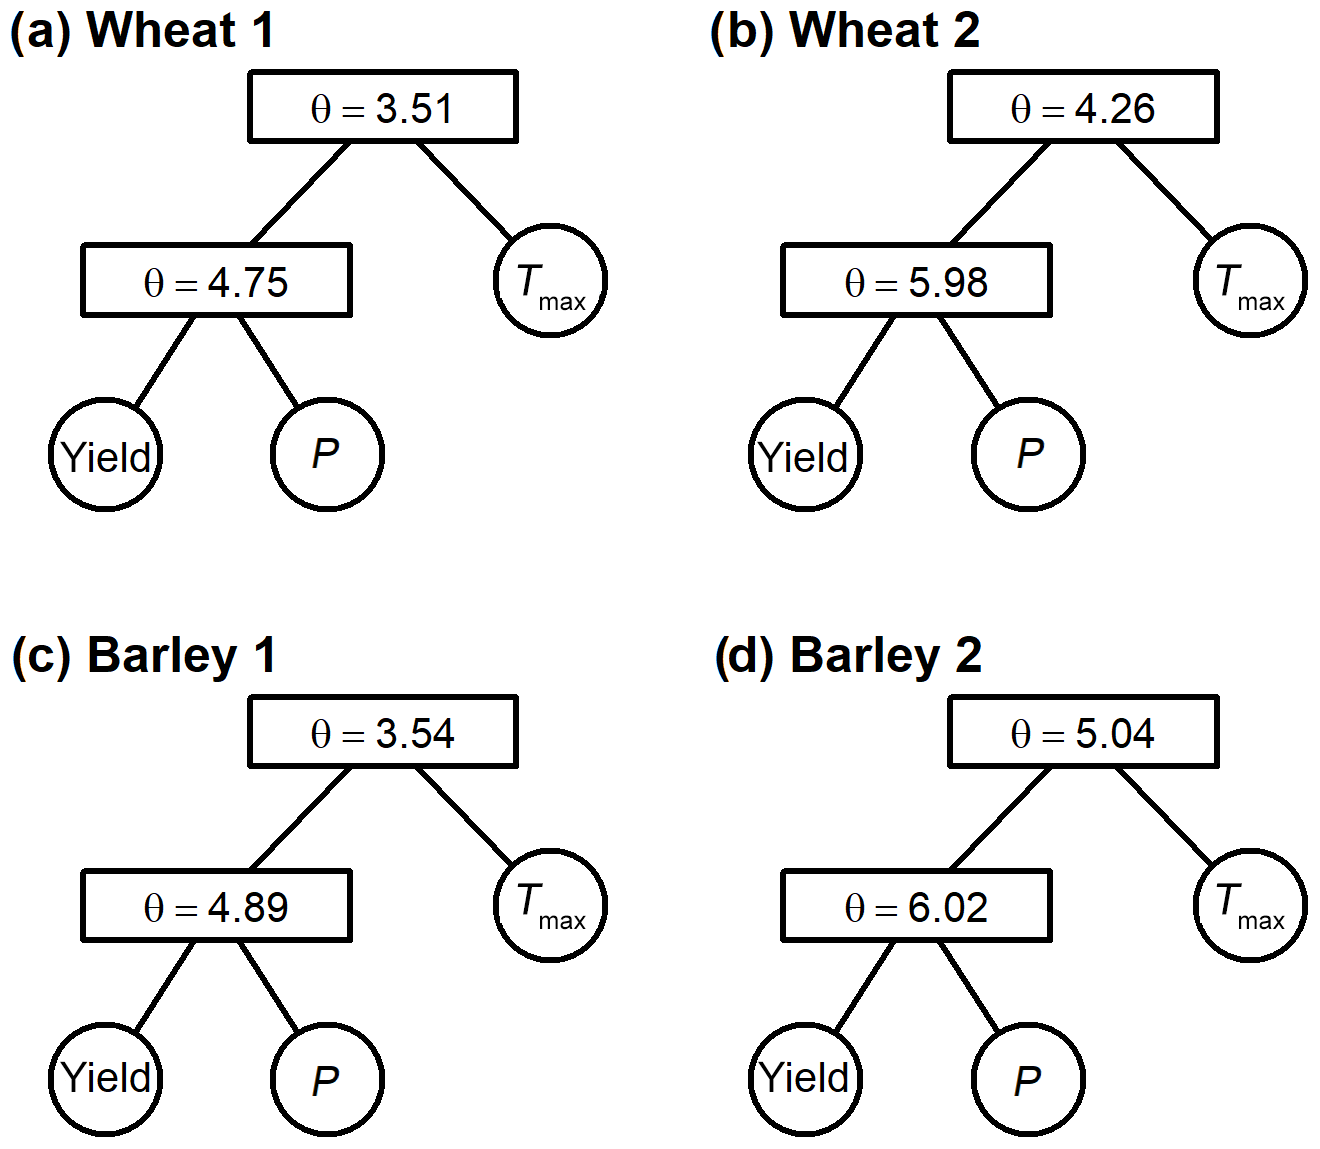
Figure 3Structure and respective parameters of the selected nested Frank models to model the trivariate joint distributions between crop yields, PMAM and . (a) Wheat in Region 1. (b) Wheat in Region 2. (c) Barley in Region 1. (d) Barley in Region 2.
Once the bivariate copula C12(u1,u2) of yields and PMAM are known, the NAC models are constructed (Table 2). The Frank copula provides the best fit of C12(u1,u2) (Table A1) for both cereals and both regions, and thus the parameters of the trivariate nested copulas are all from the Frank family. Nevertheless, despite Frank being the best family to characterise the nested copulas, we also constructed NAC models with Gumbel, Clayton and Joe copulas for comparison, as well as trivariate Archimedean copulas with one parameter where we selected the best structure between one-parameter and two-parameter AC copulas via the AIC (Table 2). In all but one case the NAC model with Frank copulas is the best model. The only exception is barley in Region 2 whose AIC of is slightly lower than the AIC of ) (Table 2). This feature may suggest that a structure favouring the dependence between yield and precipitation (u1,u2) may not be as relevant as in the other regions and yields due to a less dominant role of drought individually in this case. Nevertheless, in terms of the Cramér–von Mises distance (Sn) the nested copula is closer to the empirical trivariate copula. For this reason, we modelled the trivariate joint distribution based on nested Frank copulas for all cases. For all fitted models, the empirical cumulative distribution corresponds well to the theoretical cumulative distributions (Fig. 4).
Table 2Trivariate Archimedean copula (AC) parameters (θ) with nested structure with two-parameter and with one-parameter and respective Akaike's information criterion (AIC) and Cramér–von Mises distance (Sn). Fit based on maximum pseudo-likelihood (Gumbel, G; Clayton, C; Frank, F; and Joe, J, copulas). Smaller values of AIC and Sn indicate the selected copula for each cereal and region (bold).
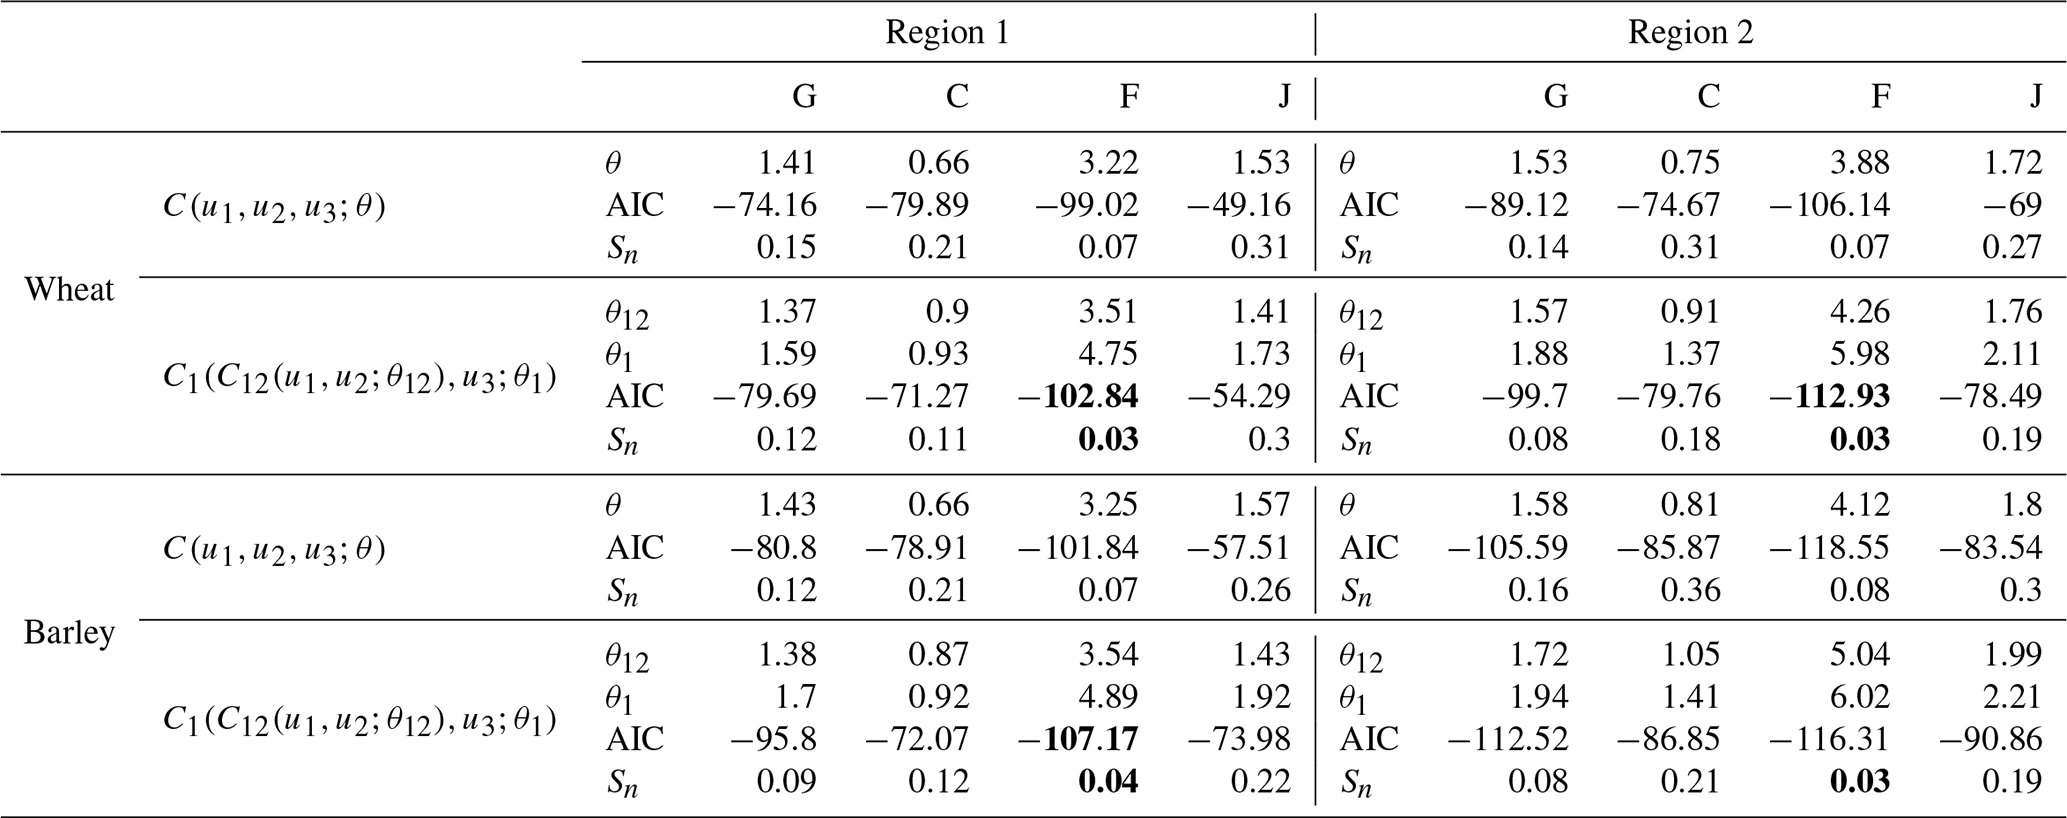
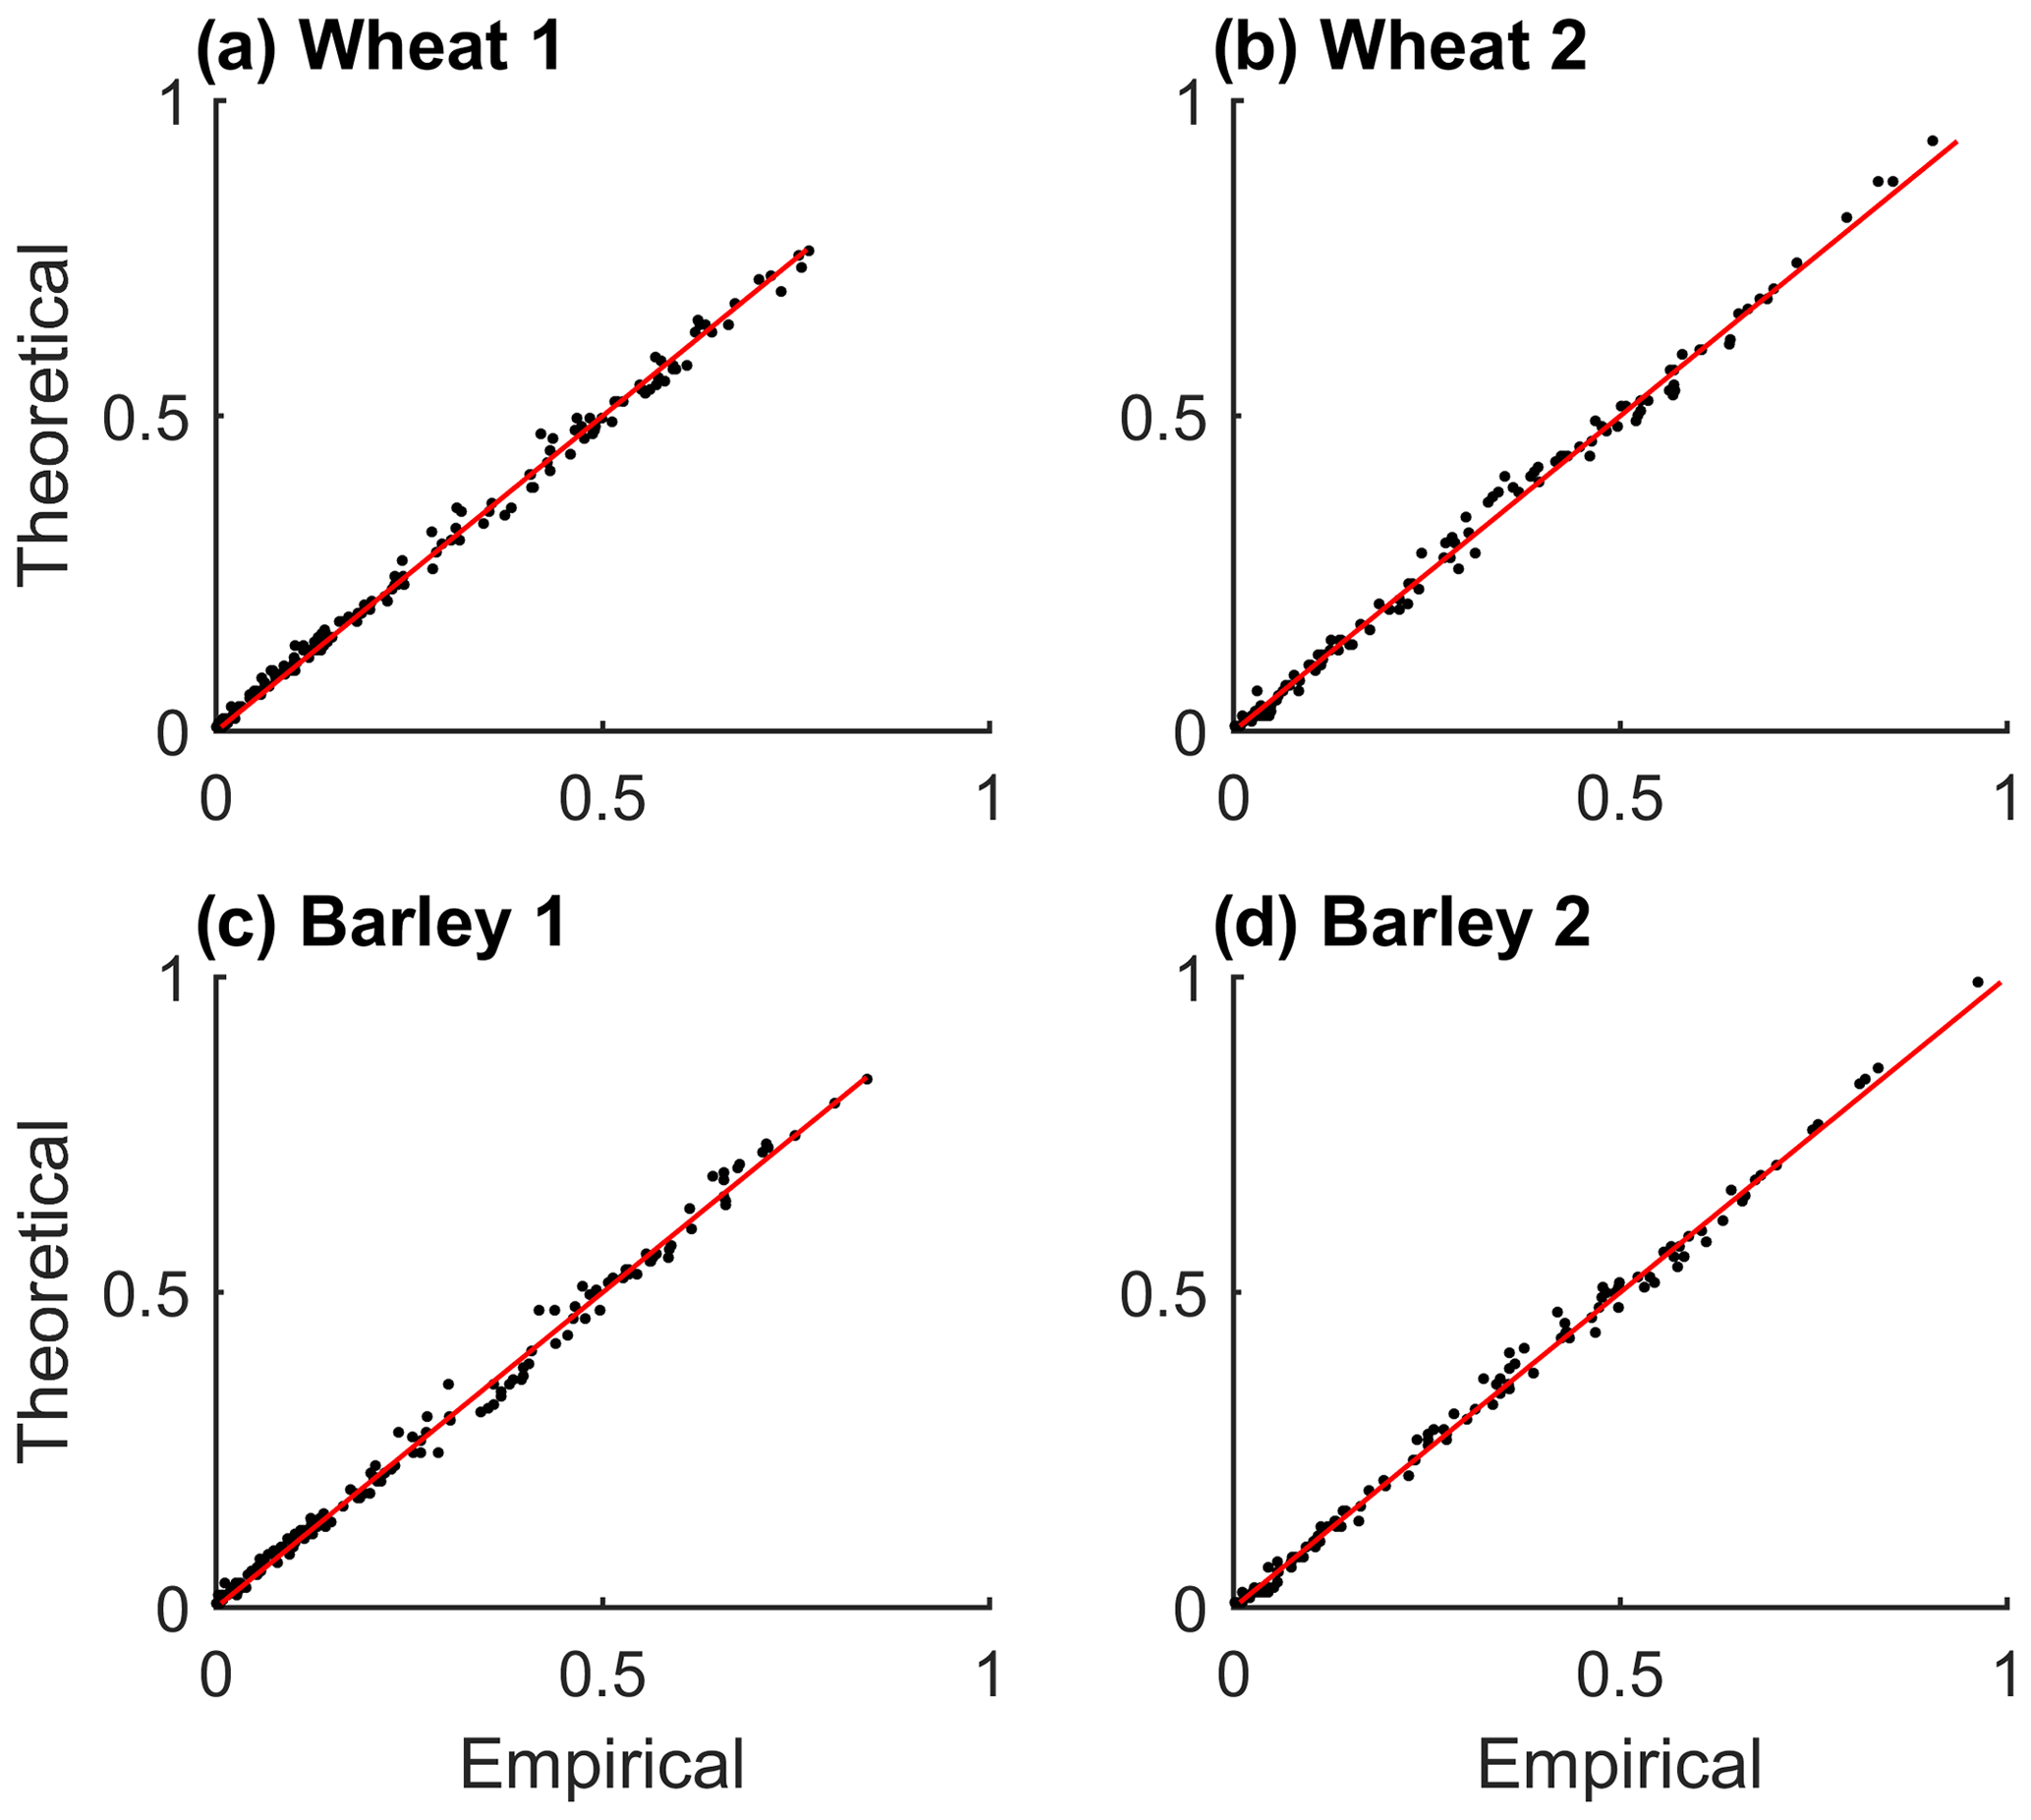
Figure 4Empirical versus theoretical probability distributions based on the nested Frank copula models. (a) Wheat in Region 1. (b) Wheat in Region 2. (c) Barley in Region 1. (d) Barley in Region 2.
Bivariate dependencies as measured by Kendall's τ are captured well by the fitted models (Fig. 5 for wheat, Fig. A1 for barley). Among all possible pairs, the correlation between Tmax and yield is the weakest for both cereals (Table A1), and likely for this reason it is the pair in Figs. 5 and A1 with observational τ closest to the lower bound of the 95 % confidence intervals (Figs. 5f, h and A1f, h). Nevertheless, in both Figs. 5 and A1, the simulated level of dependence is inside the 95 % confidence level and the magnitude of correlations among the pairs is also reasonably preserved by the models i.e. such that .
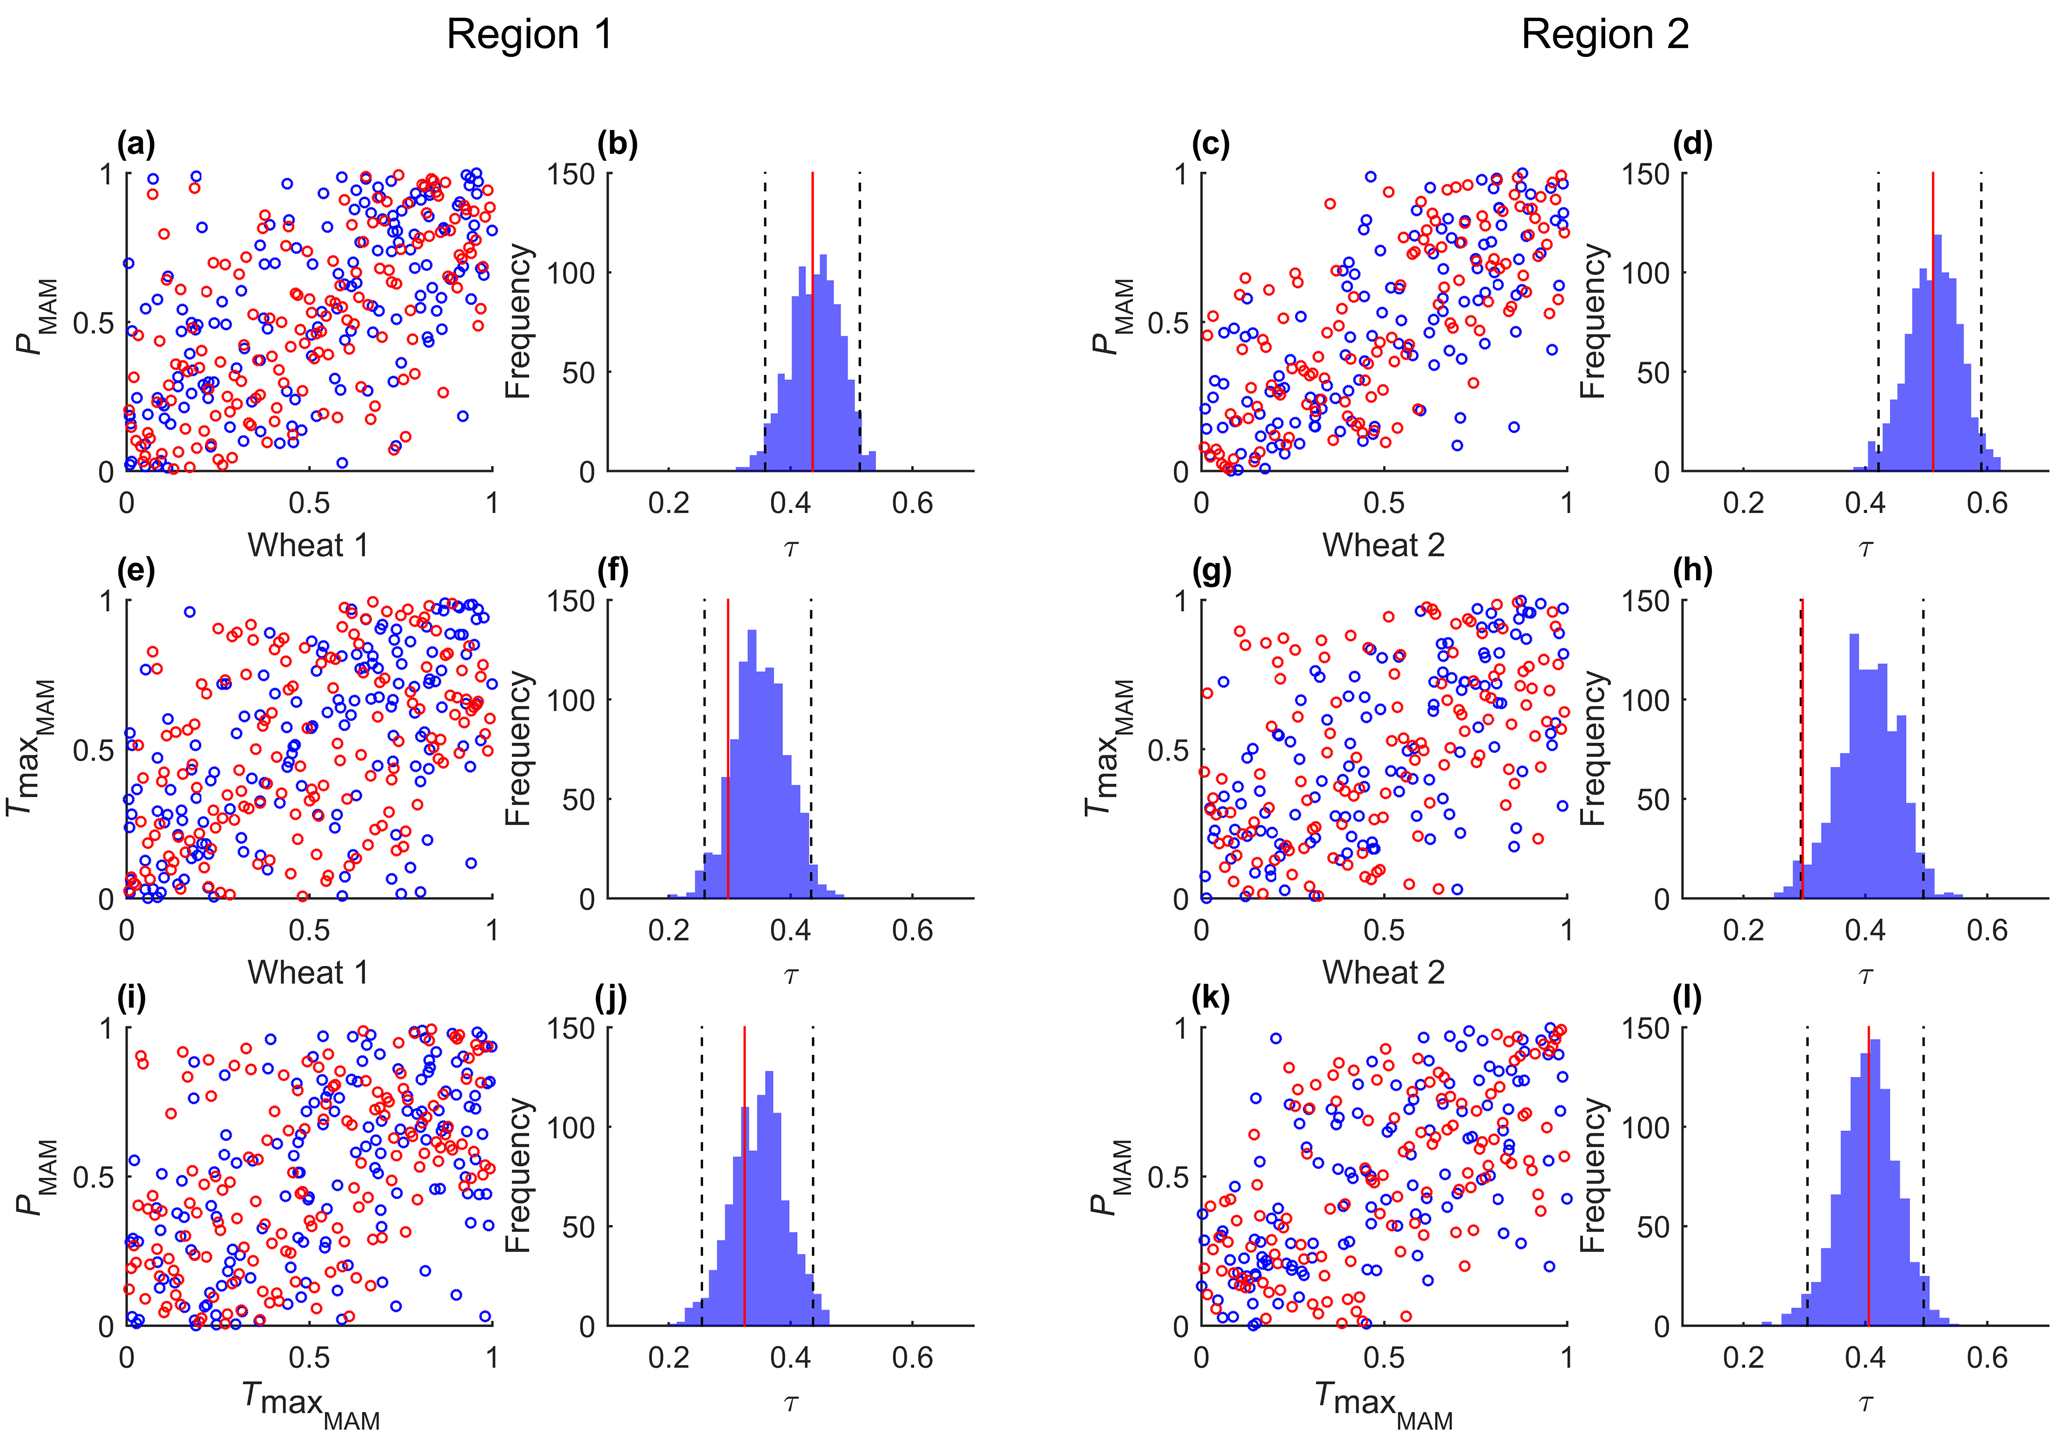
Figure 5Scatterplots of copula-based samples (blue) compared with ranked observations (red) of crop anomalies with climate variables PMAM and (a, c, e, g) and PMAM against (i, k), for both regions. The histograms (b, d, f, h, j, l) correspond to the Kendall rank correlation of each pair based on 10 000 simulations with the same sample size of the observational sample. The 95 % confidence intervals are shown with dashed lines. The red lines indicate the Kendall rank correlation of the observations.
The cumulative conditional probabilities of yield under moderate (+), severe (++) and extreme (+++) compound dry and hot conditions demonstrate that the probability of crop loss increases with the severity of compound dry and hot conditions for both regions and both cereals (Fig. 6a–d). Moreover, the likelihood of crop loss is higher in Region 2 for both cereals, particularly in the case of barley. Under extreme dry and hot conditions (+++dry+++hot, purple), the likelihood of crop loss is 68 % and 71 % for wheat and barley, respectively, in Region 2, in contrast to 62 % and 63 % in Region 1 (Fig. 6e, purple bars). In addition, the differences in crop loss are higher between moderate (+dry+hot) and severe (++dry++hot) conditions compared to the differences between severe and extreme (+++dry+++hot) conditions. More precisely, when the compound dry and hot conditions aggravate stress from moderate to severe levels, crop loss increases 5 % to 6 %, and when the compound dry and hot conditions aggravate stress from moderate to extreme levels, crop loss increases 6 % to 8 % (depending on the cereal and region). For comparison, conditional cumulative probability distributions for single stressors compared with the compound stressors are shown in Fig. A2 for all three severity levels.
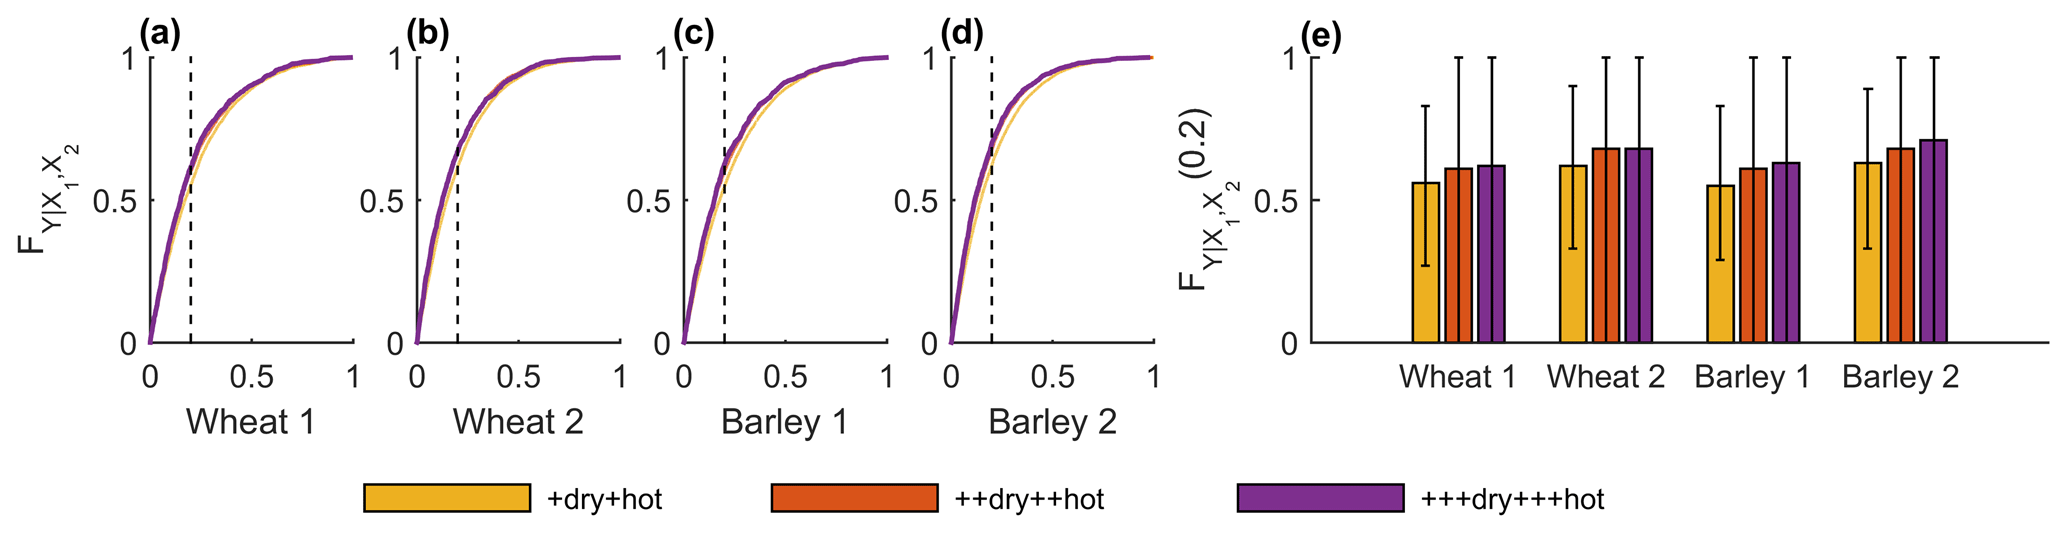
Figure 6Conditional probability distributions of crop yield anomalies over each region of provinces (wheat in Region 1 a, wheat in Region 2 b, barley in Region 1 c and barley in Region 2 d) under moderate (+dry+hot, yellow), severe (++dry++hot, orange) and extreme (+++dry+++hot, purple) compound dry and hot conditions (see Table 1). (e) Conditional probabilities of not exceeding the crop loss threshold (20th percentile – vertical dashed line in a–d) for each severity level of compound dry and hot conditions given by . Uncertainty ranges illustrate the 95 % confidence intervals.
While Fig. 6 illustrates the same severity levels for the different hazards, Fig. 7 illustrates crop loss for a range of different combinations of severity levels of dry and hot conditions (e.g. extreme dry conditions combined with moderate, severe and extreme hot conditions and vice versa) starting from the 50th percentile of PMAM and . When PMAM or are below or above the median, the probability of crop loss is always higher than 40 %. Similarly to Fig. 6, the increase in crop loss with the severity of drought and heat stress is evident (Fig. 7). The higher likelihood of crop loss in Region 2, particularly for barley, is also consistent with Fig. 6. Moreover, the results indicate that droughts are typically associated with higher probabilities of crop loss than heatwaves at the same severity level. This finding suggests that drought stress causes more damage to crop yields than heat stress, even for lower values of stress.
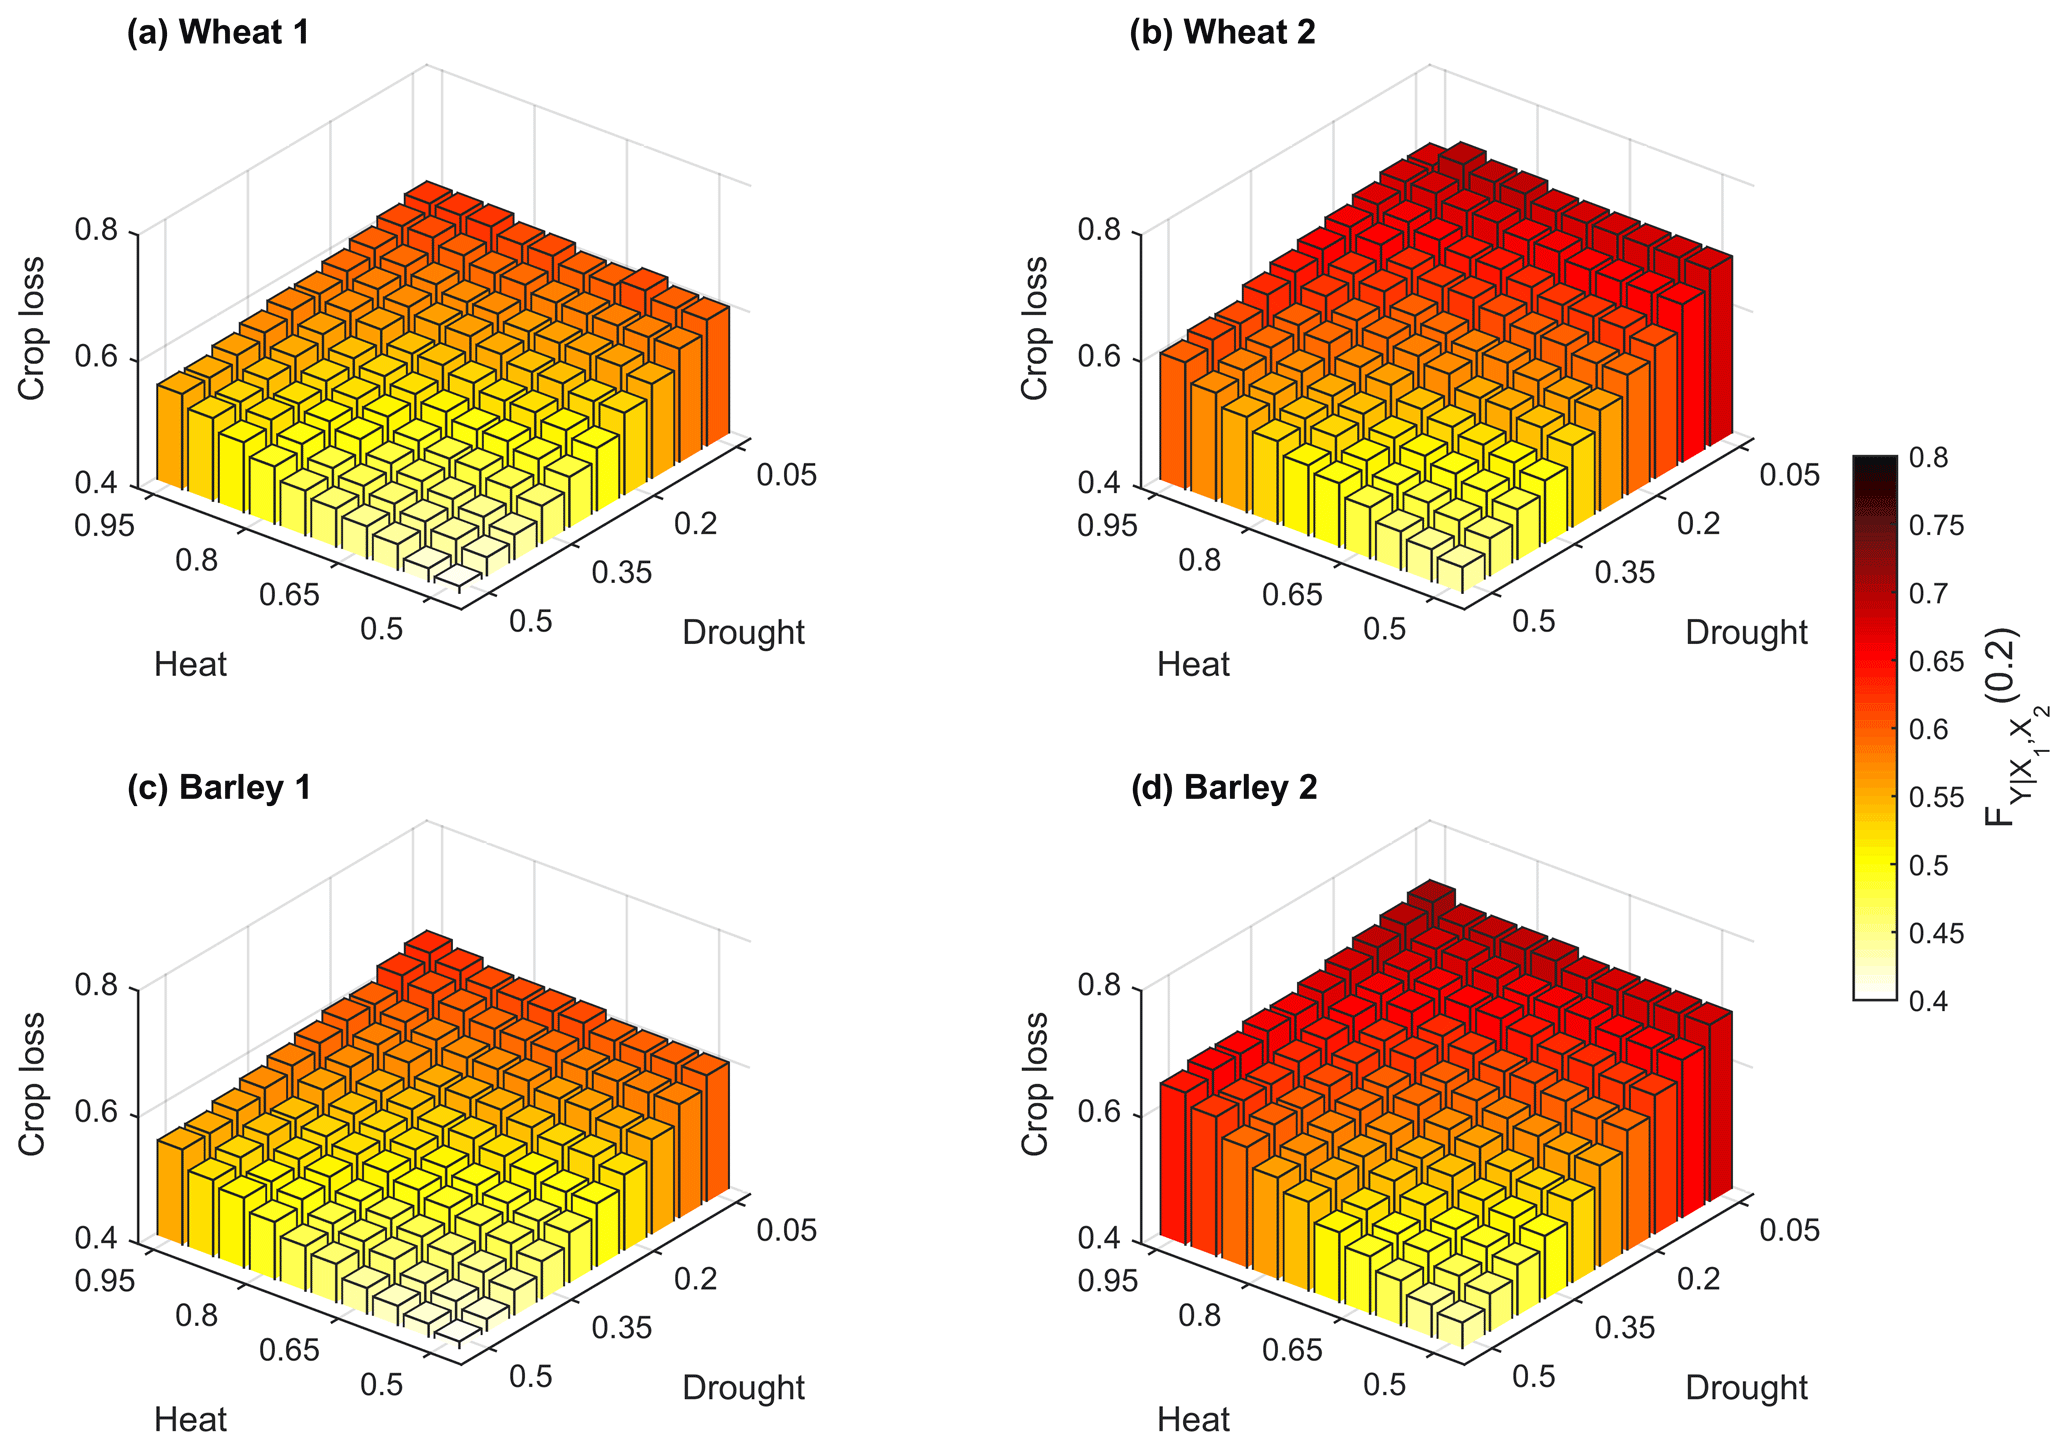
Figure 7Conditional probability of crop loss given by (bar height) for both regions and cereals (wheat in Region 1 a, wheat in Region 2 b, barley in Region 1 c and barley in Region 2 d) for different combinations of severity levels of dry and hot conditions. The x axis indicates the PMAM percentiles (drought), and the y axis indicates the percentile (heat).
In all cases, the additional effect of compound dry and hot conditions is larger when starting from only hot conditions, compared to when starting from only dry conditions (Fig. 8 for moderate stress, Fig. A3a and b for severe and extreme stress). The estimates are based on Eqs. (4) and (5). Depending on the cereal and region, the difference between drought stress and compound conditions may vary from 8 % (barley in Region 1) to 11 % (barley in Region 2). In contrast, the difference between heat stress and compound conditions may vary between 19 % (barley in Region 2) to 29 % (wheat in Region 2). Uncertainties are large for these estimates and increase with the severity of the events (Fig. A3). Consistent with Fig. 7 these findings suggest that drought stress is the major driver of crop loss associated with compound drought and heat.
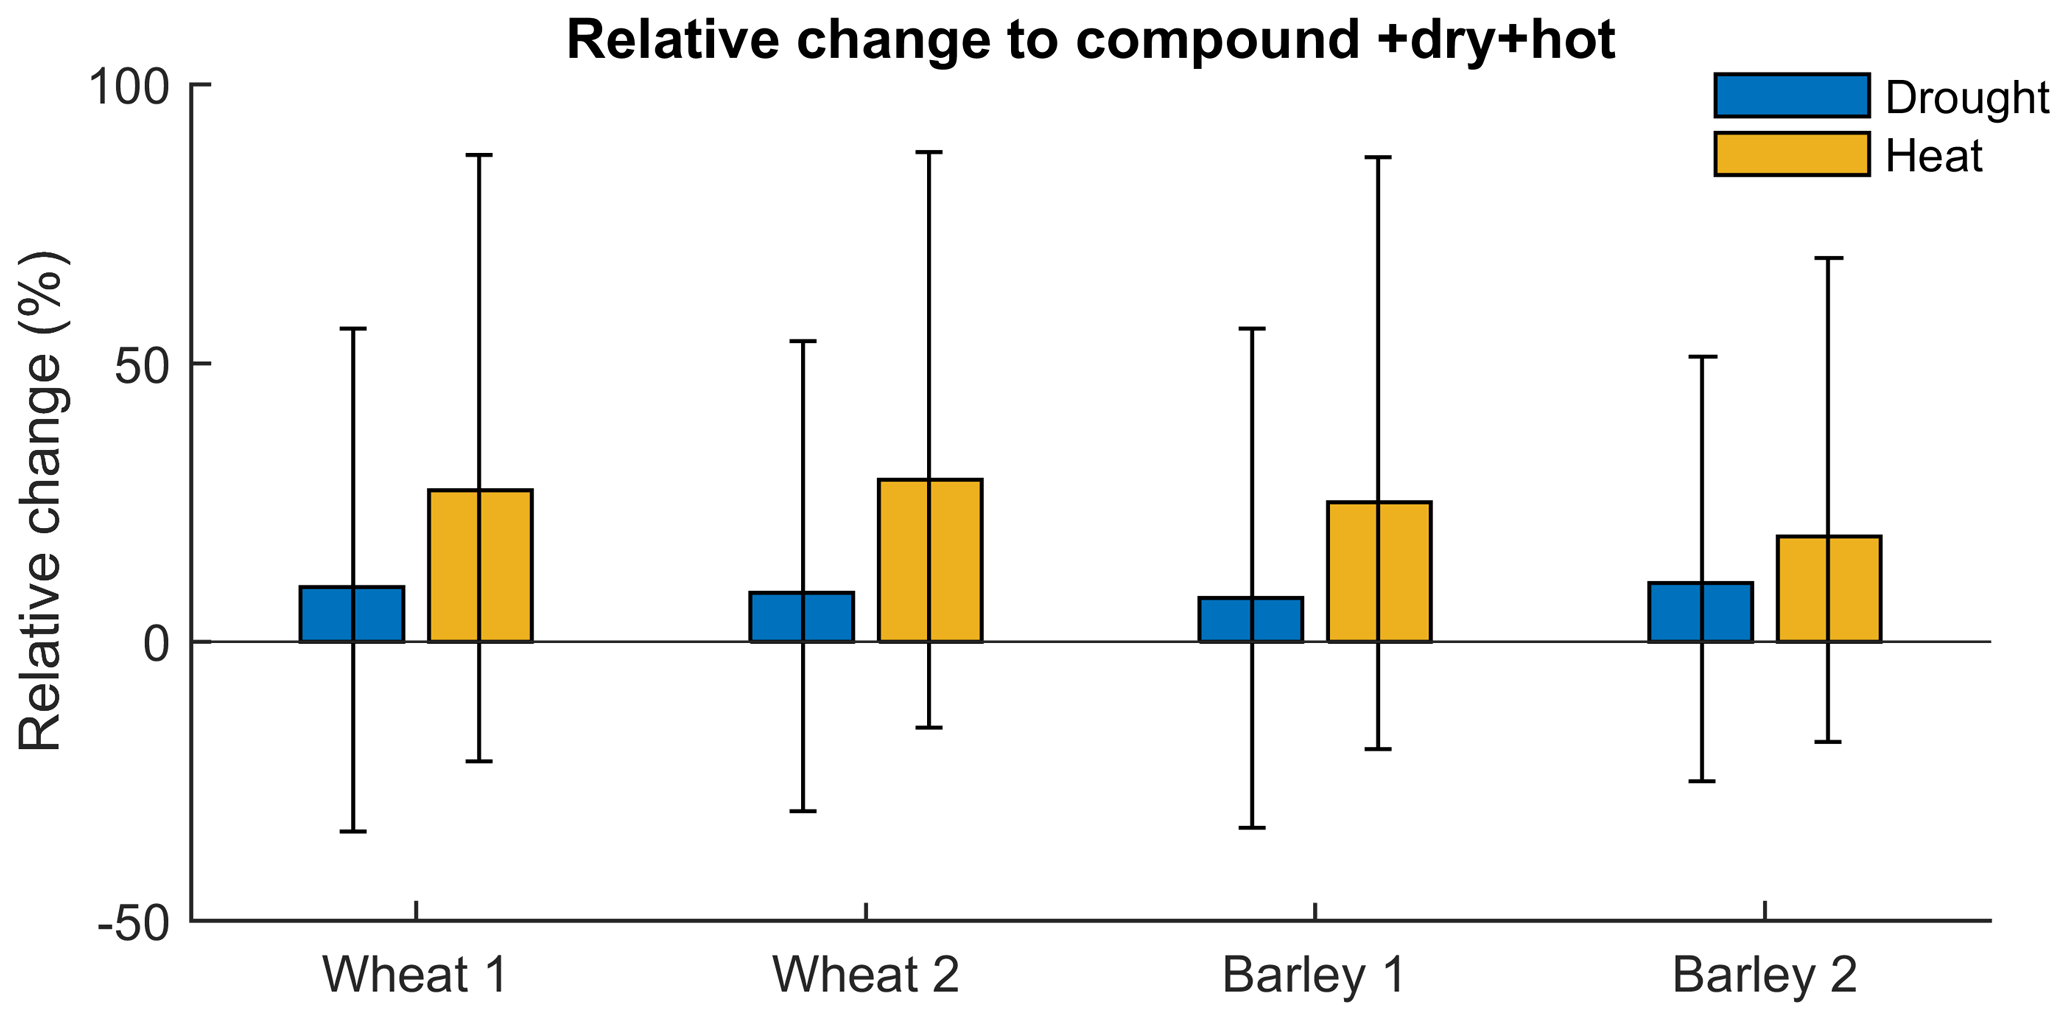
Figure 8Difference in probability of crop loss from dry (blue) and hot (orange) to compound dry and hot conditions in wheat (left) and barley (right) for Regions 1 and 2. Shown are the best estimates for moderate dry and hot (+dry+hot) conditions (bar height) and associated 95 % confidence intervals.
We have modelled the trivariate relationship between and PMAM and wheat and barley yields in two regions in Spain using nested copulas. We found that the likelihood of crop loss increases with the severity of the compound dry and hot conditions and that compound drought and heat always increases the likelihood of crop loss. Moreover, our findings suggest that drought stress is not required to be as extreme as heat stress to cause the same adverse impact on crop yields. Hence drought is the more dominant driver of crop loss, when considering compound drought and heat.
Although the use of different methodologies and spatio-temporal scales and the focus on different cereals and regions make a comparison between studies difficult, our findings are consistent with previous work. Using bivariate return periods of combined climate conditions, Zscheischler et al. (2017) have shown how linear models based directly on precipitation and temperature (and not the respective bivariate return period) may underestimate the explained variability in crop yields and that in several countries maize yields decrease with dry and hot conditions. Based on a meta-Gaussian model at the national level, Feng et al. (2019) have also shown that compound dry and hot extremes lead to larger impacts on maize yields than the individual hazards across five major maize-producing countries.
In terms of the relative contributions of drought and heat conditions, a variety of studies at the national scale have found that the response varies from country to country. Feng et al. (2019) have found that in China, France and Romania, higher chances of maize loss under dry conditions with normal temperatures (rather than under hot conditions with normal precipitation) can be expected, while in the USA and Argentina, higher chances of maize loss under hot conditions with normal precipitation (rather than under dry conditions with normal temperatures) can be expected. In contrast, Zscheischler et al. (2017) have found that in countries such as Lithuania, Luxembourg and the UK, maize yields increase under hot and wet conditions, likely because of the importance of summer precipitation for the crop vegetative cycle and the relatively cooler climate in those countries.
Although previous studies have discussed that maximum temperature might be the best predictor variable for yield variability in most countries (Zscheischler et al., 2017), our study highlights that in Spain crop loss of wheat and barley is more sensitive to dryness than to hot conditions. This finding agrees with the rainfed practices adopted in the wheat and barley cultivation in Spain. In fact, the nesting structure of the trivariate models adopted in the present study privileges the stronger dependency between yields and precipitation, rather than between yields and temperature or between precipitation and temperature (Fig. 3). Though irrigated crops typically produce higher yields, the pressure in water resources is already increasing the deficit between water supplies and water demand in Spain (Rodríguez Díaz et al., 2007). Hence, understanding climate risks for rainfed crops is crucial to address the current water management challenges for agricultural practices in Mediterranean regions.
Higher probabilities of crop loss under drought and/or heat stress are generally expected in the southern region of Spain, in comparison to the northern region (Figs. 6 and 7), in agreement with the higher temperatures and lower rainfall amounts observed in the south (Ribeiro et al., 2019a; IM and AEMET, 2011). In the case of wheat losses, this finding is in agreement with previous work which focused on drought risks for the same crops and the same region (assessed based on remote sensing and hydro-meteorological drought indicators; Ribeiro et al., 2019b). However, Ribeiro et al. (2019b) identified a higher likelihood of barley loss with drought in the northern region. This discrepancy underlines the importance of addressing the interaction between compound dry and hot conditions and the associated impacts on vegetation. For instance, compound dry and hot conditions have a larger impact on the carbon uptake potential than the sum of the individual impacts (Zscheischler et al., 2014), highlighting the relevance of interactions between multiple stressors.
We found that for barley in Region 2, drought is the least dominant driver in comparison to the other cereals and regions. Barley in Region 2 shows the highest difference between drought and compound dry and hot conditions and the lowest difference between heat stress and compound conditions (Fig. 8). This suggests that for both cereals and in both regions, barley in Region 2 is the case where the compound and possibly interacting effects of drought and heat are most relevant. Also note that in this case the CDFs between the dry and hot and dry or hot conditions are more differentiated from each other for the severe and extreme stress (Fig. A2). This is consistent with a recent study at the province level, which recommended that crop production in Spain should focus more on wheat production given that most provinces displayed lower levels of wheat loss with drought in comparison to barley loss (Ribeiro et al., 2019a). This finding is also consistent with Figs. 6 and 7.
The uncertainties associated with the parametric statistical model were assessed with a large number of sampled distributions with the same sample size as the observations. In some of these distributions, drought or heat alone may cause more damage than concurrent drought and heat (lower uncertainty bound is below 0 in Figs. 8 and A3). This highlights the challenges of estimating the likelihood of rare events in two- or three-dimensional probability distributions with limited sample sizes (Serinaldi, 2013, 2016; Zscheischler and Fischer, 2020). For the same reason, the wheat loss in Region 2 when PMAM is below the 5th percentile in Fig. 7 slightly decreases when the threshold of changes from the 10th percentile to the 5th percentile (where an increase would be expected as in the other cases). These features are associated with the uncertainties in the estimation procedure, which may be particularly large for extreme values, and it would be difficult to find a physical explanation for such a feature. Note that the uncertainties increase with the increasing severity of the compound dry and hot conditions (Fig. A3) due to the rapid decrease in available samples in the corners of the three-dimensional probability distribution. Nevertheless, the best estimates (bars in Figs. 8 and A3) show indeed that compound dry and hot extremes contribute to an increase in yield loss. In the general sense, the biophysiological explanation for the combination of environmental drivers leading to stronger yield reductions relates to the crop's requirements of water and thermal conditions during the key phenological stage in the analysis. The selection of the climate variables during spring corresponds to the reproductive phase of the plants and when vegetation is photosynthetically more active, and the combined effect of water and heat stress during this period is critical for the crop's health leading to yield decrease. During this stage of formation of the grains the dry and hot extremes may accelerate the maturation, affecting the size, number and weight of the grains and consequently affecting the crop's harvests in quantity and quality (Balla et al., 2011; COPA-COGECA, 2003; Nicolas et al., 1984; Qaseem et al., 2019; Talukder et al., 2014).
Following the work by Okhrin and Ristig (2014), here we considered nesting copulas of the same family only, as more complex structures would be difficult to implement in general. Vine copulas might offer an alternative that is also appropriate for higher dimensions (Bevacqua et al., 2017), when considering for instance more driver variables. Nevertheless, in comparison with previous studies based on bivariate models only, we argue that the statistical modelling based on NACs is a good compromise between complexity and the trivariate dimension.
The present study assessed how compound drought and heat enhances losses of wheat and barley in two major dryland areas in Spain. We showed that nested Archimedean copulas can successfully model the trivariate joint distribution between spring maximum temperature, spring precipitation and yields to estimate conditional probabilities of crop loss under different severity levels of hot and dry conditions. The strongest dependence exists between spring precipitation and yields and is best captured by a Frank copula. Our results demonstrate that the probability of crop loss increases with the severity of compound dry and hot conditions. Furthermore, the likelihood of wheat and barley loss increases when drought or heat, respectively, are aggravated to form compound dry and hot conditions in both regions. Overall, the likelihood of crop loss in the southern region is larger, in particular for barley. For both cereals and regions, the likelihood of crop loss increases more with increasing drought stress than with heat stress, suggesting that drought plays a dominant role in the compound event. Our results illustrate the additional value of using trivariate copula modelling to estimate the compounding effects of dry and hot extremes on the risk of crop failure. In operational practice, this research can contribute to the design of supporting tools and provide guidance in the decision-making process in agricultural practices to minimise crop losses related to climate hazards.
Table A1As in Table 2 with respect to the possible bivariate pairs of crop yield (u1), precipitation (u2) and maximum temperature (u3) and corresponding Kendall's' correlation (τ). Maximum values of τ are denoted in bold for each cereal and region indicating the pair of variables with the strongest relationship.
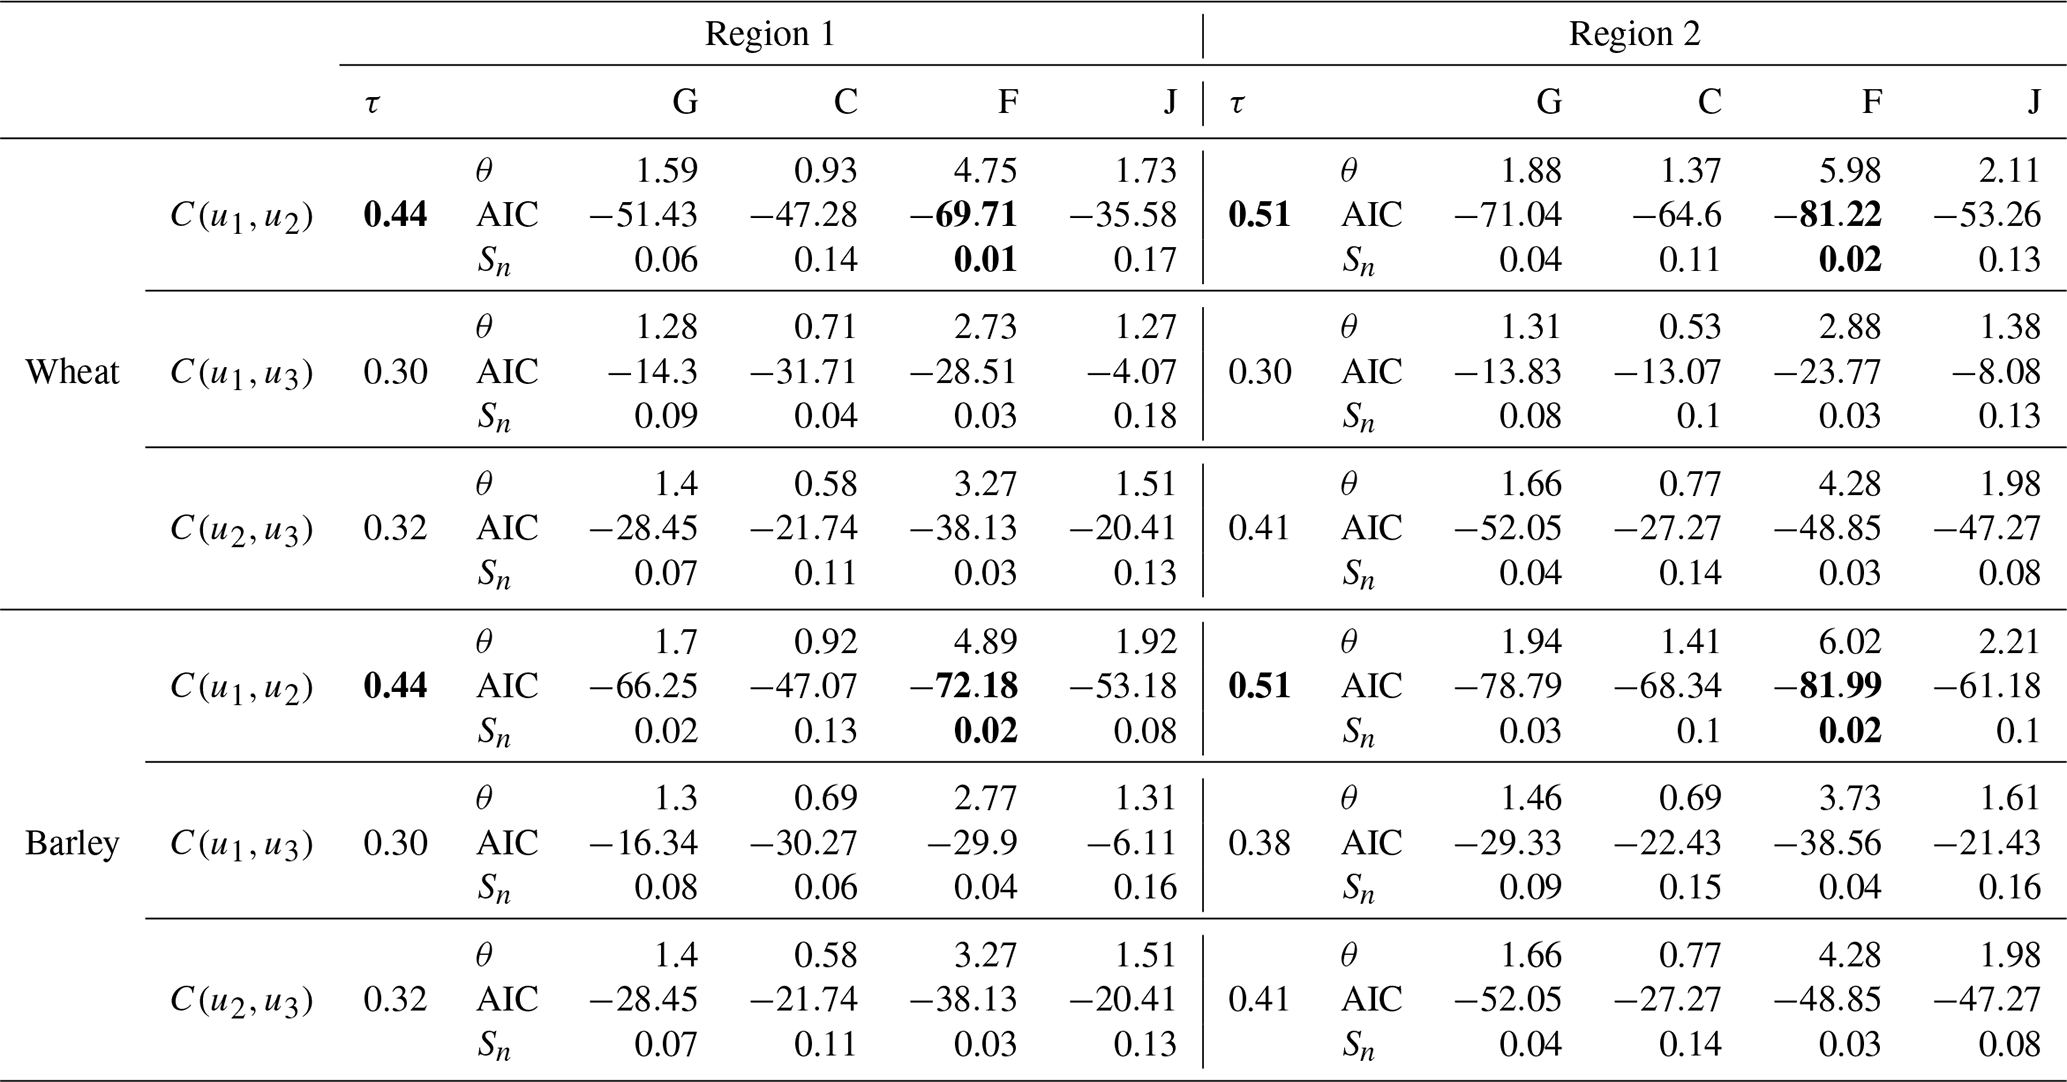
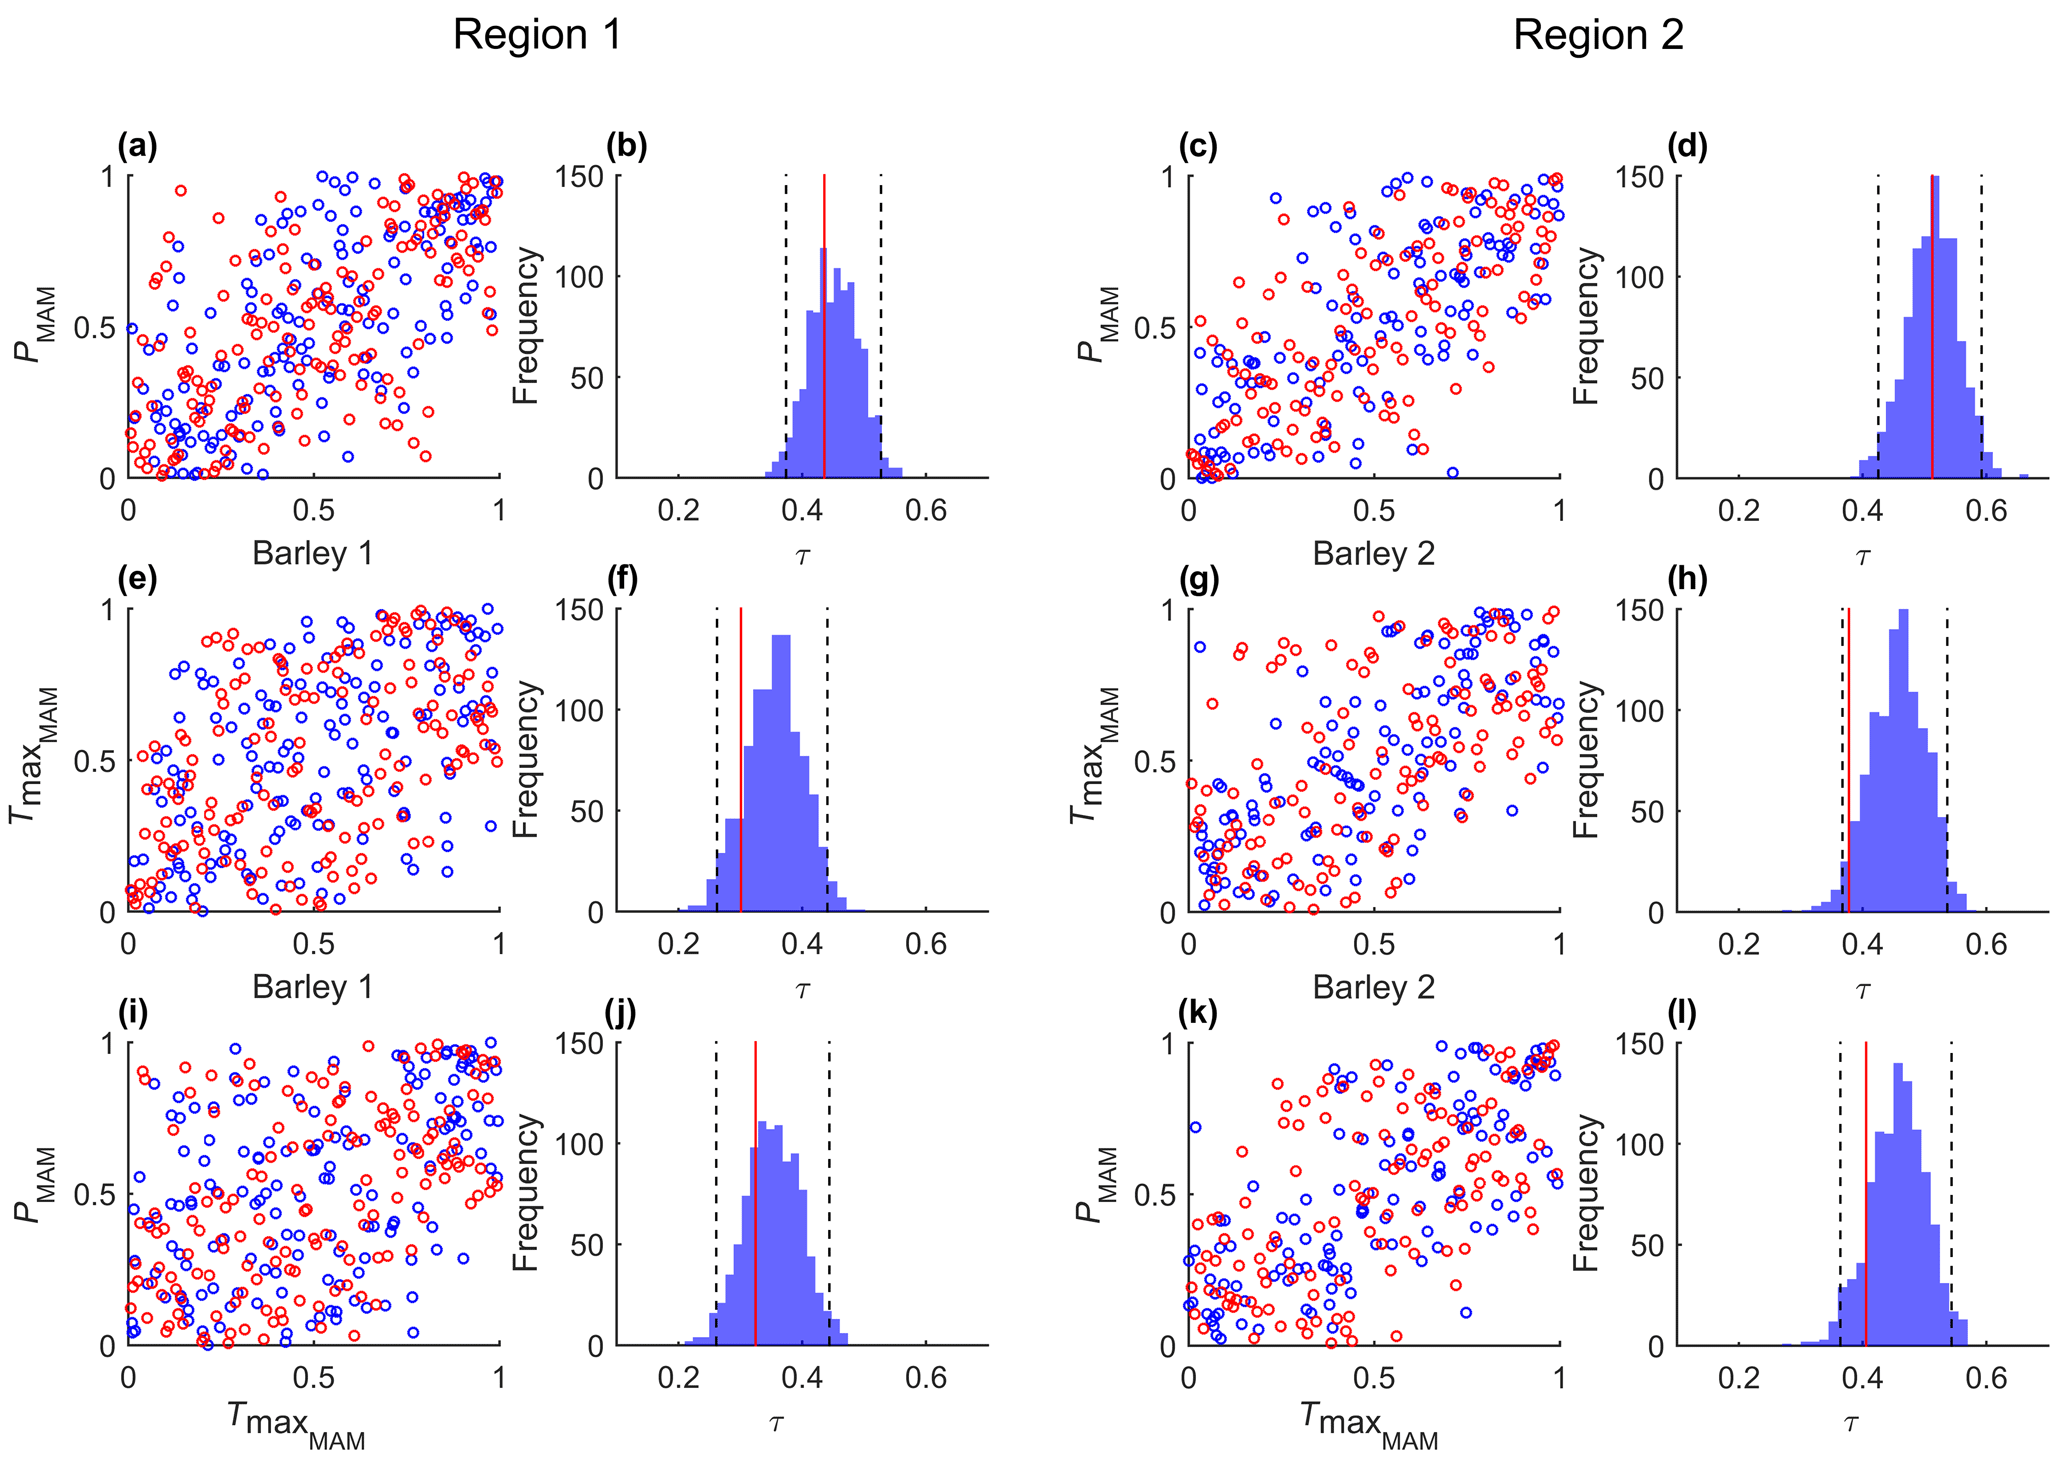
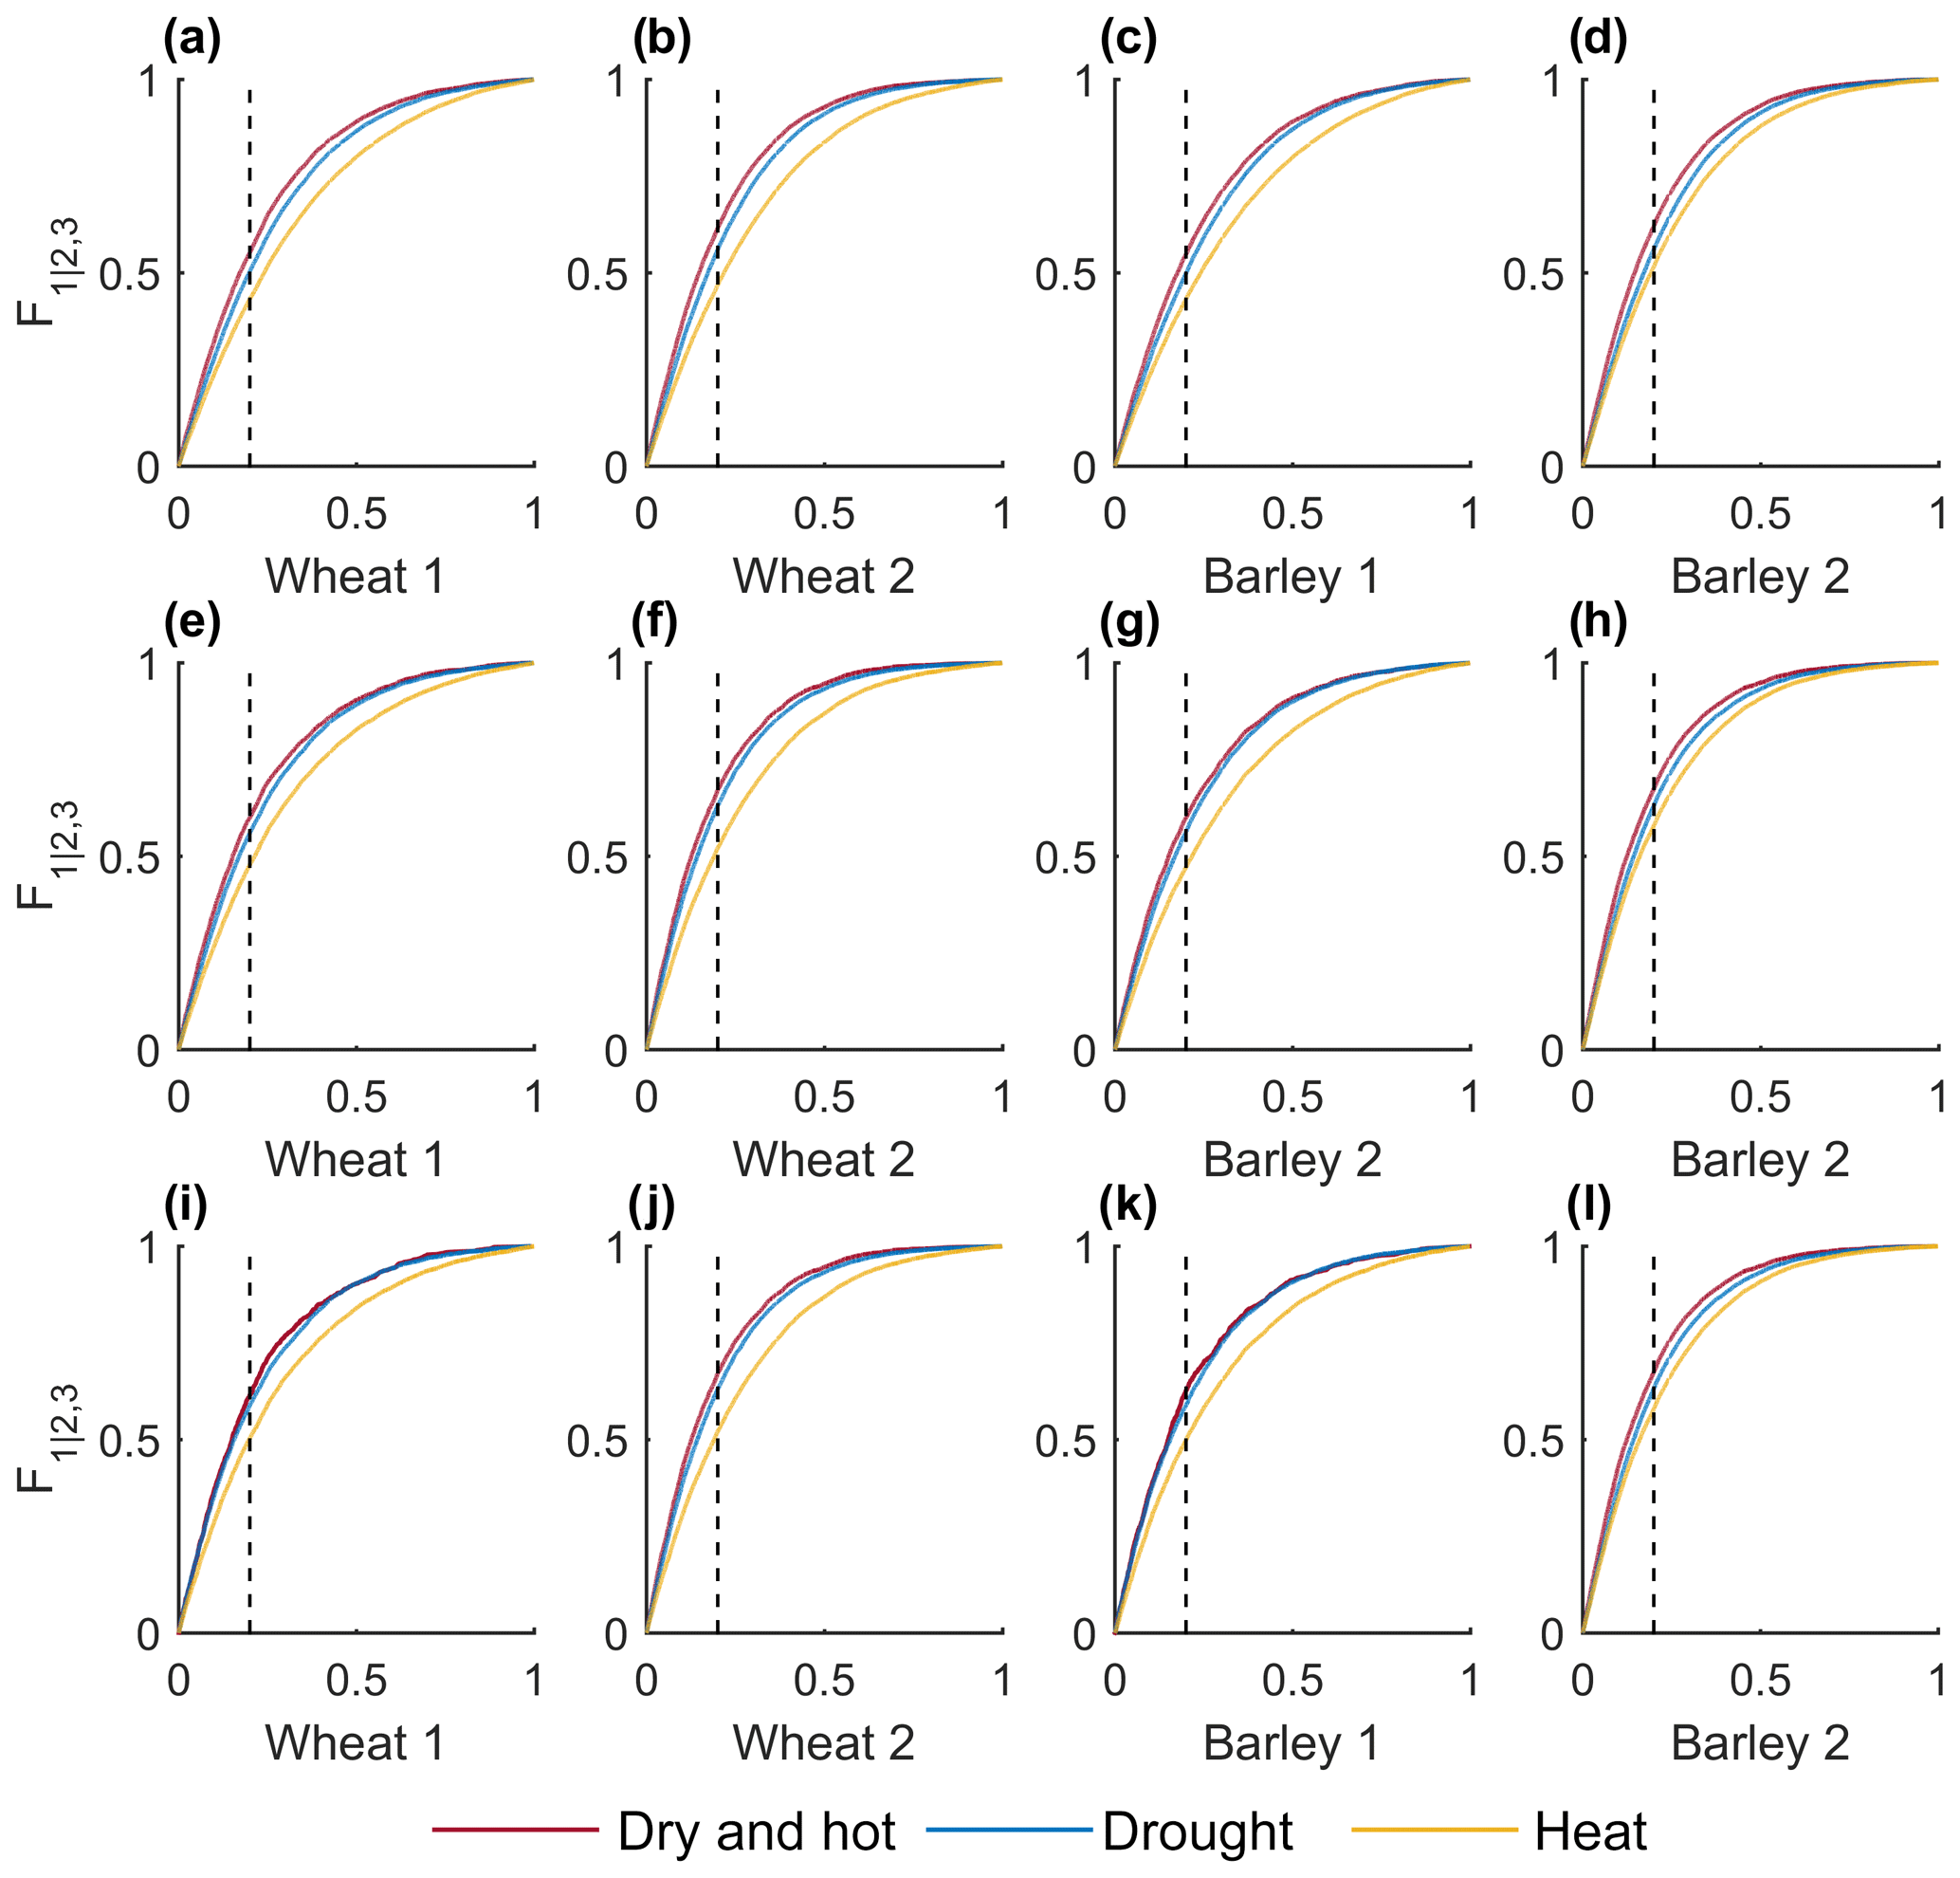
Figure A2Conditional probability distributions of crop yield anomalies over each region under hot (yellow), dry (blue) or compound dry and hot (red) conditions under moderate (a–d), severe (e–h) and extreme conditions (i–l).

The statistical analysis was performed with R software using the packages “copula” (https://doi.org/10.18637/jss.v034.i09, Kojadinovic and Yan, 2010 and “HAC” (https://doi.org/10.18637/jss.v058.i04, Okhrin and Ristig, 2014). The R scripts are available at http://impecaf.rd.ciencias.ulisboa.pt/Rcode_BGpaper.html (last access: 24 September 2020, Ribeiro et al., 2020). The precipitation and maximum-temperature gridded values are publicly available from the Climatic Research Unit (CRU) TS4.01 dataset by Harris et al. (2014) (https://doi.org/10.1002/joc.3711). The Spanish crop yield is published by the Spanish Ministry of Agriculture, Fisheries and Food (2019) in their statistical yearbooks, which can be consulted at https://www.mapa.gob.es/es/estadistica/temas/publicaciones/anuario-de-estadistica/ (last access: 9 November 2019). The CORINE Land Cover datasets are publicly available at https://land.copernicus.eu/pan-european/corine-land-cover (last access: 9 November 2019, CGLS, 2019).
AFSR analysed the data, produced the figures and drafted the manuscript. JZ supervised the overall work with an emphasis on the design of the statistical framework. AR and CMG helped to supervise the work and conceived the original idea together with AFSR. PP managed the acquisition and analysis of the crop yield data. All the authors discussed the results, provided critical feedback, helped shape the research and analysis, and contributed to the final manuscript.
The authors declare that they have no conflict of interest.
This article is part of the special issue “Understanding compound weather and climate events and related impacts (BG/ESD/HESS/NHESS inter-journal SI)”. It is not associated with a conference.
Andreia Filipa Silva Ribeiro is thankful to the COST Action CA17109 for a Short Term Scientific Mission (STSM) grant and the young academics support from the Faculty of Science of the University of Bern to develop the present work.
This work was partially supported by Portuguese funds through FCT (Fundação para a Ciência e a Tecnologia, Portugal) under the projects CLMALERT (project no. ERA4CS/0005/2016) and IMPECAF (project no. PTDC/CTA-CLI/28902/2017). Andreia Filipa Silva Ribeiro was supported by FCT (grant no. PD/BD/114481/2016). Jakob Zscheischler received funding from the Swiss National Science Foundation (Ambizione grant no. 179876).
This paper was edited by Bart van den Hurk and reviewed by three anonymous referees.
Balla, K., Rakszegi, M., Li, Z., Bekes, F., Bencze, S., and Veisz, O.: Quality of winter wheat in relation to heat and drought shock after anthesis, Czech J. Food Sci., 29, 117–128, 2011. a
Bastos, A., Gouveia, C. M., Trigo, R. M., and Running, S. W.: Analysing the spatio-temporal impacts of the 2003 and 2010 extreme heatwaves on plant productivity in Europe, Biogeosciences, 11, 3421–3435, https://doi.org/10.5194/bg-11-3421-2014, 2014. a
Ben-Ari, T., Adrian, J., Klein, T., Calanca, P., Van der Velde, M., and Makowski, D.: Identifying indicators for extreme wheat and maize yield losses, Agr. Forest Meteorol., 220, 130–140, https://doi.org/10.1016/j.agrformet.2016.01.009, 2016. a, b
Bevacqua, E., Maraun, D., Hobæk Haff, I., Widmann, M., and Vrac, M.: Multivariate statistical modelling of compound events via pair-copula constructions: analysis of floods in Ravenna (Italy), Hydrol. Earth Syst. Sci., 21, 2701–2723, https://doi.org/10.5194/hess-21-2701-2017, 2017. a
Bokusheva, R., Kogan, F., Vitkovskaya, I., Conradt, S., and Batyrbayeva, M.: Satellite-based vegetation health indices as a criteria for insuring against drought-related yield losses, Agr. Forest Meteorol., 220, 200–206, https://doi.org/10.1016/j.agrformet.2015.12.066, 2016. a
Buras, A., Rammig, A., and Zang, C. S.: Quantifying impacts of the 2018 drought on European ecosystems in comparison to 2003, Biogeosciences, 17, 1655–1672, https://doi.org/10.5194/bg-17-1655-2020, 2020. a, b
CGLS (Copernicus Global Land service): CORINE Land Cover (CLC) inventory, available at: https://land.copernicus.eu/pan-european/corine-land-cover, last access: 9 November 2019. a
COPA-COGECA: Assessment of the impact of the heat wave and drought of the summer 2003 on agriculture and forestry, Committee of Agricultural Organisations in the European Union General Committee for Agricultural Cooperation in the European Union, Brussels, p. 15, 2003. a, b, c
Del Moral, L. G., Rharrabti, Y., Villegas, D., and Royo, C.: Evaluation of grain yield and its components in durum wheat under Mediterranean conditions: an ontogenic approach, Agron. J., 95, 266–274, 2003. a
Durante, F. and Sempi, C.: Principles of Copula Theory, Taylor and Francis, New York, https://doi.org/10.1201/b18674, 2015. a, b
Feng, S., Hao, Z., Zhang, X., and Hao, F.: Probabilistic evaluation of the impact of compound dry-hot events on global maize yields, Sci. Total Environ., 689, 1228–1234, https://doi.org/10.1016/j.scitotenv.2019.06.373, 2019. a, b
Ferrise, R., Moriondo, M., and Bindi, M.: Probabilistic assessments of climate change impacts on durum wheat in the Mediterranean region, Nat. Hazards Earth Syst. Sci., 11, 1293–1302, https://doi.org/10.5194/nhess-11-1293-2011, 2011. a
Garcia-Herrera, R., Díaz, J., Trigo, R. M., Luterbacher, J., and Fischer, E. M.: A review of the european summer heat wave of 2003, Crit. Rev. Environ. Sci. Technol., 40, 267–306, https://doi.org/10.1080/10643380802238137, 2010. a
Gaupp, F., Hall, J., Hochrainer-stigler, S., and Dadson, S.: Changing risks of simultaneous global breadbasket failure, Nat. Clim. Change, 10, 54–57, https://doi.org/10.1038/s41558-019-0600-z, 2019. a
Górecki, J., Hofert, M., and Holeňa, M.: On structure, family and parameter estimation of hierarchical Archimedean copulas, J. Stat. Comput. Simul., 87, 3261–3324, 2017. a
Harris, I., Jones, P. D., Osborn, T. J., and Lister, D. H.: Updated high-resolution grids of monthly climatic observations – the CRU TS3.10 Dataset, Int. J. Climatol., 34, 623–642, https://doi.org/10.1002/joc.3711, 2014. a, b
Iglesias, A. and Quiroga, S.: Measuring the risk of climate variability to cereal production at five sites in Spain, Climate Res., 34, 47–57, 2007. a
IM and AEMET: Iberian climate atlas. Air Temperature and Precipitation (1971–2000), Instituto de Meteorologia Portugês (IM) and Agencia Estatal de Meteorologia Española (AEMET), 2011. a
IPCC: Managing the Risks of Extreme Events and Disasters to Advance Climate Change Adaptation. A Special Report of Working Groups I and II of the Intergovernmental Panel on Climate Change, edited by: Field, C. B., Barros, V., Stocker, T. F., Qin, D., Dokken, D. J., Ebi, K. L., Mastrandrea, M. D., Mach, K. J., Plattner, G.-K., Allen, S. K., Tignor, M., and Midgley, P. M., Cambridge University Press, Cambridge, UK, and New York, NY, USA, 582 pp., 2012. a
Kojadinovic, I. and Yan, J.: Modeling Multivariate Distributions with Continuous Margins Using the copula R Package, J. Stat. Softw., 34, 1–20, https://doi.org/10.18637/jss.v034.i09, 2010. a, b
Leonard, M., Westra, S., Phatak, A., Lambert, M., van den Hurk, B., Mcinnes, K., Risbey, J., Schuster, S., Jakob, D., and Stafford-Smith, M.: A compound event framework for understanding extreme impacts, WIRES Clim. Change, 5, 113–128, https://doi.org/10.1002/wcc.252, 2014. a
Loboda, T., Krankina, O., Savin, I., Kurbanov, E., and Hall, J.: Land management and the impact of the 2010 extreme drought event on the agricultural and ecological systems of European Russia, in: Land-Cover and Land-Use Changes in Eastern Europe after the Collapse of the Soviet Union in 1991, Springer, Cham, 173–192, 2017. a
Madadgar, S., AghaKouchak, A., Farahmand, A., and Davis, S. J.: Probabilistic estimates of drought impacts on agricultural production, Geophys. Res. Lett., 44, 7799–7807, https://doi.org/10.1002/2017GL073606, 2017. a
Nelsen, R. B.: An Introduction to Copulas, in: Springer Series in Statistics, 2nd edn., Springer-Verlag New York, https://doi.org/10.1007/0-387-28678-0, 2006. a, b
Nicolas, M. E., Gleadow, R. M., and Dalling, M. J.: Effects of drought and high temperature on grain growth in wheat, Funct. Plant Biol., 11, 553–566, 1984. a
Okhrin, O. and Ristig, A.: Hierarchical archimedean copulae: The HAC package, J. Stat. Softw., 58, 1–20, https://doi.org/10.18637/jss.v058.i04, 2014. a, b, c, d, e, f, g, h, i
Peña-Gallardo, M., Vicente-Serrano, S. M., Domínguez-Castro, F., and Beguería, S.: The impact of drought on the productivity of two rainfed crops in Spain, Nat. Hazards Earth Syst. Sci., 19, 1215–1234, https://doi.org/10.5194/nhess-19-1215-2019, 2019. a
Qaseem, M. F., Qureshi, R., and Shaheen, H.: Effects of pre-anthesis drought, heat and their combination on the growth, yield and physiology of diverse wheat (Triticum aestivum L.) genotypes varying in sensitivity to heat and drought stress, Sci. Rep., 9, 1–12, 2019. a
Ribeiro, A. F., Russo, A., Gouveia, C. M., and Páscoa, P.: Copula-based agricultural drought risk of rainfed cropping systems, Agric. Water Manage., 223, https://doi.org/10.1016/j.agwat.2019.105689, 2019a. a, b, c, d, e
Ribeiro, A. F. S., Russo, A., Gouveia, C. M., Páscoa, P., and Pires, C. A. L.: Probabilistic modelling of the dependence between rainfed crops and drought hazard, Nat. Hazards Earth Syst. Sci., 19, 2795–2809, https://doi.org/10.5194/nhess-19-2795-2019, 2019b. a, b, c, d, e, f
Ribeiro, A. F. S., Russo, A., Gouveia, C. M., and Páscoa, P.: Modelling drought-related yield losses in Iberia using remote sensing and multiscalar indices, Theor. Appl. Climatol., 136, 203–220, https://doi.org/10.1007/s00704-018-2478-5, 2019c. a, b, c
Ribeiro, A. F. S., Russo, A., Gouveia, C. M., Páscoa, P., and Zscheischler, J.: Rcode for risk of crop failure due to compound dry and hot extremes estimated with nested copulas, IMPECAF, available at: http://impecaf.rd.ciencias.ulisboa.pt/Rcode_BGpaper.html (last access: 24 September 2020). a
Rodríguez Díaz, J. A., Weatherhead, E. K., Knox, J. W., and Camacho, E.: Climate change impacts on irrigation water requirements in the Guadalquivir river basin in Spain, Regio. Environ. Change, 7, 149–159, https://doi.org/10.1007/s10113-007-0035-3, 2007. a
Salvadori, G. and De Michele, C.: On the Use of Copulas in Hydrology: Theory and Practice, J. Hydrol. Eng., 12, 369–380, https://doi.org/10.1061/(ASCE)1084-0699(2007)12:4(369), 2007. a, b
Salvadori, G., Durante, F., De Michele, C., Bernardi, M., and Petrella, L.: A multivariate copula-based framework for dealing with hazard scenarios and failure probabilities, Water Resour. Res., 52, 3701–3721, https://doi.org/10.1002/2015WR017225, 2016. a
Schumacher, D. L., Keune, J., Van Heerwaarden, C. C., de Arellano, J. V.-G., Teuling, A. J., and Miralles, D. G.: Amplification of mega-heatwaves through heat torrents fuelled by upwind drought, Nat. Geosci., 12, 712–717, 2019. a, b
Serinaldi, F.: An uncertain journey around the tails of multivariate hydrological distributions, Water Resour. Res., 49, 6527–6547, https://doi.org/10.1002/wrcr.20531, 2013. a
Serinaldi, F.: Can we tell more than we can know? The limits of bivariate drought analyses in the United States, Stoch. Environ. Res. Risk A., 30, 1691–1704, https://doi.org/10.1007/s00477-015-1124-3, 2016. a
Sklar, A.: Fonctions de Répartition à n Dimensions et Leurs Marges, Institut Statistique de l'Université de Paris, 8, 229–231, 1959. a, b
Spanish Ministry of Agriculture, Fisheries and Food: Statistical Yearbook, available at: https://www.mapa.gob.es/es/estadistica/temas/publicaciones/anuario-de-estadistica/, last access: 9 November 2019. a
Talukder, A., McDonald, G. K., and Gill, G. S.: Effect of short-term heat stress prior to flowering and early grain set on the grain yield of wheat, Field Crops Res., 160, 54–63, 2014. a
Vicente-Serrano, S. M., Cuadrat-Prats, J. M., and Romo, A.: Early prediction of crop production using drought indices at different timescales and remote sensing data: application in the Ebro Valley (north-east Spain), Int. J. Remote Sens., 27, 511–518, https://doi.org/10.1080/01431160500296032, 2006. a
Zscheischler, J. and Fischer, E.: The record-breaking compound hot and dry 2018 growing season in Germany, Weather Clim. Extr., 29, 100270, https://doi.org/10.1016/j.wace.2020.100270, 2020. a
Zscheischler, J. and Seneviratne, S. I.: Dependence of drivers affects risks associated with compound events, Sci. Adv., 3, e1700263, https://doi.org/10.1126/sciadv.1700263, 2017. a
Zscheischler, J., Michalak, A. M., Schwalm, C., Mahecha, M. D., Huntzinger, D. N., Reichstein, M., Berthier, G., Ciais, P., Cook, R. B., El-Masri, B., Huang, M., Ito, A., Jain, A., King, A., Lei, H., Lu, C., Mao, J., Peng, S., Poulter, B., Ricciuto, D., Shi, X., Tao, B., Tian, H., Viovy, N., Wang, W., Wei, Y., Yang, J., and Zeng, N.: Impact of large-scale climate extremes on biospheric carbon fluxes: An intercomparison based on MsTMIP data, Global Biogeochem. Cy., 28, 585–600, https://doi.org/10.1002/2014GB004826, 2014. a, b
Zscheischler, J., Orth, R., and Seneviratne, S. I.: Bivariate return periods of temperature and precipitation explain a large fraction of European crop yields, Biogeosciences, 14, 3309–3320, https://doi.org/10.5194/bg-14-3309-2017, 2017. a, b, c, d
Zscheischler, J., Westra, S., Van Den Hurk, B. J., Seneviratne, S. I., Ward, P. J., Pitman, A., Aghakouchak, A., Bresch, D. N., Leonard, M., Wahl, T., and Zhang, X.: Future climate risk from compound events, Nat. Clim. Change, 8, 469–477, https://doi.org/10.1038/s41558-018-0156-3, 2018. a
Zscheischler, J., Martius, O., Westra, S., Bevacqua, E., R., C., Horton, R. M., van den Hurk, B., AghaKouchak, A., Jézéquel, A., Mahecha, M. D., Maraun, D., Ramos, A. M., Ridder, N., Thiery, W., and Vignotto, E.: A typology of compound weather and climate events, Nat. Rev. Earth Environ., 1, 333–347, https://doi.org/10.1038/s43017-020-0060-z, 2020. a