the Creative Commons Attribution 4.0 License.
the Creative Commons Attribution 4.0 License.
 | 13 Oct 2020
Alpine Holocene tree-ring dataset: age-related trends in the stable isotopes of cellulose show species-specific patterns
Malin M. Ziehmer
Kurt Nicolussi
Christian Schlüchter
Markus Leuenberger
Stable isotopes in tree-ring cellulose are important tools for climatic reconstructions even though their interpretation could be challenging due to nonclimate signals, primarily those related to tree aging. Previous studies on the presence of tree-age-related trends during juvenile as well as adult growth phases in δD, δ18O, and δ13C time series yielded variable results that are not coherent among different plant species. We analyzed possible trends in the extracted cellulose of tree rings of 85 larch trees and 119 cembran pine trees, i.e., in samples of one deciduous and one evergreen conifer species collected at the tree line in the Alps, covering nearly the whole Holocene. The age trend analyses of all tree-ring variables were conducted on the basis of mean curves established by averaging the cambial-age-aligned tree series. For cambial ages over 100 years, our results prove the absence of any age-related effect in the δD, δ18O, and δ13C time series for both the evergreen and the deciduous conifer species, with the only exception being larch δD. However, for lower cambial ages, we found trends that differ for each isotope and species; i.e., mean δ13C values in larch do not vary with aging and can be used without detrending, whereas those in cembran pine show a juvenile effect, and the data should be detrended. Mean δ18O values present two distinct aging phases for both species, complicating detrending. Similarly, mean δD values in larch change in the first 50 years, whereas cembran pine changes between 50 and 100 years. Values for these two periods of cambial age for δD and δ18O should be used with caution for climatic reconstructions, ideally complemented by additional information regarding mechanisms for these trends.
- Article
(11556 KB) - Full-text XML
-
Supplement
(402 KB) - BibTeX
- EndNote


Stable isotopes in tree-ring cellulose are powerful tools for climatic reconstructions (Kress et al., 2010; Nagavciuc et al., 2019). In environments where the trees are rarely moisture-stressed, like at the Alps tree line, the control of δ13C is the photosynthetic rate, which depends predominantly on irradiance and temperature. δ18O probably reflects a combination of the direct temperature effect on the isotopic ratio of precipitation and the indirect evaporative-enrichment effect. (McCarroll et al., 2003).
An advantage of stable-isotope time series based on tree rings compared to other isotope time series is the defined dating and temporal – e.g., annual – resolution. A challenge for the climatic interpretation of many tree-ring parameters is the presence of nonclimate signals, primarily those related to tree aging. Tree-ring width (TRW) and maximum latewood density show aging effects, which usually have to be removed with detrending or standardization procedures before using them for climatic reconstruction (Helama, 2017). A key question for isotope dendroclimatology is whether isotope ratios of the tree cellulose show age trends or not (McCarroll and Loader, 2004). It is still a controversial issue depending on isotope type and plant species. If tree-age-related trends are absent, the analysis and reconstruction of long-term climatic evolutions based on tree-ring isotope series would lose a source of potential bias. In contrast, if they are present, some work suggests using a detrending procedure (Esper et al., 2010). The same issue concerns the juvenile phase, the values of which can be excluded from paleoclimatic analyses if they show complex age effects, as suggested by McCarroll and Loader, 2004.
For δ13C, aging studies were initiated by Freyer et al. (1979) on many tree species, followed by other investigations on, e.g., pines, oaks, and beeches. All documented an increase for δ13C values in the juvenile period (Anderson et al., 2005; Duquesnay et al., 1998; Gagen et al., 2008; Li et al., 2005; McCarroll and Pawellek, 2001; Monserud and Marshall, 2001; Nagavciuc et al., 2019; Raffalli-Delerce et al., 2004; Treydte et al., 2001). A “long-term trend” with continuous increase in δ13C values during the entire life of Pinus sylvestris was also described (Helama et al., 2015). An early juvenile effect in the first 5 years was reported for oak (Duffy et al., 2017). Fewer works did not detect any juvenile or long-term trend of δ13C values in Pinus sylvestris and larch (Gagen et al., 2007; Kilroy et al., 2016; Young et al., 2011). Altogether, most studies found a juvenile trend (increase) but of variable lengths.
Initial work on δ18O values found a negative juvenile trend of 300 years in Juniperus turkestanica grown at elevations around 3000 m a.s.l. (Treydte et al., 2006). A similar negative juvenile trend of 300 years was also reported in Pinus uncinata (Esper et al., 2010). A positive trend of 30 years was found for oak (Labuhn et al., 2014), and positive “long-term trends” were reported for spruce and beeches (Klesse et al., 2018). In contrast, other studies did not find detectable age trends in larch, oak, Pinus sylvestris, Abies alba, or cembran pine (Daux et al., 2011; Duffy et al., 2017, 2019; Nagavciuc et al., 2019; Saurer et al., 2000; Young et al., 2011). Thus, the studies on δ18O trends are rather controversial, showing negative, positive, or no age-related trends. The mentioned studies analyzed trees from different geographical origins, including some from sites near the tree line, where trees often grow in open space. Such growth situations may have an effect on age trends, i.e., under open-space growth there is no neighborhood competition and therefore no limitation of growth by adjacent trees (Matsushita et al, 2015). The absence of a canopy effect may also modify the isotope composition stored by the trees, as shown for δ18O (Daux et al., 2011; Esper et al., 2010; Gagen et al., 2008; Nagavciuc et al., 2019; Young et al., 2011). Furthermore, open-space growing limits effects described previously such as tree dominance suppression or location and exposition effects (wet: dry; sunny: shady; Leuenberger, 2007) that may lead to age trends. The tree height also imposes a hydraulic limitation and possibly reduces stomatal conductance that may lead to an increase in the cellulose δ13C values with increasing age (Brienen et al., 2017).
Changes in δD values in relation to tree ages have been analyzed only in two studies. One found a positive juvenile trend of 20 years followed by a flat phase in spruce trees (Lipp et al., 1993) and the other identified a positive long-term trend in oak (Mayr et al., 2003).
Helama et al. (2015) suggested that the availability of a suitable database of tree-ring isotopes would allow the detection of age trends and would open possibilities to their elimination in order to improve the recognition of long-term climatic evolution. Five issues were indicated as necessary for such a database: (i) that it contains a large sample number; (ii) that it has no data from “pooled” rings; (iii) that the samples are well distributed over calendar years with different climate conditions; (iv) that the samples come from timberline or tree line sites, where the distance between the trees is large, i.e., limiting the canopy effect; (v) that they do not contain “modern” rings that need to be corrected in δ13C for the anthropogenic rise in CO2 concentration in the atmosphere. This last point is particularly important because the trees at the Alps tree line benefit from an enhanced CO2 fertilization and from a recent temperature increase (Wieser et al., 2016) that may produce a long-term trend in cellulose isotopes. For example Wieser et al. (2018) show that the increase in temperature is canceled by increasing atmospheric CO2 concentrations in the environment of the Alps tree line under nonlimiting water availability. They state that the instantaneous water use efficiency of photosynthesis therefore did not change considerably.
Here we investigated the presence of age trends by utilizing a stable-isotope tree-ring database, which was established on the basis of the Eastern Alpine Conifer Chronology (Nicolussi et al., 2009): (i) the database consists of samples of mainly subfossil wood from 201 trees; (ii) the isotope samples are not pooled; (iii) the isotope time series, with up to multicentennial length, continuously cover the last ca. 9000 years; (iv) the database utilizes two different species, deciduous larch and evergreen cembran pine; (v) the wood material was collected at different tree line sites; and (vi) the database contains only 17 trees with rings that grew after the Industrial Revolution. In the present work we aim to verify the presence of age trends in δD, δ18O, and δ13C in comparison with those of cellulose content (CC) and TRW. We considered the whole multicentennial cambial age range of the trees to identify and quantify the length and extent of the juvenile and the long-term aging periods.

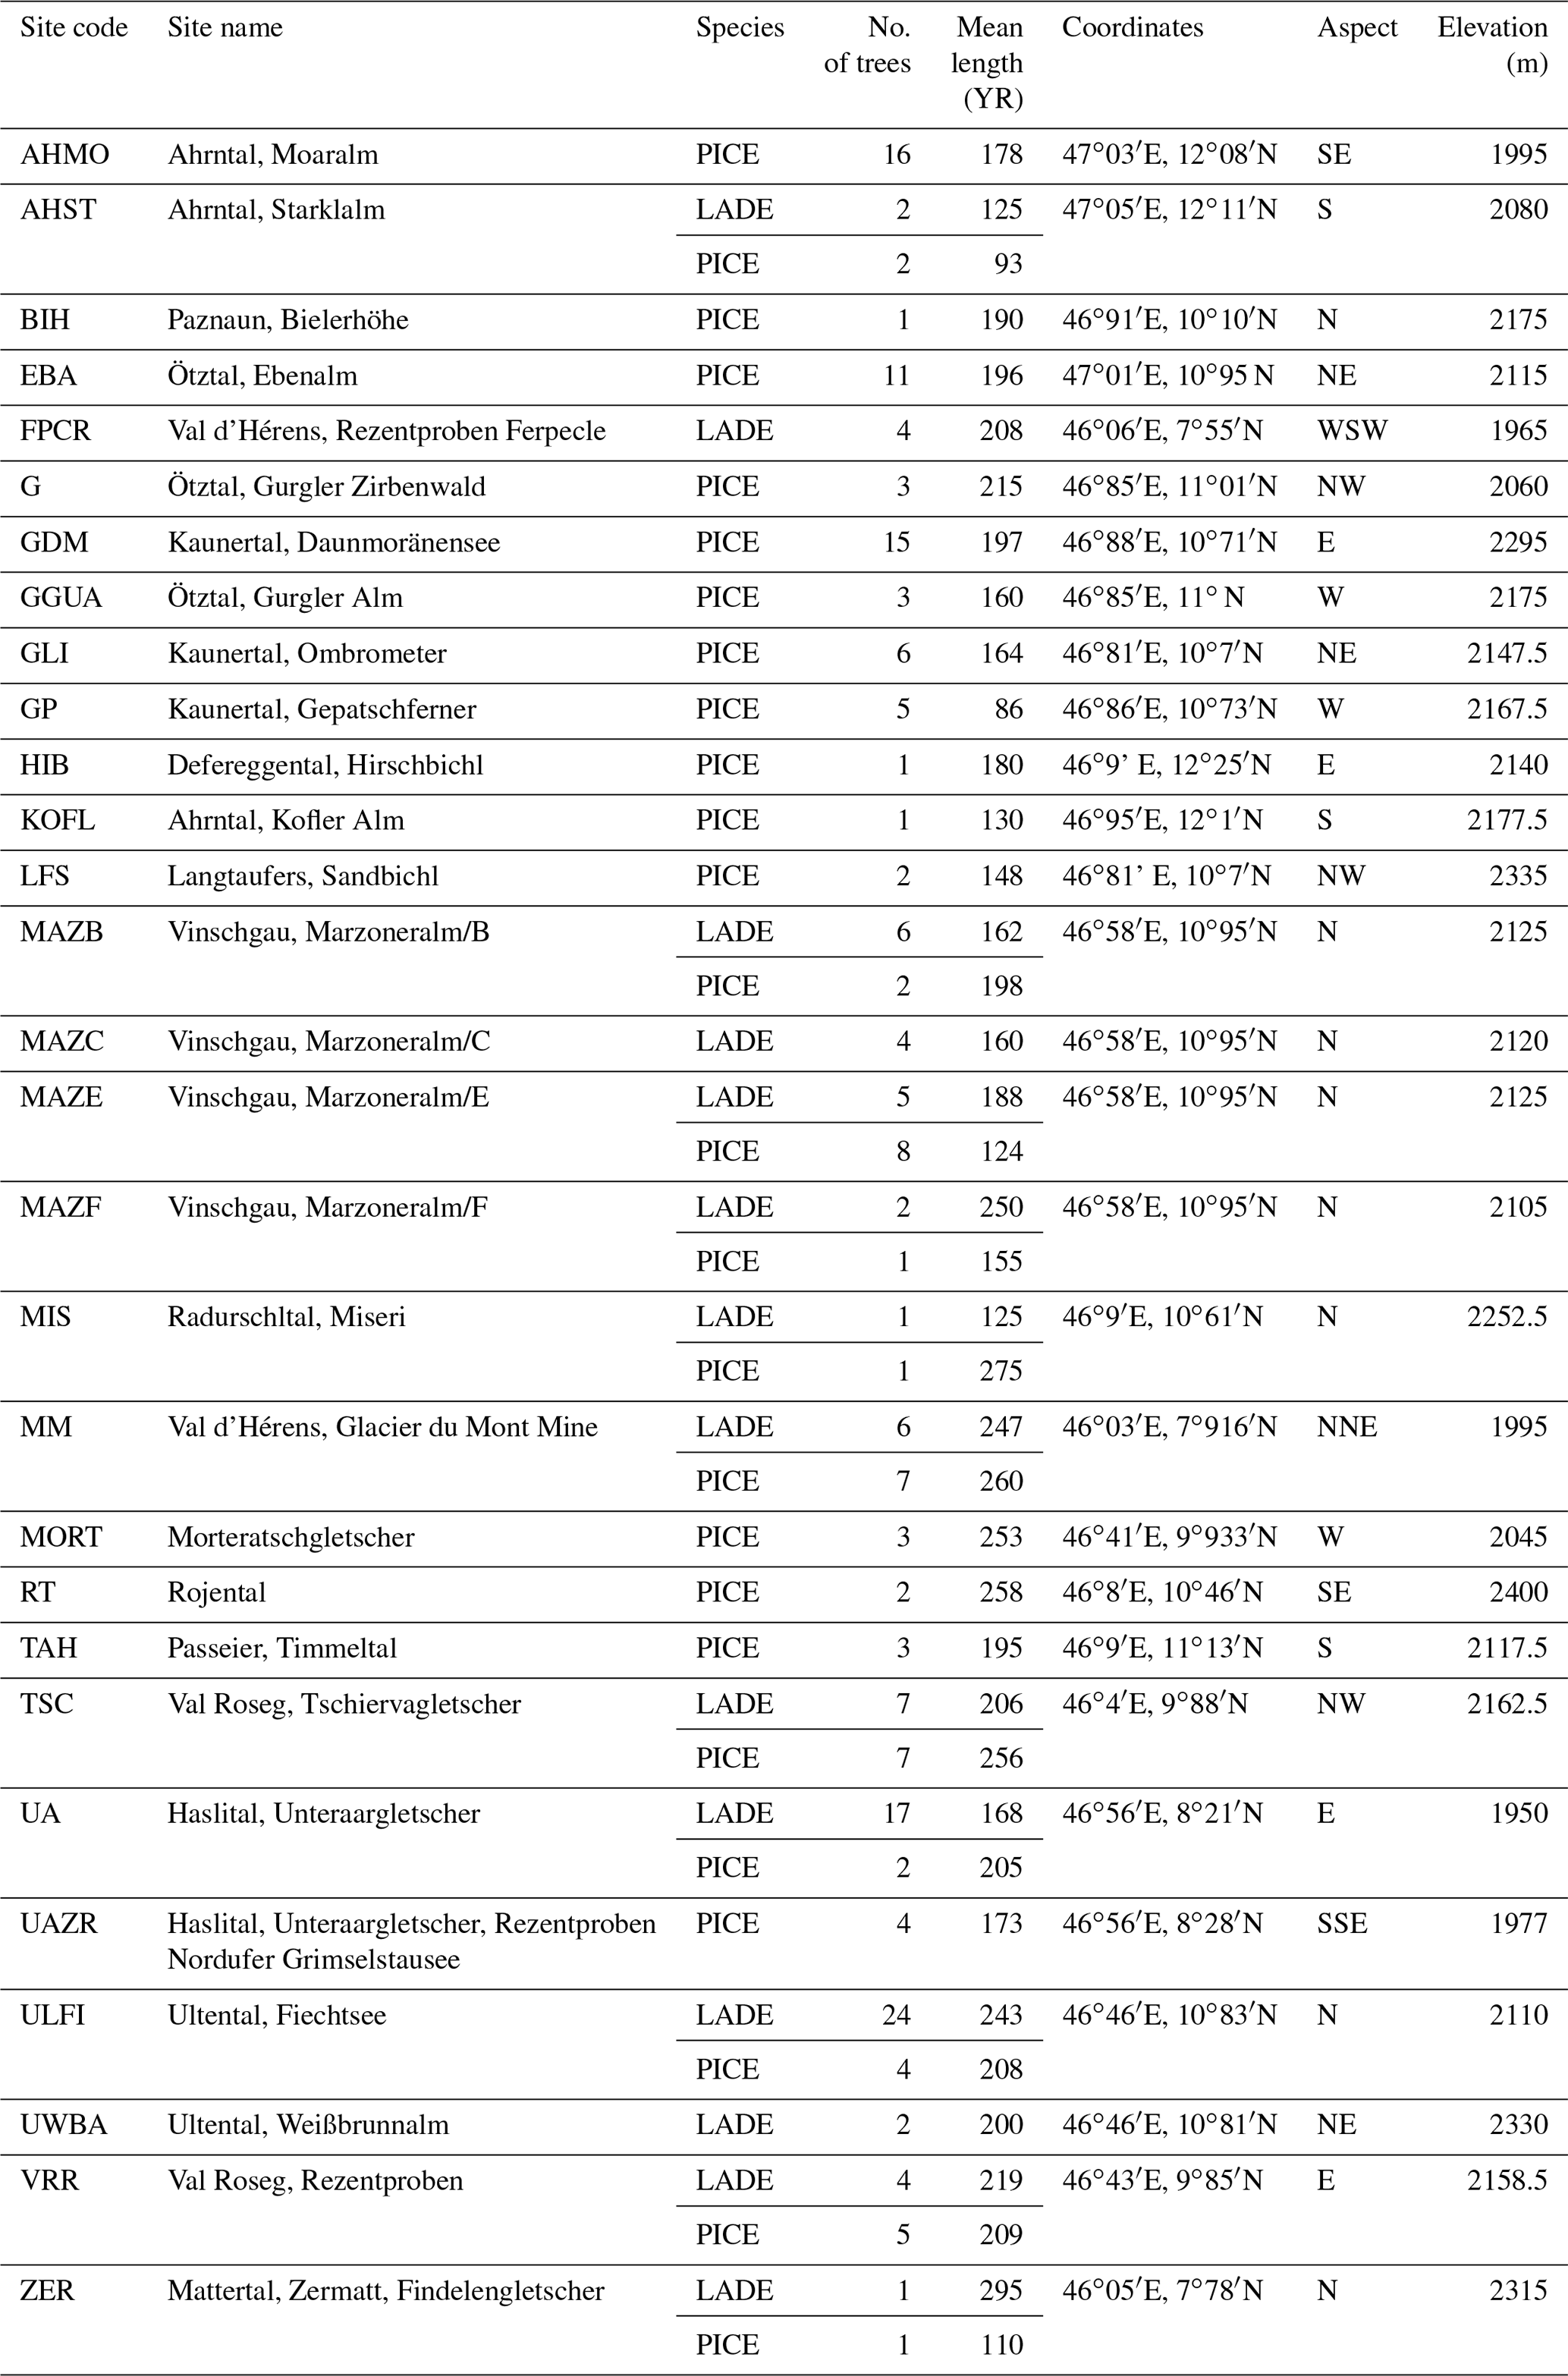
Figure 1Map of the location of the 29 sampling sites (© Google Maps 2020): they are situated in the Swiss, the Austrian, and the Italian Alps. Information on each site is given in Table 1.
Table 1Characteristics of the sampling site and of the trees: 11 sites contain both larch and cembran pine samples, 2 sites contain only larch (LADE) specimens, and the remaining sites contain only cembran pine (PICE).
2.1 Subfossil wood samples and sampling sites in the Alps
Holocene wood sections were available at the Department of Geography of the University of Innsbruck, where the Eastern Alpine Conifer Chronology (EACC) has been established on the basis of calendar-dated tree-ring-width series (Nicolussi et al., 2009). We have utilized a large number of these subfossil wood samples that cover nearly the whole Holocene (Nicolussi et al., 2009). They belong to the deciduous larch (Larix decidua Mill.) and the evergreen cembran pine (Pinus cembra L.) and have been collected at tree line sites for paleoclimatic studies. The sampling sites are located in different parts of the European Alps, covering a SW–NE transect with an elevation range of 1930 to 2400 m (Fig. 1). The wood material was collected at 29 different sites, 3 of which have only larch and 15 only cembran pine; 11 sites contain both species. The characteristics of the 201 trees are listed in Table 1. Only 17 of them contain tree rings formed after the Industrial Revolution, i.e., after ca. 1850 AD. Wood samples spanning 5 years of tree rings have been prepared and analyzed for stable-isotope ratios, as described before (Ziehmer et al., 2018; Arosio et al., 2020).
2.2 Tree-ring width data and cambial age estimation
The tree-ring width of all the samples was measured with a precision of 0.001 mm as described in Nicolussi et al. (2009). Dated tree samples with relatively wide rings were selected to collect enough material for the isotope measurements. In subfossil specimens the number of rings available for analyses often does not cover the whole tree lifespan due to effects of decay processes, and therefore the cambial age of the first measured ring was estimated from ring curvature for tree samples without preserved pith (Nicolussi et al., 2009)
2.3 Stable-isotope analysis
The procedure of cellulose extraction, determination of the cellulose content (cellulose dry weight and wood dry weight; Ziehmer et al., 2018), and the triple-isotope analysis were described before (Loader et al., 2015). Briefly, we used conventional isotope ratio mass spectrometry (Isoprime 100) coupled to a pyrolysis unit (HEKAtech GmbH, Germany), which is similar to the previously used a Thermo Scientific high temperature conversion elemental analyzer (TC/EA; for technical details see Leuenberger, 2007). This approach was extended to measurements of nonexchangeable hydrogen of alpha-cellulose using the online equilibration method (Filot et al., 2006; Loader et al., 2015). The results are reported in parts per thousand (‰) relative to the Vienna Pee Dee Belemnite (VPDB) for carbon and to Vienna Standard Mean Ocean Water (VSMOW) for hydrogen and oxygen (Coplen, 1994). The precision of the measurement is ±3.0 ‰ for hydrogen, ±0.3 ‰ for oxygen, and ±0.15 ‰ for carbon (Loader et al., 2015).
2.4 Carbon isotope correction
The burning of fossil fuels and land-use changes in the Industrial Revolution from about 1850 onwards caused a continuous increase in atmospheric carbon dioxide (CO2) depleted in δ13C (Leuenberger, 2007) known as the Suess effect (Suess, 1955). This change is reflected in the carbohydrates of the plants; therefore a correction has to be applied to the isotopic series of tree rings. For all the δ13C values after 1000 CE, we applied the correction factor described in Leuenberger (2007).
2.5 Age trend analysis
Each tree series was aligned according to the cambial age, and larch and cembran pine samples were analyzed independently. The values of the three isotope ratios were analyzed as raw, normalized, and z-scored data. The normalization consisted of subtracting the mean of the time series of a tree from each raw value of this series. For the analysis of the age-related trends, the isotope series of these three data groups were averaged to mean series for both investigated species under consideration of cambial age of the tree time series. We limited the analysis of these isotope mean series to the cambial age period, where the replication number is 10 (Klesse et al., 2018; Young et al., 2011). We plotted the normalized data of the isotope values versus the cambial age of the trees. Then we applied a linear interpolation in the different parts of the curves to quantify the trend. The division of the curves is different for each isotope, showcasing their different behaviors. The same procedure was applied to TRW and CC series, but for TRW we used the raw in place of the normalized data. To verify the presence of trends we applied a linear fit and compared it with those of the isotopes.
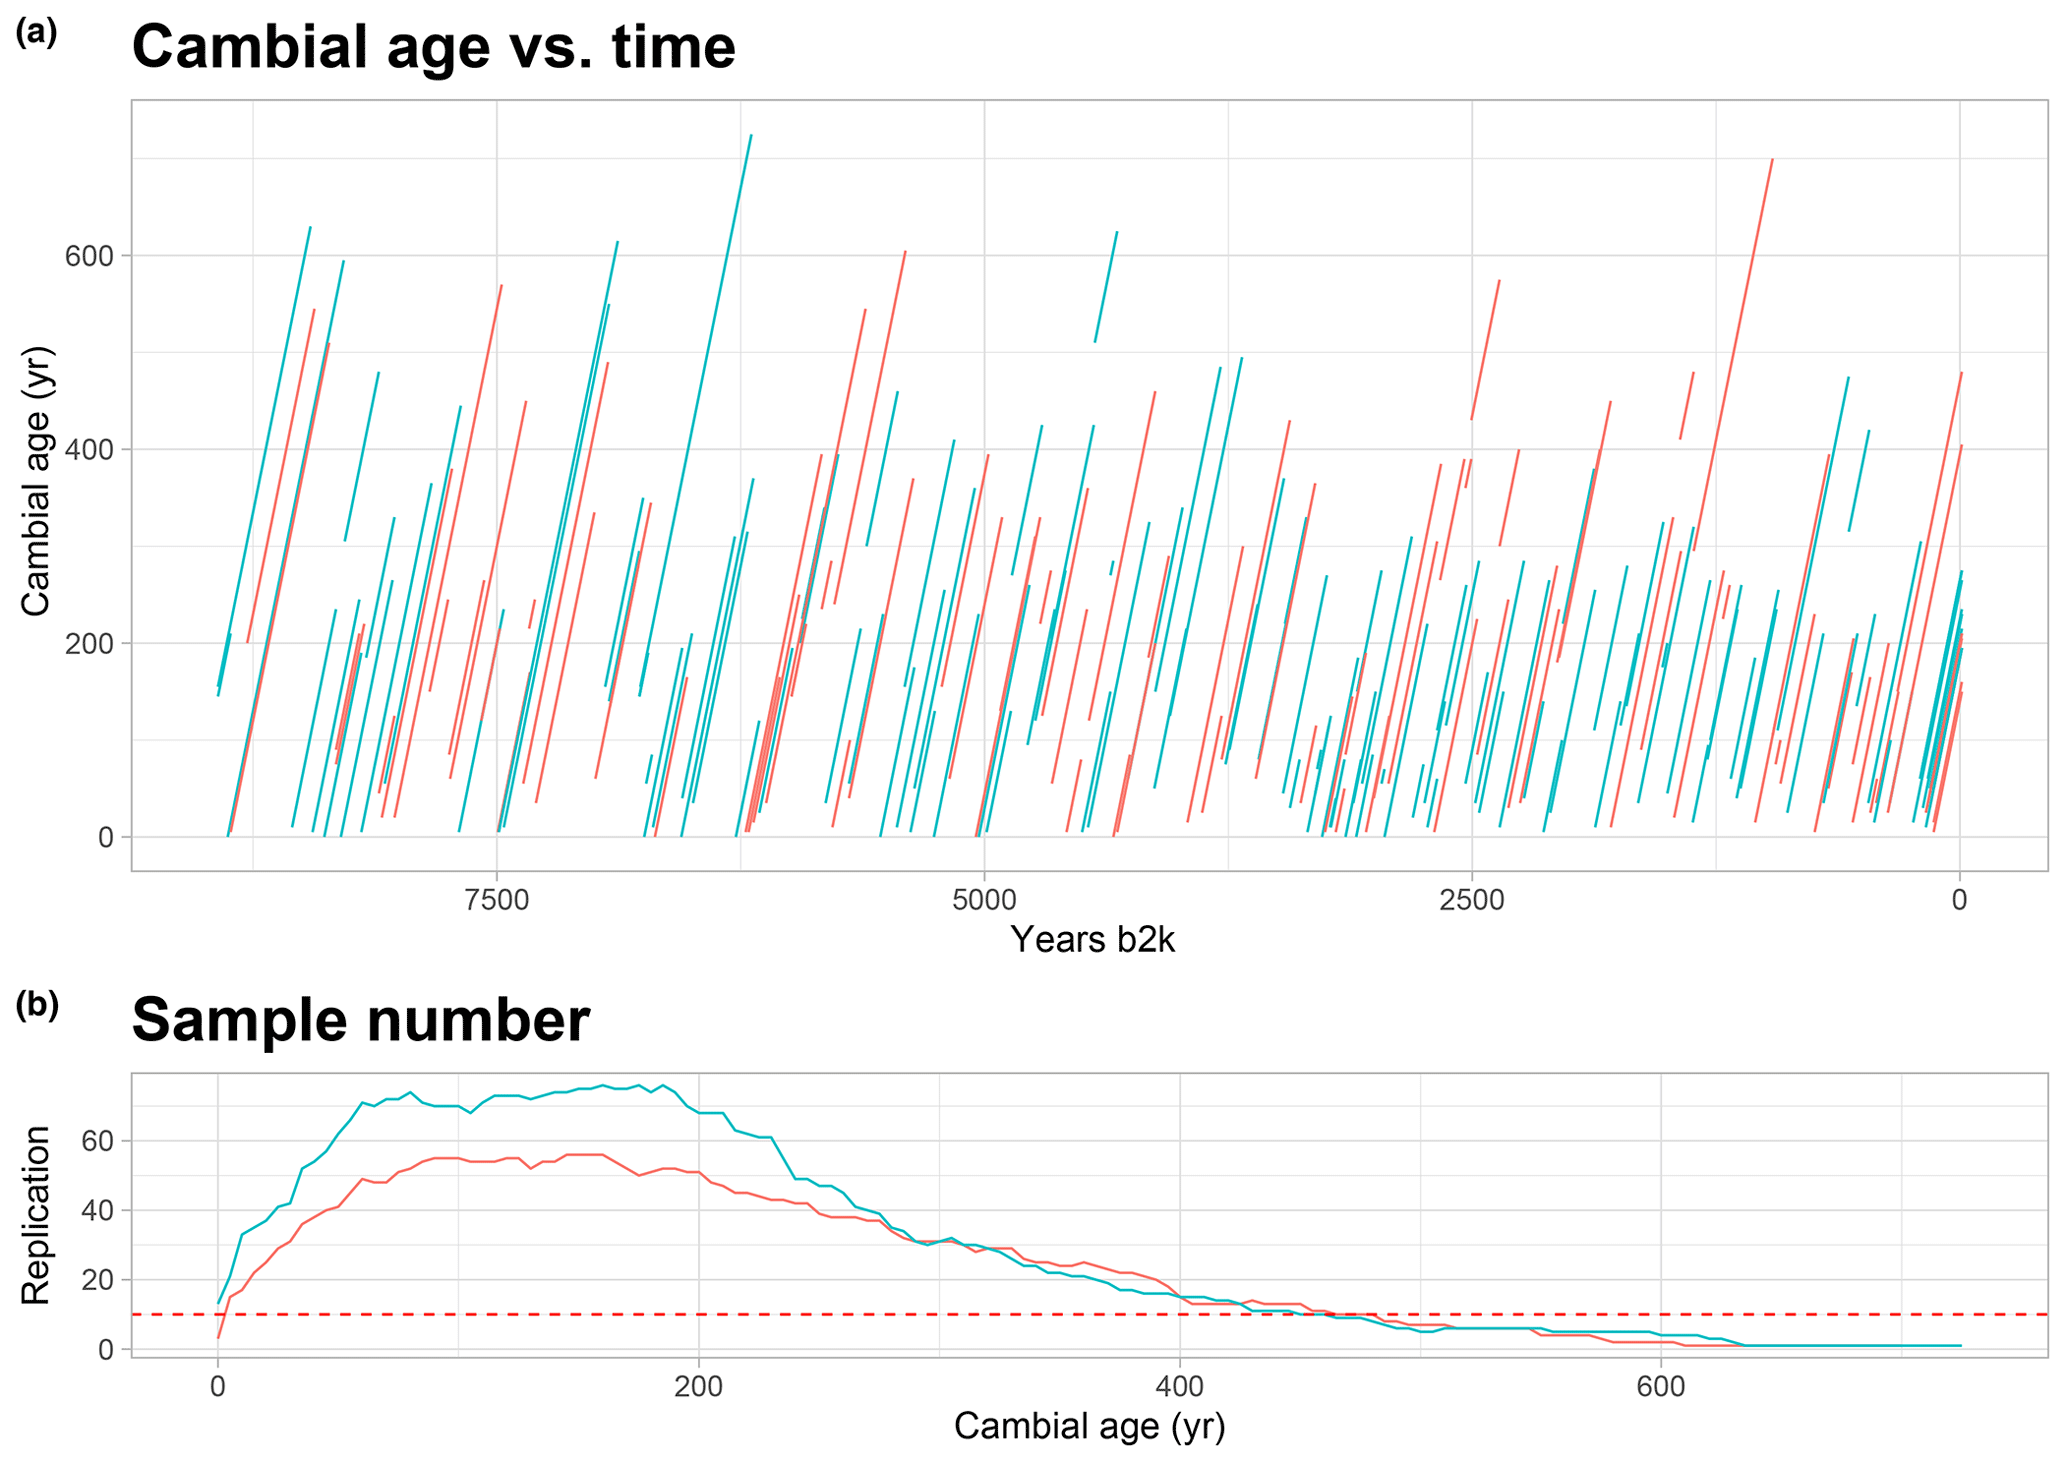
Figure 2Cambial age and replication: (a) graph of temporal distribution of the all trees and their cambial age. On the x axis the calendar age of the time series is displayed, which goes back to 9000 years; on the y axis is the cambial age. Each line represents a tree, in red the larch and in green the cembran pine. (b) Graph of the replication along the cambial age. The dotted line represents the threshold of 10 that we have considered for the analysis.
Our aim was to interrogate the stable isotopes of the EACC database for age effects using the well-known age trends in TRW as comparison. The plot of the cambial age versus calendar age (Fig. 2a) shows that the database includes isotope time series covering age ranges from 15 to 610 years, with only few of them starting from the pith. The cambial ages of the trees are rather uniformly distributed over the entire Holocene, thus avoiding a potential bias in the analysis of age trend. Figure 2a also shows that the time series of the two species, larch (red) and cembran pine (green), are similarly distributed over the Holocene. The sample replication number per cambial age of the trees is shown in Fig. 2b, with the horizontal line indicating the threshold 10, which ranged from 1 to 460 years for cembran pine and from 10 to 480 years for larch.
The isotope series of the individual larch trees have a mean length of 273 years (with a minimum and maximum length of 25 and 550 years, respectively), the mean of their initial measure is 75 years, and the mean final cambial age is 348 years. The individual cembran pine time series have a mean length of 257 years (with a minimum and maximum length of 15 and 610 years, respectively), the mean of their initial data point is 67 years, and the mean final cambial age is 324 years. Table 1 describes the samples we analyzed and shows that they cover the period 8930 b2k to 2010 CE, with a maximum cambial age of 725 years.

Figure 3Analysis of δ13C data: (a) normalized δ13C values of all larch (LADE, red) and cembran pine (PICE, green) trees; the green line corresponds to the mean. (b) Raw (left) and normalized (right) mean value with corresponding ±1 standard deviation (gray area) of larch (red) and cembran pine (cyan). (c) Plots of the mean values with linear approximations for the periods 1–100 and >100 years.
The means of raw data of each isotope of larch and cembran pine were plotted versus cambial age (Figs. 3b, 4b, 5b). The absolute mean values probably differ because of different geographical origin of the trees or species-specific signature (Arosio et al., 2020); therefore we also analyzed the trend with the normalized data. The geographical effect may influence not only the mean but also the variance of each series, thus altering the age trend. To verify it, we used the z-scored data by dividing the normalized values by the standard deviation for each tree. No consistent difference was found between the normalized and z-scored data (Supplement Fig. S1), indicating that the variance of the isotope series was not significantly influenced by geographical factors.

Figure 4Analysis of δ18O data: (a) normalized δ18O values of all larch (LADE, red) and cembran pine (PICE, green) trees; the green line corresponds to the mean. (b) Raw (left) and normalized (right) mean value with corresponding ±1 standard deviation (gray area) of larch (red) and cembran pine (cyan). (c) Plots of the mean values with linear approximations for the periods 1–50, 51–100, and >100 years.
We found that all average isotope series show trend changes only in the first 100 years of cambial age, in agreement with previous reports (Esper, 2015), except δD of larch. Therefore, we analyzed the average series before and after 100 years separately. The trends of the average series with sample replication above or equal to 10 for all subperiods were studied by linear correlations, as in Young et al. (2011).
3.1 δ13 carbon
Means of the standardized δ13C data of all samples from 1 to about 500 cambial years of both species are shown in Fig. 3a. Data points with a replication of 10 are considered, as shown in the replication plot of Fig. 2a. The plots of the raw and of the normalized data are shown in Fig. 3b. The mean raw values of cembran pine (cyan) are more depleted than the ones of larch (red; Fig. 3b). After normalization the mean values of the two species overlap only partially since the juvenile phase of the two species shows different trends (Fig. 3b). Mean values for larch are stable, while the cembran pine documents a strong positive trend in the first 100 years (0.7 ‰ ∕ 100 years) followed by a stabilization (Fig. 3c).
3.2 δ18 oxygen
The same approach was used to study the variation in δ18O of all samples (Fig. 4a), with their mean values in light green. Raw and normalized data are shown in Fig. 4b. The larch raw data are evidently more δ18O-enriched than the cembran pine ones; the normalization strongly reduces the difference between the two species, and the two time series are almost overlapping (Fig. 4b, right). In Fig. 4c only the normalized average series of the two species are plotted. Both of them show a peak in the first 100 years followed by a phase without a major age trend. Linear regression was applied to separate an initial phase of 50 years with increasing values, followed by a sharp decrease for 100 years and then a stabilization. The initial increasing phase in the larch was less steep than that of the cembran pine, and for the rest the patterns are similar.
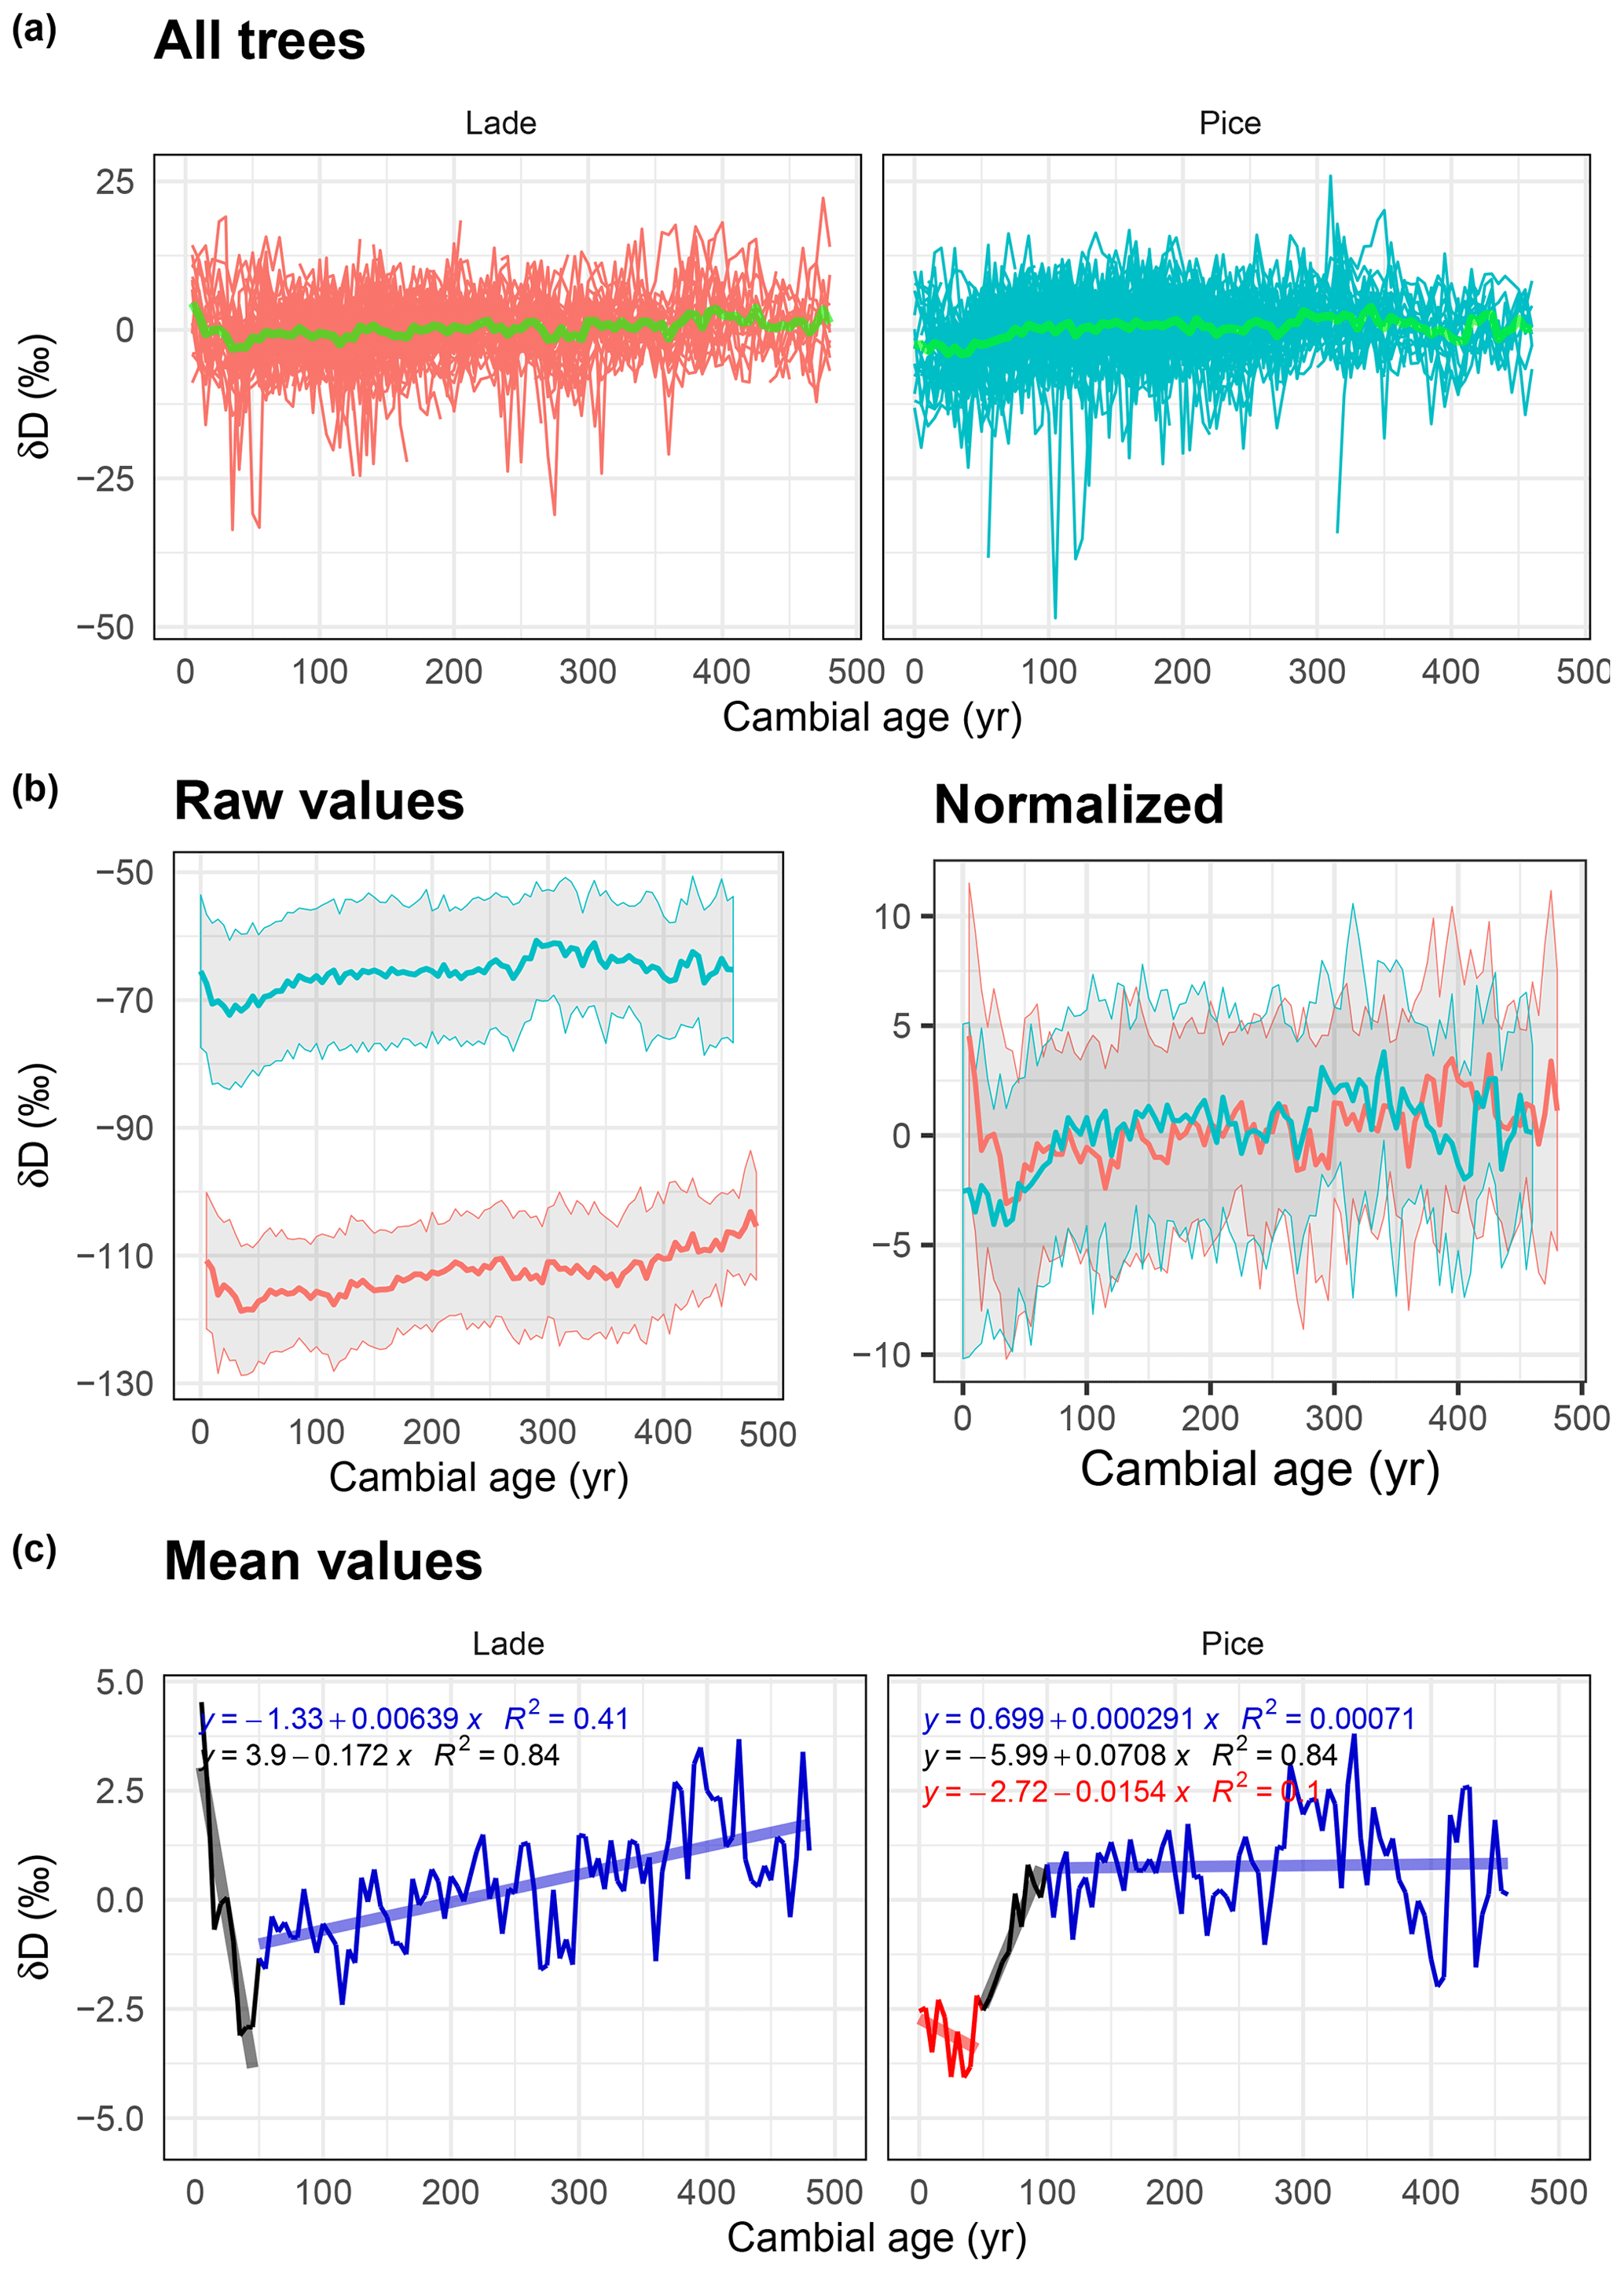
Figure 5Analysis of δD data: (a) normalized δD values of all larch (LADE, red) and cembran pine (PICE, green) trees; the green line corresponds to the mean. (b) Raw (left) and normalized (right) mean value with corresponding ±1 standard deviation (gray area) of larch (red) and cembran pine (cyan). (c) Plots of the mean values with linear approximations for the periods 1–50, 51–100, and >100 years.
3.3 δ deuterium
Means of the standardized δD data of all samples from 1 to about 500 cambial years of the two species are shown in Fig. 5a. Means of δD raw values clearly indicate that larch is more depleted than cembran pine (Fig. 5b, left), as shown before (Arosio et al., 2020). After normalization the two plots partially overlap (Fig. 5b, right). Figure 5c shows the means of the two species, the patterns of which are rather different. Larch shows a steep initial decrease in the first 50 years; after a short steep increase within 10 years of values follows a minor increase through the rest of the time. The cembran pine documents an initial slight decrease in the first 50 years, followed by a steep positive trend of 50 years and a flat line from 100 years on (Fig. 5e).
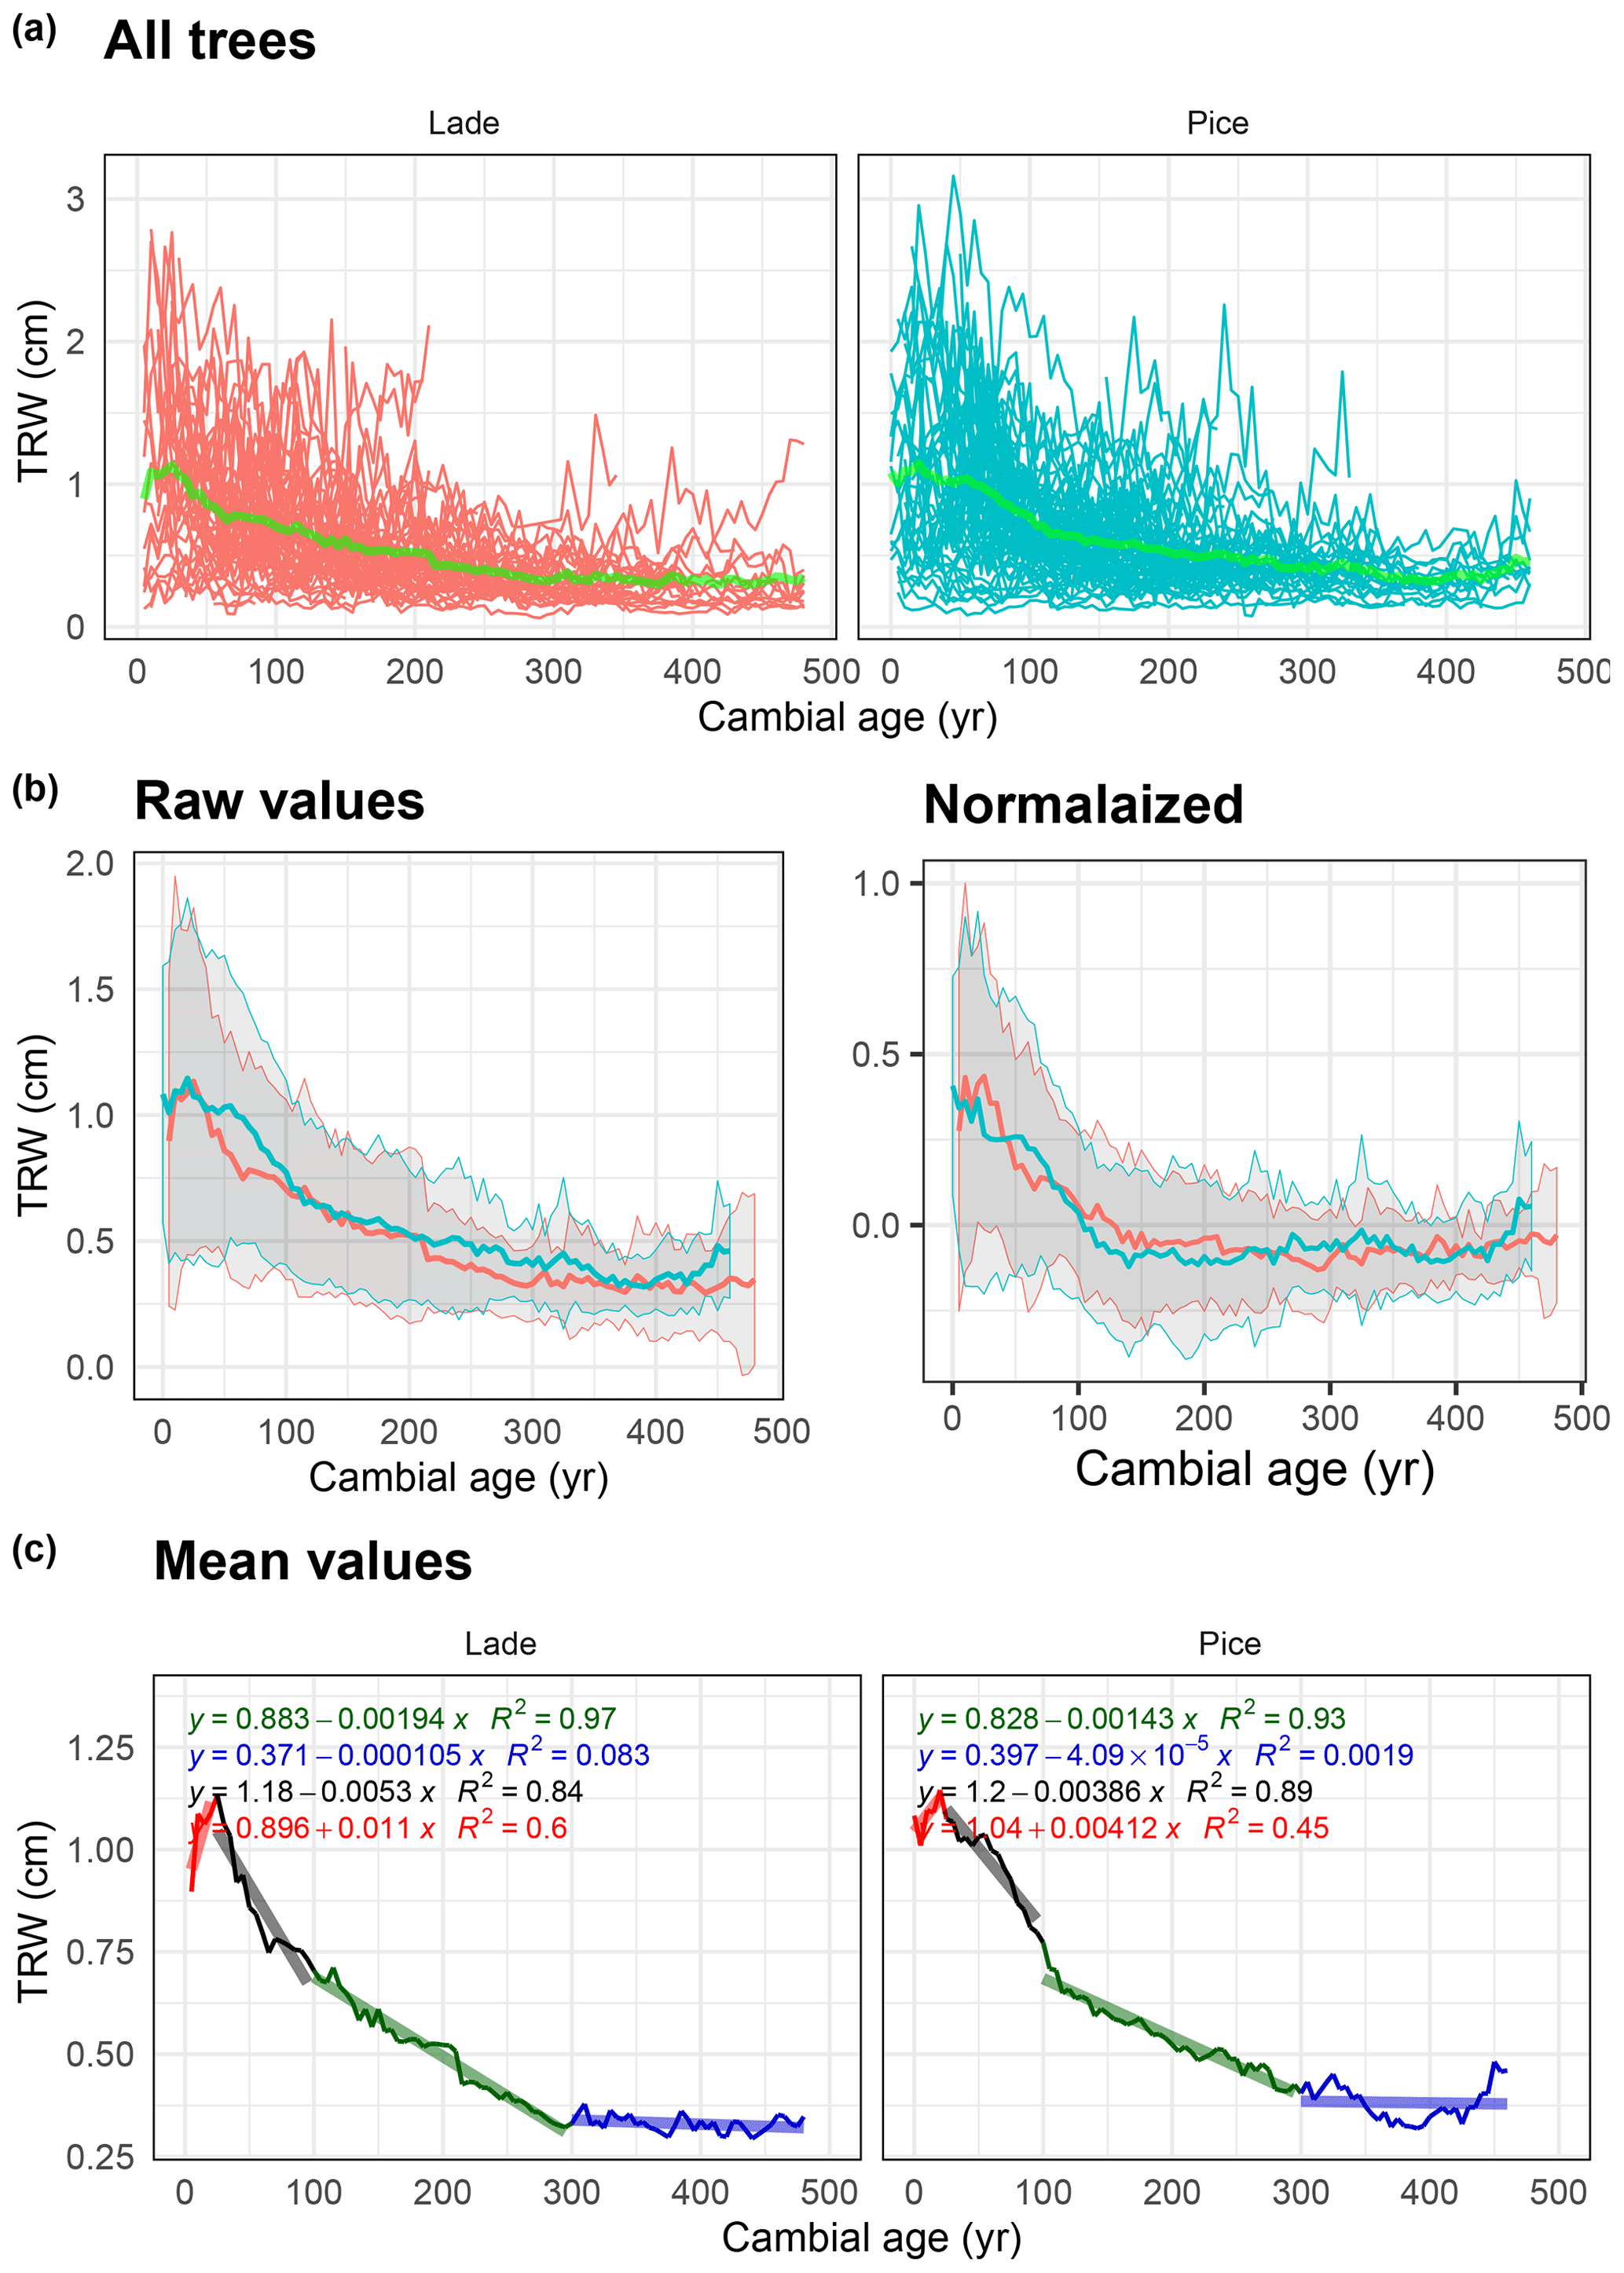
Figure 6Analysis of tree-ring width (TRW) data: (a) raw TRW values of all larch (LADE, red) and cembran pine (PICE, green) trees, green line corresponds to the mean. (b) Raw (left) and normalized (right) mean value with corresponding ±1 standard deviation (gray area) of larch (red) and cembran pine (cyan). (c) Plots of the mean values with linear approximations for the periods 1–50 to 50–100, 101–300, and >300 years.
3.4 TRW
The same analysis has also been applied to the nondetrended tree-ring width values, with the difference being that in Fig. 6a the raw data are used. Figure 6a shows all the raw values and the mean values in light green. The plots of the raw and normalized data, expressed in centimeters, show a similar trend (Fig. 6b). Means with a replication of 10 (Fig. 6b and c) show a maximum at around 30 years, in agreement with previous reports (Bräker, 1981), after which the values of both species steadily decrease in two slope sections for 300 years, thereafter becoming flat (Bräker, 1981). For a comparison between the analyses of TRW and isotope values, we applied linear regression to the TRW data instead of the more common exponential regression.
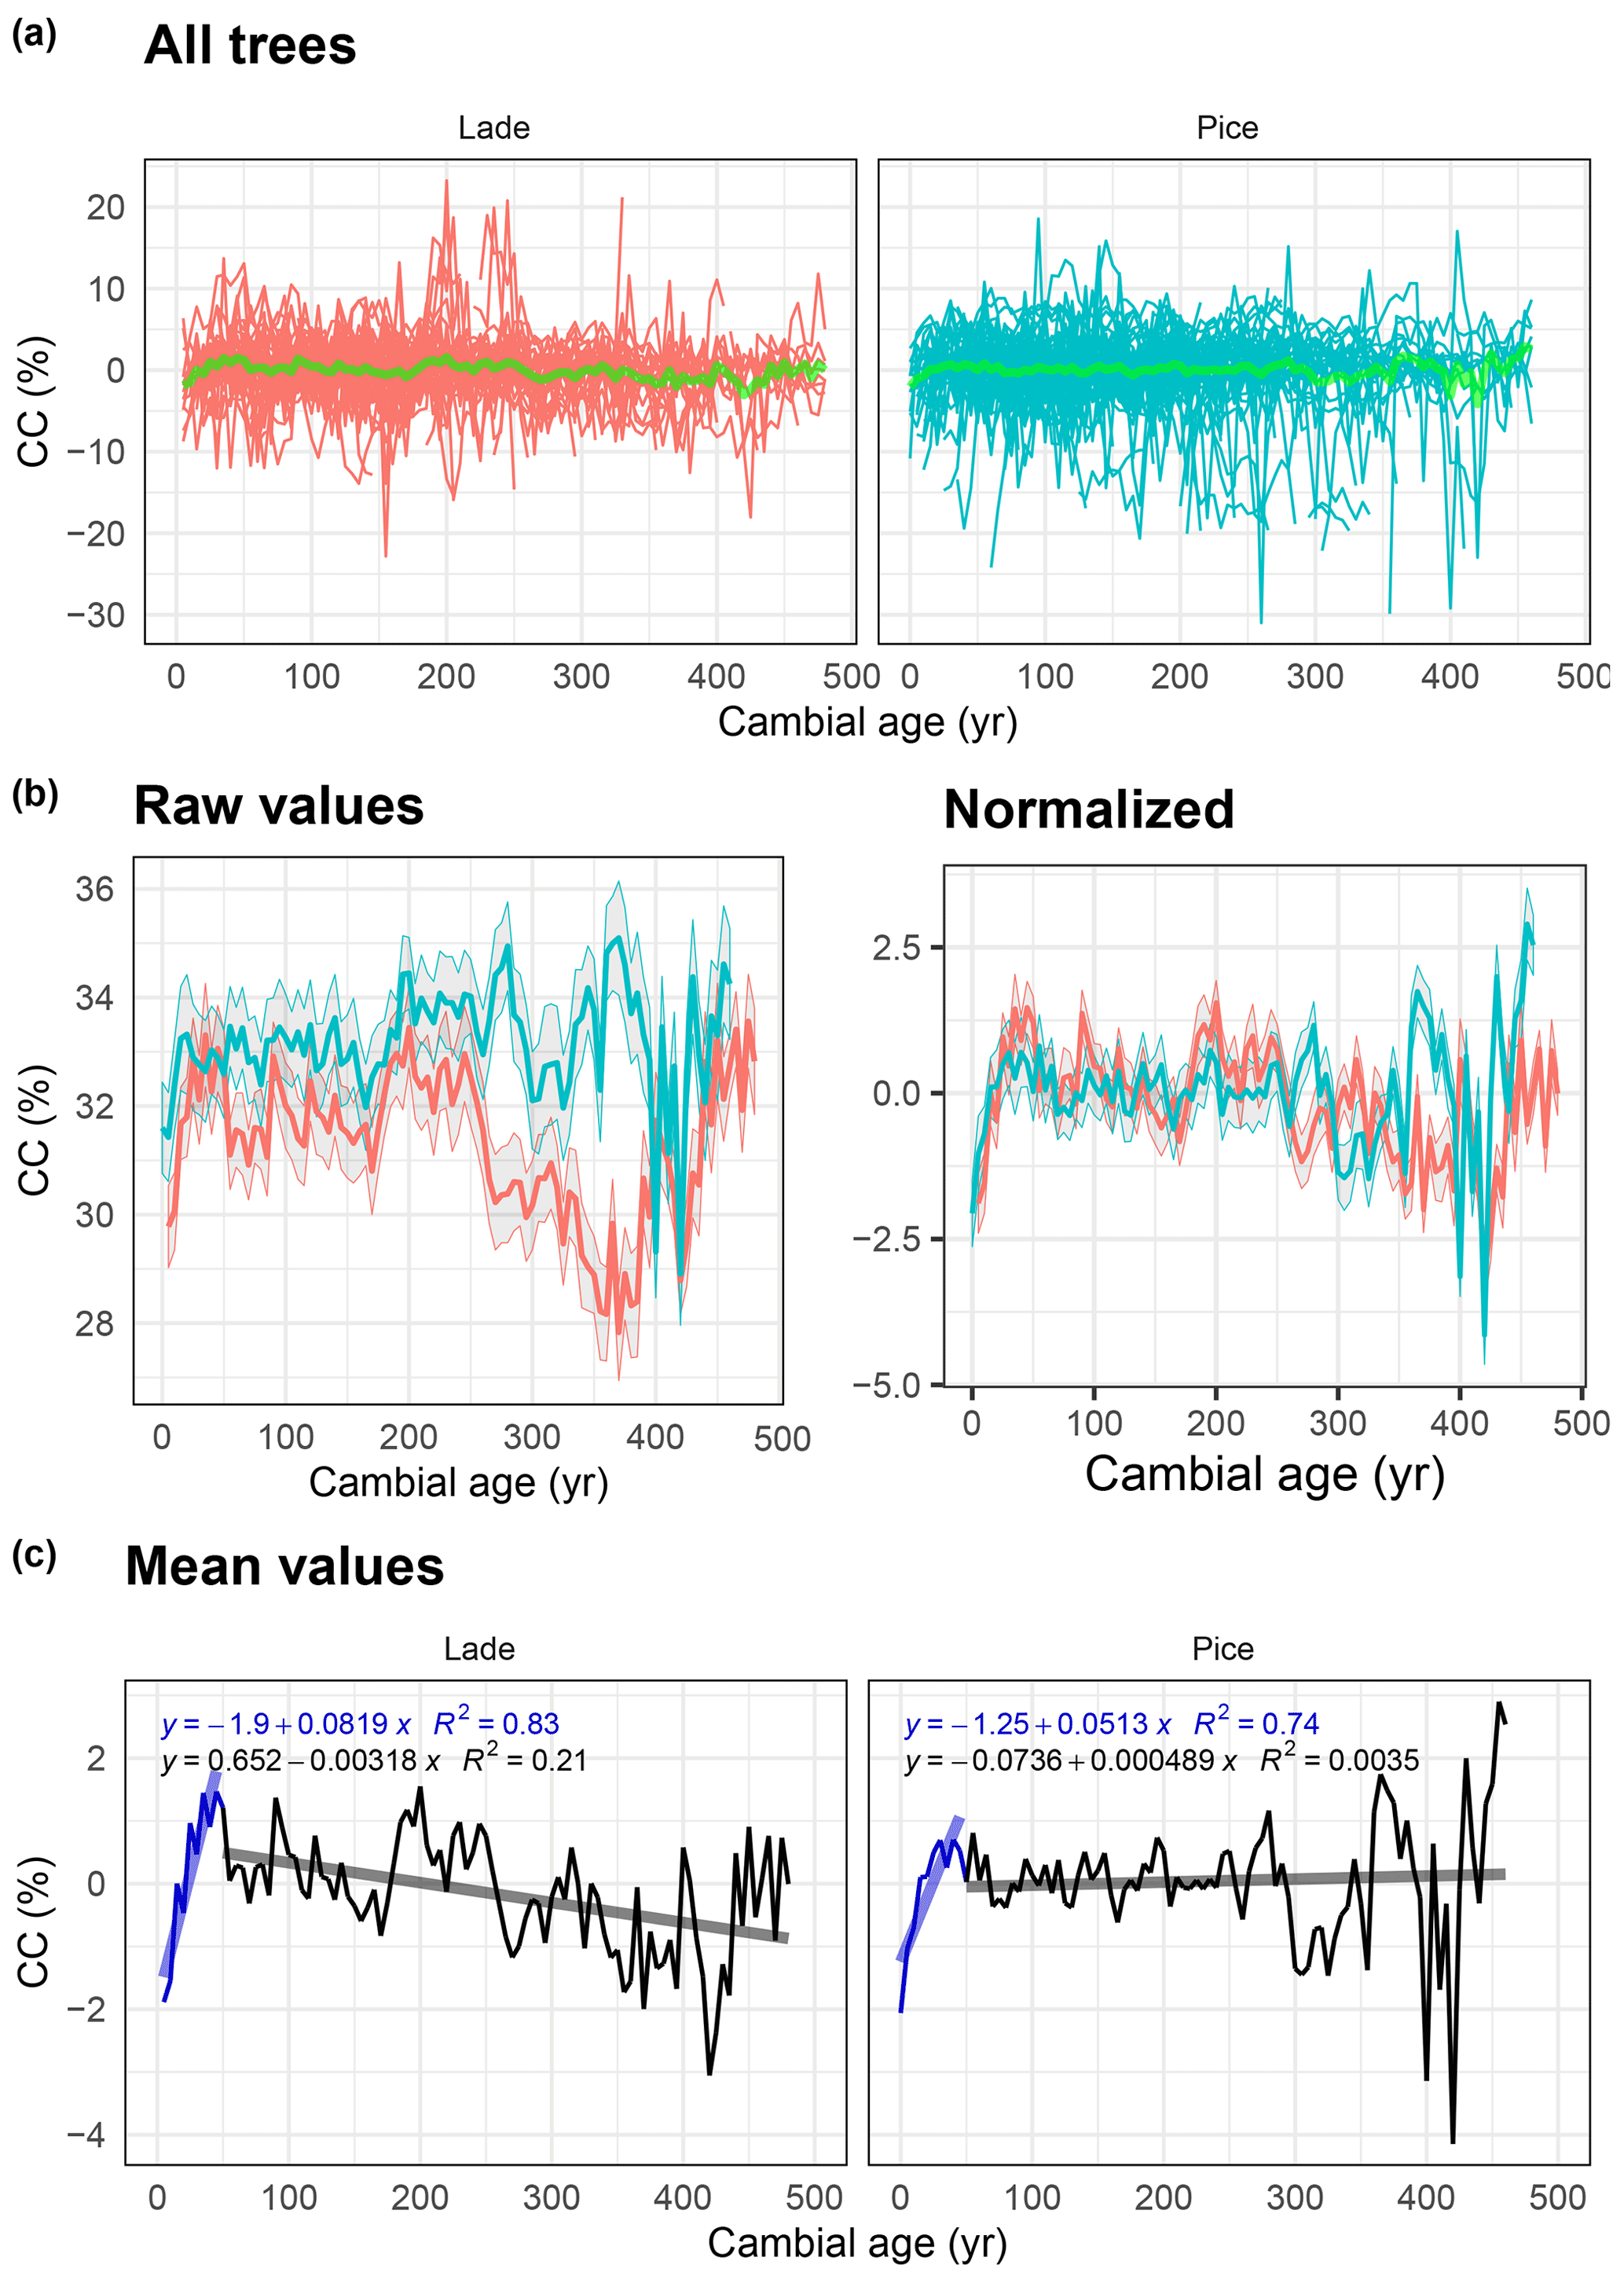
Figure 7Analysis of cellulose content (CC) data: (a) raw value of all larch (LADE, red) and cembran pine (PICE, green) trees; the green line corresponds to the mean. (b) Raw (left) and normalized (right) mean value with corresponding ±1 standard deviation (gray area) of larch (red) and cembran pine (cyan). (c) Plots of the mean values with linear approximations for the periods 1–50 and >50 years.
3.5 Cellulose content
The same analysis has also been applied to data of the cellulose content. Figure 7a shows all raw values and the mean values in light green. The plots of the raw and normalized data, expressed in percent, show a similar trend (Fig. 7b). Means with a replication of 10 (Fig. 7b and c) present a remarkable increase in the first 50 years in both species; from a cambial age of 51 years to the end, the larch presents a decreasing trend, while the cembran pine shows no trend.
A characteristic of our present work is that the wood samples represent two conifer species consisting of 201 trees that were collected at 29 different sites at high elevations in the Alps. They were exposed to different environmental conditions such as, e.g., elevation, aspect, slope steepness, and water availability. Therefore, we normalized all records by subtracting by the mean of the tree from the raw values (Daux et al., 2011). A different approach was used by Helama et al. (2015), who used the raw data to analyze samples from only three different sites. Here we present analysis of a much more extended database in time and space, which certainly represents the natural variability realistically. However, there are still issues that require consideration, in particular the sample replication. Our database does not have a constant sample replication throughout the cambial age of the trees. It is low at the beginning, increases in the first 50 years, and decreases sharply after 450 years. This may have some effect on the study of the age trends.
As introduced in the results section, we have divided tree aging into a juvenile period that we deliberately terminated at 100 years and a long-term period that lasted for 450 years. A major conclusion of this study is that the values of δD, δ18O, and δ13C in the long-term period from, 100 to 450 years, did not change significantly, except δD in larch. This is in agreement with previous δ13C studies on evergreen conifers (Esper et al., 2015; Gagen et al., 2007, 2008; Klesse et al., 2018; Nagavciuc et al., 2019; Saurer et al., 2004; Young et al., 2011) and with the previous δ18O studies on larch (Daux et al., 2011; Kilroy et al., 2016; Nagavciuc et al., 2019). This implies that no detrending is necessary for tree isotope data for climate analysis with cambial ages in that range, with the exception of δD in larch, where a nonsignificant trend is present.
More complex are the data of the juvenile period, during which the trend behavior differs among the different isotopes and species. In the juvenile phase we found evidence for a positive trend of δ13C in evergreen cembran pine but not in deciduous larch. These data are in good agreement with studies on evergreen conifers (Picea abies, Pinus sylvestris, Pinus uncinata), which all found an initial positive trend lasting up to 50 years (Gagen et al., 2007, 2008), 100 years (Klesse et al., 2018), or 200 years (Esper et al., 2015). Moreover, two previous studies on larch did not report any evident trend for δ13C in the juvenile period (Daux et al., 2011; Kilroy et al., 2016b). We can conclude that there is a general agreement that deciduous larch and evergreen conifers behave differently in the juvenile period in respect to δ13C of the cellulose. Further work is needed to understand the reason of this difference.
The behavior of δ18O values in the initial period is rather complex, with a maximum around 50 years and a decrease up to 100 years in both species. This is in good agreement with previous work that showed that Pinus uncinata grown at the tree line have maximal δ18O values around 20–50 years followed by a negative trend (Esper et al., 2010). It is also in agreement with another study on beech and spruce that found a positive juvenile trend that persisted beyond 50 years of age (Klesse et al., 2018). Altogether, our data show that δ18O of cellulose of larch and cembran pine has aging trends that are similar to those of other tree species, with up and down trends in the first 100 years and an intermediate maximum at around 50 years. The significance of these trends remains to be further studied. However, considering the time and space our database covers, this result seems to be widespread and temporally robust.
Our results on δD demonstrate different patterns for larch and cembran pine in the juvenile period, similarly to δ13C. The evergreen cembran pine displays an initial flat phase of 25 years then an increase of 4 ‰ for 100 years. This is in partial agreement with previous work that showed an increase in δD values in the juvenile period, but this lasted only 20 years (Lipp et al., 1993). Another study measured δD by nitration of the cellulose to remove nonexchangeable hydrogens (Leavitt, 2010), but this is certainly not the reason for this difference, as demonstrated by Filot et al. (2006). The difference can be attributed to the different growth environments of the trees, one at an elevation of 33 m, near Bad Windsheim (Germany), and the other at a mean altitude of 2100 m, at tree line sites in the Alps, where tree growth is known to be much slower, with a prolonged juvenile phase (Körner, 2003; Ott, 1978). The only other study that analyzed the evolution of δD in cellulose during aging reported a constant increase in δD values in the first 175 years in oak (Mayr et al., 2003). In our work the deciduous larch showed a different pattern, with a strong decrease in δD values in the first 50 years, followed by a feeble increase smaller than the analytical precision. We have not found other studies that dealt with δD in larch
The effect of TRW has been studied for long and is well documented (e.g., Helama et al., 2017). After a very short (<20 years) period of increasing TRW values, they consistently decrease, yet with different rates. From 20 to 100 years the decrease is rather steep, thereafter changing to moderate rates. At around 300 years of cambial age they flatten out in both species. Understanding the change in absolute growth rate is rather complex, as discussed for instance in Matsushita et al. (2015). Dependencies of the age–size, growth–size, and growth–age relationships are crucial. The fact that our database consists of trees from tree line sites allows us to state that our derived trends are independent from the so-called crowding effect (influence of neighboring trees). Therefore, it represents mainly the individual variability and the age–size influence on the growth rate. We did not find any dependence of the trends in the different selected time frames within the past 9000 years; the behavior we observed should represent the general dependence of the age–size influence.
The decay of wood does not influence the carbon and oxygen stable-isotope values of the cellulose (Nagavciuc et al., 2018), but it can impact CC since the cellulose decomposes faster than lignin. Yet, it has been shown that CC has the potential to be used as a climate proxy (Ziehmer et al., 2018). In the analysis of tree-age-related trends we have to consider that the decay of a trunk is not equal for all parts and that hardwood in contrast to sapwood presents a decay resistance, which also varies from species to species (Kéérik, 1974). Both investigated species show a similar positive trend in approximately the first 50 years of cambial age followed by a slight negative trend for larch or no overall trend for cembran pine. This suggests, with reference to our data, that there are probably no (cembran pine) or possibly only minor (larch) influences due to the effects of wood decay. This suggests that the CC variation in the first 50 years is not due to wood decay but rather a tree aging effect.
The present work confirms the absence of an aging effect for all three stable isotopes after 100 years of cambial age in the two conifer species, suggesting that the values older than 100 years of cambial age can be considered for climate analyses without detrending. The exception is larch, which shows a minor increase in δD mean values, smaller than the analytical precision. Before 100 years the trends differ for each isotope and species, and only the larch δ13C values can be used without detrending since they do not vary with aging. In both species, the δ18O values present two phases, making the detrending rather challenging. It is similar for δD values in larch, which change in the first 50 years, whereas in cembran pine they change between 50 and 100 years. Again detrending is demanding and should ideally be complemented by additional information regarding an explanation of this behavior. Tree-ring cellulose contents show a significant trend for the first 50 years only; in contrast tree-ring width curves flatten only after 300 years. Here the application of a regional curve standardization (RCS) is valuable. In summary, for climate reconstructions isotope data older than 100 cambial years can be used directly; data of the first 100 years should be used with caution. Therefore, data can be used only after detrending or when compared with data from other age classes covering the same time.
At present, data can be obtained upon request. As agreed upon among the project participants, datasets will be made available to the public after the official completion of the Alpine Holocene Tree Ring Isotope Records (AHTRIR) project.
The supplement related to this article is available online at: https://doi.org/10.5194/bg-17-4871-2020-supplement.
TA and MMZ performed the stable-isotope analyses. TA drafted the first version of the manuscript. KN collected the samples and performed the cross-dating. ML contributed to the evaluation of the results. ML, KN, and CS conceived of the presented idea. All authors provided comments to improve the manuscript.
The authors declare that they have no conflict of interest.
We are grateful to Peter Nyfeler for the precious assistance during measurements of the stable isotopes, to Andrea Thurner and Andreas Österreicher for the preparation of the isotope samples from Alpine sites, and the civil service collaborators: Lars Herrmann, Giacomo Ruggia, Jonathan Lamprecht, Yannick Rohrer, and Rafael Zuber. The project is funded by the Swiss National Science Foundation (grant nos. SNF 200021L_144255 and SNF 200020_172550) as well as by the Austrian Science Fund (FWF; grant no. I-1183-N19) and is supported by the Oeschger Center for Climate Change Research, University of Bern, Bern, Switzerland (OCCR).
This research has been supported by the Swiss National Science Foundation (grant nos. SNF 200021L_144255 and SNF 200020_172550) and the Austrian Science Fund (grant no. I-1183-N19).
This paper was edited by Aninda Mazumdar and reviewed by two anonymous referees.
Anderson, W. T., Sternberg, L., Pinzon, M., Gann-Troxler, T., Childers, D. L., and Duever, M.: Carbon isotopic composition of cypress trees from South Florida and changing hydrologic conditions, Dendrochronologia. 23, 1–10, https://doi.org/10.1016/j.dendro.2005.07.006, 2005.
Arosio, T., Ziehmer M. M., Nicolussi K., Schlüchter C., and Leuenberger M.: Larch cellulose is significantly depleted in deuterium isotopes with respect to evergreen conifers, Front. Earth Sci., submitted, 2020.
Bräker, O.U.: Der Alterstrend bei Jahrringdichten und Jahrringbreiten von Nadelhölzern und sein Ausgleich, Mitteilungen der forstlichen Bundesversuchsanstalt Wien, 142, 75–102, 1981.
Brienen, R.J.W., Gloor, E., Clerici, S., Newton, R., Arppe, L., Boom, A., Bottrell, S., Callaghan, M., Heaton, T., Helama, S., and Helle, G.: Tree height strongly affects estimates of water-use efficiency responses to climate and CO2 using isotopes, Nat. Commun., 8, 1–10, https://doi.org/10.1038/s41467-017-00225-z, 2017.
Coplen, T.B.: Reporting of stable hydrogen, carbon, and oxygen isotopic abundances (technical report), Pure Appl. Chem., 66, 273–276, https://doi.org/10.1351/pac199466020273, 1994.
Daux, V., Edouard J., Masson-Delmotte, V., Stievenard, M., Hoffmann, G., Pierre, M., Mestre, O., Danis, P., and Guibal, F.: Can climate variations be inferred from tree-ring parameters and stable isotopes from Larix decidua? Juvenile effects, budmoth outbreaks, and divergence issue, Earth Planet Sc. Lett., 309, 221–233, https://doi.org/10.1016/j.epsl.2011.07.003, 2011.
Duffy, J. E., McCarroll, D., Barnes, A., Ramsey, C. B., Davies, D., Loader, N. J., Miles, D., and Young, G. H.: Short-lived juvenile effects observed in stable carbon and oxygen isotopes of UK oak trees and historic building timbers, Chem. Geol., 472, 1–7, https://doi.org/10.1016/j.chemgeo.2017.09.007, 2017.
Duffy, J. E., McCarroll, D., Loader, N. J., Young, G. H., Davies, D., Miles, D., and Bronk Ramsey, C.: Absence of age-related trends in stable oxygen isotope ratios from oak tree rings, Global Biogeochem. Cy., 33, 841–848, https://doi.org/10.1029/2019GB006195, 2019.
Duquesnay, A., Breda, N., Stievenard, M., and Dupouey, J.: Changes of tree-ring δ13C and water-use efficiency of beech (Fagus sylvatica L.) in north-eastern France during the past century, Plant Cell Environ., 21, 565–572, https://doi.org/10.1046/j.1365-3040.1998.00304.x, 1998.
Esper, J., Frank, D. C., Battipaglia, G., Büntgen, U., Holert, C., Treydte, K., Siegwolf, R., and Saurer, M.: Low-frequency noise in δ13C and δ18O tree ring data: A case study of Pinus uncinata in the Spanish Pyrenees, Global Biogeochem. Cy., 24, https://doi.org/10.1029/2010GB003772, 2010.
Esper, J., Konter, O., Krusic, P. J., Saurer, M., Holzkämper, S., and Büntgen, U.: Long-term summer temperature variations in the Pyrenees from detrended stable carbon isotopes, Geochronometria, 53, 42, https://doi.org/10.1515/geochr-2015-0006, 2015.
Esper, J., Klippel, L., Krusic, P. J., Konter, O., Raible, C. C., Xoplaki, E., Luterbacher, J., and Büntgen, U.: Eastern Mediterranean summer temperatures since 730 CE from Mt. Smolikas tree-ring densities, Clim. Dynam., 54(3), 1367–1382, https://doi.org/10.1007/s00382-019-05063-x, 2020.
Filot, M.S., Leuenberger, M., Pazdur, A., and Boettger, T.: Rapid online equilibration method to determine the D/H ratios of non-exchangeable hydrogen in cellulose, Rapid Commun. Mass Sp., 20, 3337–3344, https://doi.org/10.1002/rcm.2743, 2006.
Freyer, H.: On the 13C record in tree rings, Part I. 13C variations in northern hemispheric trees during the last 150 years, J Tellus, 31, 124–137. https://doi.org/10.3402/tellusa.v31i2.10417, 1979.
Gagen, M., McCarroll, D., Loader, N. J., Robertson, I., Jalkanen, R., and Anchukaitis, K.: Exorcising the segment length curse': summer temperature reconstruction since AD 1640 using non-detrended stable carbon isotope ratios from pine trees in northern Finland, The Holocene, 17, 435–446, https://doi.org/10.1177/0959683607077012, 2007.
Gagen, M., McCarroll, D., Robertson, I., Loader, N. J., and Jalkanen, R.: Do tree ring δ13C series from Pinus sylvestris in northern Fennoscandia contain long-term non-climatic trends?, Chem. Geol., 252, 42–51, https://doi.org/10.1016/j.chemgeo.2008.01.013, 2008.
Helama, S., Melvin, T. M., and Briffa, K. R.: Regional curve standardization: State of the art, Holocene, 27, 172–177, https://doi.org/10.1177/0959683616652709, 2017.
Helama, S., Arppe, L., Timonen, M., Mielikäinen, K., and Oinonen, M.: Age-related trends in subfossil tree-ring δ13C data, Chem. Geol., 416, 28–35, https://doi.org/10.1016/j.chemgeo.2015.10.019, 2015.
Kéérik, A. A.: Decomposition of wood, in: Biology of plant litter decomposition, volume 1, edited by: Dickinson, C.H., Elsevier, New York, USA, 129, 1974.
Kilroy, E., McCarroll, D., Young, G. H., Loader, N. J., and Bale, R. J.: Absence of juvenile effects confirmed in stable carbon and oxygen isotopes of European larch trees, Acta Silvae et Ligni, 111, 27–33, https://doi.org/10.20315/ASetL.111.3, 2016.
Klesse, S., Weigt, R., Treydte, K., Saurer, M., Schmid, L., Siegwolf, R. T., and Frank, D. C.: Oxygen isotopes in tree rings are less sensitive to changes in tree size and relative canopy position than carbon isotopes, Plant Cell Environ., 41, 2899–2914, https://doi.org/10.1111/pce.13424, 2018.
Körner, C.: Alpine plant life: functional plant ecology of high mountain ecosystem, Springer Science & Business Media, Berlin and Heidelberg, Germany, ISBN 978-3-642-18970-8, 2003.
Kress, A., Saurer, M., Siegwolf, R. T., Frank, D. C., Esper, J., and Bugmann, H.: A 350 year drought reconstruction from Alpine tree ring stable isotopes, Global Biogeochem. Cy., 24(2), https://doi.org/10.1029/2009GB003613, 2010.
Labuhn, I., Daux, V., Pierre, M., Stievenard, M., Girardclos, O., Féron, A., Genty, D., Masson-Delmotte, V., and Mestre, O: Tree age, site and climate controls on tree ring cellulose δ18O: A case study on oak trees from south-western France, Dendrochronologia, 32, 78–89, https://doi.org/10.1016/j.dendro.2013.11.001, 2014.
Leavitt, S. W.: Tree-ring C–H–O isotope variability and sampling, Sci. Total Environ., 408, 5244–5253, 2010.
Leuenberger, M.: To what extent can ice core data contribute to the understanding of plant ecological developments of the past?, Terrestrial ecology, 1, 211–233, https://doi.org/10.1016/j.scitotenv.2010.07.057, 2007.
Li, Z.-H., Leavitt, S. W., Mora, C. I., and Liu, R.-M: Influence of earlywood–latewood size and isotope differences on long-term tree-ring δ13C trends, Chem. Geol., 216, 191–201, https://doi.org/10.1016/j.chemgeo.2004.11.007, 2005.
Lipp, J., Trimborn, P., Graff, W., and Becker, B.: Climatic significance of D/H ratios in the cellulose of late wood in tree rings from spruce (Picea abies L.), in: Isotope techniques in the study of past and current environmental changes in the hydrosphere and the atmosphere, International symposium on applications of isotope techniques in studying past and current environmental changes in the hydrosphere and the atmosphere, Vienna, Austria, 19–23 April 1993, IAEA-SM-329/44, 1993.
Loader, N., Street-Perrott, F., Daley, T., Hughes, P., Kimak, A., Levanic, T., Mallon, G., Mauquoy, D., Robertson, I., and Roland, T.: Simultaneous Determination of Stable Carbon, Oxygen, and Hydrogen Isotopes in Cellulose, Anal. Chem., 87, 376–380, https://doi.org/10.1021/ac502557x, 2015.
Matsushita, M., Takata, K., Hitsuma, G., Yagihashi, T., Noguchi, M., Shibata, M., and Masaki, T.: A novel growth model evaluating age–size effect on long-term trends in tree growth, Funct. Ecol., 29(10), 1250–1259, https://doi.org/10.1111/1365-2435.12416, 2015.
Mayr, C., Frenzel, B., Friedrich, M., Spurk, M., Stichler, W., and Trimborn, P.: Stable carbon-and hydrogen-isotope ratios of subfossil oaks in southern Germany: methodology and application to a composite record for the Holocene, The Holocene, 13, 393–402, https://doi.org/10.1191/0959683603hl632rp, 2003.
McCarroll, D. and Loader, N. J.: Stable isotopes in tree rings, Quaternary Sci. Rev., 23, 771–801, https://doi.org/10.1016/j.quascirev.2003.06.017, 2004.
McCarroll, D. and Pawellek, F.: Stable carbon isotope ratios of Pinus sylvestris from northern Finland and the potential for extracting a climate signal from long Fennoscandian chronologies, The Holocene, 11, 517–526, https://doi.org/10.1191/095968301680223477, 2001.
Monserud, R. A. and Marshall, J. D.: Time-series analysis of δ13C from tree rings. I. Time trends and autocorrelation, Tree Physiol., 21, 1087–1102, https://doi.org/10.1093/treephys/21.15.1087, 2001.
Nagavciuc, V., Kern, Z., Perşoiu, A., Kesjár, D., and Popa, I.: Aerial decay influence on the stable oxygen and carbon isotope ratios in tree ring cellulose, Dendrochronologia, 49, 110–117, https://doi.org/10.1016/j.dendro.2018.03.007, 2018.
Nagavciuc, V., Ionita, M., Perșoiu, A., Popa, I., Loader, N. J., and McCarroll, D.: Stable oxygen isotopes in Romanian oak tree rings record summer droughts and associated large-scale circulation patterns over Europe, Clim. Dynam., 52, 6557–6568, https://doi.org/10.1007/s00382-018-4530-7, 2019.
Nagavciuc, V., Kern, Z., Ionita, M., Hartl, C., Konter, O., Esper, J., and Popa, I.: Climate signals in carbon and oxygen isotope ratios of Pinus cembra tree-ring cellulose from the Călimani Mountains, Romania, Int. J. Climatol., 40(5), 2539–2556, https://doi.org/10.1002/joc.6349, 2020.
Nicolussi, K., Kaufmann, M., Melvin, T. M., Van Der Plicht, J., Schießling, P., and Thurner, A.: A 9111 year long conifer tree-ring chronology for the European Alps: a base for environmental and climatic investigations, The Holocene, 19, 909–920, https://doi.org/10.1177/0959683609336565, 2009.
Ott, E.: Uber die Abhangigkeit des Radialzuwachses und der Oberhohen bei Fichte und Larche von der Meereshohe und Exposition im Lotschental, J For Suisse, 169:193, 1978.
Raffalli-Delerce, G., Masson-Delmotte, V., Dupouey, J., Stievenard, M., Breda, N., and Moisselin, J.: Reconstruction of summer droughts using tree-ring cellulose isotopes: a calibration study with living oaks from Brittany (western France), Tellus B, 56, 160–174, https://doi.org/10.3402/tellusb.v56i2.16405, 2004.
Reinig, F., Nievergelt, D., Esper, J., Friedrich, M., Helle, G., Hellmann, L., Kromer, B., Morganti, S., Pauly, M., and Sookdeo, A.: New tree-ring evidence for the Late Glacial period from the northern pre-Alps in eastern Switzerland, Quaternary Sci. Rev., 186, 215–224, https://doi.org/10.1016/j.quascirev.2018.02.019, 2018.
Saurer, M., Cherubini, P., and Siegwolf, R.: Oxygen isotopes in tree rings of Abies alba: The climatic significance of interdecadal variations, J. Geophys. Res.-Atmos., 105, 12461–12470, https://doi.org/10.1029/2000JD900160, 2000.
Saurer, M., Siegwolf, R. T., and Schweingruber, F. H.: Carbon isotope discrimination indicates improving water-use efficiency of trees in northern Eurasia over the last 100 years, Glob. Change Biol., 10, 2109–2120, https://doi.org/10.1111/j.1365-2486.2004.00869.x, 2004.
Suess, H. E.: Radiocarbon concentration in modern wood, Science, 122, 415–417, 1955.
Treydte, K., Schleser, G. H., Schweingruber, F. H., and Winiger, M.: The climatic significance of δ13C in subalpine spruces (Lötschental, Swiss Alps) a case study with respect to altitude, exposure and soil moisture, Tellus, 53, 593–611, doi:10.3402/tellusb.v53i5.16639, 2001.
Treydte, K. S., Schleser, G. H., Helle, G., Frank, D. C., Winiger, M., Haug, G. H., and Esper, J.: The twentieth century was the wettest period in northern Pakistan over the past millennium, Nat. Clim. Change, 440, 1179, https://doi.org/10.1038/nature04743, 2006.
Wieser, G., Oberhuber, W., Gruber, A., Leo, M., Matyssek, R., and Grams, T. E. E.: Stable water use efficiency under climate change of three sympatric conifer species at the alpine treeline, Front. Plant. Sci., 7, 799, doi:10.3389/fpls.2016.00799, 2016.
Wieser, G., Oberhuber, W., Waldboth, B., Gruber, A., Matyssek, R., Siegwolf, R. T., and Grams, T. E.: Long-term trends in leaf level gas exchange mirror tree-ring derived intrinsic water-use efficiency of Pinus cembra at treeline during the last century, Agr. Forest Meteorol., 248, 251–258, 2018.
Young, G. H., Demmler, J. C., Gunnarson, B. E., Kirchhefer, A. J., Loader, N. J., and McCarroll, D.: Age trends in tree ring growth and isotopic archives: A case study of Pinus sylvestris L. from northwestern Norway, Global Biogeochem. Cy., 25:GB2020, https://doi.org/10.1029/2010GB003913, 2011.
Ziehmer M. M., Nicolussi, K., Schlüchter, C., and Leuenberger, M.: Preliminary evaluation of the potential of tree-ring cellulose content as a novel supplementary proxy in dendroclimatology, Biogeosciences, 15, 1047–1064, https://doi.org/10.5194/bg-15-1047-2018, 2018.