the Creative Commons Attribution 4.0 License.
the Creative Commons Attribution 4.0 License.
 | 05 Mar 2021
Winter atmospheric nutrient and pollutant deposition on Western Sayan Mountain lakes (Siberia)
Daniel Diaz-de-Quijano
Aleksander Vladimirovich Ageev
Elena Anatolevna Ivanova
Olesia Valerevna Anishchenko
The world map of anthropogenic atmospheric nitrogen deposition and its effects on natural ecosystems is not described with equal precision everywhere. In this paper, we report atmospheric nutrient, sulfate and spheroidal carbonaceous particle (SCP) deposition rates, based on snowpack analyses of a formerly unexplored Siberian mountain region. Then, we discuss their potential effects on lake phytoplankton biomass limitation.
We estimate that the nutrient depositions observed in the late-season snowpack (40 ± 16 mg NO3-N m−2 and 0.58 ± 0.13 mg TP-P m−2; TP for total phosphorous) would correspond to yearly depositions lower than 119 ± 71 mg NO3-N m−2 yr−1 and higher than 1.71 ± 0.91 mg TP-P m−2 yr−1. These yearly deposition estimates would approximately fit the predictions of global deposition models and correspond to the very low nutrient deposition range, although they are still higher than world background values.
In spite of the fact that such a low atmospheric nitrogen deposition rate would be enough to induce nitrogen limitation in unproductive mountain lakes, phosphorus deposition was also extremely low, and the resulting lake water N : P ratio was unaffected by atmospheric nutrient deposition. In the end, the studied lakes' phytoplankton appeared to be split between phosphorus and nitrogen limitation. We conclude that these pristine lakes are fragile sensitive systems exposed to the predicted climate warming, increased winter precipitation, enhanced forest fires and shifts in anthropogenic nitrogen emissions that could finally couple their water chemistry to that of atmospheric nutrient deposition and unlock temperature-inhibited responses of phytoplankton to nutrient shifts.
- Article
(4390 KB) - Full-text XML
- BibTeX
- EndNote


Worldwide nitrogen cycle perturbation is the second most important global environmental concern, just after massive extinction of species and even more important than global warming (Rockström et al., 2009; Steffen et al., 2015). The anthropogenic mobilization of formerly inaccessible nitrogen compartments has more than doubled natural nitrogenase-mediated inputs of reactive nitrogen forms into the global nitrogen cycle (Vitousek et al., 1997). Massive fossil fuel combustion since the industrial revolution, chemical fixation of atmospheric diatomic nitrogen to produce fertilizers since the Second World War and the wide extension of leguminous crops are the most important human sources of nitrogen cycle perturbation (Vitousek et al., 1997). A substantive part of this anthropogenic reactive nitrogen is then spread, air-transported and deposited all over the world with a diverse impact on different ecosystems.
The effects of atmospheric nitrogen deposition on primary production have been documented in the usually nitrogen-limited terrestrial ecosystems (Bobbink et al., 2010; DeForest et al., 2004; Güsewell, 2004; LeBauer and Treseder, 2008), as well as in commonly phosphorus-limited lakes (Bergström et al., 2005). A series of studies all over Sweden and abroad showed atmospheric nitrogen deposition turned unproductive lake phytoplankton from natural nitrogen to induced phosphorus limitation (Bergström and Jansson, 2006; Bergström et al., 2005; Elser et al., 2009) when temperature was not a limiting factor (Bergström et al., 2013). Of course, these changes do not only concern primary production limitation but also primary producer species composition, cascade effects over the food web, secondary production, species interactions, etc. Likewise, these studies showed that it was reasonable to study the relationship between atmospheric nutrient deposition and lake phytoplankton growth limitation independently from biogeochemical processes occurring at the levels of the watershed, runoff and river transport, lake sediments, etc.
Nevertheless, ecological processes are not homogeneous around the world. There is a particular and dynamic geography of reactive nitrogen sources, an atmospheric conveyor belt with a conspicuous structure, an evolving climate with patchy temperature and precipitation changes, and a multiplicity of lake districts with distinct individual lakes in them. If it is true that climatic and atmospheric nutrient deposition models have helped a lot to describe this geography, the latter ones lack empirical measurements for some regions elsewhere in the world, which might undermine their regional spatial reliability in comparison to climate models (Fagerli et al., 2019; Gauss et al., 2019; Lamarque et al., 2013; Mahowald et al., 2008). Moreover, not all lake districts of the world have been studied with the same intensity, so certain processes might be overlooked, and the limnological paradigms might be site-biased (Marcé et al., 2015). In this study, we analyzed the snowpack in the Western Sayan Mountains (south-central Siberia) in order to gauge atmospheric nitrogen, phosphorus, sulfate and spheroidal carbonaceous particle (SCP) deposition rates. As far as we know, no such measurements had been pursued in this site before, so they might be useful to contrast and inform world deposition models. Besides, we have also assessed the lake phytoplankton nutrient limitation regime and discussed the potential influence of nutrient deposition on it.
According to published global models (IPCC, 2013; Lamarque et al., 2013), the Western Sayan Mountains, in south-central Siberia, correspond to a low atmospheric nitrogen deposition area with a cold but increasingly warming climate in the last decades. Our aim was to corroborate it because in case it was confirmed, it would be an adequate site to study the effects of global warming on ecosystems with a minimal interference of atmospheric nitrogen deposition. In other words, identifying and studying such areas could help disentangle warming and nitrogen fertilization as drivers of ecological change. It could also contribute to assessing the worthiness of implementing global nitrogen cycle policies other than climate ones.
2.1 Study site and sampling
The Western Sayan Mountain range is located in south-central Siberia (Fig. 1). It has a central position in the Altai–Sayan mountain system, in between the Altai Mountains (to the west) and Eastern Sayan Mountains (to the east), which are constituents of the Sayan–Baikal mobile fold belt south of the Siberian craton (Logatchev, 1993). Western Sayan orogeny occurred in the ancient Paleozoic, by folding Paleozoic and Precambrian deposits, during the Baikal tectogenesis and in the Cenozoic era (namely during the Pliocene and Pleistocene epochs) (Chernov et al., 1988). With a northwestern orientation and heights from 400 to 2700 m a.s.l., the Western Sayan Mountains combine old eroded and typical glacial reliefs, carved during the Pleistocene glaciation in the highest ridges. The source of Yenisei River, the first Siberian river in terms of discharge, is located in the Western Sayan Mountains, and its headwater tributaries are also Sayanic.

Figure 1Distribution of sampling points in the Ergaki Natural Park. Snow cores: Tsirkovoe (A), Oiskoe (B) and Tushkan (C). Lakes: Tsirkovoe (1), Oiskoe (2), Raduzhnoe (3), Karovoe (4) and Svetloe (5). Olenya Rechka Meteorological Station (M). Ergaki location in Eurasia. Mountain ridge (gray), open spaces (white), forest and bushes (green), and three-lane federal road (yellow). Source: http://www.shandl.narod.ru/map.htm and Wikipedia CC BY-SA 3.0.
The present study was performed in the Ergaki Natural Park, in the Western Sayan Mountains. With an altitude range from 700 to 2466 m a.s.l., this park is well known for the glacial landscapes of both Ergaki and Aradan ridges embedded in a boreal mountainous taiga matrix that extends far to the north. The landscape is spattered with monumental and pictoric granite–syenite rocks, and the general geology is rich in granitoids (Voskresenskii, 1962). South from the park, sub-boreal larch taigas and central Asian steppes develop. The closest gardens and agricultural fields are located downhill more than 35 km north from the northernmost sampling point and constitute a modest patch within the taiga matrix. Meteorological conditions in the Ergaki Natural Park are characterized by high precipitation (1243 mm) and extreme temperatures, ranging from −36.8 to +33.3 ∘C (Fig. 2a). From a geobotanical point of view the park is located in the holarctic kingdom, circumboreal region and Altai–Sayan province (Takhtadzhyan, 1978). An exhaustive floristic description is available in Stepanov (2016), where our study area corresponds to the L3 district.
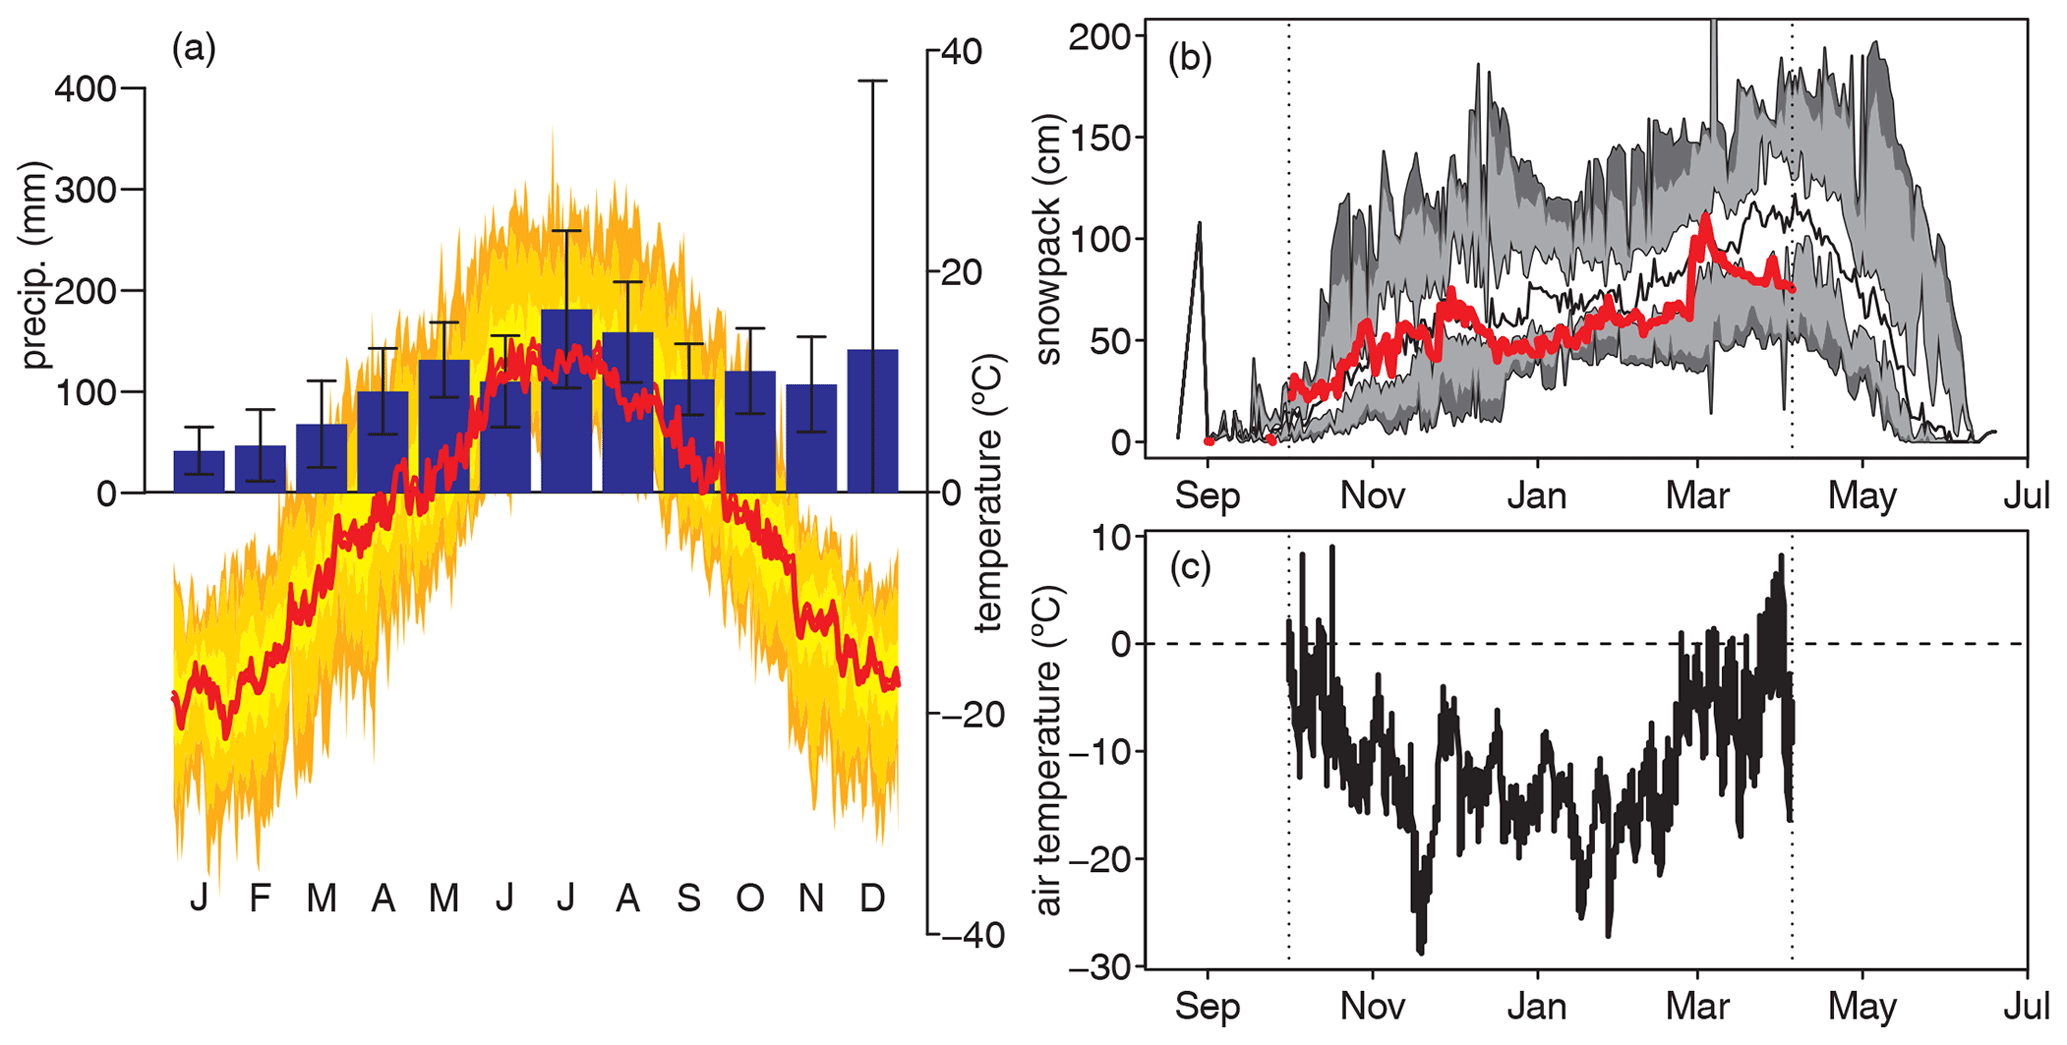
Figure 2Records at the Olenya Rechka Meteorological Station. (a) Climograph (1 February 2005–30 April 2019). The median yearly precipitation was 1242.975 mm, with winter (2 October to 5 April) and summer precipitations of 464.95 and 778.025 mm, respectively. Temperature: median (red), interquartile range (yellow band), 5th to 25th percentiles and 75th to 95th percentiles (lower and upper golden bands), and below the 5th percentile and above the 95th percentile (lower and upper orange bands). (b) Snowpack thickness (2005–2017): median (black), interquartile range (white band), 5th to 25th percentiles and 75th to 95th percentiles (lower and upper light gray bands), and below the 5th percentile and above the 95th percentile (lower and upper dark gray bands). The red line corresponds to the 2016–2017 snowpack thickness record until the snow sampling date. (c) Air temperatures measured every 3 h during the time period when analyzed snowpacks were laying on their respective locations (2016–2017).
Snowpack cores were sampled at three sites of the Ergaki Natural Park: next
to Lake Tsirkovoe (![]() ), next to Lake Oiskoe (
), next to Lake Oiskoe (![]() ) and on a forest
glade close to Tushkan stream (
) and on a forest
glade close to Tushkan stream (![]() ) (Fig. 1 and Table 1). Snow sampling was
conducted on 5 April 2017, integrating a snowfall period of 6 months
and 5 d according to precipitation data recorded in the nearby Olenya
Rechka Meteorological Station (http://rp5.ru, last access: 5 September 2018). The 1 and
24 September 2016 snowfalls, which were thinner than 0.5 and 2 cm, respectively,
were registered, but they melted the following day. The first important
snowfall occurred on the evening of 1 October 2016 and left a 22 cm pack
that was not significantly reduced anymore until the sampling day (Fig. 2b). Air temperatures recorded in the mentioned meteorological station during
this time window were mostly below zero, with positive temperatures only for
some hours around midday during the first and last weeks (Fig. 2c).
) (Fig. 1 and Table 1). Snow sampling was
conducted on 5 April 2017, integrating a snowfall period of 6 months
and 5 d according to precipitation data recorded in the nearby Olenya
Rechka Meteorological Station (http://rp5.ru, last access: 5 September 2018). The 1 and
24 September 2016 snowfalls, which were thinner than 0.5 and 2 cm, respectively,
were registered, but they melted the following day. The first important
snowfall occurred on the evening of 1 October 2016 and left a 22 cm pack
that was not significantly reduced anymore until the sampling day (Fig. 2b). Air temperatures recorded in the mentioned meteorological station during
this time window were mostly below zero, with positive temperatures only for
some hours around midday during the first and last weeks (Fig. 2c).
Table 1Sampling sites and distance to local perturbations. Temporary summer camps are present on the shore of Lake Svetloe and used to be on that of Lake Raduzhnoe. See Table S1 from Diaz-de-Quijano et al. (2020) for lake and watershed cover characteristics.
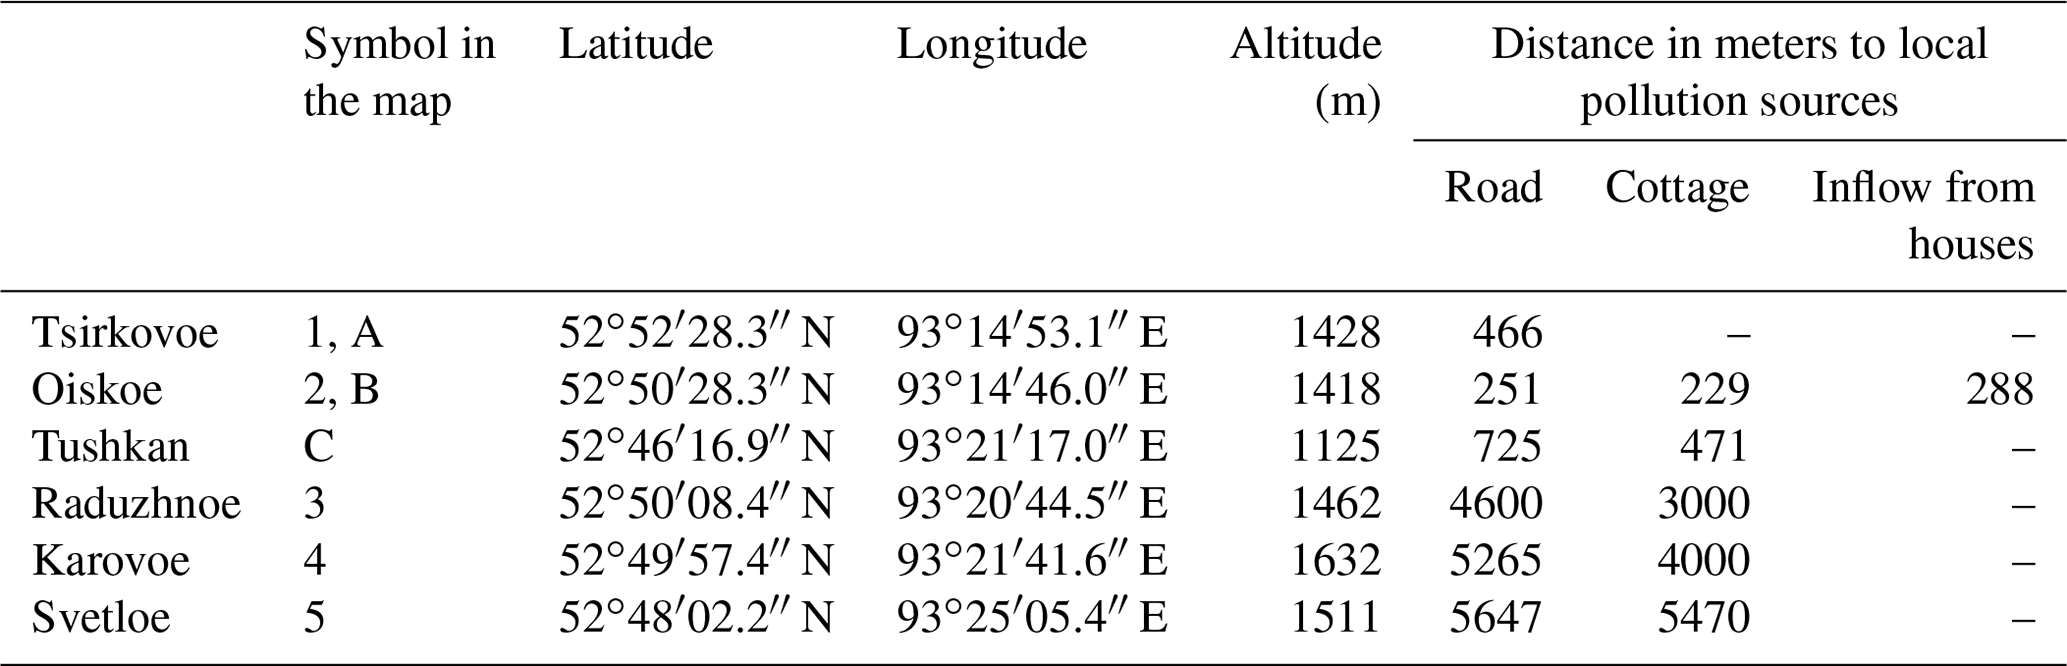
The snow core sampling was conducted following a modified version of the MOLAR (Mountain Lake Research) project protocols for atmospheric deposition assessment (Mosello et al., 1997). Sampling areas were chosen on a map to be accessible but as far as possible from local sources of air pollution. Definitive locations were also chosen to represent average snowpack thicknesses by checking it across the sampling areas using a snow probe. Hence, wind- and orography-induced secondary modifications of the snowpack were minimized. An aluminum tube and piston (1 m × 2.5 cm inner diameter), plastic shovel, plastic containers and rubber gloves were soaked in ∼4 % HCl and MQ (Milli-Q) water rinsed before being used to pick up snow cores. A protective mask and synthetic clothes were worn during sampling. The snow was stored in the plastic containers and kept at −20 ∘C until further analyses. Two cores divided in three segments (0–40, 40–80 and 80–115 cm) were sampled at Tsirkovoe, whereas three cores divided in two segments (0–60 and 60–115 cm) were sampled at Oiskoe and Tushkan.
A selection of five accessible Ergaki mountain lakes was chosen to represent
a variety in dimensions, altitude and watershed vegetation covers (Fig. 1,
Table 1 and Table S1 from Diaz-de-Quijano et al., 2020). Lake Oiskoe and Lake Svetloe (![]() ) are relatively large
forest lakes (0.57 and 0.37 km2 and 21 and 24 m maximum depth, respectively) with low
water transparency (4 and 8 m average Secchi disk, respectively). Lake Tsirkovoe,
Lake Raduzhnoe (
) are relatively large
forest lakes (0.57 and 0.37 km2 and 21 and 24 m maximum depth, respectively) with low
water transparency (4 and 8 m average Secchi disk, respectively). Lake Tsirkovoe,
Lake Raduzhnoe (![]() ) and Lake Karovoe (
) and Lake Karovoe (![]() ) are located at an alpine
landscape and are smaller and shallower (0.02, 0.03 and 0.08 km2,
respectively; 15, 4 and 7 m deep, respectively). Secchi disk was not tested
at Lake Tsirkovoe, but at Lake Raduzhnoe and Lake Karovoe lake beds were visible. Lake Karovoe and
Lake Svetloe represent 7 % of the watershed area; Lake Tsirkovoe and Lake Oiskoe represent 5 %; and Lake Raduzhnoe is only 1.4 % of its watershed area.
) are located at an alpine
landscape and are smaller and shallower (0.02, 0.03 and 0.08 km2,
respectively; 15, 4 and 7 m deep, respectively). Secchi disk was not tested
at Lake Tsirkovoe, but at Lake Raduzhnoe and Lake Karovoe lake beds were visible. Lake Karovoe and
Lake Svetloe represent 7 % of the watershed area; Lake Tsirkovoe and Lake Oiskoe represent 5 %; and Lake Raduzhnoe is only 1.4 % of its watershed area.
As for vegetation cover, the Lake Oiskoe and Lake Svetloe watersheds have a 25 % and 28 % forest cover, whereas the other lakes have less than 10 % forest cover. These two watersheds are quite similar in terms of land cover: they have quite equilibrated percentages of forests, shrubs, meadows and scree. Lake Oiskoe is also the watershed with the highest peatland cover (6 %), followed by Lake Svetloe (3 %) and Lake Raduzhnoe (1.6 %). The Lake Karovoe and Lake Raduzhnoe watersheds are dominated by scree (73 % and 52 %, respectively) and meadows (14 % and 24 %, respectively), whereas the Lake Tsirkovoe watershed is dominated by shrubs (56 %) and scree (37 %).
Lake water was sampled at different depths (from one to five separate depths or with a composite sample from those depths, depending on the sampling expedition, see Table S2 from Diaz-de-Quijano et al., 2020) and consequently analyzed for chlorophyll and nutrient content in early September 2015 (Lake Tsirkovoe, Lake Oiskoe and Lake Raduzhnoe) and in late August 2017 (Lake Tsirkovoe, Lake Oiskoe and Lake Karovoe). Data from a previously published study integrating June and August samplings for 2011–2012 (Lake Oiskoe, Lake Raduzhnoe, Lake Karovoe and Lake Svetloe) were also used (Anishchenko et al., 2015). Water samples were sieved in situ to remove zooplankton, transported to the field laboratory at 4–10 ∘C in the dark, filtered for chlorophyll analyses and frozen at −20 ∘C for further chemical analyses.
2.2 Chemical analyses
Snow and lake water samples were fully thawed and stirred before analyses. Snow water equivalent (SWE) was calculated by multiplying the snowpack depth and the ratio of melted water volume to sampled snow volume. Samples were gently vacuum-filtered for , , soluble reactive phosphorus – SRP – and analyses and filtered with single-use plastic syringes for NH analyses. Cellulose filters were used in the 2011 and 2012 surveys according to the Russian national standards (Gladyshev et al., 2015; Tolomeev et al., 2014), and “Porafil” 0.45 µm membrane filters (Macherey-Nagel, Germany) were used in 2015 and 2017. Nitrate was reduced to by the cadmium reduction method. Nitrite was determined by the colorimetric method after reacting with sulfanilamide and α-naphthylamine. Detection limits were 0.001 mg N- L−1, 0.0002 mg N- L−1 and 0.011 mg N-NH4 L−1. Lake water dissolved inorganic nitrogen (DIN) was calculated as the sum of nitrate, nitrite and ammonium. Soluble reactive phosphorus was assessed using the ascorbic acid and ammonium molybdate method. Total phosphorus (TP) was measured the same way after persulfate digestion of unfiltered samples. In the 2015 survey, lake water TP was calculated as the sum of soluble reactive phosphorus and seston particulate phosphorus (PP). The latter was collected on the abovementioned membrane filters and measured after persulfate digestion. All these analyses were made according to the Russian national standards (Gladyshev et al., 2015; Tolomeev et al., 2014), which generally coincide to those from the American Public Health Association (APHA) (APHA, 1989). In 2015 nutrients were measured using a Lachat QuickChem 8500 Series 2 Flow Injection Analysis (FIA) System (Hach Ltd, Loveland, CO, USA). The method detection limits (MDLs) were 0.0263 mg N-NO3 L−1, 0.0057 mg N-NO2 L−1, 0.0479 mg N-NH3 L−1 and 0.0011 mg P-PO4 L−1. As for analysis, snow and lake water samples were concentrated by heating; a HClO4 and HNO3 mixture was added and evaporated; and then an ion-exchange column was used to remove interferences of cations. Samples were titrated with a BaCl2 solution in the presence of nitrochromazo until the appearance of a blue color (Kalacheva et al., 2002). Finally, total nitrogen (TN) was digested from total snow and lake water samples using persulfate and boric acids and subsequently transformed into (Grasshoff et al., 1983). The natural light absorption of this nitrate at 210 nm was determined using a SPEKOL 1300 photometer (Analytik Jena, Germany) and corrected for organic matter interference by subtracting absorption at 275 nm (Slanina et al., 1976).
2.3 Chlorophyll and SCP analyses
A known fraction of melted snow samples was filtered through glass fiber filters (Whatman GF/C) to collect SCPs (Mosello et al., 1997). Nitric, hydrofluoric and chlorhydric acids were used to remove organic, siliceous and carbonate material, respectively (Rose, 1994; Yang et al., 2001). Determinate fractions of the samples were mounted on NAPHRAX and counted at 400 times zoom under an Axiostar Plus microscope (Zeiss). Negative controls and a sediment reference standard were likewise processed to correct final counts for eventual experimental bias (Rose, 2008).
Phytoplankton chlorophyll was assessed according to the UNESCO (United Nations Educational, Scientific and Cultural Organization) standard protocols (Wright et al., 1997). Samples had been filtered in the field laboratory through BaSO4-covered Porafil 0.45 µm membrane filters (Macherey-Nagel, Germany), folded inwards and frozen. They were then left to thaw, dried in the dark and scraped along with BaSO4 into centrifuge tubes. Pigments were extracted in 100 % acetone for 9 h in the dark at +4 ∘C. After filtration through 0.2 µm polycarbonate filters, MQ water was added to get pigments dissolved in a 90 % acetone solution (final concentration). Photometric measurements were used to calculate chlorophyll concentrations (Jeffrey and Humphrey, 1975).
2.4 Air mass retro-trajectory analysis, maps and statistics
The retro-trajectories of air masses flowing on the three snow sampling sites were obtained using the Hybrid Single-Particle Lagrangian Integrated Trajectory (HYSPLIT) model for archive trajectories (Rolph et al., 2017; Stein et al., 2015) of the National Oceanic and Atmospheric Administration Air Resources Laboratory (NOAA ARL, USA). A total of 187 daily retro-trajectories embracing the sampled period of atmospheric deposition were reconstructed as the snowpack bulk deposition airshed. Each trajectory started 3 d back in the past. It recorded the latitude, longitude and altitude coordinates every hour and ended up at the snow sampling coordinates, at 0 m above model ground level at 24 h for consecutive days. All the analyses were performed within the R environment (R Development Core Team, 2017). Total retro-trajectory length and average wind speed the hour before getting to the sampling point were calculated using the Vincenty (ellipsoid) distance method within the “geosphere” package (Hijmans, 2017). The “openair” package was used to determine wind direction and to draw wind roses (Carslaw and Ropkins, 2012). The number of coordinates per hour at 0 m above model ground level was calculated to characterize the direct interaction of each air mass with Earth's crust. Retro-trajectories were mapped using the “ggmap” package (Kahle and Wickham, 2013). One-way ANOVA comparing sites and Pearson correlation analyses of chemical and wind variables in the seven analyzed snow core sections were performed using built-in functions of the R statistical environment.
Detailed watershed land cover and land use maps were manually defined for each lake. Polygons were defined using QGIS 3.14.16-Pi on the basis of Google Satellite and OpenStreetMap XYZ tiles at a resolution that distinguished single trees. Lakes, whole watersheds, and different vegetation and land cover areas were calculated using the ellipsoidal project.
3.1 Potential fragmentation of nutrients by snow melting
The three sampled snow cores were 115 cm deep but had different snow water equivalent (SWE) values: 25 ± 1 cm in Tsirkovoe, 27 ± 1 cm in Oiskoe and 12 ± 0.3 cm in Tushkan. First of all, the snowpack temperature profile was measured to determine if snow melting could have occurred before sampling. Major snow thawing can be discarded in any of the three sampling sites because snow temperature was not around 0 ∘C but always lower. Nevertheless, the deepest snowpack layers fall within the range between −2 and 0 ∘C: Oiskoe at 110 cm deep, Tsirkovoe from 90 to 110 cm and namely Tushkan from 60 to 110 cm deep. This indicates that snowmelt was either about to occur or could have even started in these particular layers, triggering a sequential elution of solutes (Mosello et al., 1997). In that hypothetical case, snowpack-based atmospheric deposition estimates would be biased. In order to discard such a case, solute concentrations in the upper and colder snow layers were compared to those in the deeper and warmer ones (Fig. 3 and Table S3 from Diaz-de-Quijano et al., 2020).
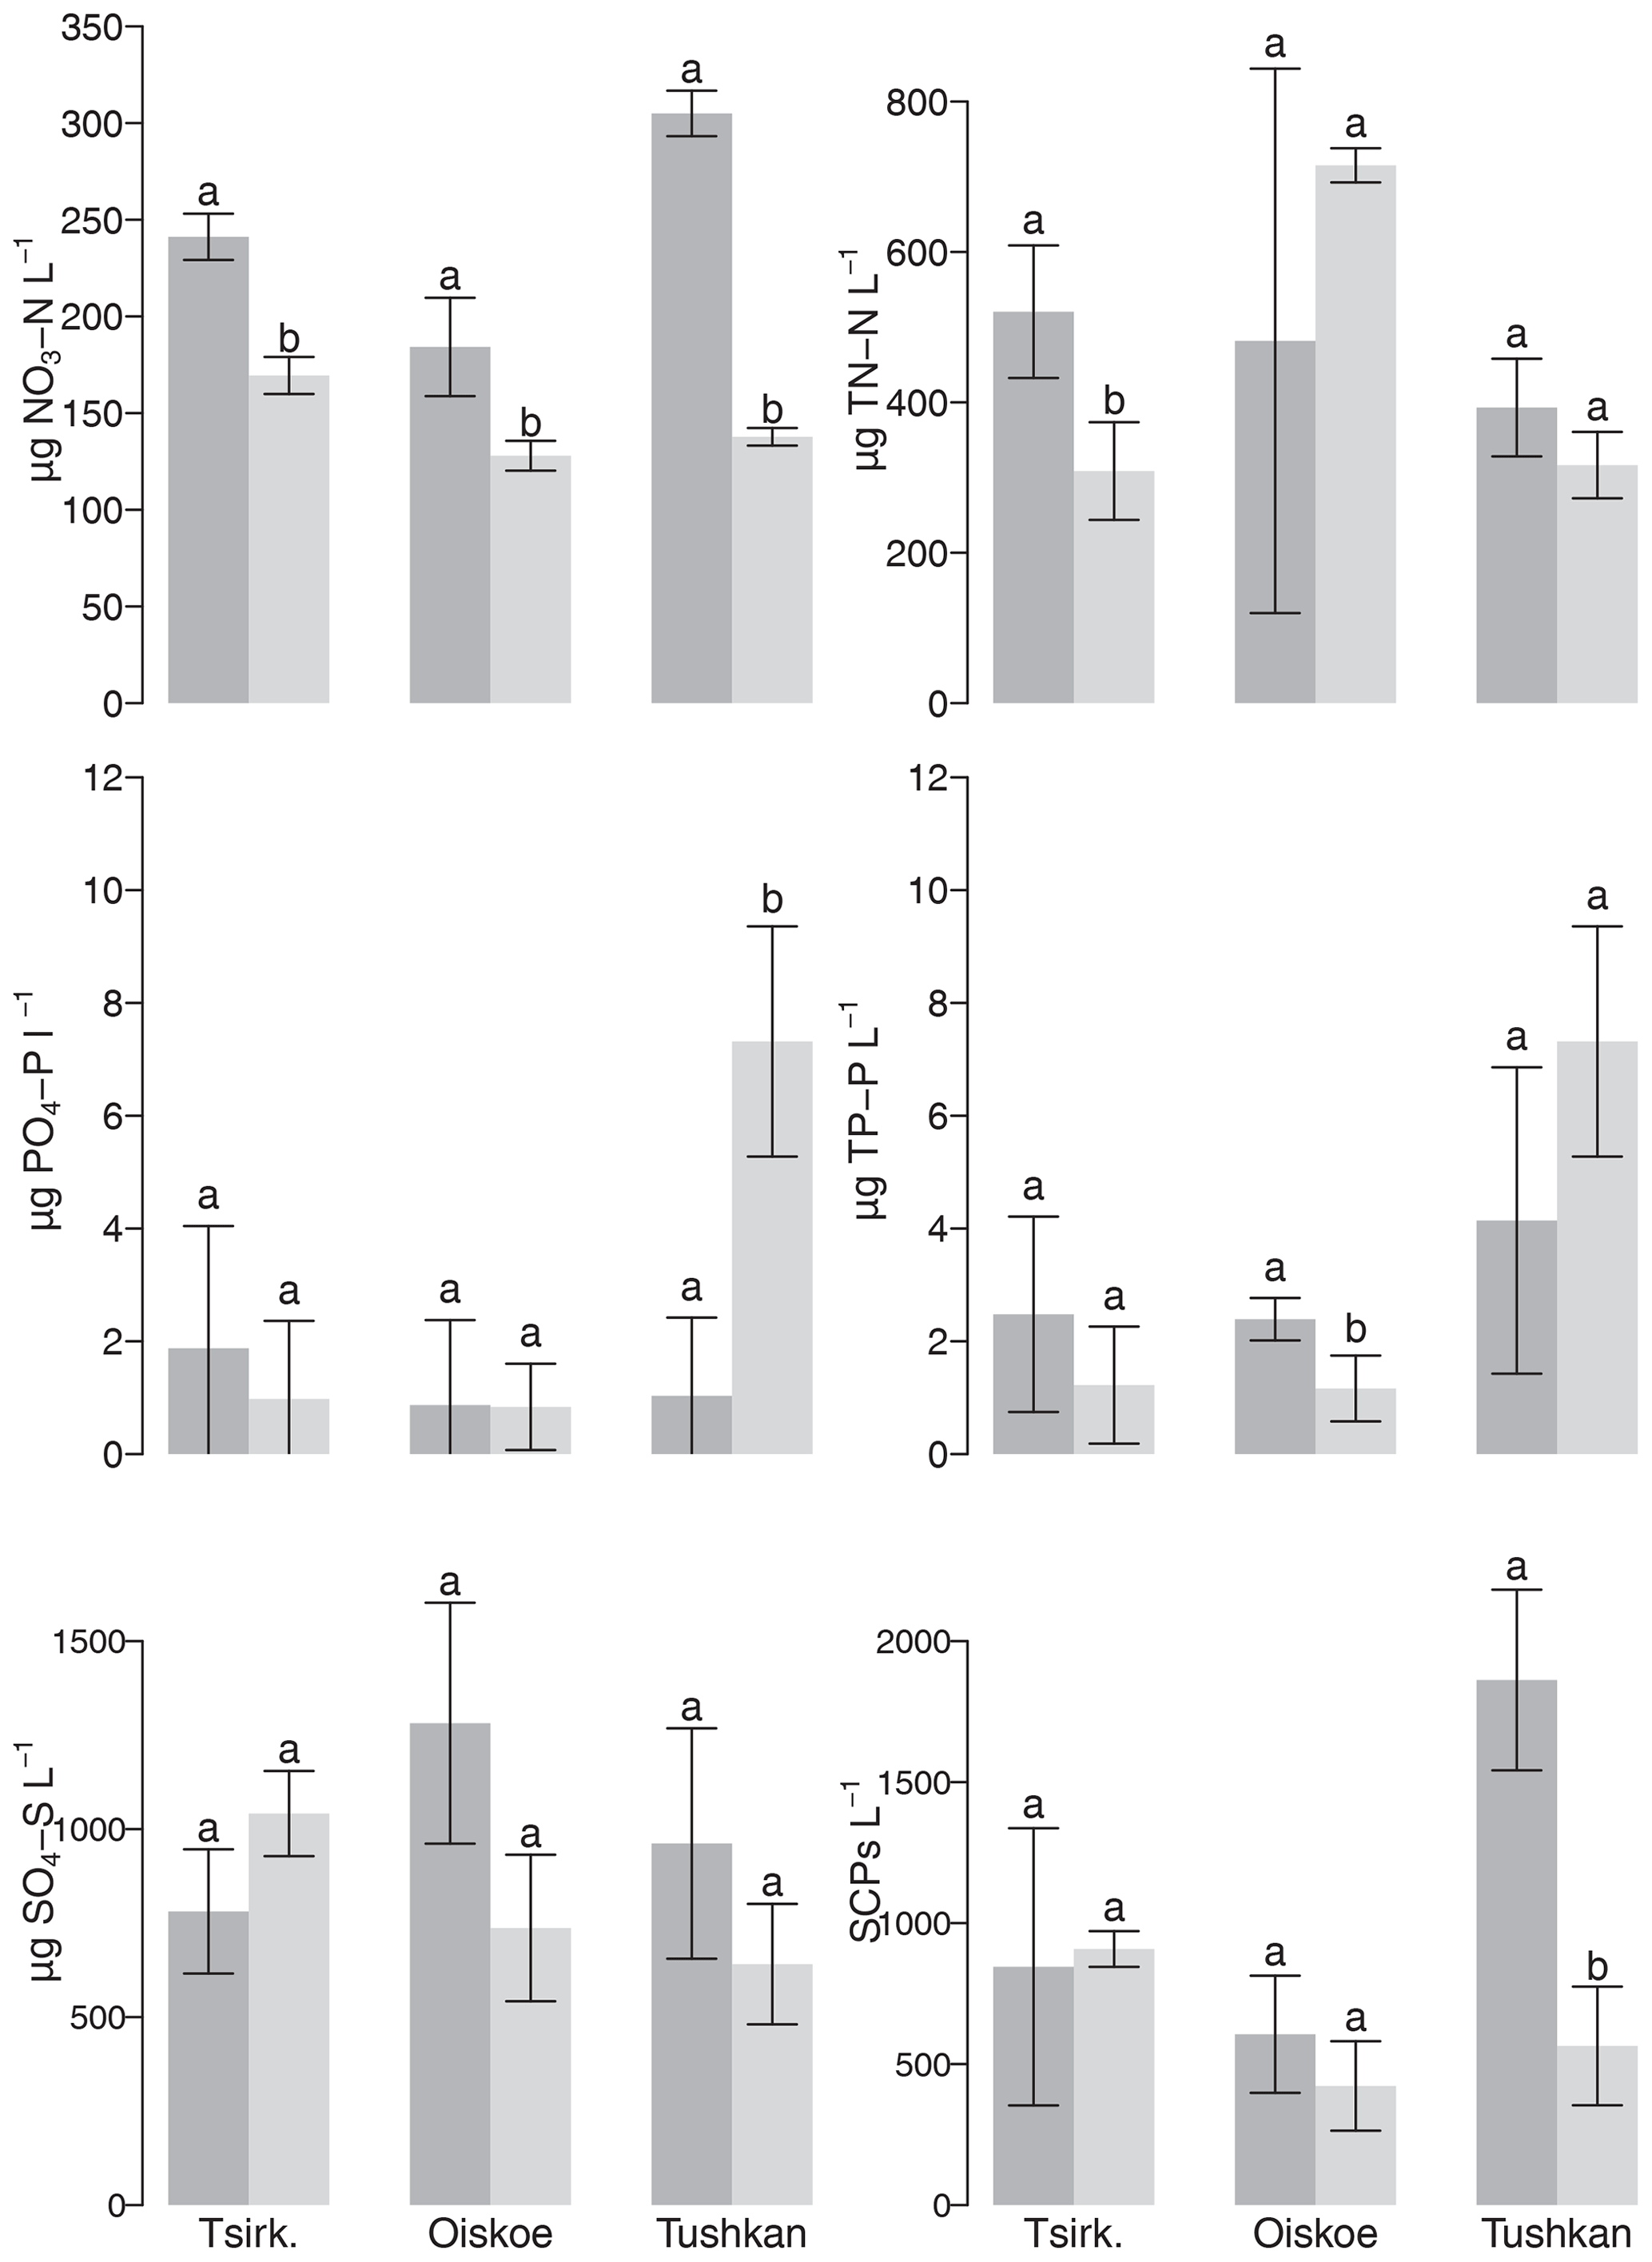
Figure 3Chemical composition of upper (dark gray) and lower (light gray) layers of the 2016–2017 snowpack in the Ergaki mountains. All values are in µg L−1 except SCPs (counts L−1). Bars represent mean values, and whiskers represent the standard deviation. The two upper layers were averaged in Tsirkovoe, where the snow core was divided into three layers. Column pairs with letters “a” and “b” are significantly different (one-way ANOVA, p-v<0.05 in the case of nitrate and t tests in the other cases; n=3 except in Tsirkovoe, where the upper layer is n=4 and the lower layer is n=2).
The hypothesis was that deeper and warmer layers, suspect of possible melting, would show lower solute concentration in case of important melting, preferentially in those solutes that elute firstly during snow melting. Yet, because the first centimeters of snowpack were formed much faster than the rest of the snowpack, it is conceivable that the deep layers were originally poorer in airborne chemicals and particles, which would affect the initial hypothesis. Indeed, the first third of snowpack thickness at the Olenya Rechka Meteorological Station deposited in only 19 d (from 1 to 19 October), whereas it took 39 d (from 1 October to 8 November) to attain half of its thickness at the sampling date (i.e. 187 d after initial snowpack formation). It is likely that the deepest Tsirkovoe, Oiskoe and Tushkan snow core segments (80–115 cm in the first case and 60–115 cm in the others) would have formed in about 19 and 39 d, respectively. Nevertheless, if the precipitation rate had a determinant effect on the vertical distribution of solute and particle content, the lower values in deeper layers should be expected in all the measured variables, and it was not the case (Fig. 3).
Thus, no significant differences were found between the upper and deeper layers in any of the measured variables except for nitrate, with lower values in the deep layers (ANOVA, p = ). The other significant differences between upper and deeper snow layers (TN in Tsirkovoe, SRP in Tushkan, TP in Oiskoe and SCPs in Tushkan; t tests) were not consistent across sampling sites (Fig. 3). Besides, sulfate also had slightly lower concentrations in the deep snow layers, but this difference was not statistically significant. This is especially explanatory because preferential elution of ions during snowmelt occurs either in the sequence of > > (Kuhn, 2001) or > > (Wang et al., 2018a), but sulfate always elutes preferentially to inorganic nitrogen species, according to the literature (Cragin et al., 1996; Kuhn, 2001; Stottlemyer and Rutkowski, 1990; Williams and Melack, 1991). In other words, higher proportions of sulfate are released during early snow-melting steps as compared to nitrate or ammonium. As a result, only significantly lower values of sulfate should be observable in incipient thawing snow layers, whereas both sulfate and nitrate would be significantly leaked at a more advanced thawing stage. Therefore, we suggest that the only observed differences in nitrate concentrations between layers might not be due to snow melting. Even if it is true that sulfate also tends to be lower at deep warm snow layers, the fact that it is non-significant allows us to discard thawing as a cause and entails sulfate load estimates that would not be thaw-biased as with any of the other solutes, which should elute at a later stage. As a conclusion, snowpack-based estimates of atmospheric deposition should always be cautiously considered, but major elution of solutes due to snow melting was not detected in the present study, probably thanks to the consistently negative temperatures along almost the whole integrated time period.
3.2 Snow nutrients and pollutants composition
Nutrient concentrations in Ergaki snowpack (Table 2 and Table S3 from Diaz-de-Quijano et al., 2020) generally take intermediate positions in comparison with other snowpack studies around the world. For instance the average of 191 ± 35 µg NO3-N L−1 in Ergaki is comparable to an old record in the Pyrenees (115 ± 106 µg NO3-N L−1, Catalan, 1989) but lower than a later one in the same mountains (280 µg NO3-N L−1, Felip et al., 1995). It also takes an intermediate position relative to the Alps: lower than in Tyrolean Alps in the early 1990s (308 µg NO3-N L−1, Felip et al., 1995) but higher than most sampling points in the French Alps in a more recent study (Dambrine et al., 2018). Finally, nitrate concentration in Ergaki snow was in between that of the Bothnian Bay of the Baltic Sea (480 ± 130 µg NO3-N L−1, Rahm et al., 1995) and the Lake Tahoe basin in the Sierra Nevada (14–138 µg NO3-N L−1, Pearson et al., 2015). Note that, paradoxically, the former is considered a region of low atmospheric nitrogen deposition (Bergström and Jansson, 2006), whereas the latter has been considered as an airborne-nutrient-enriched area (Sickman et al., 2003), where atmospheric nitrogen deposition has shifted phytoplankton limitation from N and P colimitation to persistent P limitation (Jassby et al., 1994).
Table 2Average concentrations, half-year depositions and estimated yearly deposition rates, as averaged by the three sampled sites (µg L−1, mg m−2 and mg m−2 yr−1, respectively) (SCPs in counts L−1, 103 counts m−2 and 103 counts m−2 yr−1). Mean values are shown, with the standard deviation in parenthesis; “n.d.” means non detected. Yearly deposition rates were estimated on the basis of measured winter depositions and either assuming a constant deposition rate (time-weighted estimate, third row) or a precipitation-dependent deposition rate (precipitation-weighted estimate, fourth row). See Sect. 3.3 for further discussion.
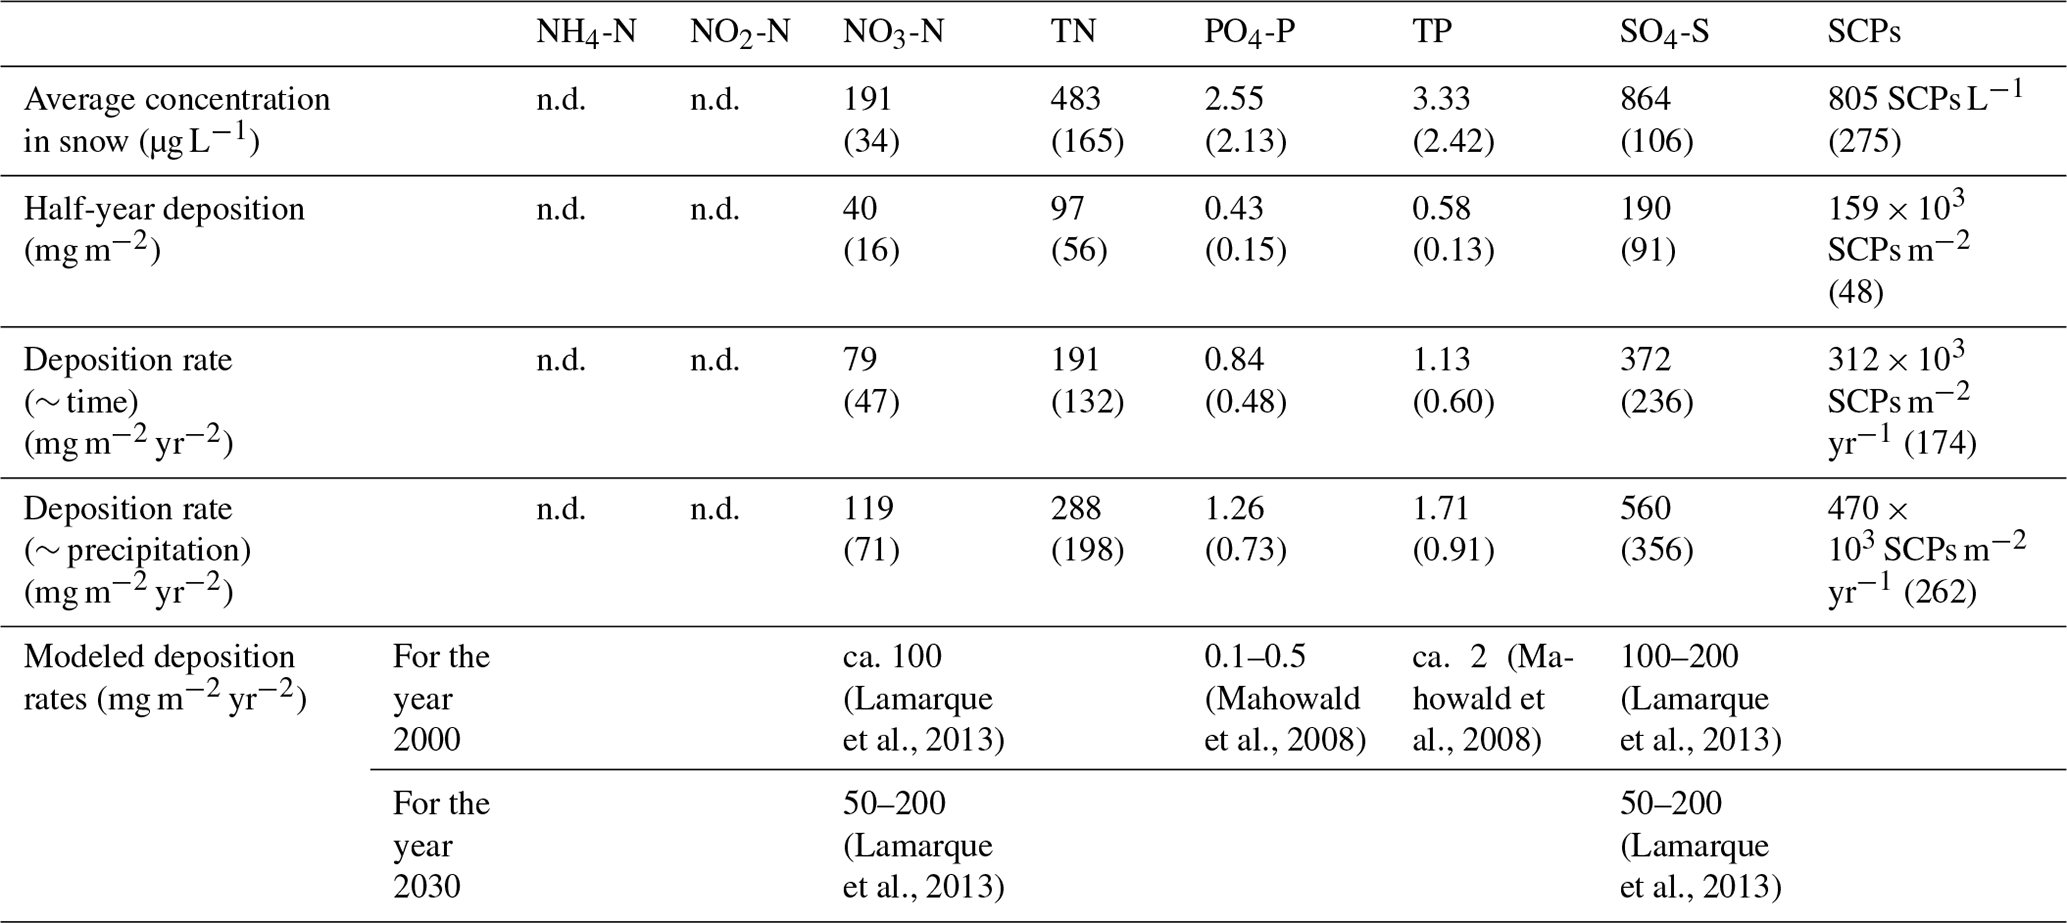
Total nitrogen and total phosphorus in Ergaki snowpack (Table 2) were higher than in the first mentioned Pyrenean study but lower than in the Baltic: 194 ± 135 and 1054 ± 363 µg TN-N L−1 and 2.38 ± 0.59 and 9.3 ± 5.1 µg TP-P L−1, respectively. Total phosphorus concentration also was within the lowest range of that measured around Lake Tahoe (3–109 µg TP-P L−1, Pearson et al., 2015). Nevertheless, ammonium and nitrite were undetectable in the present study but detected in most of the previous studies in the snowpack (e.g. Catalan, 1989; Pearson et al., 2015). Ammonium was also detected in the snow surrounding the city of Krasnoyarsk by our own lab, using the same analytical method as here (O. V. Anishchenko, unpublished data). It is very likely that ammonium concentrations in the present study were under the detection limit, as nitrate values were more than 5-fold lower than in the Krasnoyarsk snow samples, where ammonium had been detected. Finally, nutrient bioavailability is an attribute of the Ergaki snowpack, as 73 ± 12 % TP was in the form of phosphate and about 44 ± 19 % TN was nitrate.
Besides ammonium and nitrite, sulfate concentrations in Ergaki snowpack were also unusual. Sulfate was the most abundant of the measured ions. It doubled that in the Pyrenees in the late 1980s (401 ± 106 µg SO4-S L−1, Catalan, 1989) and quadrupled that on Lake Tahoe (Pearson et al., 2015). Sulfate concentration in Ergaki snowpack was only similar to the highest values in the literature for non-urban areas, such as on the southern coast of Lake Superior in the 1980s (828 ± 216 µg SO4-S L−1 on average, Stottlemyer and Rutkowski, 1990). Altogether, nitrogen and phosphorus concentrations reached intermediate–low values, but sulfate concentration was remarkably high in Ergaki snowpack.
The organic nitrogen in Ergaki snowpack represented 56 ± 19 % of the total nitrogen, which is a high but reasonable value as compared to the literature. The relative share of organic to total nitrogen in the snowpacks of the Pyrenees, Alps and Sierra Nevada (USA) and on the Baltic Sea were 10 ± 9 %, 41 ± 13 %, 49 ± 17 % and 21 ± 12 %, respectively (Catalan, 1989; Clement et al., 2012; Pearson et al., 2015; Rahm et al., 1995). Organic nitrogen has been reported elsewhere to be higher in snowpack records than in wet deposition because dry deposition of organic nitrogen is integrated in the snowpack and because microbial uptake and assimilation of inorganic nitrogen might occur in the snowpack (Clement et al., 2012; Pearson et al., 2015). In the case of microbial conversion from inorganic to organic nitrogen, it could be hypothesized that deeper and older snow layers should have higher organic nitrogen shares. Such a pattern was only observed at Tushkan (ANOVA, p = 0.0178), whereas no significant differences were found in the percentage of organic nitrogen between the upper and lower snow layers at the Oiskoe and Tsirkovoe sites. We, therefore, hypothesize that a different combination of phenomena might be responsible for organic nitrogen dominance at different sites.
3.3 Atmospheric deposition load
The roughly half-year cumulative deposition corresponding to the snow season of 187 d is summarized in Table 2 (second row; see Table S3 from Diaz-de-Quijano et al., 2020, for original measurements). Unfortunately, snow-free season depositions were not measured in the present study, and, consequently, yearly deposition rates could not be determined. Nevertheless, preliminary estimations were conducted assuming either a constant deposition rate along the year – time-weighted estimate – or a precipitation-weighted deposition rate (Table 2, third and fourth rows, respectively). These assumptions entail different simplifications concerning the seasonal pattern of emission, transport and deposition of the different chemical species in this particular part of the world. The precipitation-weighted estimate should be, a priori, a more accurate estimate because wet deposition is known to be the main contributor to total deposition in wet climates like that in the Western Sayan Mountains. Indeed, the accumulated precipitation registered in the Olenya Rechka Meteorological Station during the studied snow season was 419 mm, whereas an amount almost double that (819 mm) was registered during the following months up to a complete year. Note that the 2016–2017 seasonality was slightly more prominent than the median 2005–2019 seasonal precipitation (Fig. 2a). Nevertheless, both estimations neglect the emission seasonality, which might turn the constant deposition estimate into the most credible option in some cases. To evaluate our different estimates, we compared them to seasonal depositions in the literature and discussed their likely seasonal emissions.
The precipitation-dependent estimate of atmospheric phosphorus deposition (Table 2, fourth row) was probably the closest to the actual yearly load, although it might be an underestimate. That is because two-thirds of the yearly precipitation and biogenic aerosols – mainly pollen – co-occur during the snow-free season, and pollen represents an important share of atmospheric phosphorus sources in taiga landscapes of low atmospheric phosphorus like Ergaki (Banks and Nighswander, 2000; Doskey and Ugoagwu, 1992; Mahowald et al., 2008; Wang et al., 2015). In order to evaluate the magnitude of our underestimation, we checked similar studies with seasonal resolution in cold forest landscapes including the Lake of Bays (ON, Canada) (Eimers et al., 2018), Lake Simcoe (ON, Canada) (Brown et al., 2011) and a Tibetan forest (Wang et al., 2018b). Phosphorus loads during the snow period were about 9, 11 and 18 times larger than in Ergaki; snow-free season atmospheric phosphorus depositions were 2.4, 5 and 7.4 times higher than in the snow season; and snow-free season precipitations were 0.88, 0.91 and 9.1 times that of the snow season, respectively. Thus, in the hypothetical case that phosphorus deposition seasonality strictly depended on the yearly phosphorus load, the seasonal factor for Ergaki should be much lower than 2.4. On the other hand, if it depended on precipitation seasonality alone, Ergaki precipitation seasonality (1.95) would correspond to a phosphorus deposition seasonality of about 5.5. If we applied these factors (2.4 and 5.5) to estimate snow-free season phosphorus deposition and added it to measured snow season deposition, the yearly deposition rates would be 1.972 mg TP-P m−2 yr−2 and 1.462 mg PO4-P m−2 yr−2 and 3.77 mg TP-P m−2 yr−2 and 2.795 mg PO4-P m−2 yr−2, respectively. The latter factor (5.5) would definitely provide an overestimation of snow-free season phosphorus deposition. The former one (2.4) resulted in slightly higher values than our precipitation-dependent estimate, and it is not certain if that would either over- or underestimate the actual value.
The best atmospheric nitrate deposition estimate was the precipitation-dependent estimate (Table 2, fourth row), according to its seasonal distribution in other natural forested sites in the literature. The Ergaki autumn–winter nitrate deposition was 4 and 5 times lower than in a Chinese “background” and a southern Bohemian forest site, respectively (Kopáček et al., 2011a; Xu et al., 2018). Nevertheless, atmospheric concentrations of HNO3 and total inorganic nitrogen species were stable along the year in the Chinese background site, and only particulate NO3 was slightly higher in autumn–winter than spring–summer. In the southern Bohemian forest, the April–September precipitation and nitrate deposition were only 15 % and 5 % higher than in October–March, respectively. Therefore, atmospheric nitrogen concentration was also fairly stable at this site, with just slightly higher atmospheric nitrate concentrations in autumn–winter that would be mainly counterbalanced by a lower precipitation. In the light of these observations, it is likely that atmospheric nitrate concentration in Ergaki during the snow season was either similar to or slightly higher than in the snow-free season. In case of invariable atmospheric nitrate concentrations throughout the year, higher precipitation during the snow-free season would trigger also a higher nitrate deposition, and our precipitation-dependent estimate (Table 2, fourth row) would be our best estimate. In the hypothetical case where the proportion between the snow and snow-free season atmospheric nitrate concentrations were the same as in the Chinese site (1.24) and taking into account the higher snow-free season precipitation in Ergaki (1.95), the resulting snow-free nitrate deposition would be about 1.6 times higher than that measured in the snow season, and the yearly load would be about 104 ± 62 mg NO3-N m−2 yr−1. In conclusion, the actual yearly nitrate deposition should be somewhere in between the time-dependent and the precipitation-dependent estimates but closer to the latter estimate.
The time-based sulfate atmospheric deposition estimate was better than the precipitation-dependent estimate. Winter atmospheric sulfate depositions were higher than in summer both in the pristine Canadian Rocky Mountains (2–5 times) and in a Japanese site receiving sulfate from Chinese coal combustion (3.5–4 times) (Ohizumi et al., 2016; Wasiuta et al., 2015). Unexpectedly high seasonality in the pristine location was due to much higher precipitation in winter, but the atmospheric sulfate concentration was relatively constant throughout the year. On the other hand, sulfate deposition seasonality in the polluted site was attributed to higher coal burning and emissions in winter. As winter atmospheric sulfate deposition in Ergaki (190 ± 91 mg SO4-S m−2) was about 4 times higher than the background values in the Canadian Rocky Mountains (≤ 50 mg SO4-S m−2) and 11–12 times lower than in a Japanese site, it is likely that winter atmospheric sulfate concentrations in Ergaki were also higher than in summer. In this case, the precipitation-weighted yearly deposition estimate would be an overestimation, but we cannot rigorously determine if the actual value would lay above or below the time-weighted estimate. At most, we could assume a linear relationship between yearly sulfate deposition load and its seasonality. Then, a seasonality 11–12 times lower than in the Japanese site from the literature would imply a yearly deposition load of 251 mg SO4-S m−2 in Ergaki. Accordingly, our time-dependent estimate would be our best estimate but still an overestimate. In conclusion, for the sake of a simpler discussion, we will only consider the time-weighted estimate of yearly sulfate deposition and precipitation-weighted estimates of phosphorus and nitrate depositions. Nevertheless, these estimates must be interpreted cautiously: whereas nitrate and sulfate deposition estimates might be slightly overestimated, phosphorus would be underestimated.
The selected yearly deposition rate estimates (Table 2, third and fourth rows) were compared to global model predictions from the literature (Table 2, fifth row). A global deposition model predicted ca. 100 mg NO3-N m−2 yr−1 and 100–200 mg SO4-S m−2 yr−1 loads in the Western Sayan Mountains for the year 2000, whereas it forecasted ranges from 50 to 200 mg NO3-N m−2 yr−1 and 50–200 mg SO4-S m−2 yr−1 in 2030, according to different scenarios (Lamarque et al., 2013). The EMEP (European Monitoring and Evaluation Programme) wet deposition model reported similar values (50–100 mg oxidized N m−2 yr−1 and 50–200 mg oxidized S m−2 yr−1, including SO2 and SO4 and HNO3, HONO and NO3, respectively) for the year 2017 on the limits of their geographical prediction, at a location about 200 km west of our sampling site (Fagerli et al., 2019; Gauss et al., 2019). Therefore, our 2016–2017 nitrate deposition estimate roughly fitted the models, whereas sulfate deposition was clearly higher than expected. In the case of phosphorus deposition, our TP estimate was slightly lower than predicted (ca. 2 mg TP-P m−2 yr−1), although uncertainties linked to pollen contribution could make the actual TP-P deposition match or even surpass the modeled values. On the other hand, the phosphate fraction would be clearly higher than expected (0.1–0.5 mg PO4-P m−2 yr−1, Mahowald et al., 2008).
In conclusion, the atmospheric nitrate deposition in the Ergaki mountain ridge is at the very low range and is between 5 and 20 times lower than in polluted areas of the world. Nevertheless, it is clearly above the background deposition of 0–50 mg NO3-N m−2 yr−1, as used to be the case for most of Siberia in 1850 or Antarctica and unpolluted parts of the oceans in 2000 (Lamarque et al., 2013). As for total phosphorus deposition, the uncertainty linked to non-measured spring–summer biogenic and wildfire contributions makes it hard to position the studied site within a world ranking. Our estimate excluding these important biogenic and wildfire contributions (1.71 mg TP-P m−2 yr−2) and our literature-based estimate including them (1.972 mg TP-P m−2 yr−2) would be lower than any terrestrial measurement, according to a worldwide review (≥3 mg TP-P m−2 yr−2) (Tipping et al., 2014). Nevertheless, it is also possible that pollen and wildfires accounted for a larger contribution and that the present study site exceeded the latter value. In any case, atmospheric phosphorus deposition in Ergaki would be above the background values corresponding to the poles and the oceans (≤ 1–2 mg TP-P m−2 yr−2 and ≤0.5 mg PO4-P m−2 yr−2), excluding the Atlantic strip downwind of the Sahara (Mahowald et al., 2008). Finally, our yearly sulfate deposition estimate should be cautiously considered, as it could be overestimated due to regionally widespread coal combustion for heating during winter (see Sect. 3.5). In any case, it would positively exceed the background values of 0–50 and 50–100 mg SO4 m−2 yr−1 typical in the polar areas and Southern Hemisphere oceans, respectively (Lamarque et al., 2013).
3.4 SCP deposition rate
The calculated SCP deposition rate in the Ergaki Natural Park (312 ± 174 × 103 SCPs m−2 yr−1) was high above the background rates recorded in the Baikal middle basin (57×103 SCPs m−2 yr−1), Svalbard Islands (13×103 SCPs m−2 yr−1) and Nevada Rocky Mountains (1.3 ± 0.8×10³ SCPs m−2 yr−1) (Reinemann et al., 2014; Rose et al., 1998). Indeed, it is also far below the records in more polluted areas such as the case of Lake Paione Superiore in the western Alps as it used to be during the more polluted times of the 1980s and early 1990s (40 900 × 103 SCPs m−2 yr−1) or a set of northern African lakes (1098–23 694 × 103 SCPs m−2 yr−1), where production of electricity by thermal means has increased in the last years (Rose et al., 1999, 2003). In comparison to a couple of lakes sampled in 1992 in the Khamar-Daban Mountains (southern Siberia) (262 and 780×103 SCPs m−2 yr−1), the SCP deposition rate in Ergaki was more similar to the lake that was relatively farther from the Irkutsk pollution source (Rose et al., 1998). Our data also fall in the lower range of the Tatra Mountains (225–5240 × 103 SCPs m−2 yr−1) and the Pyrenees (229–630 × 103 SCPs m−2 yr−1) in the mid-1990s (Rose et al., 1998, 1999; Šporka et al., 2002). An interesting and paradoxical case to compare with is Lake Grånästjärn in 1980, with a very similar SCP deposition rate (300 × 103 SCPs m−2 yr−1) but sulfate and nitrate deposition rates 2.6 and 1.8 times higher than in Ergaki (Bergström et al., 2005; Wik and Renberg, 1996). This may lead to thinking that our SCP, sulfate and nitrate data did not match. Nevertheless, at least sulfate depositions differing up to ca. 40 % have been observed at sites with particularly low SCP deposition rates (Rose and Monteith, 2005). Additionally, sulfate measurements in Sweden might include a higher percentage of marine sulfate than in the heart of Eurasia. Finally, apart from this single Swedish lake where the proportion of nitrate to SCPs differs so much from ours, both SCP and nitrate deposition rates measured in this study are generally comparable to the low range of values in the literature.
3.5 Spatial distribution and origin of atmospheric depositions
The spatial distribution of deposited chemical species showed two different patterns. On the one hand, phosphorus forms and SCPs showed an even distribution between sampling sites. On the other hand, NO3, TN and SO4 depositions were significantly higher on Tsirkovoe and Oiskoe than on Tushkan (Fig. 4). Even distribution of phosphorus deposition suggests a common source of atmospheric phosphorus for all Ergaki sites. Under very low atmospheric phosphorus deposition, like in the Ergaki mountain ridge, biogenic and combustion origins are more important than mineral origin (Mahowald et al., 2008). This is supported by several pieces of evidence in our case. Firstly, even if the predominant western air mass retro-trajectories partly traverse the Kazakhstan steppe in a percentage of days, they hardly ever cross central Asian deserts (Fig. 5a and b). Moreover, direct contact between air mass retro-trajectories and Earth's crust occurs more often in the taiga ecoregion (yellow dots, Fig. 5a and b). Finally, the percentage of TP which is soluble in our snow samples (79 %) is comparable to European aerosols (50 %–100 %) but much higher than Saharan dust (8 %–25 %) (Mahowald et al., 2008), so it suggests that phosphorus aerosols in Ergaki was not of desert origin. Thus, Ergaki mountain lakes differ from Lake Baikal, which can be influenced by dust originating in the Gobi Desert (Jambers and Van Grieken, 1997).
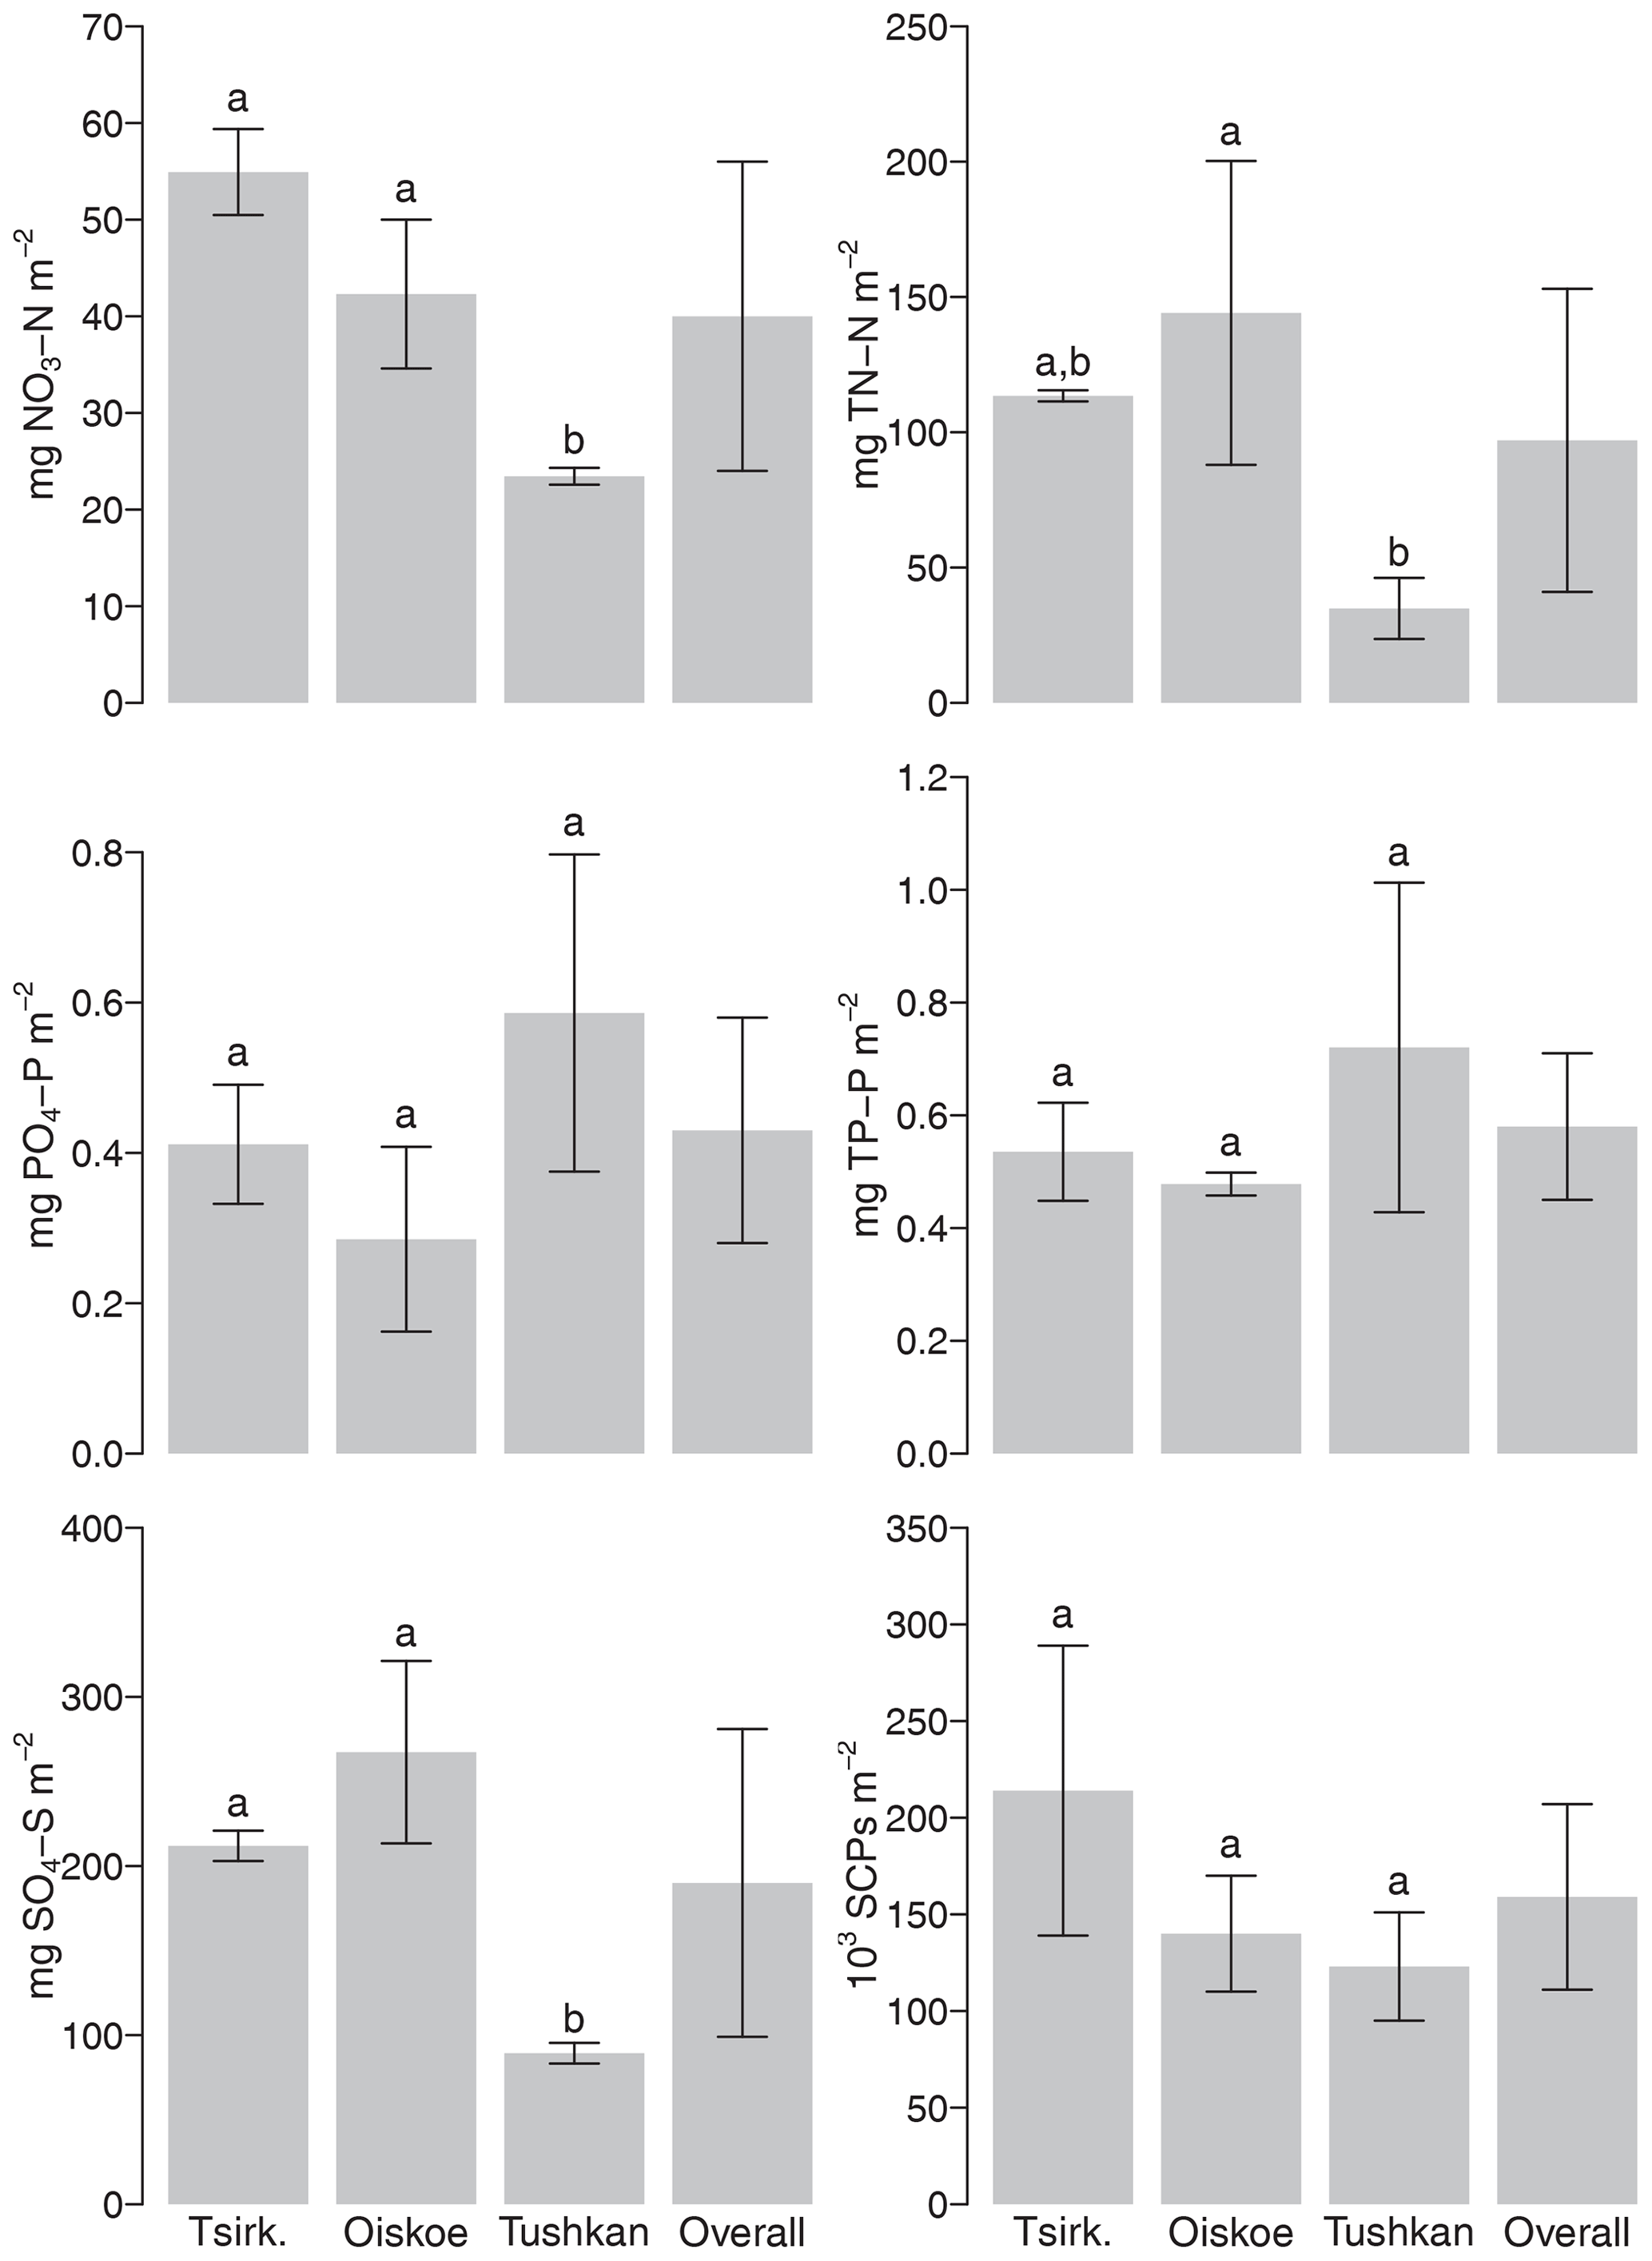
Figure 4Half-year deposition of some airborne chemical species along with snow at three different sites in the Ergaki mountain ridge. Bars are average values, and whiskers represent the standard deviation. Sites with different letters on error bars belong to different groups defined by post hoc Tukey HSD (honestly significant difference) analysis (one-way ANOVA p < 0.01).
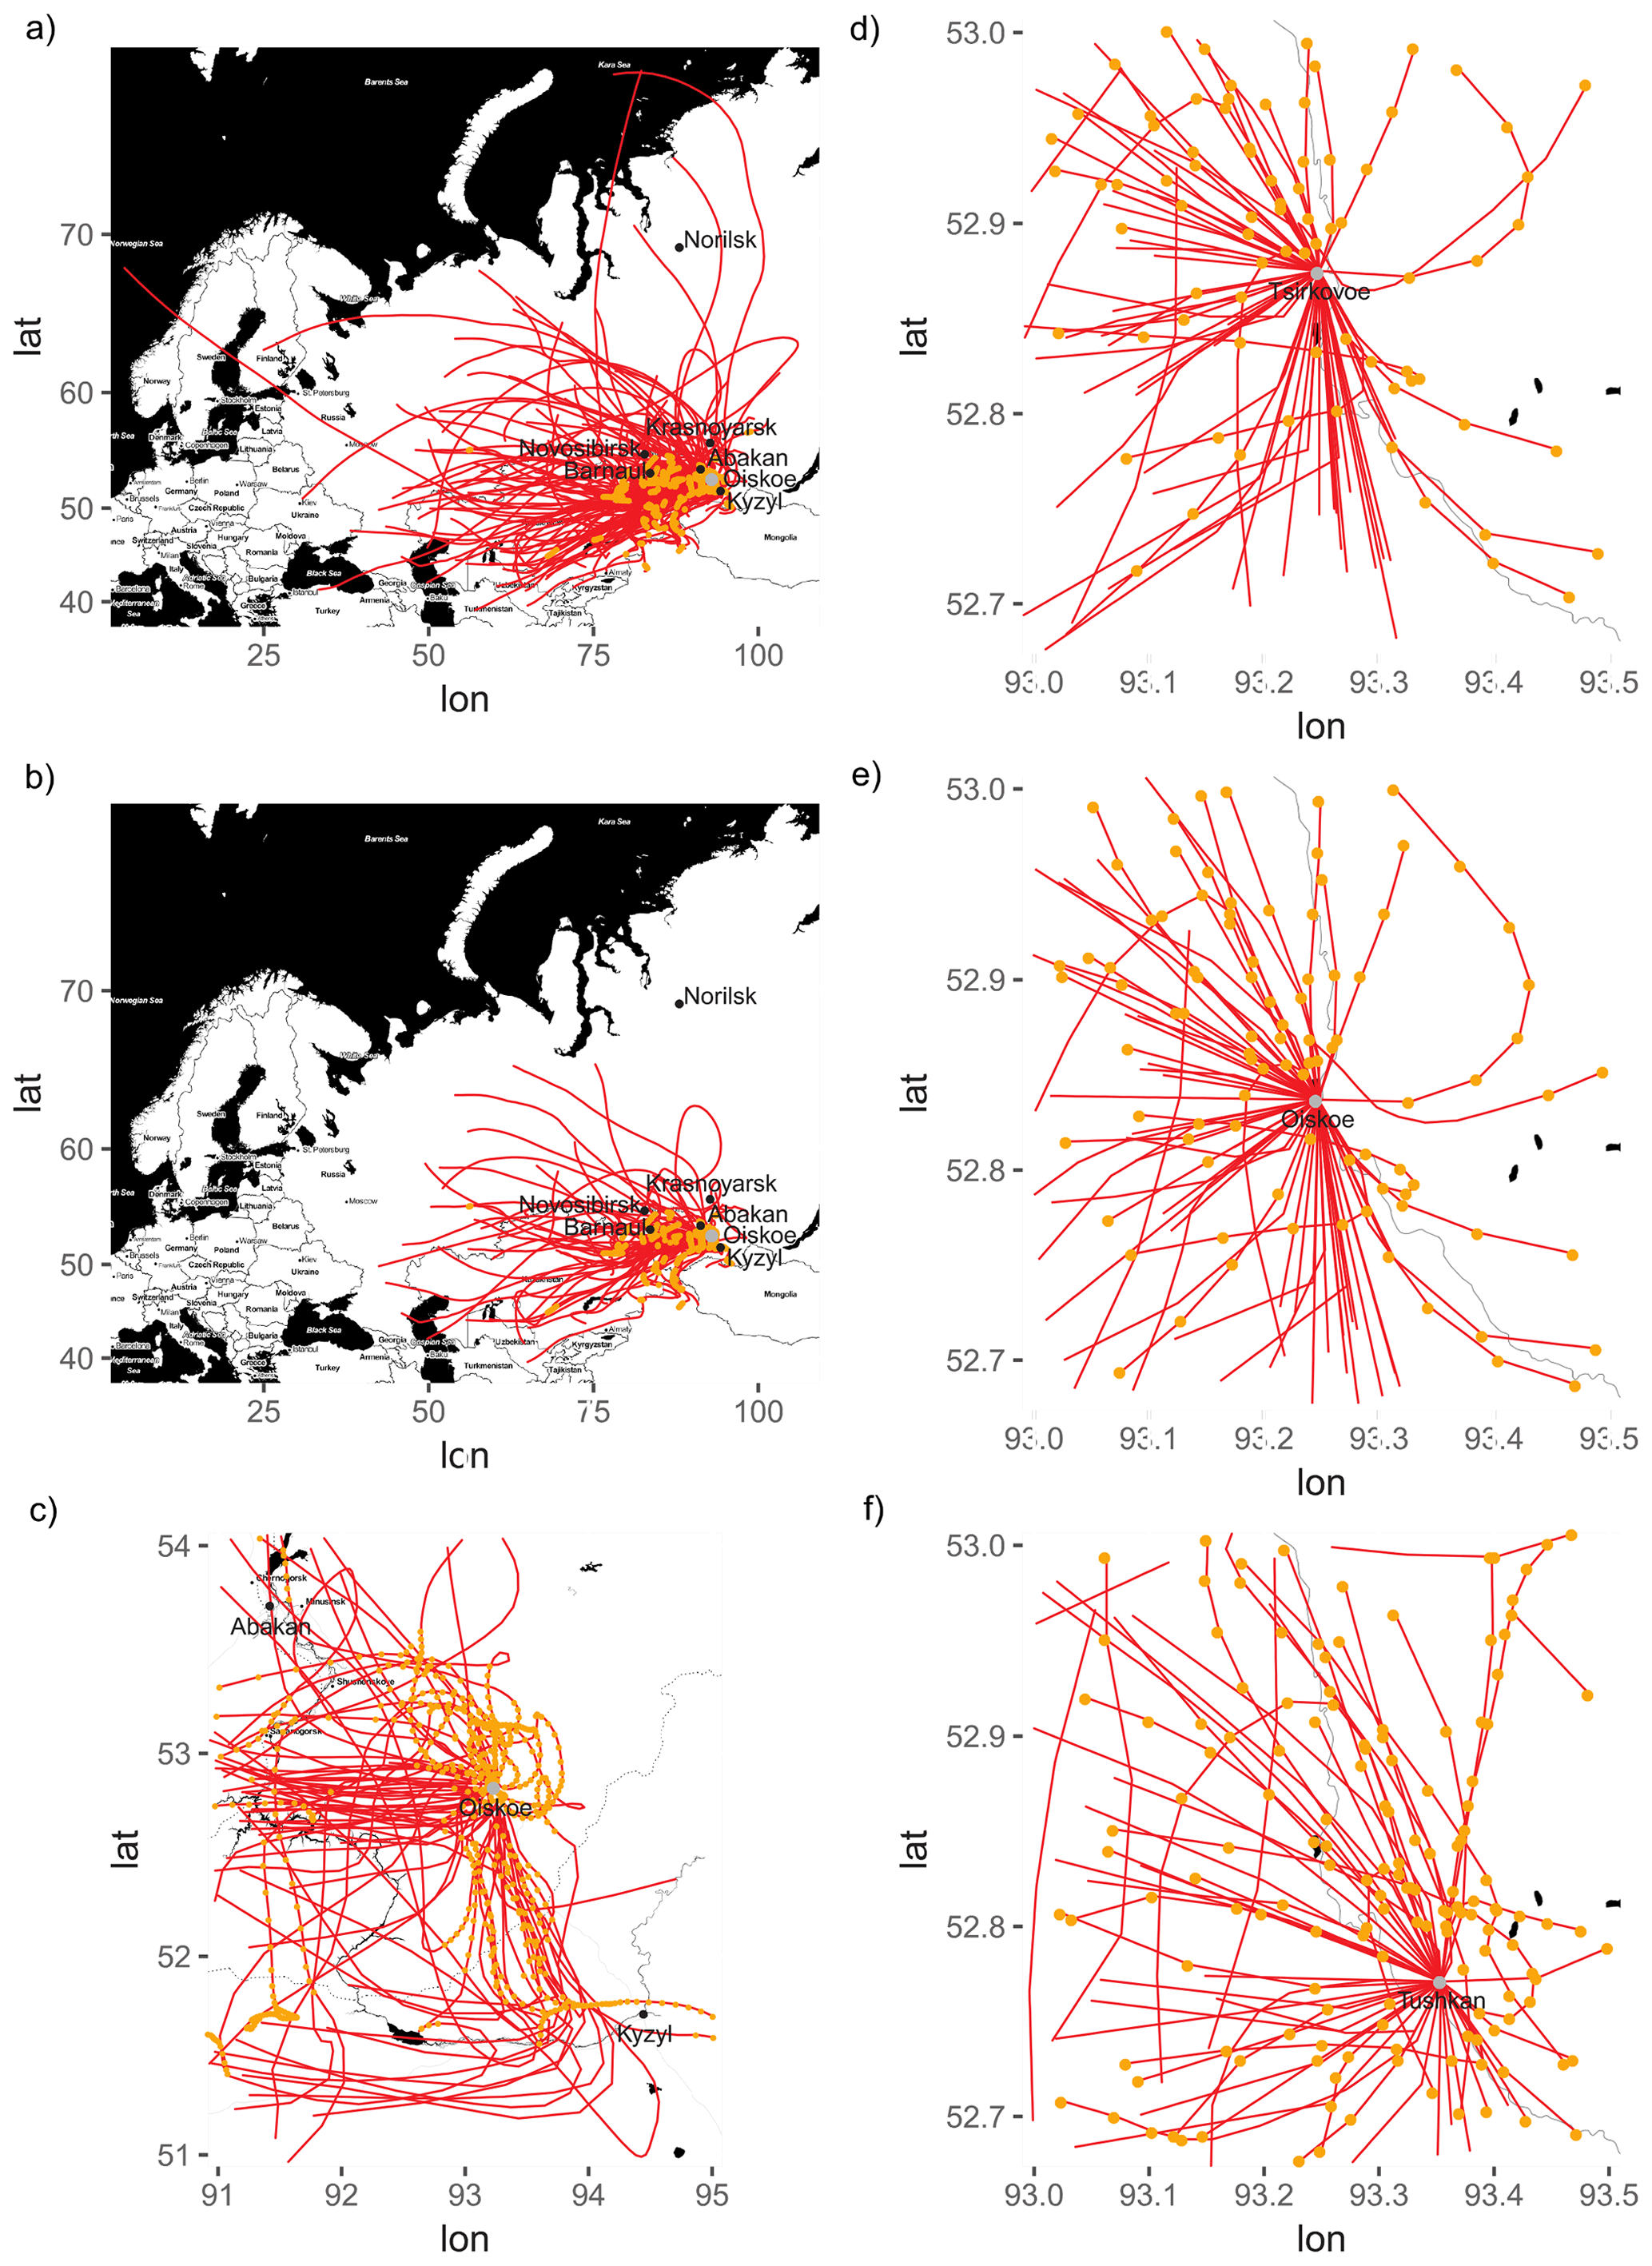
Figure 5Daily 3 d long air mass retro-trajectories flowing onto Lake Oiskoe from 1 October 2016 to 5 April 2017 (a). Only retro-trajectories of air masses causing precipitation at Lake Oiskoe at different zooms (b, c, e) and at Lake Tsirkovoe (d) and at Tushkan (f). Yellow dots represent hourly records where the air mass retro-trajectories contacted Earth's crust. Water bodies are in black. Gray lines are either political borders or the road. Sources: map tiles by Stamen Design, under CC BY 3.0. Data by © OpenStreetMap contributors 2014, distributed under a Creative Commons BY-SA License. Air mass retro-trajectories by http://www.ready.noaa.gov (last access: 8 November 2018).
Nitrate and sulfate are tracers of fossil fuel or biomass combustion (Mahowald et al., 2008). Their spatial correlation (lower in Tushkan than in the other two sites, Fig. 4) suggests that alternative nitrate origins like chemical fertilizers or secondary transformations like nitrification and denitrification by microbes in the snowpack might be unimportant. In the same vein, nitrate and sulfate had a relatively high, although not significant, Pearson correlation coefficient (0.63) in the seven analyzed snow core sections. The reason for lower nitrate and sulfate values in Tushkan is still unclear. This site is a forest glade located at an altitude 300 m lower than the other two. We argue that this altitude difference is too limited to trigger any differences in nitrate deposition, and, in any case, the higher the site is, the lower the expected deposition is (Dambrine et al., 2018). Nonetheless, a shorter distance between Tsirkovoe and Oiskoe and their wind regimes might be more decisive, even if the former is located on the northern face, and the latter is on the southern face. The wind speeds there were 3.4 and 3.3 m s−1, respectively, whereas in Tushkan, farther from the ridge, it was 3.0 m s−1. Despite the fact that the wind rose circular correlation between Tsirkovoe and Oiskoe was not significant, their local air mass retro-trajectories were much more similar than to Tushkan (Fig. 5d, e and f). Perhaps, the two more northern sites might be also more exposed to the dominant snow-forming westerlies that flow between latitudes of 52 and 53∘N and higher (Fig. 5c). As for SCPs, which are also originated by combustion, the nitrate and sulfate spatial distribution is not followed. We speculate that the particulate character of SCPs might impose different atmospheric transport properties, so even if SCPs are good tracers of air pollution, slight mismatches between SCPs and chemical pollutants might occur (Rose and Ruppel, 2015; Wik and Renberg, 1996). Anyway, a trend to higher values in the northernmost sites is also observed (Fig. 4).
Finally, local wind speed differences between sites might be a tracer of air mass origin. Generally, faster winds would be capable of delivering chemical species from longer distances. The average retro-trajectory length had a weak, non-significant but still positive Pearson correlation with nitrate (0.47) and a negative Pearson correlation with phosphate (−0.48), TP (−0.25) and TN (−0.20). This suggests that nitrate deposited in the Ergaki mountains might originate at farther distances than phosphorus and particulate nitrogen. To sum up, we hypothesize that northern cities might contribute more to the nitrate deposition than southern ones. These combustion-produced chemicals would be uploaded to the northernmost half of the dominant westerlies conveyor belt flowing directly onto the Ergaki mountains, rather than on the southernmost half of the westerlies flow, which mainly traverse Kazakhstan and turn northwards to the Ergaki mountain ridge just before reaching the city of Kyzyl (Fig. 5c). These urban sources might include not only those at the local scale (Abakan, Minusinsk and Chernogorsk rather than Kyzyl in the south) but also those at a regional one (central and eastern southern Siberian rather than northern Kazakhstan cities).
3.6 Nutrient deposition and lake water stoichiometry
The molar stoichiometry of volume-weighted mean concentrations in the snowpack, i.e., the concentrations that would be measured if we had sampled the whole snow core at once, were 169 ± 76 NO3-N TP-P, 251 ± 134 NO3-N PO4-P and 486 ± 357 TN-N TP-P (mol mol−1). The molar stoichiometry of estimated yearly atmospheric nutrient deposition in Ergaki were 169 ± 105 and 128 ± 79 NO3-N TP-P (mol mol−1) according to the precipitation-dependent yearly load estimation and to the abovementioned literature-based corrections, respectively. As no other DIN form but nitrate was detected in our samples, the NO3-N TP-P ratio can be compared to DIN-N TP-P ratios in the literature. The latter ratio has been previously used to assess nitrogen and phosphorus bioavailability both from deposition and in mountain lake water (Brahney et al., 2015). Total phosphorus was used instead of PO4 because (1) otherwise, the fast biological uptake of deposited PO4 would lead to underestimating the actual atmospheric load and (2) organic phosphorus sources are bioavailable to many mountain lake phytoplankton species via extracellular enzyme activity, phagotrophy and osmotrophy (Diaz-de-Quijano, 2014; Medina-Sanchez et al., 2004). Thus, our estimated NO3-N TP-P deposition molar ratios in Ergaki would belong to the higher quartile, as compared to a set of alpine regions elsewhere in the world (Brahney et al., 2015) (Fig. 6a). The closest nutrient deposition stoichiometries to that of Ergaki (precipitation-dependent estimates) were recorded at the Sant Nicolau valley in the Pyrenees during the second half of the 1990s (170.5 DIN-N TP-P, molar) and the Tatra Mountains (165.8; calculation based on DIN wet deposition during 1990–1994 and average TP wet deposition during 1998–2009) (Brahney et al., 2015; Kopáček et al., 2000, 2011b; Ventura et al., 2000). In the case of the alternative 128 ± 79 NO3-N TP-P (mol mol−1) deposition estimate for Ergaki, the southern Swedish lake district was the closest value (125.6). In any case, Ergaki atmospheric nutrient deposition stoichiometry was much larger than that of northern Sweden (20.1 molar DIN-N TP-P), the paradigm of pristine areas with very low anthropogenic atmospheric nitrogen deposition and naturally nitrogen-limited lakes. This was due to the extraordinary low phosphorus deposition as compared to nitrogen, which was also relatively low but not that much (see Sect. 3.3).
The molar stoichiometry of Ergaki lake water was on average above the Redfield ratio (30.7 ± 34.2 DIN-N TP-P, Fig. 6a and Table S2 from Diaz-de-Quijano et al., 2020), which suggests lake phytoplankton would generally be P limited. Nevertheless, values below the Redfield ratio (16 : 1), i.e., corresponding sensu lato to N limitation, were also frequently observed. All the lakes had DIN-N TP-P ratios both above and below the Redfield ratio at different surveys with the exception of Lake Tsirkovoe, which was always above the Redfield ratio (P limitation) (Table 3). Most lakes had DIN-N TP-P ratios below the Redfield ratio in June and August 2011 and early September 2015 and above it in June and August 2012 and late August 2017. Therefore, no temporal trend can be drawn from our lake water chemistry data set (see Table 3). Besides to the Redfield criterion, a previous study determined that DIN-N TP-P molar ratios of 3.3, 4.9 and 7.5 would correspond to 75 %, 50 % and 25 % probabilities of chlorophyll increase under an N enrichment experiment (Bergström, 2010). According to this more restrictive criterion, only Lake Oiskoe would approach the 75 % probability of having a positive increase of chlorophyll under N enrichment in the 2015 survey. Nevertheless, it is very likely that this case was due to watershed-level processes. Forest and peat cover (25 % and 6 %, respectively) in the Lake Oiskoe watershed are more important than in other lakes watersheds, and, more importantly, the lake receives an inflow passing by nearby houses (Table 1 and Table S1 from Diaz-de-Quijano et al., 2020). A local phosphorus input from nearby houses could have occurred at Lake Oiskoe in 2015, pointing to the mesotrophic status of the lake. The high TP values could be also partly due to having calculated TP as the sum of SRP and PP instead of measuring it directly in 2015, but only Lake Oiskoe recorded unprecedentedly high values, which might be due to the mentioned human activities in its watershed. In conclusion, lake water nutrient stoichiometry suggests a variable but slightly P-dominated nutrient limitation regime.
In conclusion, a decoupling between atmospheric deposition and the lake water nutrient ratio was observed in Ergaki as compared to many other mountain regions elsewhere in the world (Fig. 6a). We argue that this was due to the extraordinarily low absolute values of nutrient, especially phosphorus, atmospheric deposition in the Ergaki mountain ridge. Accordingly, the sum of other biogeochemical processes occurring at the watershed soils, runoff, rivers, water column, sediments, etc. would be sufficient to modify the original stoichiometry of airborne nutrients.

Figure 6The relationship between atmospheric nutrient deposition, nutrient bioavailability and phytoplankton biomass in Ergaki lakes (black square) in the context of different world data sets. (a) Atmospheric deposition versus lake DIN-N TP-P molar ratios of several alpine regions elsewhere in the world, as reproduced from Brahney et al. (2015), including Ergaki means and standard deviations: precipitation-dependent estimates (rhombus and dashed lines) and literature-corrected estimates (square and solid lines). Vertical dashed line represents the referential northern Swedish value (20.1). Horizontal dashed line represents the Redfield ratio (16). (b) Yearly atmospheric DIN-N deposition versus the Chl a TP-P ratio of 13 Swedish regions, as reproduced from Bergström and Jansson (2006) and Bergström et al. (2005), including Ergaki means and standard deviations (as before). Dashed lines represent approximate limits of N, N-P and P limitation areas, according to the authors (250 and 500 mg DIN-N m−2 yr−1). (c) Lake DIN-N concentration versus the Chl a TP-P ratio of different lake districts in the world (black circles) and its segmented regression fit as reproduced from Camarero and Catalan (2012), including Ergaki medians (black square) and particular observations from the following lakes (triangles): Tsirkovoe (yellow), Oiskoe (red), Raduzhnoe (blue), Karovoe (gray) and Svetloe (green). Dashed line represents the limit between N and P limitation conditions, according to the authors.
Table 3Lake water N : P ratios along the studied years and limiting nutrients according to nutrient availability (DIN-N TP-P) and the Redfield ratio.

3.7 Atmospheric input and lake phytoplankton biomass limitation
Atmospheric nitrogen deposition rate was lower in the Western Sayan Mountains than in the most pristine areas in Sweden during the period 1995–2001 and 2 orders of magnitude lower than the most impacted Swedish region (Bergström et al., 2013, 2005; Bergström and Jansson, 2006) (Fig. 6b). The Swedish atmospheric deposition gradient was used to establish the new paradigm, according to which the natural state of phytoplankton growth in many unproductive lakes (≤25 µg TP-P L−1) would be nitrogen limitation when atmospheric deposition is below ca. 250 mg DIN-N m−2 yr−1. According to that, the Western Sayan Mountain lakes (79–119 mg DIN-N m−2 yr−1) would clearly belong to the potential atmospherically induced N limitation domain, where slight increases in atmospheric nitrogen deposition trigger larger phytoplankton biomass shifts. In a further study, Camarero and Catalan reckoned the upper threshold of N limitation of phytoplankton growth regime to be ∼100 µg DIN-N L−1 in lake water (Camarero and Catalan, 2012) (Fig. 6c). Despite the fact that some of our measurements fell above the threshold, the median of 54 µg DIN-N L−1 would confirm potential N limitation in most of the sampled lakes (Table S2 from Diaz-de-Quijano et al., 2020). Nevertheless, the potential character of that nitrogen limitation should be highlighted. If we combine all the mentioned pieces of evidence, it is understandable that atmospheric nutrient deposition was so low (Fig. 6b), which led to a decoupling between atmospheric deposition and lake water nutrient stoichiometries (Fig. 6a). In the end, the lake water DIN concentration was low enough to allow for the occurrence of phytoplankton growth N limitation events (Fig. 6c), but their occurrence was alternated with phosphorus limitation periods (Table 3).
The future dynamics of DIN and TP concentrations in Ergaki lakes are likely to determine changes in phytoplankton biomass and species composition because the observed stoichiometries suggested a switching regime between N and P limitation events. That would promote alternatively low-P- and low-N-adapted species. Moreover, in the case of N, we found that shifts resulting in DIN concentrations ranging from zero to double the average registered values would trigger important phytoplankton biomass responses (Fig. 6c). During our survey, nutrient concentrations in lakes were not majorly connected to atmospheric deposition (Fig. 6a), but future dynamics of atmospheric nutrient deposition in Western Sayan Mountain lakes are uncertain. On the one hand, the observed high snow sulfate concentrations and the wind analysis made us suggest coal combustion in cities of central and eastern southern Siberia to be the main winter atmospheric nitrate source. Additionally, predicted winter precipitation in this region under the RCP4.5 scenario (Intergovernmental Panel on Climate Change Representative Concentration Pathway scenario assuming 4.5 W m−2 radiative forcing by 2100) would increase 10 %–30 % in 2016–2035 and up to 20 %–30 % in 2081–2100 (IPCC, 2013). Therefore, it is likely that atmospheric nitrogen deposition increased even in a scenario where actual emissions did not change. On the other hand, wild forest fire events in south-central Siberia have multiplied and intensified during the last decades and are expected to follow this trend in the 21st century as well (Brazhnik et al., 2017; Malevsky-Malevich et al., 2008). Their effect on atmospheric nutrient dynamics will be complex. Apart from modifying the sources of phosphorus-rich biogenic aerosol particles, wildfires themselves used to be considered as a nitrogen volatilization pulse that left phosphorus on the burnt land (Hungate et al., 2003; Raison, 1979). Nevertheless, a recent study unveiled their relevance as a source of atmospheric phosphorus too (Wang et al., 2015). To sum up, uncertainties on the magnitude and timing of future fossil fuel combustion, precipitation and wildfire regimes make it difficult to predict the details of future atmospheric nutrient deposition in the Western Sayan Mountains. Nevertheless, it is very likely that deposition rates will increase and, perhaps, represent a sufficient input to finally couple the nutrient ratio of deposition inputs and lake water and/or to promote an increase in phytoplankton biomass.
Finally, the sensitiveness of lake phytoplankton to nutrient availability might likely depend on temperature too as was the case in the pristine Swedish north (Bergström et al., 2013). Low values of atmospheric nitrogen deposition in that region triggered a low DIN availability and a regional N limitation of lake phytoplankton growth. Nevertheless, the authors found clear phytoplankton responses to experimental NH4NO3 additions only in warm enough and N-limited lakes. As summer lake water temperatures were roughly 5–18 ∘C there and 5–14 ∘C in Western Sayan Mountain lakes, it is conceivable that the phytoplankton response to nutrient availability shifts was temperature-mediated in Ergaki mountain lakes. Of course, the predicted warming in the region (IPCC, 2013) would decrease the system resilience, as eventual changes in nutrient availability could not be temperature-mitigated and would be directly reflected in phytoplankton biomass and species composition changes.
The Ergaki Natural Park in the Western Sayan Mountains was reckoned to be an area above background levels but of low atmospheric nutrient deposition. Our atmospheric total phosphorus and nitrate deposition estimates reasonably fitted those predicted by global deposition models, whereas sulfate and phosphate proved to be higher than expected. While nitrogen values were comparable to the lowest records in other mountain areas elsewhere in the world, phosphorus deposition was likely at the very lowest range ever measured on terrestrial ecosystems before. Nevertheless, any conclusions regarding yearly atmospheric phosphorus deposition loads from this study should be contrasted with further year-long measurements in the Western Sayan Mountains, including the presumably important biogenic and wildfire contributions during spring and summer.
The atmospheric reactive nitrogen deposition load in the Ergaki Natural Park was similar to that in northern Sweden, so it was low enough to potentially induce nitrogen limitation in lake phytoplankton. However, the strongly mismatching nutrient ratios in atmospheric deposition and lake water suggested a decoupling between the two compartments. The stoichiometry of atmospheric nutrient deposition was highly determined by the extremely low phosphorus deposition, and the biogeochemical processes occurring at the watershed level would easily modify the nutrient ratio of the tiny and unbalanced atmospheric input. Under such conditions, a succession of N and P limitation events was observed rather than the expected N limitation. Thus, we hypothesize that the recently suggested paradigm of nitrogen limitation of lake phytoplankton growth in natural pre-industrial conditions might apply for Sweden and other regions with a minimal atmospheric phosphorus deposition but might not apply for large areas in Siberia. A larger number of lakes distributed over Siberia and whole-year-long atmospheric nutrient deposition, including in spring and summer, should be studied to contrast that hypothesis.
Finally, the Western Sayan Mountain range constitutes an excellent pristine area to study the effects of past global warming with a minimal influence of atmospheric nitrogen and phosphorus deposition. The studied mountain lakes are also good sensitive sentinels for upcoming climate warming and atmospheric nutrient deposition dynamics. The expected increase in precipitation and wildfires and future fossil fuel combustion could finally couple these lakes to the atmospheric nutrient deposition and, if climate warming unlocked the phytoplankton response to it, promote a phytoplankton biomass increase and species composition change.
The data sets presented in this study are available as Tables S1, S2 and S3 at the repository of the library of the Siberian Federal University at http://elib.sfu-kras.ru/handle/2311/135098 (Diaz-de-Quijano et al., 2020).
DDdQ and EAI designed the snow sampling; DDdQ and AVA performed it; and DDdQ and OVA analyzed snow samples. All the authors participated in sampling and sample analyses of lake water. DDdQ prepared the paper with contributions from all co-authors.
The authors declare that they have no conflict of interest.
The authors gratefully acknowledge the NOAA Air Resources Laboratory (ARL) for the provision of the HYSPLIT transport and dispersion model and READY website (http://www.ready.noaa.gov, last access: 8 November 2018) used in this publication. We also would like to thank the direction of the Ergaki Natural Park for their support and willingness to collaborate.
This research has been supported by the Russian Foundation for Basic Research (grant no. 20-04-00960) and the Ministry of Science and Higher Education of the Russian Federation (postdoctoral program project no. 5-100, grant no. FSRZ-2020-0014).
This paper was edited by Tom J. Battin and reviewed by two anonymous referees.
Anishchenko, O. V., Glushchenko, L. A., Dubovskaya, O. P., Zuev, I. V., Ageev, A. V., and Ivanova, E. A.: Morphometry and metal concentrations in water and bottom sediments of mountain lakes in Ergaki Natural Park, Western Sayan Mountains, Water Resour., 42, 670–682, https://doi.org/10.1134/S0097807815050036, 2015.
APHA: Standard methods for the examination of water and wastewater, 17th edn., American Public Health Association, Washington DC, USA, 1989.
Banks, H. H. and Nighswander, J. E.: Relative contribution of Hemlock pollen to the phosphorus loading of the Clear lake ecosystem near Minden, Ontario, Symposium on Sustainable Management of Hemlock Ecosystems in Eastern North America, Proceedings, 22–24 June 1999, Durham NH, 168–174, 2000.
Bergström, A.-K. and Jansson, M.: Atmospheric nitrogen deposition has caused nitrogen enrichment and eutrophication of lakes in the northern hemisphere, Glob. Change Biol., 12, 635–643, https://doi.org/10.1111/j.1365-2486.2006.01129.x, 2006.
Bergström, A.-K., Faithfull, C., Karlsson, D., and Karlsson, J.: Nitrogen deposition and warming – effects on phytoplankton nutrient limitation in subarctic lakes, Glob. Change Biol., 19, 2557–2568, https://doi.org/10.1111/gcb.12234, 2013.
Bergström, A. K.: The use of TN : TP and DIN : TP ratios as indicators for phytoplankton nutrient limitation in oligotrophic lakes affected by N deposition, Aquat. Sci., 72, 277–281, https://doi.org/10.1007/s00027-010-0132-0, 2010.
Bergström, A. K., Blomqvist, P., and Jansson, M.: Effects of atmospheric nitrogen deposition on nutrient limitation and phytoplankton biomass in unproductive Swedish lakes, Limnol. Oceanogr., 50, 987–994, https://doi.org/10.4319/lo.2005.50.3.0987, 2005.
Bobbink, R., Hicks, K., Galloway, J., Spranger, T., Alkemade, R., Ashmore, M., Bustamante, M., Cinderby, S., Davidson, E., Dentener, F., Emmett, B., Erisman, J. W., Fenn, M., Gilliam, F., Nordin, A., Pardo, L., and De Vries, W.: Global assessment of nitrogen deposition effects on terrestrial plant diversity: A synthesis, Ecol. Appl., 20, 30–59, https://doi.org/10.1890/08-1140.1, 2010.
Brahney, J., Mahowald, N., Ward, D. S., Ballantyne, A. P., and Neff, J. C.: Is atmospheric phosphorus pollution altering global alpine lake stoichiometry?, Global Biogeochem. Cy., 29, 1369–1383, 2015.
Brazhnik, K., Hanley, C., and Shugart, H. H.: Simulating changes in fires and ecology of the 21st century Eurasian boreal forests of Siberia, Forests, 8, 1–27, https://doi.org/10.3390/f8020049, 2017.
Brown, L. J., Taleban, V., Gharabaghi, B., and Weiss, L.: Seasonal and spatial distribution patterns of atmospheric phosphorus deposition to Lake Simcoe, ON, J. Great Lakes Res., 37, 15–25, https://doi.org/10.1016/j.jglr.2011.01.004, 2011.
Camarero, L. and Catalan, J.: Atmospheric phosphorus deposition may cause lakes to revert from phosphorus limitation back to nitrogen limitation, Nat. Commun., 3, 1118, https://doi.org/10.1038/ncomms2125, 2012.
Carslaw, D. C. and Ropkins, K.: openair – an R package for air quality data analysis, Environ. Model. Softw., 27–28, 52–61, 2012.
Catalan, J.: The winter cover of a high-mountain Mediterranean lake (Estany Redó, Pyrenees), Water Resour. Res., 25, 519–527, 1989.
Chernov, G., Vdovin, V., Okishev, P., Petkevich, M., Mistryukov, A., Zyatkova, L., and Milyaeva, L.: Relief Altae-Sayanskoi gornoi oblasti, edited by: Nikolaev, V. and Chernov, G., Nauka Sibirskoe Otdelenie, Novosibirsk, 1988.
Clement, J. C., Robson, T. M., Guillemin, R., Saccone, P., Lochet, J., Aubert, S., and Lavorel, S.: The effects of snow-N deposition and snowmelt dynamics on soil-N cycling in marginal terraced grasslands in the French Alps, Biogeochemistry, 108, 297–315, https://doi.org/10.1007/s10533-011-9601-3, 2012.
Cragin, J. H., Hewitt, A. D., and Colbeck, S. C.: Grain-scale mechanisms influencing the elution of ions from snow, Atmos. Environ., 30, 119–127, https://doi.org/10.1016/1352-2310(95)00232-N, 1996.
Dambrine, E., Arthaud, F., Avrillier, J.-N., Millery, A., and Nicolas, M.: Altitudinal and latitudinal variations of snowpack N concentration over the French Alps, Water Air Soil Pollut., 229, 1–12, 2018.
DeForest, J. L., Zak, D. R., Pregitzer, K. S., and Burton, A. J.: Atmospheric nitrate deposition, microbial community composition, and enzyme activity in northern hardwood forests, Soil Sci. Soc. Am. J., 68, 132, https://doi.org/10.2136/sssaj2004.1320, 2004.
Diaz-de-Quijano, D.: On the track of cellular ecology, Methodological improvements and contributions of single-cell phosphatase activity on the ecology of phytoplankton in Pyrenean lakes, PhD dissertation, University of Barcelona, available at: http://diposit.ub.edu/dspace/handle/2445/57286 (last access: 1 March 2021), 2014.
Diaz-de-Quijano, D., Ageev, A., Ivanova, E. A., and Anishchenko, O. V.: Dataset for article “Winter atmospheric nutrients and pollutants deposition on West Sayan mountain lakes (Siberia)”, available at: http://elib.sfu-kras.ru/handle/2311/135098, last access: 30 December 2020.
Doskey, P. V and Ugoagwu, B. J.: Macronutrient chemistry of pollen, Commun. Soil Sci. Plant Anal., 23, 15–23, https://doi.org/10.1080/00103629209368566, 1992.
Eimers, M. C., Hillis, N. P., and Watmough, S. A.: Phosphorus deposition in a low-phosphorus landscape: sources, accuracy and contribution to declines in surface water P, Ecosystems, 21, 782–794, https://doi.org/10.1007/s10021-017-0184-2, 2018.
Elser, J. J., Andersen, T., Baron, J. S., Bergström, A.-K., Jansson, M., Kyle, M., Nydick, K. R., Steger, L. and Hessen, D. O.: Shifts in lake N : P stoichiometry and nutrient limitation driven by atmospheric nitrogen deposition, Science, 326, 835–837, https://doi.org/10.1126/science.1176199, 2009.
Fagerli, H., Tsyro, S., Jonson, J. E., Nyíri, Á., Gauss, M., Simpson, D., Wind, P., Benedictow, A., Klein, H., Mortier, A., Aas, W., Hjellbrekke, A.-G., Solberg, S., Platt, S. M., Yttri, K. E., Tørseth, K., Gaisbauer, S., Mareckova, K., Matthews, B., Schindlbacher, S., Sosa, C., Tista, M., Ullrich, B., Wankmüller, R., Scheuschner, T., Bergström, R., Johanson, L., Jalkanen, J.-P., Metzger, S., Denier van der Gon, H. D. C., Kuenen, J. J. P., Visschedjik, A. J. H., Barregård, L., Molnár, P., and Stockfelt, L.: Transboundary particulate matter, photo-oxidants, acidifying and eutrophying components, EMEP status report 1/2019, 4 September 2019, Norwegian Institute of Meteorology, Oslo, 2019.
Felip, M., Sattler, B., Psenner, R., and Catalan, J.: Highly active microbial communities in the ice and snow cover of high mountain lakes, Appl. Environ. Microbiol., 61, 2394–2401, 1995.
Gauss, M., Tsyro, S., Benedictow, A., Fagerli, H., Hjellbrekke, A.-G., Aas, W., and Solberg, S.: EMEP/MSC-W model performance for acidifying and eutrophying components and photo-oxidants in 2017, Supplementary material to EMEP Status Report 1/2019, Oslo, 2019.
Gladyshev, M. I., Kolmakova, O. V., Tolomeev, A. P., Anishchenko, O. V., Makhutova, O. N., Kolmakova, A. A., Kravchuk, E. S., Glushchenko, L. A., Kolmakov, V. I., and Sushchik, N. N.: Differences in organic matter and bacterioplankton between sections of the largest arctic river: Mosaic or continuum?, Limnol. Oceanogr., 60, 1314–1331, https://doi.org/10.1002/lno.10097, 2015.
Grasshoff, K., Ehrhamdt, M., and Kremling, K.: Methods of sea water analysis, 2nd Ed., Wiley Verlag-Chemie, Weinheim, 1983.
Güsewell, S.: N : P ratios in terrestrial plants: variation and functional significance, New Phytol., 164, 243–266, https://doi.org/10.1111/j.1469-8137.2004.01192.x, 2004.
Hijmans, R. J.: Geosphere: Spherical Trigonometry, available from: https://cran.r-project.org/package=geosphere (last access: 8 November 2018), 2017.
Hungate, B. A., Cole, J., Vitousek, P. M., Stewart, J., Victoria, R., Kenichi, S., and Naiman, R. J.: Disturbance and element interactions, in SCOPE 61: Interactions among the major biogeochemical cycles, edited by: Melillo, J. M., Field, C. B., and Moldan, B., Island Press, Washington DC, 47–62, 2003.
IPCC (van Oldenborgh, G. J., Collins, M., Arblaster, J., Christensen, J. H., Marotzke, J., Power, S. B., Rummukainen, M., and Zhou, T.): Annex I : atlas of global and regional climate projections, in: Climate change 2013: The physical science basis. Contribution of Working Group I to the fifth assessment report of the Intergovernmental Panel on Climate Change, edited by: Stocker, T. F., Qin, D., Plattner, G.-K., Tignor, M., Allen, S. K., Boschung, J., Nauels, A., Xia, Y., Bex, V., and Midgley, P. M., 1311–1394, Cambridge University Press, Cambridge, UK and New York, NY, USA, 2013.
Jambers, W. and Van Grieken, R.: Single particle characterization of inorganic suspension in Lake Baikal, Siberia, Environ. Sci. Technol., 31, 1525–1533, https://doi.org/10.1021/es9608003, 1997.
Jassby, A. D., Reuter, J. E., Axler, R. P., Goldman, C. R., and Hackley, S. H.: Atmospheric deposition of nitrogen and phosphorus in the annual nutrient load of Lake Tahoe (California-Nevada), Water Resour. Res., 30, 2207–2216, 1994.
Jeffrey, S. W. and Humphrey, G. F.: New spectrophotometric equations for determining chlorophylls a, b, c1 and c2 in higher plants, algae and natural phytoplankton, Biochem. Physiol. Pfl., 167, 191–194, 1975.
Kahle, D. and Wickham, H.: ggmap: spatial visualization with ggplot2, R. J. 5, 144–161, 2013.
Kalacheva, G. S., Gubanov, V. G., Gribovskaya, I. V., Gladchenko, I. A., Zinenko, G. K., and Savitsky, S. V.: Chemical analysis of Lake Shira water (1997–2000), Aquat. Ecol., 36, 123–141, https://doi.org/10.1023/A:1015695813280, 2002.
Kopáček, J., Stuchlík, E., Straškrabová, V., and Pšenáková, P.: Factors governing nutrient status of mountain lakes in the Tatra Mountains, Freshw. Biol., 43, 369–384, https://doi.org/10.1046/j.1365-2427.2000.00569.x, 2000.
Kopáček, J., Turek, J., Hejzlar, J., and Porcal, P.: Bulk deposition and throughfall fluxes of elements in the Bohemian Forest (central Europe) from 1998 to 2009, Boreal Environ. Res., 16, 495–508, 2011a.
Kopáček, J., Hejzlar, J., Vrba, J., and Stuchlík, E.: Phosphorus loading of mountain lakes: Terrestrial export and atmospheric deposition, Limnol. Oceanogr., 56, 1343–1354, https://doi.org/10.4319/lo.2011.56.4.1343, 2011b.
Kuhn, M.: The nutrient cycle through snow and ice, a review, Aquat. Sci., 63, 150–167, https://doi.org/10.1007/PL00001348, 2001.
Lamarque, J.-F., Dentener, F., McConnell, J., Ro, C.-U., Shaw, M., Vet, R., Bergmann, D., Cameron-Smith, P., Dalsoren, S., Doherty, R., Faluvegi, G., Ghan, S. J., Josse, B., Lee, Y. H., MacKenzie, I. A., Plummer, D., Shindell, D. T., Skeie, R. B., Stevenson, D. S., Strode, S., Zeng, G., Curran, M., Dahl-Jensen, D., Das, S., Fritzsche, D., and Nolan, M.: Multi-model mean nitrogen and sulfur deposition from the Atmospheric Chemistry and Climate Model Intercomparison Project (ACCMIP): evaluation of historical and projected future changes, Atmos. Chem. Phys., 13, 7997–8018, https://doi.org/10.5194/acp-13-7997-2013, 2013.
LeBauer, D. S. and Treseder, K. K.: Nitrogen limitation of net primary productivity in terrestrial ecosystems is globally distributed, Ecology, 2, 371–379, https://doi.org/10.1007/BF00153104, 2008.
Logatchev, N. A.: History and geodynamics of the Lake Baikal rift in the context of the Eastern Siberia rift system: a review, Bull. Centres Rech. Explor. Elf Aquitaine, 17, 353–370, 1993.
Mahowald, N., Jickells, T. D., Baker, A. R., Artaxo, P., Benitez-Nelson, C. R., Bergametti, G., Bond, T. C., Chen, Y., Cohen, D. D., Herut, B., Kubilay, N., Losno, R., Luo, C., Maenhaut, W., McGee, K. A., Okin, G. S., Siefert, R. L., and Tsukuda, S.: Global distribution of atmospheric phosphorus sources, concentrations and deposition rates, and anthropogenic impacts, Global Biogeochem. Cy., 22, 1–19, https://doi.org/10.1029/2008GB003240, 2008.
Malevsky-Malevich, S. P., Molkentin, E. K., Nadyozhina, E. D., and Shklyarevich, O. B.: An assessment of potential change in wildfire activity in the Russian boreal forest zone induced by climate warming during the twenty-first century, Clim. Change, 86, 463–474, https://doi.org/10.1007/s10584-007-9295-7, 2008.
Marcé, R., Obrador, B., Morguí, J.-A., Riera, J., López, P., and Armengol, J.: Carbonate weathering as a driver of CO2 supersaturation in lakes, Nat. Geosci., 8, 107–111, https://doi.org/10.1038/ngeo2341, 2015.
Medina-Sanchez, J. M., Villar-Argaiz, M., and Carrillo, P.: Neither with nor without you: A complex algal control on bacterioplankton in a high mountain lake, Limnol. Oceanogr., 49, 1722–1733, 2004.
Mosello, R., Berg, T., Nicuks, U., and Appleby, P.: Atmospheric deposition. Sampling and analysis of direct deposition, snow pack and soil cores, Mountain lake research (MOLAR) project manual, programme: Measuring and modelling the dynamic response of remote mountain lake ecosystems to environmental change, C.N.R. Instituto Italiano di Idrobiologia, Pallanza, Norwegian Institute for Air Research, Lillestrøm, Institute of Meteorology, Innsbruck, University of Liverpool, 1–16, 1997.
Ohizumi, T., Take, N., Inomata, Y., Yagoh, H., Endo, T., Takahashi, M., Yanahara, K., and Kusakabe, M.: Long-term variation of the source of sulfate deposition in a leeward area of Asian continent in view of sulfur isotopic composition, Atmos. Environ., 140, 42–51, https://doi.org/10.1016/j.atmosenv.2016.05.057, 2016.
Pearson, C., Schumer, R., Trustman, B. D., Rittger, K., Johnson, D. W., and Obrist, D.: Nutrient and mercury deposition and storage in an alpine snowpack of the Sierra Nevada, USA, Biogeosciences, 12, 3665–3680, https://doi.org/10.5194/bg-12-3665-2015, 2015.
R Core Team: R: A language and environment for statistical computing. R Foundation for Statistical Computing, Vienna, Austria, available at: https://www.R-project.org/ (last access: 1 March 2021), 2017.
Rahm, L., Hakansson, B., Larsson, P., Fogelqvist, E., Bremle, G., and Valderrama, J.: Nutrient and persistent pollutant deposition on the Bothnian bay ice and snow fields, Water Air Soil Pollut., 84, 187–201, 1995.
Raison, R. J.: Modification of the soil environment by vegetation fires, with particular reference to nitrogen transformations: a review, Plant Soil, 51, 73–108, 1979.
Reinemann, S. A., Porinchu, D. F., Gustin, M. A., and Mark, B. G.: Historical trends of mercury and spheroidal carbonaceous particle deposition in sub-alpine lakes in the Great Basin, United States, J. Paleolimnol., 52, 405–418, https://doi.org/10.1007/s10933-014-9801-7, 2014.
Rockström, J., Steffen, W., Noone, K., Persson, A., Chapin, F. S., Lambin, E. F., Lenton, T. M., Scheffer, M., Folke, C., Schellnhuber, H. J., Nykvist, B., de Wit, C. A., Hughes, T., van der Leeuw, S., Rodhe, H., Sörlin, S., Snyder, P. K., Costanza, R., Svedin, U., Falkenmark, M., Karlberg, L., Corell, R. W., Fabry, V. J., Hansen, J., Walker, B., Liverman, D., Richardson, K., Crutzen, P., and Foley, J. A.: A safe operating space for humanity, Nature, 461, 472–475, https://doi.org/10.1038/461472a, 2009.
Rolph, G., Stein, A., and Stunder, B.: Real-time Environmental Applications and Display sYstem: READY, Environ. Model. Softw., 95, 210–228, https://doi.org/10.1016/j.envsoft.2017.06.025, 2017.
Rose, N. L.: A note on further refinements to a procedure for the extraction of carbonaceous fly-ash particles from sediments, J. Paleolimnol., 11, 201–204, https://doi.org/10.1007/BF00686866, 1994.
Rose, N. L.: Quality control in the analysis of lake sediments for spheroidal carbonaceous particles, Limnol. Oceanogr., 6, 172–179, https://doi.org/10.4319/lom.2008.6.172, 2008.
Rose, N. L. and Monteith, D. T.: Temporal trends in spheroidal carbonaceous particle deposition derived from annual sediment traps and lake sediment cores and their relationship with non-marine sulphate, Environ. Pollut., 137, 151–163, https://doi.org/10.1016/j.envpol.2004.12.022, 2005.
Rose, N. L. and Ruppel, M.: Environmental archives of contaminant particles, in: Environmental contaminants. Developments in Paleoenvironmental Research, Vol. 18, edited by: Blais, J., Rosen, M., and Smol, J., 187–221, Springer, Dordrecht, 2015.
Rose, N. L., Appleby, P. G., Boyle, J. F., Mackay, A. W., and Flower, R. J.: The spatial and temporal distribution of fossil-fuel derived pollutants in the sediment record of Lake Baikal, eastern Siberia, J. Paleolimnol., 20, 151–162, 1998.
Rose, N. L., Harlock, S., and Appleby, P. G.: The spatial and temporal distributions of spheroidal carbonaceous fly-ash particles (SCP) in the sediment records of european mountain lakes, Water Air Soil Pollut., 113, 1–32, 1999.
Rose, N. L., Flower, R. J., and Appleby, P. G.: Spheroidal carbonaceous particles (SCPs) as indicators of atmospherically deposited pollutants in North African wetlands of conservation importance, Atmos. Environ., 37, 1655–1663, https://doi.org/10.1016/S1352-2310(03)00012-8, 2003.
Sickman, J. O., Melack, J. M., and Clow, D. W.: Evidence for nutrient enrichment of high-elevation lakes in the Sierra Nevada, California, Limnol. Oceanogr., 48, 1885–1892, https://doi.org/10.4319/lo.2003.48.5.1885, 2003.
Slanina, J., Lingerak, W. A., and Bergman, L.: A fast determination of nitrate in rain and surface waters by means of UV spectrophotometry, Z. Anal. Chem. Freseniu., 280, 365–368, 1976.
Šporka, F., Štefková, E., Bitušík, P., Thompson, A. R., Agustí-Panareda, A., Appleby, P. G., Grytnes, J. A., Kamenik, C., Krno, I., Lami, A., Rose, N., and Shilland, N. E.: The paleolimnological analysis of sediments from high mountain lake Nižné Terianske pleso in the High Tatras (Slovakia), J. Paleolimnol., 28, 95–109, 2002.
Steffen, W., Richardson, K., Rockström, J., Cornell, S. E., Fetzer, I., Bennett, E. M., Biggs, R., Carpenter, S. R., Vries, W. De, Wit, C. A. De, Folke, C., Gerten, D., Heinke, J., Mace, G. M., Persson, L. M., Ramanathan, V., Reyers, B., and Sörlin, S.: Planetary boundaries: Guiding human development on a changing planet, Science, 347, 1259855, https://doi.org/10.1126/science.1259855, 2015.
Stein, A. F., Draxler, R. R., Rolph, G. D., Stunder, B. J. B., Cohen, M. D., and Ngan, F.: Noaa's hysplit atmospheric transport and dispersion modeling system, B. Am. Meteor. Soc., 96, 2059–2077, https://doi.org/10.1175/BAMS-D-14-00110.1, 2015.
Stepanov, N. V.: Sosudistye rasteniya priyeniseiskikh Sayan, Institut Fundamentalnoy Biologii i Biotekhnologii, Siberian Federal University, Krasnoyarsk, 2016.
Stottlemyer, R. and Rutkowski, D.: Multiyear trends in snowpack Ion accumulation and loss, northern Michigan, Water Resour. Res., 26, 721–737, 1990.
Takhtadzhyan, A. L.: Floristicheskie oblasti zemli, Nauka leningradskoe otdelenie, Leningrad, 1978.
Tipping, E., Benham, S., Boyle, J. F., Crow, P., Davies, J., Fischer, U., Guyatt, H., Helliwell, R., Jackson-Blake, L., Lawlor, A. J., Monteith, D. T., Rowe, E. C., and Toberman, H.: Atmospheric deposition of phosphorus to land and freshwater, Environ. Sci. Proc. Imp., 16, 1608–1617, https://doi.org/10.1039/c3em00641g, 2014.
Tolomeev, A. P., Anishchenko, O. V., Kravchuk, E. S., Kolmakova, O. V., Glushchenko, L. A., Makhutova, O. N., Kolmakova, A. A., Kolmakov, V. I., Trusova, M. Y., Sushchik, N. N., and Gladyshev, M. I.: Component elements of the carbon cycle in the middle and lower Yenisei River, Contemp. Probl. Ecol., 7, 489–500, https://doi.org/10.1134/S1995425514040118, 2014.
Ventura, M., Camarero, L., Buchaca, T., Bartumeus, F., Livingstone, D. M., and Catalan, J.: The main features of seasonal variability in the external forcing and dynamics of a deep mountain lake (Redó. Pyrenees), J. Limnol., 59, 97–108, https://doi.org/10.4081/jlimnol.2000.s1.97, 2000.
Vitousek, P. M., Aber, J. D., Howarth, R. H., Likens, G. E., Matson, P. A., Schindler, D. W., Schlesinger, W. H., and Tilman, D. G.: Human alteration of the global nitrogen cycle: Source and consequences, Ecol. Appl., 7, 737–750, https://doi.org/10.1038/nn1891, 1997.
Voskresenskii, S.: Geomorfologia Sibirii, Izdatelstvo MGU (Moscow State University Publications), Moscow, 1962 (in Russian).
Wang, R., Balkanski, Y., Boucher, O., Ciais, P., and Tao, S.: Significant contribution of combustion-related emissions to the atmospheric phosphorus budget, Nat. Geosci., 8, 4–10, https://doi.org/10.1038/NGEO2324, 2015.
Wang, S., Shi, X., Cao, W., and Pu, T.: Seasonal variability and evolution of glaciochemistry at an Alpine temperate glacier on the southeastern Tibetan plateau, Water, 10, 1–14, https://doi.org/10.3390/w10020114, 2018a.
Wang, W., Liu, X., Xu, J., Dore, A. J., and Xu, W.: Imbalanced nitrogen and phosphorus deposition in the urban and forest environments in southeast Tibet, Atmos. Pollut. Res., 9, 774–782, https://doi.org/10.1016/j.apr.2018.02.002, 2018b.
Wasiuta, V., Norman, A. L., Lafrenière, M. J., and Hastings, M. G.: Background atmospheric sulfate deposition at a remote alpine site in the Southern Canadian Rocky Mountains, J. Geophys. Res.-Atmos., 120, 11352–11367, https://doi.org/10.1002/2015JD023835, 2015.
Wik, M. and Renberg: Environmental records of carbonaceous fly-ash particles from fossil-fuel combustion, J. Paleolimnol., 15, 193–206, 1996.
Williams, M. W. and Melack, J. M.: Solute chemistry of snowmelt and runoff in an Alpine basin, Sierra Nevada, Water Resour. Res., 27, 1575–1588, https://doi.org/10.1029/90WR02774, 1991.
Wright, S. W., Jeffrey, S. W., and Mantoura, R. F. C.: Evaluation of methods and solvents for pigment extraction, in: Phytoplankton pigments in oceanography: guidelines to modern methods, Vol. 48, edited by: Jeffrey, S. W., Mantoura, R. F. C., andx Wright, R. F. C., 261–282, UNESCO Publishing, Paris, 1997.
Xu, W., Liu, L., Cheng, M., Zhao, Y., Zhang, L., Pan, Y., Zhang, X., Gu, B., Li, Y., Zhang, X., Shen, J., Lu, L., Luo, X., Zhao, Y., Feng, Z., Collett Jr., J. L., Zhang, F., and Liu, X.: Spatial–temporal patterns of inorganic nitrogen air concentrations and deposition in eastern China, Atmos. Chem. Phys., 18, 10931–10954, https://doi.org/10.5194/acp-18-10931-2018, 2018.
Yang, H., Rose, N. L., and Battarbee, R. W.: Dating of recent catchment peats using spheroidal carbonaceous particle (SCP) concentration profiles with particular reference to Lochnagar, Scotland, Holocene, 11, 593–597, https://doi.org/10.1191/095968301680223549, 2001.