the Creative Commons Attribution 4.0 License.
the Creative Commons Attribution 4.0 License.
 | 10 Mar 2021
Enhancement of the North Atlantic CO2 sink by Arctic Waters
Solveig R. Olafsdottir
Taro Takahashi
Magnus Danielsen
Thorarinn S. Arnarson
The North Atlantic north of 50∘ N is one of the most intense ocean sink areas for atmospheric CO2 considering the flux per unit area, 0.27 Pg-C yr−1, equivalent to −2.5 mol C m−2 yr−1. The northwest Atlantic Ocean is a region with high anthropogenic carbon inventories. This is on account of processes which sustain CO2 air–sea fluxes, in particular strong seasonal winds, ocean heat loss, deep convective mixing, and CO2 drawdown by primary production. The region is in the northern limb of the global thermohaline circulation, a path for the long-term deep-sea sequestration of carbon dioxide. The surface water masses in the North Atlantic are of contrasting origins and character, with the northward-flowing North Atlantic Drift, a Gulf Stream offspring, on the one hand and on the other hand the cold southward-moving low-salinity Polar and Arctic waters with signatures from Arctic freshwater sources. We have studied by observation the CO2 air–sea flux of the relevant water masses in the vicinity of Iceland in all seasons and in different years. Here we show that the highest ocean CO2 influx is to the Arctic and Polar waters, respectively, and mol C m−2 yr−1. These waters are CO2 undersaturated in all seasons. The Atlantic Water is a weak or neutral sink, near CO2 saturation, after poleward drift from subtropical latitudes. These characteristics of the three water masses are confirmed by data from observations covering 30 years. We relate the Polar Water and Arctic Water persistent undersaturation and CO2 influx to the excess alkalinity derived from Arctic sources. Carbonate chemistry equilibrium calculations clearly indicate that the excess alkalinity may support at least 0.058 Pg-C yr−1, a significant portion of the North Atlantic CO2 sink. The Arctic contribution to the North Atlantic CO2 sink which we reveal was previously unrecognized. However, we point out that there are gaps and conflicts in the knowledge about the Arctic alkalinity and carbonate budgets and that future trends in the North Atlantic CO2 sink are connected to developments in the rapidly warming and changing Arctic. The results we present need to be taken into consideration for the following question: will the North Atlantic continue to absorb CO2 in the future as it has in the past?
- Article
(2353 KB) - Full-text XML
-
Supplement
(818 KB) - BibTeX
- EndNote


The oceans take up about a quarter of the annual anthropogenic CO2 emissions (Friedlingstein et al., 2019). This may even be an underestimate (Watson et al., 2020). The North Atlantic north of 50∘ N is one of the most intense ocean sink areas for atmospheric CO2 considering the flux per unit area (Takahashi et al., 2009). The reasons are strong winds and large natural partial pressure differences, ΔpCO2 = (pCO2sw − pCO2a), between the atmosphere and the surface ocean. The ΔpCO2 in seawater is a measure of the escaping tendency of CO2 from seawater to the overlying air. The ΔpCO2 is proportional to the concentration of undissociated CO2 molecules, [CO2]aq, which constitutes about 1 % of the total CO2 dissolved in seawater (the remainder being about 90 %–95 % as [HCO] and 4 %–9 % as [CO]). The seawater pCO2 depends sensitively on temperature and the TCO2 Alk ratio, the relative concentrations of total CO2 species dissolved in seawater (TCO2 = [CO2]aq + [HCO] + [CO]), and the alkalinity, Alk, which reflects the ionic balance in seawater. Large ΔpCO2 has been attributed to (a) a cooling effect on the CO2 solubility in the poleward-flowing Atlantic Water, (b) an efficient biological drawdown of pCO2 in nutrient-rich subpolar waters, and (c) high wind speeds over these low-pCO2 waters (Takahashi et al., 2002). Evaluations of ΔpCO2 based on observation and models have indicated that the Atlantic north of 50∘ N and northward into the Arctic takes up as much as 0.27 Pg-C yr−1, equivalent to −2.5 mol C m−2 yr−1 (Takahashi et al., 2009; Schuster et al., 2013; Landschützer et al., 2013; Mikaloff Fletcher et al., 2006). The North Atlantic is a relatively well-observed region of the ocean (Takahashi et al., 2009; Bakker et al., 2016; Reverdin et al., 2018). Nevertheless, estimates of long-term trends for the North Atlantic CO2 sink due to changes in either ΔpCO2 or wind strength are conflicting, particularly the Atlantic Water-dominated regions (Schuster et al., 2013; Landschützer et al., 2013; Wanninkhof et al., 2013). The drivers of seasonal flux variations are considered to be inadequately understood (Schuster et al., 2013), and a mechanistic understanding of high-latitude CO2 sinks is regarded as incomplete (McKinley et al., 2017). It has been common to many large-scale flux evaluations, modelled or from observations, that they are based on regions defined by geographical borders, latitude, and longitude, e.g. between 49 and 76∘ N for the high-latitude subpolar North Atlantic (Takahashi et al., 2009; Schuster et al., 2013). A more realistic approach is to define biogeographical regions or biomes (Fay and McKinley, 2014). The influence of oceanographic property differences within this region on CO2 fluxes has generally not been apparent, primarily due to Arctic latitude data limitations. The ability of current-generation Earth system models to predict trends in North Atlantic CO2 has recently been questioned, and it as been suggested that their inadequacies may be caused by biased alkalinity in the simulated background biogeochemical state (Lebehot et al., 2019).
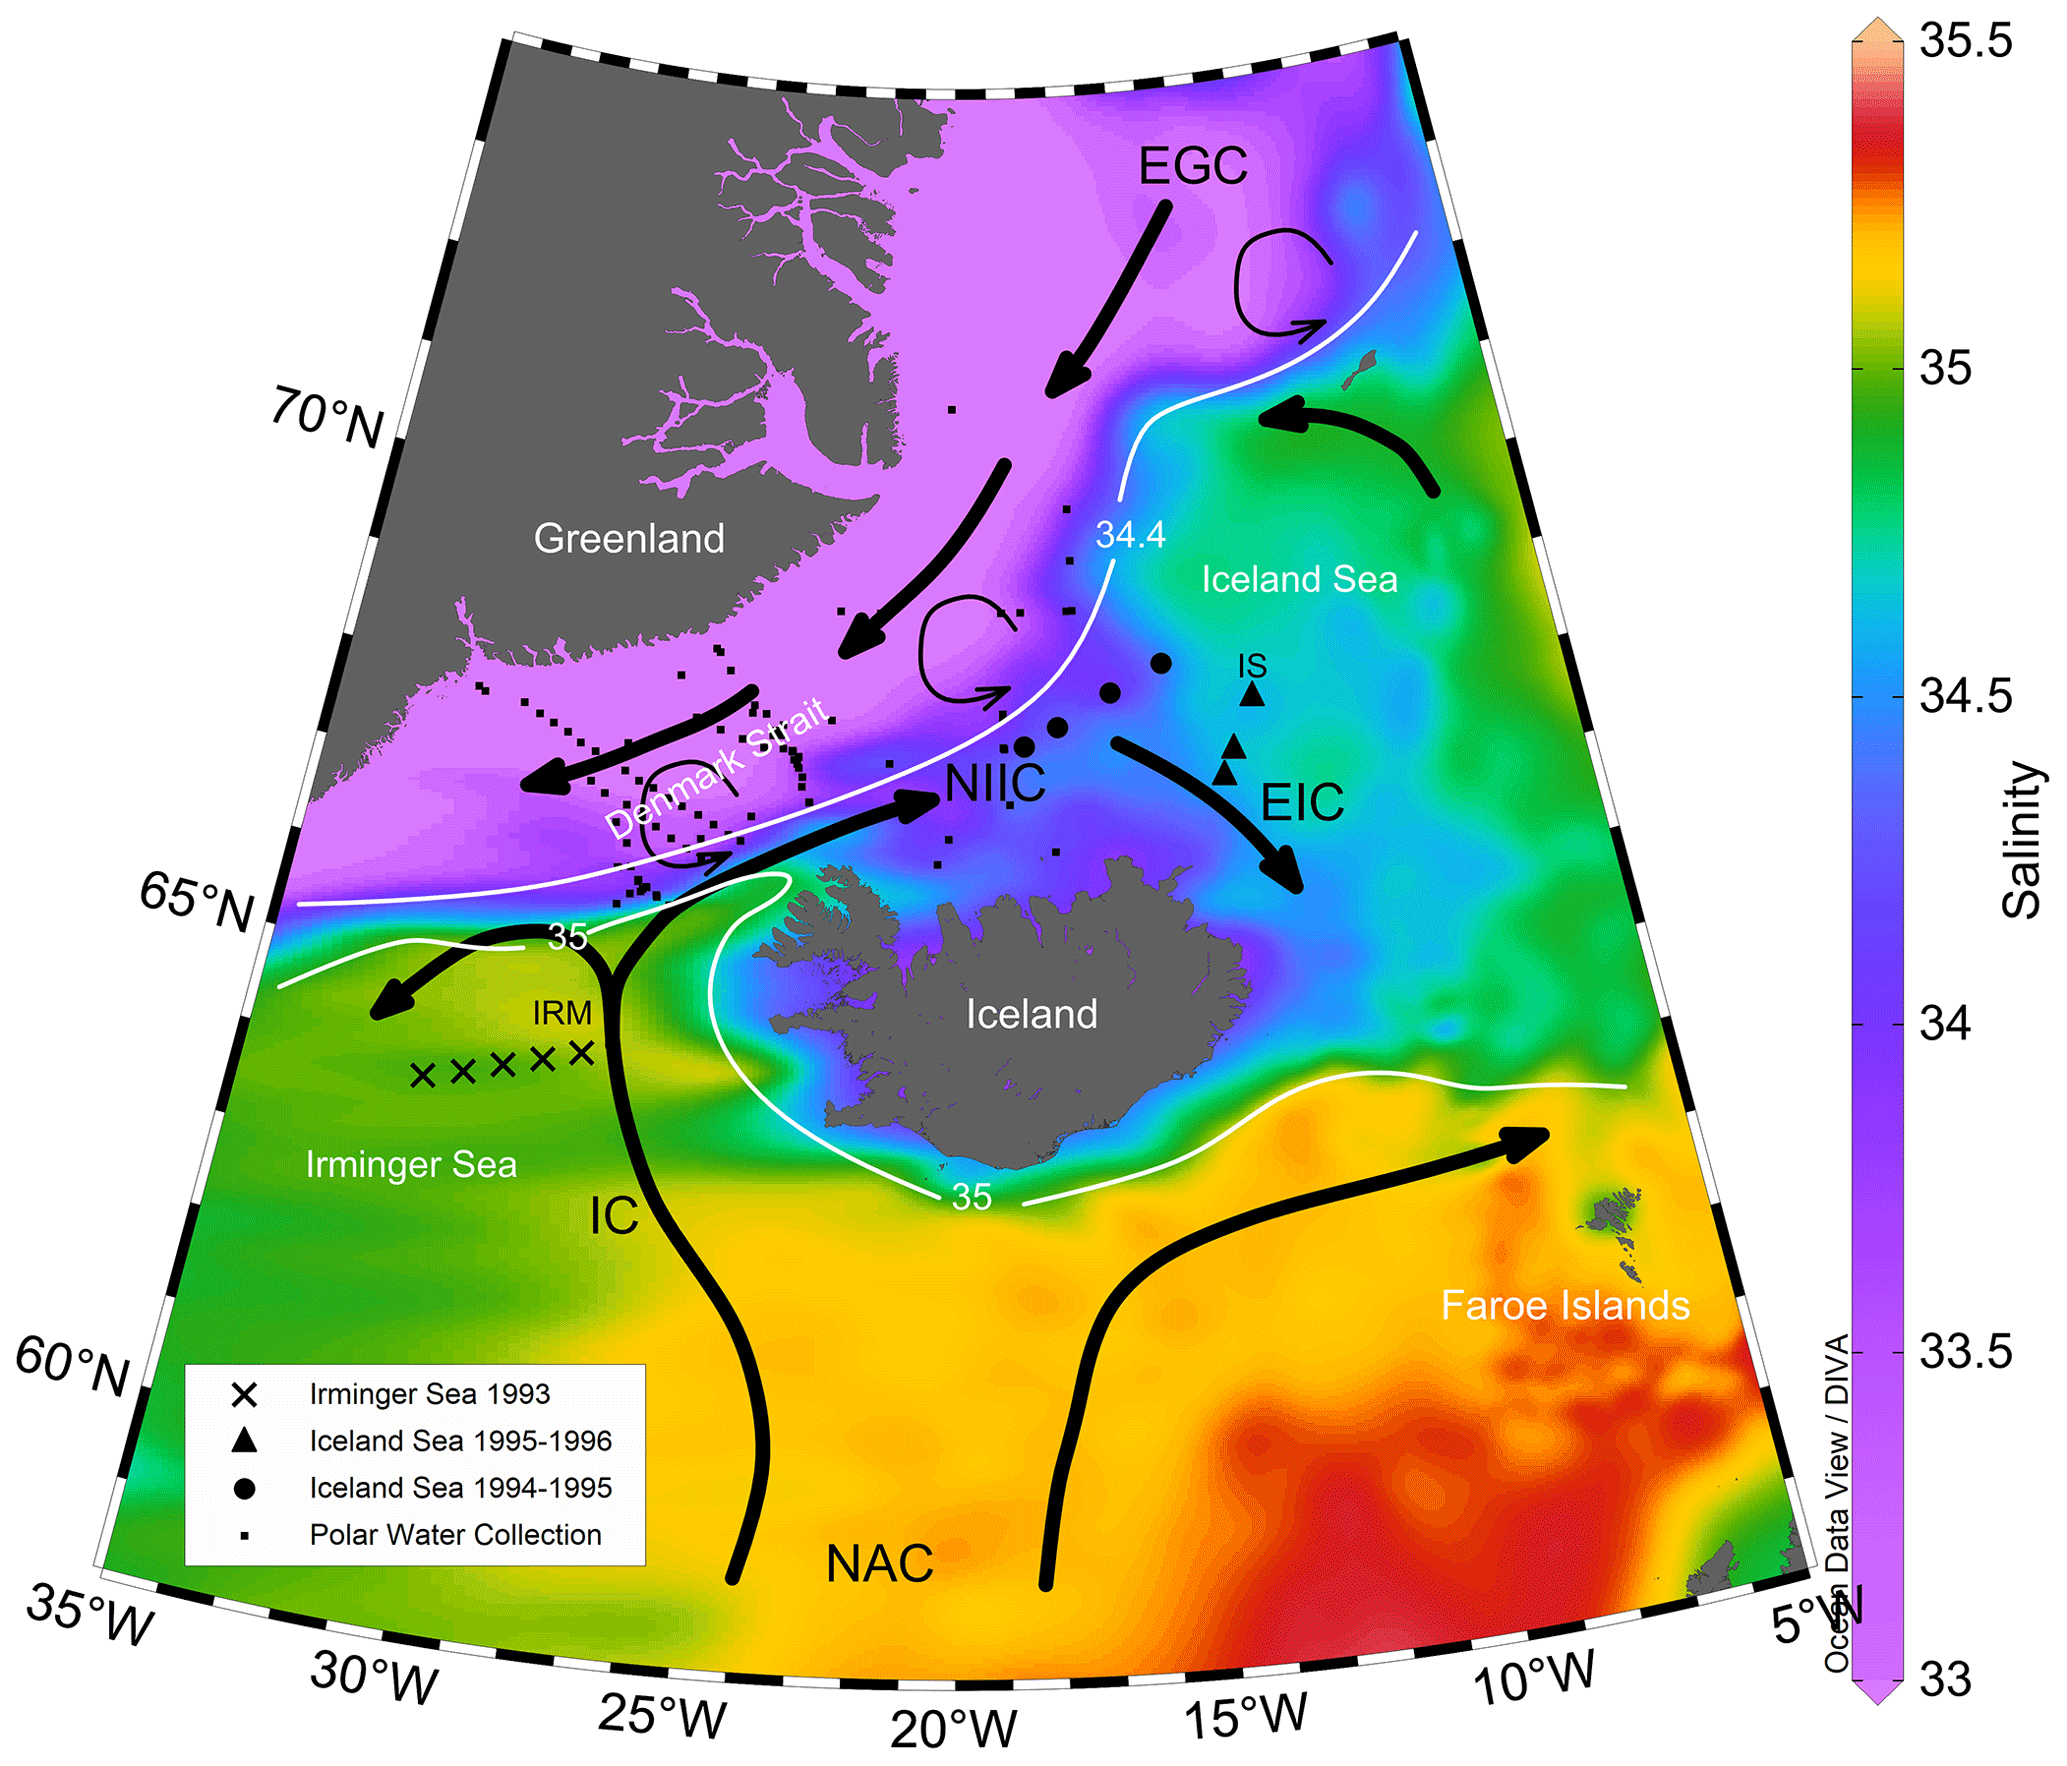
Figure 1Mean July to September surface salinity in the vicinity of Iceland. The S=35 isohaline marks the boundary between northward-flowing Atlantic Water and southward-flowing cold Arctic Water and low-salinity Polar Water. Stations in the Irminger Sea are marked with ×, and stations in the Iceland Sea are marked with • for 1994–1995 and ▴ for 1995–1996 observations. Collection of Polar Water stations in 1983–2012 are marked with ▪. IRM and IS mark the location of time series stations. NAC: North Atlantic Current; IC: Irminger Current; NIIC: North Iceland Irminger Current; EIC: East Icelandic Current; EGC: East Greenland Current. Map based on the NISE dataset (Nilsen et al., 2008) and drawn using the Ocean Data View programme (Schlitzer, 2018).
The high-latitude North Atlantic Ocean in the vicinity of Iceland is a region of contrasting surface properties (Fig. 1). The northward-flowing North Atlantic Current carries relatively warm and saline Atlantic Water, derived from the Gulf Stream, as far as the Nordic Seas and the Arctic Ocean north of Svalbard. The Irminger Current branch carries Atlantic Water to south and west Iceland, and a small branch, the North Icelandic Irminger Current that transports 1 Sv (1 Sv = 106 m3 s−1), reaches the Iceland Sea (Stefánsson, 1962; Våge et al., 2011). The temperature and salinity properties of the Atlantic Water are known to change with atmospheric forcing and with freshening events (Dickson et al., 1988; Hátún et al., 2005; Holliday et al., 2020). The rapid East Greenland Current (EGC) (Håvik et al., 2017) flows southward from the Arctic to the North Atlantic, carrying cold Polar Water with low salinity, S<34.4, due to ice melt and a portion of the large freshwater input to the Arctic from rivers that contribute about 11 % of the global riverine discharge (Sutherland et al., 2009; McClelland et al., 2012). In between these extremes there are large areas of the Greenland and Iceland seas that contain predominantly intermediate Arctic Water which is a product of heat loss and freshwater export from the EGC (Fig. 1) (Våge et al., 2015). The north- and southward-flowing currents are separated by the Arctic Front outlined in Fig. 1 by the salinity = 35 contour generally oriented SW–NE. Deep water formation in the high-latitude North Atlantic produces cold, dense waters which, together with a similar product in the Labrador Sea, are source waters for the global thermohaline circulation linking the regional air–sea CO2 flux to a route for the long-term deep ocean sequestration of anthropogenic CO2 (Broecker, 1991). Downstream from the southward Polar Water and Arctic Water flows is the subpolar North Atlantic with high water column inventories of anthropogenic carbon (Khatiwala et al., 2013; Gruber et al., 2019). The high-anthropogenic-CO2 regions have been attributed to the combined effects of the solubility and biology gas exchange pumps on the CO2 fluxes (Takahashi et al., 2002). The region of our study affects large-scale ocean–atmosphere CO2 exchange processes in the North Atlantic.
Here we evaluate regional, seasonal, and interannual air–sea carbon dioxide fluxes for the main surface waters characteristic of this region (Fig. 1). We base this work on extensive observations which cover regional water masses and all seasons and include different states of the North Atlantic Ocillation, NAO (Flatau et al., 2003). We employ two different observation approaches for flux estimates. Firstly, repeat station hydrography with emphasis on the seasonal flux patterns in Atlantic Water and in Arctic Water (Fig. 1). Secondly, we use underway ship records of surface pCO2 where the emphasis was on the different surface water masses (Fig. 2).

Figure 2Cruise tracks where surface layer salinity and pCO2 were recorded underway. The left column shows sea surface salinity, and the right column shows pCO2sw (µatm) along the cruise tracks. Maps were drawn using the Ocean Data View programme (Schlitzer, 2018).
We describe long-term carbon chemistry characteristics of water masses in mid-winter when physical forces prevail over biological processes. For the Irminger Sea and Iceland Sea we use time series observations (Olafsson et al., 2010), and for the EGC Polar Water we use a collection of pCO2 data assembled in the period 1983 to 2012.
2.1 Data acquisition
2.1.1 Seasonal studies 1993–1996
Seasonal carbon chemistry variations in the relatively warm and saline (S>35) Atlantic Water were studied in 1993–1994 on 15 cruises from February 1993 to January 1994 with five stations on a 167 km long transect over the core of the Irminger Current and into the northern Irminger Sea (Fig. 1 and Tables S1 and S2 in the Supplement). In order to close the full annual cycle, until 23 February 1994 we use data from the previous year and date. In 1994–1996 the study centred on the colder and less saline Arctic Water of the Iceland Sea and was conducted on 22 cruises with sampling dates from 11 February 1994 to 12 February 1996.
In 1994 measurements were made at four stations on a 168 km long transect into the Iceland Sea Gyre and in 1995 at three stations across the East Icelandic Current (Fig. 1 and Tables S1 and S3). On each cruise the station work was completed in 1–2 d. For both regions, the timing of cruises was with the period of the phytoplankton spring bloom in mind (Takahashi et al., 1993). The work was conducted on vessels operated by the Marine Research Institute (MRI) in Reykjavik, Iceland, R/V Bjarni Sæmundsson and R/V Árni Friðriksson. Three times in 1994 the fishing vessel M/V Solrun was hired. In August 1994 the stations were completed on the Norwegian vessel R/V Johan Hjort.
Discrete surface layer, 1, 5, and 10 m pCO2 samples were collected in 500 mL volumetric flasks, and total dissolved inorganic carbon samples, TCO2, were collected in 250 mL flasks from water bottles on Rosette and Sea-Bird 911 conductivity–temperature–depth (CTD) instruments. ThepCO2 samples were preserved with mercuric chloride and analysed ashore by equilibration at 4 ∘C with a gas of known CO2 concentration followed by gas chromatography with a flame ionization detector. The instrument was calibrated with N2 reference gas and three standards, 197.85, 362.6, and 811.08 ppm, calibrated against standards certified by NOAA-CMDL at Boulder, CO, USA. The standards used for the underway measurements were similarly calibrated (Chipman et al., 1993). Samples for total dissolved inorganic carbon, TCO2, were similarly preserved with mercuric chloride and analysed by coulometry ashore. Quality assurance and sample storage experiments indicated an overall precision of the discrete sample pCO2 determinations better than ±2 µatm and for the TCO2 determinations about ±2 µmol kg−1 after 1990 but ±4 µmol kg−1 earlier (Olafsson et al., 2010).
2.1.2 Underway pCO2 records 2006–2007
The underway pCO2 determinations in 2006–2007 covered areas of the East Greenland Current in and northwards from the Denmark Strait, in addition to Atlantic and Arctic waters. The six cruises (Table S4) covered all seasons and all three water masses but with variable areal extensions (Fig. 2). Seawater was pumped continuously from an intake at 5 m depth at 10 L min−1 into a shower-head equilibrator with a total volume of 30 L and a headspace of 15 L. Temperature at the inlet and salinity were measured with a Sea-Bird model SBE-21 thermosalinograph (Sea-Bird Electronics, Seattle, WA, USA). Underway pCO2 determinations were carried out with a system similar to the one described by Bates et al. (1998). The mole fraction of CO2 () in the headspace was determined with a Li-Cor infrared analyser model 6251 (Li-Cor Biosciences, Lincoln, NB, USA). The instrument was calibrated against four standards of CO2 in air certified by NOAA-CMDL at Boulder, CO, USA, and a N2 reference gas. The standards had CO2 dry-air mole fractions of 122.19, 253.76, 358.41, and 476.81 ppm. The pCO2 seawater (sw) determinations were corrected to in situ seawater temperatures using the equation (Takahashi et al., 1993)
The precision of the underway pCO2 determinations is estimated by SOCAT to be better than ±5 µatm (Bakker et al., 2016).
2.1.3 Time series data
We use discrete sample pCO2 and TCO2 data to calculate total alkalinity from the Irminger Sea and the Iceland Sea time series stations (Ólafsson, 2012, 2016).
2.1.4 Polar Water data collection
Discrete samples for carbon chemistry studies were taken at stations (N=146) in the East Greenland Current when opportunity permitted on cruises in the period from 1983 to 2012. The 25 m surface layer data include >400 TCO2 samples and >300 pairs of pCO2 and TCO2 for calculation of carbonate system parameters. The seasonal cycle by month is evaluated from the composite data.
2.1.5 Carbonate chemistry calculations
The most desirable way to compute carbonate chemistry parameters is to use pCO2 and TCO2 (Takahashi et al., 2014). We calculate total alkalinity from discrete sample pCO2 and TCO2 data pairs using the CO2SYS.xls v2.1 software (Lewis and Wallace, 1998; Pierrot et al., 2006) and select carbonic acid dissociation constants (Lueker et al., 2000), the constant for HSO (Dickson, 1990), and boron concentrations (Lee et al., 2010).
2.2 CO2 air–sea flux calculations
In this study, the partial pressure of carbon dioxide in seawater samples has been measured by gas–seawater equilibration methods (Olafsson et al., 2010). The results are expressed as pCO2. The bulk flux of the carbon dioxide across the air–sea interface is often estimated from its relationship with wind speed and sea-air partial pressure difference, ΔpCO2. We determine the flux (F) from ΔpCO2 and use Eqs. (2) and (3) for estimating the bulk air–sea fluxes of CO2 (Takahashi et al., 2009).
There is the gas transfer velocity or kinetic component of the expression (Wanninkhof, 2014), α is the solubility of CO2 gas in seawater (Weiss, 1974), and ΔpCO2 = (pCO2sw − pCO2a) is the partial pressure difference or thermodynamic component of the expression (Takahashi et al., 2009). For the wind speed, U, we use the CCMP-2 reanalysis wind product (Wanninkhof, 2014; Atlas et al., 2011; Wanninkhof and Triñanes, 2017).
The atmospheric partial pressure values, pCO2a, used in the ΔpCO2 calculations are weekly averages from the GlobalView-CO2 database for the CO2-ICE location which is at Vestmannaeyjar islands, off the coast of south Iceland (GlobalView-CO2, 2013). Mauna Loa values were used for periods where CO2-ICE data were missing, 1983–1992 and 2010–2012 (Tans and Keeling, 2019). The dry-air VCO2 mole fraction values were converted to microatmospheres using pCO2 (µatm) = (Pa−Pw), where Pa is the barometric pressure and Pw is the equilibrium water vapour pressure (Weiss and Price, 1980).
For the Irminger Sea seasonal study we use 30 d running means of the squared daily wind speed for the region 63.5 to 64.5∘ N and 27 to 32∘ W, and for the Iceland Sea seasonal study a similar wind product for the region 66.5 to 68.5∘ N and 12 to 19 ∘ W was used. Fluxes were calculated for the periods between cruises from interpolatedpCO2 data and period mean 30 d squared wind running mean data. There are thus 14 flux periods covering a year for the Irminger Sea and 21 flux periods covering 2 years in the Iceland Sea (Tables S1 and S2). The annual fluxes were found by summation of the period fluxes (Table 1).
For the underway cruises from 2006 to 2007 we used CCMP-2 daily wind fields at 1∘ ×1∘ for the region 62 to 72∘ N and 5 to 40∘ W. This region was further divided into four sub-regions by latitude 64.9∘ N and longitude 20∘ W. Daily 30 d running means of the squared wind speed from two locations in each sub-region were extracted and their means used for flux calculations when the vessel sailed in the area. Fluxes were calculated for all pCO2 data from the six cruises, in total 42 938 measurements.
The flux data from each of the six cruises were categorized into the three seawater types using the following criteria:
-
Atlantic Water S>35, Arctic Water S is 34.4–34.9, and Polar Water S<34.4.
-
Seasonal salinity and temperature variations were taken into account.
-
Waters with runoff influences from Iceland were excluded using salinity and ship position data.
Thus a total of 33 352 measurements were used, or 78 % of the flux data points. The CO2 fluxes in the realm of each water mass were assessed for the duration of each cruise by numerical integration. Fluxes in the five periods between cruises were assessed by interpolation of temperature, salinity, and pCO2 for each water mass and by using period regional 30 d running means of squared wind speed data. The annual flux for each water mass was assessed by summation.
3.1 Seasonal variations and annual CO2 fluxes at regional water masses
The wind gas transfer coefficient reveals seasonal variations reflecting strong winds in winter when they may be stronger over the Irminger Sea than the Iceland Sea as in 1993–1994 and in 1994–1995 (Figs. 3a and S1 in the Supplement). Both the Irminger Sea and the Iceland Sea seasonal studies reveal the strongest CO2 undersaturation, with negative ΔpCO2 of about 100 µatm in May at the time of the phytoplankton spring bloom (Fig. 3b). The undersaturation diminishes through the summer and autumn followed by a gradual return to winter conditions (Takahashi et al., 1985; Peng et al., 1987; Takahashi et al., 1993).
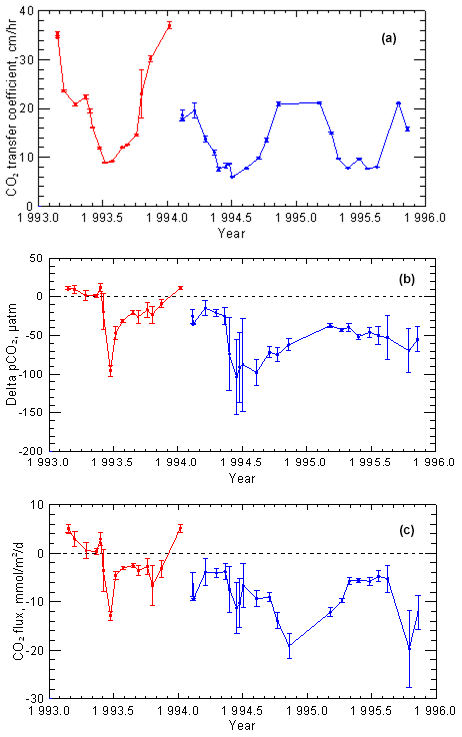
Figure 3Seasonal variations in the Atlantic Water of the Irminger Sea (red) and in the Arctic Water of the Iceland Sea (blue). The gas transfer velocity (a) reflects the seasonal wind strength and the error bars its variations during intervals between cruises. Delta pCO2 (b) records the tendency for CO2 to be transferred to the atmosphere (positive) or from the atmosphere to the ocean (negative). The CO2 flux rate (c) reveals that the Arctic Water is a CO2 sink in all seasons, whereas the Atlantic Water is a source in winter and a weak sink at other times of the year. The error bars indicate ±1 standard deviation from the mean and reflect the variations between the stations observed each cruise.
The CO2 influx in the spring is, however, relatively small as the wind gas transfer coefficient is then moderate (Fig. 3a). In the autumn the winds strengthen with heat loss and vertical mixing while CO2 undersaturation still persists. In mid-winter, February–March, vertical mixing brings richer CO2 water to the surface of the Irminger Sea, leading to supersaturation (Ólafsson, 2003); the flux reverses and the region becomes a weak source for atmospheric CO2 (Fig. 3c).
Table 1Annual sea–air CO2 fluxes (mol C m−2 yr−1) in the three water masses.
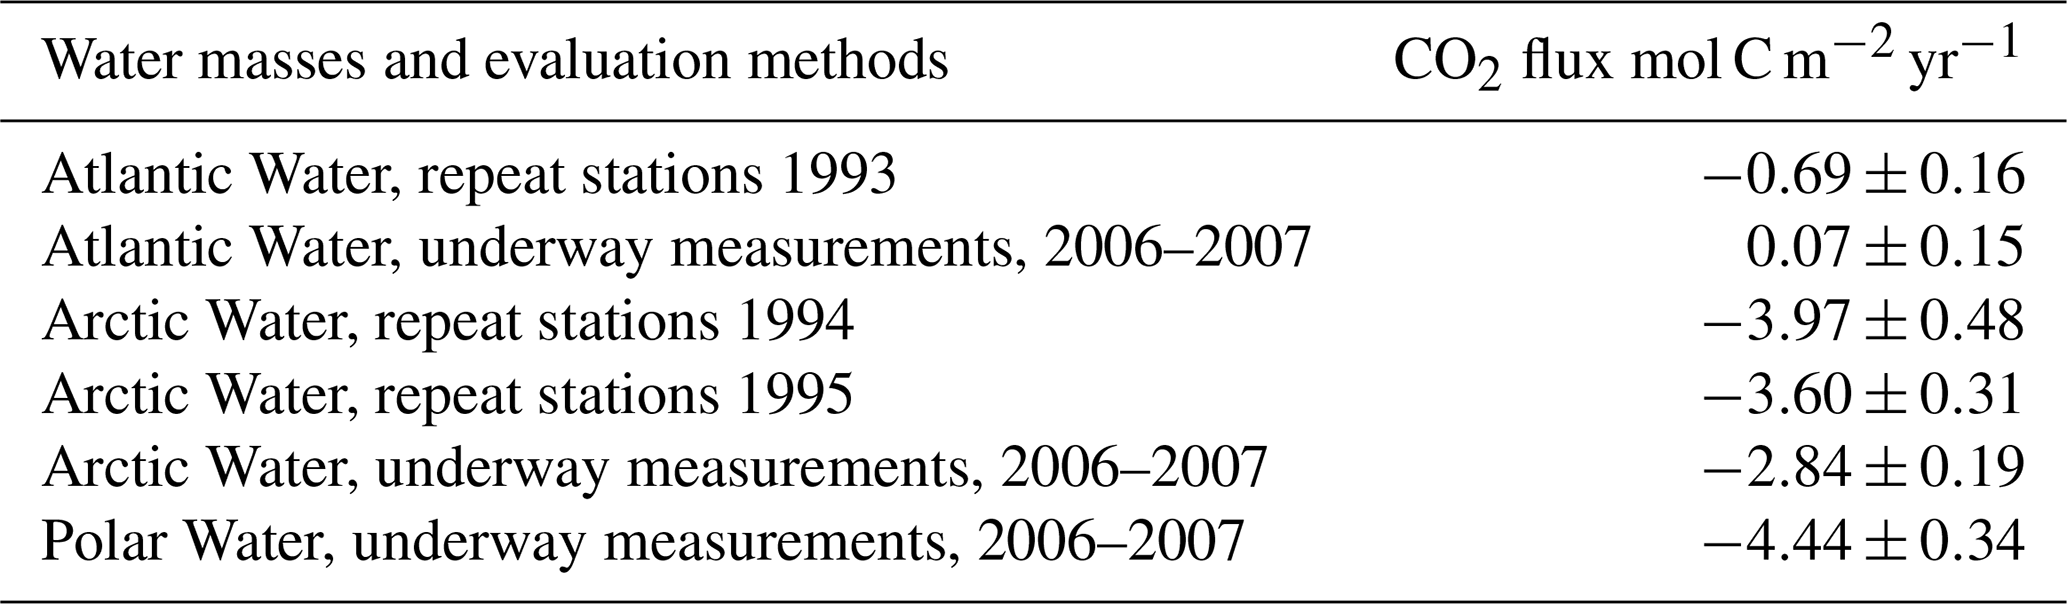
The integrated annual CO2 flux shows that the Atlantic Water in the Irminger Sea was a weak sink, mol C m−2 yr−1, in 1993 (Table 1). The more extensive underway area coverage of the Atlantic Water in 2006–2007 in essence confirmed the seasonal pattern and indicated that the Atlantic Water was a neutral sink, 0.07±0.15 mol C m−2 yr−1 for this year (Table 1). The winter gas transfer coefficient was again significantly larger over the Atlantic Water regions than the Arctic and Polar waters, facilitating air–sea equilibration (Fig. 4b).
The years of the Iceland Sea observations, 1994–1996, coincided with a large transition in the North Atlantic Oscillation (NAO) from a positive state 1994/1995 to a negative state in 1995/1996 and large-scale shifts in ocean fronts (Flatau et al., 2003). Vertical density distribution in the Iceland Sea indicated an enhanced convective activity in 1995 (Våge et al., 2015). Cold northeasterly winds were persistent in the spring of 1995, resulting in record low temperature anomalies for the north Iceland shelf (Ólafsson, 1999). In 1995 the spring bloom associated with undersaturation, ΔpCO2, was only half of that in 1994, possibly due to a weaker stratification in May, and continued over the summer season (Fig. S2) (Våge et al., 2015). As in the Irminger Sea the spring-bloom-associated CO2 influx is small. The largest CO2 influx was in the autumn and early winters of 1995 and 1996; as temperature dropped, winds gathered strength and vertical mixing was enhanced. This compensated for the small spring bloom in 1995, and the annual bulk fluxes in 1994 and 1995 are similar and high despite very different physical conditions (Table 1). The UWpCO2 surveys had less temporal resolution but confirmed year-round undersaturation of the Arctic Water. However, the integrated annual influx, −2.84 mol C m−2 yr−1, was significantly less than evaluated with repeat station data even though the strength of the gas transfer coefficient was similar in both studies (Table 1, Fig. 4a and b). This may reflect the large underway area coverage compared with the repeated fixed stations.
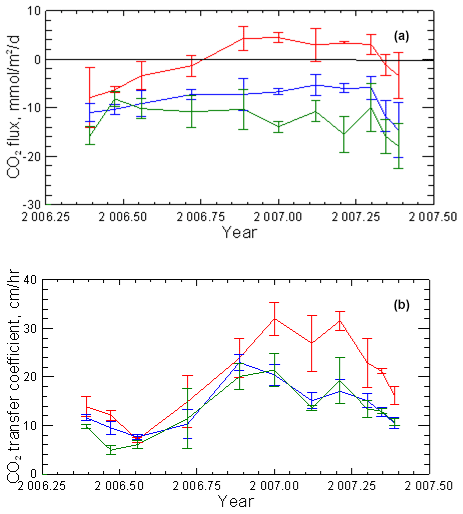
Figure 4Seasonal air–sea CO2 flux variations from UWpCO2 observations. (a) Atlantic Water (red) is a weak sink in summer and neutral over the year, n=7068. Both Arctic Water (blue) n = 16 874 and Polar Water (green) n=9410 are strong sinks throughout the year. The error bars indicate ±1 standard deviation from the mean. (b) The gas transfer coefficient for the Atlantic Water regime is significantly stronger in winter than for the Arctic and Polar Water.
Ice cover in the East Greenland Current is variable and the ice edge at the seasonal minimum has moved northward and from the Denmark Strait with decreasing Arctic sea ice (Serreze and Meier, 2019). The Polar Water salinity ranges from 34.4 to less than 30 in summer. The lowest-salinity water freezes, leading to salinity around 34 in winter. We covered the Polar Water in all six UWpCO2 surveys 2006–2007 (Fig. 2), and undersaturation characterized this water mass in all cruises. The integrated annual influx, −4.44 mol C m−2 yr−1 (Table 1, Fig. 4), shows the Polar Water to be the strongest CO2 sink, 80 % above the estimated mean for the Atlantic north of 50∘ N, −2.5 mol C m−2 yr−1 (Takahashi et al., 2009). Further comparison with the Takahashi climatology indicates a broad agreement with the Arctic Water region NE of Iceland with −3.5 to −4.5 mol C m−2 yr−1 and with the Atlantic Water region S and SW of Iceland with about −1 mol C m−2 yr−1 (Takahashi et al., 2009).
3.2 Long-term ΔpCO2 characteristics of the regional water masses
We evaluate the long-term pCO2 characteristics of the three water masses from three other data assembled over about 30 years. We use the Polar Water data collection and draft a composite picture of seasonal ΔpCO2 variations in Polar Water in and north of the Denmark Strait (Fig. 1), which confirms year-round undersaturation, deep in summer and in mid-winter when salinity increases to ∼34, with ΔpCO2 levels at about −50 µatm (Fig. 5a). Long-term winter ΔpCO2 in the Irminger Sea and Iceland Sea (Figs. 1 and 5b) when biological activity is minimal (Olafsson et al., 2009) shows the Atlantic Water to be slightly supersaturated and follows the atmospheric pCO2 increase of 1.80 µatm yr−1, whereas the Arctic Water is undersaturated to about −35 µatm. The Gulf Stream-derived Atlantic Water which reaches the northern Irminger Sea and the Nordic Seas has had a long contact time with the atmosphere to lose heat and almost reach CO2 saturation (Takahashi et al., 2002; Olsen et al., 2006).

Figure 5Water mass decadal surface water pCO2 characteristics. (a) A composite picture of delta pCO2 from 146 stations with Polar Water pCO2 observations (n=312) from the 25 m surface layer from 1983 to 2012 shows undersaturation at all times of the year. The error bars indicate ±1 standard deviation from the monthly means. (b) Atlantic Water at the Irminger Sea time series station (red) is generally a weak CO2 source in winter (24 winters, 52 samples), January–March, whereas winter (25 winters, 61 samples) CO2 undersaturation persists at the Iceland Sea time series site (blue). The error bars indicate ±1 standard deviation from the surface layer station means.
The Polar Water in the East Greenland Current which is advected southward from the Arctic is in general characterized by low temperature and large seasonal salinity and carbonate chemistry variations. Both physical and biogeochemical processes generate the large seasonal variability but the winter observations represent the state of lowest biological activity (Fig. 6) (Table 2). The TCO2 data in Table 2 are uncorrected for hydrographic variations or anthropogenic trends, but the Atlantic Water is based on a short period of 10 years, and the Polar Water atmospheric contact history is poorly known.
Table 2Mean IRM-TS Atlantic Water surface layer conditions in winter in 2001–2010 and in the Polar Water 25 m surface layer from November to April 1984–2012.
The winter conditions in the northward-flowing Atlantic Water at the Irminger Sea time series station in 2001–2010 (Table 2) are in stark contrast and have notably higher pCO2 and lower TCO2 S and Alk S ratios than the Polar Water in winter.
Figure 6Polar Water seasonal carbonate chemistry variations. Composite Polar Water data from the 25 m surface layer. The seasonal variations in the (a) total inorganic carbon salinity ratio, µmol kg−1 psu−1; (b) alkalinity salinity ratio, µmol kg−1 psu−1; and (c) total inorganic carbon alkalinity ratio reflect biological carbon assimilation and inorganic processes associated with freshwater inputs which lower the salinity (d) to the annual minimum in late summer. The error bars indicate ±1 standard deviation from the monthly means. The red horizontal lines mark the Atlantic Water benchmarks (Table 2).
We take the Atlantic Water in winter (Table 2) as a proxy (benchmark) for the relatively warm and saline water advected from the North Atlantic to the Nordic Seas and the Arctic and compare with it the carbonate chemistry seasonal variations in the southward-flowing Polar Water (Fig. 6). The Alk S ratio for the Polar Water is higher than that for the Atlantic Water in winter and throughout the year (Fig. 6b). The TCO2 S ratio of the Polar Water is larger than that of the Atlantic Water except in early summer when biological assimilation, photosynthesis, decreases the TCO2 concentration. The TCO2 Alk ratio falls as a consequence (Fig. 6c), which leads to strong pCO2 undersaturation and large delta pCO2 (Figs. 6c and 5a). The high TCO2 S and Alk S ratios indicate alkalinity and carbonate inputs as fresh water lower the Polar Water salinity to a minimum in late summer (Fig. 6d).
The Polar Water TCO2 S and Alk S ratios (Table 2 and Fig. 6) indicate both alkalinity and dissolved carbonate additions. The choice of winter ratios (Table 2) as benchmarks is solely for the evaluation of seasonal changes in the Polar Water. Representative annual long-term TCO2 S and Alk S means would be more realistic but are not available. Still, such a TCO2 S ratio would expectedly be lower than the winter one. An assessment of the effects of the relative TCO2 and Alk additions to Polar Water depends on the benchmarks chosen (Table 2).
The carbonate chemistry of Polar Water differs from that of open ocean waters, e.g. Atlantic Water, in having an increasingly higher alkalinity salinity ratio as the salinity decreases from about S=34.4. The excess alkalinity has been attributed to the high riverine input from continents to the Arctic (Anderson et al., 2004). The flow-weighted average alkalinity of six major Arctic rivers, discharging 2.245×10³ km3 yr−1, is 1048 µmol kg−1, however, without assessed uncertainty (Cooper et al., 2008). The river runoff into the Arctic is estimated to be about 4.2×10³ km3 yr−1, or 0.133×10⁶ m3 s−1 (0.133 Sv). This is about 11 % of the global freshwater input to the oceans (Carmack et al., 2016). Taking the average alkalinity 1048 µmol kg−1, the amount of alkalinity added by rivers to the Arctic and transported to the North Atlantic via the Canadian Arctic Archipelago and via the Fram Strait and further south with the Labrador and East Greenland Currents would be 4.4×10¹² mol yr−1 (Supplement). Cooper et al. (2008) reported on riverine alkalinity but not on associated inorganic carbonate. A recent assessment of Polar Water boron concentrations indicates insignificant borate contribution with Arctic rivers (Olafsson et al., 2020). The riverine alkalinity may primarily be attributed to carbonate alkalinity, CA = [HCO] + 2[CO]. The potential of the added alkalinity to reduce pCO2 of seawater would depend on its excess over TCO2.
Linear alkalinity–salinity relationships observed in the Arctic Ocean and the Nordic Seas and their extrapolated intercepts to S=0 have indicated freshwater sources with alkalinity 1412 µmol kg−1 (Anderson et al., 2004) and 1752 µmol kg−1 (Nondal et al., 2009). Climatological data from the West Greenland, Iceland, and Norwegian seas show a high S=0 intercept of 1796 µmol kg−1 but a lower one for the High Arctic north of 80∘ N, 1341 µmol kg−1 (Takahashi et al., 2014). The climatological relationships were for potential alkalinity, AP = AT + NO, which has little influence since the nitrate concentrations are low. The intercepts may be interpreted as the mean alkalinity of freshwaters added to the Arctic by rivers and melting ice and snow. However, the above intercepts indicate considerable variability, and they are also higher than the average alkalinity of Arctic rivers, 1048 µmol kg−1. The excess alkalinity would lower the pCO2 in seawater (and increase the pH) and thus give it an increased capacity to take up CO2 from the air. The thermodynamic driving force for seawater CO2 uptake, (pCO2sw − pCO2a), would be enhanced.
How large is the potential effect of excess Arctic alkalinity on the CO2 uptake by the Nordic Seas and the North Atlantic? We consider an estimate. Suppose that the pCO2 in seawater was restored to the original value by absorbing CO2 from the atmosphere. The carbonate equilibrium relations in seawater give that pCO2 is unchanged if ΔTCO2 ΔAlk = 0.85 (Fig. S3 and Supplement). This ratio of additions is nearly constant in the temperature and salinity range of the subarctic North Atlantic surface waters (t=5 ∘C, S=35). The volume transport of Polar Water, density < 1027.8 kg m−3, by the EGC has recently been estimated as 3.9 Sv (Våge et al., 2013). Taking S=33.0 for the mean Polar Water salinity and using Eqs. (6) and (7) in Nondal et al. (2009), the mean Polar Water alkalinity is 2256 µmol kg−1, which is 46 µmol kg−1 more alkalinity than for Atlantic Water calculated at the same salinity (Nondal et al., 2009). This much excess alkalinity would lower the pCO2 of Atlantic Water by 88 µatm and increase the pH by 0.10. Thus, the excess alkalinity advected to the North Atlantic by the EGC is 5.7×10¹² mol yr−1. Using 0.85 for the ΔTCO2 ΔAlk additions at a constant pCO2, we obtain that the contribution of the excess EGC alkalinity to the uptake of CO2 from the atmosphere would be 4.8×10¹² mol CO2 yr−1, or 0.058 Pg-C yr−1. The estimate corresponds to 21 % of the net CO2 uptake of 0.27 Pg-C yr−1 for the subarctic oceans north of 50∘ N (Takahashi et al., 2009). We did not include in the estimate any alkalinity contribution with the considerable Canadian Arctic Archipelago Polar Water transport (Haine et al., 2015). The effect of excess alkalinity on the North Atlantic CO2 uptake flux may therefore be substantially greater than our estimate. We note that the winter undersaturation levels, of −50 and −35 µatm observed in the Polar and Arctic Waters, respectively (Fig. 5), translate to excess alkalinity of 19 and 21 µmol kg−1 for further CO2 influx downstream.
The difference between the average measured Arctic river alkalinity and the regression-based estimates of alkalinity sources suggests that other origins and processes than the rivers contribute to the Polar Water alkalinity exported with currents from the Arctic to the Atlantic Ocean. Photic layer primary production in the absence of calcification may lower the TCO2 Alk ratio and seawater pCO2 in marginal seas (Bates, 2006), while acidification is increasing in other regions (Anderson et al., 2017; Qi et al., 2017) and projected to become extensive at the end of the century (Terhaar et al., 2020). Furthermore, the sea-ice seasonal formation and melting may affect the TCO2 Alk ratio (Grimm et al., 2016; Rysgaard et al., 2007). Efforts to reconstruct alkalinity fields and alkalinity climatology for the Arctic have however been difficult (Broullón et al., 2019).
The Arctic is complex, and complex climate-warming-related changes are observed in the western Arctic Ocean (Ouyang et al., 2020) and expected in marine freshwater systems of the warming Arctic (Carmack et al., 2016). Not least of all, the ice cover and areas of multi-year ice are decreasing (Serreze and Meier, 2019). River water alkalinity increases with an addition of cations derived from the chemical weathering of silicate and carbonate rocks (Berner and Berner, 1987). Accordingly, an increase in Arctic weathering rates, in response to warmer climate and increasing atmospheric CO2, could increase the river water alkalinity transported into the oceans. Such an increase would lower the pCO2 in seawater and enhance the oceanic uptake of atmospheric CO2, providing a negative feedback mechanism to the climatic warming resulting from increased atmospheric CO2.
The North Atlantic region we describe has Atlantic Waters advected from southern temperate latitudes and cold lower-salinity Arctic and Polar waters carried with the East Greenland Current from the Arctic. The Atlantic Water seasonal pCO2 variations are primarily driven by regional thermal and biological cycles but without much net annual influx of CO2. The southward-flowing Arctic and Polar waters are on the contrary strong and persistent year-round CO2 sinks. These waters are advected towards the sub-polar North Atlantic with high inventories of anthropogenic carbon. The TCO2 S and Alk S Polar Water ratios are higher than those for the Atlantic Water, indicating carbonate and alkalinity sources. We point here to the Polar Water and Arctic Water CO2 influx and excess alkalinity as an additional unrecognized source contributing to the North Atlantic CO2 sink. We also see that there are gaps and conflicts in the knowledge about the Arctic alkalinity and carbonate budgets and that future trends in the North Atlantic CO2 sink are connected to developments in the rapidly warming and changing Arctic.
The underway pCO2 data are available from the Ocean Carbon Data System (OCADS) (https://doi.org/10.3334/CDIAC/OTG.NDP088(V2015), Takahashi et al., 2019). The Irminger Sea and Iceland Sea seasonal study data and the Polar Water collection data are stored at the Marine and Freshwater Research Institute, Reykjavik, and available by request. Irminger Sea and Iceland Sea time series data for calculation of delta pCO2 in winter are at the NOAA National Centers for Environmental Information (https://doi.org/10.3334/cdiac/otg.carina_irmingersea_v2, Ólafsson, 2016; https://doi.org/10.3334/cdiac/otg.carina_icelandsea, Ólafsson, 2012).
The supplement related to this article is available online at: https://doi.org/10.5194/bg-18-1689-2021-supplement.
JO, TT, and SRO wrote the manuscript. JO, TSA, SRO, and MD conducted the fieldwork. JO, TT, SRO, and TSA conceived this study.
The authors declare that they have no conflict of interest.
The authors acknowledge the NMR Nordic Environmental Research Programme: Carbon Cycle and Convection in the Nordic Seas, supported the Marine Research Institute (MRI), Reykjavik, repeat station study in 1993–1995. The MRI work in 2006–2008 was supported by the European Union Sixth Framework Programme CARBOOCEAN, EU Contract: 511176. Taro Takahashi was supported to work on the manuscript with a grant from the US National Oceanographic and Atmospheric Administration. The CCMP-2 wind product was generously provided by Remote Sensing Systems (http://www.remss.com/measurements/CCMP, last access: 25 September 2017) by Joaquin Triñanes of CIMAS/AOML, Miami. We gratefully acknowledge the long-term technical support from John Goddard and Tim Newberger, Lamont-Doherty Earth Observatory. We are grateful for the invaluable cooperation we have had with the crews of all vessels operated in this study and to Norwegian colleagues for providing time for station work in August 1994.
This paper was edited by Peter Landschützer and reviewed by two anonymous referees.
Anderson, L. G., Jutterström, S., Kaltin, S., and Jones, E. P.: Variability in river runoff distribution in the Eurasian Basin of the Arctic Ocean, J. Geophys. Res., 109, C01016, https://doi.org/10.1029/2003JC001733, 2004.
Anderson, L. G., Ek, J., Ericson, Y., Humborg, C., Semiletov, I., Sundbom, M., and Ulfsbo, A.: Export of calcium carbonate corrosive waters from the East Siberian Sea, Biogeosciences, 14, 1811–1823, https://doi.org/10.5194/bg-14-1811-2017, 2017.
Atlas, R., Hoffman, R. N., Ardizzone, J., Leidner, S. M., Jusem, J. C., Smith, D. K., and Gombos, D.: A cross-calibrated multiplatform ocean surface wind velocity product for meteorological and oceanographic applications, B. Am. Meteorol. Soc., 92, 157–174, https://doi.org/10.1109/IGARSS.2008.4778804, 2011.
Bakker, D. C. E., Pfeil, B., Landa, C. S., Metzl, N., O'Brien, K. M., Olsen, A., Smith, K., Cosca, C., Harasawa, S., Jones, S. D., Nakaoka, S., Nojiri, Y., Schuster, U., Steinhoff, T., Sweeney, C., Takahashi, T., Tilbrook, B., Wada, C., Wanninkhof, R., Alin, S. R., Balestrini, C. F., Barbero, L., Bates, N. R., Bianchi, A. A., Bonou, F., Boutin, J., Bozec, Y., Burger, E. F., Cai, W.-J., Castle, R. D., Chen, L., Chierici, M., Currie, K., Evans, W., Featherstone, C., Feely, R. A., Fransson, A., Goyet, C., Greenwood, N., Gregor, L., Hankin, S., Hardman-Mountford, N. J., Harlay, J., Hauck, J., Hoppema, M., Humphreys, M. P., Hunt, C. W., Huss, B., Ibánhez, J. S. P., Johannessen, T., Keeling, R., Kitidis, V., Körtzinger, A., Kozyr, A., Krasakopoulou, E., Kuwata, A., Landschützer, P., Lauvset, S. K., Lefèvre, N., Lo Monaco, C., Manke, A., Mathis, J. T., Merlivat, L., Millero, F. J., Monteiro, P. M. S., Munro, D. R., Murata, A., Newberger, T., Omar, A. M., Ono, T., Paterson, K., Pearce, D., Pierrot, D., Robbins, L. L., Saito, S., Salisbury, J., Schlitzer, R., Schneider, B., Schweitzer, R., Sieger, R., Skjelvan, I., Sullivan, K. F., Sutherland, S. C., Sutton, A. J., Tadokoro, K., Telszewski, M., Tuma, M., van Heuven, S. M. A. C., Vandemark, D., Ward, B., Watson, A. J., and Xu, S.: A multi-decade record of high-quality fCO2 data in version 3 of the Surface Ocean CO2 Atlas (SOCAT), Earth Syst. Sci. Data, 8, 383–413, https://doi.org/10.5194/essd-8-383-2016, 2016.
Bates, N. R.: Air-sea CO2 fluxes and the continental shelf pump of carbon in the Chukchi Sea adjacent to the Arctic Ocean, J. Geophys. Res.-Oceans, 111, C10013, https://doi.org/10.1029/2005jc003083, 2006.
Bates, N. R., Takahashi, T., Chipman, D. W., and Knap, A. H.: Variability of pCO2 on diel to seasonal timescales in the Sargasso Sea near Bermuda, J. Geophys. Res.-Oceans, 103, 15567–15585, https://doi.org/10.1029/98jc00247, 1998.
Berner, E. K. and Berner, R. A.: The Global Water Cycle, Geochemistry and Environment, Prentice-Hall, Englewood Cliffs, USA, 1987.
Broecker, W. S.: The Great Ocean Conveyor, Oceanography, 4, 79–89, 1991.
Broullón, D., Pérez, F. F., Velo, A., Hoppema, M., Olsen, A., Takahashi, T., Key, R. M., Tanhua, T., González-Dávila, M., Jeansson, E., Kozyr, A., and van Heuven, S. M. A. C.: A global monthly climatology of total alkalinity: a neural network approach, Earth Syst. Sci. Data, 11, 1109–1127, https://doi.org/10.5194/essd-11-1109-2019, 2019.
Carmack, E. C., Yamamoto-Kawai, M., Haine, T. W. N., Bacon, S., Bluhm, B. A., Lique, C., Melling, H., Polyakov, I. V., Straneo, F., Timmermans, M.-L., and Williams, W. J.: Freshwater and its role in the Arctic Marine System: Sources, disposition, storage, export, and physical and biogeochemical consequences in the Arctic and global oceans, J. Geophys. Res.-Biogeosci., 121, 675–717, https://doi.org/10.1002/2015JG003140, 2016.
Chipman, D., Marra, J., and Takahashi, T.: Primary production at 47∘ N and 20∘ W in the North Atlantic Ocean: a comparision between the 14C incubation method and the mixed layer budget, Deep Sea Res., 40, 151–169, 1993.
Cooper, L. W., McClelland, J. W., Holmes, R. M., Raymond, P. A., Gibson, J. J., Guay, C. K., and Peterson, B. J.: Flow-weighted values of runoff tracers (δ18O, DOC, Ba, alkalinity) from the six largest Arctic rivers, Geophys. Res. Lett., 35, L18606, https://doi.org/10.1029/2008GL035007, 2008.
Dickson, A. G.: Standard Potential of the Reaction – AgCl(S) + 1/2H2(G) = Ag(S) + HCl(Aq) and the Standard Acidity Constant of the ion HSO in Synthetic Sea-Water from 273.15-K to 318.15-K, J. Chem. Thermodyn., 22, 113–127, https://doi.org/10.1016/0021-9614(90)90074-Z, 1990.
Dickson, R. P., Meincke, J., Malmberg, S. A., and Lee, A. J.: The Great salinity Anomaly in the northern North Atlantic, Prog. Oceanogr., 20, 103–151, 1988.
Fay, A. R. and McKinley, G. A.: Global open-ocean biomes: mean and temporal variability, Earth Syst. Sci. Data, 6, 273–284, https://doi.org/10.5194/essd-6-273-2014, 2014.
Flatau, M. K., Talley, L., and Niiler, P. P.: The North Atlantic Oscillation, surface current velocities, and SST changes in the subpolar North Atlantic, J. Climate, 16, 2355–2369, 2003.
Friedlingstein, P., Jones, M. W., O'Sullivan, M., Andrew, R. M., Hauck, J., Peters, G. P., Peters, W., Pongratz, J., Sitch, S., Le Quéré, C., Bakker, D. C. E., Canadell, J. G., Ciais, P., Jackson, R. B., Anthoni, P., Barbero, L., Bastos, A., Bastrikov, V., Becker, M., Bopp, L., Buitenhuis, E., Chandra, N., Chevallier, F., Chini, L. P., Currie, K. I., Feely, R. A., Gehlen, M., Gilfillan, D., Gkritzalis, T., Goll, D. S., Gruber, N., Gutekunst, S., Harris, I., Haverd, V., Houghton, R. A., Hurtt, G., Ilyina, T., Jain, A. K., Joetzjer, E., Kaplan, J. O., Kato, E., Klein Goldewijk, K., Korsbakken, J. I., Landschützer, P., Lauvset, S. K., Lefèvre, N., Lenton, A., Lienert, S., Lombardozzi, D., Marland, G., McGuire, P. C., Melton, J. R., Metzl, N., Munro, D. R., Nabel, J. E. M. S., Nakaoka, S.-I., Neill, C., Omar, A. M., Ono, T., Peregon, A., Pierrot, D., Poulter, B., Rehder, G., Resplandy, L., Robertson, E., Rödenbeck, C., Séférian, R., Schwinger, J., Smith, N., Tans, P. P., Tian, H., Tilbrook, B., Tubiello, F. N., van der Werf, G. R., Wiltshire, A. J., and Zaehle, S.: Global Carbon Budget 2019, Earth Syst. Sci. Data, 11, 1783–1838, https://doi.org/10.5194/essd-11-1783-2019, 2019.
GLOBALVIEW-CO2: Cooperative Global Atmospheric Data Integration Project, updated annually, Multi-laboratory compilation of synchronized and gap-filled atmospheric carbon dioxide records for the period 1979–2012 obspack CO2 1 GLOBALVIEW-CO2, 2013, v1.0.4, 2013-12-23, https://doi.org/10.3334/OBSPACK/1002, 2013.
Grimm, R., Notz, D., Glud, R. N., Rysgaard, S., and Six, K. D.: Assessment of the sea-ice carbon pump: Insights from a three-dimensional ocean-sea-ice-biogeochemical model (MPIOM/HAMOCC), Elementa, 4, 000136, https://doi.org/10.12952/journal.elementa.000136, 2016.
Gruber, N., Clement, D., Carter, B. R., Feely, R. A., van Heuven, S., Hoppema, M., Ishii, M., Key, R. M., Kozyr, A., Lauvset, S. K., Lo Monaco, C., Mathis, J. T., Murata, A., Olsen, A., Perez, F. F., Sabine, C. L., Tanhua, T., and Wanninkhof, R.: The oceanic sink for anthropogenic CO2 from 1994 to 2007, Science, 363, 1193–1199, https://doi.org/10.1126/science.aau5153, 2019.
Haine, T. W. N., Curry, B., Gerdes, R., Hansen, E., Karcher, M., Lee, C., Rudels, B., Spreen, G., Steur, L. D., Stewart, K. D., and Woodgate, R.: Arctic freshwater export: Status, mechanisms, and prospects, Global Planet. Change, 125, 13–35, 2015.
Håvik, L., Pickart, R. S., Våge, K., Torres, D., Thurnherr, A. M., Beszczynska-Möller, A., Walczowski, W., and Appen, W.-J. V.: Evolution of the East Greenland Current from Fram Strait to Denmark Strait: Synoptic measurements from summer 2012, J. Geophys. Res.-Oceans, 122, 1974–1994, https://doi.org/10.1002/2016JC01222, 2017.
Hátún, H., Sandø, A. B., Drange, H., Hansen, B., and Valdimarsson, H.: Influence of the Atlantic Subpolar Gyre on the Thermohaline Circulation, Science, 309, 1841–1844, 2005.
Holliday, N. P., Bersch, M., Berx, B., Chafik, L., Cunningham, S., Florindo-López, C., Hátún, H., Johns, W., Josey, S. A., Larsen, K. M. H., Mulet, S., Oltmanns, M., Reverdin, G., Rossby, T., Thierry, V., Valdimarsson, H., and Yashayaev, I.: Ocean circulation causes the largest freshening event for 120 years in eastern subpolar North Atlantic, Nat. Commun., 11, 585, https://doi.org/10.1038/s41467-020-14474-y, 2020.
Khatiwala, S., Tanhua, T., Mikaloff Fletcher, S., Gerber, M., Doney, S. C., Graven, H. D., Gruber, N., McKinley, G. A., Murata, A., Ríos, A. F., and Sabine, C. L.: Global ocean storage of anthropogenic carbon, Biogeosciences, 10, 2169–2191, https://doi.org/10.5194/bg-10-2169-2013, 2013.
Landschützer, P., Gruber, N., Bakker, D. C. E., Schuster, U., Nakaoka, S., Payne, M. R., Sasse, T. P., and Zeng, J.: A neural network-based estimate of the seasonal to inter-annual variability of the Atlantic Ocean carbon sink, Biogeosciences, 10, 7793–7815, https://doi.org/10.5194/bg-10-7793-2013, 2013.
Lebehot, A. D., Halloran, P. R., Watson, A. J., McNeall, D., Ford, D. A., Landschützer, P., Lauvset, S. K., and Schuster, U.: Reconciling Observation and Model Trends in North Atlantic Surface CO2, Global Biogeochem.l Cy., 33, 1204–1222, https://doi.org/10.1029/2019gb006186, 2019.
Lee, K., Kim, T.-W., Byrne, R. H., Millero, F. J., Feely, R. A., and Liu, Y.-M.: The universal ratio of boron to chlorinity for the North Pacific and North Atlantic oceans, Geochim. Cosmochim. Ac., 74, 1801–1811, 2010.
Lewis, E. and Wallace, D.: Programme developed for CO2 system calculations, Carbon Dioxide Information Analysis Center, Oak Ridge National Laboratory, U.S. Department of EnergyORNL/CDIAC-105, https://doi.org/10.2172/639712, 1998.
Lueker, T. J., Dickson, A. G., and Keeling, C. D.: Ocean pCO2 calculated from dissolved inorganic carbon, alkalinity, and equations for K-1 and K-2: validation based on laboratory measurements of CO2 in gas and seawater at equilibrium, Mar. Chem., 70, 105–119, https://doi.org/10.1016/S0304-4203(00)00022-0, 2000.
McClelland, J. W., Holmes, R. M., Dunton, K. H., and Macdonald, R. W.: The Arctic Ocean Estuary, Estuar. Coast., 35, 353–368, https://doi.org/10.1007/s12237-010-9357-3, 2012.
McKinley, G. A., Fay, A. R., Lovenduski, N. S., and Pilcher, D. J.: Natural Variability and Anthropogenic Trends in the Ocean Carbon Sink, Annu. Rev. Mar. Sci., 9, 125–150, https://doi.org/10.1146/annurev-marine-010816-060529, 2017.
Mikaloff Fletcher, S. E., Gruber, N., Jacobson, A. R., Doney, S. C., Dutkiewicz, S., Gerber, M., Follows, M., Joos, F., Lindsay, K., Menemenlis, D., Mouchet, A., ller, S. A. M., Sarmiento, J. L.: Inverse estimates of anthropogenic CO2 uptake, transport, and storage by the ocean, Global Biogeochem. Cy., 20, GB2002, https://doi.org/10.1029/2005GB002530, 2006.
Nilsen, J. E. Ø., Hátún, H., Mork, K. A., and Valdimarsson, H.: The NISE Dataset, Faroese Fisheries Laboratory, Tórshavn, Faroe Islands, Tech. Rep. 08-01, https://doi.org/10.13140/RG.2.1.3097.9441, 2008.
Nondal, G., Bellerby, R., Olsen, A., Johannessen, T., and Olafsson, J.: Predicting the surface ocean CO2 system in the northern North Atlantic: Implications for the use of Voluntary Observing Ships, Limnol. Oceanogr.-Meth., 7, 109–118, 2009.
Ólafsson, J.: Connections between oceanic conditions off N-Iceland, Lake Mývatn temperature, regional wind direction variability and the North Atlantic Oscillation, Rit Fiskideildar, 16, 41–57, 1999.
Ólafsson, J.: Winter mixed layer nutrients in the Irminger and Iceland Seas, 1990–2000, ICES Marine Science Symposia, 219, 329–332, 2003.
Ólafsson, J.: Partial pressure (or fugacity) of carbon dioxide, dissolved inorganic carbon, temperature, salinity and other variables collected from discrete samples, profile and time series profile observations during the R/Vs Arni Fridriksson and Bjarni Saemundsson time series IcelandSea (LN6) cruises in the North Atlantic Ocean from 1985-02-22 to 2013-11-26 (NCEI Accession 0100063), NOAA National Centers for Environmental Information, https://doi.org/10.3334/cdiac/otg.carina_icelandsea, 2012.
Ólafsson, J.: Partial pressure (or fugacity) of carbon dioxide, dissolved inorganic carbon, temperature, salinity and other variables collected from discrete sample and profile observations using CTD, bottle and other instruments from ARNI FRIDRIKSSON and BJARNI SAEMUNDSSON in the North Atlantic Ocean from 1983-03-05 to 2013-11-13 (NCEI Accession 0149098), NOAA National Centers for Environmental Information, https://doi.org/10.3334/cdiac/otg.carina_irmingersea_v2, 2016.
Olafsson, J., Olafsdottir, S. R., Benoit-Cattin, A., Danielsen, M., Arnarson, T. S., and Takahashi, T.: Rate of Iceland Sea acidification from time series measurements, Biogeosciences, 6, 2661–2668, https://doi.org/10.5194/bg-6-2661-2009, 2009.
Olafsson, J., Olafsdottir, S. R., Benoit-Cattin, A., and Takahashi, T.: The Irminger Sea and the Iceland Sea time series measurements of sea water carbon and nutrient chemistry 1983–2008, Earth Syst. Sci. Data, 2, 99–104, https://doi.org/10.5194/essd-2-99-2010, 2010.
Olafsson, J., Lee, K., Olafsdottir, S. R., Benoit-Cattin, A., Lee, C.-H., and Kim, M.: Boron to salinity ratios for Atlantic, Arctic and Polar Waters: A view from downstream, Mar. Chem., 224, 103809, https://doi.org/10.1016/j.marchem.2020.103809, 2020.
Olsen, A., Omar, A. M., Bellerby, R. G. J., Johannessen, T., Ninnemann, U., Brown, K. R., Olsson, K. A., Olafsson, J., Nondal, G., Kivimae, C., Kringstad, S., Neill, C., and Olafsdottir, S.: Magnitude and Origin of the Anthropogenic CO2 Increase and 13C Suess Effect in the Nordic Seas Since 1981, Global Biogeochem. Cy., 20, GB3027, https://doi.org/10.1029/2005GB002669, 2006.
Ouyang, Z., Qi, D., Chen, L., Takahashi, T., Zhong, W., DeGrandpre, M. D., Chen, B., Gao, Z., Nishino, S., Murata, A., Sun, H., Robbins, L. L., Jin, M., and Cai, W.-J.: Sea-ice loss amplifies summertime decadal CO2 increase in the western Arctic Ocean, Nat. Clim. Change, 10, 678–684, https://doi.org/10.1038/s41558-020-0784-2, 2020.
Peng, T.-H., Takahashi, T., Broecker, W. S., and Ólafsson, J.: Seasonal variability of carbon dioxide, nutrients and oxygen in the northern North Atlantic surface water, Tellus B, 39, 439–458, 1987.
Pierrot, D., Lewis, E., and Wallace, D. W. R.: MS Excel Program Developed for CO2 System Calculations, ORNL/CDIAC-105a, Carbon Dioxide Information Analysis Center, Oak Ridge National Laboratory, U.S. Department of Energy, Oak Ridge, USA, https://cdiac.ess-dive.lbl.gov/ftp/co2sys/CO2SYS_calc_XLS_v2.1/ (last access: 9 March 2021), 2006.
Qi, D., Chen, L., Chen, B., Gao, Z., Zhong, W., Feely, R. A., Anderson, L. G., Sun, H., Chen, J., Chen, M., Zhan, L., Zhang, Y., and Cai, W.-J.: Increase in acidifying water in the western Arctic Ocean, Nat. Clim. Change, 7, 195–199, https://doi.org/10.1038/nclimate3228, 2017.
Reverdin, G., Metzl, N., Olafsdottir, S., Racapé, V., Takahashi, T., Benetti, M., Valdimarsson, H., Benoit-Cattin, A., Danielsen, M., Fin, J., Naamar, A., Pierrot, D., Sullivan, K., Bringas, F., and Goni, G.: SURATLANT: a 1993–2017 surface sampling in the central part of the North Atlantic subpolar gyre, Earth Syst. Sci. Data, 10, 1901–1924, https://doi.org/10.5194/essd-10-1901-2018, 2018.
Rysgaard, S., Glud, R. N., Sejr, M. K., Bendtsen, J., and Christensen, P. B.: Inorganic carbon transport during sea ice growth and decay: A carbon pump in polar seas, J. Geophys. Res., 112, C03016, https://doi.org/10.1029/2006JC003572, 2007.
Schlitzer, R.: Ocean Data View, available at: http://odv.awi.de (last access: 22 September 2020), 2018.
Schuster, U., McKinley, G. A., Bates, N., Chevallier, F., Doney, S. C., Fay, A. R., González-Dávila, M., Gruber, N., Jones, S., Krijnen, J., Landschützer, P., Lefèvre, N., Manizza, M., Mathis, J., Metzl, N., Olsen, A., Rios, A. F., Rödenbeck, C., Santana-Casiano, J. M., Takahashi, T., Wanninkhof, R., and Watson, A. J.: An assessment of the Atlantic and Arctic sea–air CO2 fluxes, 1990–2009, Biogeosciences, 10, 607–627, https://doi.org/10.5194/bg-10-607-2013, 2013.
Serreze, M. C. and Meier, W. N.: The Arctic's sea ice cover: trends, variability, predictability, and comparisons to the Antarctic, Ann. NY Acad. Sci., 1436, 36–53, https://doi.org/10.1111/nyas.13856, 2019.
Stefánsson, U.: North Icelandic Waters, Rit Fiskideildar, 3, 1–269, 1962.
Sutherland, D. A., Pickart, R. S., Peter Jones, E., Azetsu-Scott, K., Jane Eert, A., and Ólafsson, J.: Freshwater composition of the waters off southeast Greenland and their link to the Arctic Ocean, J. Geophys. Res.-Oceans, 114, C05020, https://doi.org/10.1029/2008jc004808, 2009.
Takahashi, T., Ólafsson, J., Broecker, W. S., Goddard, J., Chipman, D. W., and White, J.: Seasonal variability of the carbon-nutrient chemistry in the ocean areas west and north of Iceland, Rit Fiskideildar, 9, 20–36, 1985.
Takahashi, T., Ólafsson, J., Goddard, J. G., Chipman, D. W., and Sutherland, S. C.: Seasonal variation of CO2 and nutrient salts over the high latitude oceans: A comparative study, Global Biogeochem. Cy., 7, 843–878, 1993.
Takahashi, T., Sutherland, S. C., Sweeney, C., Poisson, A., Metzl, N., Tilbrook, T., Bates, N., Wanninkhof, R., Feely, R. A., Sabine, C., Olafsson, J., and Nojiri, Y.: Global sea-air CO2 flux based on climatological suface ocean pCO2, and seasonal biological and temperature effects, Deep-Sea Res., 49, 1601–1622, 2002.
Takahashi, T., Sutherland, S. C., Wanninkhof, R., Sweeney, C., Feely, R. A., Chipman, D. W., Hales, B., Friederich, G., Chavez, F., Sabine, C., Watson, A., Bakker, D. C. E., Schuster, U., Metzl, N., Yoshikawa-Inoue, H., Ishii, M., Midorikawa, T., Nojiri, Y., Körtzinger, A., Steinhoff, T., Hoppema, M., Olafsson, J., Arnarson, T. S., Tilbrook, B., Johannessen, T., Olsen, A., Bellerby, R., Wong, C. S., Delille, B., Bates, N. R., and Baar, H. J. W. D.: Climatological mean and decadal change in surface ocean pCO2, and net sea-air CO2 flux over the global oceans, Deep-Sea Res., 56, 554–577, https://doi.org/10.1016/j.dsr2.2008.12.009, 2009.
Takahashi, T., Sutherland, S. C., Chipman, D. W., Goddard, J. G., Ho, C., Newberger, T., Sweeney, C., and Munro, D. R.: Climatological distributions of pH, pCO2, total CO2, alkalinity, and CaCO3 saturation in the global surface ocean, and temporal changes at selected locations, Mar. Chem., 164, 95–125, https://doi.org/10.1016/j.marchem.2014.06.004, 2014.
Takahashi, T., Sutherland, S. C., and Kozyr, A.: Global Ocean Surface Water Partial Pressure of CO2 Database: Measurements Performed During 1957–2018 (LDEO Database Version 2018) (NCEI Accession 0160492), Version 7.7, NOAA National Centers for Environmental Information, National Centers for Environmental Information, https://doi.org/10.3334/CDIAC/OTG.NDP088(V2015), 2019.
Tans, P., and Keeling, R.: Mauna Loa CO2 monthly mean data, NOAA/ESRL, available at: https://www.esrl.noaa.gov/gmd/ccgg/trends/ (last access: 5 March 2021), 2019.
Terhaar, J., Kwiatkowski, L., and Bopp, L.: Emergent constraint on Arctic Ocean acidification in the twenty-first century, Nature, 582, 379–383, https://doi.org/10.1038/s41586-020-2360-3, 2020.
Våge, K., Pickart, R. S., Sarafanov, A., Knutsen, Ø., Mercier, H., Lherminier, P., van Aken, H. M., Meincke, J., Quadfasel, D., and Bacon, S.: The Irminger Gyre: Circulation, convection, and interannual variability, Deep Sea Res., 58, 590–614, https://doi.org/10.1016/j.dsr.2011.03.001, 2011.
Våge, K., Pickart, R. S., Spall, M. A., Moore, G. W. K., Valdimarsson, H., Torres, D. J., Erofeeva, S., and Nilsen, J. E.: Revised circulation scheme north of the Denmark Strait, Deep-Sea Res., 79, 20–39, 2013.
Våge, K., Moore, G. W. K., Jónsson, S., and Valdimarsson, H.: Water mass transformation in the Iceland Sea, Deep Sea Res., 101, 98–109, https://doi.org/10.1016/j.dsr.2015.04.001, 2015.
Wanninkhof, R.: Relationship between wind speed and gas exchange over the ocean revisited, Limnol. Oceanogr.-Meth., 12, 351–362, https://doi.org/10.4319/lom.2014.12.351, 2014.
Wanninkhof, R. and Triñanes, J.: The impact of changing wind speeds on gas transfer and its effect on global air-sea CO2 fluxes, Global Biogeochem. Cy., 31, 961–974, https://doi.org/10.1002/2016GB005592, 2017.
Wanninkhof, R., Park, G.-H., Takahashi, T., Sweeney, C., Feely, R., Nojiri, Y., Gruber, N., Doney, S. C., McKinley, G. A., Lenton, A., Le Quéré, C., Heinze, C., Schwinger, J., Graven, H., and Khatiwala, S.: Global ocean carbon uptake: magnitude, variability and trends, Biogeosciences, 10, 1983–2000, https://doi.org/10.5194/bg-10-1983-2013, 2013.
Watson, A. J., Schuster, U., Shutler, J. D., Holding, T., Ashton, I. G. C., Landschützer, P., Woolf, D. K., and Goddijn-Murphy, L.: Revised estimates of ocean-atmosphere CO2 flux are consistent with ocean carbon inventory, Nat. Commun., 11, 4422, https://doi.org/10.1038/s41467-020-18203-3, 2020.
Weiss, R. F.: Carbon dioxide in water and seawater: The solubility of a non-ideal gas, Mar. Chem., 2, 203–215, 1974.
Weiss, R. F. and Price, B. A.: Nitrous oxide solubility in water and seawater, Mar. Chem., 8, 347–359, https://doi.org/10.1016/0304-4203(80)90024-9, 1980.