the Creative Commons Attribution 4.0 License.
the Creative Commons Attribution 4.0 License.
 | 17 Jun 2021
High-resolution 14C bomb peak dating and climate response analyses of subseasonal stable isotope signals in wood of the African baobab – a case study from Oman
Franziska Slotta
Frank Riedel
Karl-Uwe Heußner
Kai Hartmann
The African baobab, Adansonia digitata L., has great paleoclimatological potential because of its wide distributional range and millennial length life span. However, dendroclimatological approaches are hampered by dating uncertainties due to its unique, parenchyma-dominated stem anatomy. Here, securely dated time series of annual wood increment growth and intra-ring stable isotopes of carbon and oxygen of cellulose for a baobab tree from Oman covering 1941 to 2005 were established and tested for relationships to hydroclimate variability. Precise dating with the atomic bomb peak (ABP) using highly resolved 14C measurements confirmed the annual character of the baobab's growth rings. F14C values of tree-ring cellulose were found up to 8.8 % lower than in the corresponding atmospheric CO2 for the period around the ABP, which in conjunction with a considerable autocorrelation of the δ13C series points to the incorporation of previous year's carbon contributing to the average age of intra-ring wood samples. F14C of terminal parenchyma bands, marking the tree-ring boundaries, were found to be considerably younger than their corresponding tree ring, indicating that parenchyma tissue is alive for many years, probably undergoing cell division and structural reorganization and contributing to secondary growth. In contrast to the δ13C time series, no significant autocorrelation was found in the δ18O series of tree-ring cellulose despite the enormous water storage potential of this stem-succulent tree species. Year-to-year variability in tree-ring width and stable isotope ratios revealed radial stem growth and the geochemistry of wood cellulose are influenced by fluctuations in the hydroclimate. In particular, δ18O was found to be a good climate proxy, followed by tree-ring width and δ13C. Tree-ring width and intra-ring δ18Omin correlated well with each other and with precipitation amount for the period from pre-monsoon May to the end of the monsoon season in September/October. Intra-annual stable isotope courses were found to be rather similar for both δ13C and δ18O. Years with particularly low monsoon rain were reflected by increased stable isotope values in the mid-section of intra-annual courses. Distinct patterns with low subseasonal isotope values seem indicative for years with heavy rainfall events from pre-monsoonal cyclones. Rain events from post-monsoonal cyclones may also be recorded; however, only 2 years of observation prevented a more conclusive evaluation.
- Article
(11643 KB) - Full-text XML
- BibTeX
- EndNote


The African baobab, Adansonia digitata L., has received growing interest from the paleoclimatology community due to its widespread distribution and longevity. As revealed by radiocarbon dating, individuals can reach ages of 1000 up to 2500 years (Swart, 1963; Riedel et al., 2014; Patrut et al., 2017, 2018). Radiocarbon dating has not just helped to reveal baobabs to be the longest-living angiosperm tree species on earth but also resolved the age of specific multi-stem tree structures of the biggest, monumental individuals in Africa (Patrut et al., 2015a, b, 2017, 2018). Deciduous A. digitata inhabits (semi-)arid areas across the African continent and the southeastern Arabian Peninsula (Wickens, 1979; Wickens and Lowe, 2008) and is considered an important archive for past rainfall information stored in the layers of its wood (Robertson et al., 2006; Slotta et al., 2017; Woodborne et al., 2015, 2016, 2018). Facing the potential impacts of climate change, A. digitata can, on the one hand, help in understanding past climate patterns in order to better model future climate scenarios across the African continent, a great challenge considering the current lack of high-resolution trans-regional proxy data (IPCC, 2007, 2013). On the other hand, baobabs may be threatened by recent climate warming as the mortality of monumental baobabs in southern Africa appears to have increased over the last decade (Patrut et al., 2018), despite the high probability that the species has endured more severe climate conditions during the earth's history. In this respect conclusive evidence is lacking, and a better understanding of baobab ecophysiology and how they generally respond to temperature and rainfall variations, as well as to extremes like drought but also to heavy, cyclone-related rainfall events that can occur in parts of their distribution area (e.g., South Africa, Mozambique or Oman), is required.
At a few baobab locations, tree-ring parameters such as stable isotopes (δ13C, δ18O) of wood cellulose and also tree-ring width were shown to correlate significantly with climate parameters (Robertson et al., 2006; Woodborne et al., 2015, 2016; Slotta et al., 2017). However, initial dendrochronological and subsequent dendroclimatological analyses are hampered by the baobab's complex stem anatomy (Fig. 2a–d). A baobab tree ring generally consists of a diffuse porous wood section dominated by woody fibers and vessels followed by a terminal parenchyma band (TPB). Since the stems are specialized for water storage, parenchyma cells make up 69 %–88 % of their total wood content (Chapotin et al., 2006a). Apart from TPBs, parenchyma cells form a sheath around associated vessels (paratracheal vasicentric), as well as in fine bands, clusters or rays (apotracheal) that are irregularly dispersed among fibers and lack an association with vessels (Fisher, 1981; Neumann et al., 2001; Rajput, 2004; Wickens and Lowe, 2008). Except for abundant parenchyma cells dispersed among wood fibers and vessels, the different forms of baobab parenchyma are illustrated in the schematic drawing of Fig. 2d. The extraordinary high abundance of parenchymal tissue creates difficulties in distinguishing TPBs from other tangentially oriented non-annual parenchyma bands throughout the woody tissue, especially because the thickness of TPBs can vary greatly around the stem (Chapotin et al., 2006c; Slotta et al., 2017). Ring counting on baobabs of known age can result in about 98 % accuracy of the actual tree age (Guy, 1970), but even opposing radii of the same individual may differ in absolute numbers (Johansson, 1999). UV-light-induced fluorescence was found to be very helpful in identifying the wood anatomical details of baobab trees (Slotta et al., 2017). Nevertheless, false and missing rings together with differences in tree age and site of origin have caused conventional cross dating to fail (Slotta et al., 2017). In order to allow accurate comparison of baobab stable isotope data with meteorological data, highly resolved 14C measurements around the atomic bomb peak (ABP) could be utilized to ensure proper identification, counting and dating of growth rings.
Radiocarbon dating of organic material has long been applied to obtain reliable age estimates of tropical and subtropical trees with unique and complex stem anatomy (Swart, 1963; Worbes, 1989). Parallel to the development of modern accelerator mass spectrometry (AMS) techniques the number of radiocarbon-aided dendrochronological studies on trees with indistinct growth boundaries has increased in recent years (Fichtler et al., 2003; Hua et al., 2003; Robertson et al., 2006; Andreu-Hayles et al., 2015; Ohashi et al., 2016; Baker et al., 2017; Linares et al., 2017; Witt et al., 2017). The vast majority of atomic bomb tests have been carried out in the Northern Hemisphere, resulting in a delay in atmospheric mixing and five different zones separated by atmospheric cell boundaries (three in the Northern Hemisphere, two in the Southern Hemisphere) (Fig. 1a) (Hua et al., 2013). Despite an increasing number of studies that reconstruct the atmospheric radiocarbon content of the bomb peak period from tree rings (e.g., Hua et al., 2013; Turney et al., 2018), tree-ring radiocarbon studies in zones close to the Equator (NH3, SH3) remain scarce and need to be refined. In this regard, our study contributes to the growing body of tree-ring radiocarbon records from these zones; however, because of the peculiar stem anatomy and its high content of parenchyma, long-lived baobab trees may not be the best candidates for high-precision reconstruction of the atmospheric radiocarbon content.

Figure 1Context of the study site. (a) World map showing the northern hemispheric (NH) and southern hemispheric (SH) zones of atmospheric bomb 14C (after Hua et al., 2013). Zones close to the Equator (NH3, SH3) are still underrepresented in studies reconstructing the atmospheric radiocarbon indicate content. The star indicates the study site; sites labeled with letters (a)–(i) correspond to sample locations of F14C studies referred to in Fig. 5. (b) Map showing the location (yellow star) of the tree site Wadi Hinna (318 m a.s.l.) at the edge of the Dhofar Mountains in southern Oman (17∘ 03′ N, 54∘ 36′ E) (map topography based on SRTM and bathymetry data from Becker et al., 2009). Prevailing seasonal wind patterns are shown by blue (summer monsoon, rainfall season) and purple arrows (winter monsoon, dry season). Light blue arrows indicate upwelling of deep waters from the Arabian Sea. (c) Climate diagram for the area around Wadi Hinna (17.0–17.5∘ N, 54.0–54.5∘ S) with average mean precipitation (bars indicating minima and maxima; source: GPCC, gpcc_V7_05) and temperature for 1942–2013 (dotted lines representing Tmin and Tmax, respectively; source: CRU TS4.01, GPCC V7_05). The isotopic signature of the Arabian Sea water and the precipitation around the study site is indicated in dark grey and varies significantly between monsoonal and non-monsoonal precipitation (Wushiki, 1991; Strauch et al., 2014). Average daily sunshine hours are given in orange (1979–1990, NOAA: ftp://ftp.atdd.noaa.gov/pub/GCOS/WMO-Normals/RA-II/OM/41316.TXT (last access: 25 May 2021), and the timing of the summer monsoon and the approximate growing season of the baobab trees is indicated in green. (d) Sampled baobab tree at Wadi Hinna.

Figure 2Wood anatomy of the sampled baobab core. The right side of each photograph is unintentionally darker, causing vertical cutoffs in the stitched panorama. White asterisks mark positions of missing rings identified by radiocarbon dating. (a) Stitched core picture photographed under ultra-violet light with automatic white balance showing alternating diffuse porous wood sections and clearly defined terminal parenchyma bands. Tree-ring boundaries and years of growth are indicated for the analyzed core section, i.e., from cambium (white arrow, top left) until 1941 (white triangle). (b) Enlarged core section (grey frame on top) with indicated tree-ring boundaries (white lines), intra-annual subsamples (black lines), radiocarbon-dated samples (white triangles: holocellulose; grey triangles (1970, 1974): alpha cellulose) and years of growth. Boundaries indicated by dashed white lines were only identified after additional 14C analyses. (c) Schematic drawing of an increment core section indicating the high abundance of radial and tangential parenchyma bands. Tree rings end with a terminal parenchyma band (TPB); however, they also contain intra-annual tangential parenchyma bands of various thicknesses. Intra-annual tangential slices of ca. 1 mm thickness were dissected with a scalpel (dashed lines). Two-thirds of each slice was kept for F14C, and one-third was used for stable isotope analysis. (d) Schematic drawing of a cross-section view illustrating different peculiarities of parenchyma tissue in baobabs (parenchyma cells dispersed among wood fibers and vessels not shown). For details, see text.
The baobab site selected for this study is in the Dhofar region of Oman and is located along the northeastern edge of the species' natural distribution (Wickens and Lowe, 2008). This follows a common approach in dendroecology and dendroclimatology to select sites close to the ecological limit of a species to ensure a clearer signal of the limiting environmental and climatic factors (Fritts, 1976; Smith, 2008). The woodlands and forests along the Dhofar Mountains are a paleo-African relict of a moist vegetation belt that once stretched beyond the southern Arabian Peninsula into Asia (Kürschner et al., 2004; Hildebrandt and Eltahir, 2006). Upwelling along the southern coast of Oman lowers the Arabian Sea's surface temperature and consequently cools the moisture-rich air masses of the southwest monsoon winds. Once the dew point is reached, fog and low clouds form and then drift inshore towards the mountain range (Kürschner et al., 2004). Compared to other baobab populations, this site is therefore characterized by mostly horizontal precipitation (i.e., cloud water interception within the canopy; Hildebrandt and Eltahir, 2006). Nevertheless, precipitation seasonality within a calendar year is defined by a single wet period, and the deciduous habit of the species in general should favor the formation of annual tree rings.
Where tree rings are anatomically non-distinct, intra-annual analysis of stable isotopes (δ13C, δ18O) can help to identify annual growth increment provided that a general seasonally recurring pattern prevails in the intra-annual stable isotope records (e.g., Poussart et al., 2004; Anchukaitis et al., 2008; Pons and Helle, 2011; Xu et al., 2014; Ohashi et al., 2016). Hence, we wanted to test for recurring patterns in the intra-annual stable isotope data from a well-dated baobab tree-ring record consolidated by radiocarbon dating. After discerning intra-annual trends, referred to in this study as isotope courses, we aimed at establishing the relationship between the inter-annual variability of stable isotope parameters, minimum, maximum and mean values with monthly climate data. Usually, tree-ring stable isotopes show a high sensitivity to external drivers, such as weather conditions, making them a valuable tool to reconstruct the environmental and climatic influences during tree growth (e.g., Fichtler et al., 2010; Hartl-Meier et al., 2015; Szejner et al., 2016; van der Sleen et al., 2017). The climate signature of tree-ring width and δ13C basically originates from internal climate response mechanisms, driven by species-specific physiology, as well as carbon isotope fractionations during photosynthesis at leaf level. Elevated δ13C values in tree rings are mainly caused by a reduction in stomatal conductance (as a result of drought stress) and/or an increase in photosynthetic activity (Scheidegger et al., 2000). In both cases the leaf internal CO2 concentration declines and leads to a reduced enzymatic discrimination against 13C (Farquhar et al., 1982; Farquhar and Cernusak, 2012). However, since increased photosynthetic activity is unlikely under drought stress, high δ13C values are typically interpreted as a drought signal in areas where growth is limited by moisture availability (Brienen et al., 2011; Schollaen et al., 2013; Woodborne et al., 2015, 2016). Following this approach, the higher the δ13C values become, the more severe the drought episode is. δ18O of tree-ring cellulose is first related to the δ18O of the precipitation source via soil water and then later by internal processes. δ18O of soil water constitutes the δ18O input to the arboreal system and usually represents an average δ18O over several precipitation events modified by partial evaporation from the soil (depending on soil texture and porosity) and by a possible time lag, depending on rooting depth (Sprenger et al., 2017; Treydte et al., 2014). δ18O of tree-ring cellulose is dependent on two internal processes: evaporative 18O enrichment of leaf water via transpiration and leaf-to-air vapor pressure deficit (VPD), as well as biochemical fractionations and isotopic exchange of 18O with trunk water during cellulose biosynthesis (Roden et al., 2000; Kahmen et al., 2011; Treydte et al., 2014, and citations therein). In this regard, δ18O in tree rings from (sub-)tropical timber has been proven to strongly represent the isotopic composition of rain, i.e., source water (e.g., Evans and Schrag, 2004; Brienen et al., 2012, 2013; Boysen et al., 2014; Baker et al., 2015, 2016; van der Sleen et al., 2015, 2017). Variation of δ18O in rainfall is determined by several factors where the amount of rain (Araguas et al., 1996) plays a key role in producing a strong inverse correlation. Apart from isotopic composition of the source water, drought conditions with increasing VPD can lead to increasingly unfavorable growth conditions (with reduced tree-ring widths) paralleled by high δ18O values of corresponding tree-ring cellulose (e.g., Treydte et al., 2014).
We performed highly resolved inter- and intra-annual radiocarbon and stable isotope measurements on tree-ring cellulose of a baobab tree from Oman in order to (1) produce a time series of tree-ring width and intra-annual stable isotope ratios (δ13C, δ18O) and (2) compare 14C data of baobab tree-ring cellulose with published reconstructions of atmospheric 14C data (F14C) between the African continent and India, primarily aiming at testing the annual nature of ring formation in baobab trees and securing the accuracy of ring-width and stable isotope time series. The accurate time series of tree-ring width index (RWI), minimum (δ13Cmin, δ18Omin), maximum (δ13Cmax, δ18Omax) and mean (δ13Cmean, δ18Omean) stable isotope values were then (3) compared to instrumental climate data for assessing their sensitivity to monthly hydroclimate variables that included the comparison of intra-ring stable isotope courses during dry years, as well as to cyclone-related pre- and post-monsoonal heavy rainfall events.
2.1 Study site and climate
The baobab tree analyzed for this study is one of more than 60 individuals growing in Wadi Hinna (17∘03′ N, 54∘36′ E; 318 m above sea level (m a.s.l.)) at the edge of the Dhofar Mountains in southern Oman (Fig. 1b, d). The Dhofar Mountains reach elevations of about 1450 m a.s.l. and are separated from the Arabian Sea by a narrow coastal plain. The prevailing wind system is defined by four different seasons (Walters and Sjoberg, 1990; Charabi et al., 2011): (1) winter (December–March), in which the region is dominated by the northeast monsoon; (2) the spring transition (around April–May), during which the northeasterly circulation breaks down while southwesterly trade winds enter the region; (3) summer (around mid-June–September), in which damp air masses of the southwest monsoon (also khareef) encounter the mountain range and bring dense fog and light rain (Kwarteng et al., 2009); and (4) the autumn transition (around October–November), during which the northeasterly flow is re-established.
The closest meteorological station to the study site is located at Salalah airport (17∘01′ N, 54∘04′ E; 20 m a.s.l.), 57 km west from Wadi Hinna. Due to the distance and altitudinal difference between station and study site, the use of Climate Research Unit (CRU TS4.01; modified after Harris et al., 2020) interpolated grid data was considered more appropriate for defining the monthly climatology and for climate response analysis. The mean annual temperature for the reference period 1945–2013 was 23.1 ∘C. Precipitation data (also CRU TS4.01) and the Global Precipitation Climatology Centre data (GPCC V7_05, Schneider et al., 2015) covering the study site (17.0–17.5∘ N, 54.0–54.5∘ S) were tested for statistical similarity against data from the Salalah station (1945–2013) in order to confirm which data set best represents the temporal variability of the study region. GPCC data showed the highest correlation (rGPCC = 0.91, p<0.0001; rCRU = 0.70, p<0.0001) and were therefore used in further analysis. The grid cell indicated an average annual precipitation of 130 mm with large interannual variation (range: 28–534 mm; 1945–2013). The light drizzle during southwest monsoon in summer (mid-June–mid-September) accounts for about 70 % of the average annual rainfall (ppt = 90 mm, range: 21–231 mm). Apart from the monsoon rain, precipitation is rare and erratic, originating either from low-pressure systems moving across Oman or from cyclonic systems moving westward from the Arabian Sea during the spring (May–June) and autumn (October–November) transitions (Clark et al., 1987). These tropical storms with heavy rainfall occur about once every 3 years (Pedgley, 1969; Hildebrandt and Eltahir, 2006; Strauch et al., 2014). Aside from intensity and duration, rainfall from the monsoon and cyclones usually differs distinctively in its respective isotopic signature (Clark et al., 1987; Strauch et al., 2014; Wushiki, 1991) (Fig. 1c, Table 1). Monsoon precipitation from the Dhofar Mountains generally correlates with the oxygen isotopic composition of the Indian monsoon rainfall along the southeast coast of Oman (Strauch et al., 2014) and shows marginal variation between −0.5 ‰ and +0.7 ‰, with values close to the mean δ18O of 0.61 ± 0.02 ‰ reported for the Arabian Sea water (Lambs et al., 2011). Minimal difference exists in the oxygen isotopic signature of monsoon rain, fog and interception waters (Table 1). In contrast, water samples collected in the Dhofar Mountains from cyclones that sometimes bring enormous quantities of rainfall (e.g., 1 or more years of rainfall amount in a single day) show highly variable but significantly low δ18O signatures down to −11 ‰ (Dansgaard, 1964).
Table 1Compilation of published oxygen stable isotope data of monsoon rainfall, fog, stemflow, throughfall and cyclone water from the Dhofar Mountains for different years. Site coordinates are as follows: Salalah (17∘ 01′ N, 54∘ 04′ E), Qairoon Hairitti (17∘ 15′ N, 54∘ 05′ E), Gogob (17∘ 12′ N, 54∘ 06′ E), Tawi Atir (17∘ 06′ N, 54∘ 31′ E), and Qarhanout (17∘ 07′ N, 54∘ 37′ E).

2.2 Field work
The sampling took place in early April 2015 when the trees were still without leaves. Ten baobabs were sampled in total. Increment cores of 12 mm in diameter and up to 80 cm in length were taken at breast height from four different orientations (NE, SE, SW and NW). While in the field, core samples were stored in an airtight and cool container, and they were later stored in a freezer to prevent mold growth and distortion of wood anatomical features that could be caused by the dehydration of parenchyma tissue.
2.3 Sample preparation and wood increment dissection
The baobab tree showed rather wide growth rings favorable for intra-annual analysis, possibly due its immediate proximity to and interaction with an ephemeral stream. The SW-oriented core was chosen because its parenchyma bands were very distinct and because the perpendicular orientation of vessels and fibers with respect to the long axis of the core allowed for precise subsampling. The core surface was prepared with a razor blade to expose the anatomical features of each tree ring, and photographs were taken with a fluorescence microscope (Nikon MULTIZOOM AZ100M, V-2A: 380–420 nm; camera head: Nikon digital sight DS-Fi1c; light source: C-HGFI HG precentered fiber illuminator (130 W mercury lamp); program: NIS Elements 4.30.01 ©Laboratory Imaging 1991–2014). Individual micro-pictures were assembled to give one complete stitched panorama picture of the wood core, which was printed for further sampling documentation (scale 1:7.6) and provided the basis for the tree-ring width measurements (Fig. 2a).
For radiocarbon and stable isotope analyses, tangential wood slices of approximately 1 mm were cut parallel to the fiber orientation and in radial direction from the cambial zone towards the pith (Fig. 2b, c, d). Since the tree-ring structure for the outermost wood section was often hard to interpret (Johansson, 1999; Slotta et al., 2017), we did a five-point screening across a region of the core that based on our ring counting was estimated to be the location of the bomb peak. The entire bomb peak and the decade before were dissected, amounting to a total of 360 samples with resolutions between 1 and 11 samples per year. Because parenchyma cells can undergo cell division within the stem independent from the vascular cambium (Chapotin et al., 2006a; Spicer, 2014), rays and other parenchymatous structures (see Fig. 2d for illustration) that may be carrying a different, non-contemporaneous radiocarbon and stable carbon isotope signal than the surrounding wood vessels and fibers were removed from the wood slices to avoid possible contamination. A potential fraction of parenchyma cells in between vessels and fibers was considered to be small. Two-thirds of each wood slice were separated for radiocarbon dating while the remaining third was kept for stable isotope analyses (Fig. 2c). Each terminal parenchyma band (TPBs) was also retained and used for radiocarbon analysis.
2.4 Radiocarbon dating
The samples were prepared for radiocarbon analysis at ETH Zurich according to a protocol for high-precision measurements (Sookdeo et al., 2019). Oxalic acid II (OXII, NIST SRM 4990C) was used for standard normalization. Internal wood reference materials from 1515 CE (pine from Switzerland) and two different radiocarbon-free wood blanks (New Zealand kauri and lignite from Reichwalde, Germany) were repetitively analyzed together with the annual wood samples. The wood blanks were used for blank subtraction in the data evaluation process, and the 1515 CE references were used for quality control only (Brehm et al., 2021). In total wood 110 samples were extracted for holocellulose with a base–acid–base–acid-bleaching procedure (Němec et al., 2010). Ten samples were further purified to alpha cellulose with an additional base treatment (17.5 % NaOH for 2 h at room temperature) followed by washing and freeze-drying. The cellulose samples were then graphitized using an Automated Graphitization Equipment (AGE III) coupled to an elemental analyzer (EA: Vario MICRO cube; Wacker et al., 2010b). Once graphitized, the samples were immediately pressed into targets to minimize their interaction with air, and their 14C content was measured with a MICADAS mass spectrometer (Wacker et al., 2010a). Since the tree-ring structure for the outermost wood section was often hard to interpret (Johansson, 1999; Slotta et al., 2017), we did a five-point screening for the bomb peak before samples were selected from each of the clearly identifiable growth rings onwards from what we thought to be 1942. We avoided developing a longer record by including older tree rings because of a lack of reliable precipitation data beyond this date that could be used in calibration. With intention to minimize possible carryover effects from the implementation of previous years' non-structural carbohydrates (NSCs) into the current year's wood cellulose, the samples for dating were selected from the last third of each growth structure while steering clear of the TPB by at least one sample, where possible (Fig. 2b). For comparison, cellulose samples of five individual TPBs were analyzed for 1960–1963 (n = 4) and 2005. For the period between 2005 and 2015, for which by visual inspection annual rings could not be identified, 19 samples were dissected, of which 17 samples were dated. In addition, intra-ring radiocarbon analysis was performed on the tree rings of 1962 (6 samples) and 1963 (8 samples).
Comparison of 14C of the assumed tree rings with atmospheric 14C data comprising the bomb peak values (see different zones in Fig. 1a) allowed for annual dating between 1956 and 1980; before and after these dates the differentiation between the atmospheric 14C values of consecutive years is not sufficient enough to securely designate the age of wood increments (see Hua et al., 2003). The normalized 14C activity ratio (F14C; Reimer et al., 2004) of the assumed tree rings was plotted against the calibration curve for the corresponding hemispheric zone NH3 (Hua et al., 2013) and fitted by peak-to-peak correlation (± 5 years). Because of an observed offset in the data sets, the calibration curves for SH3 and SH1−2 (Hua et al., 2013) were also included in the comparison (Fig. 3). Each intra-ring baobab F14C sample position on the time axis is relative to their position within the respective tree ring of a growing season reflecting approximately June until September. In the case of suspected missing rings, the wood anatomy was reviewed and additional samples were radiocarbon dated. No properly dated tree-ring width chronology (e.g., from J. excelsa, Sass-Klaassen et al., 2008) exists from the study region that could be used as a reference and was available for comparison. Calendar ages were calculated from the F14C values of the TPBs using the program OxCal v4.3.2 (Bronk Ramsey, 2017) and the post-bomb atmospheric NH3 and SH1−2 curves (Hua et al., 2013). Furthermore, we visually and statistically cross-dated (COFECHA, Holmes, 1983) time series of ring-width and stable isotopes with the seasonally and annually resolved precipitation amount (May–September, June–September and January–December) for the grid cell 17–17.5∘ N, 54–54.5∘ E (GPCC V7.05, Schneider et al., 2015).
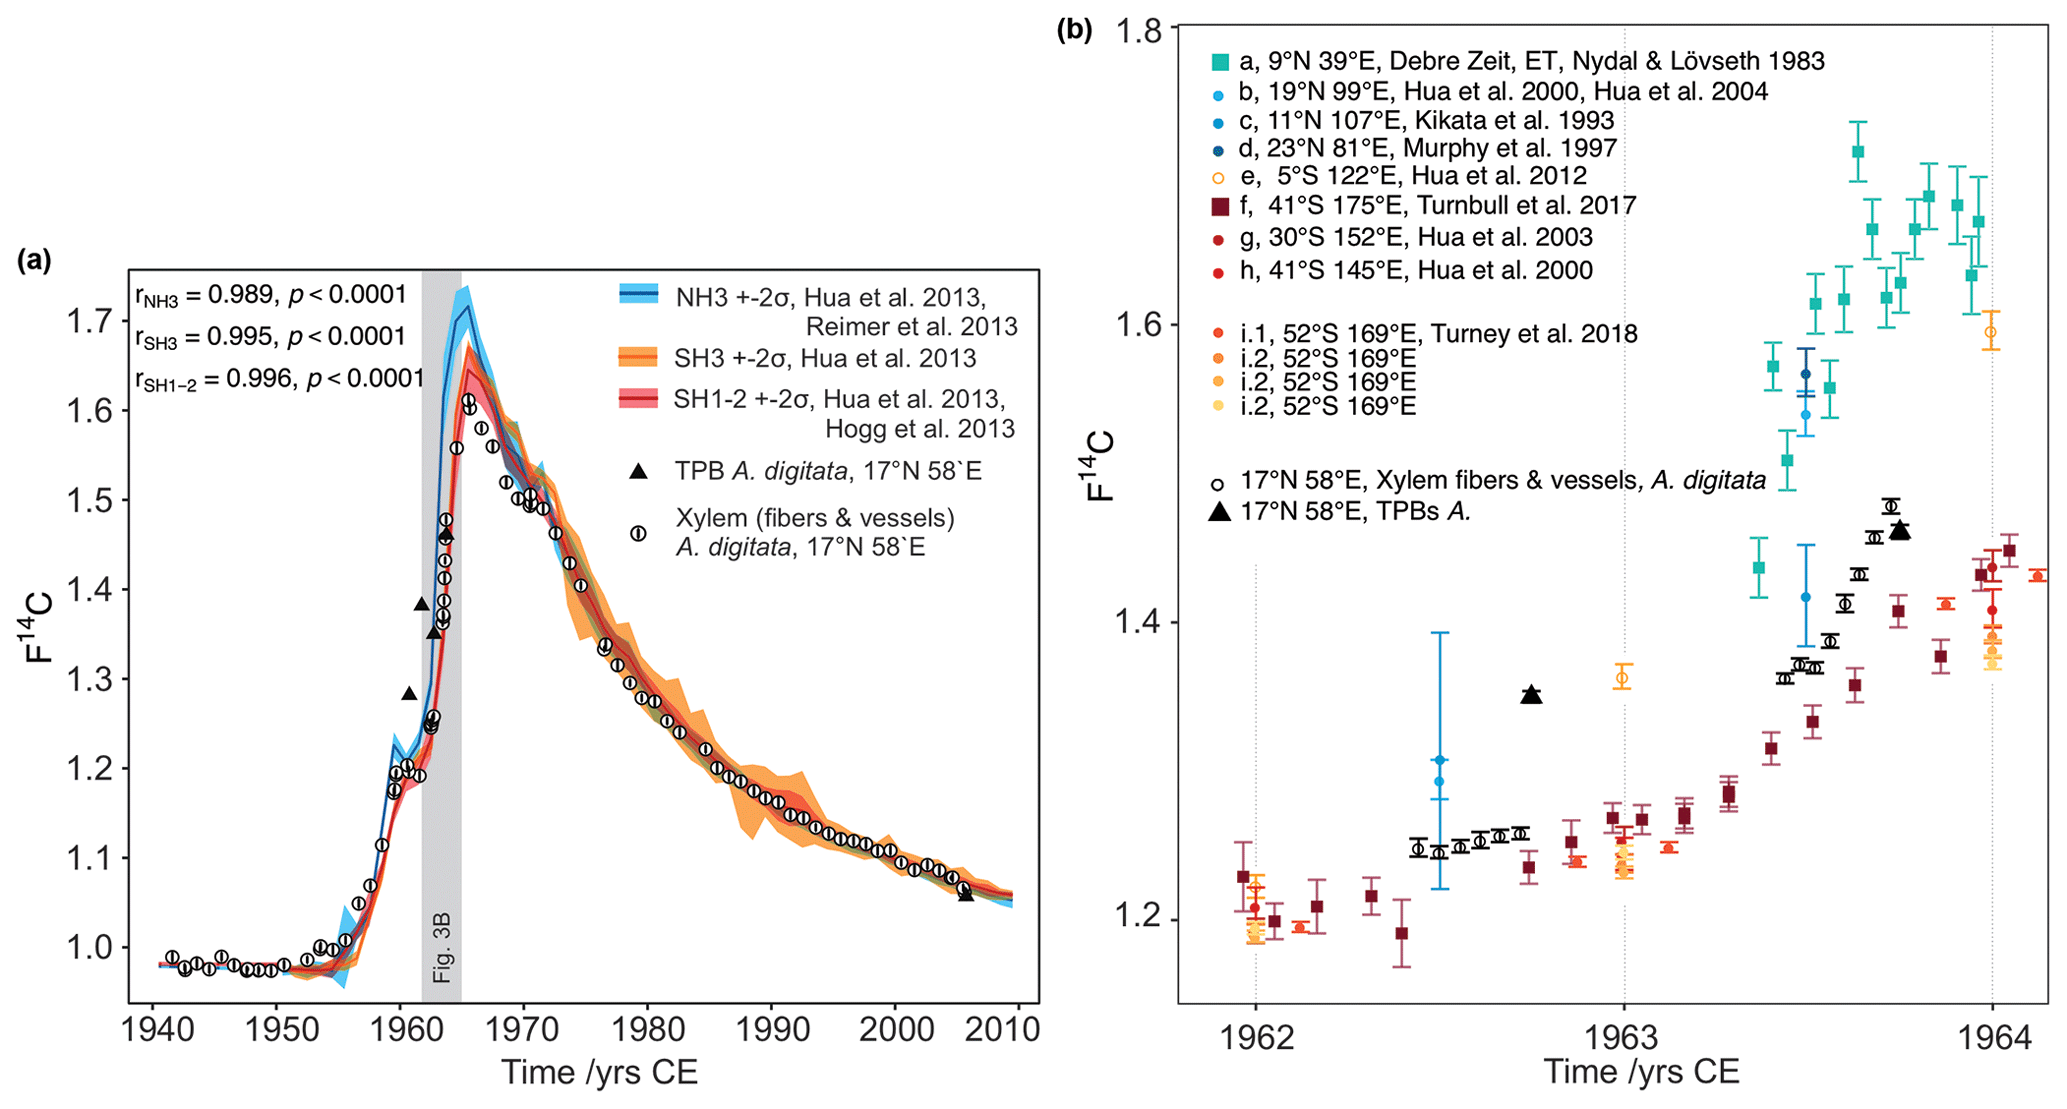
Figure 3(a) Comparison of baobab F14C values with F14C curves for both hemispheres. Data prior to 1950 were taken from IntCal13 and SHCal13 (Reimer et al., 2013, Hogg et al., 2013). Data for 1950–2010 originate from Hua et al. (2013) (line: mean value, shade: ± 2 standard deviations (σ)). The southern hemispheric increase in atmospheric F14C lags behind the Northern Hemisphere by about 1 year, and its peak is considerably shallower. The overall conformity of the baobab measurements (white dots with 2σ error bar) with the course of the calibration curves proves the annual character of the growth zones. The values for baobab tree-ring cellulose (xylem fibers and vessels) lie between the values for both hemispheres for the steep increase in F14C and then apparently follow the course of SH1−2, although temporary shifted due to different vegetation periods. Four out of five terminal parenchyma bands (TPB, black triangles; error bars are smaller than the symbol size) show either much higher F14C values (1960–1962) or a lower value (2005) than the corresponding tree ring. (b) Baobab measurements in comparison to atmospheric (squares) and tree-ring data (circles) for NH3 (a–d), SH3 (e), and SH1−2 (f–i) between 1962 and 1964. These years show strongly increasing atmospheric F14C values and were chosen to investigate the intra-annual baobab F14C values. For this period, the baobab F14C values lie between the higher NH3 SH3 and the lower SH1−2 values. A dip within the first half of the tree ring is followed by a slight (1962) or steep (1963) increase of the values. Note the inter- and intra-species' variability from the same site (i.1 and i.2, Turney et al., 2018).
2.5 Stable isotope analysis
For the stable isotope analyses (δ13C, δ18O), all 360 samples (excluding TPBs) were holocellulose extracted using the devices and procedures described by Wieloch et al. (2011), homogenized by ultrasonic treatment (Laumer et al., 2009), and freeze-dried for at least 48 h. A thorough description of the background and details on the methodology is given by Helle et al. (2021). Prior to mass spectrometric analysis, 130–180 µg of cellulose and reference material (IAEA CH-3, CH-6 and Merck cellulose), respectively, were packed in silver capsules and stored overnight at 100 ∘C in a vacuum drying oven. Simultaneous dual measurements of δ13C and δ18O were performed on carbon monoxide derived from high-temperature TC/EA pyrolysis (1400 ∘C) coupled online via a ConFlo IV to an IRMS Delta V Plus (Thermo Fisher Scientific, Bremen, Germany). Values are referred to VPDB and VSMOW, respectively, with a reproducibility of ≤ 0.15 ‰ for δ13C and ≤ 0.25 ‰ for δ18O.
In order to use δ13C of baobab tree-ring cellulose (δ13Craw) as a measure for plant response to weather conditions, the δ13Craw values have been corrected (δ13C*) for the anthropogenic changes in the long-term trend of the atmospheric CO2 source. Rising atmospheric CO2 concentrations (pCO2) and correspondingly declining δ13C of atmospheric CO2 (δ13CO2) prevailing since the onset of industrialization (1850 CE) were addressed by subtracting for each tree-ring stable isotope value the annual changes in δ13CO2, obtained from direct measurements (White et al., 2015). Since trees respond to increased atmospheric pCO2 with higher discrimination against 13C, an additional moderate correction of 0.073 ‰ per 10 ppm change (Kürschner, 1996) was applied, producing a corrected δ13C* record.
The intra-annual isotopic signatures were plotted against their relative position within the tree ring normalized to 100 % of the respective tree-ring width. Annual tree-ring stable isotope values were obtained from averaging intra-ring δ13C* and δ18O values.
2.6 Statistical analysis
Ring widths were measured for the entire core and detrended using an exponential fit (R program, package dplR; Bunn et al., 2018), resulting in a ring-width index chronology (RWI). Due to different intra-annual resolution of the stable isotope time series (ranging from 2 to 11 samples per year), the mean annual signature might be blurred and thus may weaken the climate response of intra-ring isotopic records. Hence, besides mean isotopic signatures (δ13C, δ18Omean), we also tested minimum (δ13C, δ18Omin) and maximum (δ13C, δ18Omax) stable isotope values for their climate sensitivity.
The obtained time series (RWI, δ13C, δ18O) were tested for autocorrelation. Moving mean, variance and correlation tests (window size = 15 years) were performed to discretize the time series in terms of central tendency, variation and trend behavior. The response of these parameters to weather conditions was then evaluated by calculating the Pearson correlation with monthly and seasonally averaged data of precipitation (GPCC V7.05, Schneider et al., 2015), cloud cover, temperature () and vapor pressure (CRU TS4.01) for the grid cell 17–17.5∘ N, 54–54.5∘ E, as well as relative humidity (CRU_blendnewjul08_RH_7303cf) for the area covering 15–20∘ N, 20–25∘ E. The impact of drought on the wood parameters was estimated using the Standardized Precipitation Evapotranspiration Index (SPEI) for the grid cell 17–17.5∘ N, 54–54.5∘ E. SPEI assesses droughts by using both precipitation and temperature variability at different timescales (Vicente-Serrano et al., 2010a, b, 2015). Where applicable, the coefficient of determination (COD = r2×100 %) has been added for explanatory meaning.
3.1 Wood anatomy
The TPBs were generally well defined in this ca. 100-year-old tree, with a mean width of 1.5 mm (range: 0.5–2.4 mm). The only exceptions were the outermost 15.3 mm of wood and three rings with TPB widths ≤0.1 mm (i.e., 1973, 1981, 1982) which were finally confirmed by the radiocarbon dating. In general, the width of the TPBs was significantly correlated to the width of the corresponding tree ring (r0 = 0.45, COD0 = 20.3 %, p<0.001), as well as the rings that were built 1 to 4 years earlier (highest correlation: r−4 = 0.36, COD−4 = 13.0 %, p = 0.005) and those built 1–2 and 6 years later (highest correlation: r+1 = 0.47, COD+1 = 22.0 %, p<0.001).
The mean tree-ring width for the analyzed period (TRW measured without TPBs and excluding missing rings) was 4.8 ± 2.2 mm, with a slightly significant negative trend over time (r = −0.32, COD = 10.2 %, p = 0.011). After detrending, significant autocorrelations were observed for lags 1–3 and lag 6. The moving mean test revealed major changes in the central tendency of the RWI time series for the periods 1962–1965, 1976–1977 and 1985–1992. No major changes were revealed in the variance homogeneity and linear dependency.
3.2 Radiocarbon measurements and dating
3.2.1 Holocellulose vs. alpha cellulose
The values of 6 out of 10 holocellulose and alpha-cellulose pairs were equal within 2 standard deviations and 9 out of 10 within 3 standard deviations. Based on these indications it was not necessary to perform an alpha-cellulose extraction procedure for this species.
3.2.2 Inter-annual F14C variability
The F14C values of the assumed tree rings (excluding the younger, outer stem without clearly identifiable TPBs) fit the overall shape of the bomb peak curve relative well, thus demonstrating their annual character (Fig. 3). Anomalies in the F14C record led to a review of the wood anatomy and consequently the identification of three more tree rings (boundaries marked by dashed lines in Fig. 2), while the year 1975 was regarded as absent from our time series. Our interpretation of the intra-annual F14C data was confirmed by visual and statistical comparison of the TRW chronology with precipitation data. Comparison with precipitation data also indicated missing rings in 1951 and 1983 that could not be confirmed, because year-to-year variability of atmospheric F14C data was too low for unambiguous detection. The last identifiable TPB corresponds to the tree ring of 2005; thus, the outermost 15.3 mm of wood represented 9 years of growth (2006–2014) that could not be distinguished. Due to the gentle slope of the calibration curve during this period, we refrained from assigning the measured F14C values to a specific year. Hence, the final annually dated baobab time series investigated further covers the period from 1941 until 2005.
The highest correlation between the revised baobab time series and calibration curves from different hemispheric zones (Fig. 3a, b) was reached for a peak-to-peak fit with SH1−2, although the study site is located in zone NH3 (Fig. 1a) (r = 0.996, p<0.0001; SH3: r = 0.995, p<0.0001; NH3: r = 0.989, p<0.0001, all CODs > 97.8 %). For the peak period (1964–1966) baobab F14C values were found notably lower than the mean values of the zone NH3 (≈ −8.8 %) and even slightly lower than the mean values of SH1−2 (≈ −2.6 %) (Fig. 3a, b).
3.2.3 Intra-annual F14C variability
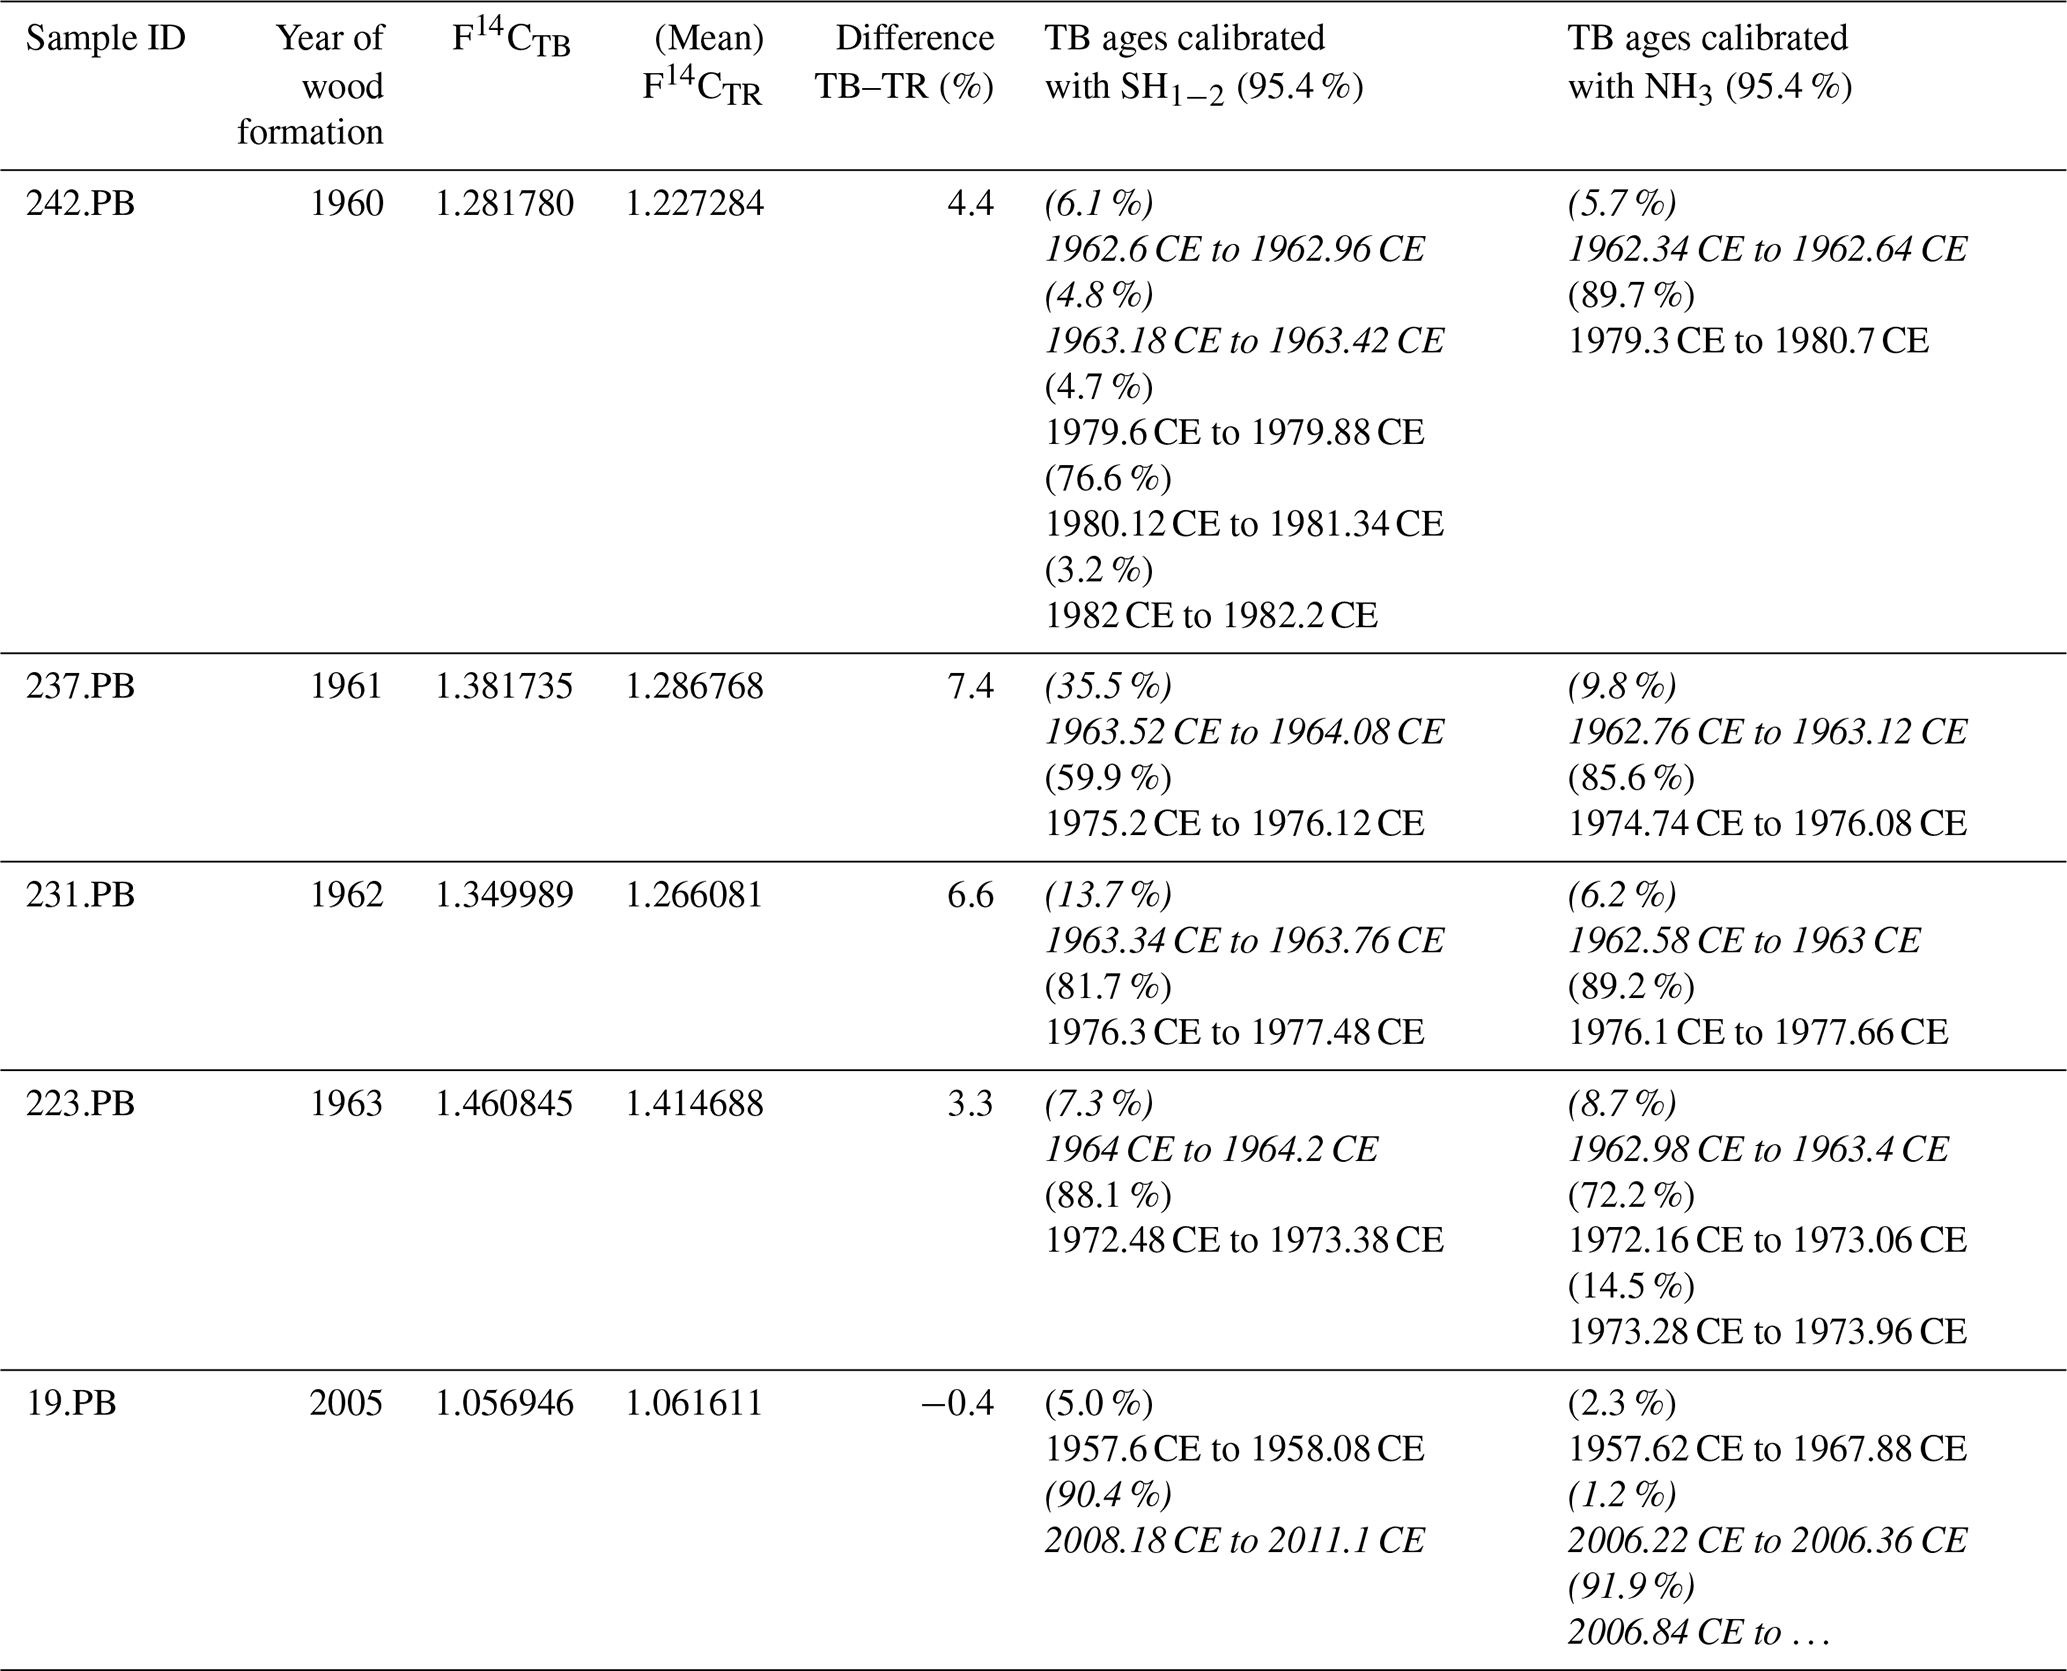
Intra-annual baobab F14C values analyzed for the 2 consecutive years, 1962 and 1963 were found positioned between higher NH3 and lower SH1−2 atmospheric values (Fig. 3b). The F14C values for the TPBs (F14CTPB) for 1960–1962 (n = 3) are significantly higher than the (mean) values for the corresponding tree rings (Fig. 3, Table 2) and also higher than expected for NH3. For 1963, the F14CTPB value is in the range of the tree ring's value, and the last clearly visible TPB (2005) shows a slightly lower F14C value than the corresponding tree ring. Based on radiocarbon analysis TPBs appear to be on average younger than the fibers and vessels of their corresponding tree ring (Table 2).
Table 2Comparison of the F14C values of terminal parenchyma bands (TPBs) and the corresponding tree ring (TR). In case of multiple measurements per ring, the mean value was taken for comparison. Considering the youngest possible calibrated age, most TPBs are significantly younger than the corresponding tree ring. The end of growth is assumed to be at the end of September, i.e., at 0.75 of each year. Please note that the calibration always yields age ranges on the rising side of the bomb peak as well as on the falling part. For years ≤ 1964 only the rising side and for years ≥ 1965 only the falling side were considered for consistency. Italic calibrated ages are viable, and others are only theoretical and given for sake of completeness.
3.3 Statistical characteristics of tree-ring parameter time series
Despite the corrections made for atmospheric change in δ13C and pCO2, the δ13C* time series shows a slightly negative trend over time (r = −0.32, COD = 10.2 %, p = 0.011) (Fig. 4). The mean δ13C* value was –26.99 ± 1.21 ‰ (min: −29.77 ‰, max: −23.43 ‰), with an observed mean range per year of 2.27 ‰ (maximum range: 4.55 ‰ in 1963). δ13C correlated with RWI (r = 0.31, COD = 9.6 %, p = 0.014) and strongly with δ18Omax (r = 0.61, COD = 37.2 %, p<0.0001). Significant autocorrelation was found for δ13C (lag 3), for δ13C (lag 1–2) and for δ13C (lag 1). The moving tests revealed major changes in the central tendency of δ13C for the periods 1948–1953, 1960–1961 and 1984–1985. Major changes in the linear dependency of δ13C occurred in 1964–1966 and 1984–1985, and its variance homogeneity changed significantly for 1985–1987.
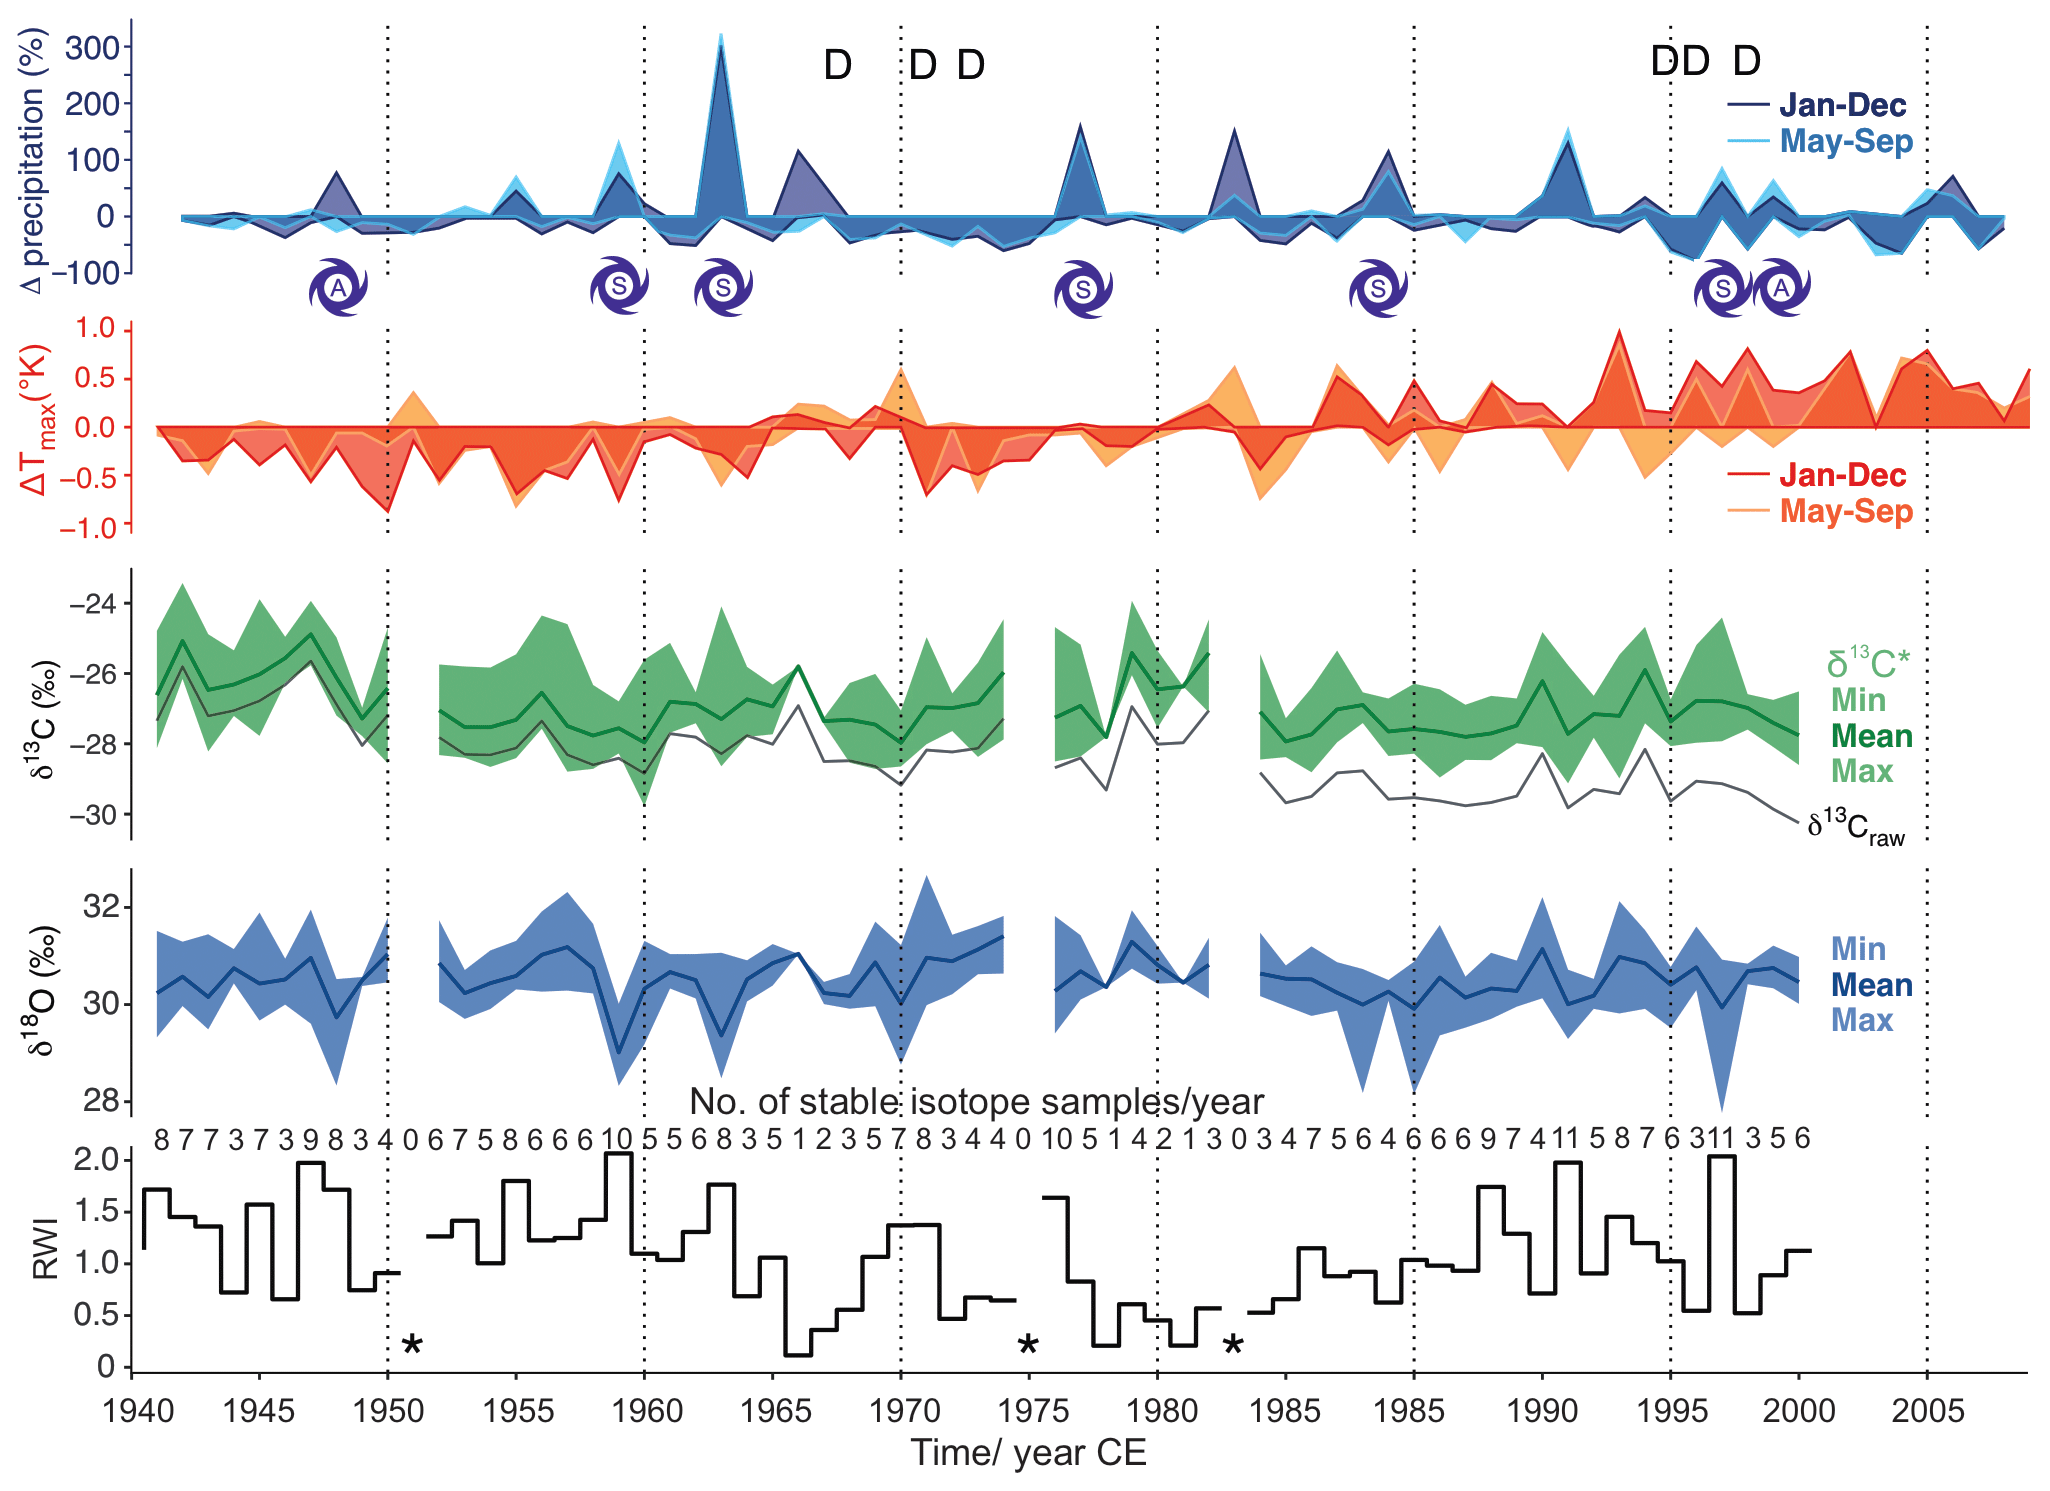
Figure 4Analyzed baobab tree-ring parameters (ring width indices (RWI), δ18O, δ13C*) together with available precipitation and Tmax data for the period 1941–2014. Precipitation is presented as percentage differences from the mean and Tmax as differences in Kelvin. Darker colors reflect differences on an annual basis and lighter colors for the monsoon period June–September. The stable isotope values (δ13C*, δ18O) are presented with minima, maxima and mean values for each year. Mean δ13C, uncorrected for effects of changing atmospheric CO2 concentration and corresponding δ13C, is given as a black line (δ13Craw). Dry years with ≤ 45 mm of rain during the monsoon period are marked with D. Years with spring (S) or autumn (A) storms with ≥ 90 mm of rain are indicated by cyclone symbols. Missing rings caused gaps in the time series and are marked by asterisks.
The mean δ18O value was 30.44 ± 0.77 ‰ (min: 27.77 ‰, max: 32.67 ‰) with an observed mean range per year of 1.38 ‰ (maximum range: 3.16 ‰ in 2002). A rather strong negative correlation was found between δ18Omin and RWI (r = −0.60, p<0.0001). No significant autocorrelation was found for any of the δ18O time series. Major changes in the central tendency occurred for δ18Omin in 1984–1987 and for δ18Omax in 1968–1969. The variance homogeneity of δ18Omin changed significantly for 1957–1959, 1976–1977, 1985–1988 and 1991–1993; the variance homogeneity of δ18Omax changed significantly for 1959–1961.
3.4 Intra-annual stable isotope courses
The intra-annual signature was found to be similar for both δ13C* and δ18O (all years with more than one value; n = 59; Fig. 5a). The first half of the tree ring was characterized by a majority of minimum values per year, whereas the second half was comprised of mainly maximum values. This separation was clearer for δ13C*, where 86 % of all δ13C occurred within the first half (64 % within the first quarter) and 80 % of all δ13C were found in the second half of the tree ring (58 % within the last quarter). δ18O showed a generally higher variability, with the minimum and maximum values more scattered throughout the year. Only 68 % of the δ18Omin values were found within the first half of a tree ring (44 % within the first quarter) and 71 % of the δ18Omax occurred within the second half (44 % within the last quarter). The mid-section showed the highest variation for both δ13C* and δ18O, and the values at the very beginning and the very end varied less. Due to different resolutions of the intra-annual time series ranging from 2 to 11 samples per year, the actual intra-annual isotope courses might be blurred. The time series with at least seven samples per year (n = 20) resulted in a distinct intra-ring pattern (Fig. 5b). For δ18O, the values were still more scattered than for δ13C*, with 75 % of δ18Omin occurring in the first half (35 % within the first quarter) and 85 % of δ18Omax occurring in the second half of the tree ring (55 % within the last quarter). The center of the tree ring revealed a short-term dip in δ18O before rising towards the end of the tree ring, which is in contrast to δ13C*, which showed slightly lowered but not declining values in the mid-section (Fig. 5b).
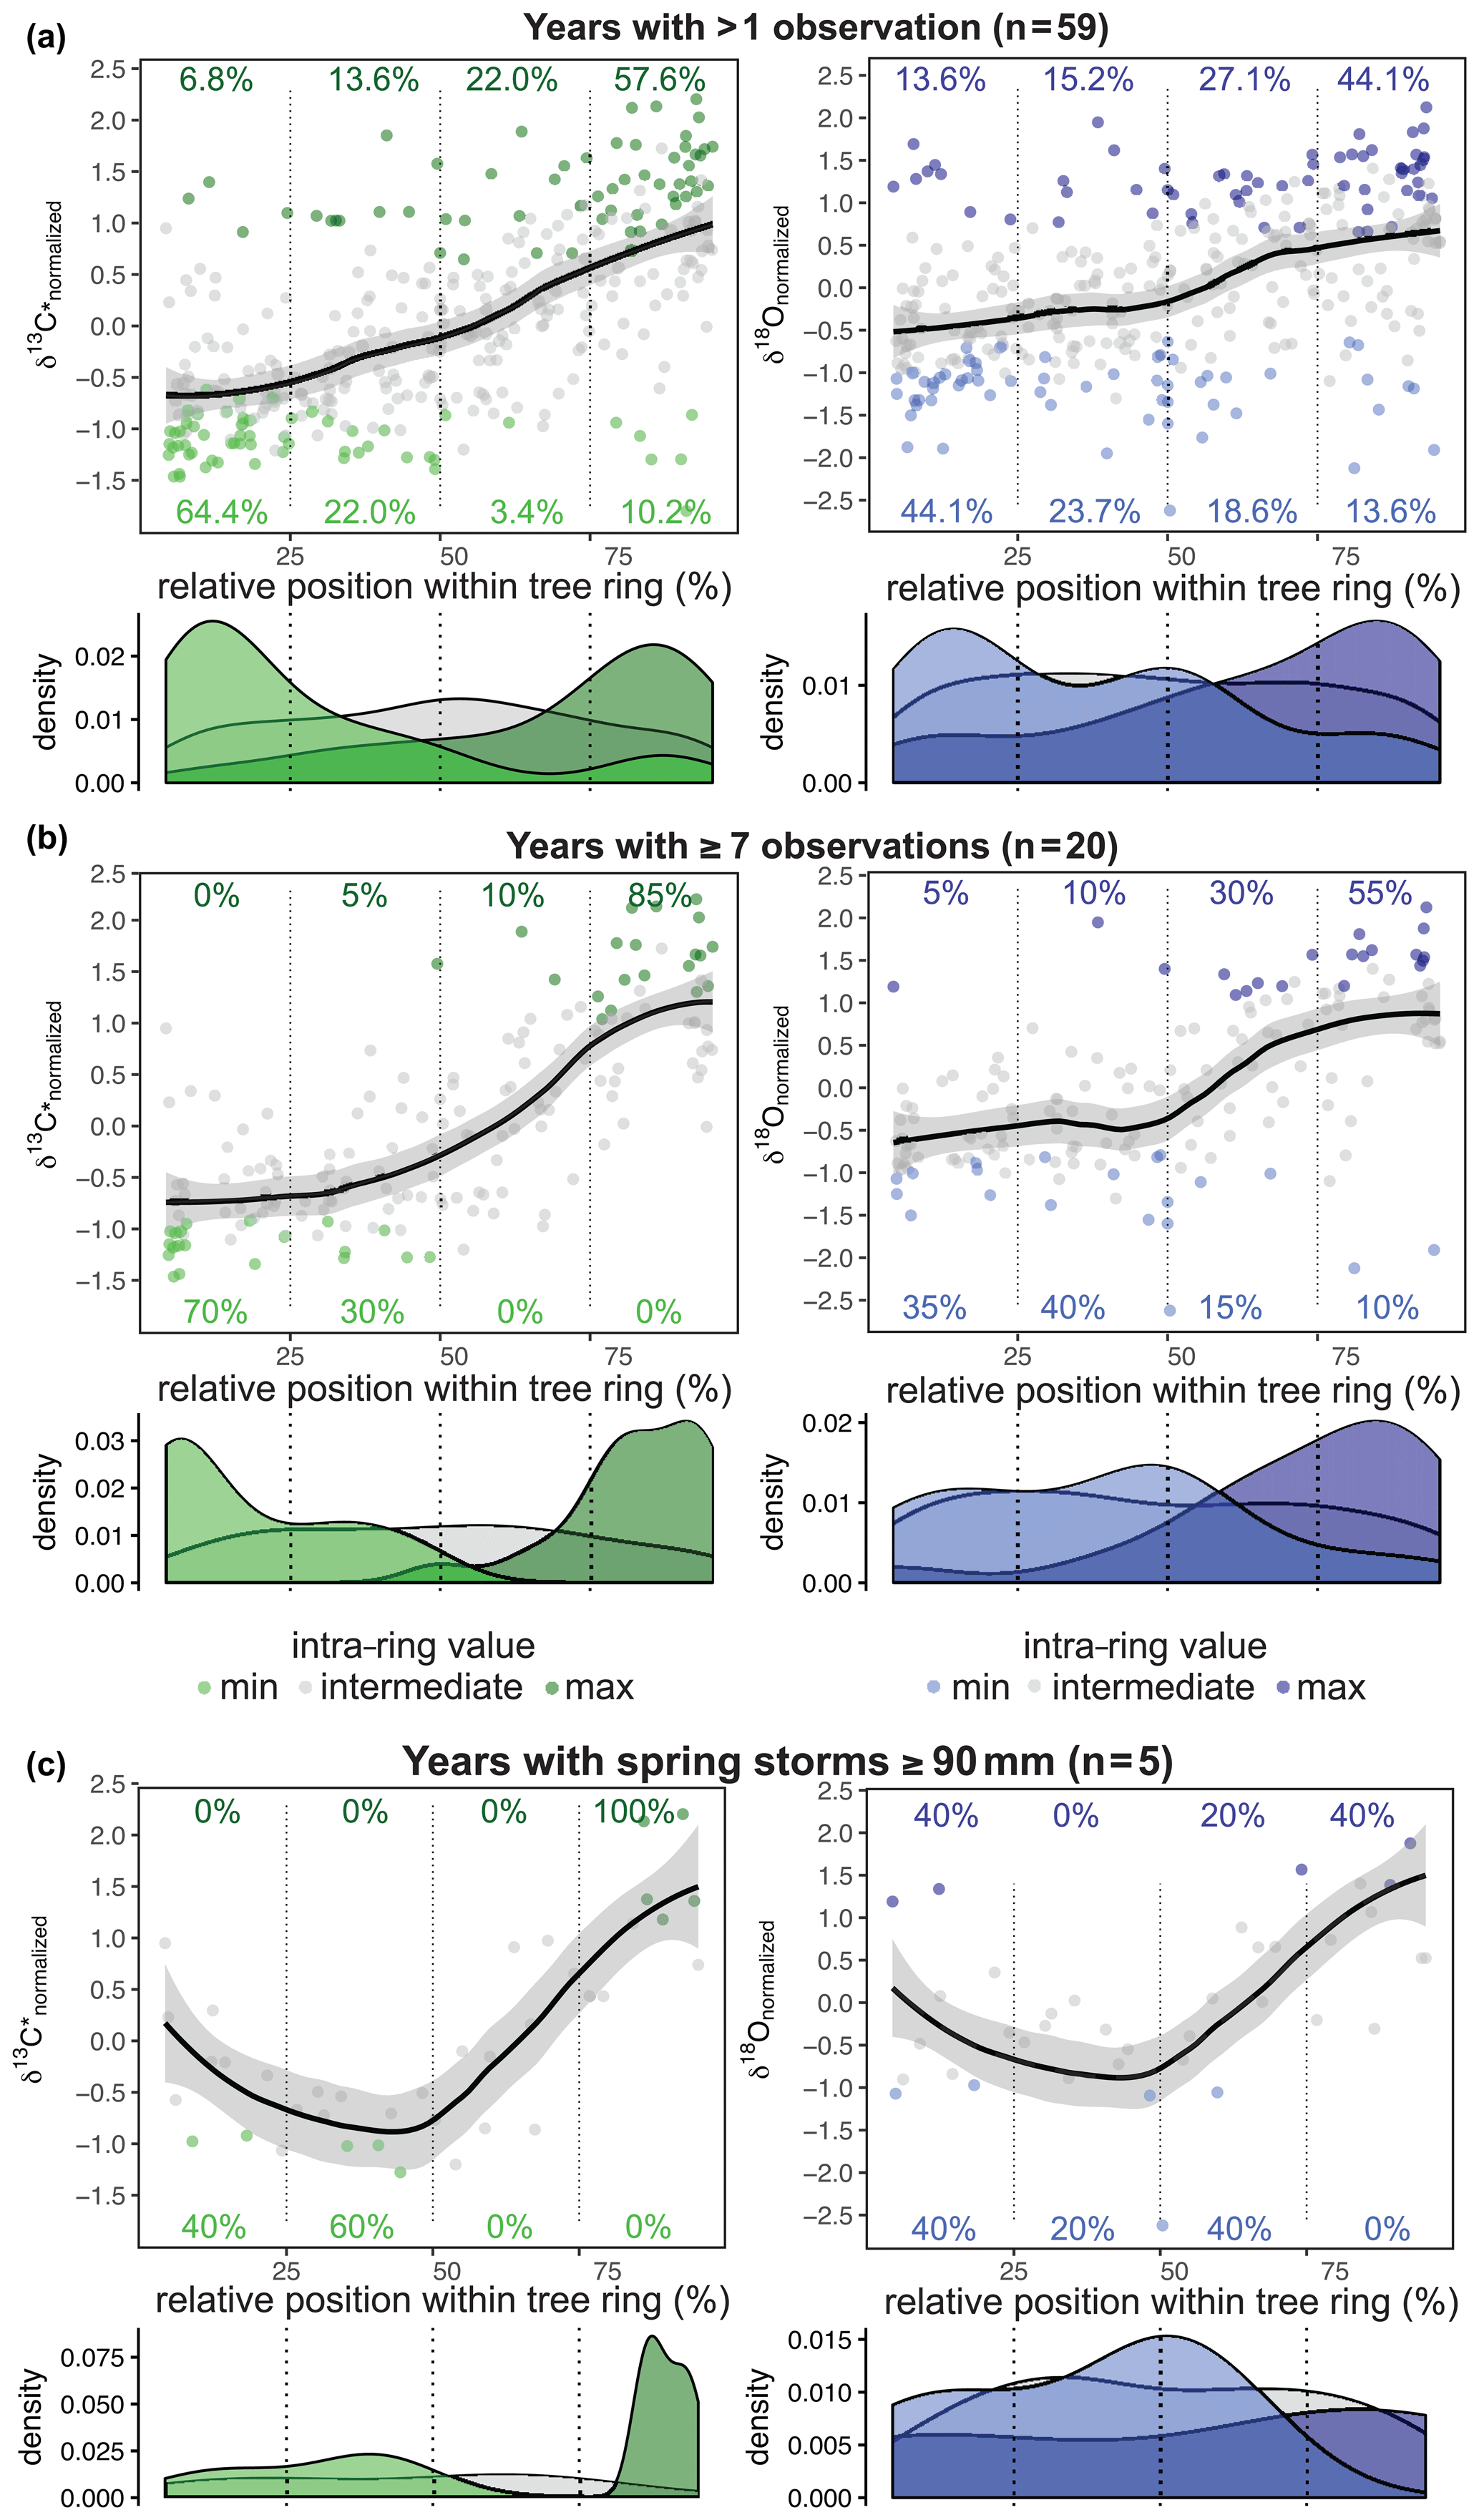
Figure 5Relative position of normalized δ13C* (green) and δ18O (blue) values (a–c). Smooth line illustrates the intra-annual course of the isotope ratios with the standard error as the grey shaded area (loess fit with span = 0.6). (a) For both δ13C* and δ18O the first half of the tree ring is dominated by minimum values and the second half by maximum values. (b) The common isotopic pattern becomes clearer for tree rings with seven or more samples. δ13C* shows a gentle increase during the first two quarters and then increases strongly before leveling off in the last quarter. δ18O is characterized by a dip in the mid-section before the steep rise of the values. (c) For years with spring cyclones with ≥ 90 mm of rain (i.e., 1959, 1963, 1977, 1989, 2002) and five or more isotope values per year, δ13C* shows decreasing values within the first half of the tree ring and a steep increase in the second half. The δ18O values show their minimum around the center of the tree ring, followed by a steep rise towards the end of the tree ring.
3.4.1 Intra-annual isotope course in years with heavy rainfall events due to spring or autumn cyclones
In order to estimate the influence of heavy rainfall events on intra-annual δ13C* and δ18O, we separated years with pre- to early- and late- to post-monsoonal storms (starting in April/May/June or September/October/November, respectively) ≥ 90 mm (i.e., average monsoon precipitation) with more than one or more than seven observations, respectively (Fig. 5a, b). As shown in Fig. 5c this revealed a pronounced difference in the mid-section of the intra-ring isotope courses, causing a significant decline. In the 5 years with spring cyclones (1959, 1963, 1977, 1989, 2002), δ13C* and δ18O values declined during the first half of a tree ring and steeply increased within the second half, reaching their maximum close to or at the end of each tree ring. Although δ13C* and δ18O courses closely resemble each other, δ18O showed a more pronounced decline in the mid-section and a greater range, with maximum values found in 2 out of the 5 years at the very beginning of a tree ring (Fig. 5c). This indicates that minimum values are shifted from the beginning of an intra-ring isotope course to its center in years with spring cyclones and rainfall ≥ 90 mm.
In the 2 years with autumn cyclones (Fig. 6a) intra-annual δ13C* showed no distinct pattern, and after reaching the maximum values it indicated a final decrease at the end of a tree ring but showed no distinct pattern. δ18O responds largely similarly to autumn cyclones with the lowest values of the intra-ring course in the last quarter of the tree ring. Additionally, δ18O values were found above normalized average in the first half of the intra-ring δ18O course and below average at the end (Fig. 6a, right). The tree ring of 1948 showed a conspicuously strong increase in δ18O towards the very end. It was rather wide and is represented by eight intra-annual isotope samples.
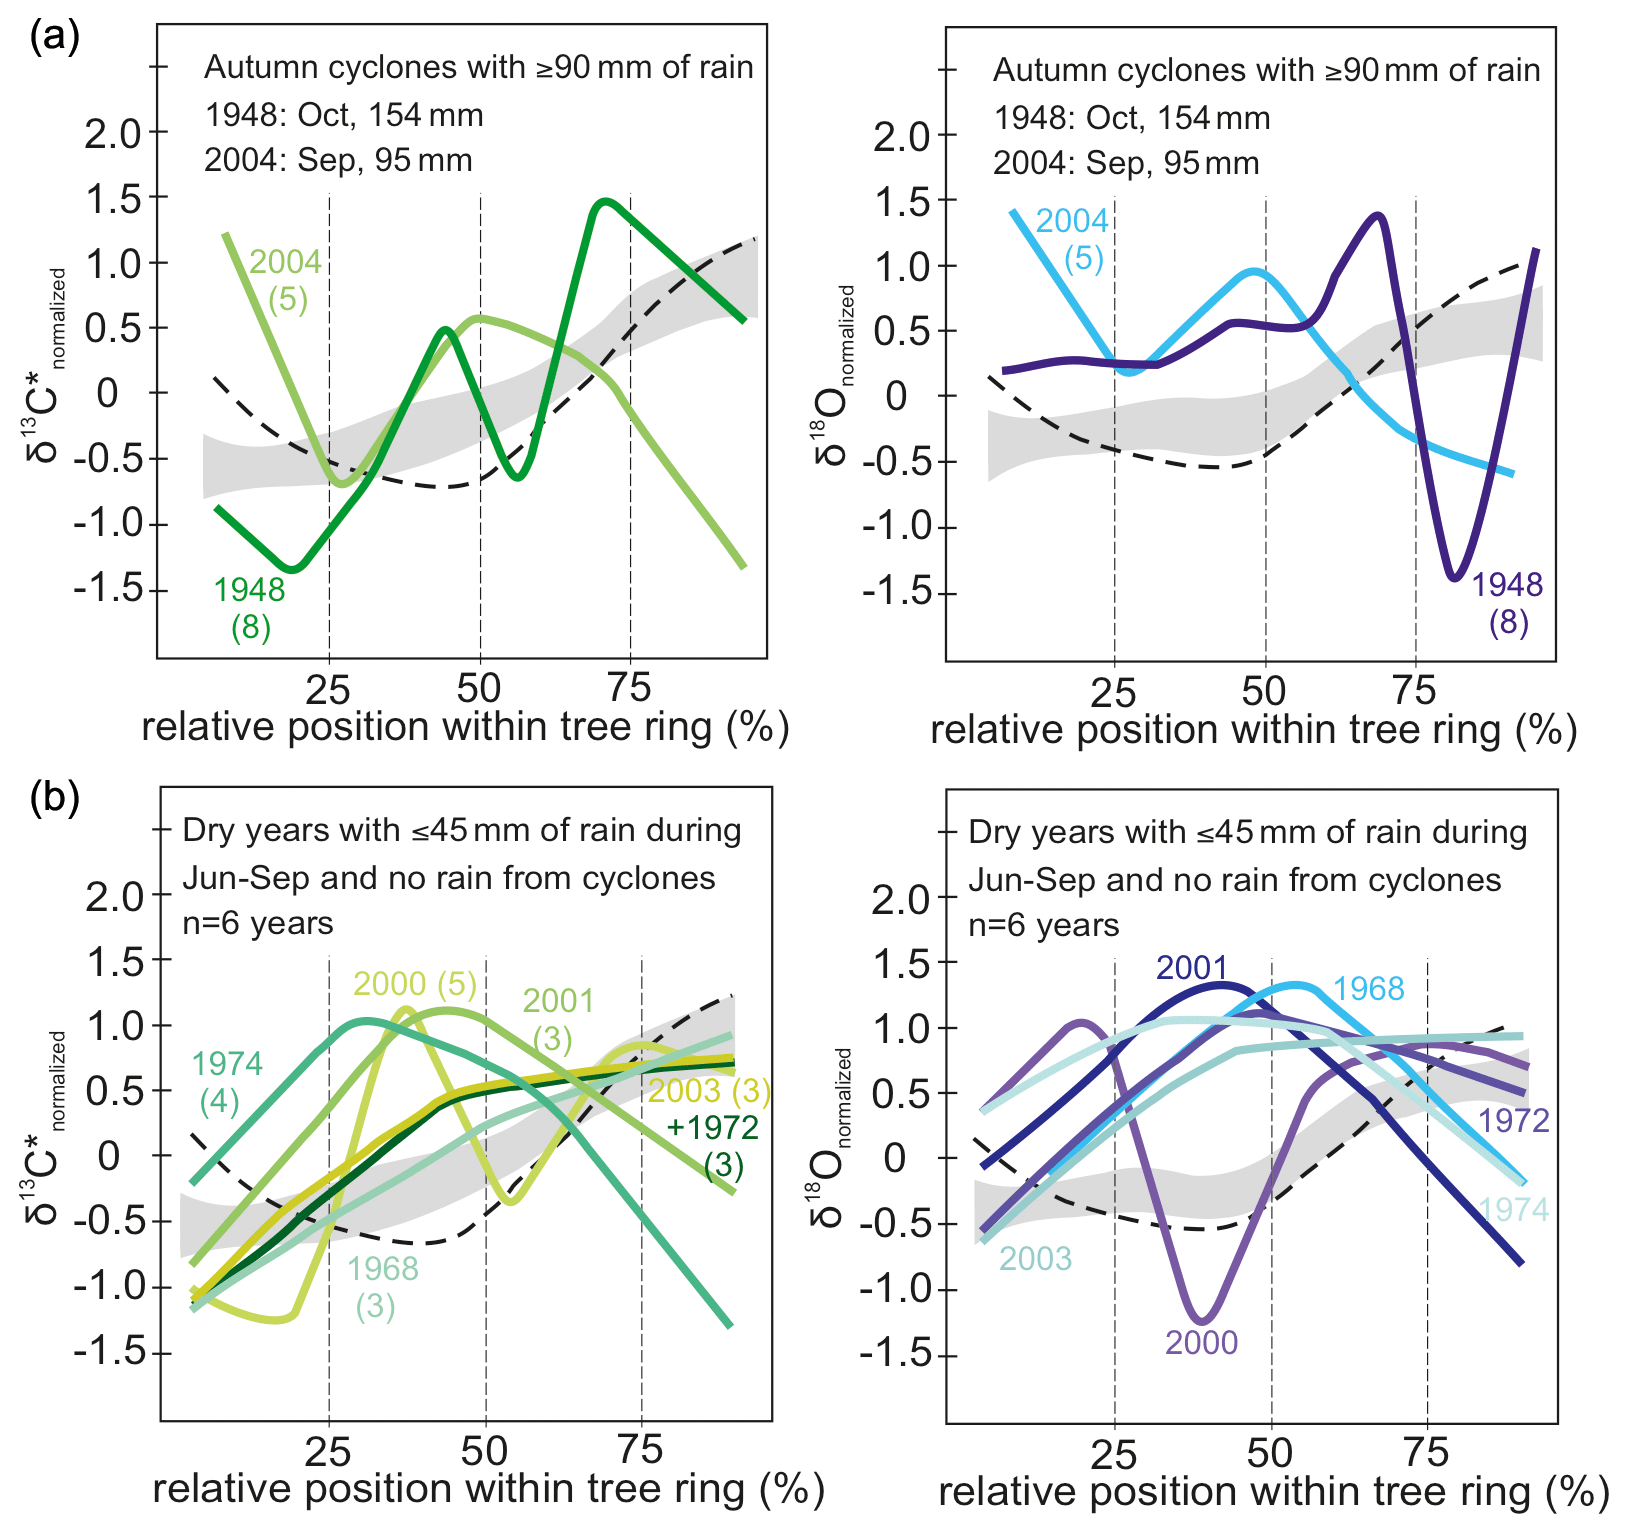
Figure 6(a) Intra-annual course of normalized δ13C* (green) and δ18O (blue) values for years with autumn cyclones bringing ≥ 90 mm of rain (n = 2) and (b) dry years with ≥ 45 mm monsoonal precipitation and no rain from cyclones (n = 6). Numbers in brackets indicate number of isotope samples analyzed per year. Grey shaded area marks the intra-annual course of isotope ratios with standard error for all years with more than three observations. The dashed line indicates intra-annual course of isotopes for years with spring cyclones, illustrated in detail in Fig. 5c. Rain from autumn cyclones may affect the intra-annual isotope signature by more strongly declining values towards the end of a tree ring. Years with 45 mm of monsoon precipitation or less show an increase in δ13C* towards the middle of each tree ring and then decline or increase only slightly towards the end. Rather similar seasonal trends can be observed for δ18O values. Hence, dry monsoon seasons usually cause higher isotope values in the middle part of each tree ring than during normal years. Please see text for further details on the conspicuous seasonal trends in 1948 and 2000.
3.4.2 Intra-annual isotope course in years with exceptionally low monsoon precipitation
Years with less than 50 % of the average monsoon precipitation (June–September: ≤ 45 mm) and no spring/autumn heavy rainfall due to cyclones were selected for inspecting the influence of drought on the intra-ring stable isotope courses yielding 6 years with reduced average monsoon precipitation: 1968, 1972, 1974, 2000, 2001 and 2003. Except for the year 2000, all intra-ring δ13C* courses start with a distinct increase reaching δ13C or values close to δ13C within the first half of the tree ring (Fig. 6b). In general, intra-ring δ13C* for the years 1968, 1972 and 2003 showed an increasing trend, with δ13C reached towards the end of the ring, whereas in 1974, 2000 and 2001, δ13C occurred in the early half of the ring, followed by declining δ13C* (with the exception of 2000 that showed a complex multimodal pattern). The intra-annual course for the year 2000 showed a much higher intra-ring stable isotope variation, but it was also the year with the most observations (n= 6) for a year with low monsoon rain. In sum, both isotope species generally showed rather similar intra-ring trends in response to drought, with the highest values frequently located in the mid-section of the intra-ring course (Fig. 6b).
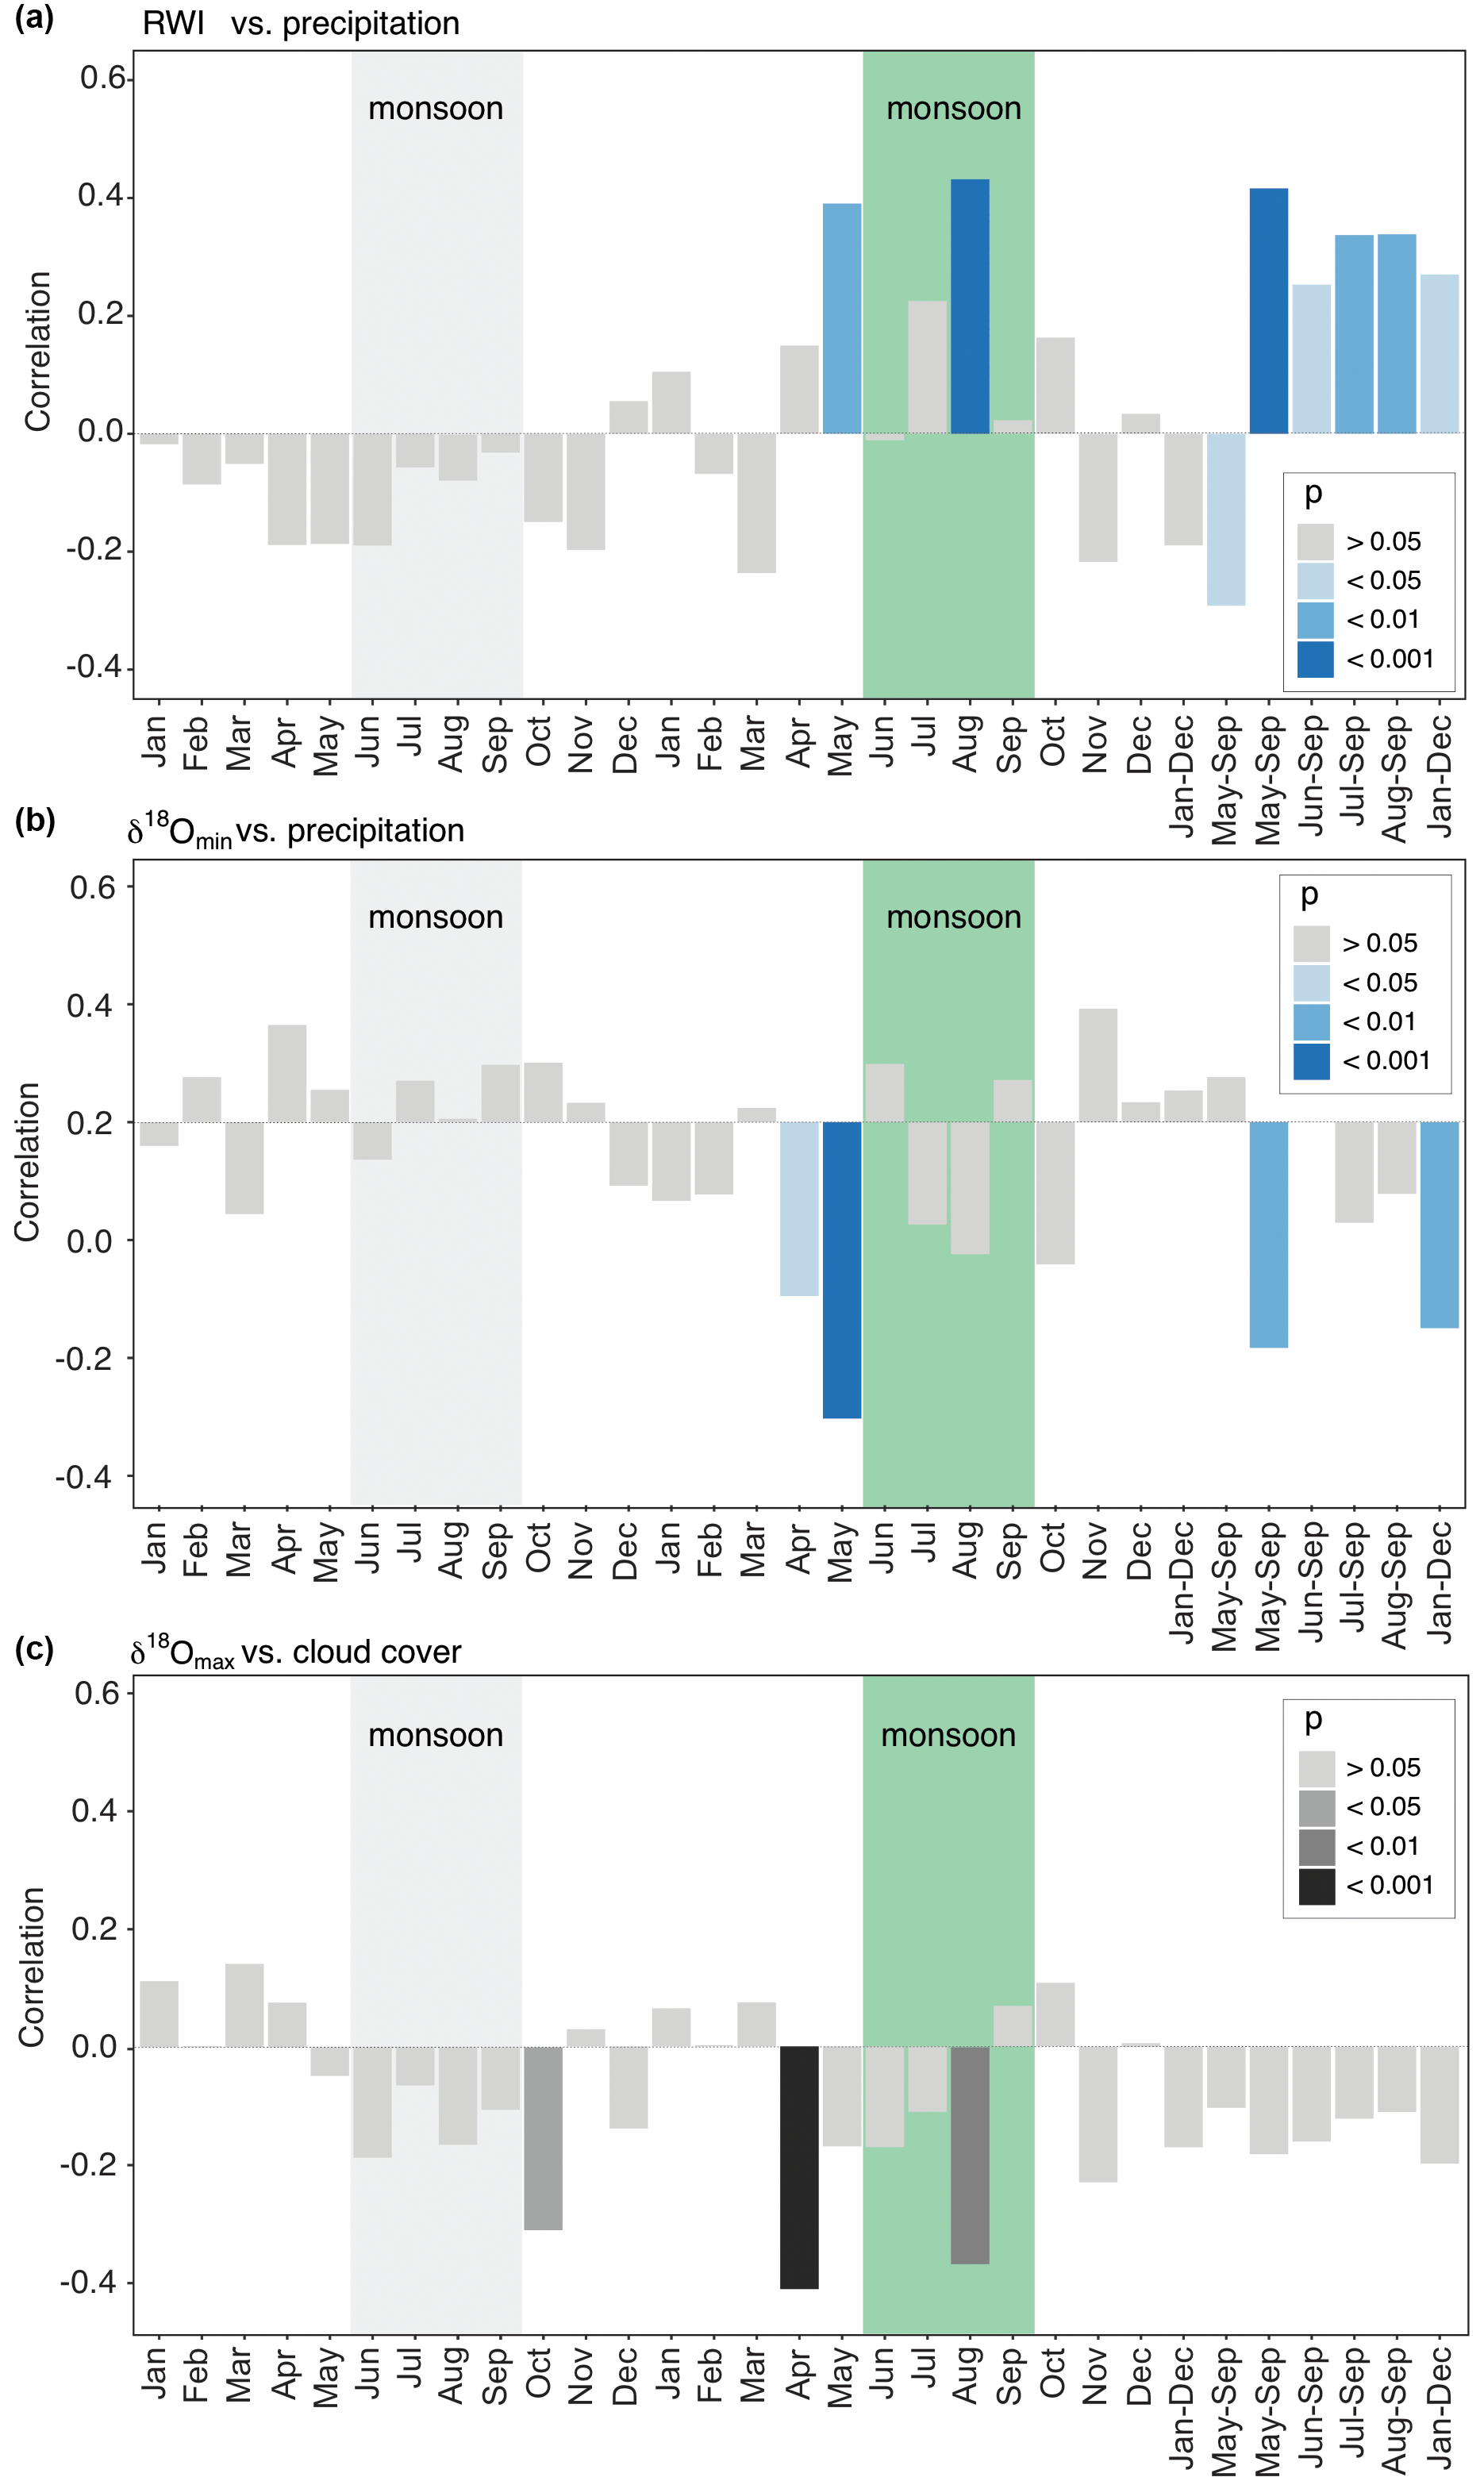
Figure 7Diagrams for the strongest correlations of baobab tree-ring parameters with monthly and seasonally resolved climate parameters. Months of the previous year are marked by lowercase abbreviations and months of the current year by uppercase abbreviations. The green box marks the average monsoon period. (a) Ring-width indices versus precipitation amount. (b) δ18Omin versus precipitation. (c) δ18Omax versus cloud cover. Apart from the actual monsoon season (June–September) also the pre-monsoon (April–May) has a significant influence on wood increment growth and δ18O isotope signature.
3.5 Statistical relations between weather conditions and tree-ring parameters
Significant correlations between RWI, δ13C, and δ18O and selected monthly climate variables reflecting moisture conditions at the site were observed for the current and the previous year (Table 3, Fig. 7). RWI, comprising annual radial growth, showed significant positive correlations (p<0.001) with August and May–September precipitation (Table 3, Fig. 7a). δ13C generally revealed no relation to precipitation and only weak correlations with other climate variables. In contrast, δ18Omean correlated significantly and negatively with May precipitation, as well as the monthly aggregates, May–September and January–December.
Table 3Significant correlations between the obtained baobab time series and climate parameters for the area around Wadi Hinna. Correlations within months of the current year are marked by uppercase abbreviations and correlations within months of the previous year by lowercase abbreviations. Significance level values: * p<0.05; p<0.01; p<0.001; p<0.0001. Positive (negative) correlations are indicated with “+” (“−“). Note that δ13C values show some significant but weak correlations compared to RWI and δ18O.
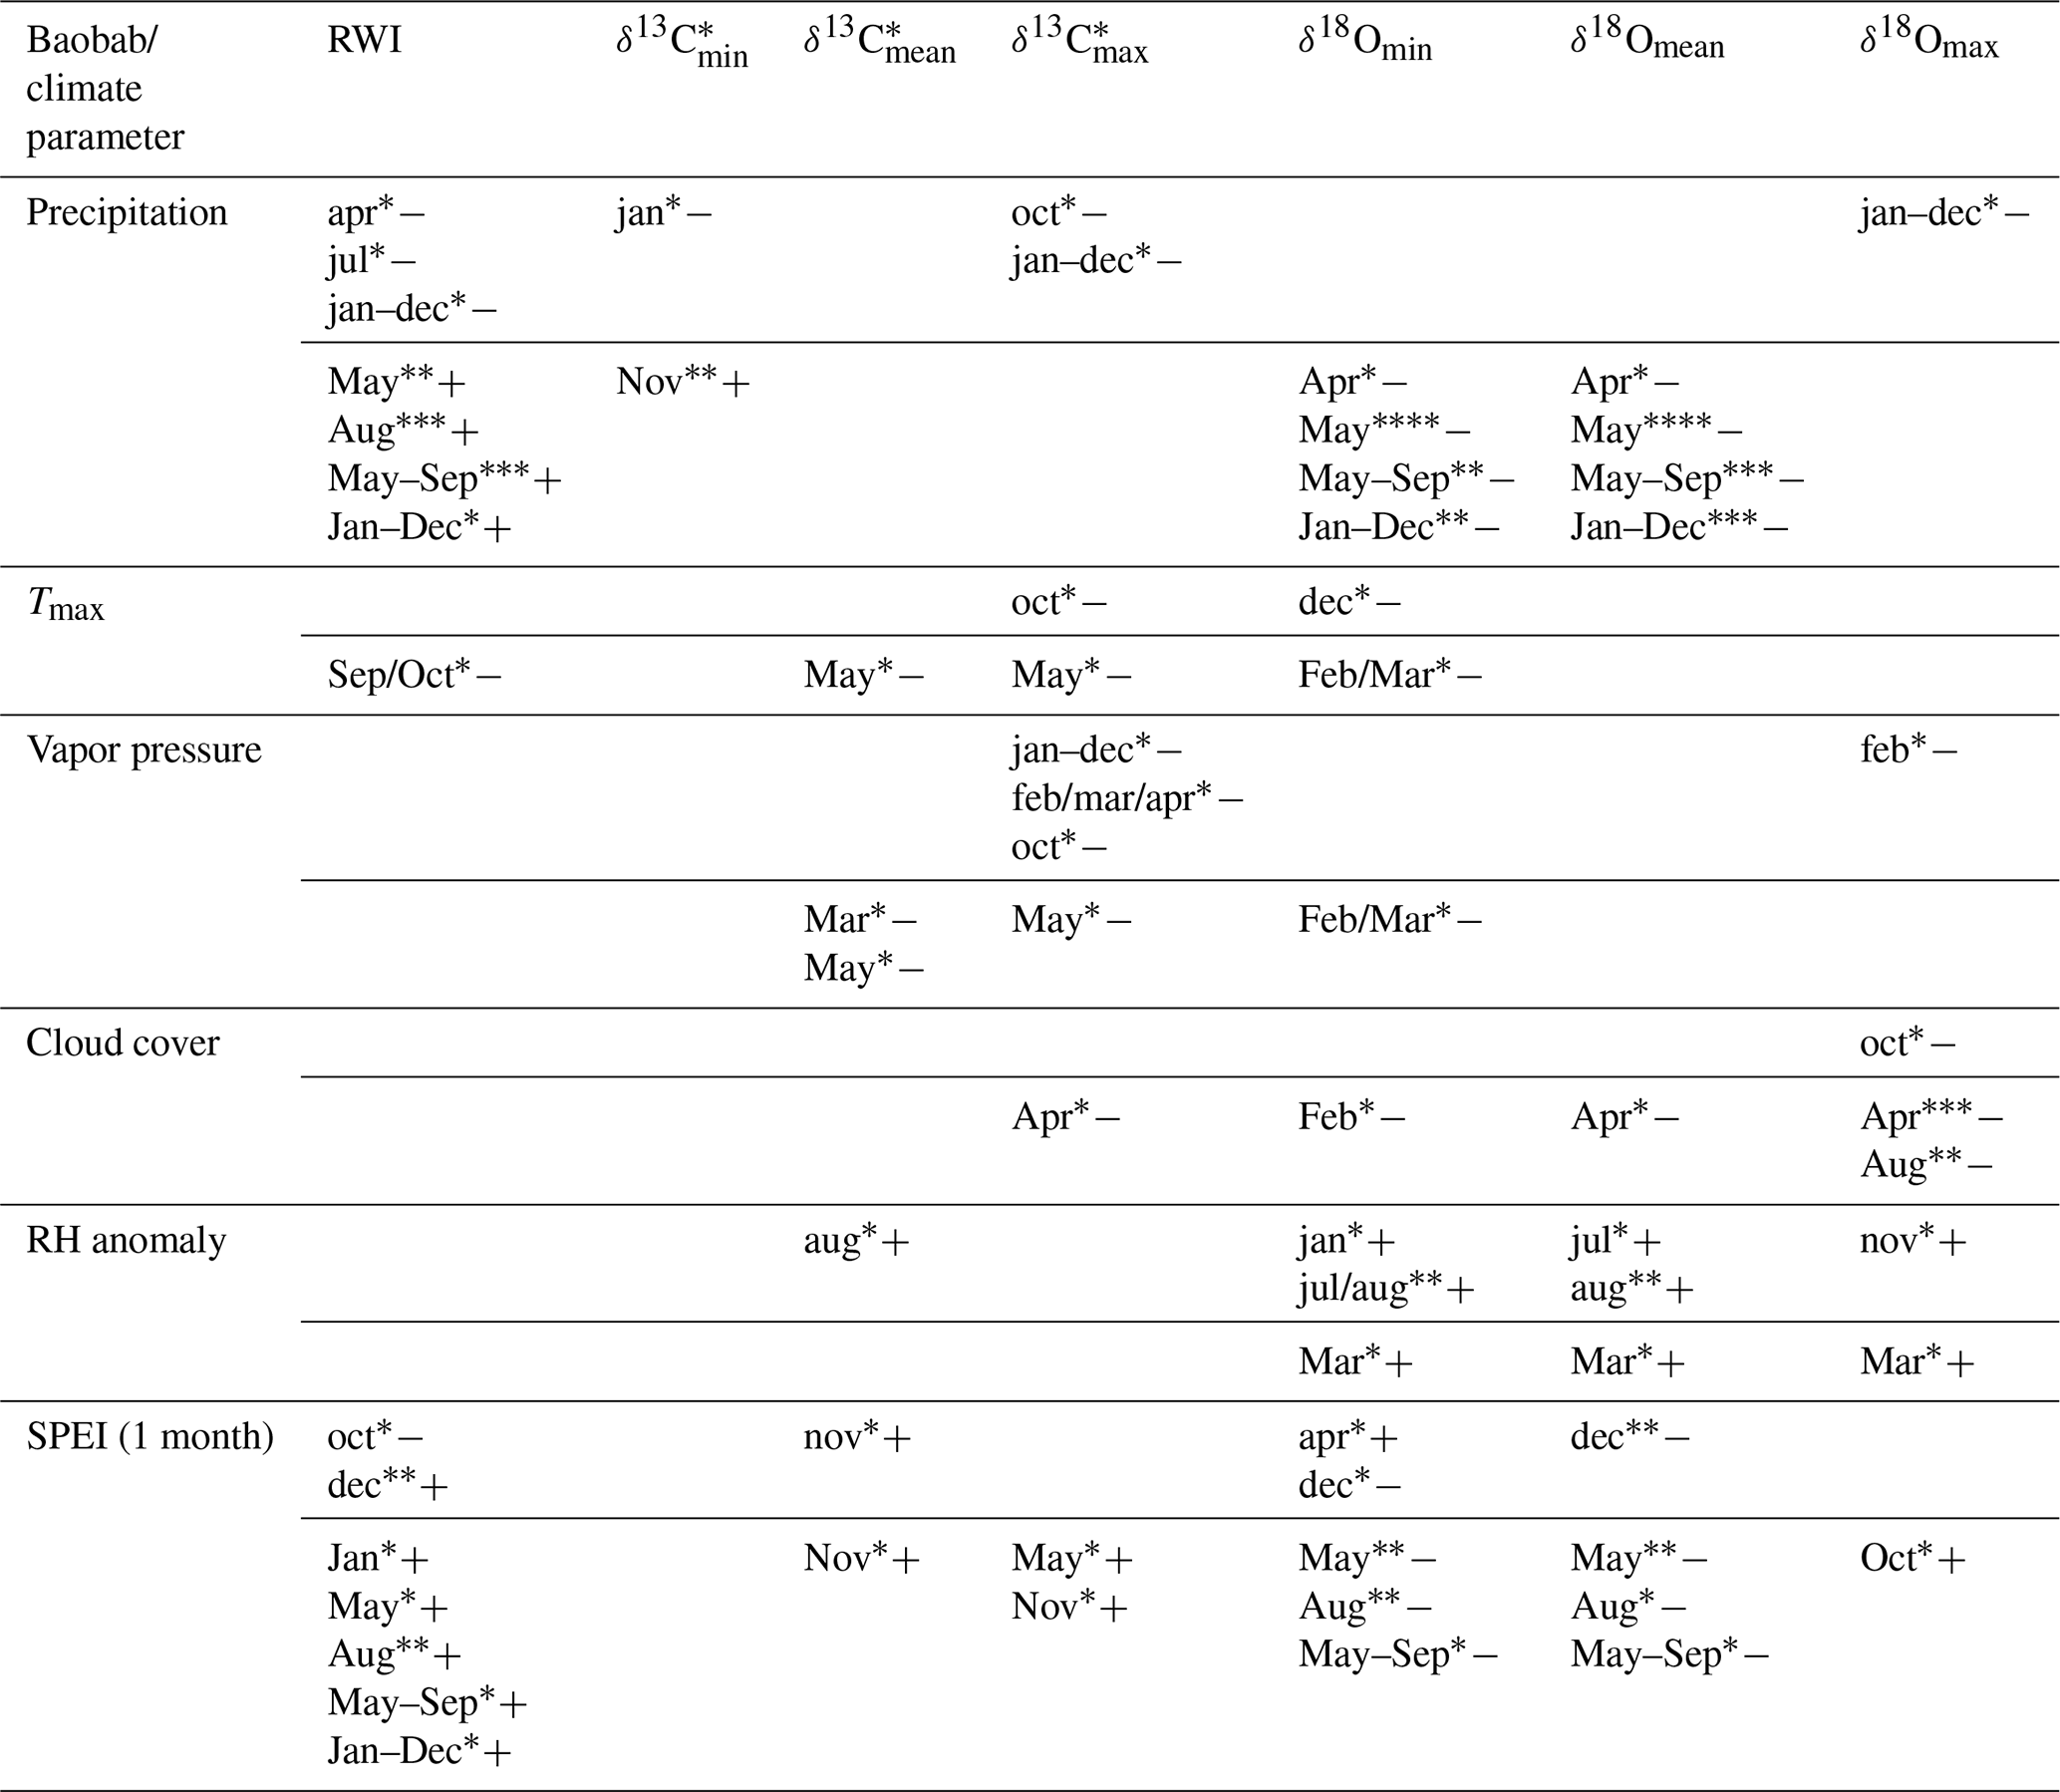
Intra-ring minimum isotope values displayed only weak correlations between δ13C and precipitation from previous year January and current year November, while no relations were found with other climate variables. Conversely, δ18Omin correlated significantly with Tmax and all moisture related climate variables with δ18Omin, showing a strong response to pre-monsoonal May rainfall (Table 3, Fig. 7b).
δ13C showed more and better relationships with climate quantities than δ13C and δ13C. Significant correlations were found for May temperature, vapor pressure and SPEI (1 month). The highest correlation to cloud cover was revealed for δ18Omax in pre-monsoon April (Table 3, Fig. 7c). Further significant correlations of δ18Omax were also found with the climate conditions of the previous year (previous January–December, February, October and November; see Table 3 for details).
4.1 F14C values in baobab wood are very likely altered by carbohydrate metabolism
Situated in Oman, the baobab F14C values were expected to fit the post-bomb atmospheric curve NH3 (Hua et al., 2013). However, they were found notably lower than NH3 and even SH3, around the bomb peak period (1964–1967, Fig. 3a). A number of external factors can potentially be responsible for the dilution of atmospheric 14C: (1) fossil fuel dilution from neighboring industrial and urban areas (Chakraborty et al., 1994, 2008), (2) volcanic emanations (e.g., Lefevre et al., 2018), and (3) upwelling of carbon-rich waters causing outgassing of “older” CO2 into the atmosphere (Takahashi et al., 2009; Sreeush et al., 2018). We can exclude atmospheric 14C dilution from CO2 released by volcanic activities. This effect is usually confined to obvious volcanic activity, e.g., fumaroles. Furthermore, we consider regional fossil fuel CO2 mixing as unlikely at this tree site in the Dhofar Mountains. Because of its remoteness from any city or industrial complex the site rather reflects atmospheric background. Due to the close proximity to the coast of the Arabian Sea with significant upwelling, we cannot fully exclude atmospheric 14C dilution. However, other studies report only subtle effects of aged CO2 released from ocean upwelling (e.g., Beramendi-Orosco et al., 2018). Since the measurements for the 1940s are consistent with other records for the Northern Hemisphere, we suggest that dilution from 14C-free CO2 from upwelling cannot be responsible for the large offset of 8.8 % (1964–1967) between F14C of baobab tree-ring cellulose record and atmospheric F14C of NH3.
The baobab record of the bomb peak is further characterized as a period of major changes in the central tendency of RWI (1962–1965) as well as in the linear dependency of δ13C (1964–1966). It is difficult to assess the driving force(s) behind these major changes without further investigations on other tree species and other sites in Oman; however, the notably lowered values of baobab F14C during the bomb peak period may to some extent be explained by the baobabs' carbohydrate turnover. The observed autocorrelation in the δ13C* signature points to the use of previous years' carbon for part of the growth, which leads to a dampening in the carbon isotope record of environmental signals, including the atmospheric F14C content. The dramatic deviation of baobab F14C values and atmospheric NH3 data around the bomb peak area points out that an immediate allocation of leaf assimilates to wood growth is very unlikely and transient storage or carbon recycling from respiration has to be considered.
In an attempt to explain the observed baobab F14C values, we applied a simple conceptual modeling approach assuming that baobab wood formation is fueled by pools of non-structural carbohydrates (NSCs) that carry the atmospheric F14C source values for the NH3 zone. From radiocarbon dating, Richardson et al. (2013) found a mean age of stemwood NSC of about 10 years in temperate forest trees with individual dates of up to 31 years. They presented lines of evidence for “fast” and “slow” cycling reserves and proposed a two-pool model structure to explain the age of stemwood total NSC. A follow-up study on the mixing of new and previously stored NSC supported this model and the “last in, first out” hypothesis (Richardson et al., 2015). We have no 14C data or other information about the age of different NSC pools in baobabs; however, we attempted to address these considerations by assuming two NSC pools and tested for annual renewal rates ranging between 2 and 10 % (“slow” cycling reserves) and 98 % to 90 % (low contribution of old reserves; “fast” cycling), respectively. Taking the last in, first out hypothesis (Richardson et al., 2015) into account we further presumed that wood formation is fueled by a mix from these two NSC pools and visually tested the agreement with the observed baobab F14C values for relative contributions between 95 % and 70 % from the fast cycling pool and 5 % to 30 % from the slow cycling NSC pool. The best approximation to the baobab F14C time series was achieved by holding stakes of 85 % fast cycling and 15 % slow cycling NSCs with annual renewal rates of 95 % (renewal fast cycling pool) and 5 % (renewal slow cycling pool) of the two respective pools (Fig. 8). The slow cycling NSC pool may predominantly represent starch, the major long-term carbohydrate reserve in trees, although starch has not always been found to be older than sugars, which should represent the fast cycling NSC pool (Richardson et al., 2015). We suggest that the slow cycling NSC might originate from considerable cortical photosynthesis (Kotina et al., 2017) of older respiratory CO2. Additionally, the significant autocorrelation found for δ13C* strongly indicates the incorporation of previous years' carbon into tree-ring cellulose from carbohydrate reserves and/or from current carbohydrates derived from old stem respiratory CO2 recycled in cortical photosynthesis.
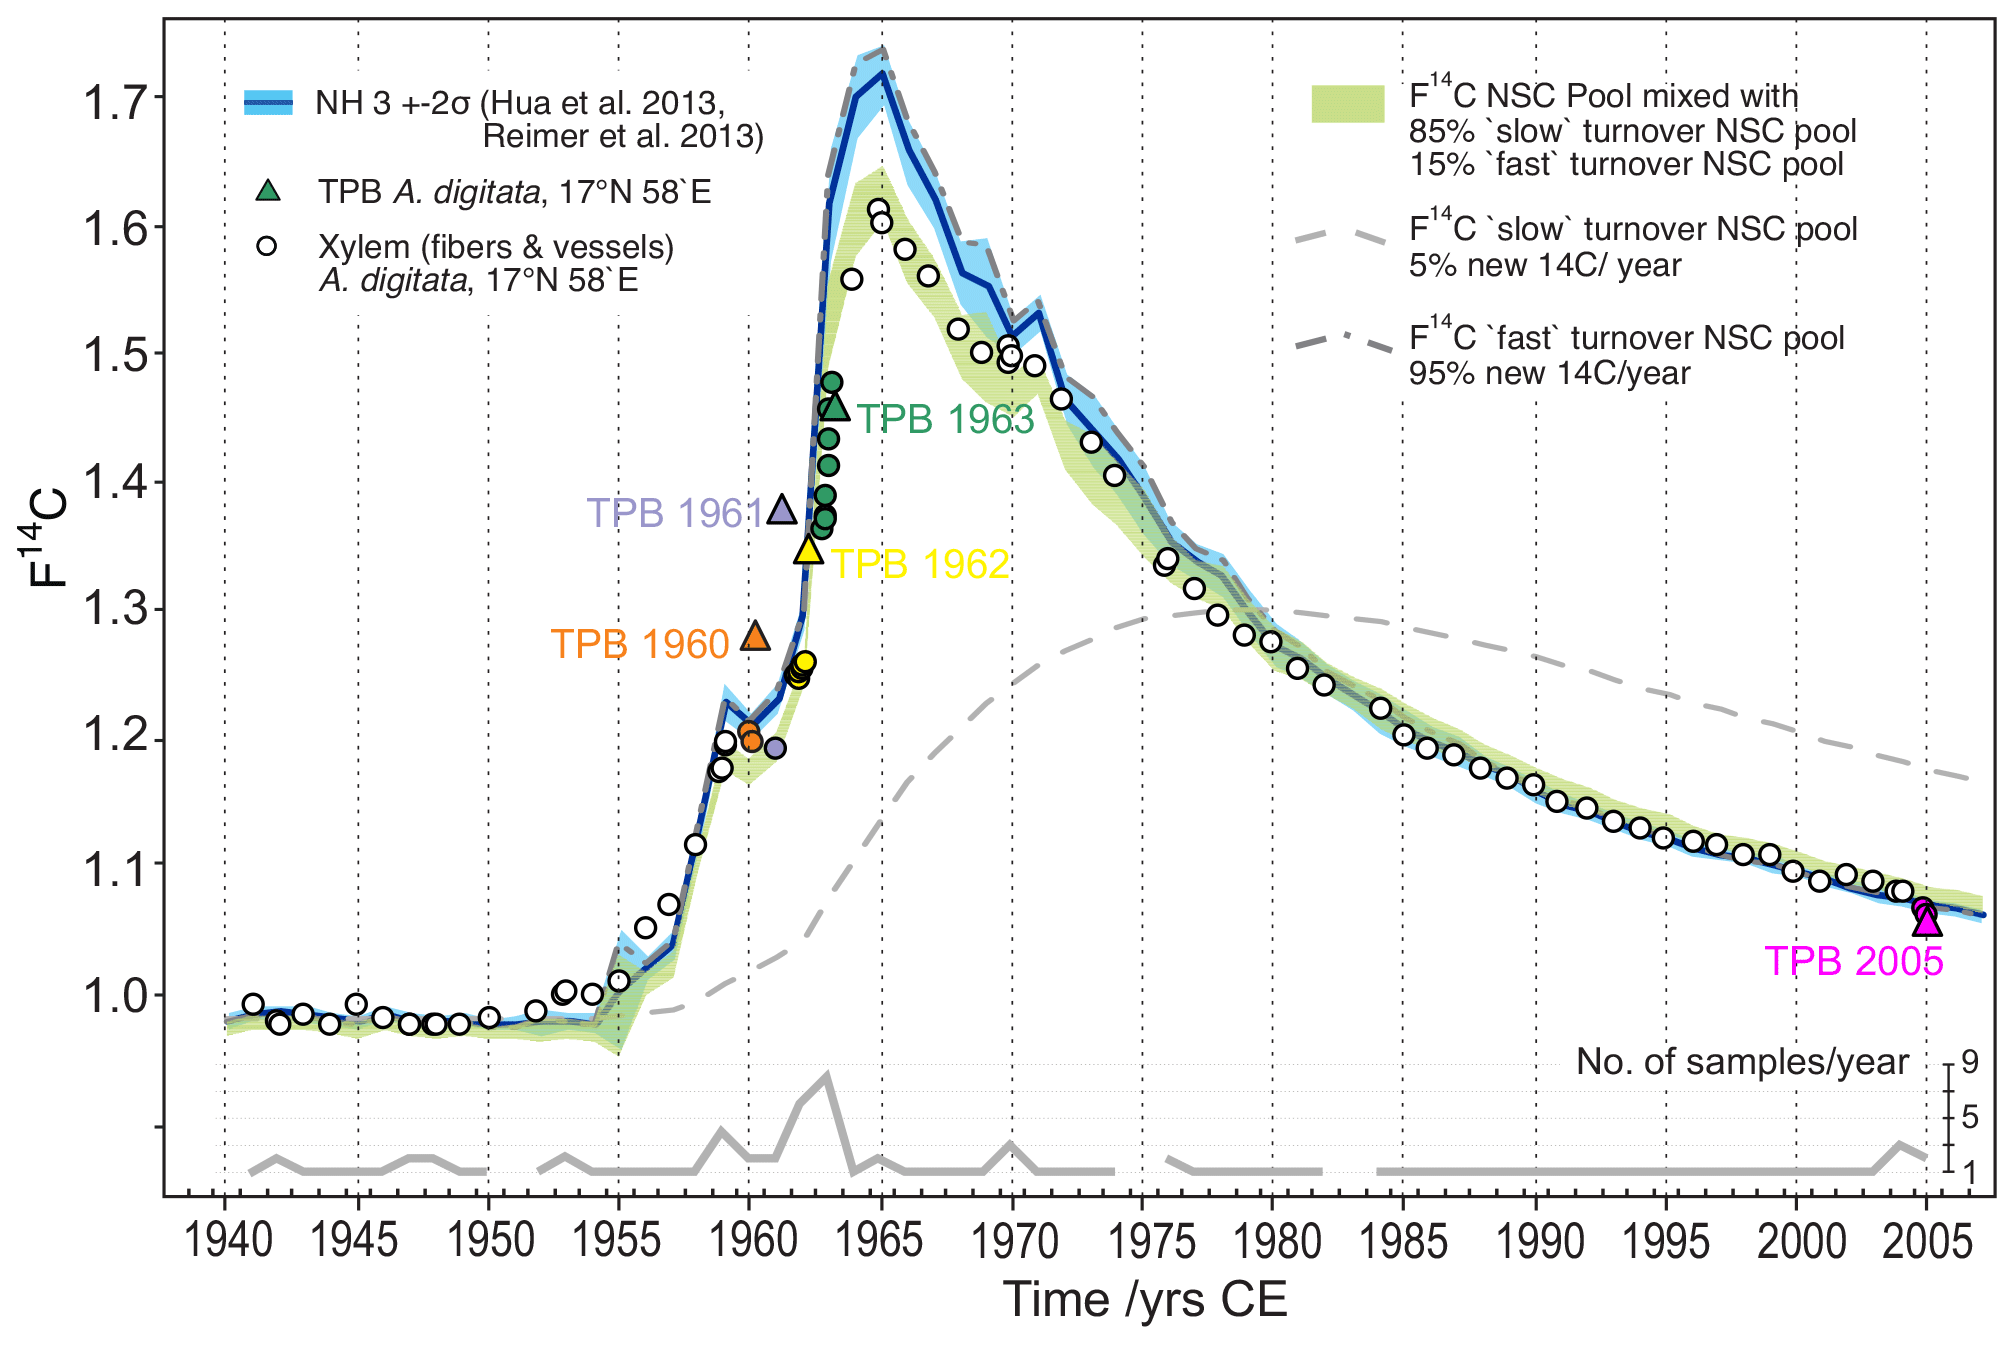
Figure 8Baobab F14C values in comparison with the F14C curve for NH3 (blue line/shade) and modeled pools of non-structural carbohydrates (NSCs) fueling wood formation. The observed F14C values of baobab xylem fibers and vessels (circles) are well approximated by assuming polymerization from a mixed NSC pool (F14CNSCm[i]) with contributions from a fast (F14CNSCf[i]) and slow (F14CNSCs[i]) turnover NSC pool, respectively. Range of F14CNSCm[i] (green shade) is given by the 2σ range of atmospheric F14C source values (F14C) for each year ([i]). 1940 was chosen as the starting year for the model calculations. Terminal parenchyma bands (TPB, colored triangles) show higher (1960–1962) and lower (2005) F14C values than F14C of NH3 and xylem fiber and vessel tissue of corresponding tree rings. This indicates distinct younger ages of TPBs and points to structural changes and ongoing cell division of parenchyma tissue for a number of years after initial formation. Some F14C values of fiber and vessel samples (e.g., 1945, 1953, 1954, 1957, 1958) were also found above corresponding NH3 values. This might allude to the presence of intraxylary parenchyma tissue that could not be detected during the tree-ring dissection process.
Despite our simplistic approach with assumptions based on literature data from very different tree species and not taking into account pool size dynamics, the offset in F14C between baobab cellulose and NH3 data during the time around the bomb peak is well captured. Nonetheless, baobab F14C values for 1945, 1952–1954, 1956 and 1957 lie slightly above the calculated range of F14C of the NSC pool. Although to a much lesser extent, this is in common with F14C values measured for the TPBs, strongly indicating that the wood of these rings may have contained an unrecognized high fraction of intraxylary parenchyma cells and did not consist of pure xylem fibers and vessels.
4.2 F14C of TPBs indicates ongoing formation and/or restructuring of parenchyma tissue for several years
Terminal parenchyma bands (TPBs), marking the visual tree-ring boundaries, were found to be at least up to 1.6 years younger than the corresponding tree ring when calibrated with post-bomb NH3 and assigned to the youngest possible age (Table 2, Fig. 8). In addition, the highest correlation between the width of TPBs and RWI was found for the ring built 1 year after the corresponding tree ring. Initial parenchyma bands are being produced each year, initiated by the cambium between wood (xylem) and bark. However, well-defined TPBs could only be found deeper in the xylem, marking the actual tree-ring boundaries well but also explaining previously described difficulties in cross dating the outer part of baobab core samples (Johansson, 1999; Slotta et al., 2017).
Since parenchyma cells retain their ability to divide throughout their life span (Spicer, 2014) it is thus possible that the proliferation, i.e., post-cambial parenchyma growth, starts once the existing NSC storage volume is sufficiently refilled. This point in time may vary, depending on the tree's current water and nutrient budget, and may sometimes not be reached at all. However, parenchyma tissue may carry a generally different radiocarbon signal than the surrounding wood vessels and fibers, although both types of xylem are likely being fed by the same mixed NSC pool with the only difference being that fibers and vessels are annual and parenchyma cells are perennial and can undergo structural changes for an unknown number of years. Fractions of parenchyma tissue in between vessels and fibers might be easily overlooked during the sample dissection procedure, causing a potential shift in F14C towards younger ages. The assumed life span is based on the significant correlation found between the width of TPBs and the width of rings built 6 years later. However, the TPBs seem to be more variable in their 14C content than vessels and fibers, probably because their growth is not continuous but rather discontinuous during their life following the year of initialization. Presumably, parenchyma growth depends on NSC availability and the demand of water, as well as the supply of water by the soil. A significant post-cambial growth, i.e., widening of TPBs, could not be observed for 1973, 1981 and 1982, which is 2 years before the missing tree ring in 1975 and 1 and 2 years before the missing tree ring in 1983. This leads to the assumption that baobabs prioritize growth of fibers and vessels over storage enlargement, i.e., formation of new parenchyma cells. When there is not enough energy to invest in growth, baobabs seem to refrain from broadening the initial TPBs. However, the 10 TPBs prior to the missing ring in 1951 were all notably thickened; the reason for this missing ring remains unclear. The fact that TPBs accounting for 9 years (2006–2014) were not well developed in the outer part of the wood core potentially indicates a particularly high stress level over the last decade, which is in line with the meteorological data, i.e., increasing Tmax and decreasing precipitation (Fig. 4).
In sum, the relatively high fraction (69 %–88 %) (Chapotin et al., 2006c) and perennial character of parenchyma tissue in stem succulent baobabs lead to shifts of the atmospheric F14C signal in their wood. The relative content and lifetime of intraxylary parenchyma may be also considered when reconstructing atmospheric F14C from tree rings of other woody plant groups. Conifers were found to have the lowest parenchyma fractions, followed by angiosperm trees (including shrubs), woody climbers (lianas) and succulents (Morris et al., 2016). Major differences in the relative parenchyma content of angiosperms were also found between tropical species (36.2 ± 13.4 %) and temperate species (21.1 ± 7.9 %) (Morris et al., 2015); i.e., the atmospheric F14C signal in tree-ring cellulose may be altered in a species-specific and/or even plant-individual way. This, however, only plays a role in radiocarbon dating exercises utilizing the bomb peak with its dramatic changes over a few years.
4.3 Baobabs have annual growth rings, but visual recognition depends on tree-ring width and shaping of the TPBs
Besides the issues discussed above, the high number of radiocarbon dates allowed us to confirm the annual nature of the baobab growth zones. Very thin TPBs (≤ 0.1 mm) cannot not be identified as such with a solely wood anatomical approach. From this study, only xylem increments of ≥ 2 mm in combination with TPBs of ≥ 0.5 mm thickness can be considered an annual tree ring with confidence. Thus, a high number of radiocarbon dates is advisable to date time series of centuries-old baobab wood samples for climate reconstruction purposes not only because of varying external growth conditions but also because baobabs show varying growth rates during the different phases within their stem development (Breitenbach, 1985) and because very old individuals are in fact multi-stemmed conglomerates (e.g., Patrut et al., 2015b). However, annual time resolution appears to be possible particularly for wood sections with ample ring width and distinct TPBs. Here, we worked with fresh samples that were stored airtight and cool in the field to avoid distorting the original wood anatomical characteristics. When air-drying baobab, stem tissues shrink and in some cases reveal fissures between the TPBs and the part of a tree ring that is dominated by fibers and vessels. Assuming those fissures to mark actual tree-ring boundaries, individual growth rings for stable isotope and/or radiocarbon sampling have been peeled off for paleoclimatic studies (e.g., Woodborne et al., 2015, 2016). This sampling strategy waives the elaborate securing of freshly taken increment cores (see sampling strategy) at the expense of not obtaining exact growth increment data. Another constraint is that formation of more than one parenchyma band per year can easily introduce substantial uncertainty in tree-ring counting. In this study, three missing rings were detected in a time series of 65 years from a rather-well-grown young individual, suggesting that dating errors of 5 % or more have to be considered. It also has to be noted that the sampling procedure based on dry, deformed wood will inhibit the possibility to deduce intra-ring isotope signals, as from this study design. Nonetheless, precipitation reconstructions of good quality from δ18O of baobab tree-ring cellulose seem to be possible, as δ18Omean revealed highly significant correlations with the May–September period (Table 3).
4.4 Intra-annual stable isotope courses are in line with isotope fractionation theory
The intra-annual stable isotope courses were rather similar for both δ13C* and δ18O (Fig. 5). The first half of the tree ring was characterized by a majority of minimum values per year, whereas the second half comprised mainly maximum values. In terms of intra-annual δ13C* the observed seasonal course is very different to the recurring pattern described for deciduous tree species from temperate (Helle and Schleser, 2004) and tropical zones (Schollaen et al., 2013), where maximum δ13C values were generally observed during early wood formation indicative for the use of 13C-enriched reserves like starch at the beginning of the vegetation period. Conversely, the baobab's seasonal δ13C pattern generally showed low to lowest values at the beginning of each tree ring, which points to the use of other 13C-depleted, non-structural carbohydrates that might be originating from cortical photosynthesis (Kotina et al., 2017), producing assimilates with lighter δ13C compared to those from leaf photosynthesis (Cernusak et al., 2001). Additionally, the significant autocorrelation found for δ13C* strongly indicates the incorporation of previous years' carbon into tree-ring cellulose from carbohydrate reserves and/or from current carbohydrates derived from old stem respiratory CO2 recycled in cortical photosynthesis. Unlike for δ13C*, no autocorrelation was present in δ18O. A lack of significant autocorrelation in δ18O series from tree-ring cellulose is quite common (Treydte et al., 2007); however, this could not be expected here per se considering the relatively large water saving capacity of baobab stemwood potentially storing varying amounts of mixed precipitation waters from several monsoon seasons. Baobabs draw upon their water reserves when flushing leaves prior to the onset of the monsoon season (Chapotin et al., 2006b), which may lead to a very high annual turnover diminishing potential autocorrelation in δ18O of stem, i.e., source water. Despite the differences in autocorrelation, δ18O intra-ring values revealed a higher variability than those of δ13C*. This may point to the fact that the source water (precipitation) isotopic signature already does contain a climatic signal related to air temperature and precipitation amount, whereas δ13C of atmospheric CO2 does not. Highly variable rainfall amounts from pre- or post-monsoonal cyclones comprise correspondingly variable δ18O signatures (Fig. 1c). The significant correlation (, p<0.0001, n=56) between RWI and δ18Omin (occurring mainly at the beginning or within the first half of a tree ring) may be an indication for a significant influence of moisture supply on tree growth at the beginning of the wet season. Low δ18O of tree-ring cellulose values reflects higher rainfall and less evaporative 18O enrichment of leaf water, i.e., lower VPD evoking favorable growth conditions and vice versa.
Climate relevance of tree-ring δ13C is originating only from fractionation processes during photosynthetic CO2 uptake. Nonetheless, the overall high similarity between the average intra-annual δ13C* and δ18O courses suggests that stable isotope fractionations at leaf level (Farquhar et al., 1989; Roden et al., 2000; Kahmen et al., 2011), where water and carbon cycles meet during photosynthesis, are of predominant importance. In accordance with fractionation theories, maximum values at or close to the end of the tree ring likely do correspond to the end of the monsoon period, when relative humidity is decreasing and leaf-to-air vapor pressure deficit is rising, thus causing corresponding leaf water 18O enrichment to increase while enzymatic discrimination against 13C during photosynthetic uptake of atmospheric CO2 is declining.
4.5 Intra-annual stable isotope courses are indicative for years with heavy rainfall events from cyclones
Starting first with low to intermediate values, intra-ring δ13C* and δ18O of the mid-section either increase or decline in dry or wet years, respectively. In particular, heavy pre-monsoonal rainfall from spring cyclones did not significantly alter start and end values but apparently causes a distinct decline in the mid-section of the general stable isotope course (Fig. 5c). In general, pre-monsoonal precipitation can help to replenish the stem water reserves during and/or shortly after leaf flush, and the monsoonal influence on the baobabs' ecophysiology was reflected by the significant correlations between δ18Omin and RWI with April and May rainfall (Table 3, Fig. 7a, b). However, strongly depleted δ18O signatures of heavy pre-monsoonal rainfall events are not imprinted into the intra-ring δ18O pattern as a deep, short-term dip but rather lead to a distinct trough in the mid-section. This points to a lagging or more indirect influence by diluting the δ18O signature of the stem water and/or by causing wetter (micro-)site conditions evoking reduced leaf water 18O enrichment but also increased 13C discrimination at the beginning and during the main monsoon season. Note that isotopically lighter values for the mid-section were observed also with increasing number of observations per year. δ18O courses from wide tree rings with more than seven observations per year revealed a short-term mid-section decline (Fig. 5b, right) resulting from higher monsoon precipitation as suggested by the significant correlations with RWI (Table 3). The expression of this dip within the intra-annual δ18O pattern is relatively weak; however, it may hamper the clear detection of unknown spring cyclonic events in potential future reconstruction studies.
Only 2 years (1948, 2004) with autumn cyclones bringing more than 90 mm of rain could be investigated (Fig. 6a). Due to the lack of replication, a conclusive evaluation of intra-ring stable isotope response to post-monsoonal cyclones is not possible, especially with respect to the observed indistinct δ13C* courses (Fig. 6a, left). However, δ18O seems to largely respond to autumn cyclones with a strong decline to very low values in the last quarter of the intra-ring course. When compared to the average seasonal δ18O course and those for years with spring cyclones, intra-ring δ18O values of years with autumn cyclones were found above in the first half and below at the end of the tree ring (Fig. 6a, right). Furthermore, post-monsoonal rain seems to prolong the growing season as indicated by the rather wide tree ring of 1948 that provided eight intra-annual isotope samples. Based on theoretical considerations and studies on temporal dynamics of soil water stable isotopes at the soil–plant–atmosphere interface of the critical zone (Sprenger et al., 2017; Treydte et al., 2014), the conspicuously strong increase in δ18O towards the very end might reflect evaporative 18O enrichment of the soil water taken up by the tree and/or effects due to increased evapotranspiration at leaf level during the prolonged growing period after a heavy autumn rainfall event. In sum, the intra-ring stable isotope courses are modified by pre- and post-monsoonal rainfall events from cyclones. Significantly negative correlations of δ18Omax with cloud cover for the previous October and the current April also indicate an influence of non-monsoonal precipitation (Table 3, Fig. 7c). Hence, baobabs might well take advantage of rainfall outside their actual vegetation period.
4.6 Increased stable isotope values in the mid-section of intra-annual courses reflect low monsoon precipitation
A clearer picture with more constrained intra-ring isotope patterns was obtained for dry years with less than 50 % of the average monsoon precipitation and no pre- or post-monsoonal cyclones. Except for the year 2000, all intra-ring δ13C* and δ18O courses reveal increased values for the mid-section of a tree ring (Fig. 6b). The very low variability of δ18O in rain or fog within and between different monsoon seasons (Table 1) suggests that the observed δ18O pattern has to be largely attributed to the effects of fractionation processes at leaf level. Vapor pressure deficit between leaves and ambient air is higher during a dry monsoon season, causing enhanced 18O enrichment in leaf water and lower stomatal conductance with decreased leaf internal CO2 concentrations causing photosynthetic 13C discrimination to decline. Decreasing values at the very end of an intra-annual stable isotope course can be observed in δ13C* of 3 years (1974, 2000, 2001) and in all but one δ18O year (2003), which might be attributed to the decreasing transpiration and reduced photosynthesis towards the end of the growing period, i.e., during leaf senescence. δ13C* of 1968, 1972 and 2003 did not reach the high values in the tree rings of the other dry years; however, in the second half they continue to increase (at a slower rate) to the end. This trend may or may not be an artifact of the low resolution (three values per year) causing a more or less linear increasing trend (see Fig. 6a). The year 2000 showed an unexpected early decline in δ18O, as seen for spring storm years, which might be due to above normal precipitation from a fall storm in October 1999. However, the δ18O time series shows no autocorrelation, and this finding could not be verified for other years because the tree rings following other fall storms were only half as wide and the signal is probably lost in the resolution.
This study comprises 62 years of highly resolved inter- and intra-annual analyses of F14C, δ13C and δ18O on baobab tree-ring cellulose. The fairly high number of radiocarbon dates has confirmed that baobabs have annual growth rings that are separated by terminal parenchyma bands. However, unambiguous visual recognition of tree rings was possible only for xylem increments of ≥ 2 mm in combination with TPBs of ≥ 0.5 mm thickness. Situated in Oman, the baobab F14C values were expected to fit the post-bomb atmospheric curve NH3. However, they were found notably lower than NH3 and even lower than SH3 around the atomic bomb peak period (1964–1967). A certain spread between tree species and sites is well known (cf. Fig. 3; such large offsets are uncommon but have been reported earlier, e.g., Chakraborty et al., 1994). Potential consequences should be considered when dating tropical trees with indistinct growth pattern and high abundance of parenchyma tissue. Normally, three radiocarbon samples placed within the bomb peak period result in a very precise dating of tree rings. But, with the bomb peak represented by clearly lower F14C values compared to the corresponding atmospheric zone, a lower sampling rate on parenchyma-rich tree species like the baobab can lead to a misinterpretation of the time series' resolution and duration. Usually, external factors like fossil fuel dilution from neighboring industrial or urban areas are considered likely causes for deviations of tree-ring data from atmospheric F14C. However, the large extent of the F14C offset observed here for A. digitata, with its unique stem anatomy, puts the focus on potential tree physiological explanations, namely carbohydrate turnover and longevity of certain stem tissue (parenchyma). A conceptual modeling approach suggests that the observed shift between atmospheric and baobab F14C is caused by a mixture of non-structural carbohydrates fueling baobab wood formation with 85 % contribution from a fast cycling and 15 % from a slow cycling pool with respective annual renewal rates of 95 % (renewal fast cycling pool) and 5 % (renewal slow cycling pool). Furthermore, radiocarbon dates of terminal parenchyma bands, marking the visual tree-ring boundaries, were found to be at least up to 1.6 years younger than their corresponding tree ring. This can be explained by the well-known ongoing restructuring and/or formation of new intraxylary parenchyma tissue years after initial tree-ring formation. Stem succulent baobabs have a very high fraction of long-lived parenchyma tissue that is not only arranged in tangential bands but also irregularly dispersed within the wood modifying its F14C values. Hence, the relative content and lifetime of intraxylary parenchyma may be also considered when reconstructing atmospheric F14C from tree rings of other woody plant groups or when dating particularly parenchyma-rich succulent plants. Nonetheless, the high-resolution bomb peak dating approach together with visual inspection of TPBs allows the development of precise time series useful for investigating the ecophysiology of baobabs and allows the assessment of their vulnerability to recent climate change. Well-dated longer time series for paleoclimatic reconstructions are still more difficult to establish, although annual time resolution appears to be possible for wood sections with ample ring width and distinct TPBs. Tree-ring width indices (RWI) and stable isotope ratios have revealed significant climate sensitivity. RWI and intra-ring δ18Omin correlated well with each other (r = –0.6, p<0.0001) and with precipitation amount for the period from pre-monsoon May to the end of the monsoon season in September–October. Intra-annual stable isotope courses were found to be rather similar for both δ13C and δ18O. The distinct pattern seems indicative for years with heavy rainfall events from pre-monsoonal cyclones. Rain from post-monsoonal cyclones may also be recorded; however, a conclusive evaluation was not possible because there were only 2 years of observation. Years with particularly low monsoon rain were reflected by increased stable isotope values in the mid-section of intra-annual courses. When intra-ring isotope signals, as from this study, cannot be deduced, precipitation reconstructions of good quality from cellulose δ18O seem to be possible, as δ18Omean revealed highly significant correlations with the May–September period. Overall, in the baobab archive δ18O appeared to be a good climate proxy followed by tree-ring width and δ13C.
The data produced in this publication are available from the PANGAEA database (https://doi.pangaea.de/10.1594/PANGAEA.905626, last access: 21 April 2019, Slotta et al., 2019.).
FS, FR, GH and LW conceived the study. Field work for this study was conducted by FS and FR. FS and LW performed the F14C analyses. FS and GH performed chemical extraction of tree-ring cellulose and measurements of stable isotope ratios of carbon and oxygen. GH and FS prepared the manuscript with contributions from all co-authors.
The authors declare that they have no conflict of interest.
We are grateful to the Director General of Nature Conservation Suleiman Bin Nasser Al Akhzami and the Director of Biodiversity Thuraya Said Al-Sariri at the Ministry of Environment and Climate affairs for granting us permission (permit no. 11/2015) to sample baobab trees in Wadi Hinna and to the ministry employees involved in the collection process for their field assistance. Furthermore, we would like to extend our gratitude to Bernhard Pracejus and Frank Mattern (Sultan Qaboos University) for collaboration. Frank Mattern and his wife Sarah as well as Annette Kossler and Heidemarie Pettauer also assisted in the field. We are also grateful to Quan Hua for making available published radiocarbon data. We would further like to thank Silvia Bollhalder and Philip Gautschi (ETH Zurich) for their support in the laboratory and Andreas Hendrich for his help with the figure layout. We acknowledge the fruitful discussions with Arne Ramisch and thank Daniel Balanzategui and Patrick Lynch for the linguistic revision of an earlier version of the manuscript. Furthermore, we thank the reviewers Guaciara M. Santos and Supryo Chakraborty for their valuable criticism. This study was supported with 14C measurements performed at the Laboratory of Ion Beam Physics (Hans-Arno Synal) at ETH Zurich.
This research has been supported by the DFG (grant nos. HE3089/10-1 and RI 809/32-1).
The article processing charges for this open-access publication were covered by the Helmholtz Centre Potsdam – GFZ German Research Centre for Geosciences.
This paper was edited by Aninda Mazumdar and reviewed by Guaciara Santos and Supriyo Chakraborty.
Anchukaitis, K. J., Evans, M. N., Wheelwright, N. T., and Schrag, D. P.: Stable isotope chronology and climate signal calibration in neotropical montane cloud forest trees, J. Geophys. Res.-Biogeo., 113, 1–17, https://doi.org/10.1029/2007JG000613, 2008.
Andreu-Hayles, L., Santos, G. M., Herrera-Ramirez, D. A., Martin-Fernandez, J., Ruiz-Carrascal, D., Boza-Espinoza, T. E., Fuentes, A. F., and Jorgensen, P. M.: Matching denrochronological dates with the southern hemisphere C-14 bomb curve to confirm annual tree rings in Pseudolmedia rigida from Bolivia, Radiocarbon, 57, 1–13, https://doi.org/10.2458/azu_rc.57.18192, 2015.
Araguas, L. A., Danesi, P., Froehlich, K., and Rozanski, K.: Global monitoring of the isotopic composition of precipitation, J. Radio. Nucl. Ch. Ar., 205, 189–200, 1996.
Baker, J. C. A., Hunt, S. F. P., Clerici, S. J., Newton, R. J., Bottrell, S. H., Leng, M. J., Heaton, T. H. E., Helle, G., Argollo, J., Gloor, M., and Brienen, R. J. W.: Oxygen isotopes in tree rings show good coherence between species and sites in Bolivia, Glob. Planet. Change, 133, 298–308, https://doi.org/10.1016/j.gloplacha.2015.09.008, 2015.
Baker, J. C. A., Gloor, M., Spracklen, D. V., Arnold, S. R., Tindall, J. C., Clerici, S. J., Leng, M. J., and Brienen, R. J. W.: What drives interannual variation in tree ring oxygen isotopes in the Amazon?, Geophys. Res. Lett., 43, 11831–11840, https://doi.org/10.1002/2016gl071507, 2016.
Baker, J. C. A., Santos, G. M., Gloor, M., and Brienen, R. J. W.: Does Cedrela always form annual rings? Testing ring periodicity across South America using radiocarbon dating, Trees-Struct. Funct., 31, 1999–2009, https://doi.org/10.1007/s00468-017-1604-9, 2017.
Becker, J. J., Sandwell, D. T. , Smith, W. H. F., Braud, J., Binder, B., Depner, J., Fabre, D., Factor, J., Ingalls, S.,Kim, S-H., Ladner, R., Marks, K., Nelson, S., Pharaoh, A., Sharman, G., Trimmer, R., Von Rosenburg, J., Wallace, G., and Weatherall., P.: Global Bathymetry and Elevation Data at 30 Arc Seconds Resolution: SRTM30_PLUS, Mar. Geod., 32, 355–371, 2009.
Beramendi-Orosco, L. E., Johnson, K. R., Noronha, A. L., Gonzalez-Hernandez, G., and Villanueva-Diaz, J.: High precision radiocarbon concentrations in tree rings from Northeastern Mexico: A new record with annual resolution for dating the recent past, Quaternary Geochronol., 48, 1–6, https://doi.org/10.1016/j.quageo.2018.07.007, 2018.
Boysen, B. M. M., Evans, M. N., and Baker, P. J.: delta O-18 (Murphy et al., 1997) Conifer Agathis robusta Records ENSO-Related Precipitation Variations, Plos One, 9, e102336, https://doi.org/10.1371/journal.pone.0102336, 2014.
Brehm, N., Bayliss, A., Christl, M., Synal, H.-A., Adolphi, F., Beer, J., Kromer, B., Muscheler, R., Solanki, S. K., Usoskin, I., Bleicher, N., Bollhalder, S., Tyers, C., and Wacker, L.: Eleven-year solar cycles over the last millennium revealed by radiocarbon in tree rings, Nat. Geosci., 14, 10–15, https://doi.org/10.1038/s41561-020-00674-0, 2021.
Breitenbach, F. v.: Aantekening oor die groeitempo van aangeplante kremetartbome (Adansonia digitata) en opmerkinge ten opsigte van lewenstyd, groeifases en genetiese variasie van die spesie, Dendrologiese Tydskrif, 5, 1–21, 1985.
Brienen, R. J. W., Wanek, W., and Hietz, P.: Stable carbon isotopes in tree rings indicate improved water use efficiency and drought responses of a tropical dry forest tree species, Trees, 25, 103–113, https://doi.org/10.1007/s00468-010-0474-1, 2011.
Brienen, R. J. W., Helle, G., Pons, T. L., Guyot, J.-L., and Gloor, M.: Oxygen isotopes in tree rings are a good proxy for Amazon precipitation and El Nino-Southern Oscillation variability, P. Natl. Acad. Sci. USA, 109, 16957–16962, https://doi.org/10.1073/pnas.1205977109, 2012.
Brienen, R. J. W., Hietz, P., Wanek, W., and Gloor, M.: Oxygen isotopes in tree rings record variation in precipitation delta O-18 and amount effects in the south of Mexico, J. Geophys. Res.-Biogeo., 118, 1604–1615, https://doi.org/10.1002/2013jg002304, 2013.
Bronk Ramsey, C.: Methods for summarizing radiocarbon datasets, Radiocarbon, 59, 1809–1833, 2017.
Bunn, A., Korpela, M., Biondi, F., Campole, F., Mérian, P., Qeadan, F., Zang, C., Pucha-Cofrep, D., and Wernicke, J.: dplR: Dendrochronology Program Library in R, Computer Program downloaded from webpage: https://r-forge.r-project.org/projects/dplr/, 2018.
Cernusak, L. A., Marshall, J. D., Comstock, J. P., and Balster, N. J.: Carbon isotope discrimination in photosynthetic bark, Oecologia, 128, 24–35, https://doi.org/10.1007/s004420100629, 2001.
Chakraborty, S., Ramesh, R., and Krishnaswami, S.: Air sea exchange of CO2 in the Gulf of Kutch, northern Arabian Sea based on bomb-carbon in corals and tree rings, Proceedings of the Indian Academy of Sciences – Earth and Planetary Sciences, 103 329–340, https://doi.org/10.1007/BF02839542, 1994.
Chakraborty, S., Dutta, K., Bhattacharyya, A., Nigam, M., Schuur, E. A. G., and Shah, S. K.: Atmospheric 14C Variability Recorded in Tree Rings from Peninsular India: Implications for Fossil Fuel CO2 Emission and Atmospheric Transport, Radiocarbon, 50, 321–330, https://doi.org/10.1017/S0033822200053467, 2008.
Chapotin, S. M., Razanameharizaka, J. H., and Holbrook, N. M.: Water relations of baobab trees (Adansonia spp. L.) during the rainy season: does stem water buffer daily water deficits?, Plant Cell Environ., 29, 1021–1032, https://doi.org/10.1111/j.1365-3040.2005.01456.x, 2006a.
Chapotin, S. M., Razanameharizaka, J. H., and Holbrook, N. M.: Baobab trees (Adansonia) in Madagascar use stored water to flush new leaves but not to support stomatal opening before the rainy season, New Phytol., 169, 549–559, https://doi.org/10.1111/j.1469-8137.2005.01618.x, 2006b.
Chapotin, S. M., Razanameharizaka, J. H., and Holbrook, N. M.: Abiomechanical perspective on the role of large stem volume and high water content in baobab trees (Adansonia spp.; Bombacaceae), Am. J. Bot., 93, 1251–1264, https://doi.org/10.3732/ajb.93.9.1251, 2006c.
Charabi, Y., Al-Yahyai, S., and Gastli, A.: Evaluation of NWP performance for wind energy resource assessment in Oman, Renew. Sustain. Energ. Rev., 15, 1545–1555, 2011
Clark, I., Fritz, P., Quinn, O., Rippon, P., Nash, H., and Al-Said, S.: Modern and fossil groundwater in an arid environment: a look at the hydrogeology of southern Oman, Proc. Symp. on Isotope Techniques in Water Resources Development, IAEA (Int. At. Energy Agency), Vienna, 1987, 167–187,
Dansgaard, W.: Stable isotopes in precipitation, Tellus, 16, 437–468, 1964.
Evans, M. N. and Schrag, D. P.: A stable isotope-based approach to tropical dendroclimatology, Geochim. Cosmochim. Ac., 68, 3295–3305, 2004.
Farquhar, G. D. and Cernusak, L. A.: Ternary effects on the gas exchange of isotopologues of carbon dioxide, Plant Cell Environ., 35, 1221–1231, https://doi.org/10.1111/j.1365-3040.2012.02484.x, 2012.
Farquhar, G. D., O'Leary, M. H., and Berry, J. A.: On the Relationship between Carbon Isotope Discrimination and the Intercellular Carbon Dioxide Concentration in Leaves, Austr. J. Plant Physiol., 9, 121–137, https://doi.org/10.1071/PP9820121 1982.
Farquhar, G. D., Ehleringer, J. R., and Hubick, K. T.: Carbon isotope discrimination and photosynthesis, Annu. Rev. Plant Physiol. Plant Mol. Biol., 40, 503–537, 1989.
Fichtler, E., Clark, D. A., and Worbes, M.: Age and Long-term Growth of Trees in an Old-growth Tropical Rain Forest: Based on Analyses of Tree Rings and 14C, Biotropica, 35, 306–317, 2003.
Fichtler, E., Helle, G., and Worbes, M.: Stable-carbon isotope time series from tropical tree rings indicate a precipitation signal, Tree-Ring Res., 66, 35–49, 2010.
Fisher, J. B.: Wound healing by exposed secondary xylem in Adansonia (Bombacaceae), IAWA Bulletin N.S., 2, 193–199, https://doi.org/10.1163/22941932-90000732, 1981.
Fritts, H. C.: Tree Rings and Climate, Academic Press Inc., London, UK, 1976.
Guy, G. L.: Adansonia digitata and its rate of growth in relation to rainfall in south central Africa., Proceedings and transactions – Rhodesia Scientific Association, 54, 68–84, 1970.
Harris, I., Osborn, T. J., Jones, P., and Lister, D.: Version 4 of the CRU TS monthly high-resolution gridded multivariate climate dataset, Sci Data, 7, 109, https://doi.org/10.1038/s41597-020-0453-3, 2020.
Hartl-Meier, C., Zang, C., Büntgen, U., Esper, J., Rothe, A., Gottlein, A., Dirnbock, T., and Treydte, K.: Uniform climate sensitivity in tree-ring stable isotopes across species and sites in a mid-latitude temperate forest, Tree Physiol., 35, 4–15, https://doi.org/10.1093/treephys/tpu096, 2015.
Helle, G., Pauly, M., Balanzategui, D., Heinrich, I., and Schollän, K.: Stable isotope signatures of wood, its constituents and methods of cellulose extraction, in: Stable Isotopes in Tree Rings: Inferring Physiological, Climatic and Environmental Responses, edited by: Siegwolf, R., Brooks, J. R., Roden, J., and Saurer, M., Springer Nature, Zürich, 2021.
Holmes, R. L.: Computer-assisted quality control in tree-ring dating and measurement, Tree-Ring Bull., 43, 68–78, 1983.
Helle, G., and Schleser, G. H.: Beyond CO2-fixation by Rubisco – an interpretation of C-13/C-12 variations in tree rings from novel intra-seasonal studies on broad-leaf trees, Plant Cell Environ., 27, 367–380, 2004.
Hildebrandt, A. and Eltahir, E. A. B.: Forest on the edge: Seasonal cloud forest in Oman creates its own ecological niche, Geophys. Res. Lett., 33, L11401, https://doi.org/10.1029/2006GL026022, 2006.
Hogg, A. G., Hua, Q., Blackwell, P. G., Niu, M., Buck, C. E., Guilderson, T. P., Heaton, T. J., Palmer, J. G., Reimer, P. J., Reimer, R. W., Turney, C. S. M., and Zimmerman, S. R. H.: SHcal13 Southern Hemisphere Calibration, 0-50,000 Years Cal Bp, Radiocarbon, 55, 1889–1903, https://doi.org/10.2458/azu_js_rc.55.16783, 2013.
Hua, Q., Barbetti, M., Jacobsen, G. E., Zoppi, U., and Lawson, E. M.: Bomb radiocarbon in annual tree rings from Thailand and Australia, Nucl. Instrum. Meth. B, 172, 359–365, https://doi.org/10.1016/s0168-583x(00)00147-6, 2000.
Hua, Q., Barbetti, M., Zoppi, U., Chapman, D. M., and Thomson, B.: Bomb radiocarbon in tree rings from northern new south Wales, Australia: Implications for dendrochronology, atmospheric transport, and air-sea exchange of CO2, Radiocarbon, 45, 431–447, https://doi.org/10.1017/s0033822200032793, 2003.
Hua, Q., Barbetti, M., and Zoppi, U.: Radiocarbon in annual tree rings from Thailand during the pre-bomb period, AD 1938–1954, Radiocarbon, 46, 925–932, https://doi.org/10.1017/s0033822200035979, 2004.
Hua, Q., Barbetti, M., and Rakowski, A. Z.: Atmospheric Radiocarbon for the Period 1950–2010, Radiocarbon, 55, 2059–2072, https://doi.org/10.2458/azu_js_rc.v55i2.16177, 2013.
IPCC: Climate Change 2007: Impacts, Adaptions and Vulnerability. Contribution of working group II to the Fourth Assessment Report of the Intergovernmental Panel on Climate Change, Cambridge, UK, 2007.
IPCC: Climate Change 2013: The Physical Science Basis. Contribution of Working Group I to the Fifth Assessment Report of the Intergovernmental Panel on Climate Change, Cambridge, UK, New York, NY, USA, 2013.
Johansson, M.: The baobab tree in Kondoa Irangi Hills, Tanzania, Minor field studies, Swedish University of Agricultural Sciences, International Office, Uppsala, Sweden, 74, https://stud.epsilon.slu.se/12738/1/johansson_m_171019.pdf, 1999.
Kahmen, A., Sachse, D., Arndt, S. K., Tu, K. P., Farrington, H., Vitousek, P. M., and Dawson, T. E.: Cellulose δ18O is an index of leaf-to-air vapor pressure difference (VPD) in tropical plants, P. Natl. Acad. Sci. USA, 108, 1981–1986, https://doi.org/10.1073/pnas.1018906108, 2011.
Kotina, E. L., Oskolski, A. A., Tilney, P. M., and Van Wyk, B. E.: Bark anatomy of Adansonia digitata L. (Malvaceae), Adansonia, 39, 31–40, https://doi.org/10.5252/a2017n1a3, 2017.
Kürschner, H., Hein, P., Kilian, N., and Hubaishan, M. A.: The Hybantho durae-Anogeissetum dhofaricae ass. nova-phytosociology, structure and ecology of an endemic South Arabian forest community, Phytocoenologia, 34, 569–612, 2004.
Kürschner, W. M.: Leaf stomata as biosensors of palaeoatmospheric CO2 levels, LPP Contribut. Ser., 5, 1–152, 1996
Kwarteng, A. Y., Dorvlo, A. S., and Vijaya Kumar, G. T.: Analysis of a 27-year rainfall data (1977–2003) in the Sultanate of Oman, Int. J. Climatol., 29, 605–617, https://doi.org/10.1002/joc.1727, 2009.
Lambs, L., Gurumurthy, G. P., and Balakrishna, K.: Tracing the sources of water using stable isotopes: first results along the Mangalore-Udupi region, south-west coast of India, Rapid Commun. Mass Sp., 25, 2769–2776, https://doi.org/10.1002/rcm.5104, 2011.
Laumer, W., Andreu, L., Helle, G., Schleser, G. H., Wieloch, T., and Wissel, H.: A novel approach for the homogenization of cellulose to use micro-amounts for stable isotope analyses, Rapid Commun. Mass Sp., 23, 1934–1940, https://doi.org/10.1002/Rcm.4105, 2009.
Lefevre, J. C., Gillot, P. Y., Cardellini, C., Gresse, M., Lesage, L., Chiodini, G., and Oberlin, C.: Use of the radiocarbon activity deficit in vegetation as a sensor of CO2 soil degassing: example from la Solfatara (Naples, Southern Italy), Radiocarbon, 60, 549–560, https://doi.org/10.1017/rdc.2017.76, 2018.
Linares, R., Santos, H. C., Brandes, A. F. N., Barros, C. F., Lisi, C. S., Balieiro, F. C., and de Faria, S. M.: Exploring the C-14 bomb peak with tree rings of tropical species from the Amazon rain forest, Radiocarbon, 59, 303–313, https://doi.org/10.1017/rdc.2017.10, 2017.
Morris, H., Plavcova, L., Cvecko, P., Fichtler, E., Gillingham, M., Martinez Cabrera, H., McGlinn, D., Wheeler, E., Zheng, J., Ziemińska, K., and Jansen, S.: A global analysis of parenchyma tissue fractions in secondary xylem of seed plants, New Phytol., 209, 1553–1565, https://doi.org/10.1111/nph.13737, 2016.
Murphy, J. O., Lawson, E. M., Fink, D., Hotchkis, M. A. C., Hua, Q., Jacobsen, G. E., Smith, A. M., and Tuniz, C.: 14C AMS measurements of the bomb pulse in N- and S-Hemisphere tropical trees, Nucl. Instrum. Meth. B, 123, 447–450, 1997.
Němec, M., Wacker, L., Hajdas, I., and Gäggeler, H.: Alternative methods for cellulose preparation for AMS measurement, Radiocarbon, 52, 1358–1370, https://doi.org/10.1017/S0033822200046440, 2010.
Neumann, K., Schoch, W., Détienne, P., and Schweingruber, F. H.: Woods of the Sahara and Sahel: an anatomical atlas/Bois du Sahara et du Sahel: atlas d'anatomie/Hölzer der Sahara und des Sahel: ein anatomischer Atlas, edited by: Birmensdorf, E. F. W., Haupt Verlag, Bern, 2001.
Nydal, R. and Lövseth, K.: Tracing bomb 14C in the atmosphere 1962–1980, J. Geophys. Res., 88, 3621–3642, https://doi.org/10.1029/JC088iC06p03621, 1983.
Ohashi, S., Durgante, F. M., Kagawa, A., Kajimoto, T., Trumbore, S. E., Xu, X. M., Ishizuka, M., and Higuchi, N.: Seasonal variations in the stable oxygen isotope ratio of wood cellulose reveal annual rings of trees in a Central Amazon terra firme forest, Oecologia, 180, 685–696, https://doi.org/10.1007/s00442-015-3509-x, 2016.
Patrut, A., Woodborne, S., Patrut, R. T., Hall, G., Rakosy, L., Von Reden, K. F., Lowy, D., and Margineanu, D.: Radiocarbon dating of African baobabs with two false cavities: The investigation of Luna tree, Stud. Univ. Babes-Bolyai Chem., 60, 7–20, 2015a.
Patrut, A., Woodborne, S., von Reden, K. F., Hall, G., Hofmeyr, M., Lowy, D. A., and Patrut, R. T.: African Baobabs with False Inner Cavities: The Radiocarbon Investigation of the Lebombo Eco Trail Baobab, Plos One, 10, e0117193, https://doi.org/10.1371/journal.pone.0117193, 2015b.
Patrut, A., Woodborne, S., Patrut, R. T., Rakosy, L., Hall, G., Ratiu, I.-A., and Von Reden, K. F.: Final Radiocarbon Investigation of Platland Tree, the Biggest African Baobab, Studia Universitatis Babeş-Bolyai Chemia, 62, 347–354, https://doi.org/10.24193/subbchem.2017.2.27, 2017.
Patrut, A., Woodborne, S., Patrut, R. T., Rakosy, L., Lowy, D. A., Hall, G., and von Reden, K. F.: The demise of the largest and oldest African baobabs, Nature Plant., 4, 423–426, https://doi.org/10.1038/s41477-018-0170-5, 2018.
Pedgley, D. E.: Cyclones along the Arabian coast, Weather, 24, 456–470, 1969.
Pons, T. L. and Helle, G.: Identification of anatomically non-distinct annual rings in tropical trees using stable isotopes, Trees-Struct. Funct., 25, 83–93, https://doi.org/10.1007/s00468-010-0527-5, 2011.
Poussart, P. F., Evans, M. N., and Schrag, D. P.: Resolving seasonality in tropical trees: multi-decade, high-resolution oxygen and carbon isotope records from Indonesia and Thailand, Earth Planet. Sc. Lett., 218, 301–316, 2004.
Rajput, K. S.: Formation of Unusual Tissue Complex in the Stem of Adansonia digitata Linn. (Bombacaceae), Beiträge zur Biologie der Pflanzen, 73, 331–342, 2004.
Reimer, P. J., Brown, T. A., and Reimer, R. W.: Discussion: Reporting and calibration of post-bomb 14C data, Radiocarbon, 46, 1299–1304, 2004.
Richardson, A. D., Carbone, M. S., Keenan, T. F., Czimczik, C. I., Hollinger, D. Y., Murakami, P., Schaberg, P. G., and Xu, X.: Seasonal dynamics and age of stemwood nonstructural carbohydrates in temperate forest trees, New Phytol., 197, 850–861, https://doi.org/10.1111/nph.12042, 2013.
Richardson, A. D., Carbone, M. S., Huggett, B. A., Furze, M. E., Czimczik, C. I., Walker, J. C., Xu, X., Schaberg, P. G., and Murakami, P.: Distribution and mixing of old and new nonstructural carbon in two temperate trees, New Phytol., 206, 590–597, 2015.
Riedel, F., Henderson, A. C. G., Heussner, K. U., Kaufmann, G., Kossler, A., Leipe, C., Shemang, E., and Taft, L.: Dynamics of a Kalahari long-lived mega-lake system: hydromorphological and limnological changes in the Makgadikgadi Basin (Botswana) during the terminal 50 ka, Hydrobiologia, 739, 25–53, https://doi.org/10.1007/s10750-013-1647-x, 2014.
Robertson, I., Loader, N. J., Froyd, C. A., Zambatis, N., Whyte, I., and Woodborne, S.: The potential of the baobab (Adansonia digitata L.) as a proxy climate archive, Appl. Geochem., 21, 1674–1680, https://doi.org/10.1016/j.apgeochem.2006.07.005, 2006.
Roden, J. S., Lin, G. G., and Ehleringer, J. R.: A mechanistic model for interpretation of hydrogen and oxygen isotope ratios in tree-ring cellulose, Geochim. Cosmochim. Ac., 64, 21–35, 2000.
Sass-Klaassen, U., Leuschner, H. H., Buerkert, A., and Helle, G.: Tree-ring analysis of Juniperus excelsa from northern Oman mountains., TRACE, Tree Rings in Archeology, Climatology and Ecology, Riga, Latvia, 99–108, 2008.
Scheidegger, Y., Saurer, M., Bahn, M., and Siegwolf, R.: Linking stable oxygen and carbon isotopes with stomatal conductance and photosynthetic capacity: a conceptual model, Oecologia, 125, 350–357, https://doi.org/10.1007/s004420000466, 2000.
Schneider, U., Becker, A., Finger, P., Meyer-Christoffer, A., Rudolf, B., and Ziese, M.: GPCC Full Data Reanalysis Version 7.0 at 0.5∘: Monthly Land-Surface Precipitation from Rain-Gauges built on GTS-based and Historic Data, Edition 7.0, Global Precipitation Climatology Centre (GPCC, available at: http://gpcc.dwd.de/, last access: 17 October 2015) at Deutscher Wetterdienst 2015.
Schollaen, K., Heinrich, I., Neuwirth, B., Krusic, P. J., D'Arrigo, R. D., Karyanto, O., and Helle, G.: Multiple tree-ring chronologies (ring width, delta C-13 and delta O-18) reveal dry and rainy season signals of rainfall in Indonesia, Quat. Sci. Rev., 73, 170–181, https://doi.org/10.1016/j.quascirev.2013.05.018, 2013.
Slotta, F., Helle, G., Heussner, K. U., Shemang, E., and Riedel, F.: Baobabs on Kubu Island, Botswana – A dendrochronological multi-parameter study using ring width and stable isotopes (δ13C, δ18O), Erdkunde, 71, 23–43, https://doi.org/10.3112/erdkunde.2017.01.02, 2017.
Slotta, F., Wacker, L., Riedel, F., Heussner, K.-U., Hartmann, K., and Helle, G.: Normalized 14C activity ratios (F14C) of an African baobab (Adansonia digitata) tree from Oman [data set], PANGAEA, https://doi.pangaea.de/10.1594/PANGAEA.905626, last access 21 April 2019.
Smith, K. T.: An organismal view of dendrochronology, Dendrochronologia, 26, 185–193, https://doi.org/10.1016/j.dendro.2008.06.002, 2008.
Spicer, R.: Symplasmic networks in secondary vascular tissues: parenchyma distribution and activity supporting long-distance transport, J. Exp. Bot., 65, 1829–1848, https://doi.org/10.1093/jxb/ert459, 2014.
Sreeush, M. G., Valsala, V., Pentakota, S., Prasad, K. V. S. R., and Murtugudde, R.: Biological production in the Indian Ocean upwelling zones – Part 1: refined estimation via the use of a variable compensation depth in ocean carbon models, Biogeosciences, 115, 1895–1918, https://doi.org/10.5194/bg-15-1895-2018, 2018.
Strauch, G., Al-Mashaikhi, K. S., Bawain, A., Knoller, K., Friesen, J., and Muller, T.: Stable H and O isotope variations reveal sources of recharge in Dhofar, Sultanate of Oman, Isot. Environ. Health S., 50, 475–490, https://doi.org/10.1080/10256016.2014.961451, 2014.
Sookdeo, A., Kromer, B., Büntgen, U., Friedrich, M., Friedrich, R., Helle, G., Pauly, M., Nievergelt, D., Reinig, F., Treydte, K., Synal, H.-A., and Wacker, L.: Quality Dating: A Well-Defined Protocol Implemented at ETH for High-Precision 14C-Dates Tested on Late Glacial Wood, Radiocarbon, 62, 891–899, https://doi.org/10.1017/RDC.2019.132, 2019.
Sprenger, M., Tetzlaff, D., and Soulsby, C.: Soil water stable isotopes reveal evaporation dynamics at the soil–plant–atmosphere interface of the critical zone, Hydrol. Earth Syst. Sci., 21, 3839–3858, https://doi.org/10.5194/hess-21-3839-2017, 2017.
Swart, E. R.: Age of the Baobab Tree, Nature, 198, 708–709, https://doi.org/10.1038/198708b0, 1963.
Szejner, P., Wright, W. E., Babst, F., Belmecheri, S., Trouet, V., Leavitt, S. W., Ehleringer, J. R., and Monson, R. K.: latitudinal gradients in tree-ring stable carbon and oxygen isotopes reveal differential climate influences of the North American Monsoon System, J. Geophys. Res.-Biogeo., 121, 1978–1991, https://doi.org/10.1002/2016JG003460, 2016.
Takahashi, T., Sutherland, S. C., Wanninkhof, R., Sweeney, C., Feely, R. A., Chipman, D. W., Hales, B., Friederich, G., Chavez, F., Sabine, C., Watson, A., Bakker, D. C. E., Schuster, U., Metzl, N., Yoshikawa-Inoue, H., Ishii, M., Midorikawa, T., Nojiri, Y., Körtzinger, A., Steinhoff, T., Hoppema, M., Olafsson, J., Arnarson, T. S., Tilbrook, B., Johannessen, T., Olsen, A., Bellerby, R., Wong, C. S., Delille, B., Bates, N. R., and de Baar, H. J. W.: Climatological mean and decadal change in surface ocean pCO2, and net sea–air CO2 flux over the global oceans, Deep-Sea Res. Pt. II, 56, 554–577, https://doi.org/10.1016/j.dsr2.2008.12.009, 2009.
Treydte, K., Frank, D., Esper, J., Andreu, L., Bednarz, Z., Berninger, F., Boettger, T., D'Alessandro, C. M., Etien, N., Filot, M., Grabner, M., Guillemin, M. T., Gutierrez, E., Haupt, M., Helle, G., Hilasvuori, E., Jungner, H., Kalela-Brundin, M., Krapiec, M., Leuenberger, M., Loader, N. J., Masson-Delmotte, V., Pazdur, A., Pawelczyk, S., Pierre, M., Planells, O., Pukiene, R., Reynolds-Henne, C. E., Rinne, K. T., Saracino, A., Saurer, M., Sonninen, E., Stievenard, M., Switsur, V. R., Szczepanek, M., Szychowska-Krapiec, E., Todaro, L., Waterhouse, J. S., Weigl, M., and Schleser, G. H.: Signal strength and climate calibration of a European tree-ring isotope network, Geophys. Res. Lett., 34, L24302, https://doi.org/10.1029/2007gl031106, 2007.
Treydte, K., Boda, S., Graf Pannatier, E., Fonti, P., Frank, D., Ullrich, B., Saurer, M., Siegwolf, R., Battipaglia, G., Werner, W., and Gessler, A.: Seasonal transfer of oxygen isotopes from precipitation and soil to the tree ring: source water versus needle water enrichment, New Phytol., 202, 772–783, https://doi.org/10.1111/nph.12741, 2014.
Turnbull, J. C., Fletcher, S. E. M., Ansell, I., Brailsford, G. W., Moss, R. C., Norris, M. W., and Steinkamp, K.: Sixty years of radiocarbon dioxide measurements at Wellington, New Zealand: 1954–2014, Atmos. Chem. Phys., 17, 14771–14784, https://doi.org/10.5194/acp-17-14771-2017, 2017.
Turney, C. S. M., Palmer, J., Maslin, M. A., Hogg, A., Fogwill, C. J., Southon, J., Fenwick, P., Helle, G., Wilmshurst, J. M., McGlone, M., Bronk Ramsey, C., Thomas, Z., Lipson, M., Beaven, B., Jones, R. T., Andrews, O., and Hua, Q.: Global Peak in Atmospheric Radiocarbon Provides a Potential Definition for the Onset of the Anthropocene Epoch in 1965, Sci. Rep. 8, 3293, https://doi.org/10.1038/s41598-018-20970-5, 2018.
van der Sleen, P., Groenendijk, P., and Zuidema, P. A.: Tree-ring delta O-18 in African mahogany (Entandrophragma utile) records regional precipitation and can be used for climate reconstructions, Glob. Planet. Change, 127, 58–66, https://doi.org/10.1016/j.gloplacha.2015.01.014, 2015.
van der Sleen, P., Zuidema, P. A., and Pons, T. L.: Stable isotopes in tropical tree rings: theory, methods and applications, Funct. Ecol., 31, 1674–1689, https://doi.org/10.1111/1365-2435.12889, 2017.
Vicente-Serrano, S. M., Beguería, S., and López-Moreno, J. I.: A multiscalar drought index sensitive to global warming: the standardized precipitation evapotranspiration index, J. Clim., 23, 1696–1718, 2010a.
Vicente-Serrano, S. M., Beguería, S., López-Moreno, J. I., Angulo, M., and El Kenawy, A.: A new global 0.5 gridded dataset (1901–2006) of a multiscalar drought index: comparison with current drought index datasets based on the Palmer Drought Severity Index, J. Hydrometeorol., 11, 1033–1043, 2010b.
Vicente-Serrano, S. M., Van der Schrier, G., Beguería, S., Azorin-Molina, C., and Lopez-Moreno, J.-I.: Contribution of precipitation and reference evapotranspiration to drought indices under different climates, J. Hydrol., 526, 42–54, 2015.
Wacker, L., Bonani, G., Friedrich, M., Hajdas, I., Kromer, B., Němec, M., Ruff, M., Suter, M., Synal, H., and Vockenhuber, C.: MICADAS: routine and high-precision radiocarbon dating, Radiocarbon, 52, 252–262, 2010a.
Wacker, L., Němec, M., and Bourquin, J.: A revolutionary graphitisation system: Fully automated, compact and simple, Nucl. Inst. Method. Phys. Res. Sect. B, 268, 931–934, https://doi.org/10.1016/j.nimb.2009.10.067, 2010b.
Walters, K. R. and Sjoberg, W. F.: The Persian Gulf Region. A Climatological Study, Air Force Environmental Technical Applications Center Scott AFB, IL, Technical Note, Accession Number: ADA222654, 1–73, https://apps.dtic.mil/sti/pdfs/ADA222654.pdf 1990.
White, J. W. C., Vaughn, B. H., and Michel, S. E.: Stable Isotopic Composition of Atmospheric Carbon Dioxide (13C and 18O) from the NOAA ESRL Carbon Cycle Cooperative Global Air Sampling Network, 1990–2014, Version: 2015-10-26, ftp://aftp.cmdl.noaa.gov/data/trace_gases/co2c13/flask/surface/README_surface_flask_co2c13.html (last access: 28 November 2015), University of Colorado, Institute of Arctic and Alpine Research (INSTAAR), 2015.
Wickens, G. E.: The uses of the baobab (Adansonia digitata L.) in Africa, in: Browse in Africa: The current state of knowledge, edited by: Le Houérou, H. N., International Livestock Centre for Africa, Addis Ababa, 1979.
Wickens, G. E. and Lowe, P.: The Baobabs: Pachycauls of Africa, Madagascar and Australia, Springer Verlag, London, UK, 2008.
Wieloch, T., Helle, G., Heinrich, I., Voigt, M., and Schyma, P.: A novel device for batch-wise isolation of α-cellulose from small-amount wholewood samples, Dendrochronologia, 29, 115–117, https://doi.org/10.1016/j.dendro.2010.08.008, 2011.
Witt, G. B., English, N. B., Balanzategui, D., Hua, Q., Gadd, P., Heijnis, H., and Bird, M. I.: The climate reconstruction potential of Acacia cambagei (gidgee) for semi-arid regions of Australia using stable isotopes and elemental abundances, J. Arid Environ., 136, 19–27, https://doi.org/10.1016/j.jaridenv.2016.10.002, 2015.
Woodborne, S., Hall, G., Robertson, I., Patrut, A., Rouault, M., Loader, N. J., and Hofmeyr, M.: A 1000-Year Carbon Isotope Rainfall Proxy Record from South African Baobab Trees (Adansonia digitata L.), PLoS ONE, 10, e0124202, https://doi.org/10.1371/journal.pone.0124202, 2015.
Woodborne, S., Gandiwa, P., Hall, G., Patrut, A., and Finch, J.: A Regional Stable Carbon Isotope Dendro-Climatology from the South African Summer Rainfall Area, PLoS ONE, 11, e0159361, https://doi.org/10.1371/journal.pone.0159361, 2016.
Woodborne, S., Hall, G., Jones, C. W., Loader, N. J., Patrut, A., Patrut, R. T., Robertson, I., Winkler, S. R., and Winterbach, C. W.: A 250-year isotopic proxy rainfall record from southern Botswana, Stud. Univ. Babes-Bolyai Chem., 63, 109–123, https://doi.org/10.24193/subbchem.2018.1.09, 2018.
Worbes, M. and Junk, W. J.: Dating tropical trees by means of 14C from bomb tests, Ecology, 70, 503–507, 1989.
Wushiki, H.: 18O 16O and D H of the Meteoric Waters in South Arabia, Journal of the Mass Spectrometry Society of Japan, 39, 239—250, 1991.
Xu, C. X., Sano, M., Yoshimura, K., and Nakatsuka, T.: Oxygen isotopes as a valuable tool for measuring annual growth in tropical trees that lack distinct annual rings, Geochem. J., 48, 371–378, https://doi.org/10.2343/geochemj.2.0312, 2014.