the Creative Commons Attribution 4.0 License.
the Creative Commons Attribution 4.0 License.
 | 13 Dec 2021
Nitrogen restricts future sub-arctic treeline advance in an individual-based dynamic vegetation model
Adrian Gustafson
Paul A. Miller
Robert G. Björk
Stefan Olin
Benjamin Smith
Arctic environmental change induces shifts in high-latitude plant community composition and stature with implications for Arctic carbon cycling and energy exchange. Two major components of change in high-latitude ecosystems are the advancement of trees into tundra and the increased abundance and size of shrubs. How future changes in key climatic and environmental drivers will affect distributions of major ecosystem types is an active area of research. Dynamic vegetation models (DVMs) offer a way to investigate multiple and interacting drivers of vegetation distribution and ecosystem function. We employed the LPJ-GUESS tree-individual-based DVM over the Torneträsk area, a sub-arctic landscape in northern Sweden. Using a highly resolved climate dataset to downscale CMIP5 climate data from three global climate models and two 21st-century future scenarios (RCP2.6 and RCP8.5), we investigated future impacts of climate change on these ecosystems. We also performed model experiments where we factorially varied drivers (climate, nitrogen deposition and [CO2]) to disentangle the effects of each on ecosystem properties and functions. Our model predicted that treelines could advance by between 45 and 195 elevational metres by 2100, depending on the scenario. Temperature was a strong driver of vegetation change, with nitrogen availability identified as an important modulator of treeline advance. While increased CO2 fertilisation drove productivity increases, it did not result in range shifts of trees. Treeline advance was realistically simulated without any temperature dependence on growth, but biomass was overestimated. Our finding that nitrogen cycling could modulate treeline advance underlines the importance of representing plant–soil interactions in models to project future Arctic vegetation change.
- Article
(1473 KB) - Full-text XML
-
Supplement
(3331 KB) - BibTeX
- EndNote


In recent decades, the Arctic has been observed becoming greener (Epstein et al., 2012; Bhatt et al., 2010). Causes include an increased growth and abundance of shrubs (Myers-Smith et al., 2011; Elmendorf et al., 2012; Forbes et al., 2010), increased vegetation stature associated with a longer growing season, and poleward advance of the Arctic treeline (Bjorkman et al., 2018). Shrubs protruding through the snow and treeline advance alter surface albedo and energy exchange with potential feedback to the climate system (Chapin et al., 2005; Sturm, 2005; Serreze and Barry, 2011; Zhang et al., 2013, 2018). Warming and associated changes in high-latitude ecosystems have implications for carbon cycling through increased plant productivity, species shifts (Chapin et al., 2005; Zhang et al., 2014) and increased soil organic matter (SOM) decomposition with subsequent loss of carbon to the atmosphere. Studies of the Arctic carbon balance have shown that the region has been a weak sink in the past (Mcguire et al., 2009, 2012; Bruhwiler et al., 2021; Virkkala et al., 2021), although uncertainty is substantial, and it is difficult to determine accurately the strength of this sink. How climate and environmental changes will affect the relative balance between the carbon uptake, i.e. photosynthesis, and release processes, i.e. autotrophic and heterotrophic respiration, will determine whether the Arctic will be a source or a sink of carbon in the future.
Forest–tundra ecotones constitute vast transition zones where abrupt changes in ecosystem functioning occur (Hofgaard et al., 2012). While a generally accepted theory of what drives treeline advance is currently lacking, several alternative explanations exist. Firstly, direct effects of rising temperatures have been thoroughly discussed (e.g. Rees et al., 2020; Hofgaard et al., 2019; Körner, 2015; Chapin, 1983). On the global scale, treelines have been found to correlate well with a 6–7 ∘C mean growing season ground temperature (Körner and Paulsen, 2004) and could thus be expected to follow isotherm movement as temperatures rise. A global study of alpine treeline advance in response to warming since 1900 showed that 52 % of treelines had advanced while the other half were stationary (47 %), with only occasional instances of retreat (1 %) (Harsch et al., 2009). Similar patterns have been observed on the circumarctic scale, although latitudinal treelines might be expected to shift more slowly than elevational treelines due to dispersal constraints (Rees et al., 2020). As trees close to the treeline often show ample storage of non-structural carbohydrates (Hoch and Körner, 2012), it has been suggested that a minimum temperature requirement for wood formation, rather than productivity, might constrain treeline position (Körner, 2003, 2015; Körner et al., 2016).
Secondly, it has been hypothesised that indirect effects of warming might be as important as or more important than direct effects (Sullivan et al., 2015; Chapin, 1983). For example, rising air and soil temperatures might induce increased mineralisation and plant availability of nitrogen in the litter layer and soil (Chapin, 1983). Increased nitrogen uptake could in turn enhance plant productivity and growth (Dusenge et al., 2019). Increased nitrogen uptake as a consequence of increased soil temperatures or nitrogen fertilisation has been shown to increase seedling winter survival among seedlings of mountain birch (Betula pubescens ssp. tortuosa) – the main treeline species in Scandinavia (Weih and Karlsson, 1999; Karlsson and Weih, 1996).
Thirdly, experiments exposing plants and ecosystems to elevated CO2 often show increased plant productivity and biomass increase, especially in trees (Ainsworth and Long, 2005). Terrestrial biosphere models generally emulate the same response (Hickler et al., 2008; Smith et al., 2014; Piao et al., 2013). Although difficult to measure in field experiments, the treeline position seems unresponsive to increased [CO2] alone (Holtmeier and Broll, 2007). Whether treelines are responsive to increased productivity through CO2 fertilisation might yield insights into whether treelines are limited by their productivity, i.e. photosynthesis, versus their ability to utilise assimilated carbon, i.e. wood formation. However, the extent to which increased [CO2] drives long-term tree and shrub encroachment and growth remains poorly studied.
For treeline migration to occur, it is not only the growth and increased stature of established trees but also the recruitment and survival of new individuals beyond the existing treeline that is important (Holtmeier and Broll, 2007). Seedlings of treeline species are sometimes observed above the treeline, especially in sheltered microhabitats (Hofgaard et al., 2009; Sundqvist et al., 2008). However, these individuals often display stunted growth and can be decades old, although age declines with elevation (Hofgaard et al., 2009). The suitability of the tundra environment for trees to establish and grow taller will thus be an important factor for the rate of treeline advance (Cairns and Moen, 2004). Interspecific competition and herbivory are known to be important modulators of range shifts of trees (Cairns and Moen, 2004; Van Bogaert et al., 2011; Grau et al., 2012). For instance, the presence of shrubs has been shown to limit tree seedling growth (Weih and Karlsson, 1999; Grau et al., 2012), likely as a consequence of competition with tree seedlings for nitrogen. Comparisons of a model incorporating only bioclimatic limits to species distributions and more ecologically complex models have also suggested interspecific plant competition to be important for range shifts of trees (Epstein et al., 2007; Scherrer et al., 2020). Thus, as a fourth factor, shrub–tree interactions could be important when predicting range shifts such as changing treeline positions under future climates. Rising temperatures have been suggested as the dominant driver of increased shrub growth, especially where soil moisture is not limiting (Myers-Smith et al., 2015, 2018). Furthermore, a changed precipitation regime, especially increased winter snowfall, might promote establishment of trees and shrubs through the insulating effects of snow cover with subsequent increases in seedling winter survival (Hallinger et al., 2010).
A narrow focus on a single variable, e.g. summer temperature, or a few driving variables may lead to overestimation of treeline advance in future projections (Hofgaard et al., 2019). Dynamic vegetation models (DVMs) offer a way to investigate the influence of multiple and interacting drivers on vegetation and ecosystem processes. Model predictions may be compared with observations of local treelines and ecotones to validate assumptions embedded in the models and to interpret causality in observed dynamics and patterns. DVMs also offer a way to extrapolate observable local phenomena to broader scales, such as that of circumarctic shifts in the forest–tundra ecotone and the responsible drivers. Here, we examine a sub-arctic forest–tundra ecotone that has undergone spatial shifts over recent decades (Callaghan et al., 2013), previously attributed to climate warming. Adopting an individual-based DVM incorporating a detailed description of vegetation composition and stature and nitrogen cycle dynamics, we apply the model at a high spatial resolution to compare observed and predicted recent treeline dynamics, and we project future vegetation change and its implications for carbon balance and biogeophysical vegetation–atmosphere feedbacks. In addition, we conduct three model experiments to separate and interpret the impact of driving factors (climate, nitrogen deposition, [CO2]) on vegetation in a forest–tundra ecotone in Sweden's sub-arctic north.
2.1 Study site
Abisko Scientific Research Station (ANS; 68∘21′ N, 18∘49′ E), situated in the mountain-fringed Abisko Valley near Lake Torneträsk in northern Sweden, has a long record of ecological and climate research. The climate record dates back to 1913 and is still ongoing. The area is situated in a rain shadow and is thus relatively dry despite its proximity to the ocean (Callaghan et al., 2013). The forests in the lower parts of the valley consist mostly of mountain birch Betula pubescens ssp. czerepanovii, which is also dominant at the treeline. Treeline elevation in the Abisko Valley ranges between 600–800 m above sea level (a.s.l.) (Callaghan et al., 2013). Other tree types in lower parts of the valley are Sorbus aucuparia and Populus tremula, along with small populations of Pinus sylvestris, which are assumed to be refugia species from warmer periods during the Holocene (Berglund et al., 1996). Soils consist of glaciofluvial till and sediments. An extensive summary of previous studies and the environment around Lake Torneträsk can be found in Callaghan et al. (2013).
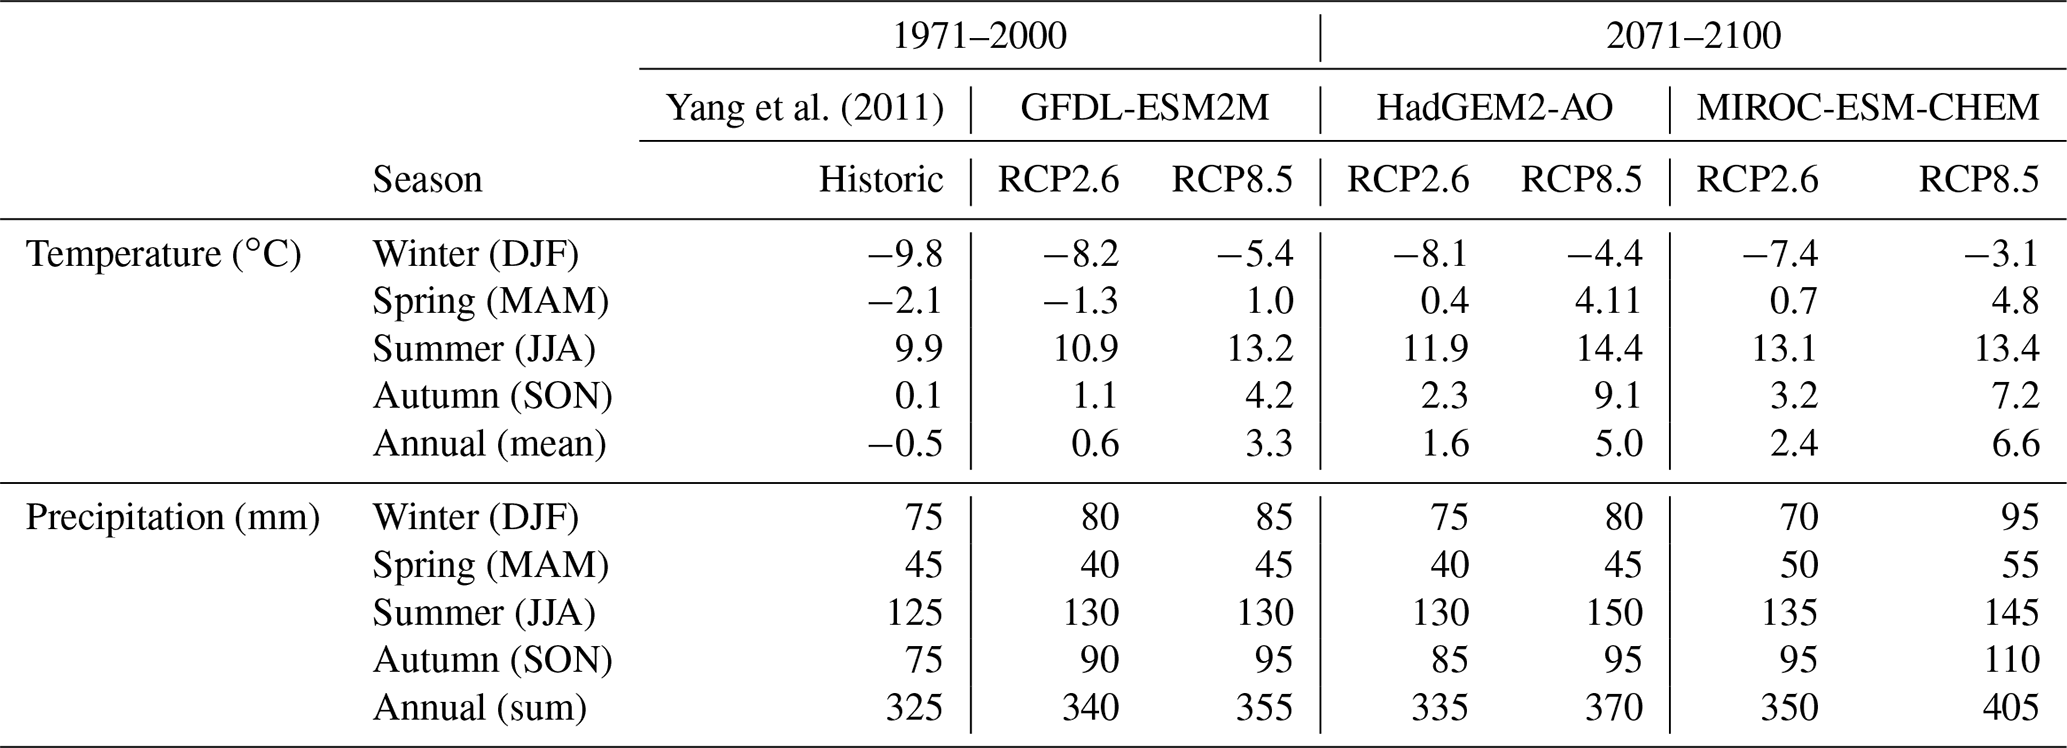
Our study domain covers an area of approximately 85 km2 and extends from Mount Nuolja in the west to the mountain Nissončorru in the east (see Fig. 2). The northern part of our study domain is bounded by Lake Torneträsk. The mean annual temperature was −0.5 ± 0.9 ∘C for the 30-year period 1971–2000 (Fig. 1, Table 2), with January being the coldest month (−10.2 ± 3.5 ∘C) and July the warmest (11.3 ± 1.4 ∘C). Mean annual precipitation was 323 ± 66 mm for the same reference period. This reference period was chosen as it is the last one in the dataset by Yang et al. (2011).
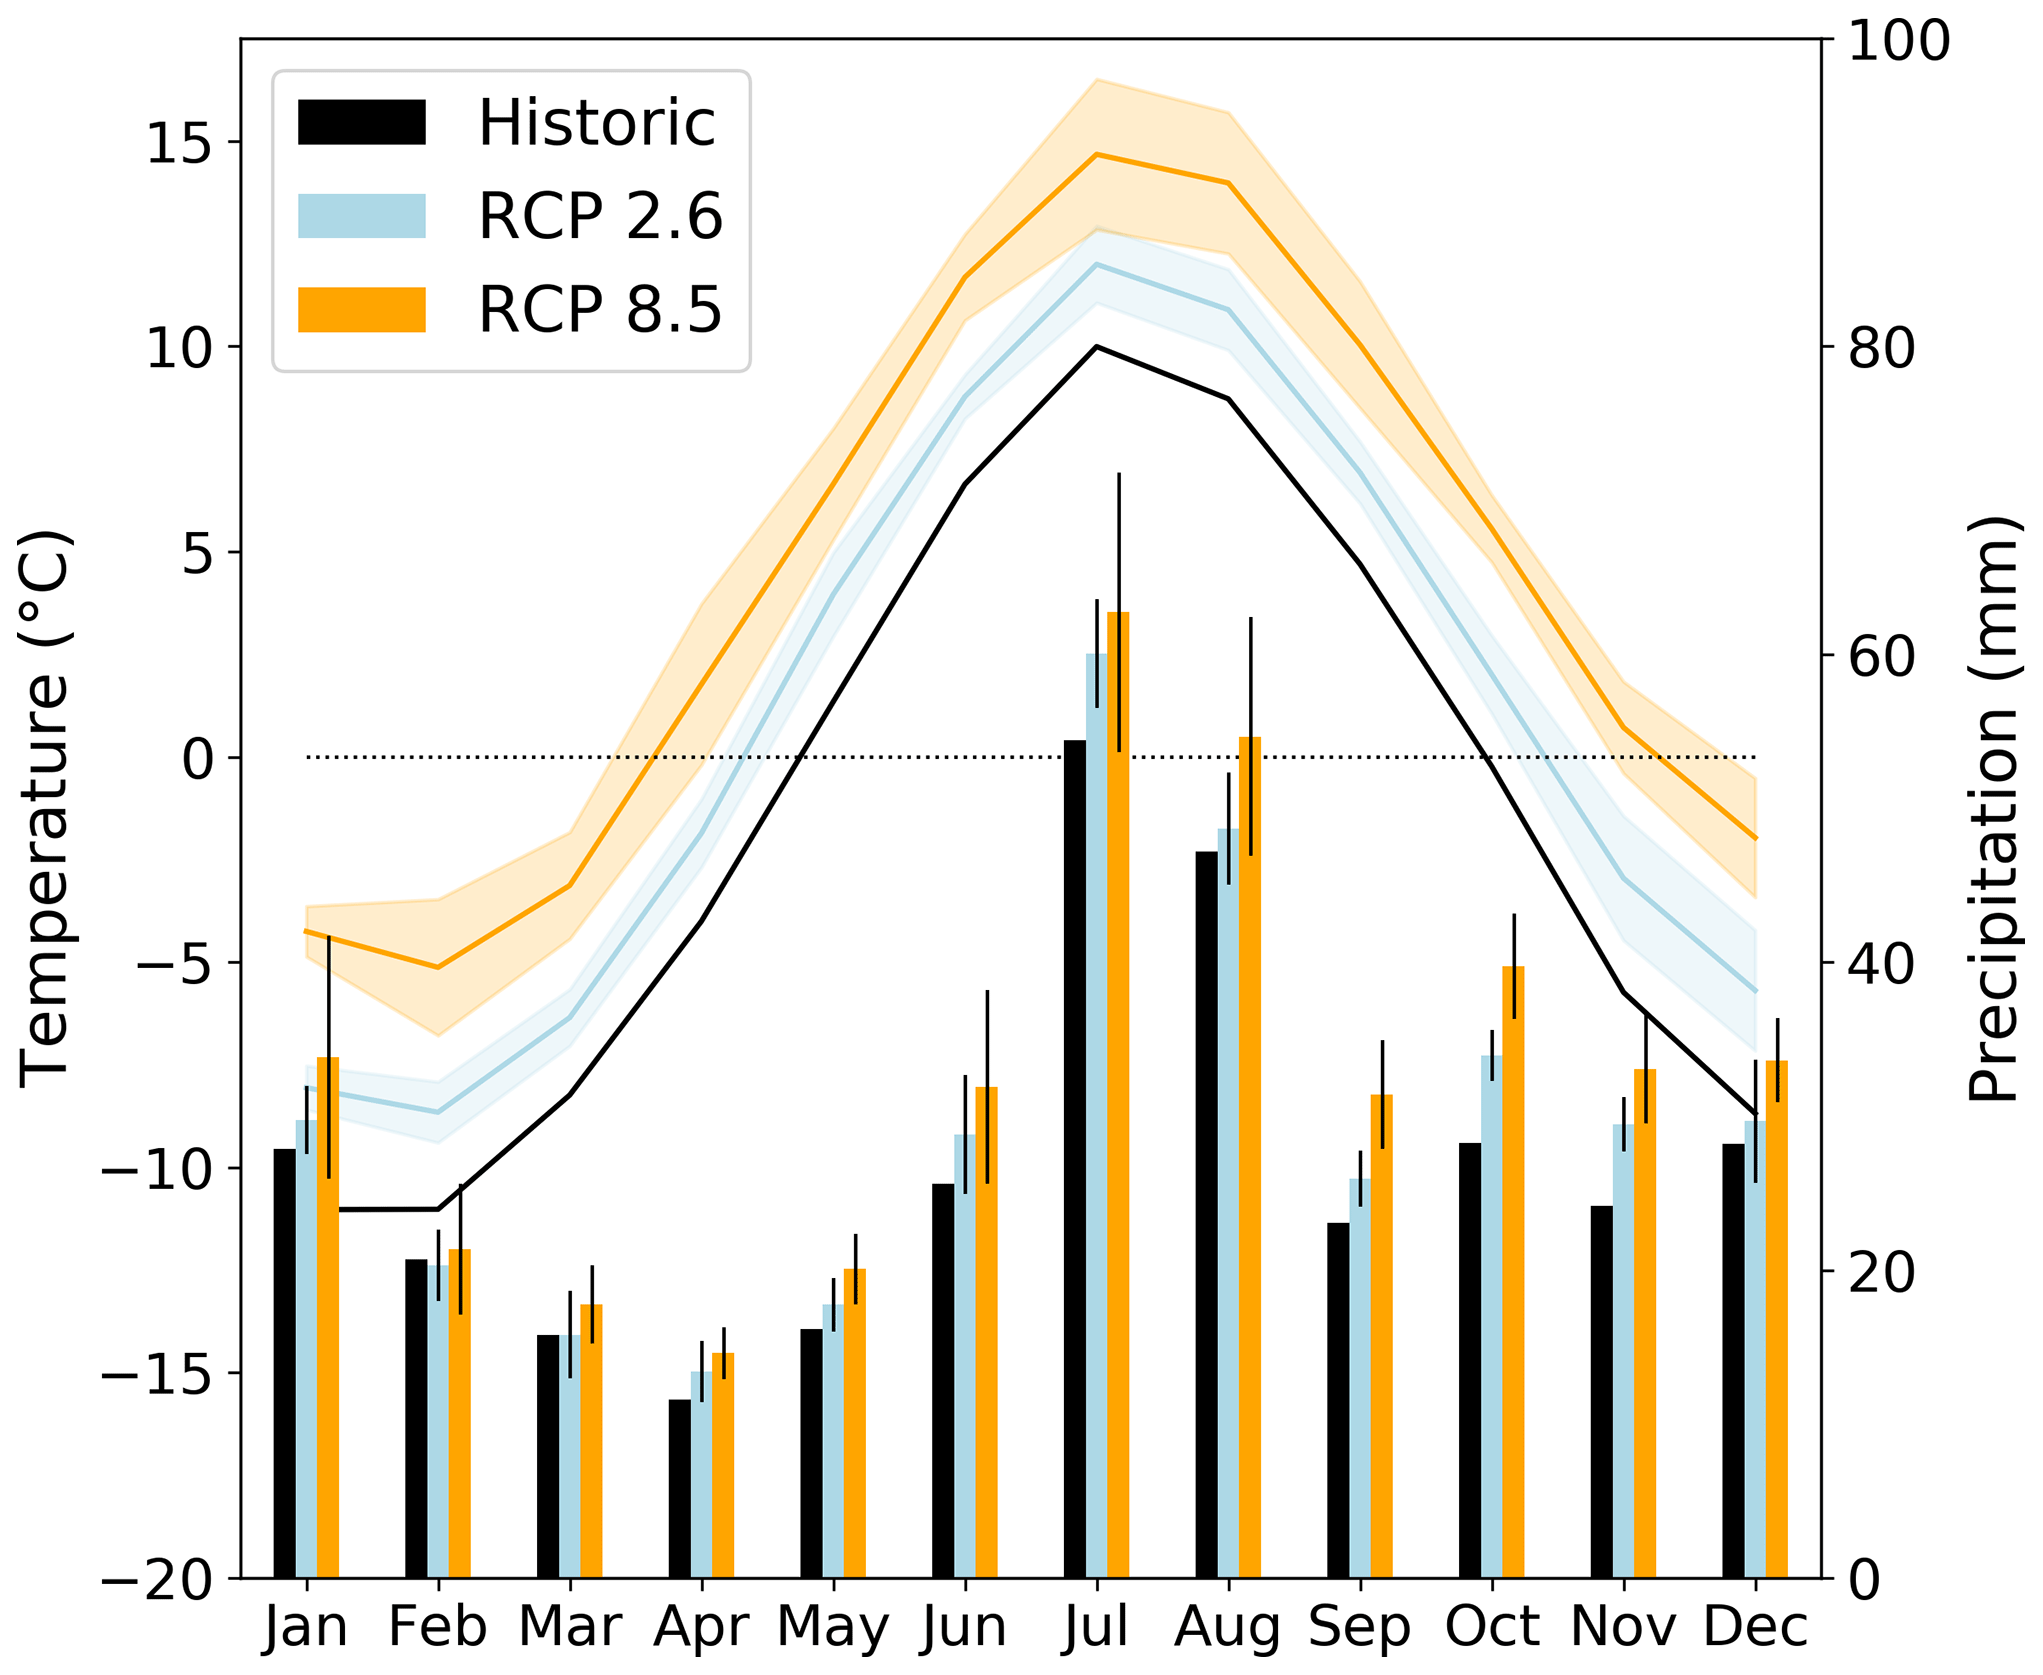
Figure 1Historic (1971–2000) and projected (2071–2100) temperature (left) and precipitation (right) variability at the Abisko study area. The shaded areas (temperature) and narrow bars (precipitation) mark ±1 standard deviation uncertainty in the three CMIP5 multi-model means for RCP2.6 and RCP8.5.
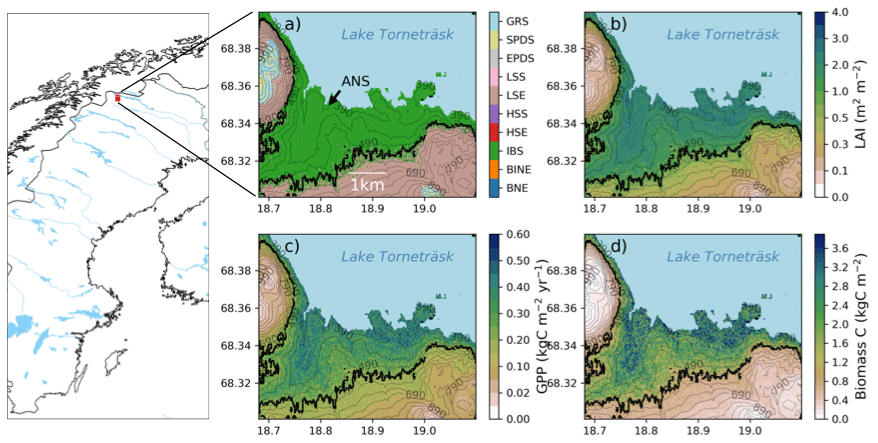
Figure 2Map of Sweden and Scandinavia with a red square marking the study area. The location of the Abisko Scientific Research Station (ANS) is marked in panel (a). Panels on the right show the study area in more detail and the modelled forest–tundra ecotone for the historic period (1990–2000). (a) Dominant PFT (BNE – boreal needle leaved evergreen tree; BINE – boreal shade-intolerant needle leaved tree; IBS – boreal shade-intolerant broadleaved tree; HSE – tall evergreen shrub; HSS – tall summergreen shrub; LSE – low evergreen shrub; LSS – low summergreen shrub; EPDS – evergreen prostrate dwarf shrub; SPDS – summergreen prostrate dwarf shrub; GRS – grasses) in the ecotone and total ecosystem, (b) LAI (m2 m−2), (c) productivity (GPP; kgC m−2 yr−1), and (d) plant biomass carbon density (kgC m−2). The black line in panels (a)–(d) shows the modelled treeline position. Numbers on the contour lines mark the elevation in metres above sea level. Data source for map: Natural Earth.
2.2 Ecosystem model
We used the LPJ-GUESS DVM as the main tool for our study (Smith et al., 2001, 2014; Miller and Smith, 2012). LPJ-GUESS is one of the most ecologically detailed models of its class, suitable for regional- and global-scale studies of climate impacts on vegetation, employing an individual- and patch-based representation of vegetation composition and structure. It simulates the dynamics of plant populations and ecosystem carbon, nitrogen and water exchanges in response to external climate forcing. Biogeophysical processes (e.g. soil hydrology and evapotranspiration) and plant physiological processes (e.g. photosynthesis, respiration, carbon allocation) are interlinked and represented mechanistically. Canopy fluxes of carbon dioxide and water vapour are calculated by a coupled photosynthesis and stomatal conductance scheme based on the approach of BIOME3 (Haxeltine and Prentice, 1996). Photosynthesis is a function of air temperature, incoming short-wave or photosynthetically active radiation, [CO2], and water and nutrient availability. Autotrophic respiration has three components – maintenance, growth and leaf respiration. Tissue maintenance respiration is dependent on soil and air temperature for root and above-ground respiration, respectively, along with a dependency on tissue C : N stoichiometry. All assimilated carbon that is not consumed by autotrophic respiration, less a 10 % flux to reproductive organs, is allocated to leaves; fine roots; and, for woody plant functional types (PFTs), sapwood, following a set of prescribed allometric relationships for each PFT, resulting in biomass, height and diameter growth (Sitch et al., 2003). Consequently, an individual in the model is assumed to be carbon limited when autotrophic respiration equals or exceeds the amount of carbon assimilated by photosynthesis. A chronically negative carbon balance at the individual level eventually results in plant death.
The model assumes the presence of seeds in all grid cells, meaning that simulated PFTs can establish once the climate is favourable, as defined by each PFT's predefined bioclimatic limits. The competition between neighbouring plant individuals for light, water and nutrients, affecting establishment, growth and mortality, is modelled explicitly. Competition for light and nutrients is assumed to be asymmetric; i.e. individuals with taller canopies or larger root systems will be advantaged in the capture of resources under scarcity. Water uptake is divided equally among individuals according to the water availability and the fraction of each PFT's roots occupying each soil layer. Individuals of the same age co-occurring in a local neighbourhood or patch and belonging to the same PFT (see below) are assumed to be identical to each other. Decomposition of plant litter and cycling of soil nutrients are represented by a CENTURY-based soil biogeochemistry module, applied at the patch scale (Smith et al., 2014). Biological N fixation is represented by an empirical relationship between annual evapotranspiration and nitrogen fixation (Cleveland et al., 1999). LPJ-GUESS does not currently incorporate PFT-specific nitrogen fixation, which for instance may be associated with species that form root nodules, such as Alnus spp. Additional inputs of nitrogen to the system occur through nitrogen deposition or fertilisation. Nitrogen is lost from the system through leaching, gaseous emissions from soils or wildfires (Smith et al., 2014).
For this study we employed LPJ-GUESS version 4.0 (Smith et al., 2014), enhanced with arctic-specific features (Miller and Smith, 2012; Wania et al., 2009). The combined model incorporates an updated set of arctic PFTs (described below), improved soil physics and a multi-layered dynamic snow scheme, allowing for simulation of permafrost and frozen ground. The soil scheme includes 15 equally distributed soil layers constituting a total soil depth of 1.5 m.
Vegetation in the model is represented by cohorts of individuals interacting in local communities or patches and belonging to a number of PFTs that are distinguished by growth form (tree, shrub, herbaceous), life history strategies (shade tolerant or intolerant) and phenology class (evergreen or summergreen). Herbaceous PFTs are represented as a dynamic, aggregate cover of ground layer vegetation in each patch. In this study 11 PFTs were implemented (see Table S2.1 in the Supplement for a description of included PFTs; see Table S2.2 in the Supplement for parameter values associated with each PFT). Out of these, three were tree PFTs: boreal needle-leaved evergreen tree (BNE), boreal shade-intolerant evergreen tree (BINE) and boreal shade-intolerant broad-leaved summergreen tree (IBS). Corresponding tree species present in the Torneträsk region include Picea abies (BNE), Pinus sylvestris (BINE), Betula pubescens ssp. czerepanovii, Populus tremula and Sorbus aucuparia (IBS). Following Wolf et al. (2008), shrub PFTs with different statures were implemented as follows: tall summergreen shrub (HSS) and tall evergreen shrub (HSE), corresponding to Salix spp. (HSS) and Juniperus communis (HSE), and low summergreen shrub (LSS) and low evergreen shrub (LSE) such as Betula nana (LSS) and Empetrum nigrum (LSE). We also included prostrate shrubs and two herbaceous PFTs.
Grid cell vegetation and biogeophysical properties are calculated by averaging over a number of replicate patches, each nominally 0.1 ha in area and subject to the same climate forcing. No assumptions are made about how the patches are distributed within a grid cell; they are a statistical sample of equally possible disturbance/demographic histories across the landscape of a grid cell. Within each patch, the establishment, growth and mortality of tree or shrub cohorts comprising individuals of equal age (and dynamic size/form) are modelled annually (Smith et al., 2001, 2014). Establishment and mortality have both an abiotic (bioclimatic) and a biotic (competition-mediated) component. Vegetation dynamics, i.e. changes in the distribution and abundance of different PFTs in grid cells over time, are an emergent outcome of the competition for resources between PFT cohorts at the patch level within an overall climate envelope determined by bioclimatic limits for establishment and survival. The bioclimatic envelope is a hard limit to vegetation distribution, intended to represent the physiological niche of a PFT. Furthermore, the climate envelope is a proxy not only for physiological processes such as meristem activity that may set species ranges but also for climatic stressors such as tissue freezing. The parameters are intended to capture broader climatic properties of each grid cell. A detailed description of each bioclimatic parameter and its respective values can be found in Table S2.2 in the Supplement. Disturbance is accounted for by the occasional removal of all vegetation within a patch with an annual probability of 300 yr−1, representing random events such as storms, avalanches, insect outbreaks and windthrow. The study used three replicate patches within each 50 × 50 m grid cell. We judged this number sufficient to obtain a stable representation of vegetation dynamics given the relative area of each grid cell and replicate patches (0.1 ha). For summergreen PFTs we slightly modified the assumption of a fixed growing degree day (GDD) requirement for establishment, using thawing degree days (TDDs – degree days with a 0 ∘C basis; see Table S2.2) to capture the thermal sum requirement for the establishment of new individuals.
2.3 Forcing data
The input variables used as forcing in LPJ-GUESS simulations are monthly 2 m air temperature (∘C), precipitation (mm) and incoming short-wave radiation (W m−2) as well as annual atmospheric [CO2] (ppm), soil texture (mineral fractions only) and nitrogen deposition (kgN per hectare per month). Monthly air temperature and short-wave radiation are interpolated to a daily time step, while precipitation is randomly distributed over the month using monthly wet days.
2.3.1 Historic period
A highly resolved (50 × 50 m) temperature and radiation dataset using field measurements and a digital elevation model (DEM) by Yang et al. (2011) provided climate input to the model simulations for the historic period (1913–2000). The field measurements were conducted in the form of transects that captured mesoscale climatic variations, i.e. lapse rates. In addition, the transects were placed to capture microclimatic effects of the nearby Lake Torneträsk and aspect effects on radiation influx. The temperature in the lower parts of the Abisko Valley in the resulting dataset was influenced by the lake, with milder winters and less yearly variability. At higher elevation, the temperature was more variable over the year and the local-scale variations were more dependent on the different solar angles between seasons and by aspect (Yang et al., 2011, 2012) (see Fig. S1.1 in the Supplement). For a full description of how this dataset was constructed we refer to Yang et al. (2011, 2012).
Monthly precipitation input was obtained from the Abisko Scientific Research Station weather records. Precipitation was randomly distributed over each month using the number of wet days from the CRUNCEP v.7 dataset (Wei et al., 2014). We assumed that local differences in precipitation can be neglected for our study domain, and thus the raw station data were used as input to LPJ-GUESS for the historic period. Nitrogen deposition data for the historic and future simulations were extracted from the grid cell including Abisko in the dataset of Lamarque et al. (2013). Nitrogen deposition was assumed to be distributed equally over the study domain.
Soil texture was extracted from the WISE soil dataset (Batjes, 2005) for the Abisko area and assumed to be uniform across the study domain. Callaghan et al. (2013) report that the soils around the Torneträsk areas are mainly glaciofluvial till and sediments. Clay and silt fractions vary between 20 %–50 % (Josefsson, 1990) with higher fractions of clay and silt in the birch forest and a larger sand content in the heaths. In the absence of spatial information on particle size distributions, the soil was prescribed as a sandy loam soil with 43 % sand and approximately equal fractions of silt and clay.
2.3.2 Future simulations
Future estimates of vegetation change were simulated for one low-emission (RCP2.6) and one high-emission (RCP8.5) scenario. For each scenario, climate change projections from three global climate models (GCMs) from the CMIP5 GCM ensemble (Taylor et al., 2012) were used to investigate climate effects on vegetation dynamics. The chosen GCMs (MIROC-ESM-CHEM, HadGEM2-AO, GFDL-ESM2M) were selected to represent the largest spread, i.e. the highest, the lowest and near average, in modelled mean annual temperature for the reference period 2071–2100. Only models with available simulations for both RCP2.6 and RCP8.5 were used in the selection. Monthly climate data for input to LPJ-GUESS (temperature, total precipitation and short-wave radiation) were extracted for the grid cell including Abisko for each GCM. The number of wet days per month was assumed not to change in the future scenario simulations, so we used the 1971–2000 climatology for this period.
The historic climate dataset by Yang et al. (2011) was extended into the projection period (2001–2100) using the delta change approach as follows. For each grid cell monthly differences were calculated between the projection climate and the dataset by Yang et al. (2011) for the last 30-year reference period in our historic dataset (1971–2000). For temperature, the arithmetic difference was extracted, while for precipitation and incoming short-wave radiation, relative (i.e. geometric) differences between the two datasets were extracted. The resulting monthly anomalies were then either added (temperature) to the GCM outputs or used to multiply (precipitation, radiation) the GCM outputs from 2001–2100, for each of the climate scenarios used. Forcing data of atmospheric [CO2] for the two scenarios were obtained from the CMIP5 project.
2.4 Model experiments
To investigate the possible drivers of future vegetation change, we performed three model experiments. The model was forced with changes to one category of input (driver) variables (climate, [CO2], nitrogen deposition) at a time for a projection period between the years 2001–2100. A full list of simulations can be found in Table S3 (Supplement).
A control scenario with no climate trend (and with [CO2] and nitrogen deposition held at their respective year 2000 values) was also created. We estimated the effect of the transient climate change, [CO2] or nitrogen deposition scenarios by subtracting model results for the last decade (2090–2100) in the no-trend scenario from those for the last decade (2090–2100) of the respective transient scenario. To estimate how sensitive the model was to different factors, we performed a Spearman rank correlation for each PFT in 50 m elevational bands over the forest–tundra ecotone. We chose Spearman rank over Pearson since not all correlations were linear.
2.4.1 Climate change
To estimate the sensitivity to climate change, the same scenarios as those used for the future simulations (Sect. 2.3.2) were used while [CO2] and nitrogen deposition were held constant at their year 2000 value.
Climate anomalies without any trend were created by randomly sampling full years in the last decade (1990–2000) from the climate station data. The climate dataset was then extended using these data. The resulting climate scenario had the same interannual variability as the historic dataset and no trend for the years 2001–2100. This scenario was used to investigate any lag effects on vegetation change. This scenario also provided climate input for the nitrogen and [CO2] sensitivity tests described below.
2.4.2 CO2
For our projection simulations we used five different [CO2] scenarios from the CMIP5 project. High-emission (RCP8.5), medium-emission (RCP6.0, RCP4.5) and low-emission (RCP2.6) scenarios as well as a “no change” emission scenario were used.
2.4.3 Nitrogen deposition
Scenarios of nitrogen deposition were obtained from the Lamarque et al. (2013) dataset. Since this dataset assumes a decrease in nitrogen deposition after the year 2000, we also added four scenarios where nitrogen deposition increased with 2, 5, 7.5 and 10 times the nitrogen deposition relative to the year 2000. These four scenarios were created to isolate the single-factor effect of nitrogen increase without any climate or [CO2] change. The resulting additional loads of nitrogen after the year 2000 in these scenarios were 0.38, 0.97, 1.46 and 1.9 gN m−2 yr−1, respectively.
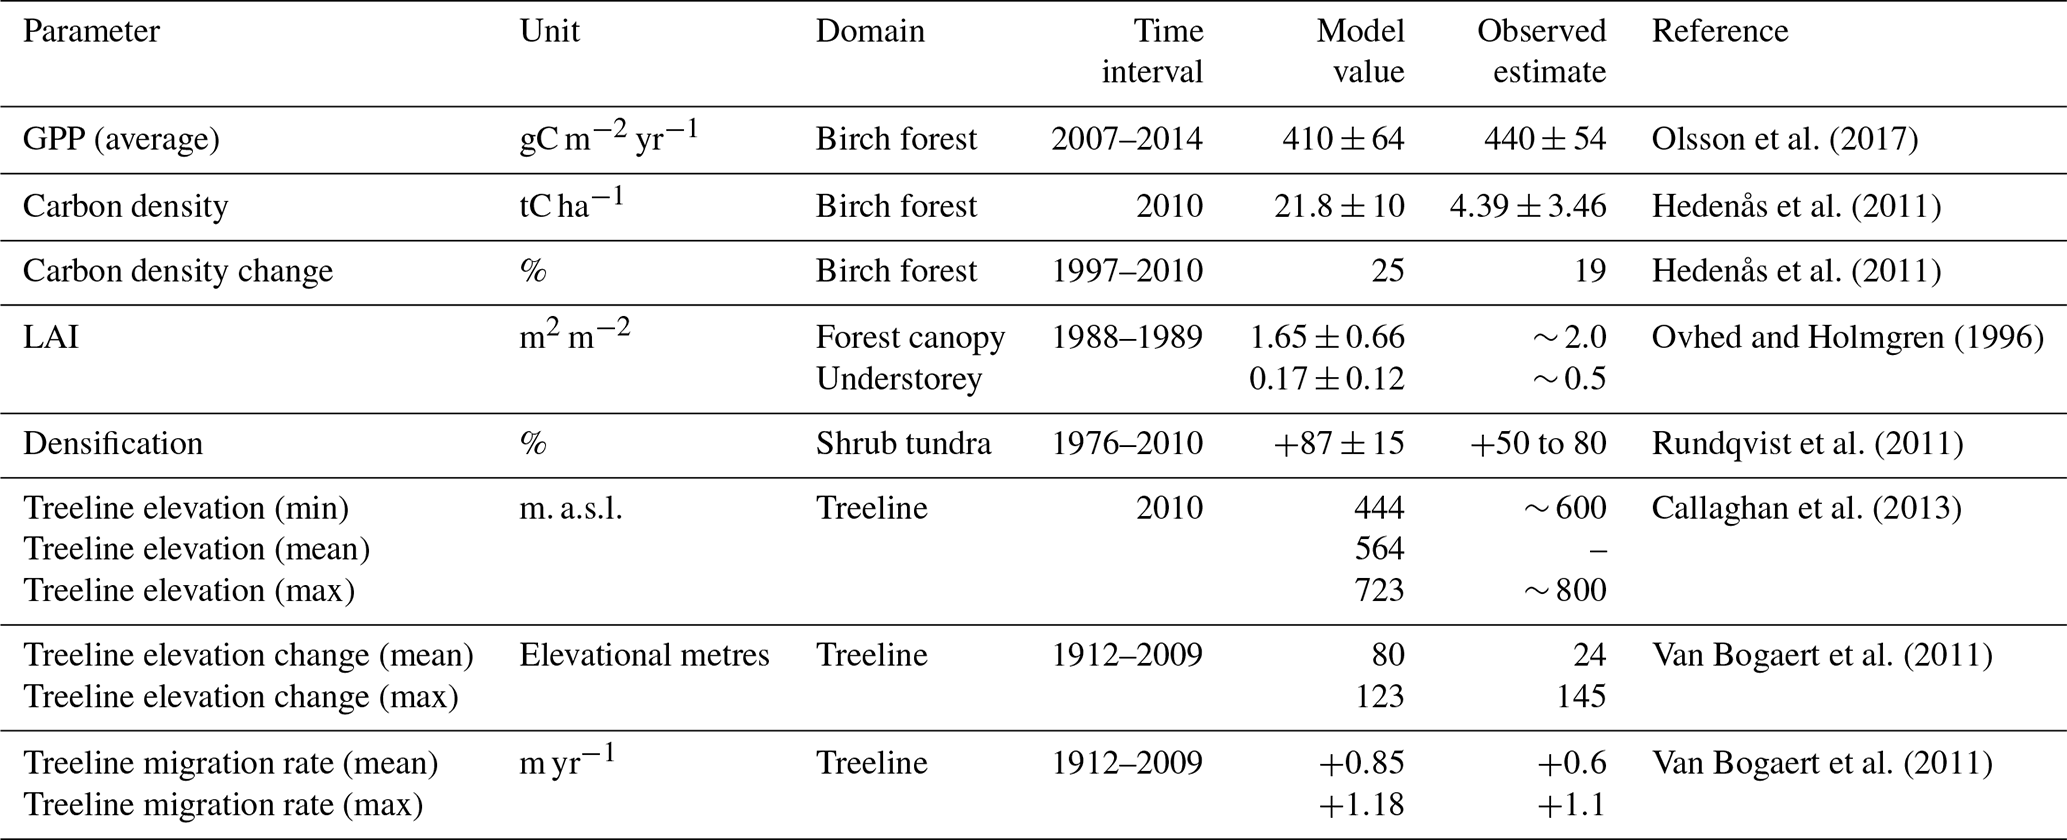
2.5 Model evaluation
We evaluated the model against available observations in the Abisko area. Measurements of ecosystem productivity from an eddy covariance (EC) tower were obtained for 6 non-consecutive years (Olsson et al., 2017). Biomass and biomass change estimates were used to evaluate simulated biomass in the birch forest (Hedenås et al., 2011). Surveys of historic vegetation change above the treeline were obtained from Rundqvist et al. (2011). Leaf area index (LAI) and evapotranspiration estimates were obtained from Ovhed and Holmgren (1996).
The studies by Hedenås et al. (2011) and Rundqvist et al. (2011) were used to evaluate model outputs around the observation year 2010. To compare biomass and vegetation change with these studies, we extracted 5-year multi-model averages for 2008–2012 from our projection simulations (Sect. 2.3.2). These means were used to calculate modelled change in biomass and vegetation in our historic dataset and to compare the modelled output to the observational data.
To determine the local rates of treeline migration, several transects were defined within our study domain (Fig. S1.2 in the Supplement). These transects were chosen to represent a large spread in heterogeneity with regard to slope and aspect in the landscape. A subsample of the selected transects were placed close to the transects used by Van Bogaert et al. (2011) and used to evaluate model performance. Results from the model evaluation are summarised in Tables 1 and S1.1.
2.6 Determination of domains in the forest–tundra ecotone
In our analysis we distinguished between forest, treeline and shrub tundra, defined as follows. Any grid cell containing 30 % fractional projective cover or more of trees was classified as forest. This limit has been used by other studies in the area (e.g. Van Bogaert et al., 2011) to determine the birch forest boundary. The treeline was then determined by first selecting grid cells classified as forest. Any grid cell with four or more neighbours fulfilling the 30 % cover condition criterion was classified as belonging to the forest. The perimeter of the forest was then determined through sorting out grid cells with four or five neighbours classified as forest. Grid cells with fewer or more neighbours were regarded as tundra or forest, respectively. Grid cells below the treeline were classified as forest in the analysis, and grid cells above the treeline were classified as tundra.
2.7 Presentation of results
We present seasonal values for soil and air temperature. These are averages of the 3-month periods DJF, MAM, JJA and SON, referred to as winter, spring, summer and autumn below. For the RCPs average values are presented with the ranges of the different scenarios within each RCP given in parentheses. We report values of both gross primary production (GPP), which we benchmark the model against, and net primary productivity (NPP) as this is of relevance for the carbon limitation discussion.
3.1 Historic vegetation shifts
The dominant PFT in the forest and at the treeline was IBS, which constituted 90 % of the total LAI (Figs. 2a–3a). The only other tree PFT present in the forest was BINE, which comprised a minor fraction of total LAI. However, in the lower (warmer) parts of the landscape, BINE comprised up to 20 % of the total LAI in a few grid cells. The forest understorey was mixed but consisted mostly of tall and low evergreen shrubs and grasses. Shrub tundra vegetation above the treeline was more mixed, but LSE dominated with 51 % of the total LAI. Grasses comprised an additional 25 % of the total LAI, and IBS was present close to the treeline, where it comprised up to 5 % of the LAI in some grid cells. NPP for IBS in the forest increased from 96 to 180 gC m−2 yr−1 over our historic period (1913–2000). Corresponding values at the treeline did not increase but were saturated at around 60 gC m−2 yr−1. Above the treeline, IBS showed very low NPP values (<15 gC m−2 yr−1), while NPP for the dominant shrub (LSE) doubled from 20 gC m−2 yr−1 at the treeline to 40 gC m−2 yr−1 in the tundra.
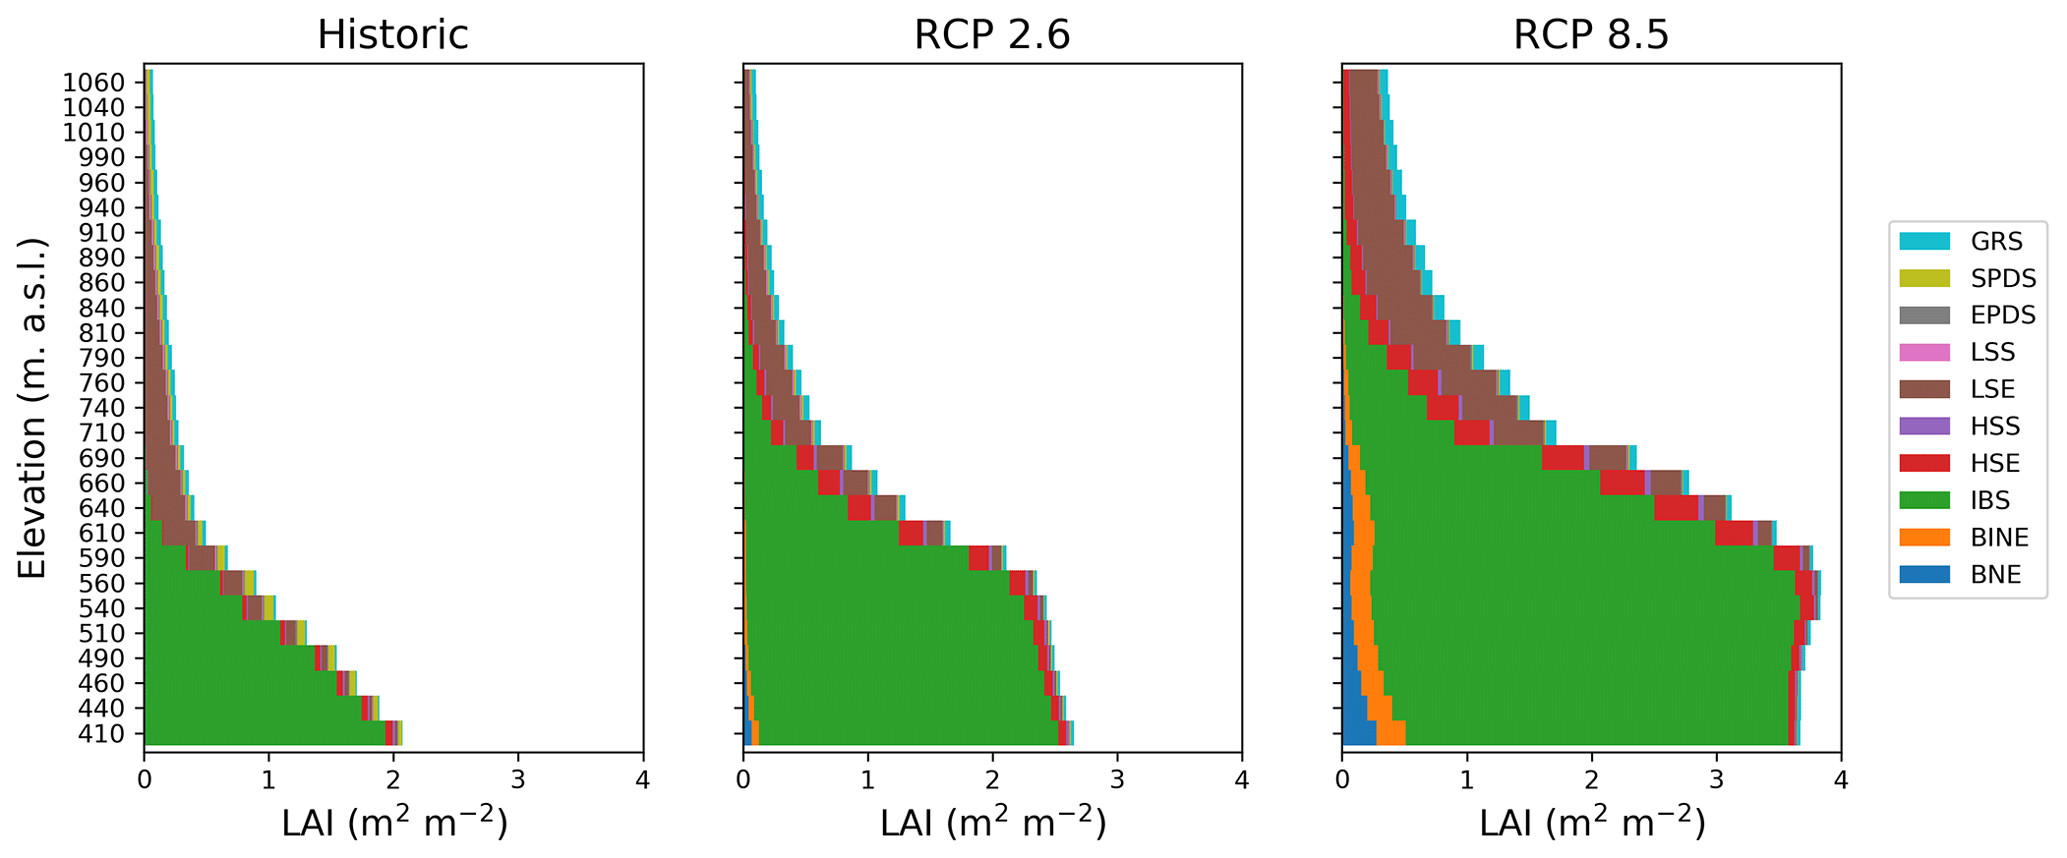
Figure 3Leaf area index (LAI) in the forest–tundra ecotone for the historic period (1990–2000) (a) and at the end of the century (2090–2100) for (b) RCP2.6 and (c) RCP8.5, respectively. Each bar represents 50 elevational metres.
Between the start and end of our historic (1913–2000) simulation the treeline shifted upwards by 67 elevational metres on average, corresponding to a rate of 0.83 m yr−1. However, during the 20th century both a period (1913–1940) with more rapid warming (0.8 ∘C) and a faster tree migration rate (1.23 m yr−1) and a period (1940–1980) with a cooling trend (−0.3 ∘C) and stationary treeline occurred (Fig. 5). Between 1913–2000, the lower boundary of the treeline shifted upwards by 2 m, while treeline upper boundaries shifted upwards by 123 m. These shifts corresponded to rates of 0.03 and 1.54 m yr−1, respectively. Similar rates were also found in the transects established to test how the model simulates the heterogeneity of treeline migration (Fig. S1.2 and Table S1.1 in the Supplement), where the average migration rate was 0.87 (0.54–1.25) m yr−1.
During the 1913–2000 period, annual average air temperature at the simulated treeline warmed from −2.0 to −0.8 ∘C. Warming occurred throughout the year but was strongest in winter and spring, when temperatures increased by 3.0 and 1.4 ∘C, respectively. In contrast, both summer and autumn temperatures warmed by only 0.6 ∘C. The resulting winter, spring, summer and autumn air temperatures at the treeline in 1990–2000 were −8.7, 3.3, 8.8 and −0.1 ∘C, respectively. The warming was also reflected in annual average soil temperature increases of a similar magnitude, by 2.1 ∘C from −0.8 to 1.3 ∘C. Winter soil temperature increased by 3.7 ∘C from −5.6 ∘C in 1913 to −1.9 ∘C in 2000. The warmer soil temperatures resulted in a 4.8 % simulated increase in the annual net nitrogen mineralisation rate in the treeline soils over the same period. In absolute numbers, nitrogen mineralisation increased from 1.29 to 1.36 gN m−2. Combined with an increased nitrogen deposition load from 0.06 gN m−2 in 1913 to 0.20 gN m−2 in 2000 and an increased nitrogen fixation from 0.13 to 0.18 gN m−2, plant-available nitrogen was simulated to increase by 15.9 %. Simulated permafrost with an active layer thickness of <1.5 m was present at elevations down to 560 m a.s.l. in a few grid cells but was always well above the treeline. More shallow permafrost (active layer thickness <1 m) was only present in grid cells at elevations of 940 m a.s.l. and above.
3.2 Projected vegetation shifts
During the 100-year projection period (2001–2100) treelines advanced by between 45 (HadGEM2-AO-RCP2.6) and 195 (GFDL-ESM2M-RCP8.5) elevational metres in the different scenarios, corresponding to rates of 0.45 and 1.95 elevational metres per year. The total LAI increased in the entire ecotone in both RCP2.6 and RCP8.5 compared to the historic (1990–2000) values (Fig. 3b–c). The increase was more pronounced in RCP8.5, which also saw a large increase in low evergreen shrubs (LSE) at the end of the century (2090–2100). While the forest was still dominated by IBS, evergreen trees (BNE and BINE) increased and together comprised approximately 15 % of the total LAI. The fraction of evergreen trees in the forest correlated well with the degree of warming in each scenario. Forest GPP was mainly driven by tree PFTs and increased by 50 % (12 %–99 %) for RCP2.6 and 177 % (98 %–270 %) for RCP8.5. Above the treeline, low shrubs (LSS and LSE) contributed the most to annual GPP change, which increased by 33 % (−12 % to 67 %) and 239 % (105 %–370 %) in RCP2.6 and RCP8.5, respectively. Forest NPP, wherein IBS was always dominant, increased from 200 gC m−2 yr−1 in the year 2000 to 300 (220–375) gC m−2 yr−1 and 490 (380–610) gC m−2 yr−1 for RCP2.6 and RCP8.5, respectively, over the projection period. NPP for the same period for IBS at the treeline increased slightly from 60 gC m−2 yr−1 to 80 (74–90) gC m−2 yr−1 and 104 (80–116) gC m−2 yr−1 for RCP2.6 and RCP8.5. Above the treeline NPP remained low (<25 gC m−2 yr−1) for IBS in all scenarios and always had a lower NPP than the most productive shrub PFT (LSE). NPP for this shrub was 49 (24–64) gC m−2 yr−1 and 130 (81–180) gC m−2 yr−1. The productivity increase translated into a biomass C increase of the same magnitude both in the forest and above the treeline.
The average summer air temperature at the treeline between the last decade of the historic and projection periods increased by 0.3 and 6.7 ∘C for the coldest (GFDL-ESM2M-RCP2.6) and warmest (MIROC-ESM-CHEM-RCP8.5) GCM scenario, respectively. The advance of the 6 ∘C JJA soil temperature isotherm was more rapid than the treeline advance (Fig. 4). In the two warmest scenarios (MIROC-ESM-CHEM-RCP8.5 and HadGEM2-AO-RCP8.5) summer soil temperatures exceeded 6 ∘C in the whole study domain. Treeline elevations in these scenarios only reached 745 and 660 m a.s.l., respectively. Treelines advanced almost twice as fast in RCP8.5 compared to RCP2.6, by 1.55 (1.10–1.96) m yr−1 and 0.84 (0.44–1.16) m yr−1, respectively.
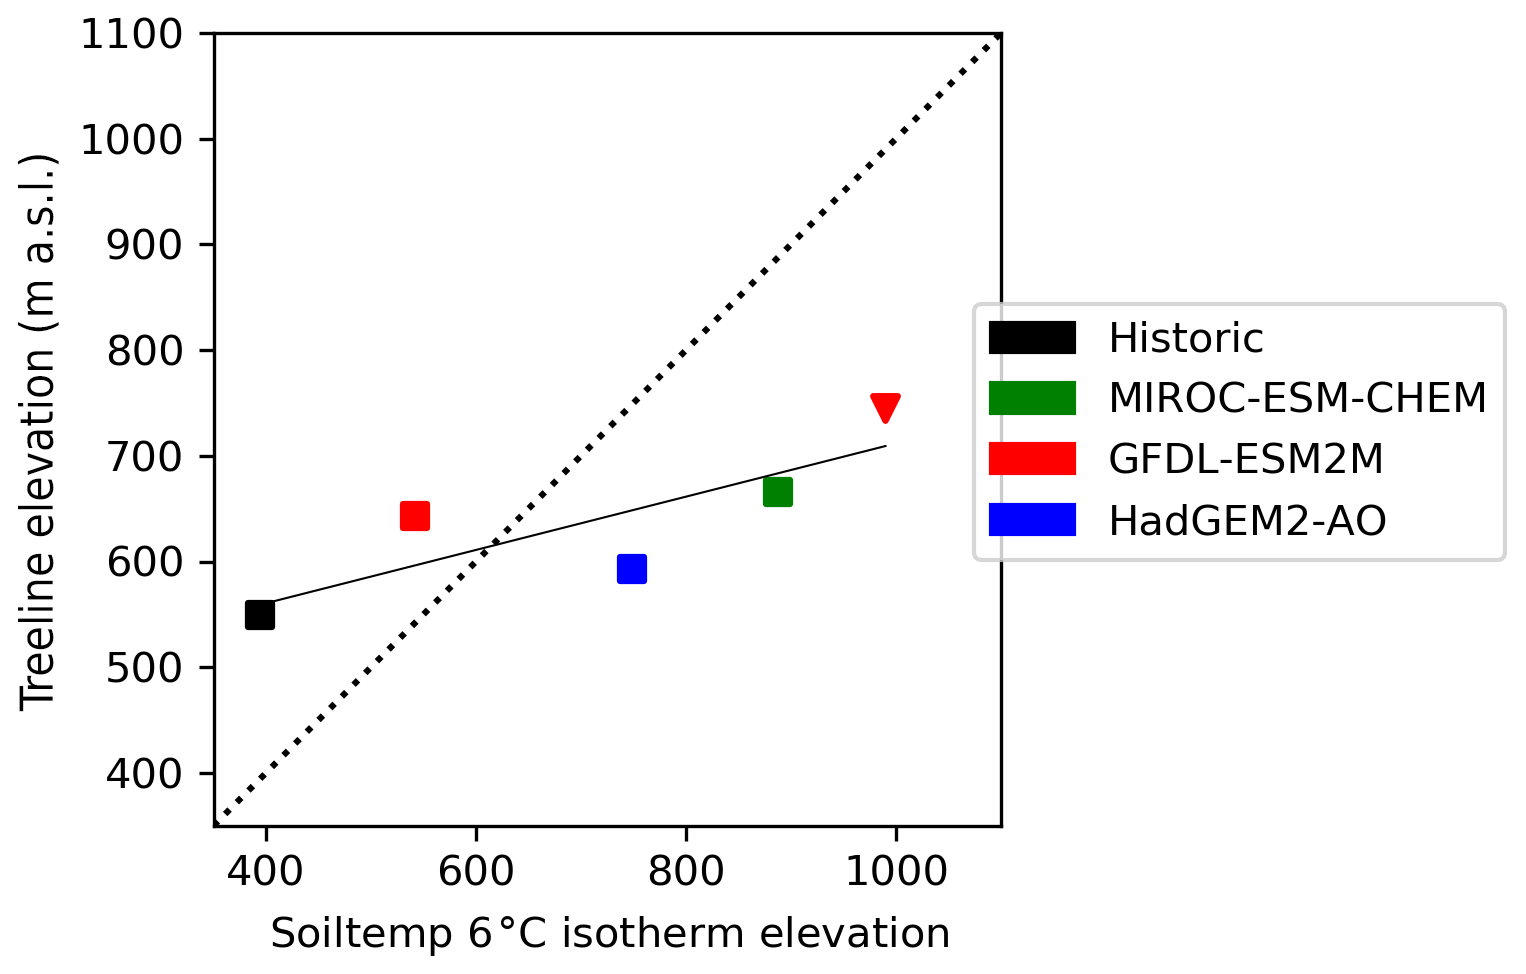
Figure 4JJA 6 ∘C soil temperature isotherm elevation relative to average treeline elevation. Square markers represent RCP2.6, and triangles represent RCP8.5. In the two warmest scenarios (HadGEM2-AO-RCP8.5 and MIROC-ESM-CHEM-RCP8.5), the 6 ∘C soil temperatures exceed 6 ∘C in the whole landscape. The dotted line represents the 1:1 relationship between the treeline and isotherm placement, and the solid line displays the treeline–soil temperature regression.
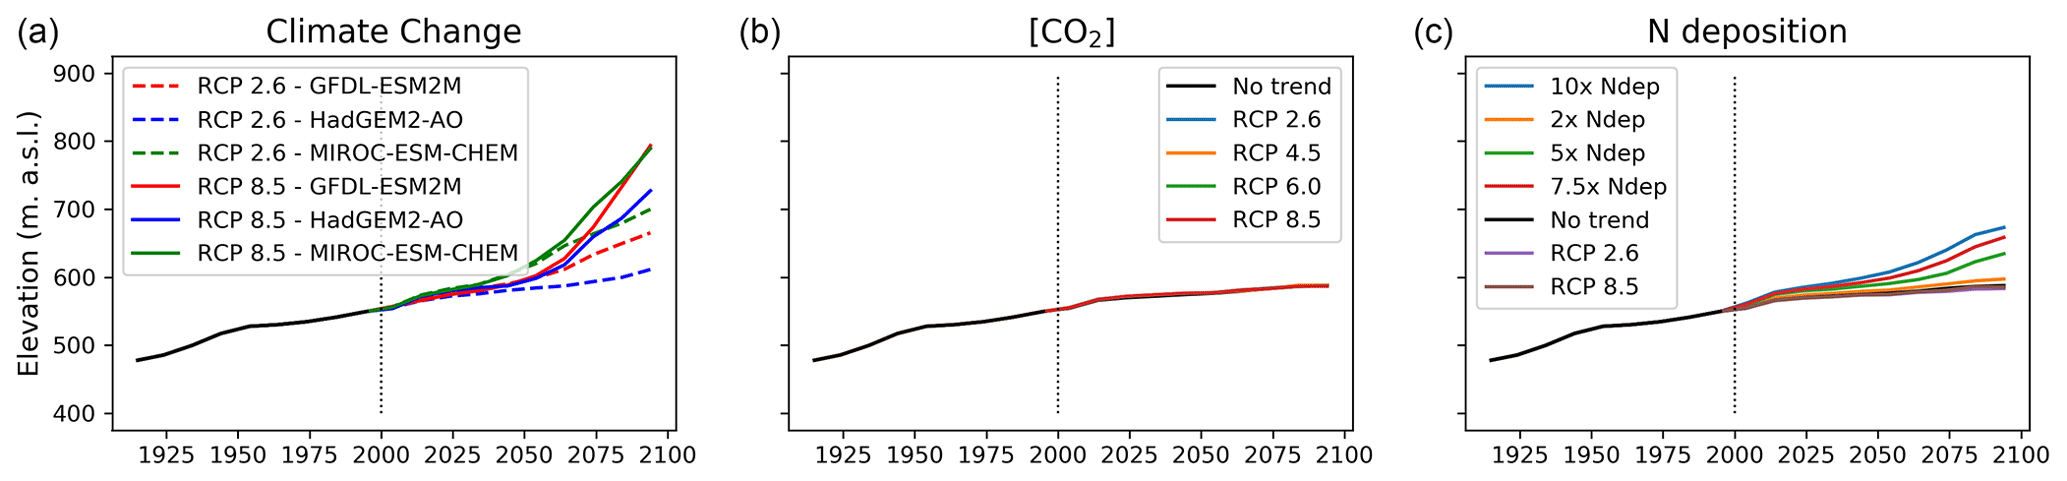
Figure 5Shifts in average treeline elevation over the simulation period for the three experiments of (a) climate change, (b) CO2 fertilisation and (c) nitrogen deposition. The start of projection simulations is marked with a vertical dotted line in all panels. The no-trend scenario in panels (b)–(c) represents a scenario where climate, CO2 and nitrogen deposition are kept constant (without a trend) relative to the year 2000. The black line before the year 2000 represents the historic simulation.
3.3 Model experiments
A slight treeline advance at the end of the projection period (2090–2100) of approximately 11 elevational metres was seen in the control simulation. As all drivers were held constant or trend-free in this simulation, this reveals a lag from the historical period, likely resulting from smaller trees that had established in the historic period that matured during the projection period.
3.3.1 Climate change
Treeline advance occurred in all climate change scenarios although the rate was not uniform throughout the projection period (Fig. 5). When driven by climate change alone, migration rates were faster compared to simulations where nitrogen deposition and [CO2] were also changed (Sect. 3.2). Treeline advance in climate-change-only scenarios ranged between 60 elevational metres (HadGEM2-AO-RCP2.6) and 245 elevational metres (MIROC-ESM-CHEM-RCP8.5) over the 100-year projection period.
Tree productivity was strongly enhanced by air temperature increase over the whole study domain (Fig. 6a). Weaker correlations between productivity and other climate factors such as precipitation and net short-wave radiation were also seen (Figs. S1.5 and S1.6 in the Supplement). Annual precipitation increased in all climate change scenarios (Table 2). In the lower parts of the valley, the increased precipitation did not result in increased soil moisture during summer as losses through evapotranspiration driven by temperature exceeded the additional input. Spring and autumn soil moisture increased in the forest, mainly because of earlier snowmelt and thawing ground in spring and relatively weaker evapotranspiration in autumn. Above the treeline, soil moisture increased as the lower temperatures and LAI did not drive evapotranspiration as strongly as in the lower parts of the valley, and the increased moisture input thus outweighed the slightly increased evapotranspiration.
Table 2Seasonal temperature and precipitation for historic and scenario simulations.
Increased tree productivity in the forest resulted in an increased LAI of 0.3–1.5 m2 m−2 (18 %–90 %). BNE appeared in the forest and dominated in a few grid cells. In most places BNE constituted approximately 5 % of the total LAI. Tall shrub (HSE and HSS) productivity and the LAI increased in the forest. This increase was negatively correlated with temperature; i.e. the increase was highest in the coolest climate change scenarios. Above the treeline, tall shrubs showed the opposite pattern, increasing by 8 %–50 % to finally constitute 10 %–36 % of the total LAI.
Higher soil moisture content in spring and autumn favoured trees in the whole ecotone, while the forest understorey suffered from the earlier onset of the growing season with subsequent flushing of the leaf and light shading from taller competitors. Although soil moisture in summer decreased in the forest, the LAI and biomass carbon of summergreen shrubs were positively correlated with soil moisture. Higher soil moisture during summers in the wetter GCM scenarios promoted summergreen shrubs over evergreen shrubs in the whole ecotone. As an example, vegetation composition on the tundra above the treeline differed between GFDL-ESM2M and MIROC-ESM-CHEM under RCP8.5, where the warmer GCM showed a 52 % biomass C increase in the tall evergreen shrub, HSE. The intermediate warming scenario (GFDL-ESM2M-RCP8.5) showed a more mixed increase in biomass carbon in HSE (20 %) and HSS (24 %). While annual temperature differed by 3.9 ∘C between the two scenarios, average annual precipitation only differed by 6.2 mm, yielding much (26 %) lower JJA soil moisture in the warmest scenario (MIROC-ESM-CHEM-RCP8.5) compared to the coldest (GFDL-ESM2M-RCP8.5). Relatively higher soil moisture and subsequently lower water stress allow taller plants to establish.
Radiation correlated positively with the growth of tree PFTs, with spring and autumn radiation found to be especially important for height and biomass increase (Fig. S1.7 in the Supplement). Increased radiation provided a competitive advantage for taller trees and shrubs to shade out lower shrubs and grasses in the forest. Shrubs above the treeline were also favoured by increased light.
Net nitrogen mineralisation at the treeline showed great variation between different climate change scenarios, ranging from a 4 % decrease in GFDL-ESM2M-RCP8.5 to a 79 % increase in the strongest warming scenario (MIROC-ESM-CHEM-RCP8.5). In absolute terms, the latter increase corresponds to an increase from 1.35 gN m−2 yr−1 at the end of the historic period (1990–2000) to 2.43 gN m−2 yr−1 at the end of the century (2090–2100). This is comparable to the nitrogen load in the 7.5× increased nitrogen deposition scenario. Interestingly, despite very different plant-available nitrogen and warming, the two scenarios displayed a similar resulting (2090–2100) treeline elevation (Fig. 5a).
Permafrost with an active layer thickness of <1.5 m disappeared completely from our study domain in all scenarios except the coldest (GFDL-ESM2M-RCP2.6), where it occurred in a few grid cells at elevations of approximately 600 m a.s.l. However, the shallow permafrost (<1 m) had also disappeared in this scenario.

Figure 6Correlation (Spearman rank) between annual GPP for each PFT and (a) average 2090–2100 temperature anomalies in the climate change experiment, (b) the CO2 scenario and (c) the nitrogen deposition scenario. Each box represents a 50-elevational-metre band for a given PFT.
3.3.2 CO2
[CO2] increase enhanced productivity in most PFTs (Fig. 6b). The total GPP averaged over the forest increased by between 2 %–10 % depending on the [CO2] scenario, with the largest increase in RCP8.5 and smallest in RCP2.6. The CO2 fertilisation effect was not uniform within the landscape but stronger towards the forest edge with increases from 2 % to 18 % from the weakest to the strongest [CO2] scenario. NPP for IBS increased uniformly over the forest with 2.5 %–8.4 % but decreased above the treeline. Thus, the productivity of the two dominant PFTs (IBS in the forest and LSE above the treeline) was reinforced in their respective domains. The increased productivity translated into a 1 %–5 % increase in the tree LAI in the forest, while the low shrub LAI increased by 24 %–77 %. Likewise, the increase in the leaf area of low shrubs was largest on the tundra under elevated [CO2], which saw a 15 %–40 % LAI increase in the low and high [CO2] scenario, respectively. Above the treeline, the productivity of grasses and low shrubs responded strongly to the CO2 fertilisation with a 350 % increase in GPP for grasses and 150 % increase for low shrubs. The additional litter fall produced by the increased leaf mass did not lead to an increase in N mineralisation. However, immobilisation of nitrogen through increased uptake by microbes increased by 2 %–6 % between the lowest and highest [CO2] scenarios, yielding a net reduction in plant-available nitrogen. Despite productivity increases, the treeline remained stationary in all [CO2] scenarios (Fig. 5b).
3.3.3 Nitrogen deposition
Productivity of woody PFTs was in general positively correlated with nitrogen in the different nitrogen deposition scenarios. In contrast, productivity of grasses was negatively correlated (Fig. 6c) as they suffered in competition for light with the trees. Annual GPP of trees (especially IBS) was positively correlated throughout the whole ecotone, but the increase in GPP was larger towards the forest boundaries than in the lower parts of the forest when nitrogen was added. Nitrogen-stressed plants in the model allocate more carbon to their roots at the expense of foliar cover when they suffer a productivity reduction (Smith et al., 2014). In the two scenarios with decreasing nitrogen deposition (RCP2.6, RCP8.5) there was an overall reduction in the LAI in both the tundra and the forest of 6 %–10 %. The largest reduction was seen in tree PFTs, which have the largest biomass and consequently will have the highest nitrogen demand, followed by tall shrubs. Low shrubs and grasses did however increase their LAI in the forest when nitrogen input decreased as a result of less light competition from trees. Above the treeline, the LAI of low shrubs and grass PFTs also decreased with less nitrogen input.
In all scenarios with increasing nitrogen deposition there was an advancement of the treeline on the order of 10–85 elevational metres with the smallest (2× nitrogen deposition) having the smallest change in treeline elevation and vice versa for the largest input (10× nitrogen deposition) (Fig. 5c). In the scenarios where nitrogen input was constant or decreasing, the treeline remained stationary.
In our simulations, rates of treeline advance were faster under climate-change-only scenarios than when all drivers were changing. This revealed nitrogen as a modulating environmental variable, as nitrogen deposition was prescribed to decrease in both the RCP2.6 and the RCP8.5 scenarios. During our historic simulations, the treeline correlated well with a soil temperature isotherm close to the globally observed 6–7 ∘C isotherm. However, in our projection period the correlation between the treeline position and the isotherm weakened, revealing a fading or potential lag of the treeline–climate equilibrium that became stronger with increased warming. Future rates of treeline advance were thus constrained by factors other than temperature in our simulations. In contrast to previous modelling studies of treeline advance (e.g. Paulsen and Körner, 2014), we include not only temperature dependence on vegetation change but also the full nitrogen cycle and CO2 fertilisation effects (Smith et al., 2014). Scenarios with increased nitrogen deposition induced treeline advance, further illustrating the modulating role played by nitrogen dynamics in our results. Rising [CO2] induced higher productivity in our simulations, but these productivity enhancements alone did not lead to significant treeline advance. Furthermore, although NPP for IBS was lower at the treeline than in the forest, it was never close to zero. Such a pattern, which was seen above the treeline, indicates stagnant growth in which the carbon costs of maintaining a larger biomass cancel out any productivity increase. However, enhancement of productivity in combination with an allocation shift from roots to shoots, enabled by a greater nitrogen uptake, favoured taller plants over their shorter neighbours in the competition for light within the model. For treeline advance to occur, trees need to invade the space already occupied by other vegetation. As the model assumes asymmetric competition for nutrients, newly established seedlings have a disadvantage compared to incumbent vegetation, further slowing down the modelled rate of treeline advance. Field experiments with nitrogen fertilisation have shown that mountain birches at the treeline display enhanced growth after nitrogen addition (Sveinbjörnsson et al., 1992). Furthermore, fertilisation with nitrogen improved birch seedling survival above the treeline (Grau et al., 2012) and is thus likely important for the establishment and growth of new individuals to form a new treeline. Historically, treeline positions show a strong correlation with the 6–7 ∘C isotherm (Körner and Paulsen, 2004). These records are, however, a snapshot in time and are not necessarily a strong predictor of the future treeline, with other factors (as with nitrogen in our results) potentially breaking the link to temperature. As pointed out by others (Hofgaard et al., 2019; Van Bogaert et al., 2011), considering climate change or temperature alone in projections of treeline advance could potentially result in overestimation of vegetation change. Our results clearly point to nitrogen cycling as a modulating factor when predicting future Arctic vegetation shifts.
In our simulations, the treeline advanced at similar rates to those experienced during the historic period, resulting in a displacement of 45–195 elevational metres over the 100-year projection period. Some estimates based on lake sediments in the Torneträsk region from the Holocene thermal maximum, when summer temperatures may have been about 2.5 ∘C warmer than present (Kullman and Kjällgren, 2006), indicate potential treeline elevations approximately 500 m above the present level in the warmer climate (Kullman, 2010). Macrofossil records from lakes in the area indicate that birch was present 300–400 m above the current treeline (Barnekow, 1999). Furthermore, pine might have occurred approximately 100–150 m above its present distribution (Berglund et al., 1996). IBS emerged as the dominant forest and treeline PFT in both our historic and our projection simulations but with larger fractions of evergreen trees (BNE and BINE) at the end of the century (2090–2100). Mountain birch, represented by IBS in our model, has historically dominated treelines in the study area, even during warmer periods of the Holocene (Berglund et al., 1996), but with larger populations of pine (BINE) and spruce (BNE) than seen at present. Both pine and spruce have been found in high-elevation lake pollen sediments and can thus be assumed to have grown in higher parts of the ecotone during warmer periods (Kullman, 2010). Treeline advance for the historic period in our simulations is broadly consistent with observational studies from the Abisko region (Van Bogaert et al., 2011).
Temperature was a strong driver of tree productivity and growth in the whole ecotone in our simulations. For the historic period, higher rates of treeline advance followed periods of stronger warming. However, other factors such as precipitation indirectly influenced treeline advance through changes in vegetation composition and nitrogen mineralisation. This is illustrated by the comparison of GFDL-ESM2M and MIROC-ESM-CHEM under RCP8.5, where the intermediate warming but wetter scenario had a very similar resulting treeline elevation to that of the warmer scenario. While the simulated treeline position was too low compared to the treeline elevation reported by Callaghan et al. (2013), the correlation with the globally observed 6–7 ∘C ground temperature isotherm (Körner and Paulsen, 2004) throughout the historic period gives confidence in the model results.
IBS at the treeline had a positive carbon balance (NPP) and was thus not directly limited by its productivity in our simulations. This is consistent with observations of ample carbon storage in treeline trees globally (Hoch and Körner, 2012). The modelled treeline is thus not set by productivity directly but rather by competition, as non-tree PFTs become more productive above the treeline. Whether the treeline is set by productivity constraints or by cold temperature limits on wood formation and meristematic activity has been a subject of debate in the literature (Körner, 2015, 2003; Körner et al., 2016; Fatichi et al., 2019; Pugh et al., 2016). DVMs assume NPP to be constraining for growth. On the other hand, trees close to the treeline have been shown to have ample stored carbon (Hoch and Körner, 2012). Furthermore, enhancement of photosynthesis through added CO2 does not always result in increased tree growth close to the treeline (Dawes et al., 2013), and wood formation is slow below around 5 ∘C, leading to a hypothesis of reversed control of plant productivity and treeline position (Körner, 2015). As has also been highlighted in this study, ecological interactions as a component in the control of treeline position have been the subject of attention in some recent modelling studies (see for example Scherrer et al., 2020). Such studies add an extra dimension to the discussion as they not only consider plant physiology and hard limits to species distributions but also broadly accept ecological concepts such as realised versus fundamental niches.
The model overestimated biomass carbon in the forest but captured historic rates of biomass increase. The overestimation was more severe closer to the forest boundaries as the model showed a weaker negative correlation between biomass carbon and elevation than observed by Hedenås et al. (2011). The mean annual biomass increase in the same dataset is, although highly variable, on average 2.5 gC m−2 yr−1 between 1997 and 2010. As the simulated GPP and LAI were within the range of observations in the area (Rundqvist et al., 2011; Ovhed and Holmgren, 1996; Olsson et al., 2017), this indicates a coupling between photosynthesis and growth in the model that is stronger than that observed. Terrestrial biosphere models often overestimate biomass in high latitudes (Pugh et al., 2016; Leuzinger et al., 2013) and potentially lack processes that likely limit growth close to low temperature boundaries. Examples of such processes are the carbon costs of nitrogen acquisition (Shi et al., 2016), including costs for mycorrhizal interactions (Vowles et al., 2018), and temperature limits on wood formation (Friend et al., 2019). However, data on carbon allocation and its temperature dependence are scarce (Fatichi et al., 2019). Additionally, the overestimation in our study can be partly attributed to a lack of herbivory in the model. Outbreaks of the moth Epirrita autumnata are known to limit productivity and reduce biomass of mountain birch in the area in certain years (Olsson et al., 2017); however, this would not fully explain the overestimation of biomass at the treeline in our simulations. Since growth and biomass increments in the model do not include a direct temperature dependence or any decoupling of growth and productivity, we do not regard these mechanisms as necessary to accurately predict treeline dynamics. However, they might be important to accurately predict forest biomass at the treeline.
To examine variability in the simulated treeline dynamics across the study area, we established a number of transects close to observation points in the landscape. Average treeline advance in the transects showed a somewhat faster and more homogenous migration than reported (Van Bogaert et al., 2011). The model does not include historic anthropogenic disturbances, topographic barriers or insect herbivory, all of which have been invoked to explain the heterogeneity of treeline advance rates and placement in the landscape (Van Bogaert et al., 2011; Emanuelsson, 1987). Furthermore, our model does not include any wind-related processes such as wind-mediated snow transport or compaction. Thus, our simulations result in a homogenous snowpack during the winter months with no differentiation in sheltering or frost damage that may result from different snow and ice properties. Sheltered locations in the landscape are known to promote the survival of tree saplings (Sundqvist et al., 2008). For nitrogen cycling this may also mean that suggested snow–shrub feedbacks (Sturm et al., 2001; Sturm, 2005) are not possible to capture with the current version of our model. While overall rates of treeline migration were captured, local variations arising from physical barriers such as steep slopes, stony patches or anthropogenic disturbances were not possible to capture as these processes are not implemented in the model. High-resolution, local observations of vertically resolved soil texture and soil organic matter content (see, e.g., Hengl et al., 2017, for an example compiled using machine learning) have the potential to improve the spatial variability in modelled soil temperatures and nutrient cycling in our study domain.
A longer growing season favoured tree PFTs in the whole ecotone, which escaped early-season desiccation due to milder winters and earlier spring thaw. Permafrost was only present at the highest elevations during the historic simulation but had disappeared from the landscape by 2100 for all except the coolest scenario (GFDL-ESM2M-RCP2.6). The simulated permafrost was however always well above the treeline and did not have a significant impact on the treeline advancement. While some aspects of ground freezing are accounted for in the model, soil vertical and horizontal movement caused by frost, as well as the amelioration of such effects in the warmer future climate, is not. Such processes could affect survival and competition among the plant functional types, especially in the seedling stage when plants are most vulnerable to mechanical disturbance (Holtmeier and Broll, 2007). These effects could be relevant to treeline dynamics at the high grid resolution of our study but are not included in our model.
Higher summer soil moisture in the wetter climate scenarios shifted the ratio of summergreen to evergreen shrubs in favour of the summergreen shrubs, in line with observations (Elmendorf et al., 2012). Conversely, drier scenarios yielded an increased abundance of evergreen shrubs, similar to what has been observed in drier parts of the tundra heath in the Abisko region (Scharn et al., 2021). Within RCP8.5, the warmest (MIROC-ESM-CHEM-RCP8.5) and coldest (GFDL-ESM2M-RCP8.5) scenarios gave rise to very similar treeline positions at the end of the projection period (2090–2100). The cooler scenario led to both higher soil moisture and a greater abundance of summergreen shrubs. Higher soil moisture promoted carbon allocation to the canopy and thus favoured the taller IBS tree PFT over tall shrubs (HSS). Increased shrub abundance and nutrient cycling have been shown to have potentially non-linear effects on shrub growth and ecosystem carbon cycling (Buckeridge et al., 2009; Hicks et al., 2019), and some observations indicate that changes in the ratio of summergreen to evergreen shrubs or an increased abundance of trees might impact soil carbon loss (Parker et al., 2018; Clemmensen et al., 2021). Thus, our results indicate that any future change in soil moisture conditions could play an important role in the competitive balance between shrubs and trees and for carbon balance.
LPJ-GUESS assumes the presence of seeds in all grid cells, and PFTs may establish when the 20-year (running) average climate is within PFT-specific bioclimatic limits for establishment. This assumption may overlook potential constraints on plant migration rates such as seed dispersal and reproduction. On larger spatial scales, it is likely that lags in range shifts would arise from these additional constraints (Rees et al., 2020; Brown et al., 2018). Models that account for dispersal limitations generally predict slower latitudinal tree migration than models driven solely by climate (Epstein et al., 2007). However, on smaller spatial scales, the same models predict competitive interactions to be more dominant in determining species migration rates (Scherrer et al., 2020), and this is included in our model. In a seed transplant study from the Swiss Alps, seed viability could not be shown to decline towards the range limits of eight European broadleaved tree species (Kollas et al., 2012; Körner et al., 2016). Similarly, gene flow above the treeline could not be shown to be limited to near-treeline trees in the Abisko region (Truong et al., 2007). Furthermore, tree saplings have been reported to be common up to 100 m above the present treeline (Sundqvist et al., 2008; Hofgaard et al., 2009). As environmental conditions improve, these individuals may form the new treeline.
Above the treeline low evergreen shrubs (LSE) dominated the vegetation in both our historic and our projection simulations. The productivity of shrubs and grasses was greatly enhanced by CO2 fertilisation in our [CO2] model experiment, and a large proportion of tundra productivity increases in our projection simulations could be attributed to rising [CO2]. Physiological effects of elevated CO2 on arctic and alpine tundra productivity and growth are understudied. Free-air CO2 enrichment (FACE) experiments are generally considered the best method for quantifying long-term ecosystem effects of elevated CO2 but are extremely costly, and very few have been deployed in near-treeline locations. A majority of FACE experiments have been implemented in temperate forests and grasslands, yielding limited evidence of relevance to boreal and tundra ecosystems (Hickler et al., 2008). One FACE experiment situated in a forest–tundra ecotone in the Swiss Alps showed differing responses to elevated CO2 among shrub species where Vaccinium myrtillys showed 11 % increased shoot growth, while Empetrum nigrum was unresponsive and the response of V. gaultherioides depended on the forest type in which it was growing (Dawes et al., 2013). Our model results indicated that shrubs are carbon limited, and shrub productivity and growth are consequently responsive to CO2 fertilisation.
In this study we examined treeline dynamics in the sub-arctic north of Sweden using an individual-based dynamic vegetation model at a high spatial resolution. The model identified nitrogen cycling and availability as important modulating factors for treeline advance in a warming future climate. Internal cycling of nitrogen in soils provides the main source of this usually limiting nutrient for Arctic plants (Chapin, 1983). The model performed well regarding rates of shrub increase and treeline advance but overestimated biomass carbon in the treeline forest. Treeline migration rates were realistically simulated even though the model did not represent temperature limitations on tree growth. While a decoupling between productivity and growth in the model could potentially have improved estimates of biomass carbon, it was not needed to correctly predict treeline elevation. Instead, our results point to the importance of indirect effects of rising temperatures on tree range shifts, especially with regard to nutrient cycling and competition between trees and shrubs. Furthermore, soil moisture strongly influenced vegetation composition within the model with implications for treeline advance. Improving how models represent nutrient uptake and cycling and incorporating empirical understanding of processes that determine tree and shrub growth will be key to making better predictions of Arctic vegetation change and carbon and nitrogen cycling. Models are a valuable aid in judging the relevance of these processes for sub-arctic treeline ecosystems.
The LPJ-GUESS code is located at a non-public repository hosted by Lund University. The code can be accessed for scientific purposes upon inquiry to the authors. More information about the model can be found at https://web.nateko.lu.se/lpj-guess (LPJ-GUESS developers, 2021). All data analysis was carried out using Python pandas (https://doi.org/10.5281/zenodo.4309786, The pandas development team, 2020), NumPy (Harris et al., 2020) and SciPy (https://doi.org/10.5281/zenodo.595738, Gommers et al., 2021). Plots were created using Matplotlib (https://doi.org/10.5281/zenodo.592536, Caswell et al., 2021) and Cartopy (https://doi.org/10.5281/zenodo.1182735, Elson et al., 2021).
The climate dataset by Yang et al. (2011) was generously shared with the authors but is not publicly accessible. The data can be accessed upon inquiry to the authors. CMIP5 climate data were downloaded from the ESGF data repository (https://esg-dn1.nsc.liu.se/projects/esgf-liu/, ESGF, 2021) and can be accessed through the ESGF service. The historic climate data for the Abisko Scientific Research Station were generously shared with the authors. Access to this data is provided by the Abisko Scientific Research Station. The soil data used in our study can be accessed through the ISRIC Data Hub (http://data.isric.org/geonetwork/srv/eng/catalog.search#/metadata/dc7b283a-8f19-45e1-aaed-e9bd515119bc, Batjes et al., 2005) The dataset with historic and projected nitrogen deposition is not publicly available but was generously shared with the authors.
The supplement related to this article is available online at: https://doi.org/10.5194/bg-18-6329-2021-supplement.
AG designed the experiments with contributions from PAM and SO. AG also performed necessary model code developments and carried out model simulations and data analysis. RGB and BS contributed scientific advice and input throughout the study and contributed to the writing. AG prepared the manuscript with contributions from all co-authors.
The contact author has declared that neither they nor their co-authors have any competing interests.
Publisher's note: Copernicus Publications remains neutral with regard to jurisdictional claims in published maps and institutional affiliations.
We would like to thank Christian Körner and Jed Kaplan for their thoughtful and constructive reviews, which greatly improved the manuscript and widened the scope of our analysis. We acknowledge the Lund University strategic research areas BECC and MERGE for their financial support. Abisko Scientific Research Station generously shared the data used in preparation of the future climate projections.
This research was partly funded (Paul A. Miller, Robert G. Björk) by the project BioDiv-Support through the 2017–2018 Belmont Forum and BiodivERsA joint call for research proposals, under the BiodivScen ERA-Net COFUND programme, and with the funding organisations Academy of Finland (AKA) (contract no. 326328), Agence Nationale de la Recherche (ANR) (grant no. ANR-18-EBI4-0007), Bundesministerium für Bildung und Forschung (BMBF) (grant no. KFZ 01LC1810A), Svenska Forskningsrådet Formas (contract nos. 2018-02434, 2018-02436, 2018-02437, 2018-02438) and Ministerio de Ciencia e Innovación (MICINN) (through APCIN (grant no. PCI2018-093149)). Support was also provided by the Lund University strategic research areas BECC and MERGE.
This paper was edited by Ben Bond-Lamberty and reviewed by Jed Kaplan and Christian Körner.
Ainsworth, E. A. and Long, S. P.: What have we learned from 15 years of free-air CO2 enrichment (FACE)? A meta-analytic review of the responses of photosynthesis, canopy properties and plant production to rising CO2, New Phytol., 165, 351–371, https://doi.org/10.1111/j.1469-8137.2004.01224.x, 2005.
Barnekow, L.: Holocene tree-line dynamics and inferred climatic changes in the Abisko area, nothern Sweden, based on macrofossil and pollen records, The Holocene, 9, 253–265, 1999.
Batjes, N. H.: ISRIC-WISE global data ser of derived soil properties on a 0.5 by 0.5∘ grid (version 3.0), ISRIC – World Soil Information, Wageningen, available at: http://data.isric.org/geonetwork/srv/eng/catalog.search#/metadata/dc7b283a-8f19-45e1-aaed-e9bd515119bc (last access: 10 December 2021) 2005.
Berglund, B. E., Barnekow, L., Hammarlund, D., Sandgren, P., and Snowball, I. F.: Holocene forest dynamics and climate changes in the Abisko area, northern Sweden – the Sonesson model of vegetation history reconsidered and confirmed, Ecol. Bull., 45, 15–30, 1996.
Bhatt, U. S., Walker, D. A., Raynolds, M. K., Comiso, J. C., Epstein, H. E., Jia, G., Gens, R., Pinzon, J. E., Tucker, C. J., Tweedie, C. E., and Webber, P. J.: Circumpolar Arctic Tundra Vegetation Change Is Linked to Sea Ice Decline, Earth Interact., 14, 1–20, https://doi.org/10.1175/2010ei315.1, 2010.
Bjorkman, A. D., Myers-Smith, I. H., Elmendorf, S. C., Normand, S., Ruger, N., Beck, P. S. A., Blach-Overgaard, A., Blok, D., Cornelissen, J. H. C., Forbes, B. C., Georges, D., Goetz, S. J., Guay, K. C., Henry, G. H. R., HilleRisLambers, J., Hollister, R. D., Karger, D. N., Kattge, J., Manning, P., Prevey, J. S., Rixen, C., Schaepman-Strub, G., Thomas, H. J. D., Vellend, M., Wilmking, M., Wipf, S., Carbognani, M., Hermanutz, L., Levesque, E., Molau, U., Petraglia, A., Soudzilovskaia, N. A., Spasojevic, M. J., Tomaselli, M., Vowles, T., Alatalo, J. M., Alexander, H. D., Anadon-Rosell, A., Angers-Blondin, S., Beest, M. T., Berner, L., Bjork, R. G., Buchwal, A., Buras, A., Christie, K., Cooper, E. J., Dullinger, S., Elberling, B., Eskelinen, A., Frei, E. R., Grau, O., Grogan, P., Hallinger, M., Harper, K. A., Heijmans, M., Hudson, J., Hulber, K., Iturrate-Garcia, M., Iversen, C. M., Jaroszynska, F., Johnstone, J. F., Jorgensen, R. H., Kaarlejarvi, E., Klady, R., Kuleza, S., Kulonen, A., Lamarque, L. J., Lantz, T., Little, C. J., Speed, J. D. M., Michelsen, A., Milbau, A., Nabe-Nielsen, J., Nielsen, S. S., Ninot, J. M., Oberbauer, S. F., Olofsson, J., Onipchenko, V. G., Rumpf, S. B., Semenchuk, P., Shetti, R., Collier, L. S., Street, L. E., Suding, K. N., Tape, K. D., Trant, A., Treier, U. A., Tremblay, J. P., Tremblay, M., Venn, S., Weijers, S., Zamin, T., Boulanger-Lapointe, N., Gould, W. A., Hik, D. S., Hofgaard, A., Jonsdottir, I. S., Jorgenson, J., Klein, J., Magnusson, B., Tweedie, C., Wookey, P. A., Bahn, M., Blonder, B., van Bodegom, P. M., Bond-Lamberty, B., Campetella, G., Cerabolini, B. E. L., Chapin, F. S., 3rd, Cornwell, W. K., Craine, J., Dainese, M., de Vries, F. T., Diaz, S., Enquist, B. J., Green, W., Milla, R., Niinemets, U., Onoda, Y., Ordonez, J. C., Ozinga, W. A., Penuelas, J., Poorter, H., Poschlod, P., Reich, P. B., Sandel, B., Schamp, B., Sheremetev, S., and Weiher, E.: Plant functional trait change across a warming tundra biome, Nature, 562, 57–62, https://doi.org/10.1038/s41586-018-0563-7, 2018.
Brown, C. D., Dufour-Tremblay, G., Jameson, R. G., Mamet, S. D., Trant, A. J., Walker, X. J., Boudreau, S., Harper, K. A., Henry, G. H. R., Hermanutz, L., Hofgaard, A., Isaeva, L., Kershaw, G. P., and Johnstone, J. F.: Reproduction as a bottleneck to treeline advance across the circumarctic forest tundra ecotone, Ecography, 42, 137–147, https://doi.org/10.1111/ecog.03733, 2018.
Bruhwiler, L., Parmentier, F.-J. W., Crill, P., Leonard, M., and Palmer, P. I.: The Arctic Carbon Cycle and Its Response to Changing Climate, Curr. Clim. Change Rep., 7, 14–34, https://doi.org/10.1007/s40641-020-00169-5, 2021.
Buckeridge, K. M., Zufelt, E., Chu, H., and Grogan, P.: Soil nitrogen cycling rates in low arctic shrub tundra are enhanced by litter feedbacks, Plant Soil, 330, 407–421, https://doi.org/10.1007/s11104-009-0214-8, 2009.
Cairns, D. and Moen, J.: Herbivory Influences Tree Lines, J. Ecol., 92, 1019–1024, 2004.
Callaghan, T. V., Jonasson, C., Thierfelder, T., Yang, Z., Hedenas, H., Johansson, M., Molau, U., Van Bogaert, R., Michelsen, A., Olofsson, J., Gwynn-Jones, D., Bokhorst, S., Phoenix, G., Bjerke, J. W., Tommervik, H., Christensen, T. R., Hanna, E., Koller, E. K., and Sloan, V. L.: Ecosystem change and stability over multiple decades in the Swedish subarctic: complex processes and multiple drivers, Philos. T. R. Soc. Lond. B, 368, 20120488, https://doi.org/10.1098/rstb.2012.0488, 2013.
Caswell, T. A., Droettboom, M., Lee, A., Sales de Andrade, E., Hoffmann, T., Hunter, J., Klymak, J., Firing, E., Stansby, D., Varoquaux, N., Nielsen, J. H., Root, B., May, R., Elson, P., Seppänen, J. K., Dale, D., Lee, J.-J., McDougall, D., Straw, A., Hobson, P., hannah, Gohlke, C., Vincent, A. F., Yu, T. S., Ma, E., Silvester, S., Moad, C., Kniazev, N., Ernest, E., and Ivanov, P.: matplotlib/matplotlib: REL: v3.5.0, Zenodo [code], https://doi.org/10.5281/zenodo.592536, 2021.
Chapin, F. S., 3rd, Sturm, M., Serreze, M. C., McFadden, J. P., Key, J. R., Lloyd, A. H., McGuire, A. D., Rupp, T. S., Lynch, A. H., Schimel, J. P., Beringer, J., Chapman, W. L., Epstein, H. E., Euskirchen, E. S., Hinzman, L. D., Jia, G., Ping, C. L., Tape, K. D., Thompson, C. D., Walker, D. A., and Welker, J. M.: Role of land-surface changes in arctic summer warming, Science, 310, 657–660, https://doi.org/10.1126/science.1117368, 2005.
Chapin, F. S. I.: Direct and Indirect Effects of Temperature on Arctic Plants, Polar Biol., 2, 47–52, 1983.
Clemmensen, K. E., Durling, M. B., Michelsen, A., Hallin, S., Finlay, R. D., and Lindahl, B. D.: A tipping point in carbon storage when forest expands into tundra is related to mycorrhizal recycling of nitrogen, Ecol. Lett., 24, 1193–1204, https://doi.org/10.1111/ele.13735, 2021.
Cleveland, C. C., Townsend, A. R., Schimel, D. S., Fisher, H., Howarth, R. W., Hedin, L. O., Perakis, S. S., Latty, E. F., Von Fischer, J. C., Elseroad, A., and Wasson, M. F.: Global patterns of terrestrial biological nitrogen (N2) fixation in natural ecosystems, Global Biogeochem. Cy., 13, 623–645, https://doi.org/10.1029/1999gb900014, 1999.
Dawes, M. A., Hagedorn, F., Handa, I. T., Streit, K., Ekblad, A., Rixen, C., Körner, C., and Hättenschwiler, S.: An alpine treeline in a carbon dioxide-rich world: synthesis of a nine-year free-air carbon dioxide enrichment study, Oecologia, 171, 623–637, https://doi.org/10.1007/s00442-012-2576-5, 2013.
Dusenge, M. E., Duarte, A. G., and Way, D. A.: Plant carbon metabolism and climate change: elevated CO2 and temperature impacts on photosynthesis, photorespiration and respiration, New Phytol., 221, 32–49, https://doi.org/10.1111/nph.15283, 2019.
Elmendorf, S. C., Henry, G. H. R., Hollister, R. D., Björk, R. G., Boulanger-Lapointe, N., Cooper, E. J., Cornelissen, J. H. C., Day, T. A., Dorrepaal, E., Elumeeva, T. G., Gill, M., Gould, W. A., Harte, J., Hik, D. S., Hofgaard, A., Johnson, D. R., Johnstone, J. F., Jónsdóttir, I. S., Jorgenson, J. C., Klanderud, K., Klein, J. A., Koh, S., Kudo, G., Lara, M., Lévesque, E., Magnússon, B., May, J. L., Mercado-Díaz, J. A., Michelsen, A., Molau, U., Myers-Smith, I. H., Oberbauer, S. F., Onipchenko, V. G., Rixen, C., Martin Schmidt, N., Shaver, G. R., Spasojevic, M. J., Þórhallsdóttir, Þ. E., Tolvanen, A., Troxler, T., Tweedie, C. E., Villareal, S., Wahren, C.-H., Walker, X., Webber, P. J., Welker, J. M., and Wipf, S.: Plot-scale evidence of tundra vegetation change and links to recent summer warming, Nat. Clim. Change, 2, 453–457, https://doi.org/10.1038/nclimate1465, 2012.
Elson, P., Sales de Andrade, E., Lucas, G., May, R., Hattersley, R., Campbell, E., Dawson, A., Raynaud, S., scmc72, Little, B., Snow, A. D., Donkers, K., Blay, B., Killick, P., Wilson, N., Peglar, P., lbdreyer, Andrew, Szymaniak, J., Berchet, A., Bosley, C., Davis, L., Filipe, Krasting, J., Bradbury, M., Kirkham, D., stephenworsley, Clément, Caria, G., and Hedley, M.: SciTools/cartopy: v0.20.1, Zenodo [code], https://doi.org/10.5281/zenodo.1182735, 2021.
Emanuelsson, U.: Human Influence on Vegetation in the Torneträsk Area during the Last Three Centuries, Ecol. Bullet., 38, 95–111, 1987.
Epstein, H. E., Kaplan, J. O., Lischke, H., and Yu, Q.: Simulating Future Changes in Arctic and Subarctic Vegetation, Comput. Sci. Eng., 9, 12–23, https://doi.org/10.1109/mcse.2007.84, 2007.
Epstein, H. E., Raynolds, M. K., Walker, D. A., Bhatt, U. S., Tucker, C. J., and Pinzon, J. E.: Dynamics of aboveground phytomass of the circumpolar Arctic tundra during the past three decades, Environ. Res. Lett., 7, 015506, https://doi.org/10.1088/1748-9326/7/1/015506, 2012.
Fatichi, S., Pappas, C., Zscheischler, J., and Leuzinger, S.: Modelling carbon sources and sinks in terrestrial vegetation, New Phytol., 221, 652–668, https://doi.org/10.1111/nph.15451, 2019.
Forbes, B. C., Fauria, M. M., and Zetterberg, P.: Russian Arctic warming and “greening” are closely tracked by tundra shrub willows, Glob. Change Biol., 16, 1542–1554, https://doi.org/10.1111/j.1365-2486.2009.02047.x, 2010.
Friend, A. D., Eckes-Shephard, A. H., Fonti, P., Rademacher, T. T., Rathgeber, C. B. K., Richardson, A. D., and Turton, R. H.: On the need to consider wood formation processes in global vegetation models and a suggested approach, Ann. Forest Sci., 76, 49, https://doi.org/10.1007/s13595-019-0819-x, 2019.
Gommers, R., Virtanen, P., Burovski, E., Oliphant, T. E., Weckesser, W., Cournapeau, D., alexbrc, Reddy, T., Peterson, P., Haberland, M., Wilson, J., Nelson, A., endolith, Mayorov, N., van der Walt, S., Polat, I., Laxalde, D., Brett, M., Larson, E., Millman, J., Lars, van Mulbregt, P., eric-jones, Carey, C. J., Moore, E., Kern, R., peterbell10, Leslie, T., Perktold, J., and Striega, K.: ScipPy python package, Zenodo [code], https://doi.org/10.5281/zenodo.595738, 2021.
Grau, O., Ninot, J. M., Blanco-Moreno, J. M., van Logtestijn, R. S. P., Cornelissen, J. H. C., and Callaghan, T. V.: Shrub-tree interactions and environmental changes drive treeline dynamics in the Subarctic, Oikos, 121, 1680–1690, https://doi.org/10.1111/j.1600-0706.2011.20032.x, 2012.
Hallinger, M., Manthey, M., and Wilmking, M.: Establishing a missing link: warm summers and winter snow cover promote shrub expansion into alpine tundra in Scandinavia, New Phytol., 186, 890–899, 2010.
Harris, C. R., Millman, K. J., van der Walt, S. J., Gommers, R., Virtanen, P., Cournapeau, D., Wieser, E., Taylor, J., Berg, S., Smith, N. J., Kern, R., Picus, M., Hoyer, S., van Kerkwijk, M. H., Brett, M., Haldane, A., Fernández del Río, J., Wiebe, M., Peterson, P., Gérard-Marchant, P., Sheppard, K., Reddy, T., Weckesser, W., Abbasi, H., Gohlke, C., and Oliphant, T. E.: Array programming with NumPy, Nature, 585, 357–362, https://doi.org/10.1038/s41586-020-2649-2, 2020.
Harsch, M. A., Hulme, P. E., McGlone, M. S., and Duncan, R. P.: Are treelines advancing? A global meta-analysis of treeline response to climate warming, Ecol. Lett., 12, 1040–1049, https://doi.org/10.1111/j.1461-0248.2009.01355.x, 2009.
Haxeltine, A. and Prentice, I. C.: A General Model for the Light-Use Efficiency of Primary Production, Funct. Ecol., 10, 551–561, https://doi.org/10.2307/2390165, 1996.
Hedenås, H., Olsson, H., Jonasson, C., Bergstedt, J., Dahlberg, U., and Callaghan, T. V.: Changes in Tree Growth, Biomass and Vegetation Over a 13-Year Period in the Swedish Sub-Arctic, Ambio, 40, 672–682, https://doi.org/10.1007/s13280-011-0173-1, 2011.
Hengl, T., Mendes de Jesus, J., Heuvelink, G. B., Ruiperez Gonzalez, M., Kilibarda, M., Blagotic, A., Shangguan, W., Wright, M. N., Geng, X., Bauer-Marschallinger, B., Guevara, M. A., Vargas, R., MacMillan, R. A., Batjes, N. H., Leenaars, J. G., Ribeiro, E., Wheeler, I., Mantel, S., and Kempen, B.: SoilGrids250m: Global gridded soil information based on machine learning, PLoS One, 12, e0169748, https://doi.org/10.1371/journal.pone.0169748, 2017.
Hickler, T., Smith, B., Prentice, I. C., MjÖFors, K., Miller, P., Arneth, A., and Sykes, M. T.: CO2 fertilization in temperate FACE experiments not representative of boreal and tropical forests, Glob. Change Biol., 14, 1531–1542, https://doi.org/10.1111/j.1365-2486.2008.01598.x, 2008.
Hicks, L. C., Rousk, K., Rinnan, R., and Rousk, J.: Soil Microbial Responses to 28 Years of Nutrient Fertilization in a Subarctic Heath, Ecosystems, 23, 1107–1119, https://doi.org/10.1007/s10021-019-00458-7, 2019.
Hoch, G. and Körner, C.: Global patterns of mobile carbon stores in trees at the high-elevation tree line, Glob. Ecol. Biogeogr., 21, 861–871, https://doi.org/10.1111/j.1466-8238.2011.00731.x, 2012.
Hofgaard, A., Dalen, L., and Hytteborn, H.: Tree reqruitment above the treeline and potential for climate-driven treeline change, J. Veg. Sci., 20, 1133–1144, 2009.
Hofgaard, A., Harper, K. A., and Golubeva, E.: The role of the circumarctic forest–tundra ecotone for Arctic biodiversity, Biodiversity, 13, 174–181, https://doi.org/10.1080/14888386.2012.700560, 2012.
Hofgaard, A., Ols, C., Drobyshev, I., Kirchhefer, A. J., Sandberg, S., and Söderström, L.: Non-stationary Response of Tree Growth to Climate Trends Along the Arctic Margin, Ecosystems, 22, 434–451, https://doi.org/10.1007/s10021-018-0279-4, 2019.
Holtmeier, F. K. and Broll, G. E.: Treeline advance – driving processes and adverse factors, Landscape Online, 1, 1–33, https://doi.org/10.3097/lo.200701, 2007.
Josefsson, M.: The Geoecology of Subalpine Heaths in the Abisko Valley, Northern Sweden, A study of periglacial conditions, Department of Physical Geography, Uppsala University, Sweden, 180 pp., 1990.
Karlsson, P. S. and Weih, M.: Relationships between Nitrogen Economy and Performance in the Mountain Birch Betula pubescens ssp. tortuosa, Ecol. Bull., 45, 71–78, 1996.
Kollas, C., Vitasse, Y., Randin, C. F., Hoch, G., and Korner, C.: Unrestricted quality of seeds in European broad-leaved tree species growing at the cold boundary of their distribution, Ann. Bot., 109, 473–480, https://doi.org/10.1093/aob/mcr299, 2012.
Kullman, L.: A richer, greener and smaller alpine world: review and projection of warming-induced plant cover change in the Swedish Scandes, Ambio, 39, 159–169, https://doi.org/10.1007/s13280-010-0021-8, 2010.
Kullman, L. and KjÄLlgren, L.: Holocene pine tree-line evolution in the Swedish Scandes: Recent tree-line rise and climate change in a long-term perspective, Boreas, 35, 159–168, https://doi.org/10.1111/j.1502-3885.2006.tb01119.x, 2006.
Körner, C.: Carbon limitation in trees, J. Ecol., 91, 4–17, 2003.
Körner, C.: Paradigm shift in plant growth control, Curr. Opin. Plant Biol., 25, 107–114, https://doi.org/10.1016/j.pbi.2015.05.003, 2015.
Körner, C. and Paulsen, J.: A World-Wide Study of High Altitude Treeline Temperatures, J. Biogeogr., 31, 713–732, 2004.
Körner, C., Basler, D., Hoch, G., Kollas, C., Lenz, A., Randin, C. F., Vitasse, Y., and Zimmermann, N. E.: Where, why and how? Explaining the low-temperature range limits of temperate tree species, J. Ecol., 104, 1079–1088, https://doi.org/10.1111/1365-2745.12574, 2016.
Lamarque, J. F., Dentener, F., McConnell, J., Ro, C. U., Shaw, M., Vet, R., Bergmann, D., Cameron-Smith, P., Dalsoren, S., Doherty, R., Faluvegi, G., Ghan, S. J., Josse, B., Lee, Y. H., MacKenzie, I. A., Plummer, D., Shindell, D. T., Skeie, R. B., Stevenson, D. S., Strode, S., Zeng, G., Curran, M., Dahl-Jensen, D., Das, S., Fritzsche, D., and Nolan, M.: Multi-model mean nitrogen and sulfur deposition from the Atmospheric Chemistry and Climate Model Intercomparison Project (ACCMIP): evaluation of historical and projected future changes, Atmos. Chem. Phys., 13, 7997–8018, https://doi.org/10.5194/acp-13-7997-2013, 2013.
Leuzinger, S., Manusch, C., Bugmann, H., and Wolf, A.: A sink-limited growth model improves biomass estimation along boreal and alpine tree lines, Glob. Ecol. Biogeogr., 22, 924–932, https://doi.org/10.1111/geb.12047, 2013.
LPJ-GUESS developers: LPJ-GUESS home page, available at: https://web.nateko.lu.se/lpj-guess/, last access: 10 December 2021.
McGuire, A. D., Anderson, L. G., Christensen, T. R., Dallimore, S., Guo, L., Hayes, D. J., Heimann, M., Lorenson, T. D., Macdonald, R. W., and Roulet, N.: Sensitivity of the carbon cycle in the Arctic to climate change, Ecol. Monogr., 79, 523–555, https://doi.org/10.1890/08-2025.1, 2009.
McGuire, A. D., Christensen, T. R., Hayes, D., Heroult, A., Euskirchen, E., Kimball, J. S., Koven, C., Lafleur, P., Miller, P. A., Oechel, W., Peylin, P., Williams, M., and Yi, Y.: An assessment of the carbon balance of Arctic tundra: comparisons among observations, process models, and atmospheric inversions, Biogeosciences, 9, 3185–3204, https://doi.org/10.5194/bg-9-3185-2012, 2012.
Miller, P. A. and Smith, B.: Modelling tundra vegetation response to recent arctic warming, Ambio, 41, 281–291, https://doi.org/10.1007/s13280-012-0306-1, 2012.
Myers-Smith, I. H., Forbes, B. C., Wilmking, M., Hallinger, M., Lantz, T., Blok, D., Tape, K. D., Macias-Fauria, M., Sass-Klaassen, U., Lévesque, E., Boudreau, S., Ropars, P., Hermanutz, L., Trant, A., Collier, L. S., Weijers, S., Rozema, J., Rayback, S. A., Schmidt, N. M., Schaepman-Strub, G., Wipf, S., Rixen, C., Ménard, C. B., Venn, S., Goetz, S., Andreu-Hayles, L., Elmendorf, S., Ravolainen, V., Welker, J., Grogan, P., Epstein, H. E., and Hik, D. S.: Shrub expansion in tundra ecosystems: dynamics, impacts and research priorities, Environ. Res. Lett., 6, 045509, https://doi.org/10.1088/1748-9326/6/4/045509, 2011.
Myers-Smith, I. H., Elmendorf, S. C., Beck, P. S. A., Wilmking, M., Hallinger, M., Blok, D., Tape, K. D., Rayback, S. A., Macias-Fauria, M., Forbes, B. C., Speed, J. D. M., Boulanger-Lapointe, N., Rixen, C., Lévesque, E., Schmidt, N. M., Baittinger, C., Trant, A. J., Hermanutz, L., Collier, L. S., Dawes, M. A., Lantz, T. C., Weijers, S., Jørgensen, R. H., Buchwal, A., Buras, A., Naito, A. T., Ravolainen, V., Schaepman-Strub, G., Wheeler, J. A., Wipf, S., Guay, K. C., Hik, D. S., and Vellend, M.: Climate sensitivity of shrub growth across the tundra biome, Nat. Clim. Change, 5, 887–891, https://doi.org/10.1038/nclimate2697, 2015.
Myers-Smith, I. H., Hik, D. S., and Aerts, R.: Climate warming as a driver of tundra shrubline advance, J. Ecol., 106, 547–560, https://doi.org/10.1111/1365-2745.12817, 2018.
Olsson, P.-O., Heliasz, M., Jin, H., and Eklundh, L.: Mapping the reduction in gross primary productivity in subarctic birch forests due to insect outbreaks, Biogeosciences, 14, 1703–1719, https://doi.org/10.5194/bg-14-1703-2017, 2017.
Ovhed, M. and Holmgren, B.: Modelling and measuring evapotranspiration in a mountain birch forest, Ecol. Bull., 45, 31–44, 1996.
Parker, T. C., Sanderman, J., Holden, R. D., Blume-Werry, G., Sjogersten, S., Large, D., Castro-Diaz, M., Street, L. E., Subke, J. A., and Wookey, P. A.: Exploring drivers of litter decomposition in a greening Arctic: results from a transplant experiment across a treeline, Ecology, 99, 2284–2294, https://doi.org/10.1002/ecy.2442, 2018.
Paulsen, J. and Körner, C.: A climate-based model to predict potential treeline position around the globe, Alpine Bot., 124, 1–12, https://doi.org/10.1007/s00035-014-0124-0, 2014.
Piao, S., Sitch, S., Ciais, P., Friedlingstein, P., Peylin, P., Wang, X., Ahlstrom, A., Anav, A., Canadell, J. G., Cong, N., Huntingford, C., Jung, M., Levis, S., Levy, P. E., Li, J., Lin, X., Lomas, M. R., Lu, M., Luo, Y., Ma, Y., Myneni, R. B., Poulter, B., Sun, Z., Wang, T., Viovy, N., Zaehle, S., and Zeng, N.: Evaluation of terrestrial carbon cycle models for their response to climate variability and to CO2 trends, Glob. Change Biol., 19, 2117–2132, https://doi.org/10.1111/gcb.12187, 2013.
Pugh, T. A. M., Muller, C., Arneth, A., Haverd, V., and Smith, B.: Key knowledge and data gaps in modelling the influence of CO2 concentration on the terrestrial carbon sink, J. Plant Physiol., 203, 3–15, https://doi.org/10.1016/j.jplph.2016.05.001, 2016.
Rees, W. G., Hofgaard, A., Boudreau, S., Cairns, D. M., Harper, K., Mamet, S., Mathisen, I., Swirad, Z., and Tutubalina, O.: Is subarctic forest advance able to keep pace with climate change?, Glob. Change Biol., 26, 3965–3977, https://doi.org/10.1111/gcb.15113, 2020.
Rundqvist, S., Hedenås, H., Sandström, A., Emanuelsson, U., Eriksson, H., Jonasson, C., and Callaghan, T. V.: Tree and Shrub Expansion Over the Past 34 Years at the Tree-Line Near Abisko, Sweden, Ambio, 40, 683–692, https://doi.org/10.1007/s13280-011-0174-0, 2011.
Scharn, R., Brachmann, C. G., Patchett, A., Reese, H., Bjorkman, A., Alatalo, J., Björk, R. G., Jägerbrand, A. K., Molau, U., and Björkman, M. P.: Vegetation responses to 26 years of warming at Latnjajaure Field Station, northern Sweden, Arctic Science, 1–20, https://doi.org/10.1139/as-2020-0042, 2021.
Scherrer, D., Vitasse, Y., Guisan, A., Wohlgemuth, T., Lischke, H., and Gomez Aparicio, L.: Competition and demography rather than dispersal limitation slow down upward shifts of trees' upper elevation limits in the Alps, J. Ecol., 108, 2416–2430, https://doi.org/10.1111/1365-2745.13451, 2020.
Serreze, M. C. and Barry, R. G.: Processes and impacts of Arctic amplification: A research synthesis, Glob. Planet. Change, 77, 85–96, https://doi.org/10.1016/j.gloplacha.2011.03.004, 2011.
Shi, M., Fisher, J. B., Brzostek, E. R., and Phillips, R. P.: Carbon cost of plant nitrogen acquisition: global carbon cycle impact from an improved plant nitrogen cycle in the Community Land Model, Glob. Change Biol., 22, 1299–1314, https://doi.org/10.1111/gcb.13131, 2016.
Sitch, S., Smith, B., Prentice, I. C., Arneth, A., Bondeau, A., Cramer, W., Kaplan, J. O., Levis, S., Lucht, W., Sykes, M. T., Thonicke, K., and Venevsky, S.: Evaluation of ecosystem dynamics, plant geography and terrestrial carbon cycling in the LPJ dynamic global vegetation model, Glob. Change Biol., 9, 161–185, https://doi.org/10.1046/j.1365-2486.2003.00569.x, 2003.
Smith, B., Prentice, I. C., and Sykes, M. T.: Representation of vegetation dynamics in the modelling of terrestrial ecosystems: comparing two contrasting approaches within European climate space, Glob. Ecol. Biogeogr., 10, 621–637, https://doi.org/10.1046/j.1466-822X.2001.t01-1-00256.x, 2001.
Smith, B., Wårlind, D., Arneth, A., Hickler, T., Leadley, P., Siltberg, J., and Zaehle, S.: Implications of incorporating N cycling and N limitations on primary production in an individual-based dynamic vegetation model, Biogeosciences, 11, 2027–2054, https://doi.org/10.5194/bg-11-2027-2014, 2014.
Sturm, M.: Changing snow and shrub conditions affect albedo with global implications, J. Geophys. Res., 110, G01004, https://doi.org/10.1029/2005jg000013, 2005.
Sturm, M., Holmgren, J., McFadden, J. P., Liston, G. E., Chapin, F. S., and Racine, C. H.: Snow–Shrub Interactions in Arctic Tundra: A Hypothesis with Climatic Implications, J. Clim., 14, 336–344, https://doi.org/10.1175/1520-0442(2001)014<0336:Ssiiat>2.0.Co;2, 2001.
Sullivan, P., Ellison, S., McNown, R., Brownlee, A., and Sveinbjörnsson, B.: Evidence of soil nutrient availability as the proximate constraint on growth of treeline trees in northwest Alaska, Ecology, 96, 716–727, 2015.
Sundqvist, M. K., Björk, R. G., and Molau, U.: Establishment of boreal forest species in alpine dwarf-shrub heath in subarctic Sweden, Plant Ecol. Div., 1, 67–75, https://doi.org/10.1080/17550870802273395, 2008.
Sveinbjörnsson, B., Nordell, O., and Kauhanen, H.: Nutrient relations of mountain birch growth at and below the elevational tree-line in Swedish Lapland, Funct. Ecol., 6, 213–220, 1992.
Taylor, K. E., Stouffer, R. J., and Meehl, G. A.: An Overview of CMIP5 and the Experiment Design, Bull. Am. Meteorol. Soc., 93, 485–498, https://doi.org/10.1175/bams-d-11-00094.1, 2012.
The pandas development team: pandas-dev/pandas, Zenodo [code], https://doi.org/10.5281/zenodo.4309786, 2020.
Truong, C., Palme, A. E., and Felber, F.: Recent invasion of the mountain birch Betula pubescens ssp. tortuosa above the treeline due to climate change: genetic and ecological study in northern Sweden, J. Evol. Biol., 20, 369–380, https://doi.org/10.1111/j.1420-9101.2006.01190.x, 2007.
Van Bogaert, R., Haneca, K., Hoogesteger, J., Jonasson, C., De Dapper, M., and Callaghan, T. V.: A century of tree line changes in sub-Arctic Sweden shows local and regional variability and only a minor influence of 20th century climate warming, J. Biogeogr., 38, 907–921, https://doi.org/10.1111/j.1365-2699.2010.02453.x, 2011.
Virkkala, A. M., Aalto, J., Rogers, B. M., Tagesson, T., Treat, C. C., Natali, S. M., Watts, J. D., Potter, S., Lehtonen, A., Mauritz, M., Schuur, E. A. G., Kochendorfer, J., Zona, D., Oechel, W., Kobayashi, H., Humphreys, E., Goeckede, M., Iwata, H., Lafleur, P. M., Euskirchen, E. S., Bokhorst, S., Marushchak, M., Martikainen, P. J., Elberling, B., Voigt, C., Biasi, C., Sonnentag, O., Parmentier, F. W., Ueyama, M., Celis, G., St Loius, V. L., Emmerton, C. A., Peichl, M., Chi, J., Jarveoja, J., Nilsson, M. B., Oberbauer, S. F., Torn, M. S., Park, S. J., Dolman, H., Mammarella, I., Chae, N., Poyatos, R., Lopez-Blanco, E., Rojle Christensen, T., Jung Kwon, M., Sachs, T., Holl, D., and Luoto, M.: Statistical upscaling of ecosystem CO2 fluxes across the terrestrial tundra and boreal domain: regional patterns and uncertainties, Glob. Change Biol., 27, 4040–4059, https://doi.org/10.1111/gcb.15659, 2021.
Vowles, T., Lindwall, F., Ekblad, A., Bahram, M., Furneaux, B. R., Ryberg, M., and Bjork, R. G.: Complex effects of mammalian grazing on extramatrical mycelial biomass in the Scandes forest-tundra ecotone, Ecol. Evol., 8, 1019–1030, https://doi.org/10.1002/ece3.3657, 2018.
Wania, R., Ross, I., and Prentice, I. C.: Integrating peatlands and permafrost into a dynamic global vegetation model: 1. Evaluation and sensitivity of physical land surface processes, Global Biogeochem. Cy., 23, GB3014, https://doi.org/10.1029/2008gb003412, 2009.
Wei, Y., Liu, S., Huntzinger, D. N., Michalak, A. M., Viovy, N., Post, W. M., Schwalm, C. R., Schaefer, K., Jacobson, A. R., Lu, C., Tian, H., Ricciuto, D. M., Cook, R. B., Mao, J., and Shi, X.: The North American Carbon Program Multi-scale Synthesis and Terrestrial Model Intercomparison Project – Part 2: Environmental driver data, Geosci. Model Dev., 7, 2875–2893, https://doi.org/10.5194/gmd-7-2875-2014, 2014.
Weih, M. and Karlsson, S.: The nitrogen economy of mountain birch seedlings: implications for winter survival, J. Ecol., 87, 211–219, 1999.
Wolf, A., Callaghan, T. V., and Larson, K.: Future changes in vegetation and ecosystem function of the Barents Region, Climatic Change, 87, 51–73, https://doi.org/10.1007/s10584-007-9342-4, 2008.
Yang, Z., Hanna, E., and Callaghan, T. V.: Modelling surface-air-temperature variation over complex terrain around abisko, swedish lapland: uncertainties of measurements and models at different scales, Geogr. Ann. A, 93, 89–112, https://doi.org/10.1111/j.1468-0459.2011.00005.x, 2011.
Yang, Z., Hanna, E., Callaghan, T. V., and Jonasson, C.: How can meteorological observations and microclimate simulations improve understanding of 1913–2010 climate change around Abisko, Swedish Lapland?, Meteorol. Appl., 19, 454–463, https://doi.org/10.1002/met.276, 2012.
Zhang, W., Miller, P. A., Smith, B., Wania, R., Koenigk, T., and Döscher, R.: Tundra shrubification and tree-line advance amplify arctic climate warming: results from an individual-based dynamic vegetation model, Environ. Res. Lett., 8, 034023, https://doi.org/10.1088/1748-9326/8/3/034023, 2013.
Zhang, W., Jansson, C., Miller, P. A., Smith, B., and Samuelsson, P.: Biogeophysical feedbacks enhance the Arctic terrestrial carbon sink in regional Earth system dynamics, Biogeosciences, 11, 5503–5519, https://doi.org/10.5194/bg-11-5503-2014, 2014.
Zhang, W., Miller, P. A., Jansson, C., Samuelsson, P., Mao, J., and Smith, B.: Self-Amplifying Feedbacks Accelerate Greening and Warming of the Arctic, Geophys. Res. Lett., 45, 7102–7111, https://doi.org/10.1029/2018gl077830, 2018.