the Creative Commons Attribution 4.0 License.
the Creative Commons Attribution 4.0 License.
 | 21 Dec 2021
Fractionation of stable carbon isotopes during acetate consumption by methanogenic and sulfidogenic microbial communities in rice paddy soils and lake sediments
Pengfei Liu
Peter Claus
Acetate is an important intermediate during the degradation of organic matter in anoxic flooded soils and sediments. Acetate is disproportionated to CH4 and CO2 by methanogenic or is oxidized to CO2 by sulfate-reducing microorganisms. These reactions result in carbon isotope fractionation, depending on the microbial species and their particular carbon metabolism. To learn more about the magnitude of the isotopic enrichment factors (ε) involved, acetate conversion to CH4 and CO2 was measured in anoxic paddy soils from Vercelli (Italy) and the International Rice Research Institute (IRRI, the Philippines) and in anoxic lake sediments from the northeastern and the southwestern basins of Lake Fuchskuhle (Germany). Acetate consumption was measured using samples of paddy soil or lake sediment suspended in water or in phosphate buffer (pH 7.0), both in the absence and presence of sulfate (gypsum), and of methyl fluoride (CH3F), an inhibitor of aceticlastic methanogenesis. Under methanogenic conditions, values of εac for acetate consumption were always in a range of −21 ‰ to −17 ‰ but higher in the lake sediment from the southwestern basin (−11 ‰). Under sulfidogenic conditions εac values tended to be slightly lower (−26 ‰ to −19 ‰), especially when aceticlastic methanogenesis was inhibited. Again, εac in the lake sediment of the southwestern basin was higher (−18 ‰ to −14 ‰). Determination of from the accumulation of 13C in CH4 resulted in much lower values (−37 ‰ to −27 ‰) than from the depletion of 13C in acetate (−21 ‰ to −17 ‰ ), especially when acetate degradation was measured in buffer suspensions. The microbial communities were characterized by sequencing the bacterial 16S rRNA (ribosomal ribonucleic acid) genes as well as the methanogenic mcrA and sulfidogenic dsrB genes. The microbial communities were quite different between lake sediments and paddy soils but were similar in the sediments of the two lake basins and in the soils from Vercelli and the IRRI, and they were similar after preincubation without and with addition of sulfate (gypsum). The different microbial compositions could hardly serve for the prediction of the magnitude of enrichment factors.
- Article
(3362 KB) - Full-text XML
-
Supplement
(2465 KB) - BibTeX
- EndNote


Organic matter degradation under anaerobic conditions results in the production of CO2, when electron acceptors such sulfate (sulfidogenic conditions) are available, and in the production of CH4 and CO2, when they are absent (methanogenic conditions). Carbon dioxide not only is an end product but can also serve as an intermediate. It can for example be converted by chemolithotrophic microorganisms to CH4 or to acetate. These conversion reactions of CO2 have an isotope effect and result in products that are strongly depleted in 13C, expressing isotope enrichment factors (ε) being on the order of −70 ‰ to −50 ‰ (Blaser and Conrad, 2016). However, the conversion of acetate to CO2 by sulfidogenic reactions or to CH4 plus CO2 by methanogenic reactions can also have quite substantial enrichment factors, often being on the order of about −20 ‰ (Goevert and Conrad, 2009, 2010).
Knowledge of enrichment factors is important for the quantification of the pathways involved in anaerobic degradation of organic matter. For example, the relative contribution of hydrogenotrophic and aceticlastic methanogenesis to total CH4 production can be determined in situ from analytical values of 13C in organic matter, CO2 and CH4, if the enrichment factors (ε) are known for the reduction of CO2 to CH4 (hydrogenotrophic methanogenesis) and the cleavage of acetate to CH4 and CO2 (aceticlastic methanogenesis; Conrad, 2005). While ε of the former reaction can be experimentally determined by incubation in the presence of CH3F (Chan et al., 2005; Conrad et al., 2007; Holmes et al., 2014; Penning et al., 2006b), that of the latter reaction is not so easy to determine. So far reference values are mainly available from relatively few experiments with pure microbial cultures. This is true for both aceticlastic methanogenic archaea (Gelwicks et al., 1994; Goevert and Conrad, 2009; Krzycki et al., 1987; Penning et al., 2006a; Valentine et al., 2004; Zyakun et al., 1988) and acetate-oxidizing sulfidogenic bacteria (Goevert and Conrad, 2008, 2010; Londry and DesMarais, 2003).
There are quite some studies of methanogenic and sulfidogenic microbial communities in environmental samples, notably in paddy soils from Italy and the Philippines (P. Liu et al., 2018, 2019; P. F. Liu et al., 2018; Wörner et al., 2016) and in sediments from Lake Fuchskuhle (Chan et al., 2002). However, there are hardly any studies of environmental samples in which ε values of acetate consumption were determined together with the composition of the methanogenic and sulfidogenic microbial communities (Blair and Carter, 1992; Chidthaisong et al., 2002; Conrad et al., 2009; Goevert and Conrad, 2009; Penning et al., 2006a). In order to constrain the magnitude of such ε values, we decided to investigate the stable carbon isotope fractionation during the consumption of acetate in methanogenic and sulfidogenic rice paddy soils and anaerobic lake sediments.
2.1 Environmental samples
The soil samples were from the research stations in Vercelli, Italy, and the International Rice Research Institute (IRRI) in the Philippines. Sampling and soil characteristics were described before (P. F. Liu et al., 2018). The lake sediments (top 10 cm layer) were from the northeastern and southwestern basins of Lake Fuchskuhle (Casper et al., 2003). They were sampled in July 2016 using a gravity core sampler as described before (Kanaparthi et al., 2013).
2.2 Paddy soils
Two different experimental setups were used using soil suspensions in water (unbuffered suspensions) or in 20 mM potassium phosphate buffer (pH 7.0) (buffered suspensions). For the unbuffered suspensions, paddy soil was mixed with autoclaved anoxic H2O at a ratio of 1:1 and incubated under N2 at 25 ∘C (which is close to the in situ temperature) for 4 weeks. Then, 5 mL preincubated soil slurry was incubated at 25 ∘C with 45 mL 5.6 mM sodium acetate in a 150 mL bottle under an atmosphere of N2. The bottles were (i) unamended; (ii) amended with 4.5 mL CH3F; and (iii) amended with 200 µL of a gypsum (CaSO4 • 2H2O) suspension (corresponding to a concentration of 2.5 M sulfate), giving a final concentration of 10 mM sulfate. The experiment was performed in four replicates.
For the buffered suspensions, paddy soil was mixed with autoclaved anoxic H2O at a ratio of 1:1 and incubated under N2 at 25 ∘C for 4 weeks. In a second incubation, paddy soil was mixed with autoclaved anoxic H2O at a ratio of 1:1, amended with 0.07 g CaSO4 • 2H2O and then incubated under N2 at 25 ∘C for 4 weeks. These two preincubated soil slurries were sampled and stored (in one replicate) at −20 ∘C for later molecular analysis. The preincubated soil slurries were also used (in three replicates) for the following incubation experiments. Three different sets of incubations were prepared. In the first set (resulting in methanogenic conditions), 5 mL soil slurry preincubated without sulfate was incubated at 25 ∘C with 40 mL 20 mM potassium phosphate buffer (pH 7.0) in a 150 mL bottle under an atmosphere of N2. The bottles were those amended with (i) 5 mL H2O, (ii) 5 mL H2O + 4.5 mL CH3F, (iii) 5 mL 50 mM sodium acetate and (iv) 5 mL 50 mM sodium acetate + 4.5 mL CH3F. In the second set (resulting in mainly methanogenic conditions), again 5 mL soil slurry preincubated without sulfate was incubated at 25 ∘C with 40 mL 20 mM potassium phosphate buffer (pH 7.0) in a 150 mL bottle under an atmosphere of N2. The amendments were the same as above but with the addition of 200 µL of a CaSO4 suspension giving a final concentration of 10 mM sulfate. In the third set (resulting in sulfidogenic conditions), 5 mL soil slurry preincubated with sulfate was incubated at 25 ∘C with 40 mL 20 mM potassium phosphate buffer (pH 7.0) in a 150 mL bottle under an atmosphere of N2. The amendments were the same as above but with the addition of 200 µL of a CaSO4 suspension corresponding to a concentration of 2.5 M (giving a final concentration of 10 mM sulfate).
2.3 Lake sediments
The lake sediments (northeastern and southwestern basins) of Lake Fuchskuhle were sampled and stored (in one replicate) at −20 ∘C for later molecular analysis. For methanogenic conditions, 5 mL lake sediment was incubated in three replicates at 10 ∘C (which is close to the in situ temperature) with 45 mL 20 mM potassium phosphate buffer (pH 7.0) in a 150 mL bottle under an atmosphere of N2. The bottles were the amended with (i) 5 mL H2O, (ii) 5 mL H2O + 4.5 mL CH3F, (iii) 5 mL 50 mM sodium acetate and (iv) 5 mL 50 mM sodium acetate + 4.5 mL CH3F.
Part of the lake sediments were preincubated with sulfate by adding 0.1 g CaSO4 • 2H2O (gypsum) to 50 mL sediment and incubating at 10 ∘C for 4 weeks. The preincubated lake sediments were sampled and stored (in one replicate) at −20 ∘C for later molecular analysis. For sulfidogenic conditions, 5 mL of the preincubated sediment was incubated in three replicates at 10 ∘C with 40 mL 20 mM potassium phosphate buffer (pH 7.0) in a 150 mL bottle under an atmosphere of N2. The bottles were amended as above but additionally also with 200 µL of a CaSO4 suspension, giving a final concentration of 10 mM sulfate. Samples for later molecular analysis were taken from the original lake sediment and from the lake sediment preincubated with sulfate. The samples were stored at −20 ∘C.
2.4 Extraction of DNA and amplicon sequencing
The lake sediments or paddy soils in the phosphate buffer were collected by centrifugation (11 000×g, 4 ∘C, 5 min). Genomic DNA were extracted with the NucleoSpin Soil kit (Macherey-Nagel, Düren, Germany) by following the user's manual. The DNA was checked by gel electrophoresis (1 % agarose in TEA buffer, stained with GelRed) and quantified by Qubit 2.0. The amplification of 16S rRNA (ribosomal ribonucleic acid), mcrA and dsrB was done as described previously (Liu and Conrad, 2017). This publication also shows in Table S9 in the Supplement all the primers used. In brief, for the first-step PCR (polymerase chain reaction), for 16S rRNA, h515-Y/h926R primers were used with the following PCR protocol: 94 ∘C for 3 min; 15 cycles with 94 ∘C for 30 s, 52 ∘C for 30 s and 68 ∘C for 60 s; and 68 ∘C for 10 min and holding at 8 ∘C. For mcrA, hmlas-mod-F/hmcra-rev-R primers were used with the following PCR protocol: 94 ∘C for 4 min; 15–18 cycles with 94 ∘C for 30 s, 60 ∘C by 1 to 55 ∘C for 30 s and 68 ∘C for 60 s; and 68 ∘C for 10 min and holding at 8 ∘C. For dsrB hDSR1762Fmix/hDSR2010Rmix primers were used with the following PCR protocol: 94 ∘C for 3 min; 25 cycles with 94 ∘C for 30 s, 60 ∘C by 1 to 50 ∘C for 30 s and 68 ∘C for 60 s; and 68 ∘C for 10 min and holding at 8 ∘C.
In the second-step PCR, barcode-head primers were used for the PCR products of 16S rRNA, mcrA and dsrB obtained from the first step with the following PCR protocol: 94 ∘C for 3 min; 10–20 cycles with 94 ∘C for 30 s, 52 ∘C for 30 s and 68 ∘C for 60 s; and 68 ∘C for 10 min and holding at 8 ∘C.
PCR amplicons were purified by AMP xx for both the first- and second-step PCR. After quantification, the individual barcoded amplicons of 16S rRNA genes and dsrB were mixed in equimolar concentrations, with 16S rRNA gene amplicons added in double amounts. The library was sequenced on an Illumina HiSeq 2000 system using the 2×250 cycle combination mode by the Max Planck-Genome-Centre Cologne (Cologne, Germany). For mcrA, individual barcoded amplicons were mixed in equimolar concentrations, and the library was sequenced on an Illumina MiSeq system using the 2×300 cycle combination mode by the Max Planck-Genome-Centre Cologne (Cologne, Germany).
2.5 Amplicon sequence data processing
Amplicon sequence data were analyzed according to the pipeline as described previously (Liu and Conrad, 2017). In brief, paired-end reads were first merged by USEARCH, and 16S rRNA gene and dsrB datasets were separated by primer sequences using Cutadapt and demultiplexed using QIIME 1. Datasets of mcrA were demultiplexed using QIIME1 directly. All reads were subjected to quality control, de novo chimera filtering, singleton filtering and OTU (operational taxonomic unit) clustering according to the UPARSE pipeline. Species-level OTUs for 16S rRNA genes were obtained at 97 % sequence identity. Approximate species-level dsrB and mcrA OTUs were obtained with the gene-specific OTU thresholds of 0.90 (Pelikan et al., 2016) and 0.84 (Yang et al., 2014). Taxonomic identities of the OTUs of 16S rRNA genes were assigned with the Ribosomal Database Project Classifier against the SILVA 123 SSU Ref (small subunit reference) database (Pruesse et al., 2007). Nucleotide sequences of dsrB and mcrA were initially translated into amino acid sequences using FrameBot (Wang et al., 2013). For the dsrB gene, amino acid sequences were aligned to the DsrAB (dissimilatory sulfite reductase) reference sequence alignment (Pelikan et al., 2016) using MAFFT (multiple alignment using fast Fourier transform; Katoh and Standley, 2013). Subsequently, the taxonomic classification of each dsrB OTU was analyzed using the Evolutionary Placement Algorithm (EPA) in RAxML (Randomized Axelerated Maximum Likelihood; Berger et al., 2011). For the mcrA gene, amino acid sequences of each OTU and updated full-length mcrA amino acid sequences from NCBI (National Center for Biotechnology Information) were imported into a mcrA reference ARB database developed by Angel et al. (2012). The taxonomic classification of each mcrA OTU was analyzed by phylogenetic-tree construction using maximum parsimony implemented in ARB software (Ludwig et al., 2004).
2.6 Chemical and isotopic analyses
Chemical and isotopic analyses were performed as described in detail previously (Goevert and Conrad, 2009). Methane was analyzed by gas chromatography (GC) with a flame ionization detector. Carbon dioxide was analyzed after conversion to CH4 with a Ni catalyst. Stable isotope analyses of 13C12C in gas samples were performed using GC-combustion isotope ratio mass spectrometry (GC-C-IRMS). Acetate was measured using high-performance liquid chromatography (HPLC) linked via a Finnigan LC IsoLink to an IRMS. The isotopic values are reported in the delta notation (δ13C) relative to the Vienna Pee Dee Belemnite standard having a 13C12C ratio (Rstandard) of 0.01118: . The precision of the GC-C-IRMS was ±0.2 ‰; that of the HPLC-IRMS was ±0.3 ‰. The carbon of the sodium acetate that was used in the incubation experiments had the following δ13C values: total acetate of −24.4 ‰, acetate methyl of −27.9 ‰ and acetate carboxyl of −20.9 ‰.
2.7 Calculations
Fractionation factors for reaction A → B are defined after Hayes (Hayes, 1993) as
also expressed as in ‰. The carbon isotope enrichment factor εac associated with acetate consumption was calculated from the temporal change of δ13C of acetate as described by Mariotti et al. (1981) from the residual reactant of
and from the product formed by
where δri is the isotopic composition of the reactant (acetate) at the beginning, δr is the isotopic composition of the residual acetate and δp is that of the product (CH4), at the instant when f is determined. f is the fractional yield of the products based on the consumption of acetate (). Linear regression of δ13C of acetate against ln (1−f) yields εac as the slope of best-fit lines. Similarly, linear regression of δ13C of CH4 against yields as the slope of best-fit lines. The regressions of δ13C of acetate were done for data in the range of f<0.5. The linear regressions of δ13C of CH4 were done either for the entire data range or again only for f<0.5. The linear regressions were done individually for each experimental replicate (n=3–4) and were only accepted if r2>0.8 for paddy soils or r2>0.7 for lake sediments. The ε values resulting from the replicate experiments were then averaged (±SE).
For mass balance calculations, total inorganic carbon (TIC) was calculated as the sum of gaseous CO2, dissolved CO2 and bicarbonate using the measured data of gaseous CO2, the pH, and the relevant solubility and equilibrium constants (Stumm and Morgan, 1996).
3.1 Incubation of unbuffered suspensions of rice field soils
Incubation of unbuffered suspensions (soil and H2O) of rice field soil from the International Rice Research Institute (IRRI) in the Philippines with acetate under anoxic conditions resulted in the depletion of acetate and the release of CH4 and CO2 (Fig. 1a and c). In the presence of CH3F, an inhibitor of aceticlastic methanogenesis (Janssen and Frenzel, 1997), acetate was no longer consumed, and production of CH4 and CO2 was inhibited. However, addition of sulfate had only a small effect on acetate consumption and the production of CH4 and CO2 (Fig. 1a and c). Both in the presence and the absence of sulfate, δ13C of the residual acetate and the produced CH4 increased, whereas δ13C in CO2 stayed relatively stable (Fig. 1b and d). In the presence of CH3F, the δ13C in CH4 was much more negative than in its absence. The results were similar for soil from the Rice Research Station in Vercelli, Italy (Fig. S1 in the Supplement).
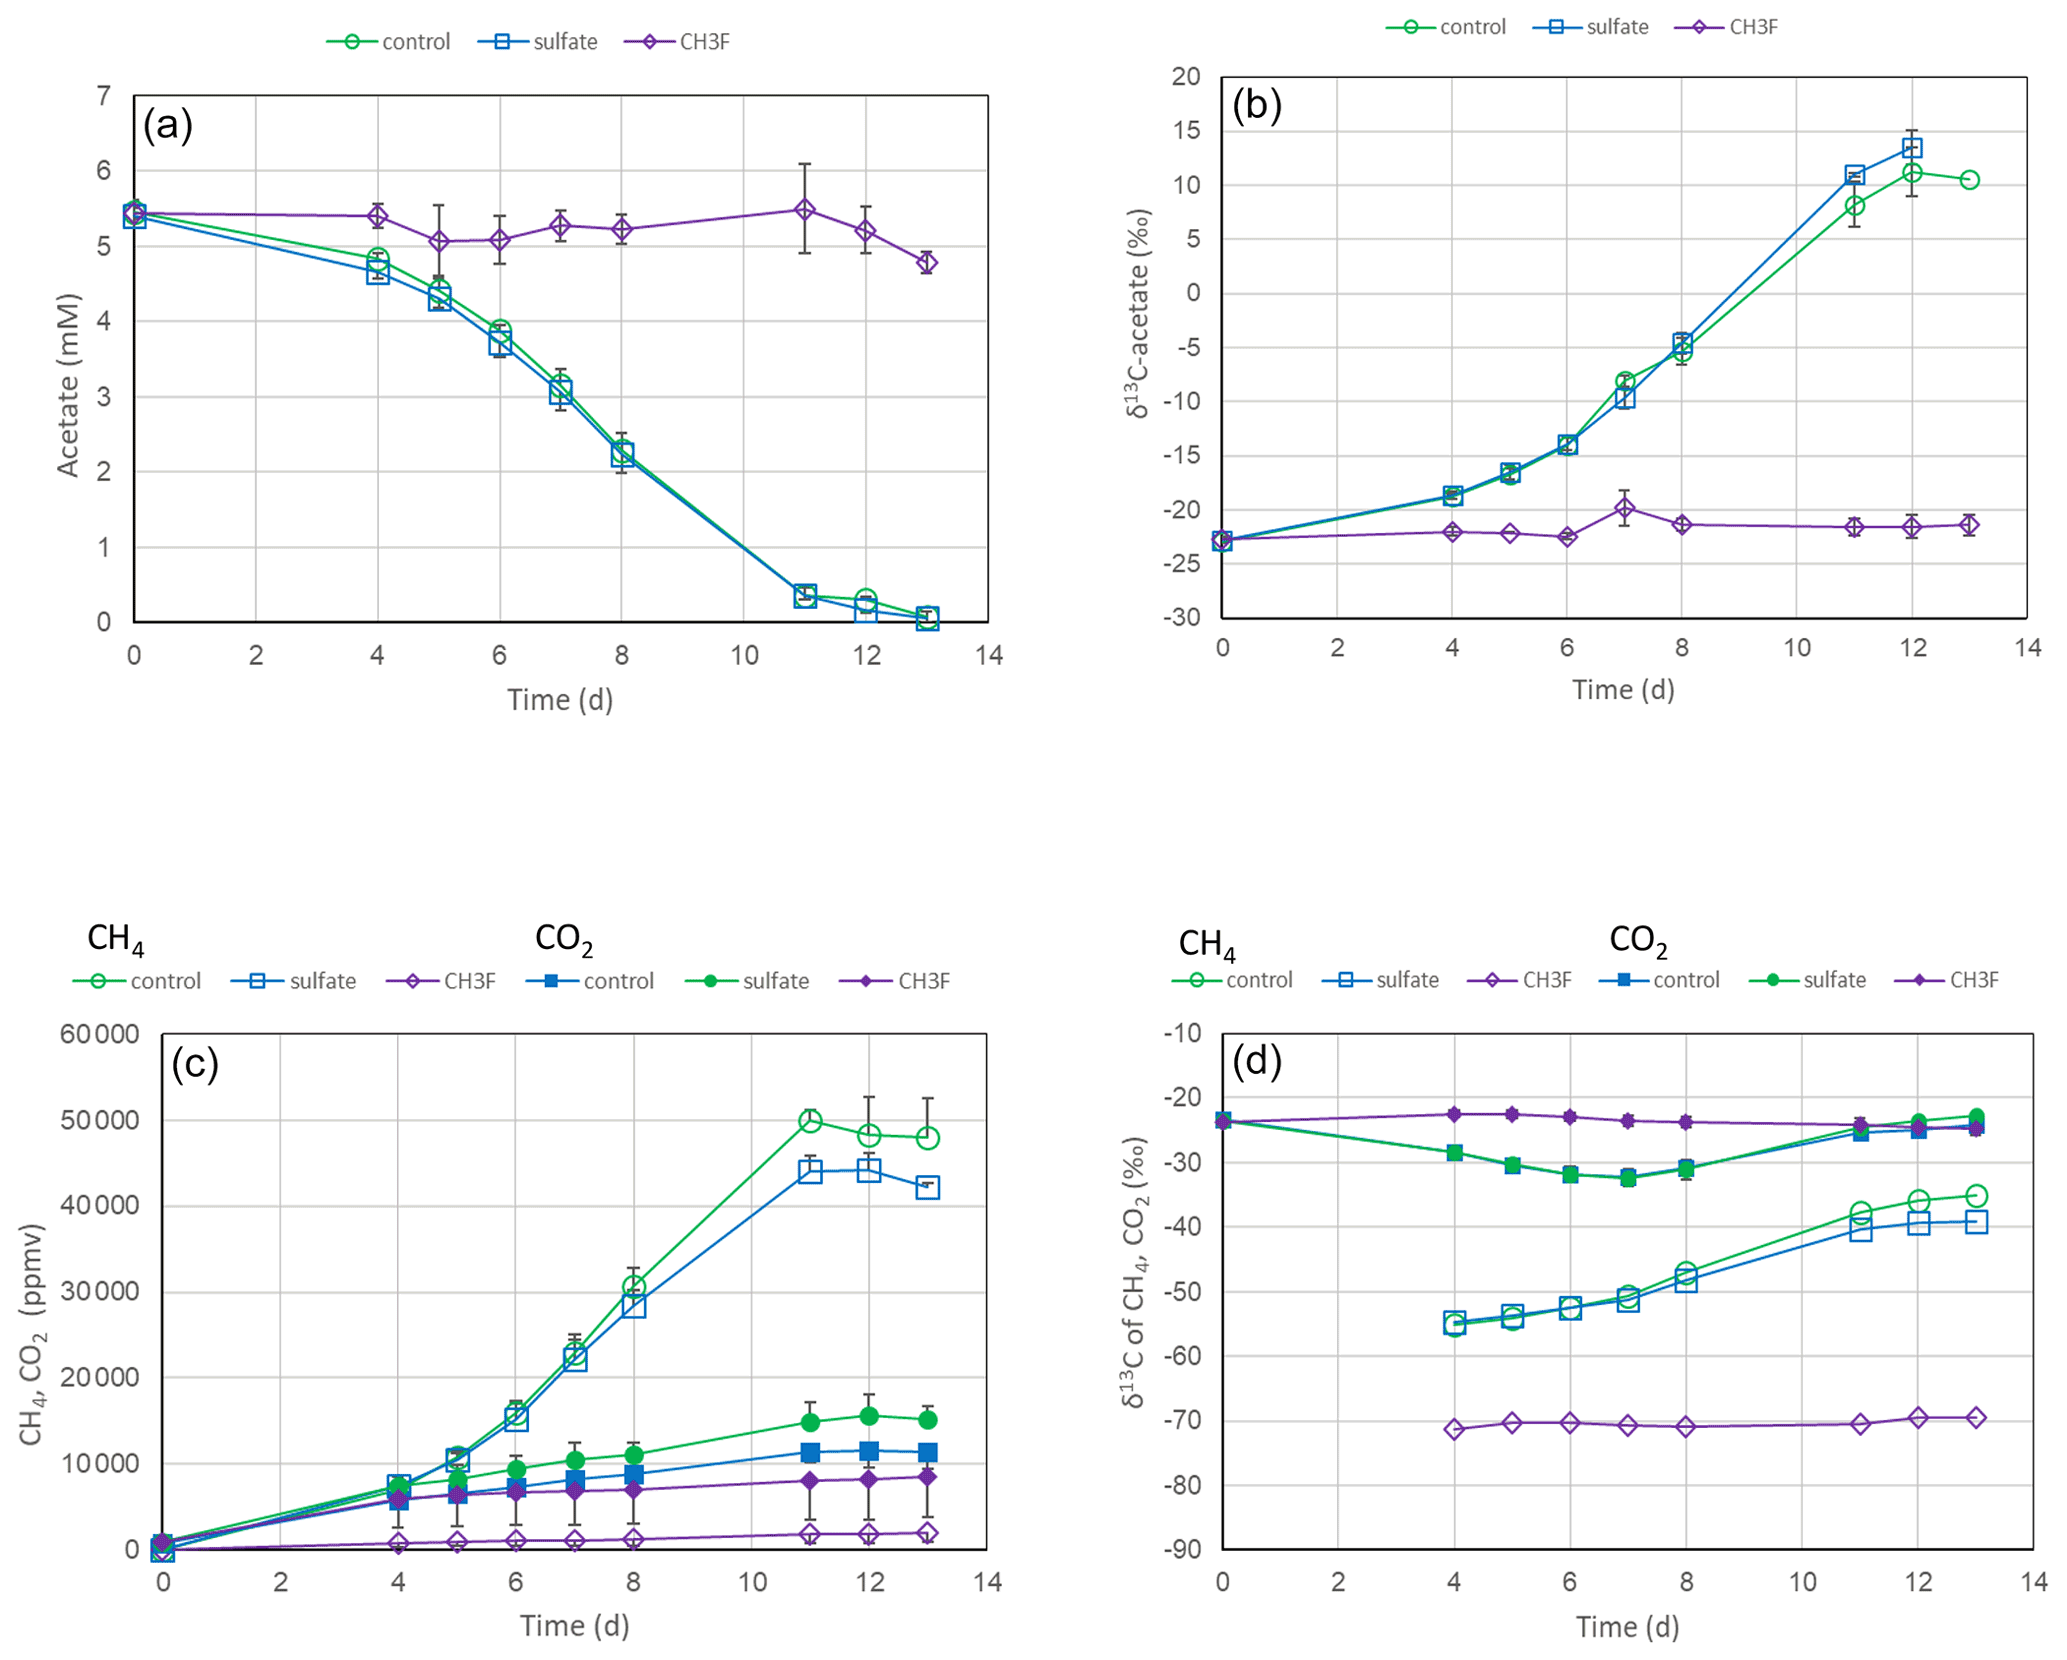
Figure 1Acetate conversion to CH4 and CO2 in unbuffered suspensions of paddy soil from the IRRI (the Philippines) without additions (water control), with gypsum and with CH3F. The panels show the temporal change of (a) concentrations of acetate, (b) δ13C of acetate, (c) partial pressures of CH4 and CO2 ( bar), and (d) δ13C of CH4 and CO2. Means±SE, n=2.
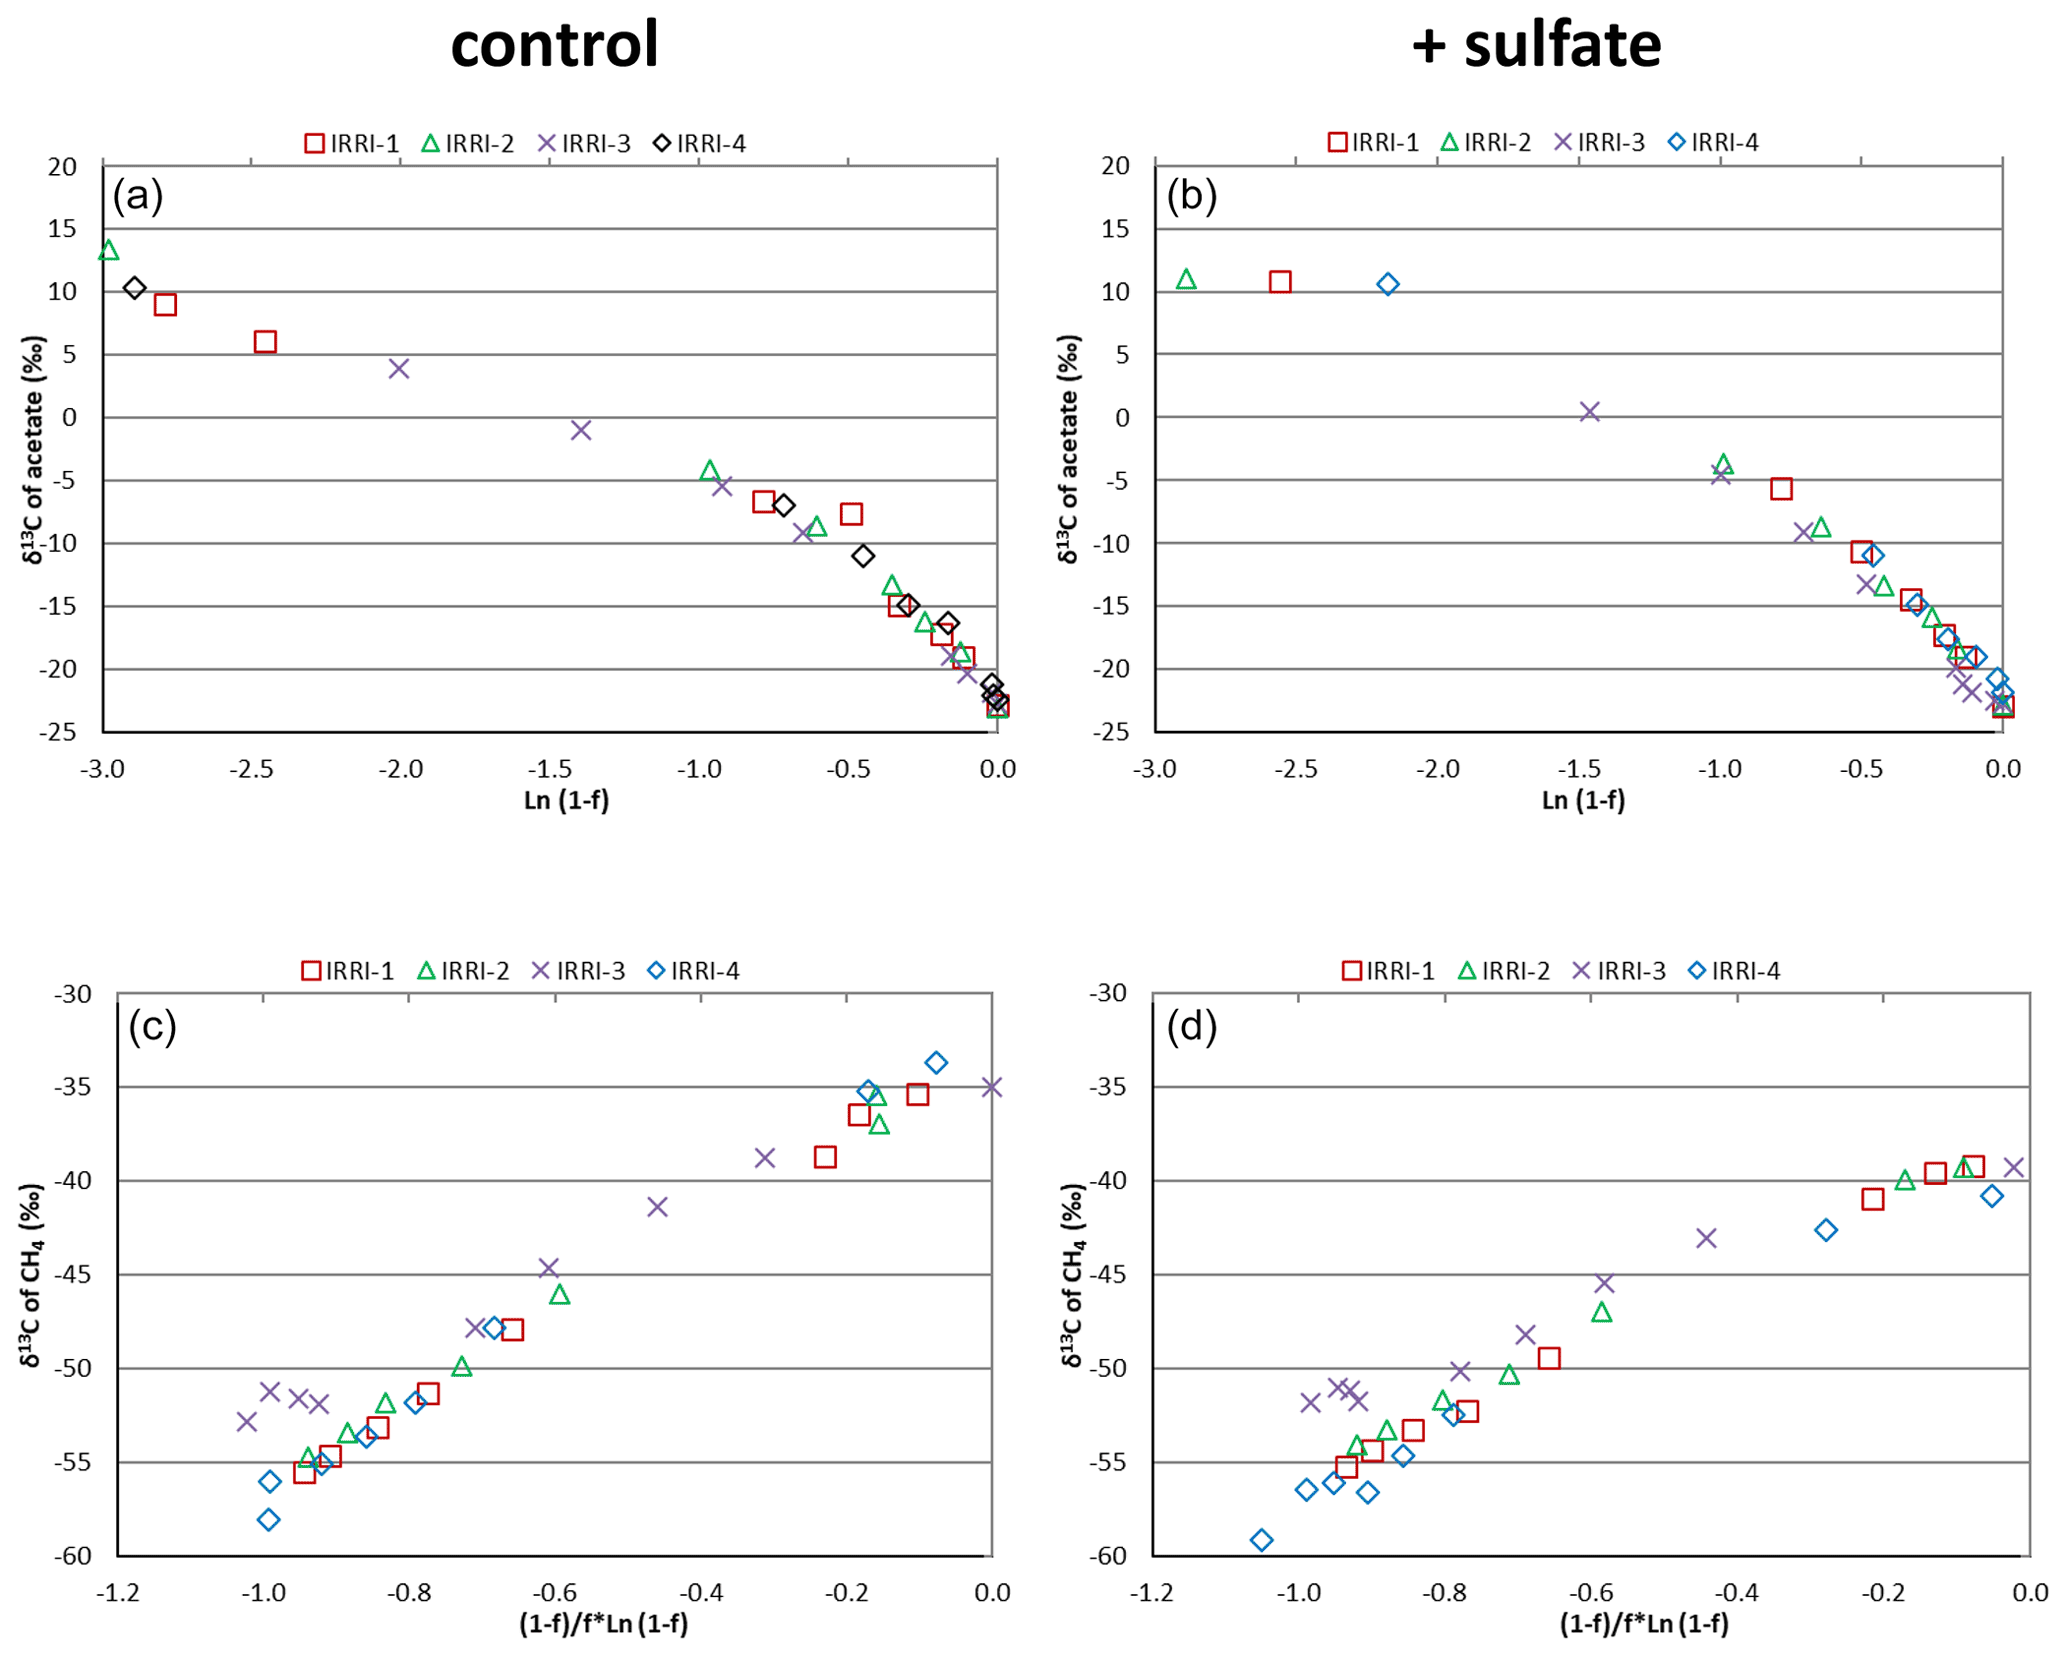
Figure 2Mariotti plots of (a, b) acetate consumption and (c, d) CH4 production in (a, c) the absence (control) and (b, d) the presence of gypsum (and sulfate) in four replicates of unbuffered suspensions of paddy soil from the IRRI.
Mariotti plots of the 13C of acetate as function of the fractions (f) of acetate consumed resulted in similar curves for all four replicates of the incubations of IRRI soil without (Fig. 2a) and with (Fig. 2b) sulfate amendment. The lines were straight for f<0.5 (<50 % of acetate consumed). The same was the case for Mariotti plots of 13CH4, the product of acetate consumption (Fig. 2c and d). The enrichment factors ε, which were calculated from the Mariotti plots, were in the range of −22 ‰ to −19 ‰, irrespective of whether they were determined in the presence or the absence of sulfate and whether they were determined from acetate depletion or from CH4 formation (Fig. 3 and Table S1 in the Supplement). Similar Mariotti plots were obtained for Vercelli soil (Fig. S2 in the Supplement), which resulted in ε values ranging between −20 ‰ and −17 ‰, except for the ε determined for CH4 production in the presence of sulfate, which was only ‰ (Fig. 3).

Figure 3Isotopic enrichment factors (εac or , given as negative values) of unbuffered soil suspensions (Vercelli soil and IRRI soil) and buffered suspensions of paddy soil (Vercelli and IRRI) or sediments of Lake Fuchskuhle (northeastern and southwestern basins). The values of εac (acetate) and (CH4) were measured without the addition of sulfate (methanogenic conditions), with the addition of sulfate during preincubation and the experiment (sulfidogenic conditions), and with sulfate but the preincubation without sulfate (mostly methanogenic conditions). Mean±SE, n=3–4.
Mass balance calculations showed that on a molar basis the accumulated CH4 amounted to about 90 % of the consumed acetate (the methyl group) in the absence and to about 71 % in the presence of sulfate in the IRRI soil and to 97 % and 76 %, respectively, in the Vercelli soil.
3.2 Incubation of buffered suspensions of rice field soils
The experiments with rice field soils were repeated using soil slurries suspended in the phosphate buffer. This was done to run the experiment at a constant pH of 7.0. In Vercelli soil, acetate was consumed, and CH4 and CO2 were produced (Fig. 4a, c and e). The δ13C of the residual acetate and the produced CH4 increased as acetate consumption proceeded (Fig. 4b and d). The δ13C of the produced CO2 first decreased and later increased (Fig. 4f). This happened also when the soil suspensions were incubated in the presence of sulfate after preincubation with sulfate (Fig. 4f), but CH4 production was lower, and CO2 production was higher in the presence than in the absence of sulfate (Fig. 4c and e). Production of CH4 ceased in the presence of sulfate after about 10 d (Fig. 4c). The addition of CH3F completely inhibited CH4 production both in the presence and absence of sulfate (Fig. 4c). It also inhibited CO2 production but only in the absence of sulfate (Fig. 4e). In the presence of sulfate, CH3F only delayed but did not inhibit acetate consumption and CO2 production (Fig. 4a and e), and it also did not prevent the increase of δ13C in the residual acetate (Fig. 4b).
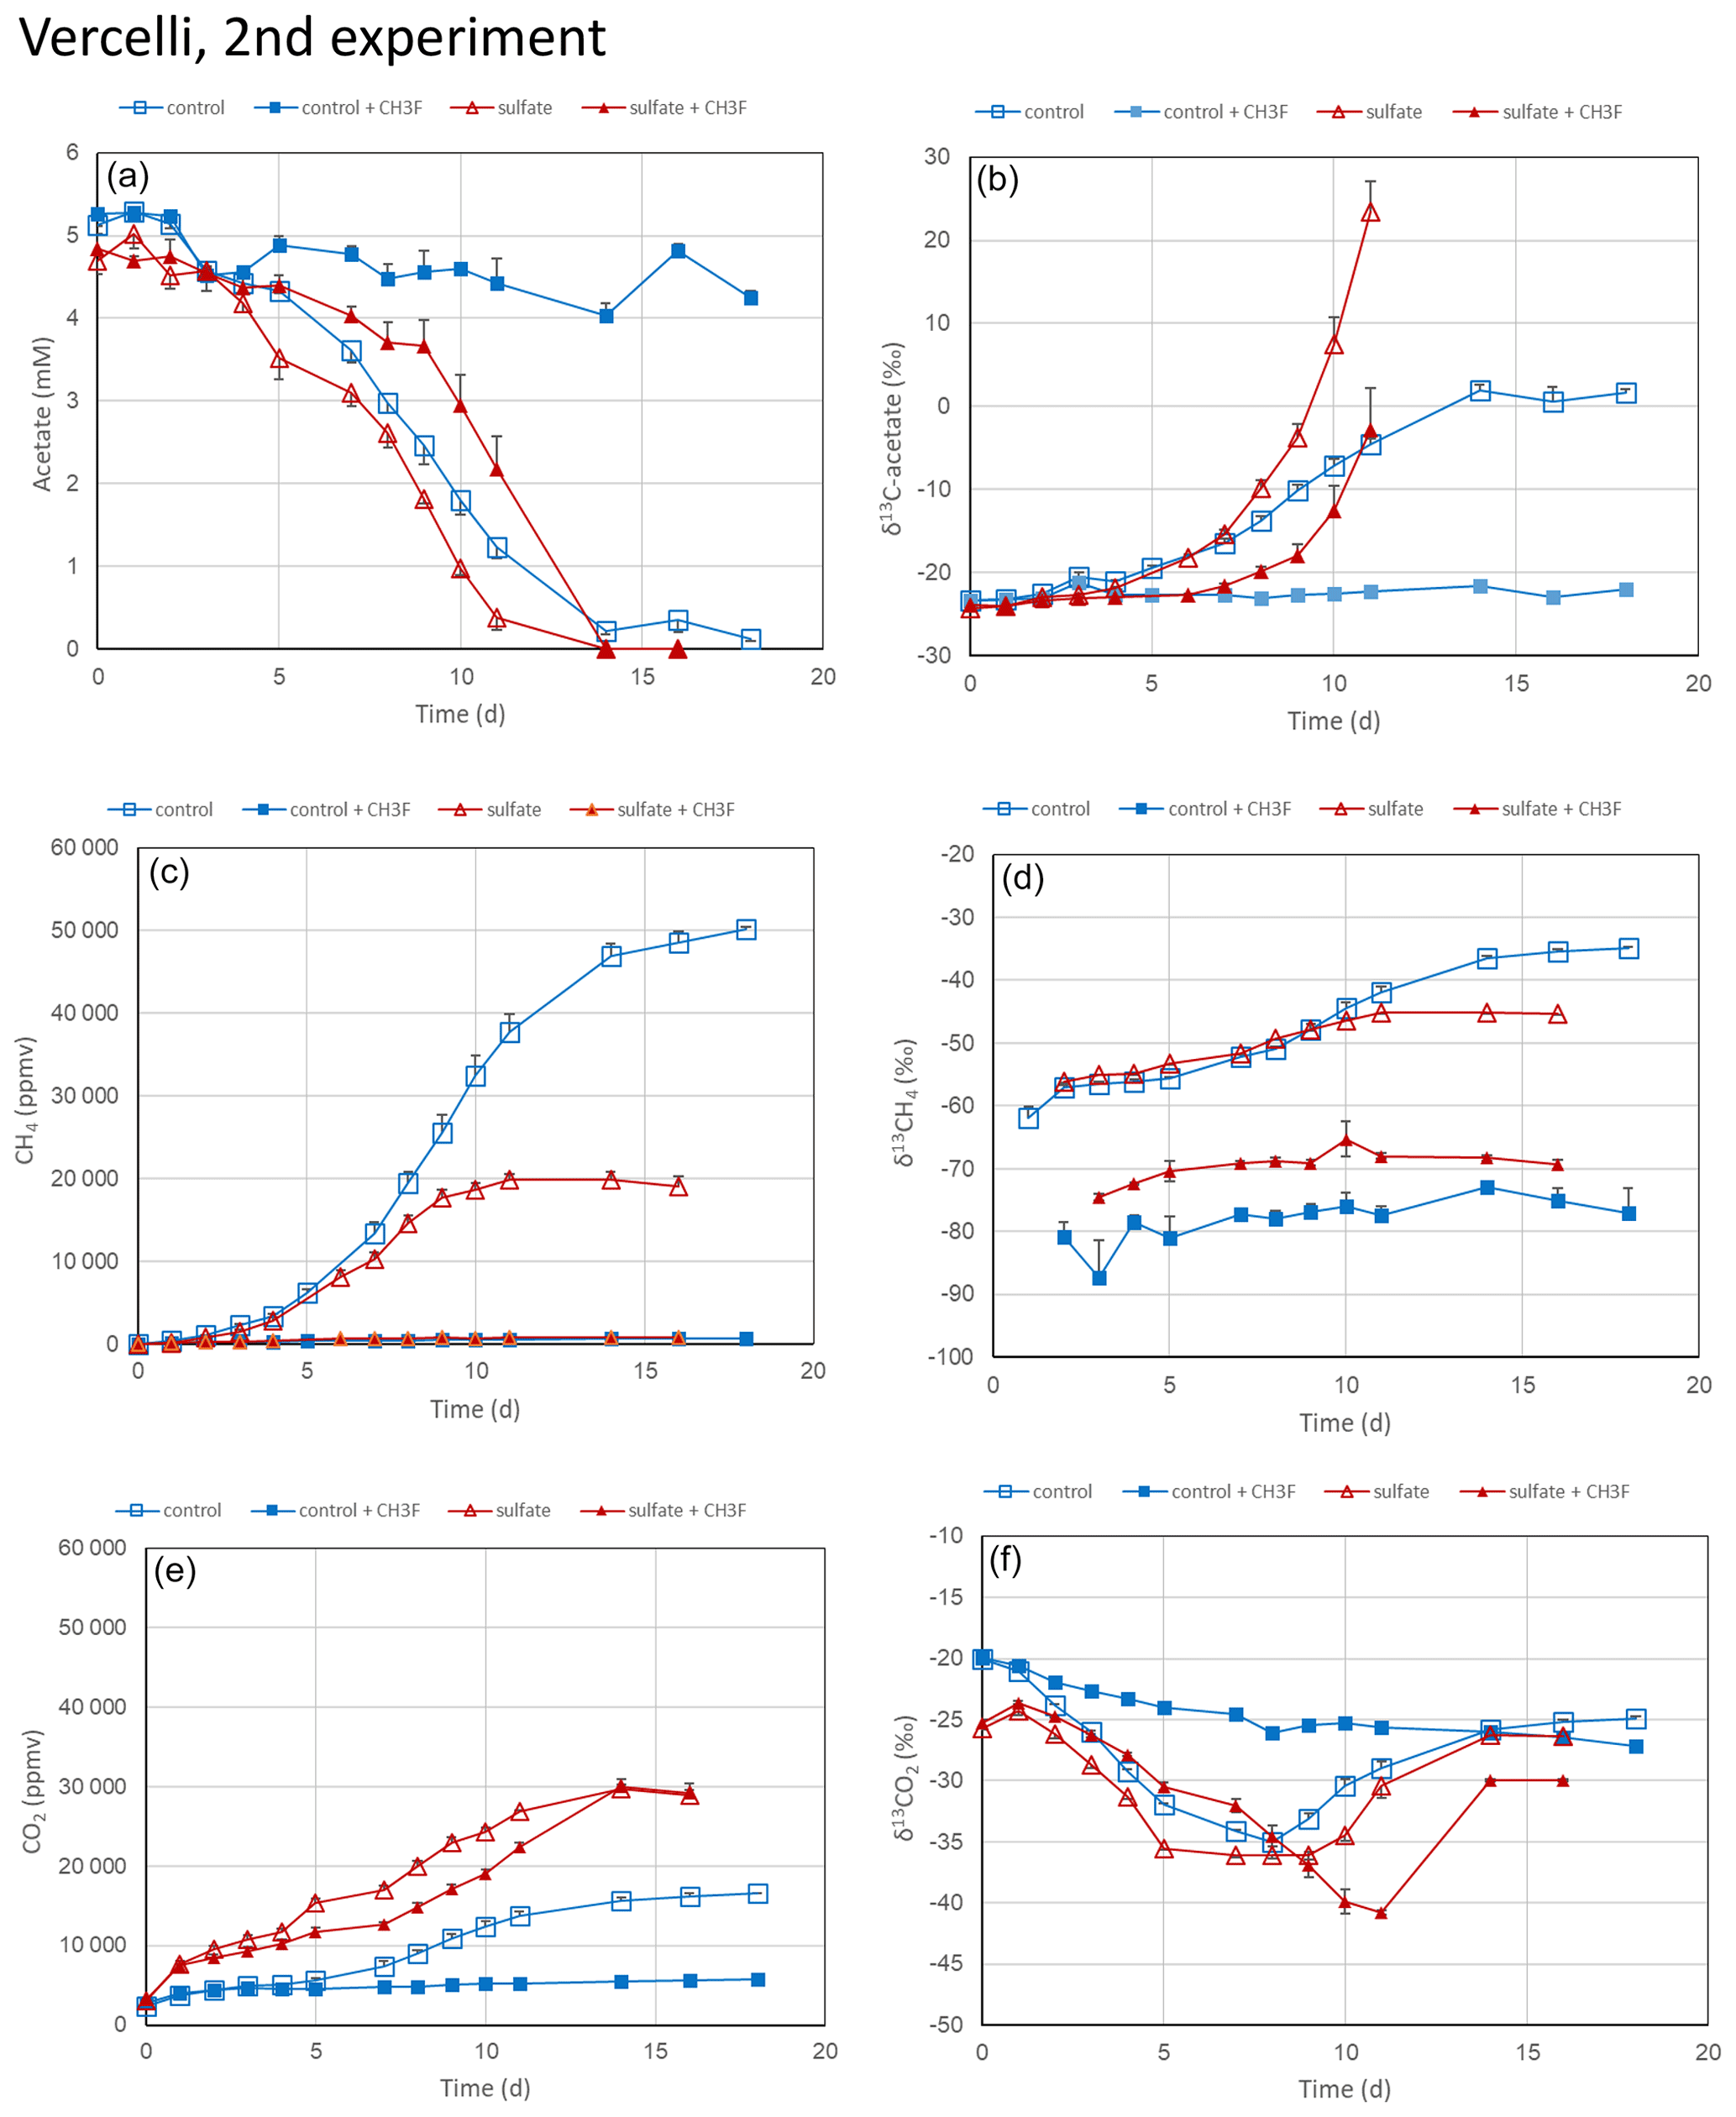
Figure 4Acetate conversion to CH4 and CO2 in phosphate-buffered (pH 7.0) suspensions of paddy soil from Vercelli, Italy, without additions (control), with CH3F, with gypsum (preincubation and experiment), and with gypsum (preincubation and experiment) and CH3F. The panels show the temporal change of (a) concentrations of acetate, (b) δ13C of acetate, (c) partial pressures of CH4 ( bar), (d) δ13C of CH4, (e) partial pressures of CO2 ( bar) and (f) δ13C of CO2. Means±SE, n=3.
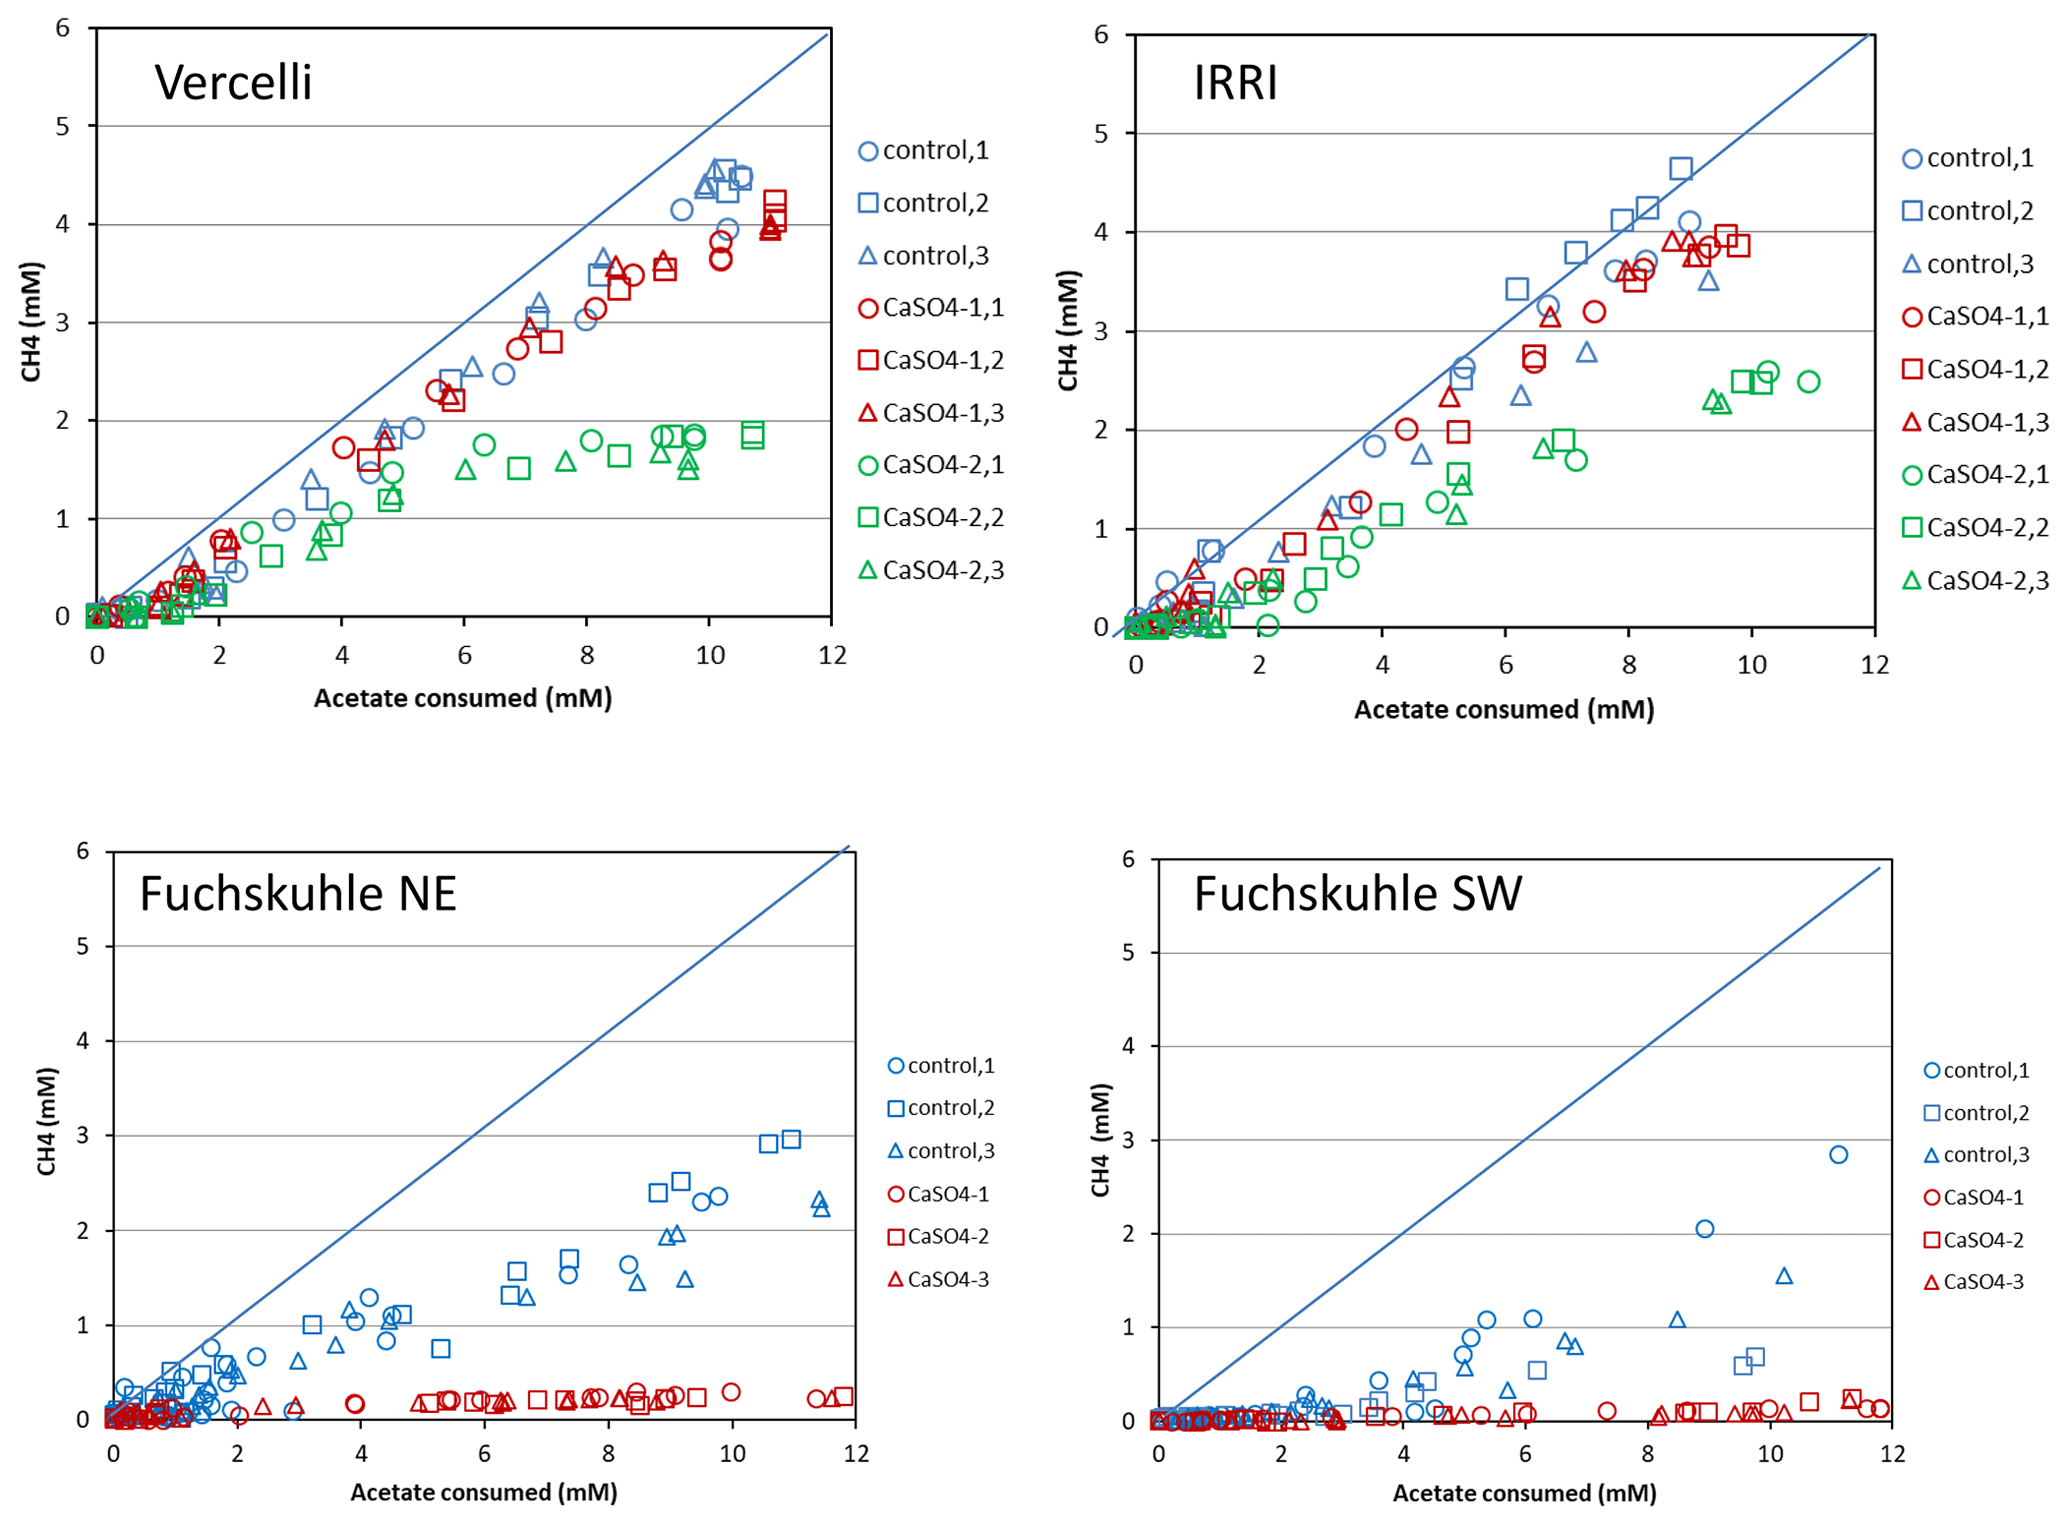
Figure 5Balance of CH4 produced against acetate consumed in phosphate-buffered suspensions of paddy soil from Vercelli and the IRRI and of sediments from the northeastern and southwestern basins of Lake Fuchskuhle. The panels show individual replicates (n=3) of the unamended control (methanogenic conditions), of the experiment plus gypsum (CaSO4-1), and of preincubation and experiment plus gypsum (CaSO4-2). The diagonal line indicates stoichiometric conversion (disproportionation) of acetate to CH4+CO2.
Mass balance calculations showed that while acetate (the methyl group) was almost completely degraded to CH4 in the absence of sulfate, it accounted, after a delayed inhibition, for only about a third in the presence of sulfate (Fig. 5). When the soil suspensions were incubated in the presence of sulfate but without preincubation, CH4 production was only slightly less than in the incubations without sulfate (Fig. 5). The complete set of these experiments is shown in Fig. S3 in the Supplement. When CH4 production was inhibited, CO2 production apparently was a substitute, since the consumed acetate was always rather well balanced by the production of both CH4 and TIC together (Fig. S4 in the Supplement). The same experimental setup was used for IRRI soil. The results were similar and are shown in Figs. S5–S7 in the Supplement. In IRRI soil suspensions, the mass balance between the production of CH4+TIC and the acetate consumed was improved when the production was corrected with the background production in a control without addition of acetate (Fig. S8 in the Supplement).
Mariotti plots of acetate consumption and CH4 production in both Vercelli soil (Fig. S9 in the Supplement) and IRRI soil (Fig. S10 in the Supplement) could be created for all the different incubation conditions in which acetate was consumed, i.e., in the absence of sulfate (control), in the presence of sulfate and in the presence of sulfate after preincubation with sulfate. Enrichment factors (ε) were calculated for fractions of acetate consumption with f<0.5 (Fig. 3 and Table S1). The ε values for acetate consumption were similar for the experiments without and with sulfate and ranged between −21 ‰ and −17 ‰. However, the ε values for CH4 production were systematically lower, ranging between −37 ‰ and −23 ‰ (Fig. 3 and Table S1). Since acetate consumption in the presence of sulfate was also possible when CH4 production was inhibited by CH3F, Mariotti plots could also be created for these conditions (Fig. S11 in the Supplement). The resulting ε values were similar than those in the absence of sulfate and ranged for Vercelli soil between −24 ‰ and −22 ‰ (Fig. 3 and Table S1). Only in the IRRI soil were ε values higher (−10 ‰) but only when the soil had been preincubated with sulfate (Fig. 3 and Table S1).
3.3 Incubation of buffered suspensions of lake sediments
Experiments with lake sediments were done analogously to those with rice filed soils. Slurries of sediment from the northeastern and southwestern basins of Lake Fuchskuhle were suspended in phosphate buffer (pH 7.0) in the absence and the presence of sulfate (after preincubation with sulfate) and without and with the addition of CH3F. In the sediment from the northeastern basin, acetate was consumed after a lag phase, first (after about 40 d) in the incubations with sulfate, then (after about 60 d) also in the incubations without sulfate (Fig. 6a). The addition of CH3F only partially inhibited the acetate consumption in the absence of sulfate and did not at all inhibit the acetate consumption in the presence of sulfate (Fig. 6a). However, CH3F almost completely inhibited the production of CH4 and also inhibited almost completely the increase of the δ13C in the residual acetate when sulfate was absent (Fig. 6b). The presence of sulfate also strongly inhibited CH4 production (Fig. 6c). The small amounts of CH4 produced showed a rather constant δ13C of about −40 ‰ in the absence and −90 ‰ to −80 ‰ in the presence of CH3F (Fig. 6d). Without sulfate, by contrast, the δ13C in CH4 was first about −70 ‰, and then with acetate consumption progressively increased to about −40 ‰ in the absence and decreased to about −90 ‰ in the presence of CH3F (Fig. 6d). Mass balance calculations showed that CH4 production in the presence of sulfate accounted on a molar basis only for about 5 % of the acetate consumed, while in the absence of sulfate CH4 production accounted for about 45 % (Fig. 5). In the sediment from the southwestern basin, the contribution of CH4 production to acetate consumption was even lower (about 30 %) (Fig. 5). These low values are noteworthy in comparison to those found in the rice field soils (Fig. 5). In the presence of sulfate, acetate was almost exclusively converted to CO2, which strongly increased during the time of acetate consumption, exhibiting a relatively good mass balance (Figs. S4 and S8). This was also the case in the incubations without sulfate, indicating that a rather large fraction of the acetate was converted to CO2 rather than CH4 (Figs. S4 and S8). The δ13C of the produced CO2 strongly decreased from about −30 ‰ to about −55 ‰ during the period of acetate consumption (Fig. 6f) and then slowly increased back to −30 ‰ when about 50 % of the acetate had been consumed (Fig. 6a). The experimental results were similar in the incubations with sediment from the southwestern basin, which are shown in Figs. S12 and S13 in the Supplement.
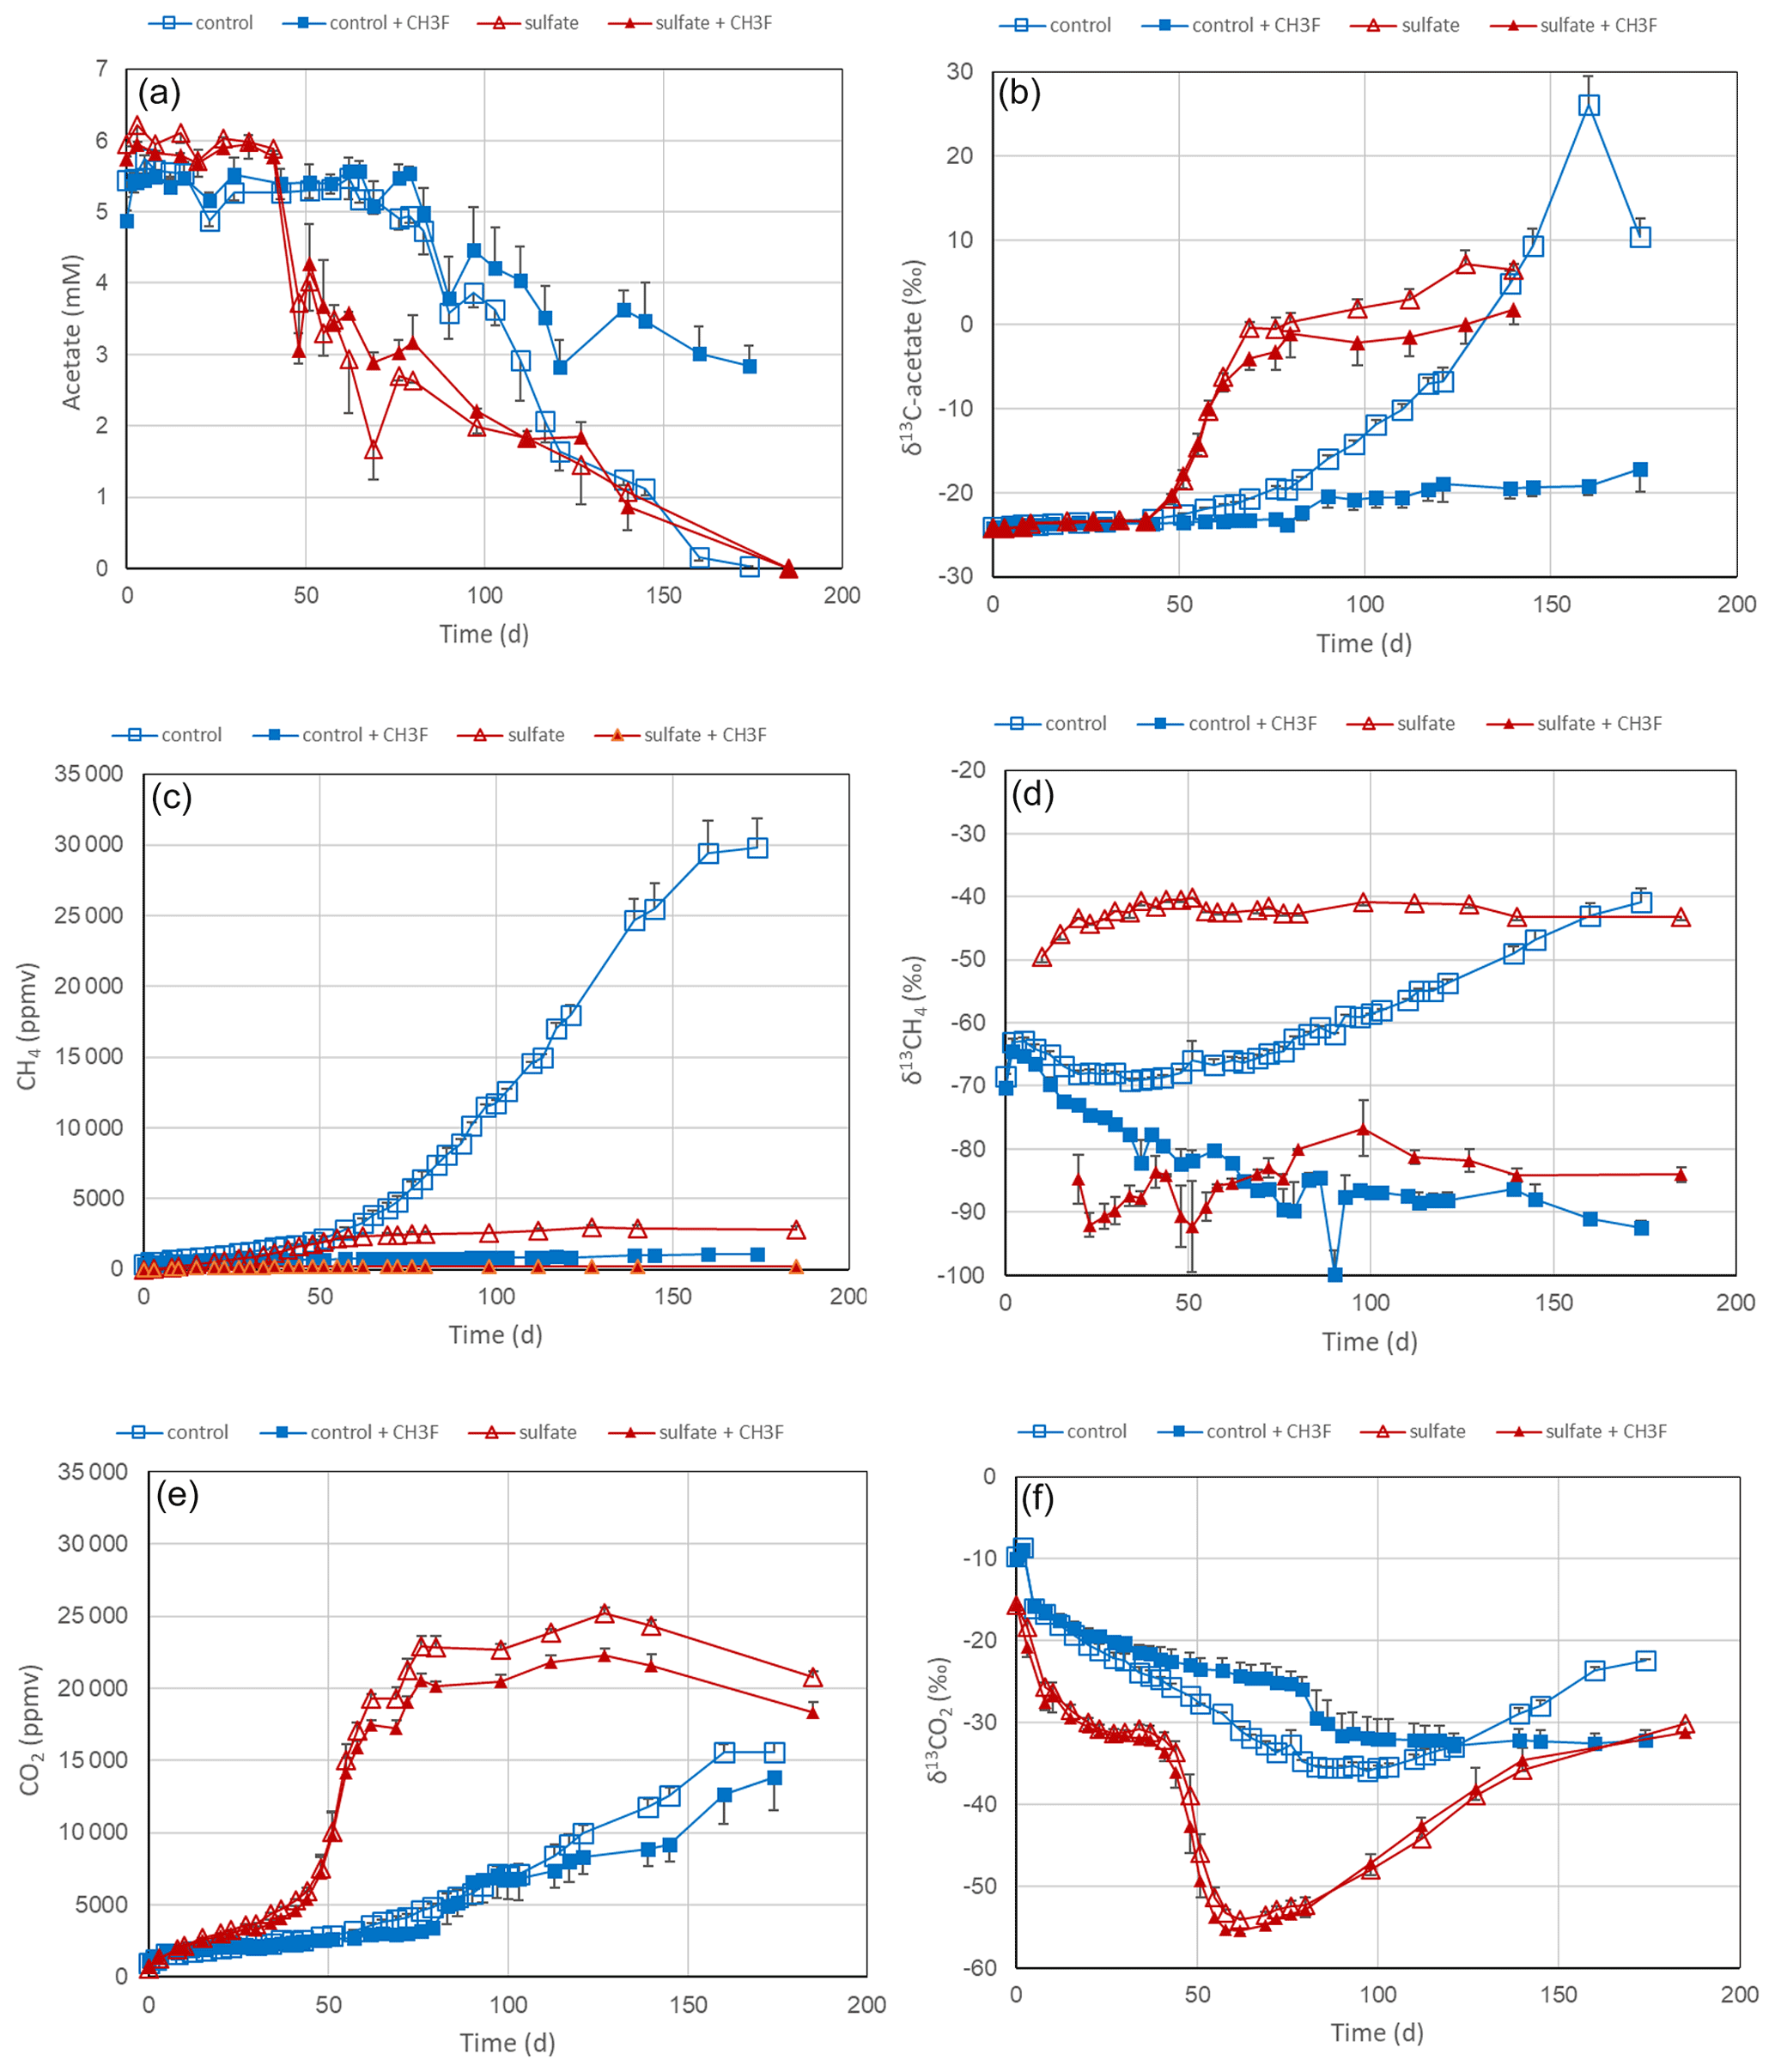
Figure 6Acetate conversion to CH4 and CO2 in phosphate-buffered (pH 7.0) suspensions of sediment from the northeastern basin of Lake Fuchskuhle without additions (control), with CH3F, with gypsum (preincubation and experiment), and with gypsum (preincubation and experiment) and CH3F. The panels show the temporal change of (a) concentrations of acetate, (b) δ13C of acetate, (c) partial pressures of CH4 ( bar), (d) δ13C of CH4, (e) partial pressures of CO2 ( bar) and (f) δ13C of CO2. Means±SE, n=3.
Mariotti plots of acetate consumption could be generated for all incubation conditions both in the northeastern and in the southwestern basin of Lake Fuchskuhle (Figs. S14 and S15 in the Supplement). These plots allowed for the calculation of ε values, which were generally higher (−20 ‰ to −19 ‰) in the northeastern (−20 ‰ to −19 ‰) than the southwestern basin (−14 ‰ to −11 ‰). For CH4 production, useful Mariotti plots could only be generated for incubations without sulfate resulting in ε values, which were higher (−28 ‰ to −27 ‰) than those calculated from acetate consumption (Fig. 3 and Table S1). Mariotti plots of acetate consumption could be generated for incubations with sulfate in which the very low CH4 production was further inhibited by CH3F (Fig. S16 in the Supplement). The ε values of these incubations (northeastern and southwestern basins, respectively) were lower (−26 ‰ and −24 ‰) than those without CH3F (−20 ‰ and −14 ‰) (Fig. 3 and Table S1).
3.4 Microbial-community composition
The composition of the microbial communities was determined at the beginning of incubation, after preincubation without and with sulfate in the rice field soil and lake sediment suspensions by targeting three different genes, i.e., mcrA (methyl-CoM – coenzyme M – reductase), dsrB (dissimilatory sulfate reductase) and the bacterial 16S rRNA gene. The compositions of microorganisms represented by all three genes were quite different between the rice field soils and the lake sediments, while the differences within the individual samples of either soils or sediments were smaller (Fig. 7).

Figure 7Relative abundance of (a) mcrA (methanogens), (b) dsrB (sulfate reducers) and (c) bacterial 16S rRNA genes. The DNA was extracted after preincubation of phosphate-buffered suspensions of paddy soils (Vercelli and IRRI) and sediments of Lake Fuchskuhle (northeastern and southwestern basins) without additions (methanogenic conditions) or preincubated and incubated in the presence of sulfate (sulfidogenic conditions).
In the sediments of both basins of Lake Fuchskuhle, the methanogenic archaea (represented by mcrA) were dominated by Methanomicrobiales and Methanosaetaceae, while Methanomassiliicoccales and Methanosarcinaceae contributed less (Fig. 7a). In the rice field soils, the methanogenic taxa were more diverse, comprising six different orders or families, with putatively aceticlastic Methanosarcinaceae being relatively more abundant than Methanosaetaceae. In addition, Methanomicrobiales contributed only little compared to Methanobacteriales and especially Methanocellales. In general, there was only a marginal difference in composition between the incubations in the absence and the presence of sulfate. A statistical analysis of these marginal differences was not warranted and was also not possible due to the fact that only one replicate each was assayed.
The composition of putative sulfate reducers (represented by dsrB) was also only a little different between the incubations with and without sulfate addition (Fig. 7b). However, the composition between rice field soils and lake sediments was completely different. While rice field soils were dominated by members of the uncultured-family-level lineages 9 and 5, the lake sediments were dominated by the Desulfobacca acetoxidans lineage. Compared to IRRI soil the relative abundance of Syntrophobacteraceae was larger in Vercelli soil, where it increased upon treatment with sulfate. In the lake sediments, the relative abundances of Syntrophobacteraceae and members of environmental superclusters were similar. In the lake sediments there was only a minor quantitative difference between the two basins, while the difference between Vercelli and IRRI soil was more pronounced. For example, compared to IRRI soil the relative abundance of Syntrophobacteraceae was larger in Vercelli soil, where it increased upon preincubation with sulfate.
The composition of bacteria in general (represented by the 16S rRNA gene) was again most different between rice field soils and lake sediments, while differences between Vercelli and IRRI soils and also between sediments from the northeastern and southwestern lake basins were much less, and differences between preincubations without and with sulfate were marginal (Fig. 7c). While in rice field soils Clostridia were the most abundant group followed by Deltaproteobacteria, it was the other way round in the lake sediments. Rice field soils contained Bacilli, while lake sediments contained Spirochaetes, which were respectively negligible.
4.1 Methanogenic conditions
We measured εac values in anaerobic environmental samples, which consumed acetate almost exclusively by methanogenesis. The predominance of methanogenesis occurred in the absence of sulfate; in some incubations of the rice field soils even in the presence of sulfate provided there was no prior incubation in the presence of sulfate. In the rice field soils, CH4 carbon accounted for more than 90 % of the consumed acetate carbon, and CH3F completely inhibited acetate consumption, inhibited the increase of δ13C in the residual acetate and also inhibited most of the CH4 production. In conclusion, acetate was exclusively consumed by aceticlastic methanogenesis, and only a little CH4 was produced from other sources than acetate, presumably from background organic carbon via hydrogenotrophic methanogenesis as indicated by the negative δ13C of the produced CH4. The increase of δ13C in the residual acetate was expected due to preferred utilization of isotopically light acetate carbon. Such patterns of CH4 production and change in 13C isotopic signatures have been observed by us before in rice field soils and lake sediments (Conrad et al., 2009, 2010; Fu et al., 2018; Ji et al., 2018). They are in agreement with the presence of a diverse methanogenic archaeal community consisting of putatively hydrogenotrophic and aceticlastic methanogenic archaea, which have been found in both Vercelli and IRRI soils (P. F. Liu et al., 2018; P. Liu, 2019). The aceticlastic methanogens consisted of species of the genera Methanosarcina and Methanosaeta (or Methanothrix; Oren, 2014), which differ in the mechanism of acetate activation and the affinity towards acetate (Jetten et al., 1990).
Both genera of methanogens were also present in the sediments of Lake Fuchskuhle, which exhibited a similar pattern of acetate consumption and CH4 production as the anaerobic rice field soils, thus confirming and extending earlier studies (Chan et al., 2002; Conrad et al., 2010). Notably, CH3F addition again almost completely inhibited CH4 production from acetate and was accompanied by highly negative δ13C in the small amounts of residual CH4, which was presumably produced by hydrogenotrophic methanogenesis. The addition of CH3F did not completely inhibit acetate consumption, indicating consumption by oxidation rather than aceticlastic methanogenesis. However, CH3F almost completely inhibited the increase of δ13C in the residual acetate, indicating only a negligible isotope effect. Also, CH4 production accounted only for less than 50 % of the consumed acetate, as production of CH4 was replaced by CO2. Hence, part of the acetate was apparently consumed by oxidative processes, even without the addition of sulfate. We assume that the oxidation consumption process was driven by humic acids (Lovley et al., 1996). Notably, imbalance in the stoichiometry between CH4 and consumed acetate is reflected by the fact that the southwestern basin has a higher humic acid content than the northeastern basin (Casper et al., 2003).
Values of εac measured in cultures of methanogenic archaea differ depending on the genus and the corresponding mechanism of acetate activation. Thus, methanogenic archaea of the genus Methanosarcina, which activate acetate with acetate kinase and phosphotransacetylase, have a relatively negative εac with values ranging between −35 ‰ and −21 ‰ (Gelwicks et al., 1994; Goevert and Conrad, 2009; Krzycki et al., 1987; Zyakun et al., 1988). By contrast, those of the genus Methanosaeta, which activate acetate with acetyl-CoA (coenzyme A) synthetase, have less negative εac with values ranging between −14 ‰ and −10 ‰ (Penning et al., 2006a; Valentine et al., 2004). The εac values in methanogenic rice field soils were all in the range of −21 ‰ to −17 ‰, which is at the less negative end or even a bit less negative than the values reported for pure cultures of Methanosarcina but is more negative than the values reported for Methanosaeta. Therefore, it is reasonable to conclude that in the methanogenic rice field soils, acetate was consumed mainly by Methanosarcina species and only to a minor extent by Methanosaeta species. This conclusion is in agreement with the composition of the soil methanogenic archaeal communities, which consisted of both genera. A similar conclusion has been reached in methanogenic rice field soil (Goevert and Conrad, 2009). A similar enrichment factor for acetate consumption has also been measured in the anoxic sediment of Lake Wintergreen (Gelwicks et al., 1994) and again in the present study of the northeastern basin of Lake Fuchskuhle. However, the sediment of the southwestern basin of Lake Fuchskuhle exhibited a less negative εac of about −11 ‰, which would be consistent with the activity of aceticlastic Methanosaeta species. Indeed, mcrA genes of Methanoseata species were much more abundant in the sediments of Lake Fuchskuhle than mcrA genes of Methanosarcina species. Also in Lake Dagow sediments (located in the same region of Germany), methanogenic archaea were dominated by Methanosaeta species and exhibited a relatively high εac of about −13 ‰ (Penning et al., 2006a). However, the sediment of the northeastern basin of Lake Fuchskuhle, which was also dominated by Methanosaeta species, exhibited more negative εac values of about −19 ‰.
Methanogenic consumption results in the disproportionation of the acetate molecule with oxidation of the carboxyl group to CO2 and reduction of the methyl group to CH4. In the context of the isotope fractionation during the conversion of acetate to CH4, it is the isotopic enrichment factor of the methyl group, εac-methyl, which matters. Studies of fractionation of the acetate methyl in pure culture studies of aceticlastic methanogenic archaea have shown that εac-methyl was always a few per mil less negative than εac. This difference was due to a larger isotope effect for the conversion of acetate carboxyl than acetate methyl (Gelwicks et al., 1994; Goevert and Conrad, 2009; Penning et al., 2006a; Valentine et al., 2004). Alternatively to εac-methyl the enrichment factor for the conversion of acetate methyl to CH4 can also be measured from the isotopic composition in CH4, i.e., . Most of the studies of pure methanogenic cultures resulted in being similar to εac-methyl (Gelwicks et al., 1994; Goevert and Conrad, 2009; Penning et al., 2006a), but occasionally was a few per mil more negative than εac-methyl, both in pure culture (Valentine et al., 2004) and in environmental samples (Goevert and Conrad, 2009). Similarly, values of in the unbuffered suspensions of rice field soils were only slightly more negative than values of εac. However, in the buffered suspensions of both rice field soils and lake sediments, values of were much more negative than those of εac, the difference amounting to 9 ‰–17 ‰. These results indicate that the isotope effect for the conversion of the acetate methyl to CH4 was much stronger than that for the conversion of acetate carboxyl to CO2, which is completely opposite of the results obtained in cultures of methanogenic archaea. This discrepancy in the results is presently without a conclusive explanation. The possibility of effects by bicarbonate or CO2 concentrations, being different in the pure microbial cultures; the unbuffered and buffered soil suspensions; or phosphate effects should be considered. Effects of CO2 concentrations and buffer systems on fractionation factors have for example been observed in cultures of chemolithoautotrophic Thermoanaerobacter kivui (Blaser et al., 2015).
4.2 Sulfidogenic conditions
We also measured εac values in anaerobic environmental samples, which consumed acetate by sulfate reduction. These conditions were achieved (only in the buffered suspensions) by preincubation with gypsum and the measurement of acetate consumption in the presence of sulfate (gypsum). Preincubation was required because of a delayed sulfate reduction (P. Liu et al., 2018). The relative abundance of both dsrB genes and genes of bacterial 16S rRNA were only marginally different between samples preincubated under methanogenic and sulfidogenic conditions, similarly as observed before (Wörner et al., 2016). The induction of the sulfate reduction activity is probably the cause of the delayed sulfidogenic conditions (P. Liu et al., 2018). Sulfidogenic conditions were verified by showing that methanogenesis was almost completely inhibited while acetate consumption operated, also with respect to an increase of δ13C in the residual acetate, and that CH3F, which is rather specific for acetoclastic methanogenesis, had only a marginal effect on these sulfidogenic activities. Finally, sulfidogenic conditions were verified by the stoichiometry of acetate conversion, which showed only very little CH4 production.
Values of εac measured in cultures of sulfate-reducing bacteria differ depending on the genus and the corresponding mechanism of acetate dissimilation. Experiments with cultures of sulfate reducers showed that Desulfobacca acetoxidans, which dissimilates acetate via the acetyl-CoA pathway, exhibits about −19 ‰, similar to the εac values of aceticlastic Methanosarcina species. By contrast, cultures of Desulfobacter species, which dissimilate acetate via the tricarbonic-acid cycle, exhibited εac values of about +2 ‰ (Goevert and Conrad, 2008). The εac values measured in sulfidogenic anoxic paddy soils were in a range of −24 ‰ to −22 ‰ but were only −24 ‰ to −10 ‰ when measured in the presence of CH3F, which guarantees that all aceticlastic methanogenic activities were inhibited. This range of εac values compares rather well with the value of −19 ‰ measured in Desulfobacca acetoxidans, which, however, was of only low relative abundance in the rice field soil incubations. However, it is very possible that uncultured-family-level lineages, which were the major sulfate reducers, dissimilated by pathways similar to Desulfobacca acetoxidans and thus exhibited similar εac values. Also Syntrophobacteraceae, which have been found to act as major acetate-utilizing sulfate reducers in Vercelli soil (P. Liu et al., 2018), increased in relative abundance after preincubation with sulfate. The lake sediments, by contrast, exhibited a high relative abundance of Desulfobacca acetoxidans, and εac values (including those with CH3F) were in the range of −26 ‰ to −14 ‰. Unfortunately, there is, to our knowledge, only a paucity of εac values measured in cultures of sulfate reducers (Goevert and Conrad, 2008). Therefore, it is not possible to have a better resolution of the role of different taxa and metabolic types of sulfate-reducing bacteria on the fractionation of acetate carbon.
Despite a relatively wide variety of environmental conditions and microbial-community compositions, the range of fractionation factors (isotopic enrichment factors εac for the fractionation of total acetate) was quite moderate. The observed εac values were basically within the range that is known from studies of pure cultures of sulfate-reducing bacteria and methanogenic archaea, with a predominance of εac values around −20 ‰, which is consistent with acetate fractionation in both aceticlastic Methanosarcina species and acetate-dissimilating sulfate reducers using the acetyl-CoA pathway. In a few cases, εac values were close to −10 ‰, being consistent with a predominance of aceticlastic Methanosaeta species. However, there is a paucity of data from cultures of acetate-dissimilating sulfate-reducing bacteria, for example from Syntrophobacteraceae, which presently limits the potential for predicting fractionation of acetate carbon by knowing the microbial-community composition. Another point of concern is the use of buffered growth media, which may affect isotope fractionation, such as indicated by the observation that values were much more negative than εac values when using suspensions in the phosphate buffer rather than in water.
The nucleotide sequence data were deposited in the NCBI SRA (Sequence Read Archive) database under accession number SUB5161628 (available at: https://www.ncbi.nlm.nih.gov/Traces/study/?acc=PRJNA521576, last access: 20 December 2021). Other data are all contained in the tables and figures and in the Supplement.
The supplement related to this article is available online at: https://doi.org/10.5194/bg-18-6533-2021-supplement.
RC designed the experiments, evaluated the data and wrote the manuscript. PL evaluated the nucleotide sequence data and contributed to the discussion of the data. PC performed the experiments.
The contact author has declared that neither they nor their co-authors have any competing interests.
Publisher's note: Copernicus Publications remains neutral with regard to jurisdictional claims in published maps and institutional affiliations.
We thank Peter Casper and Dheeraj Kanaparthi for providing sediment samples from Lake Fuchskuhle. We thank the Fonds der Chemischen Industrie for financial support.
This research has been supported by the Fonds der Chemischen Industrie.
The article processing charges for this open-access publication were covered by the Max Planck Society.
This paper was edited by Luo Yu and reviewed by two anonymous referees.
Angel, R., Claus, P., and Conrad, R.: Methanogenic archaea are globally ubiquitous in aerated soils and become active under wet anoxic conditions, ISME J., 6, 847–862, 2012.
Berger, S. A., Krompass, D., and Stamatakis, A.: Performance, accuracy, and web server for evolutionary placement of short sequence reads under maximum likelihood, Syst. Biol., 60, 291–302, 2011.]
Blair, N. E. and Carter Jr., W. D.: The carbon isotope biogeochemistry of acetate from a methanogenic marine sediment, Geochim. Cosmochim. Ac., 56, 1247–1258, 1992.
Blaser, M. and Conrad, R.: Stable carbon isotope fractionation as tracer of carbon cycling in anoxic soil ecosystems, Curr. Opin. Biotech., 41, 122–129, 2016.
Blaser, M. B., Dreisbach, L. K., and Conrad, R.: Carbon isotope fractionation of Thermoanaerobacter kivui in different growth media and at different total inorganic carbon concentrations, Org. Geochem., 81, 45–52, 2015.
Casper, P., Chan, O. C., Furtado, A. L. S., and Adams, D. D.: Methane in an acidic bog lake: The influence of peat in the catchment on the biogeochemistry of methane, Aquat. Sci., 65, 36–46, 2003.
Chan, O. C., Wolf, M., Hepperle, D., and Casper, P.: Methanogenic archaeal community in the sediment of an artificially partitioned acidic bog lake, FEMS Microbiol. Ecol., 42, 119–129, 2002.
Chan, O. C., Claus, P., Casper, P., Ulrich, A., Lueders, T., and Conrad, R.: Vertical distribution of structure and function of the methanogenic archaeal community in Lake Dagow sediment, Environ. Microbiol., 7, 1139–1149, 2005.
Chidthaisong, A., Chin, K. J., Valentine, D. L., and Tyler, S. C.: A comparison of isotope fractionation of carbon and hydrogen from paddy field rice roots and soil bacterial enrichments during CO2/H2 methanogenesis, Geochim. Cosmochim. Ac., 66, 983–995, 2002.
Conrad, R.: Quantification of methanogenic pathways using stable carbon isotopic signatures: a review and a proposal, Org. Geochem., 36, 739–752, 2005.
Conrad, R., Chan, O. C., Claus, P., and Casper, P.: Characterization of methanogenic Archaea and stable isotope fractionation during methane production in the profundal sediment of an oligotrophic lake (Lake Stechlin, Germany), Limnol. Oceanogr., 52, 1393–1406, 2007.
Conrad, R., Klose, M., Claus, P., and Dan, J. G.: Activity and composition of the methanogenic archaeal community in soil vegetated with wild versus cultivated rice, Soil Biol. Biochem., 41, 1390–1395, 2009.
Conrad, R., Claus, P., and Casper, P.: Stable isotope fractionation during the methanogenic degradation of organic matter in the sediment of an acidic bog lake, Lake Grosse Fuchskuhle, Limnol. Oceanogr., 55, 1932–1942, 2010.
Fu, B., Conrad, R., and Blaser, M.: Potential contribution of acetogenesis to anaerobic degradation in methanogenic rice field soils, Soil Biol. Biochem., 119, 1–10, 2018.
Gelwicks, J. T., Risatti, J. B., and Hayes, J. M.: Carbon isotope effects associated with aceticlastic methanogenesis, Appl. Environ. Microbiol., 60, 467–472, 1994.
Goevert, D. and Conrad, R.: Carbon isotope fractionation by sulfate-reducing bacteria using different pathways for the oxidation of acetate, Environ. Sci. Technol., 42, 7813–7817, 2008.
Goevert, D. and Conrad, R.: Effect of substrate concentration on carbon isotope fractionation during acetoclastic methanogenesis by Methanosarcina barkeri and M. acetivorans and in rice field soil, Appl. Environ. Microbiol., 75, 2605–2612, 2009.
Goevert, D. and Conrad, R.: Stable isotope fractionation by acetotrophic sulfur-reducing bacteria, FEMS Microbiol. Ecol., 71, 218–225, 2010.
Hayes, J. M.: Factors controlling 13C contents of sedimentary organic compounds: principles and evidence, Mar. Geol., 113, 111–125, 1993.
Holmes, M., Chanton, J. P., Bae, H. S., and Ogram, A.: Effect of nutrient enrichment on δ13CH4 and the methane production pathway in the Florida Everglades, J. Geophys. Res.-Biogeo., 119, 1267–1280, 2014.
Janssen, P. H. and Frenzel, P.: Inhibition of methanogenesis by methyl fluoride – studies of pure and defined mixed cultures of anaerobic bacteria and archaea, Appl. Environ. Microbiol., 63, 4552–4557, 1997.
Jetten, M. S. M., Stams, A. J. M., and Zehnder, A. J. B.: Acetate threshold and acetate activating enzymes in methanogenic bacteria, FEMS Microbiol. Ecol., 73, 339–344, 1990.
Ji, Y., Liu, P., and Conrad, R.: Change of the pathway of methane production with progressing anoxic incubation of paddy soil, Soil Biol. Biochem., 121, 177–184, 2018.
Kanaparthi, D., Pommerenke, B., Casper, P., and Dumont, M. G.: Chemolithotrophic nitrate-dependent Fe(II)-oxidizing nature of actinobacterial subdivision lineage TM3, ISME J., 7, 1582–1594, 2013.
Katoh, K. and Standley, D. M.: MAFFT multiple sequence alignment software version 7: improvements in performance and usability, Mol. Biol. Evol., 30, 772–780, 2013.
Krzycki, J. A., Kenealy, W. R., DeNiro, M. J., and Zeikus, J. G.: Stable carbon isotope fractionation by Methanosarcina barkeri during methanogenesis from acetate, methanol, or carbon dioxide-hydrogen, Appl. Environ. Microbiol., 53, 2597–2599, 1987.
Liu, P., Pommerenke, B., and Conrad, R.: Identification of Syntrophobacteraceae as major acetate-degrading sulfate reducing bacteria in Italian paddy soil, Environ. Microbiol., 20, 337–354, 2018.
Liu, P., Klose, M., and Conrad, R.: Temperature-dependent network modules of soil methanogenic bacterial and archaeal communities, Front. Microbiol., 10, 496, https://doi.org/10.3389/fmicb.2019.00496, 2019.
Liu, P. F. and Conrad, R.: Syntrophobacteraceae-affiliated species are major propionate-degrading sulfate reducers in paddy soil, Environ. Microbiol., 19, 1669–1686, 2017.
Liu, P. F., Klose, M., and Conrad, R.: Temperature effects on structure and function of the methanogenic microbial communities in two paddy soils and one desert soil, Soil Biol. Biochem., 124, 236–244, 2018.
Londry, K. L. and DesMarais, D. J.: Stable carbon isotope fractionation by sulfate-reducing bacteria, Appl. Environ. Microbiol., 69, 2942–2949, 2003.
Lovley, D. R., Coates, J. D., Blunt-Harris, E. L., Phillips, E. J. P., and Woodward, J. C.: Humic substances as electron acceptors for microbial respiration, Nature, 382, 445–448, 1996.
Ludwig, W., Strunk, O., Westram, R., Richter, L., Meier, H., Yadhukumar, Buchner, A., Lai, T., Steppi, S., Jobb, G., Förster, W., Brettske, I., Gerber, S., Ginhart, A. W., Gross, O., Grumann, S., Hermann, S., Jost, R., König, A., Liss, T., Lüssmann, R., May, M., Nonhoff, B., Reichel, B., Strehlow, R., Stamatakis, A., Stuckmann, N., Vilbig, A., Lenke, M., Ludwig, T., Bode, A., and Schleifer, K. H.: ARB: a software environment for sequence data, Nucleic Acids Res., 32, 1363–1371, 2004.
Mariotti, A., Germon, J. C., Hubert, P., Kaiser, P., Letolle, R., Tardieux, A., and Tardieux, P.: Experimental determination of nitrogen kinetic isotope fractionation: some principles; illustration for the denitrification and nitrification processes, Plant Soil, 62, 413–430, 1981.
Oren, A.: The family Methanotrichaceae, in: The Prokaryotes, edited by: Rosenberg, E., DeLong, E. F., Lory, S., Stackebrandt, E., and Thompson, F., Springer, Berlin, 298–306, 2014.
Pelikan, C., Herbold, C. W., Hausmann, B., Mueller, A. L., Pester, M., and Loy, A.: Diversity analysis of sulfite- and sulfate-reducing microorganisms by multiplex dsrA and dsrB amplicon sequencing using new primers and mock community-optimized bioinformatics, Environ. Microbiol., 18, 2994–3009, 2016.
Penning, H., Claus, P., Casper, P., and Conrad, R.: Carbon isotope fractionation during acetoclastic methanogenesis by Methanosaeta concilii in culture and a lake sediment, Appl. Environ. Microbiol., 72, 5648–5652, 2006a.
Penning, H., Tyler, S. C., and Conrad, R.: Determination of isotope fractionation factors and quantification of carbon flow by stable isotope signatures in a methanogenic rice root model system, Geobiology, 4, 109–121, 2006b.
Pruesse, E., Quast, C., Knittel, K., Fuchs, B. M., Ludwig, W., Peplies, J., and Glöckner, F. O.: SILVA: a comprehensive online resource for quality checked and aligned ribosomal RNA sequence data compatible with ARB, Nucleic Acids Res., 35, 7188–7196, 2007.
Stumm, W. and Morgan, J. J.: Aquatic Chemistry, 3. ed. Wiley, New York, 1996.
Valentine, D. L., Chidthaisong, A., Rice, A., Reeburgh, W. S., and Tyler, S. C.: Carbon and hydrogen isotope fractionation by moderately thermophilic methanogens, Geochim. Cosmochim. Ac., 68, 1571–1590, 2004.
Wang, Q., Quensen, J. F., Fish, J. A., Lee, T. K., Sun, Y. N., Tiedje, J. M., and Cole, J. R.: Ecological patterns of nifH genes in four terrestrial climatic zones explored with targeted metagenomics using FrameBot, a new informatics tool, mBio, 4, https://doi.org/10.1128/mBio.00592-13, 2013.
Wörner, S., Zecchin, S., Dan, J. G., Todorova, N. H., Loy, A., Conrad, R., and Pester, M.: Gypsum amendment to rice paddy soil stimulated bacteria involved in sulfur cycling but largely preserved the phylogenetic composition of the total bacterial community, Env. Microbiol. Rep., 8, 413–423, 2016.
Yang, S., Liebner, S., Alawi, M., Ebenhöh, O., and Wagner, D.: Taxonomic database and cut-off value for processing mcrA gene 454 pyrosequencing data by MOTHUR, J. Microbiol. Meth., 103, 3–5, 2014.
Zyakun, A. M., Bondar, V. A., Laurinavichus, K. S., Shipin, O. V., Belyaev, S. S., and Ivanov, M. V.: Fractionation of carbon isotopes under the growth of methane-producing bacteria on various substrates, Mikrobiologiceskij Zhurnal, 50, 16–22, 1988.