the Creative Commons Attribution 4.0 License.
the Creative Commons Attribution 4.0 License.
 | 24 Mar 2022
Soil geochemistry as a driver of soil organic matter composition: insights from a soil chronosequence
Moritz Mainka
Laura Summerauer
Daniel Wasner
Gina Garland
Marco Griepentrog
Asmeret Asefaw Berhe
Sebastian Doetterl
A central question in carbon research is how stabilization mechanisms in soil change over time with soil development and how this is reflected in qualitative changes in soil organic matter (SOM). To address this matter, we assessed the influence of soil geochemistry on bulk SOM composition along a soil chronosequence in California, USA, spanning 3 million years. This was done by combining data on soil mineralogy and texture from previous studies with additional measurements on total carbon (C), stable isotope values (δ13C and δ15N), and spectral information derived from diffuse reflectance infrared Fourier transform spectroscopy (DRIFTS). To assess qualitative shifts in bulk SOM, we analysed the peak areas of simple plant-derived (S-POM), complex plant-derived (C-POM), and predominantly microbial-derived organic matter (OM; MOM) and their changes in abundance across soils with several millennia to millions of years of weathering and soil development. We observed that SOM became increasingly stabilized and microbial-derived (lower C : N ratio, increasing δ13C and δ15N) as soil weathering progressed. Peak areas of S-POM (i.e. aliphatic root exudates) did not change over time, while peak areas of C-POM (lignin) and MOM (components of microbial cell walls (amides, quinones, and ketones)) increased over time and depth and were closely related to clay content and pedogenic iron oxides. Hence, our study suggests that with progressing soil development, SOM composition co-varied with changes in the mineral matrix. Our study indicates that structurally more complex OM compounds (C-POM, MOM) play an increasingly important role in soil carbon stabilization mechanisms as the mineral soil matrix becomes increasingly weathered.
- Article
(3457 KB) - Full-text XML
- BibTeX
- EndNote


Soils harbour the largest and most active terrestrial carbon (C) pool on earth (Jobbágy and Jackson, 2000; Lal, 2008). Over the past decades, many of the detailed mechanistic processes determining the fate of soil organic matter (SOM) in soils have been well studied (Schmidt et al., 2011; Lehmann and Kleber, 2015; Kleber et al., 2021). Yet, it remains unclear how these individual processes evolve over time as stabilization mechanisms depend on the soil matrix properties which in turn are subject to constant changes through soil formation (Bradford et al., 2016; Bailey et al., 2019; Kögel-Knabner and Amelung, 2021). Additionally, differences regarding pedogenic (i.e. soil type, mineralogy, soil microbiome) and environmental (i.e. climate, vegetation cover) properties not only determine the sizes of SOM stocks but also govern the abundance of diverse biochemical compounds (e.g. lignin, polysaccharides, lipids) found in the terrestrial C pool (Paul, 2016; Hall et al., 2020). Hence, SOM composition (the prevalence of certain biochemical compounds) may serve as a proxy for ecosystem properties and soil functioning, as it affects C cycling by the amount of energy provided to soil microorganisms (Nunan et al., 2015; Barré et al., 2016). Furthermore, the peak areas related to biochemical SOM compounds have been successfully used to parameterize fast- and slow-cycling SOM pools (Todd-Brown et al., 2013; Bailey et al., 2018; Laub et al., 2020; Baldock et al., 2021).
Despite the central role that SOM composition plays in soil C cycling, we lack a thorough understanding of how it is influenced by the input of organic matter (OM) and by changes in soil C stabilization mechanisms following soil formation (von Lützow et al., 2008; Doetterl et al., 2018). At initial soil formation stages, the mainly plant-derived input material determines SOM composition (Khedim et al., 2021). With increasing soil age, soil properties such as soil mineralogy, texture, and soil aggregation become increasingly important for the stabilization of accumulating SOM (Chorover et al., 2004; Mikutta et al., 2006, 2009; Wei et al., 2016). For example, a comparative study of soil aggregation in relation to soil weathering found micro- and macroaggregates to become more stable with increasing weathering (Wei et al., 2016). In addition, there is an emerging consensus that certain SOM compounds are preferentially bound to mineral surfaces in organo-mineral associations (OMAs) and are thus highly important C stabilization mechanisms (Kleber et al., 2021). Many studies reported a high affinity of chemically simple carbohydrates to minerals (i.e. low molecular weight compounds from root exudates or of microbial origin) (Kaiser et al., 1997; Calderón et al., 2011; Kleber et al., 2011; Cotrufo et al., 2015; Lavallee et al., 2019). Conversely, chemically more complex compounds (i.e. lignin or phenols from woody plant parts), formerly considered to be recalcitrant OM, were found to be less associated with minerals (Spielvogel et al., 2008; Kleber et al., 2011; Lavallee et al., 2019). However, recent studies reported a preferential binding with iron oxides in the particular case of lignin (Kramer et al., 2012; Hall et al., 2016).
OMAs are preferentially found in the fine-grained, heavy soil fraction (<2 µm = clay) which is therefore often regarded as the most important fraction to explain how SOM persists in soils (Six et al., 2000; Kleber et al., 2021). Recent conceptualizations argue that the organo-mineral interaction is subject to dynamic changes through mineral weathering (Cotrufo et al., 2013; Lehmann and Kleber 2015; Kleber et al., 2021). With ongoing soil weathering, primary silicates originating from the parent material are replaced by newly formed secondary clay minerals (White et al., 1996). The sorptive capacity of clay minerals decreases as 2:1 layer type silicates (e.g. smectite) are substituted by 1:1 layer type silicates (e.g. kaolinite) (Sposito et al., 1999). In contrast, iron oxides, particularly nano-sized iron (Fe)- and aluminium-bearing (Al) oxides, gain importance with increasing soil weathering as they conserve high specific surface areas. As soil acidification progresses with soil weathering, the importance of these oxides to stabilize OM compounds becomes more pronounced (Kleber et al., 2021). Hence, the potential of different SOM stabilization mechanisms changes dynamically as a function of mineral weathering (Mikutta et al., 2009). Given that different SOM compounds have differing binding preferences, mineral weathering is thus likely to affect SOM composition. Therefore, a promising approach to gain further insights into the controls of SOM composition is the observation of changes in SOM composition along pedogenic gradients.
The aim of our study was to assess how bulk SOM composition changed along an undisturbed soil chronosequence spanning 3 million years, located under rangeland vegetation in the Mediterranean climatic conditions of California, USA. To this end, we used the C : N ratio and the stable isotope signatures δ15N and δ13C as proxies for the degree of microbial transformation of the bulk SOM and the selected peak areas of diffuse reflectance infrared Fourier transform spectroscopy (DRIFTS) measurements as proxies for SOM composition. We then combined this information with previously published data on soil mineralogy and texture from the same samples (Doetterl et al., 2018) in order to identify which drivers are most important in explaining shifts in SOM composition with soil development. Based on previous studies, we hypothesized that absorbance peak areas related to simple plant-derived OM (S-POM) would decrease with increasing soil formation as binding sites for the formation of OMAs are reduced. Consequently, the protection of S-POM compounds from microbial degradation and transformation decreases. The peak areas of complex plant-derived OM (C-POM) were expected to increase with soil age due to preferential association with pedogenic iron oxides (Hall et al., 2016; Zhao et al., 2016; Huang et al., 2019). Finally, MOM was expected to strongly increase with soil age since microbial uptake of OM and the subsequent stabilization in soils leads to an increasing share of microbial-derived SOM (Cotrufo et al., 2013, 2015).
2.1 Site description
This study links information on soil mineralogy and texture (Doetterl et al., 2018) with proxies for microbial transformation and SOM composition to derive a better understanding of long-term SOM dynamics along weathering gradients. The study area is located in the California Central Valley (Merced County, CA, USA), where granitic debris with a minor share of mafic minerals from the Sierra Nevada foothills was deposited on alluvial terraces of the Merced River during interglacial periods (Harden, 1987; White et al., 1996, 2005). The alluvial deposits cover a temporal range of 3 million years, with the youngest terrace only 100 years old (Harden, 1987; Doetterl et al., 2018). We assume that the soil age corresponds to the age of the terrace depositions. The present climatic conditions across the study region are semiarid with a mean annual temperature of 16.3 ∘C and a mean annual precipitation of 315 mm (Reheis et al., 2012). On the flat, plateau-like terraces, extensive, unfertilized rangeland dominates, which is not affected by wildfires. The vegetation cover is uniform along the chronosequence, consisting of annual Mediterranean grasslands, with common species including Bromus mollis, Festuca spp. (grasses), Erodium spp. (forbs), and legumes (Trifolium spp.) (Jones and Woodmansee, 1979).
2.2 Soil sampling
Soil samples were collected in December 2013 from 1 m3 soil pits located within a diameter of approximately 40 km in the north of Merced County (Fig. 1). The terraces are named based on different quaternary periods that led to the alluvial deposition (Harden, 1987). The two youngest terraces are named Post-Modesto (PM) 24II (0.1 ka) and Post-Modesto (PM) 22 (3 ka). The intermediate terrace Modesto 2.4 m was deposited between 8 and 30 kyr (∅ 19) ago. The two oldest terraces are Riverbank deposits (from 260 to 330 kyr (∅ 295) ago) and Chinahat (3000 kyr old deposits). On each terrace one plot was sampled, and three field replicates were taken per pedogenic horizon (Doetterl et al., 2018). Yet, for the youngest 0.1 ka terrace, soils were only taken to a depth of 30 cm, and in the case of the intermediate Modesto 2.4 m terrace, soil samples were taken from three different soil pits. To convert the pedogenic horizons to homogeneous depth classes (0–10 and 10–30 cm), weighted arithmetic means were calculated based on the contribution of each pedogenic horizon to the respective depth class. All soils were classified as chromic Luvisols except for the 3 ka terrace (PM 22) which was classified as a dystric Fluvisol. The total sample set was comprised of 30 observations.
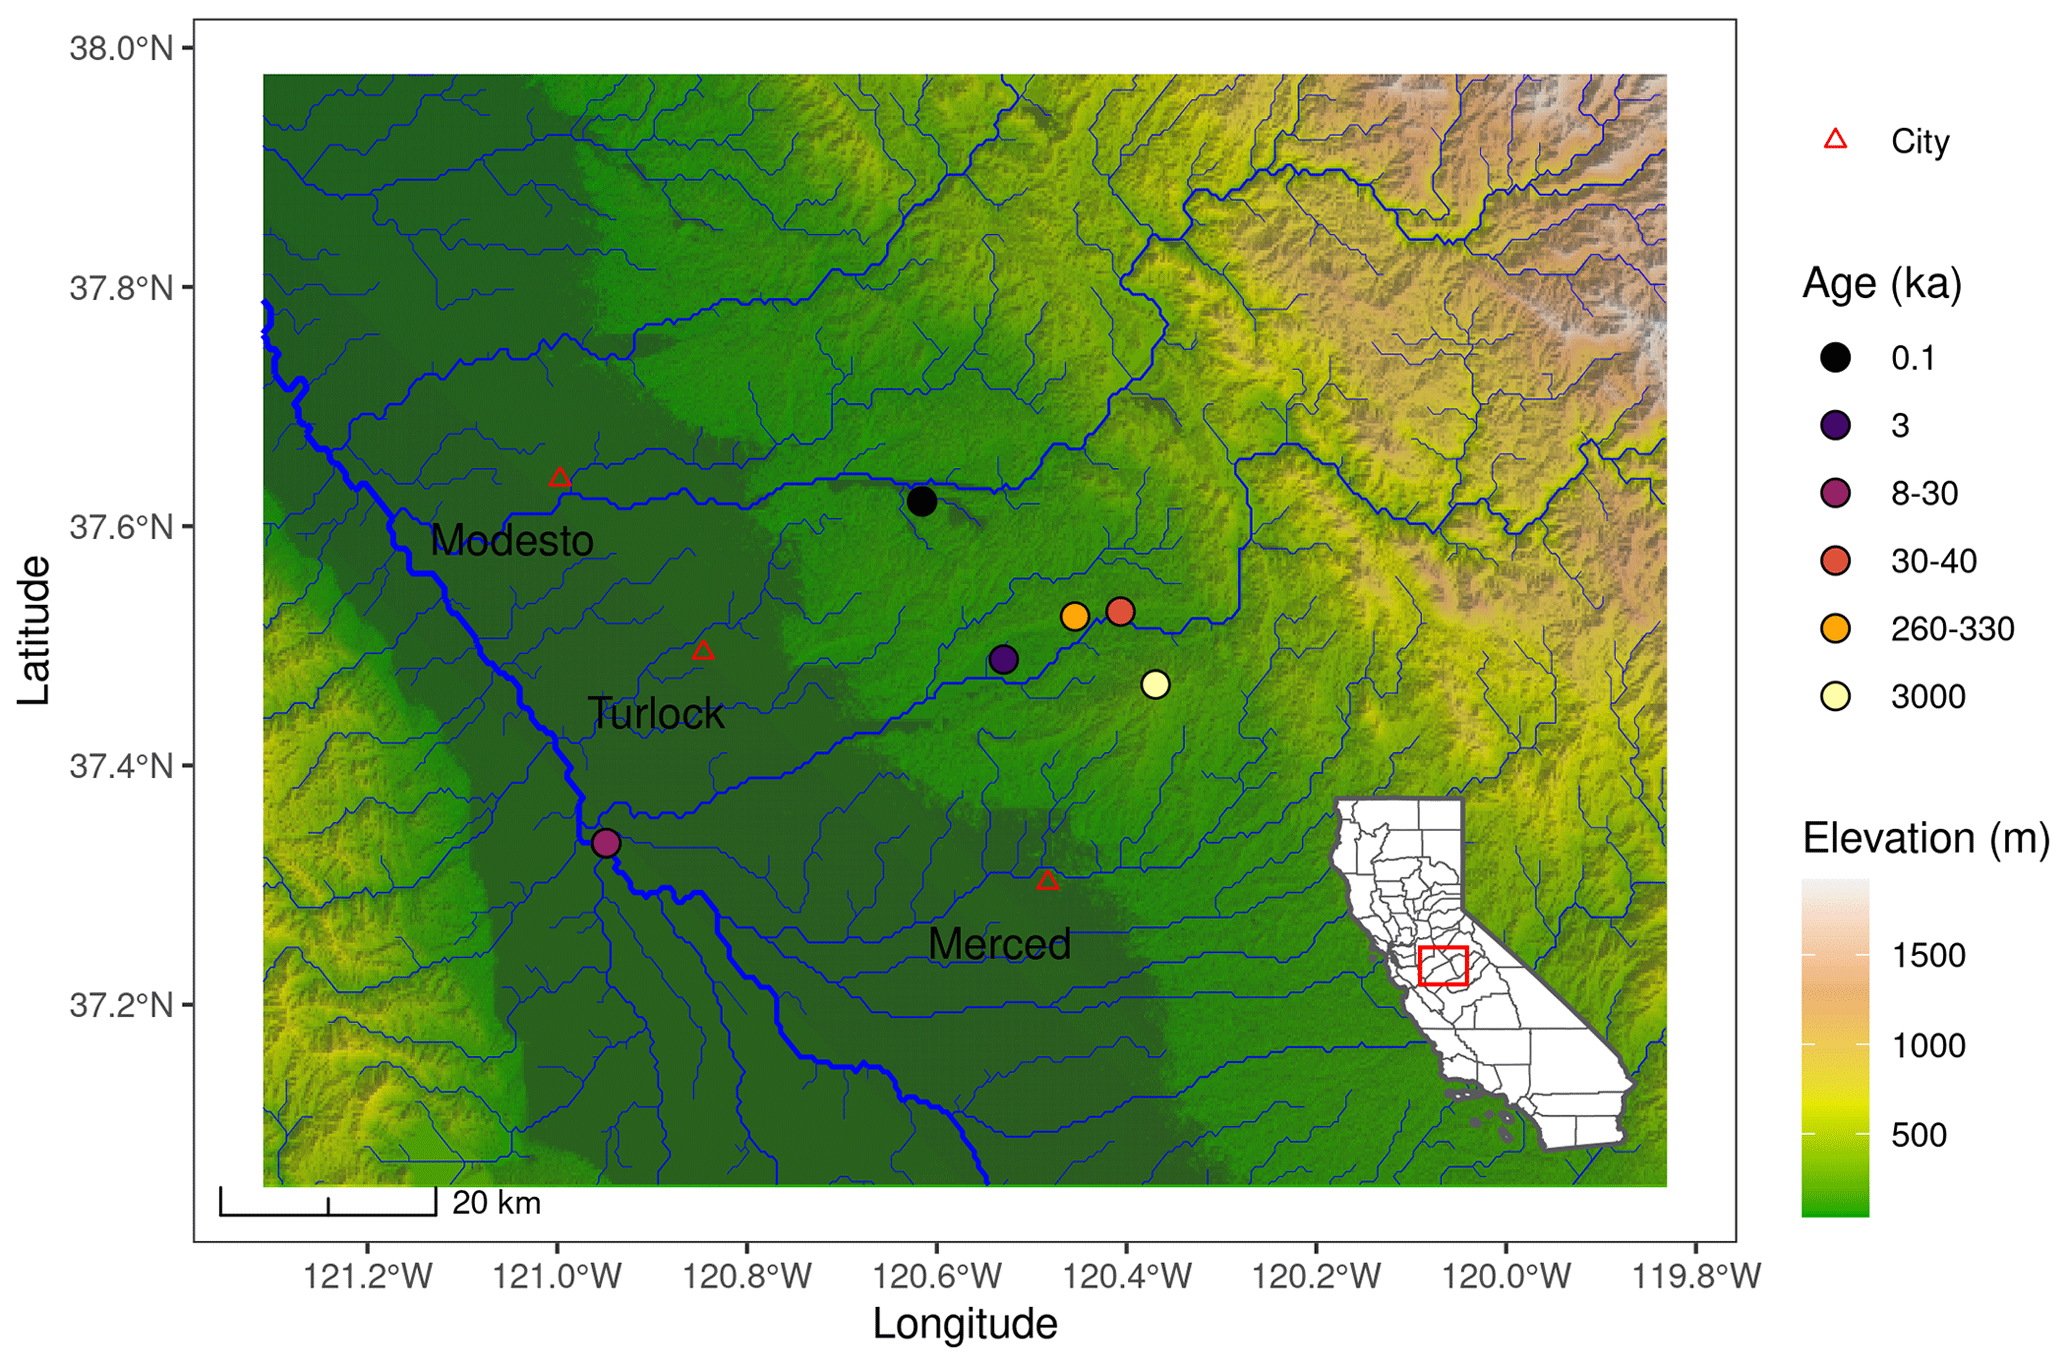
Figure 1Map of the study area based on a digital elevation model (DEM) retrieved from Shuttle Radar Topography Mission (SRTM, resolution ∼ 30 m). River hydrology data were taken from Lehner et al. (2008).
2.3 Soil analysis
Doetterl et al. (2018) quantified elemental composition, pedogenic oxides, soil pH, cation exchange capacity (CEC), and soil texture. Elemental composition of the soil samples was determined using inductively coupled plasma atomic emission spectrometry (ICP-AES) after borate fusion (Chao and Sanzolone, 1992). Extraction of pedogenic organo-mineral associations and oxy-hydroxides was done using dithionite–citrate–bicarbonate (DCB) at pH 8 (Mehra and Jackson, 1958). The extracted pedogenic oxides (FeDCB, AlDCB) were then quantified using ICP-AES and serve as a measure of how many Fe- and Al-bearing phases formed during soil pedogenesis. The degree of mineral weathering along the chronosequence was assessed based on successive depletion and/or accumulation of geochemical components. For instance, the Fetotal : Sitotal ratio indicates how the mostly pedogenically formed Fetotal relates with Sitotal, an element that abounds in the felsic parent material and accumulates in the semi-arid environment of the study area (White et al., 2005). Hence, the ratio decreases with increasing soil weathering. Similarly, the Ti : Zr ratio indicates the accumulation of Ti (constituent of many minerals) through mineral weathering relative to Zr (amount largely determined by the parent material). In addition, the increasing share of organo-mineral-associated Fe (FeDCB) and Al (AlDCB) was assessed relative to Fetotal (Fetotal : FeDCB) and Altotal, respectively.
Soil pH was averaged from two measurements, after 30 min and 24 h, in 0.01 M CaCl2 with a glass electrode. The potential CEC was measured as the NH exchanged after saturating cation exchange sites with aluminium acetate with 2 M KCl buffered at pH 7. The share of base saturation (Bsat) was calculated as the availability of all base cations (K, Na, Mg, Ca) relative to the potential CEC. Soil texture was analysed by Doetterl et al. (2018) with a Mastersizer 2000 laser diffraction particle size analyser (Malvern Instruments). Clay (<2 µm), silt (2–63 µm), and sand (63 µm–2 mm) were differentiated based on the World Reference Base (WRB) classification (WRB 2014). In silty soils, clay is under- and silt is overestimated due to the planar geometry of clay minerals (Beuselinck et al., 1998). Therefore, correction factors (see Eq. 1) were employed that correct the percentage of silt based on previous studies (Beuselinck et al., 1998; Miller and Schaetzl, 2012).
Soil samples were ground in a ball mill (8000M Mixer/Mill, with a 55 mL tungsten carbide vial, SPEX SamplePrep, LLC, Metuchen, NJ, USA) prior to SOM analysis. To assess the degree of microbial transformation of SOM, we quantified the stable isotope ratios using an elemental combustion system (Costech ECS 4010 CHNSO Analyzer, Costech Analytical Technologies, Valencia, CA, USA) that was interfaced with an isotope ratio mass spectrometer (DELTA V Plus isotope ratio mass spectrometer, Thermo Fisher Scientific, Inc., Waltham, MA, USA). The stable isotope values were complemented with total C values taken from Doetterl et al. (2018). Stable isotope values for δ13C and δ15N were calculated as the ratio of 13C over 12C and 15N over 14N (Rsample) relative to the Vienna Pee Dee Belemnite (VPDB) standard for δ13C and relative to atmospheric N2 for δ15N (Rstandard). The calculation follows Araya et al. (2017) (see Eq. 2):
The spectroscopic analysis was carried out with a Bruker IFS 66v/S Vacuum FT-IR spectrometer (Bruker Biosciences Corporation, Billerica, MA, USA) to collect diffuse mid-infrared reflectance with a wavenumber range from 4000 to 400 cm−1 (2500–25 000 nm wavelength). In our analysis, 100 co-added scans were performed on each ground sample and averaged for further analysis. Spectra were normalized with the standard normal variate (SNV) method for scatter correction and a potassium–bromide (KBr) background for baseline correction. Subsequently, absorbance peak areas were integrated using a local baseline defined as a straight line connecting the absorbances at the upper and lower wavenumber limits of each functional group (Demyan et al., 2012). Negative peak areas were attributed to noise due to low C stocks and not to excessive signal strength as they only occurred in the subsoil. To account for potential variation in signal strength due to varying C stocks, the peak areas were divided by the respective C stocks. The treatments of the spectra were performed using the OPUS software (version 7.5.18; Bruker Optik GmbH, Ettlingen, Germany).
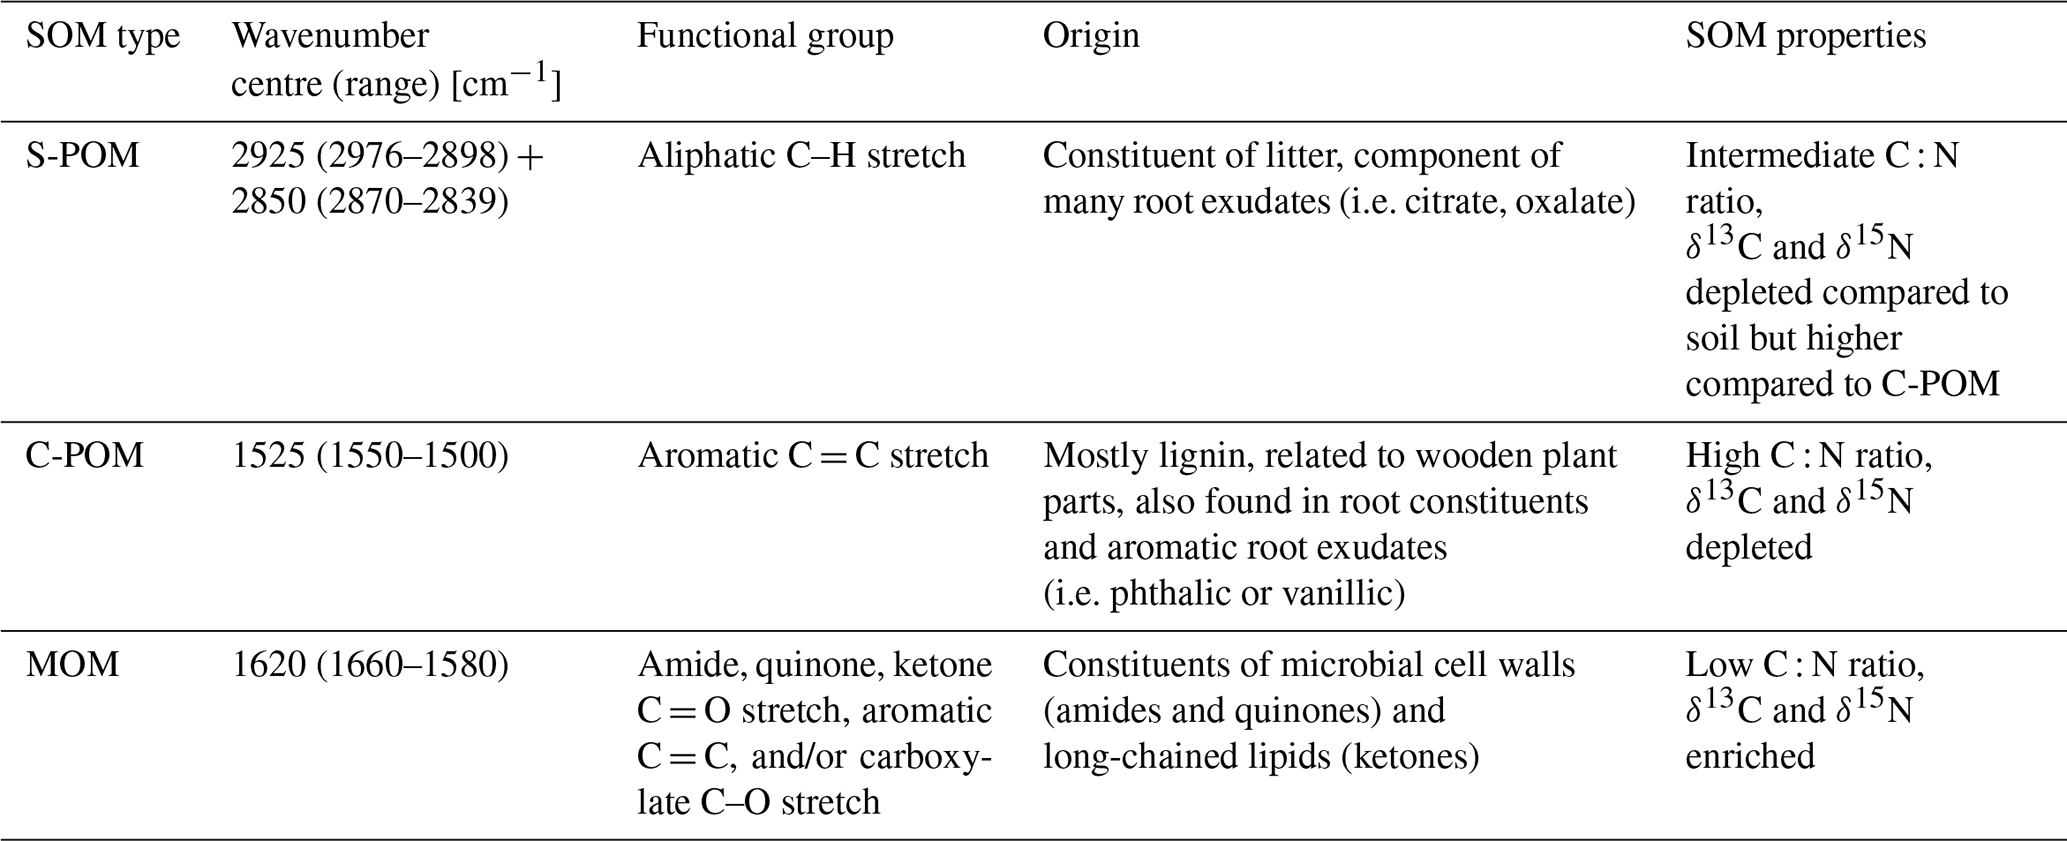
We differentiated three functional groups, based on extensive previous research (Ellerbrock et al., 2004; Demyan et al., 2012; Vranova et al., 2013; Parikh et al., 2014; Ryals et al., 2014; Viscarra Rossel et al., 2016; Fissore et al., 2017; Hall et al., 2018): aliphatic C–H bonds, aromatic C = C bonds, and C = O bonds (see Fig. 2). These three functional groups are known to be indicative of three groups of SOM compounds with strongly differing chemical properties and consequently differing bioavailability to microorganisms in soil systems (see Table 1). The wavenumber ranges centred at 2925 (2976–2898 cm−1) and 2850 cm−1 (2870–2839 cm−1) are attributed to antisymmetric and symmetric aliphatic C–H stretching (Parikh et al., 2014) and represent simple plant-derived organic compounds (S-POM), e.g. originating from leaf compounds (i.e. waxes), as well as certain organic acids that are secreted by plant roots (i.e. citrate and oxalate) (Vranova et al., 2013). The second wavenumber range, located at 1512 cm−1 (1550–1500 cm−1), represents aromatic C = C compounds (Parikh et al., 2014). This functional group is related to lignin-derived, complex plant-derived compounds (C-POM) present in lignin constituents of wooden plant parts and aromatic organic acids of root exudates (Ryals et al. 2014). A large wavenumber range at 1620 cm−1 (1660–1580 cm−1) represents a carboxylic C = O stretch of amides, quinones, and ketones, with possible shares of aromatic compounds (Parikh et al., 2014). This peak area is interpreted as microbial-derived organic compounds (MOM) and jointly represents amides and quinones, which constitute microbial cell walls, as well as a ketone contribution attributed to long-chained lipids that can also be found in plant materials (Kögel-Knabner and Amelung, 2014). Wavenumber ranges that overlap with signals from mineral compounds, i.e. between 1400 and 400 cm−1 (Parikh et al., 2014; Margenot et al., 2015, 2017), were excluded from our analysis.
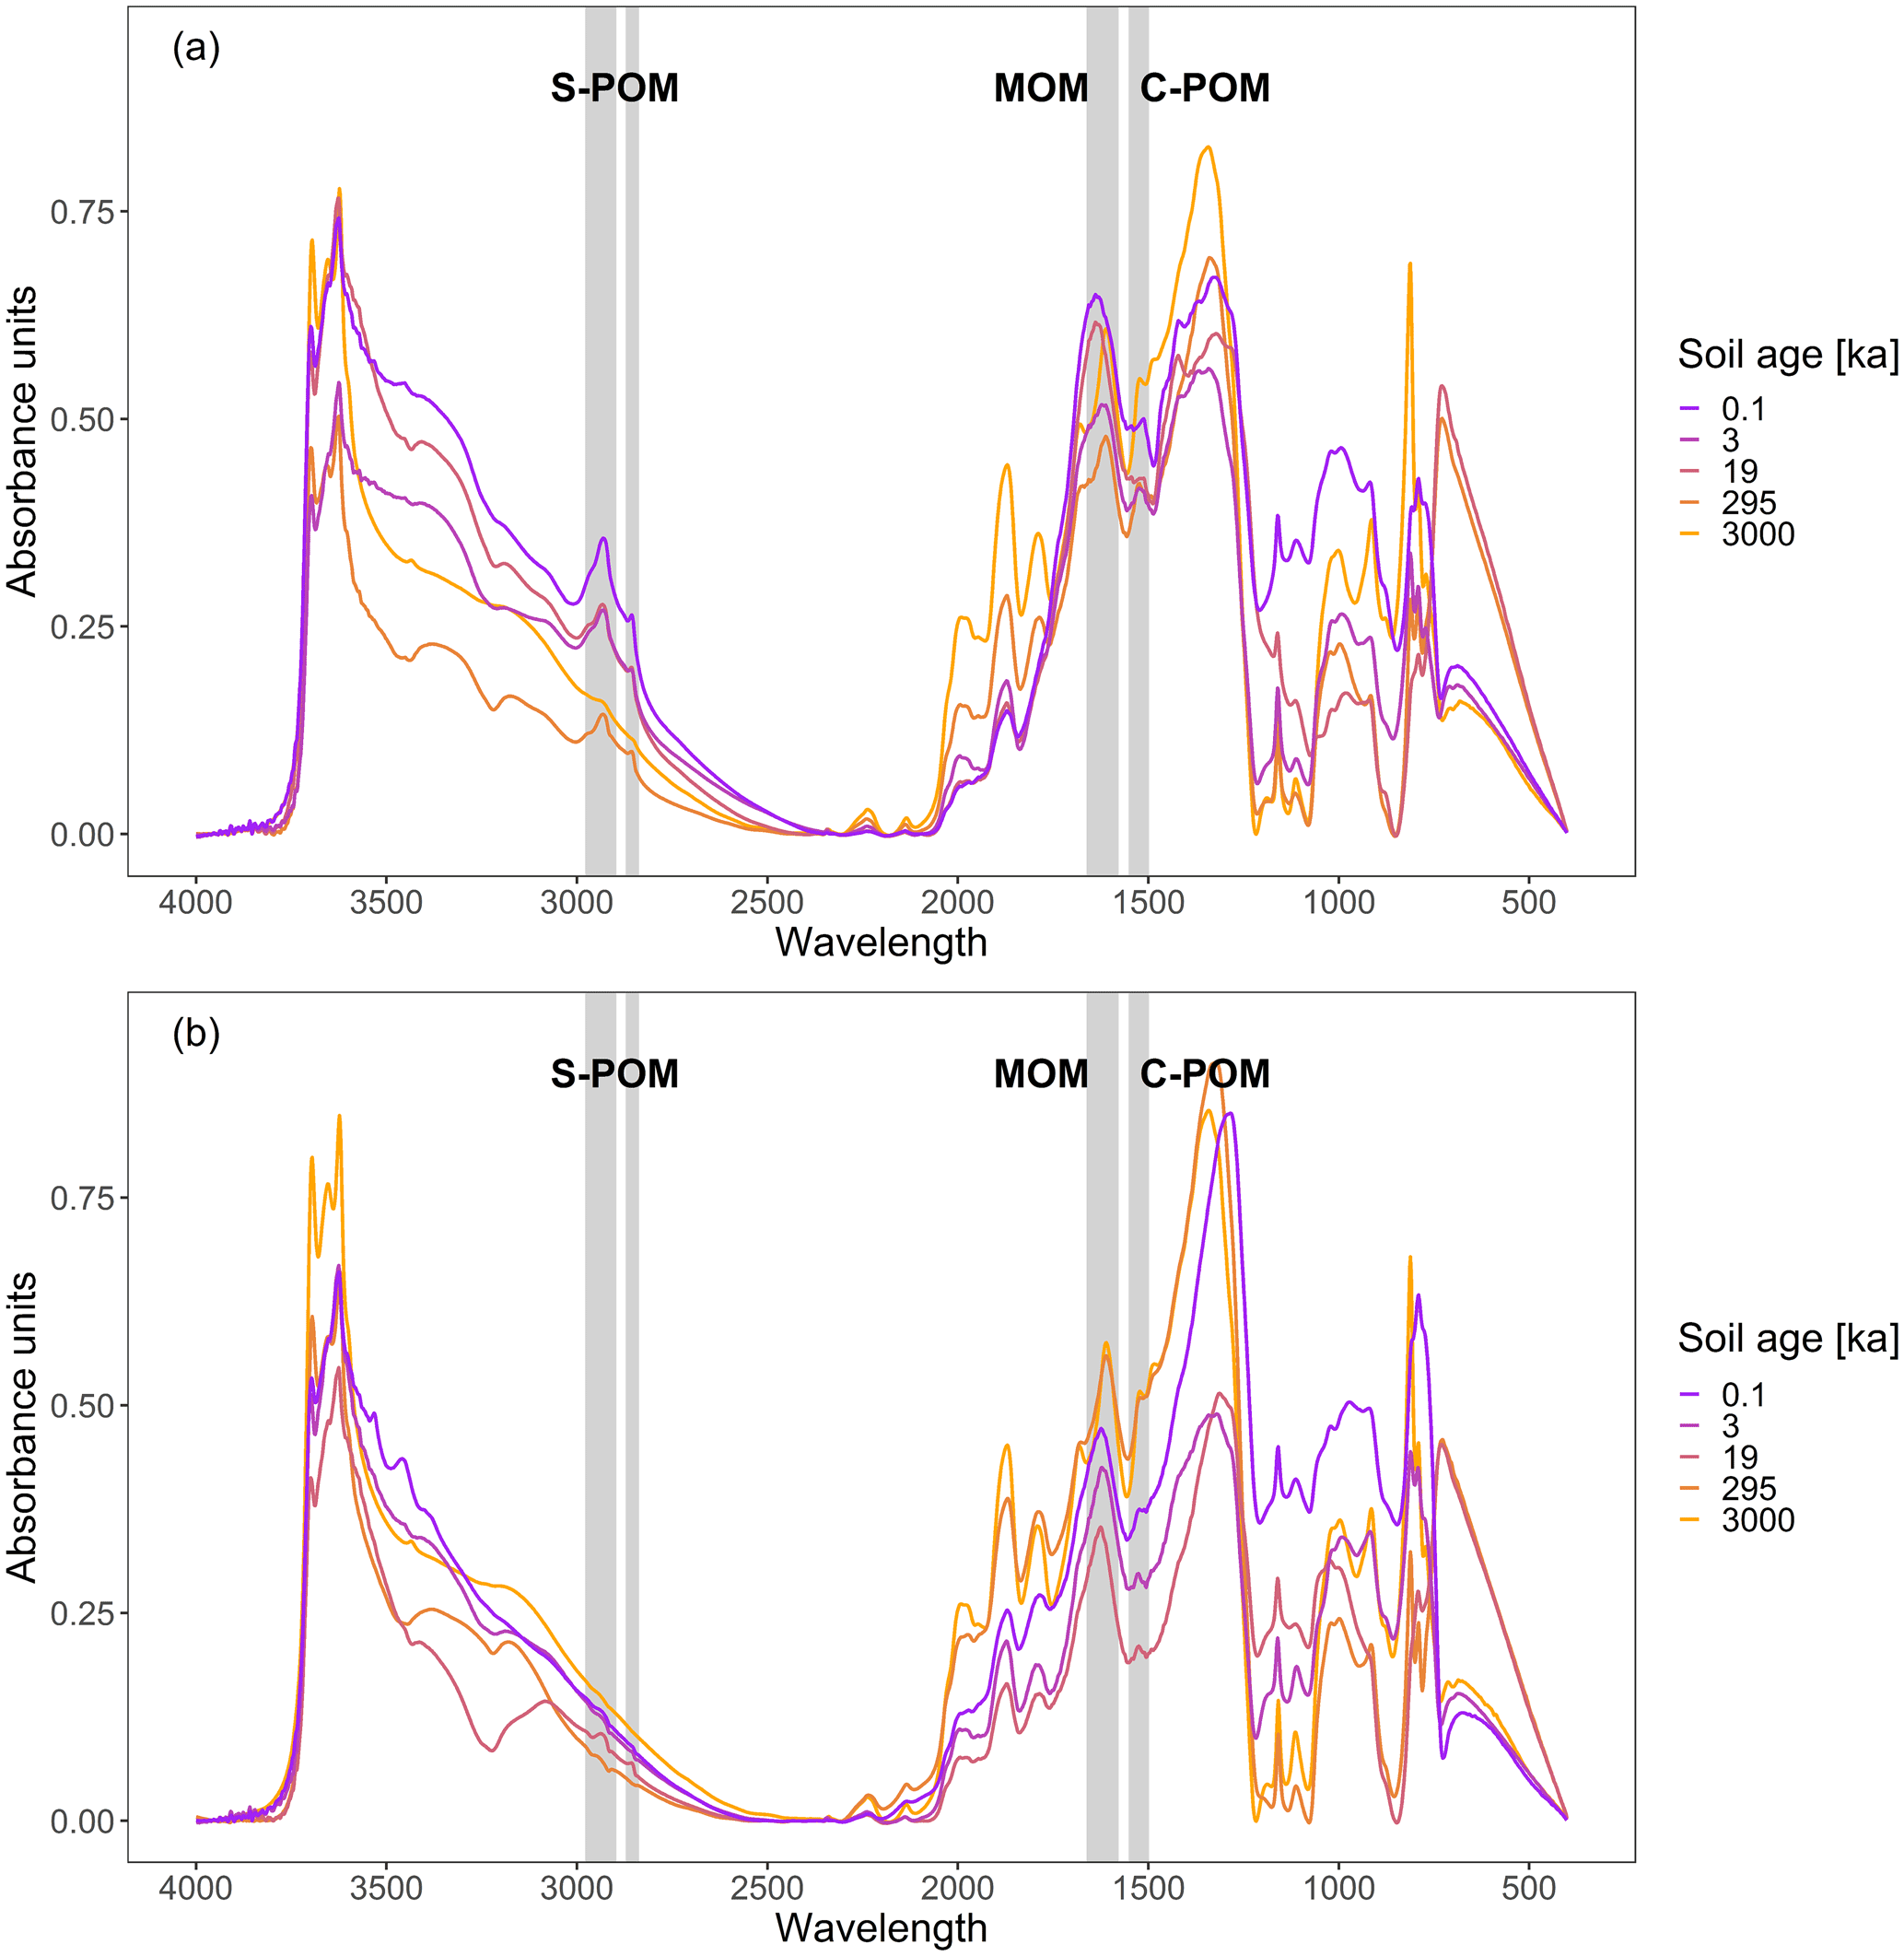
Figure 2Baseline-corrected DRIFTS spectra of each soil age for 0–10 (a) and 10–30 cm (b) soil depth. The wavenumber ranges across which absorbance peak areas were integrated for functional group assignment are indicated with grey bars in the background. The two wavenumber ranges around 2900 cm−1 stand for simple plant-derived OM (S-POM), the one around 1620 cm−1 for microbially associated OM (MOM), and the one at 1525 cm−1 for complex plant-derived OM (C-POM).
Table 1Overview of wavenumber ranges used to calculate absorbance peak areas from DRIFTS, the respective functional groups related to specific biochemical properties of SOM compounds and compiled information on the origin (Demyan et al., 2012; Parikh et al., 2014; Hall et al., 2018), and the respective SOM properties (C : N ratio, δ13C, and δ15N values) of each functional group (Benner et al., 1987; Austin and Vitousek, 1998; Dijkstra et al., 2006; Xu et al., 2010; Vranova et al., 2013).
2.4 Statistical analysis
Statistical analysis was carried out using R (Version 4.0.1, R Core Team, 2020). Two-way analysis of variance (ANOVA) was carried out to assess differences across soil age (0.1, 3, 19, 295, 3000 ka) and soil depth (topsoil: 0–10; and subsoil: 10–30 cm) to identify significant trends of bulk SOM composition parameters (n=30). The significance level of the ANOVA results was at p<0.05. Prior to the ANOVA, residuals were tested for normality with a Shapiro–Wilk test, and the homogeneity of variances were checked with Levene's test. We used Tukey's honestly significant difference (HSD) as a post hoc test for pairwise comparison of homogeneous subgroups across soil ages. For the mineralogy and texture data taken from Doetterl et al. (2018), no ANOVA was carried out due to the low number of observations (n=10).
Linear models were formulated to explain the influence of mineralogy and texture variables on the SOM composition (dependent variables: C : N ratio, δ15N, δ13C, S-POM, C-POM, MOM) independent of soil age and soil depth. We controlled for multicollinearity among all variables by calculating variance inflation factors (VIFs) and excluded all variables with VIFs above 5 (Kuhn, 2020). VIFs quantify the collinearity of a variable with the model (Fox and Monette, 1992; Fox and Weisberg, 2019). The VIF of each variable was computed as follows (James et al., 2013) (Eq. 3):
Out of the variables presented in Table 2, the Fetotal : Sitotal ratio, clay content, FeDCB, and AlDCB were selected as explanatory variables as their inflation factor was below 5. Based on these variables, linear least squares regressions were calculated to explain SOM properties (C : N ratio, δ13C, δ15N, S-POM, C-POM, and MOM). To assess the variable importance of the model parameters we used the absolute t values which are calculated by dividing the parameter estimate (βi) by the standard error of estimation (SEi) (James et al., 2013; Kuhn, 2020). The t value is a measure to determine the effect that each parameter has on the regression slope (Grömping, 2015). To give information on the significance of the impact, we added the p value attributed to each predictor (Bring, 1996). The goodness of model fit was quantified with the R2 value. The root mean squared error (RMSE), as a measure of prediction error, and the mean absolute error (MAE), as a measure of model bias, were quantified by a Monte Carlo cross-validation following a leave-one-group-out principle. Thus, the RMSE and MAE were calculated as the difference between predicted values based on a randomly selected training set (80 % of the observations) in relation to a randomly selected validation set (20 % of the observations) and relative to the sample size. The RMSE, the MAE, and the R2 values were averaged, and respective standard deviations were calculated based on 100 iterations of the cross-validation. In addition, we calculated the relative RMSE (rRMSE) and relative MAE (rMAE). They were calculated as the quotient of the RMSE and the mean of the response variable and multiplied by 100 (to get percentages).
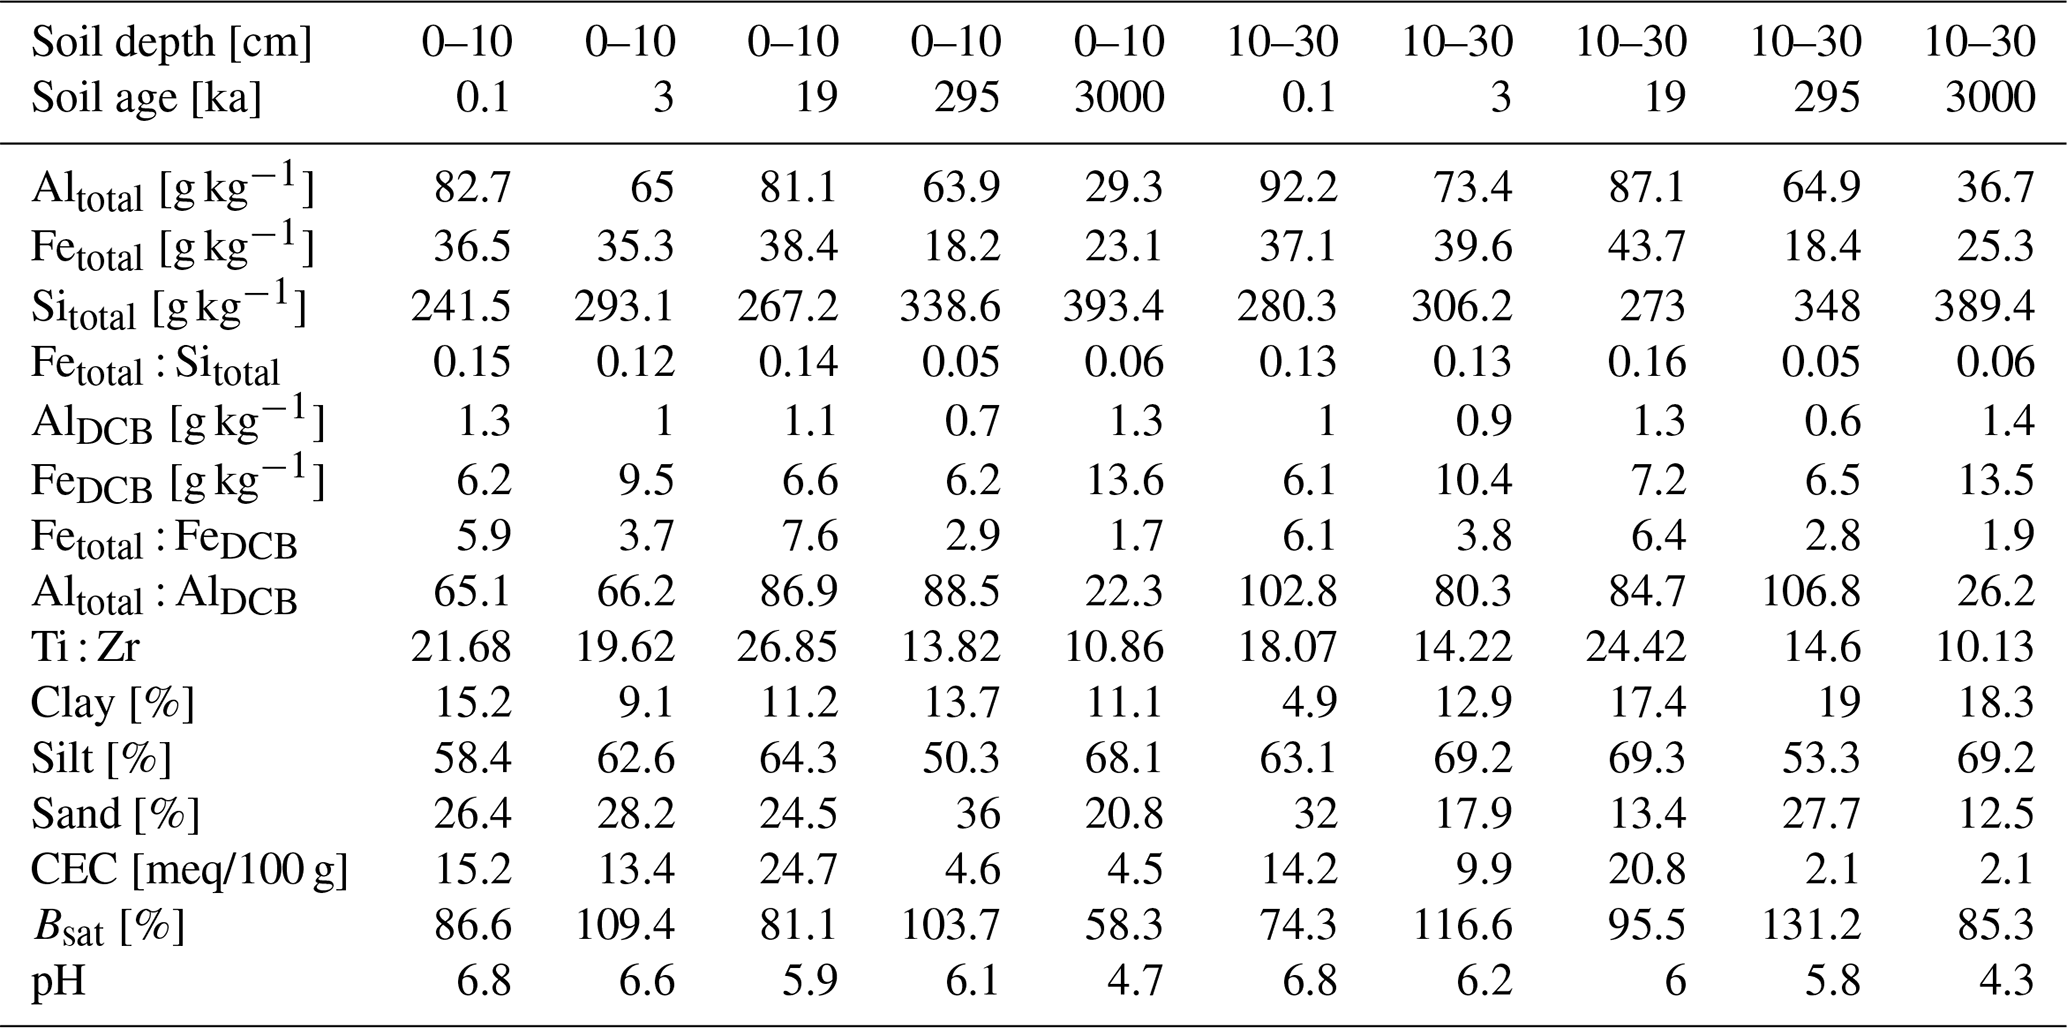
Table 2Overview of soil mineralogy and texture changes with increasing soil age at 0–10 and 10–30 cm depth (n=10). The mineralogy was measured using inductively coupled plasma atomic emission spectrometry (ICP-AES). Texture was quantified with a laser diffraction particle size analyser. Pedogenic oxides were extracted in duplicates with dithionite–citrate–bicarbonate (DCB).
3.1 Changes in soil properties and SOM composition along the chronosequence
With increasing soil age, the soil mineral matrix was progressively weathered. Weathering and leaching of cations were reflected in decreasing trends of the CEC from 15.2 to 4.5 at 0–10 cm depth (difference between youngest (0.1 ka) and oldest (3000 ka) terrace) and from 14.2 to 2.1 at 10–30 cm depth (see Table 2). Similarly, soil pH showed a trend to decrease from 6.8 to 4.7 in 0–10 cm and 6.8 to 4.3 at 10–30 cm depth (see Table 2). Yet, the gradient observed for CEC and soil pH was not found in base saturation (Bsat) values which did not show any clear pattern with increasing soil age but were consistently higher at the 10–30 cm compared to 0–10 cm depth (except for the youngest 0.1 ka terrace). We observed an increase in Sitotal from 241.5 to 393.4 g kg−1 at 0–10 cm and from 280.3 to 389.4 g kg−1 at the 10–30 cm depth with increasing soil age. Altotal and Fetotal contents showed the opposite trend, decreasing with soil age in both depths. However, this decrease was not displayed in the fractions of DCB-extractable Al (AlDCB) and Fe (FeDCB). While AlDCB stagnated along the age gradient at values ranging from 0.7 to 1.3 g kg−1 at 0–10 cm depth and 0.6 to 1.4 g kg−1 at 10–30 cm depth, FeDCB exhibited an increasing trend in both depths. At 0–10 cm depth the values increased from 6.2 to 13.6 g kg−1 and at 10–30 cm depth from 6.1 to 13.5 g kg−1. The higher FeDCB values among the DCB-extracted pedogenic oxides reflect the high potential of Fe to be quantitatively important for SOM binding. The Fetotal : FeDCB ratio showed the highest values in the soils of the 19 ka terrace (7.6 at 0–10 cm and 6.4 at 10–30 cm depth). The Altotal : AlDCB ratio was highest in soils of the 295 ka terrace with values of 88.5 at 0–10 cm depth and 106.8 at 10–30 cm depth (see Table 2). Soil texture showed no clear patterns with soil age but instead differed between the 0–10 and 10–30 cm depths (Table 2). Except for the youngest terrace, silt and clay fractions were more abundant at 10–30 cm depth, while the proportion of sand was mostly lower relative to the 0–10 cm depth.
Overall, bulk total C decreased significantly with soil depth (ANOVA results were significant at p<0.05) and with soil age at the 0–10 cm depth (see Fig. 3a). However, the decrease was not linear, and the highest C stock was measured at 3 ka (3.6 kg m2 C; see Fig. 3a). Furthermore, the C : N ratio was lower at 10–30 cm depth and in the 19, 295, and 3000 kyr old soils compared to the 0.1 and 3 kyr old soils (see Fig. 3b). In contrast, δ13C values showed no significant pattern with soil age but increased with soil depth (see Fig. 3c). The δ15N values increased significantly with soil age but showed no significant difference from 0–10 to 10–30 cm depth (see Fig. 3d). Similarly, the peak areas of S-POM were significantly lower at the 10–30 cm depth and remained stable with increasing soil age (see Fig. 4a). Conversely, peak areas related to C-POM and MOM significantly increased with age at 0–10 cm depth and 10–30 cm depth. Moreover, peak areas were significantly higher at 10–30 cm (see Fig. 4b and c).
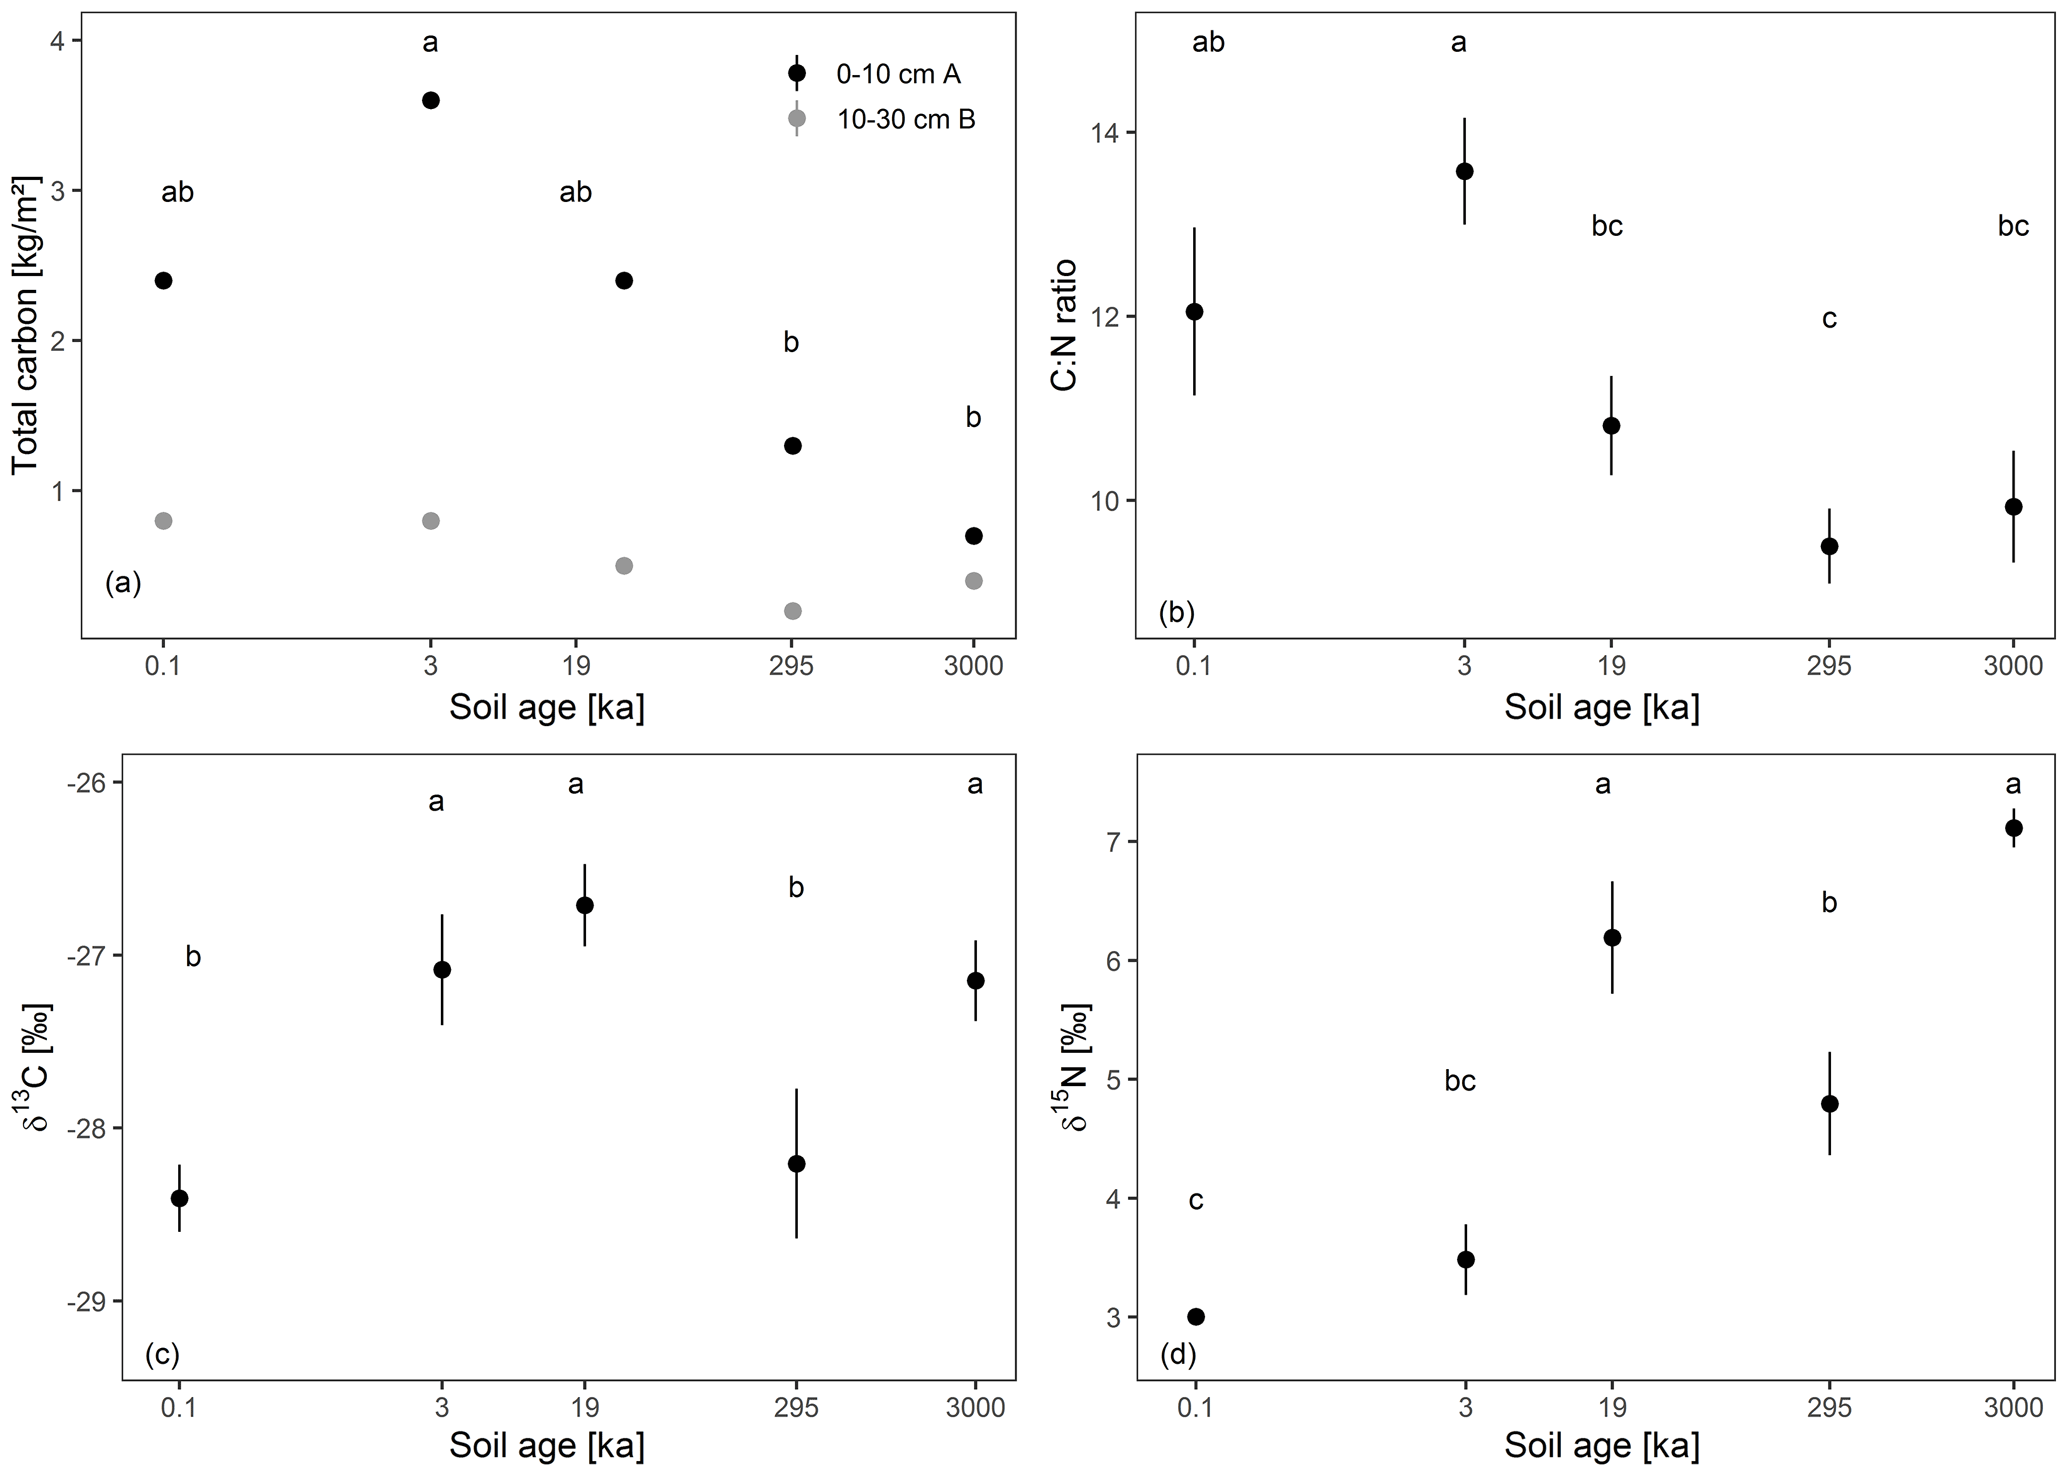
Figure 3Mean ± standard deviation of site triplicates of total C (a), the C : N ratio (b), δ13C (c), and δ15N (d) for 0–10 (black) and 10–30 cm soil depth (grey). Significant differences between the soil ages calculated with Tukey's HSD test are indicated with letters (p<0.05). Differences across soil age are indicated with lowercase letters and differences across soil depth in capital letters. Soil age is spaced based on the log-transformed age differences.
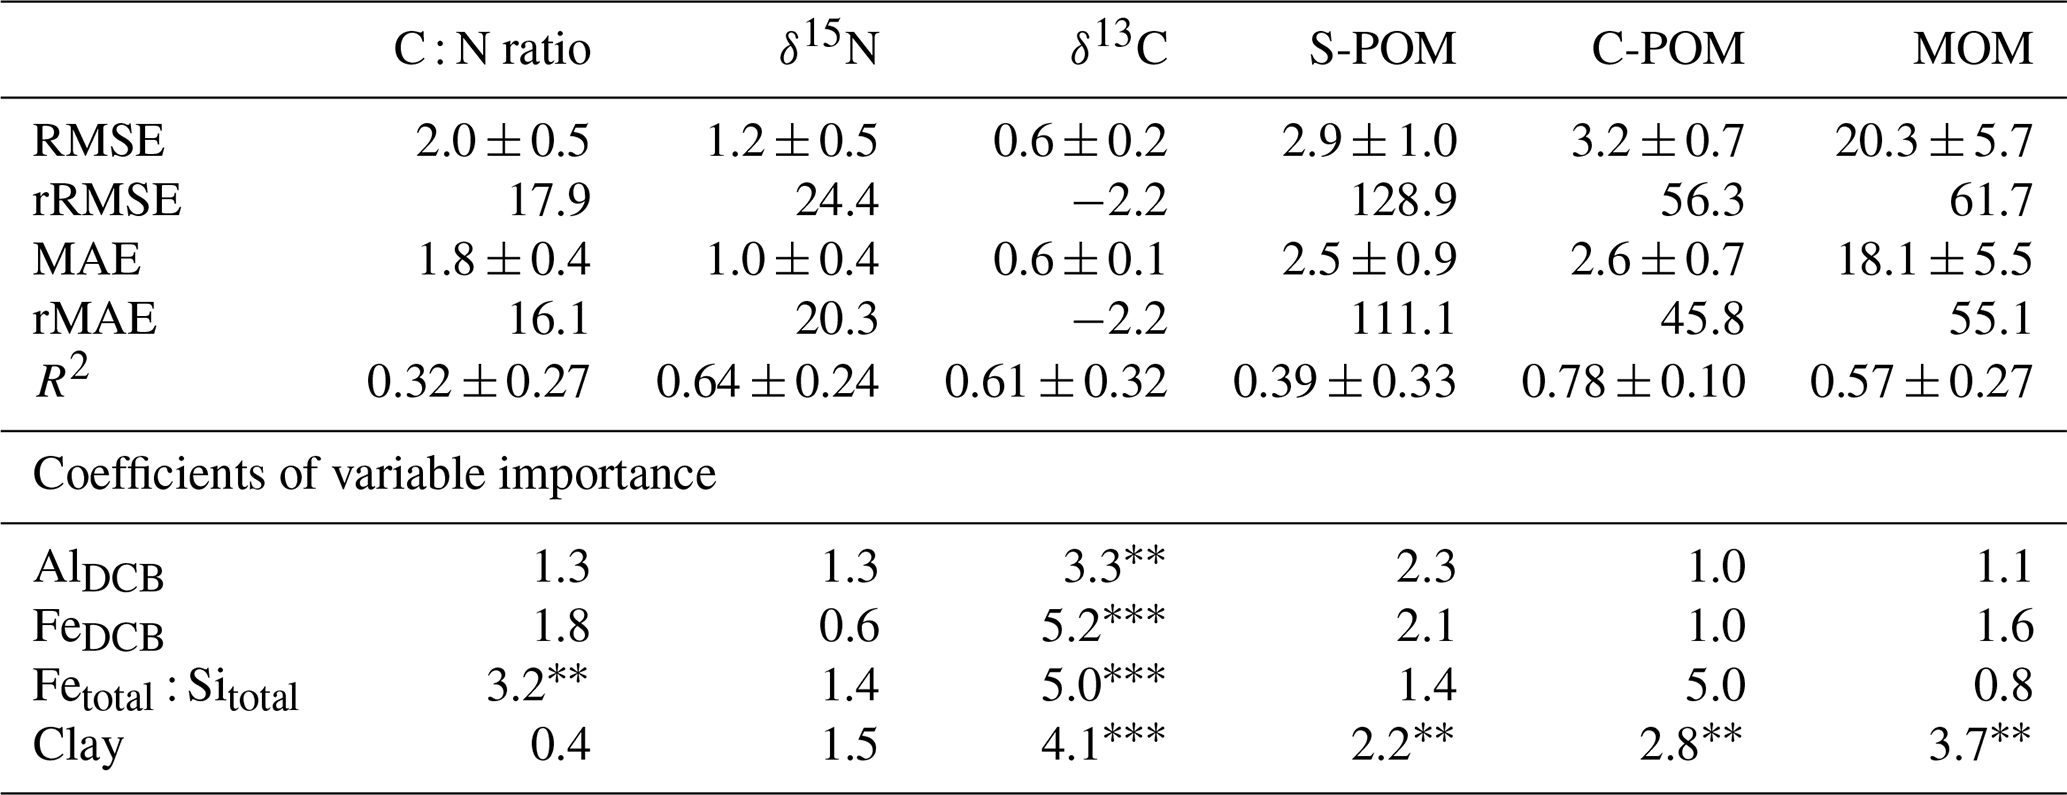
Table 3Overview of the linear regression models describing SOM composition (C : N ratio, δ15N, and δ13C), as well as peak areas of functional groups related to simple plant-derived OM (S-POM), complex plant-derived OM (C-POM) and mainly microbial-derived OM (MOM) based on n=30 observations. Explanatory variables related to the mineral matrix and soil texture were selected (AlDCB, FeDCB, Fetotal : Sitotal ratio, clay content). Absolute and relative model fit parameters (root mean squared error (RMSE and rRMSE), mean absolute error (MAE and rMAE), and R2 ) with standard deviations were computed following 100 iterations of a Monte Carlo cross-validation. Higher coefficients of variable importance indicate a higher importance of the variable to explain the impact on the regression slope. The significance levels of each model parameter on the linear model are denoted as p<0.001 and p<0.01.
3.2 Link between soil geochemistry and SOM composition
The DRIFTS peak areas related to S-POM decreased significantly with soil depth, while the C-POM and MOM signals rose significantly with increasing soil age and soil depth (see Fig. 4). This raised the question of whether there were identifiable soil properties driving the relative changes in S-POM, C-POM, and MOM. Therefore, we used a modelling approach to predict bulk SOM composition using the soil mineralogy and texture parameters which were not affected by multicollinearity (see “Methods”). In Table 3, the mean model fit (RMSE and R2), respective relative measures (rRMSE, rMAE), and variable importance coefficients are presented based on the cross-validated results of the linear models with randomly divided training and control sets (see “Methods”).
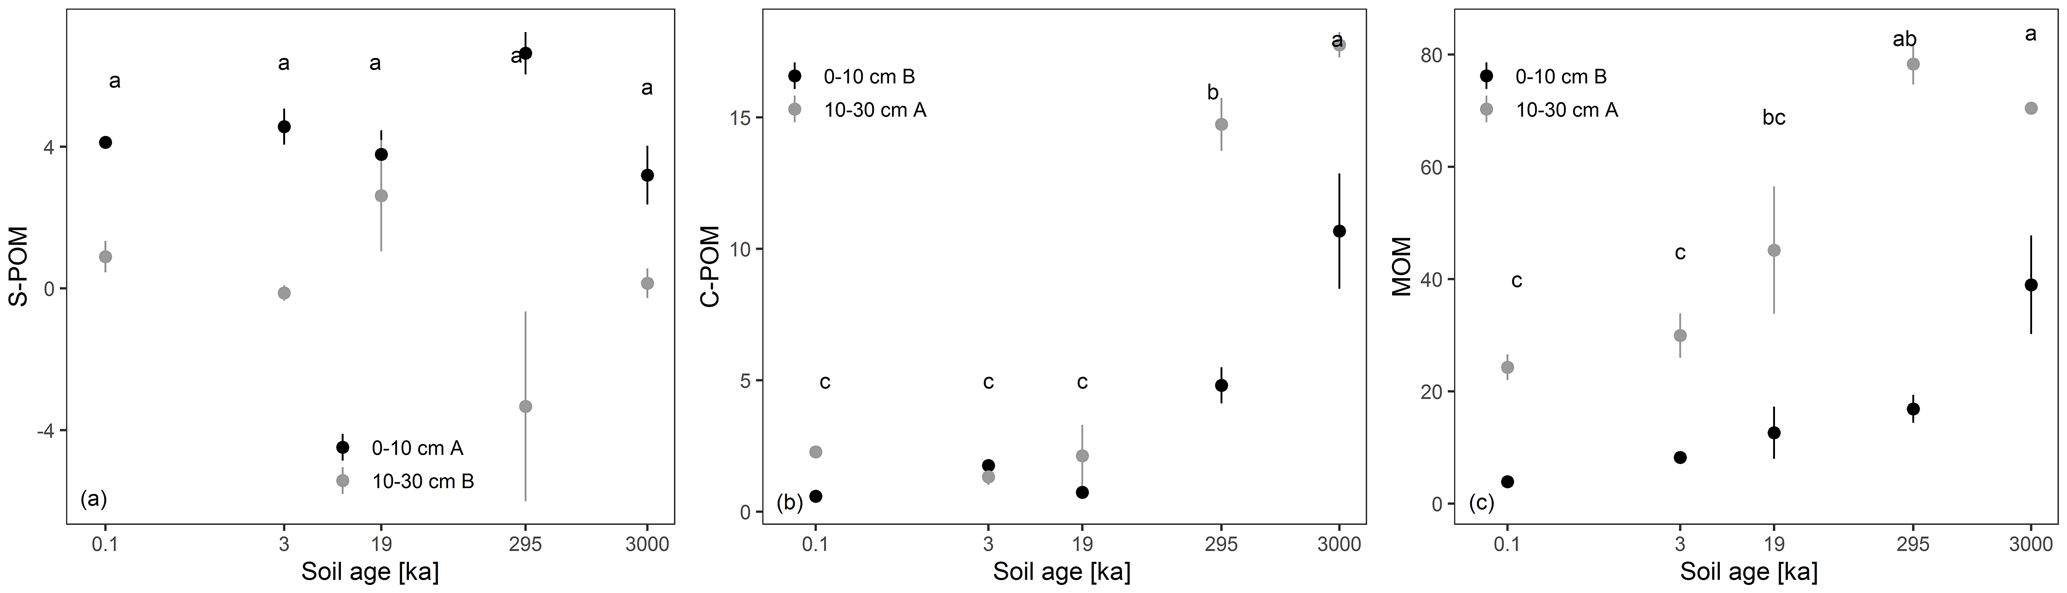
Figure 4Mean ± standard deviation of site triplicates of the DRIFTS absorbance peak areas (unitless) corresponding to simple plant-derived OM (S-POM; a), complex plant-derived OM (C-POM; b), and mainly microbial-derived OM (MOM; c) for 0–10 (black) and 10–30 cm soil depth (grey). Homogeneous subgroups (p<0.05) across soil age are indicated with letters. Significant differences between soil depth are indicated with letters behind the depth classes in the legend. The subgroups were identified by pairwise comparison (Tukey's HSD) following a two-way ANOVA (n=30). Soil age is spaced based on the log-transformed age differences.
The C : N ratio was best explained by the Fetotal : Sitotal ratio which was the most important variable contributing significantly to the regression slope (p<0.01; see Table 3). However, the R2 showed high variability and was comparatively low in relation to the other models (R2: 0.32 mean ± 0.27 SD). The rRMSE of 17.9 % and the rMAE of 16.1 % indicated a good prediction error compared to the other models (see Table 3). The δ15N values were most influenced by clay content, the Fetotal : Sitotal ratio, and AlDCB. However, despite the high model fit, no model parameter was significant. Similar results were obtained for the R2 values of δ13C. In this model all parameters were significant (p<0.001), and based on the absolute values of the variable importance coefficients, FeDCB, the Fetotal : Sitotal ratio, and clay were more important than AlDCB (see Table 3). The rRMSE and rMAE were slightly higher for δ15N compared to the C : N ratio model (rRMSE: 24.2 %; rMAE: 20.3 %) and low for δ13C (rRMSE: −2.2 %; rMAE: −2.2 %). Regarding the peak areas related to S-POM, the most important significant variable was clay (p<0.01; see Table 3). Yet, the explained variance was low and had a high standard deviation (R2: 0.39 ± 0.33). This is also reflected in a high rRMSE and rMAE of >100 % (see Table 3). Conversely, the linear models explaining the variance of the peak areas linked to C-POM and MOM had high R2 values (R2: 0.78 ± 0.10 and 0.57 ± 0.27, respectively) indicating a good fit. In both cases, clay content was the only significant model parameter (p<0.01). Despite the high variable importance of the Fetotal : Sitotal ratio in the C-POM model, this parameter was not significant (see Table 3). The rRMSE (C-POM: 56.3 %; MOM: 61.7 %) and rMAE (C-POM: 45.8 %; MOM: 55.1 %) were high in both cases.
Our study assessed to what extent SOM composition changes as driven by soil weathering. We found that soil mineralogical and texture properties were able to explain a large part of variance in SOM composition parameters (Table 3). SOM was increasingly processed as indicated by a significant decrease in the C : N ratio and δ15N over time and significant decreases in δ13C with soil depth. These developments were accompanied by significant increases in the peak areas related to complex plant-derived OM (C-POM) and microbial-derived OM (MOM), as well as constant peak areas related to simple plant-derived OM (S-POM) (see Fig. 5). This suggests that changes in soil mineralogy following weathering likely exert control on SOM composition.
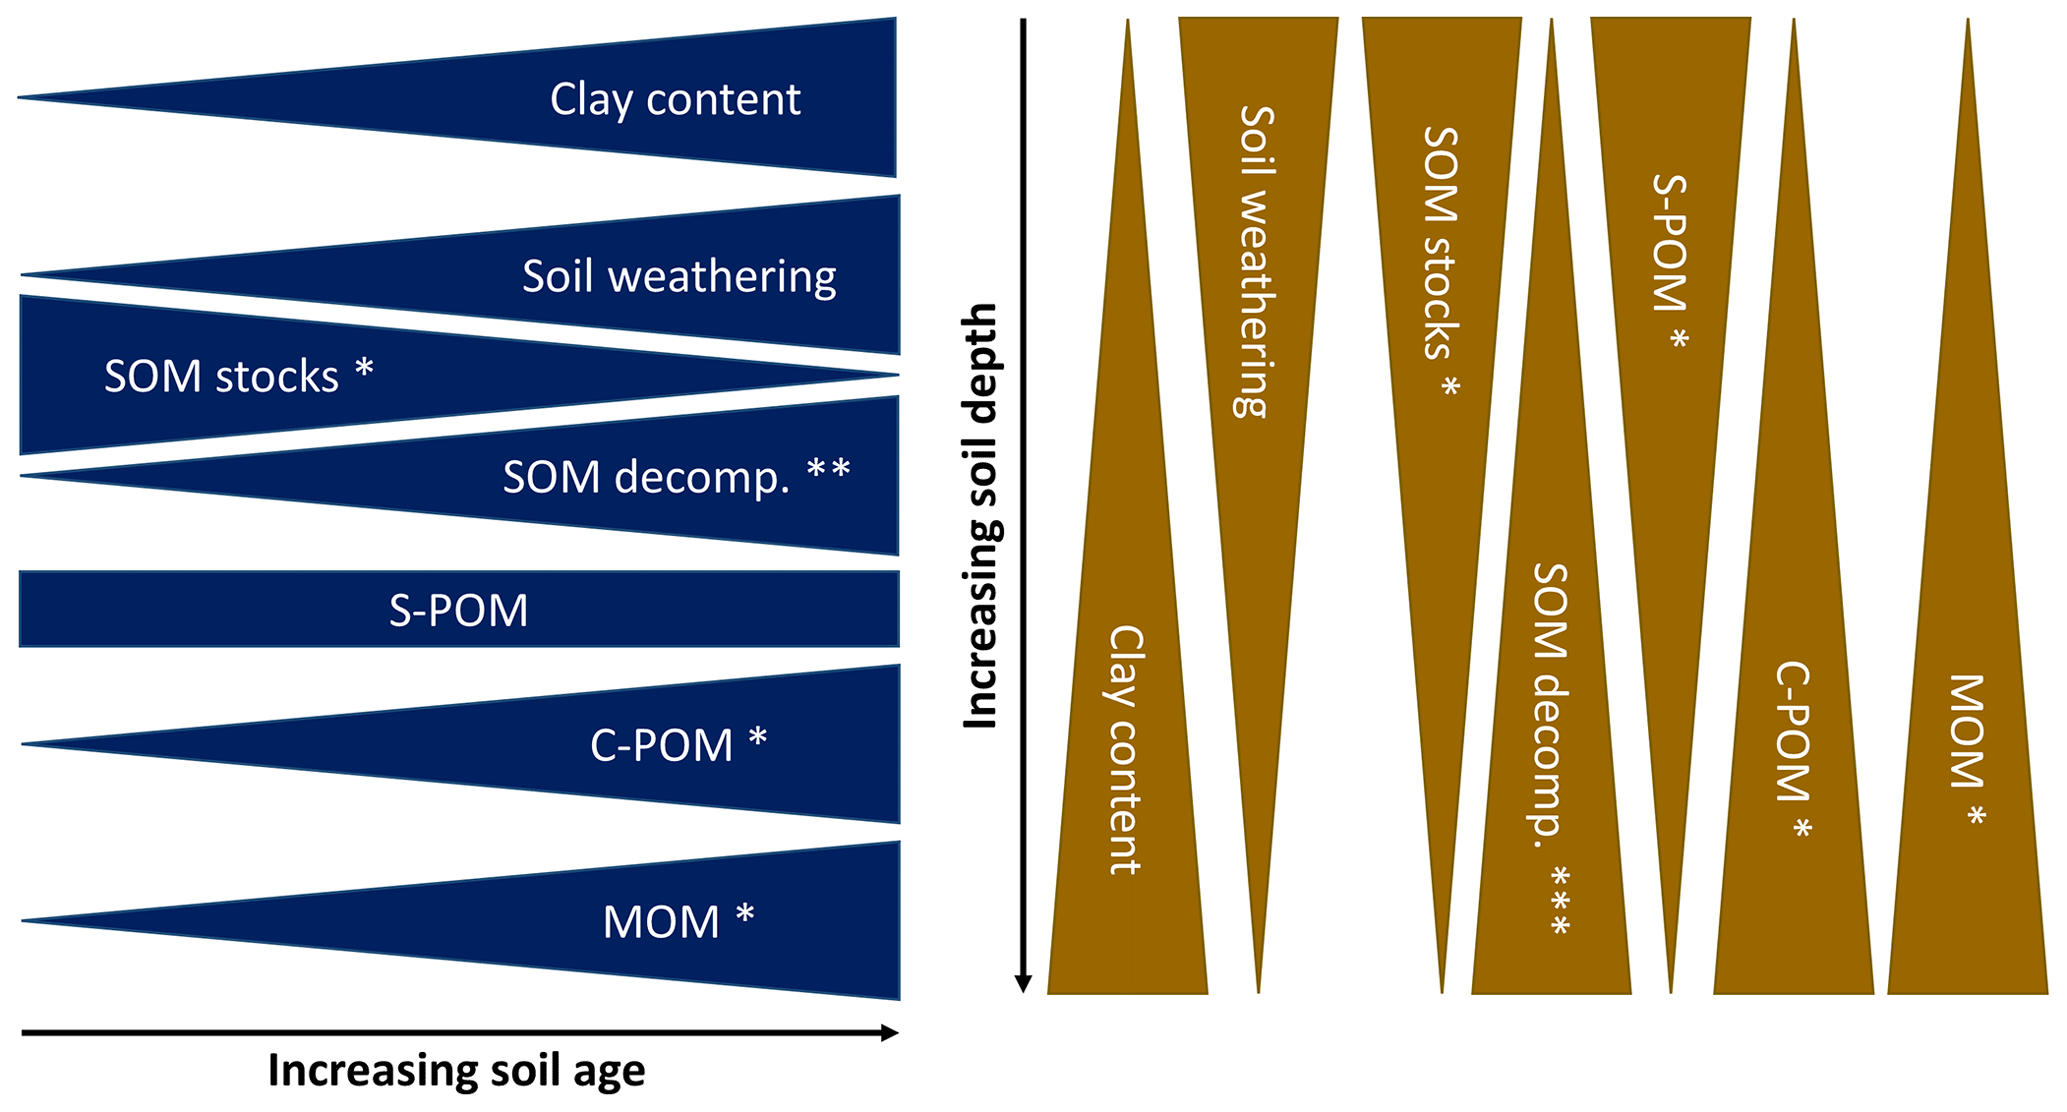
Figure 5Conceptual model explaining the influence of soil development with increasing soil age and depth on mineralogy and texture based on our findings. These properties (i.e. Fetotal : Sitotal, FeDCB) may then drive the dynamics of SOM stocks, properties, and composition. SOM stocks reflect the total C stock, SOM decomposition proxies include δ13C, δ15N, and the C : N ratio, and the signals of the selected DRIFTS peak areas are represented individually. Soil weathering proxies and clay content were not tested since only one value per soil age and depth was available (n=10). SOM decomposition proxies and peak areas were tested by a two-way ANOVA (n=30) with Tukey's HSD as the post hoc test (p<0.05): * shows significant trends, significant trends for C : N and δ15N but not for δ13C, and significant trends for C : N and δ13C but not for δ15N. The outcomes of the ANOVA are visualized in Figs. 3 and 4 and the values of soil geochemistry in Table 2.
4.1 Assessing chemical alteration of soil mineralogy, texture, and SOM composition over time and depth
Older soils are increasingly weathered, and soil fertility decreases, as indicated by the lower soil pH and CEC (see Table 2). Further, the increasing dominance of Si with ongoing mineral weathering indicates increasing amounts of low reactive clay-sized silicates, i.e. kaolinite, which offer fewer binding sites to SOM (White et al., 2005). At the same time, significantly lower total C in strongly weathered soils were accompanied by an increasing trend of pedogenic iron oxides, i.e. FeDCB, that likely contributed to the unaltered base saturation values. Similar effects were observed in previous soil chronosequence studies, highlighting the importance of iron-bearing mineral phases for SOM stabilization in strongly weathered soils (Chorover et al., 2004; Mikutta et al., 2009). In this study, the increasing trends in pedogenic iron oxides co-varied with proxies that indicate increasingly stabilized and microbially transformed SOM (decreasing C : N ratio, increasing δ13C and δ15N values) and a shift towards a C-limited soil environment (Coyle et al., 2009; Cotrufo et al., 2021). The stronger microbial-derived origin of SOM is reflected in the increasing δ13C and δ15N values that develop due to isotopic discrimination of microorganisms against heavier 13C and 15N (Dijkstra et al., 2006, 2008; Brunn et al., 2016; Kramer et al., 2017).
Soil fertility and SOM stabilization capacity of soils decreased along the chronosequence, thus leading to lower total C stocks on old terraces and stronger signs of microbially transformed SOM following reduced C input (Doetterl et al., 2018). Additionally, we observed significant changes in the peak areas of different functional groups of different origins and complexity regarding their chemical structures. While peak areas of simple plant-derived OM (S-POM) were less affected over time but significantly decreased with depth, peak areas of microbial-derived (MOM) and complex plant-derived OM (C-POM) significantly increased over time and with depth (see Fig. 4). We related S-POM to aliphatic compounds from litter and/or root exudates, C-POM compounds to aromatic structures of aboveground woody debris and/or aromatic root constituents, and MOM to long-chained lipids of predominantly microbial origin (see Table 1).
Throughout the quaternary period, the climate and vegetation undoubtedly varied. Nevertheless, we found that S-POM did not decrease along the chronosequence, thus indicating a steady supply by aboveground (light fraction of litter compounds) and belowground input (low-molecular weight root exudates; Nardi et al., 2005) particularly in the topsoil layer. The significant decreases with depth might be related to a lower stabilization potential of aliphatic organic acids with increasing soil depth (Vranova et al., 2013). Yet, it is noteworthy that below the main rooting zone (>16 cm depth) increases in aliphatic compounds have been observed in similar grassland soils which was explained by increasing stabilization on mineral surfaces (Feng et al., 2007). The latter is further supported by the high affinity of S-POM, in particular citrate and oxalate, to bind with Fe and Al oxides (FeDCB tended to increase with soil age) in acidic soils (Clarholm et al., 2015). The significant increase in MOM peak areas in parallel to the constant S-POM peak areas along the chronosequence could indicate that an increasing fraction of microbially processed and transformed OM gains importance in bulk SOM with soil age (Feng et al., 2007). Previous studies showed a strong correlation between the MOM peak area and organo-mineral associations (Kaiser et al., 2007; Demyan et al., 2012; Kaiser et al., 2012). Thus, the observed increases in our study hint towards an increasing importance of OMAs with progressing soil weathering. C-POM signals, interpreted as lignin compounds from woody plant parts, behaved similarly to MOM and significantly increased with soil age and depth. In grassland soils, increases in signals related to lignin compounds with depth were explained by the increasing dominance of root-derived OM input in subsoils (Feng et al., 2007). Yet, increases in lignin compounds were also observed following a preferential association with iron oxides which is supported by the increase in pedogenic FeDCB with soil age (Hall et al., 2016; Zhao et al., 2016), as well as kaolinite which is supported by the increasing clay contents in our samples with soil depth (Li et al., 2019).
4.2 Mineralogical control of SOM dynamics over geological time
As indicated above, the changes in the degree of decomposition (as indicated by the C : N ratio, δ13C, and δ15N) and SOM composition (peak areas of S-POM, MOM, and C-POM) must be contemplated in the light of simultaneously occurring changes in the mineral matrix along the chronosequence. Therefore, here we discuss to which extent the relationship between soil mineralogy, texture, and SOM (de-)composition is reflected in linear models and how these findings can be embedded in our current understanding of SOM dynamics.
The properties related to SOM decomposition showed differences in the model fit (see Table 3). The C : N ratio showed the lowest model fit of all SOM composition properties. Low and variable R2 values highlighted that the mineral matrix did not strongly affect the C : N ratio of bulk SOM even though SOM was progressively decomposed with increasing soil age. The only variable that contributed significantly to the explanation of the C : N ratio was the Fetotal : Sitotal ratio. The decreasing trend of the Fetotal : Sitotal ratio with soil age indicated that during soil weathering processes, low reactive silicates, i.e. quartz or 1:1 layer type of clay minerals (kaolinite), abound (White et al., 2005). The second most important predictor variable, FeDCB, reflects an increasing importance of pedogenic iron oxides in SOM stabilization as these compounds retain very high reactive surface areas (Kleber et al., 2021). Our findings show that the properties of the mineral matrix play a subordinate role in shaping the C : N ratio which is more strongly driven by the increasing microbial origin of the SOM (Sollins et al., 2009).
In contrast to the C : N ratio, linear models with δ13C and δ15N values as response variables showed a good model fit (R2>0.60, Table 3). The δ13C values were strongly related to FeDCB, Fetotal : Sitotal, and clay, while δ15N values were explained by clay, Fetotal : Sitotal, and AlDCB (although not significantly). In both cases, the high importance of clay content as predictor supports empirical findings that SOM with a higher share of microbial-derived OM (high δ15N; high MOM signal) and increasingly decomposed OM (low C : N ratio; high δ15N, less negative δ13C) is predominantly found within the heavy (clay) fraction of soils (Conen et al., 2008; Sollins et al., 2009; Clemente et al., 2011; Lawrence et al., 2015). It has been previously demonstrated that SOM bound to iron oxides was enriched in δ13C and exhibited more MOM (Zhao et al., 2016). Likely the imprint of δ13C enrichment with increasing microbial transformation of the SOM manifested itself more clearly in bulk SOM as the overall C stocks decreased in the oldest soils (Yang et al., 2015).
Similar to the models explaining SOM decomposition variables, the linear models on DRIFTS peak areas had varying model fits (see Table 3). The model for S-POM had a lower model fit (R2=0.39) compared to the models explaining C-POM and MOM (R2=0.78 and 0.57, respectively). In all models, the clay content was the key explanatory variable which hints at different behaviours in top- and subsoils as consistently higher shares of clay were found at the 10–30 cm depth (see Table 2). The fact that S-POM was not significantly influenced by the Fetotal : Sitotal ratio suggests that the contribution of S-POM to OM is less related to weathering-induced changes in the mineral matrix but is rather determined by above- and belowground vegetation input, i.e. through litter components or root exudates (Vranova et al., 2013; Mueller et al., 2013). Lower signals of S-POM in subsoils compared to topsoils (see Fig. 4) indicate that the mineral stabilization of S-POM compounds in subsoils is lower or that S-POM compounds are less abundant at these depths (Vranova et al., 2013). Still, the higher variable importance of AlDCB and FeDCB to explain S-POM potentially indicates that certain compounds, likely aliphatic organic acids derived from root exudates, are preferentially attached to minerals (Clarholm et al., 2015).
In the case of C-POM, the decreasing Fetotal : Sitotal ratio with increasing soil age had the highest variable importance coefficient but was not significant to the model. The high variable importance coefficient is in line with other studies that found functional groups that are considered chemically more complex (i.e. through an aromatic ring structure) to be increasingly stabilized relative to other functional groups as soils become more weathered, as overall SOM stocks deplete, and as protection through reactive mineral surfaces declines in strongly weathered soils (Angst et al., 2018). Lignin compounds represented by C-POM were shown to be better stabilized due to attachment on mineral surfaces, such as calcite (Grünewald et al., 2006), kaolinite (Li et al., 2019), and Fe oxides (Kramer et al., 2012; Hall et al., 2016; Zhao et al., 2016; Huang et al., 2019). Yet, the coefficients of variable importance of the C-POM model did not show a particular importance of FeDCB and AlDCB (see Table 3). Potentially the more linear decrease in the Fetotal : Sitotal ratio might mask less consistent increases in FeDCB or the varying behaviour of AlDCB (see Table 2). Clay content was the only significant predictor, and it was previously shown that kaolinite accumulates in the mineral matrix with increasing soil age and depth along the present chronosequence (White et al., 2005). Hence, the mineral stabilization of C-POM in heavy soil fractions might be more strongly linked to the presence of clay minerals than iron oxides (Li et al., 2019; Grünewald et al., 2006).
The peak areas related to MOM were significantly explained by the clay content (see Table 3). This is consistent with the significant model parameters for S-POM and C-POM. The clay fraction is known to harbour the vast majority of soil microorganisms and to stimulate their activity (i.e. Stotzky and Rem, 1966; Sollins et al., 2009). Therefore, it is logical that the increasingly microbial-derived imprint in the bulk SOM is significantly linked to the clay fraction. Further, the FeDCB parameter had a higher variable importance coefficient which might be linked to the increasing importance of pedogenic iron oxides and MOM along the soil chronosequence. This might be caused by the increasing importance of metal surfaces in stabilizing bulk SOM but also soil microorganisms or microbial necromass in particular (Kaiser et al., 1997, Zhao et al., 2016). Yet, these interpretations are more speculative due to the heterogeneity of soil microorganisms, and the vast range of possible interactions requires further investigation.
The present observational study provides new information on qualitative changes in the SOM composition in relation to soil geochemical dynamics driven by mineral weathering from a soil chronosequence covering a gradient of 3 million years. With progressing soil development SOM stocks decreased, and we observed an increasingly microbially transformed bulk SOM (lower C : N ratio, higher δ13C and δ15N values). Simultaneously, the spectroscopic fingerprint of SOM (reflected in the peak areas related to S-POM, C-POM, and MOM) shifted as peak areas of structurally more complex compounds increased (C-POM and MOM). These qualitative changes in SOM composition co-occurred with changes in soil geochemistry and texture induced by soil formation. Hence, changes in soil texture (clay content) and an increasingly kaolinite- and iron-oxide-rich, strongly weathered mineral matrix might discriminate in favour of structurally more complex SOM compounds (C-POM and MOM). Our study shows that soil mineralogy plays an important role in shaping SOM composition during soil weathering across large timescales. We therefore recommend further studies to assess this link in contrasting soil mineralogies or vegetation types in order to gain a better understanding of how mineral matrix and C input affect SOM composition across larger geographical areas.
The code used for the statistical analysis is available on Zenodo (https://doi.org/10.5281/zenodo.6366361, Mainka, 2022).
The dataset and the data description files underlying the statistical analysis can be accessed on Zenodo (https://doi.org/10.5281/zenodo.6366361, Mainka, 2022).
AAB and SD designed the experiments. MM performed the measurements, analysed the data, and wrote the manuscript. DW, GG, MG, and LS reviewed and edited the manuscript. LS created the map (Fig. 1). All authors contributed to writing the paper (lead author: MM).
The contact author has declared that neither they nor their co-authors have any competing interests.
Publisher’s note: Copernicus Publications remains neutral with regard to jurisdictional claims in published maps and institutional affiliations.
We thank the working group of Asmeret A. Berhe for logistic help and support in the laboratory.
This research has been supported by the Bayerisch-Kalifornischen Hochschulzentrum (Projekt 22 (grant no. 2016-1)).
This paper was edited by Sara Vicca and reviewed by Jeroen Meersmans and Xavier Dupla.
Angst, G., Nierop, K. G. J., Angst, Š., and Frouz, J.: Abundance of lipids in differently sized aggregates depends on their chemical composition, Biogeochemistry, 140, 111–125, https://doi.org/10.1007/s10533-018-0481-7, 2018.
Araya, S. N., Meding, M., and Berhe, A. A.: Thermal alteration of soil physico-chemical properties: a systematic study to infer response of Sierra Nevada climosequence soils to forest fires, SOIL, 2, 351–366, https://doi.org/10.5194/soil-2-351-2016, 2016.
Austin, A. T. and Vitousek, P. M.: Nutrient dynamics on a precipitation gradient in Hawai'i, Oecologia, 113, 519–529, https://doi.org/10.1007/s004420050405, 1998.
Bailey, V. L., Hicks Pries, C., and Lajtha, K.: What do we know about soil carbon destabilization?, Environ. Res. Lett., 14, 083004, https://doi.org/10.1088/1748-9326/ab2c11, 2019.
Baldock, J. A., Creamer, C., Szarvas, S., McGowan, J., Carter, T., and Farrell, M.: Linking decomposition rates of soil organic amendments to their chemical composition, Soil Res., 59, 630–643, https://doi.org/10.1071/SR20269, 2021.
Barré, P., Durand, H., Chenu, C., Meunier, P., Montagne, D., Castel, G., Billiou, D., Soucémarianadin, L., and Cécillon, L.: Geological control of soil organic carbon and nitrogen stocks at the landscape scale, Geoderma, 285, 50–56, https://doi.org/10.1016/j.geoderma.2016.09.029, 2017.
Benner, R., Fogel, M. L., Sprague, E. K., and Hodson, R. E.: Depletion of C in lignin and its implications for stable carbon isotope studies, Nature, 329, 708–710, https://doi.org/10.1038/329708a0, 1987.
Beuselinck, L., Govers, G., Poesen, J., Degraer, G., and Froyen, L.: Grain-size analysis by laser diffractometry: Comparison with the sieve-pipette method, CATENA, 32, 193–208, https://doi.org/10.1016/S0341-8162(98)00051-4, 1998.
Bradford, M. A., Wieder, W. R., Bonan, G. B., Fierer, N., Raymond, P. A., and Crowther, T. W.: Managing uncertainty in soil carbon feedbacks to climate change, Nat. Clim. Change, 6, 751–758, https://doi.org/10.1038/nclimate3071, 2016.
Bring, J.: A geometric approach to compare variables in a regression model, Am. Stat., 50, 57–62, 1996.
Brunn, M., Condron, L., Wells, A., Spielvogel, S., and Oelmann, Y.: Vertical distribution of carbon and nitrogen stable isotope ratios in topsoils across a temperate rainforest dune chronosequence in New Zealand, Biogeochemistry, 129, 37–51, https://doi.org/10.1007/s10533-016-0218-4, 2016.
Calderón, F. J., Reeves, J. B., Collins, H. P., and Paul, E. A.: Chemical Differences in Soil Organic Matter Fractions Determined by Diffuse-Reflectance Mid-Infrared Spectroscopy, Soil Sci. Soc. Am. J., 75, 568–579, https://doi.org/10.2136/sssaj2009.0375, 2011.
Chao, T. T. and Sanzolone, R. F.: Decomposition techniques, J. Geochem. Explor., 44, 65–106, https://doi.org/10.1016/0375-6742(92)90048-D, 1992.
Chorover, J., Amistadi, M. K., and Chadwick, O. A.: Surface charge evolution of mineral-organic complexes during pedogenesis in Hawaiian basalt, Geochim. Cosmochim. Ac., 68, 4859–4876, https://doi.org/10.1016/j.gca.2004.06.005, 2004.
Clarholm, M., Skyllberg, U., and Rosling, A.: Organic acid induced release of nutrients from metal-stabilized soil organic matter – The unbutton model, Soil Biol. Biochem., 84, 168–176, https://doi.org/10.1016/j.soilbio.2015.02.019, 2015.
Clemente, J. S., Simpson, A. J., and Simpson, M. J.: Association of specific organic matter compounds in size fractions of soils under different environmental controls, Org. Geochem., 42, 1169–1180, https://doi.org/10.1016/j.orggeochem.2011.08.010, 2011.
Conen, F., Zimmermann, M., Leifeld, J., Seth, B., and Alewell, C.: Relative stability of soil carbon revealed by shifts in δ15N and C : N ratio, Biogeosciences, 5, 123–128, https://doi.org/10.5194/bg-5-123-2008, 2008.
Cotrufo, M. F., Wallenstein, M. D., Boot, C. M., Denef, K., and Paul, E.: The Microbial Efficiency-Matrix Stabilization (MEMS) framework integrates plant litter decomposition with soil organic matter stabilization: Do labile plant inputs form stable soil organic matter?, Glob. Change Biol., 19, 988–995, https://doi.org/10.1111/gcb.12113, 2013.
Cotrufo, M. F., Soong, J. L., Horton, A. J., Campbell, E. E., Haddix, M. L., Wall, D. H., and Parton, W. J.: Formation of soil organic matter via biochemical and physical pathways of litter mass loss, Nat. Geosci., 8, 776–779, https://doi.org/10.1038/ngeo2520, 2015.
Cotrufo, M. F., Lavallee, J. M., Zhang, Y., Hansen, P. M., Paustian, K. H., Schipanski, M., and Wallenstein, M. D.: In-N-Out: A hierarchical framework to understand and predict soil carbon storage and nitrogen recycling, Glob. Change Biol., 27, 4465–4468, https://doi.org/10.1111/gcb.15782, 2021.
Coyle, J. S., Dijkstra, P., Doucett, R. R., Schwartz, E., Hart, S. C., and Hungate, B. A.: Relationships between C and N availability, substrate age, and natural abundance 13C and 15N signatures of soil microbial biomass in a semiarid climate, Soil Biol. Biochem., 41, 1605–1611, https://doi.org/10.1016/j.soilbio.2009.04.022, 2009.
Demyan, M. S., Rasche, F., Schulz, E., Breulmann, M., Müller, T., and Cadisch, G.: Use of specific peaks obtained by diffuse reflectance Fourier transform mid-infrared spectroscopy to study the composition of organic matter in a Haplic Chernozem, Eur. J. Soil Sci., 63, 189–199, https://doi.org/10.1111/j.1365-2389.2011.01420.x, 2012.
Dijkstra, P., Ishizu, A., Doucett, R., Hart, S. C., Schwartz, E., Menyailo, O. V., and Hungate, B. A.: 13C and 15N natural abundance of the soil microbial biomass, Soil Biol. Biochem., 38, 3257–3266, https://doi.org/10.1016/j.soilbio.2006.04.005, 2006.
Doetterl, S., Berhe, A. A., Arnold, C., Bodé, S., Fiener, P., Finke, P., Fuchslueger, L., Griepentrog, M., Harden, J. W., Nadeu, E., Schnecker, J., Six, J., Trumbore, S., Van Oost, K., Vogel, C., and Boeckx, P.: Links among warming, carbon and microbial dynamics mediated by soil mineral weathering, Nat. Geosci., 11, 589–593, https://doi.org/10.1038/s41561-018-0168-7, 2018.
Ellerbrock, R. H. and Gerke, H. H.: Characterizing organic matter of soil aggregate coatings and biopores by Fourier transform infrared spectroscopy, Eur. J. Soil Sci., 55, 219–228, https://doi.org/10.1046/j.1365-2389.2004.00593.x, 2004.
Feng, X. and Simpson, M. J.: The distribution and degradation of biomarkers in Alberta grassland soil profiles, Org. Geochem., 38, 1558–1570, https://doi.org/10.1016/j.orggeochem.2007.05.001, 2007.
Fissore, C., Dalzell, B. J., Berhe, A. A., Voegtle, M., Evans, M., and Wu, A.: Influence of topography on soil organic carbon dynamics in a Southern California grassland, CATENA, 149, 140–149, https://doi.org/10.1016/j.catena.2016.09.016, 2017.
Fox, J. and Monette, G.: Generalized collinearity diagnostics, J. Am. Stat. Assoc., 87, 178–183, https://doi.org/10.1080/01621459.1992.10475190, 1992.
Fox, J. and Weisberg, S.: An R Companion to Applied Regression, 3rd Edn., SAGE, Thousand Oaks, ISBN 9781544336473, 2019.
Grömping, U.: Variable importance in regression models, WIREs Comput. Stat., 7, 137–152, https://doi.org/10.1002/wics.1346, 2015.
Grünewald, G., Kaiser, K., Jahn, R., and Guggenberger, G.: Organic matter stabilization in young calcareous soils as revealed by density fractionation and analysis of lignin-derived constituents, Org. Geochem., 37, 1573–1589, https://doi.org/10.1016/j.orggeochem.2006.05.002, 2006.
Hall, S. J., Silver, W. L., Timokhin, V. I., and Hammel, K. E.: Iron addition to soil specifically stabilized lignin, Soil Biol. Biochem., 98, 95–98, https://doi.org/10.1016/j.soilbio.2016.04.010, 2016.
Hall, S. J., Berhe, A. A., and Thompson, A.: Order from disorder: do soil organic matter composition and turnover co-vary with iron phase crystallinity?, Biogeochemistry, 140, 93–110, https://doi.org/10.1007/s10533-018-0476-4, 2018.
Hall, S. J., Ye, C., Weintraub, S. R., and Hockaday, W. C.: Molecular trade-offs in soil organic carbon composition at continental scale, Nat. Geosci., 13, 687–692, https://doi.org/10.1038/s41561-020-0634-x, 2020.
Harden, J. W.: Soils Developed in Granitic Alluvium near Merced, California, U.S. Geological Survey, Denver, United States Government Printing Office, https://doi.org/10.3133/b1590A, 1987.
Huang, W., Hammel, K. E., Hao, J., Thompson, A., Timokhin, V. I., and Hall, S. J.: Enrichment of lignin-derived carbon in mineral-associated soil organic matter, Environ. Sci. Technol., 53, 7522–7531, https://doi.org/10.1021/acs.est.9b01834, 2019.
James, G., Witten, D., Hastie, T., and Tibshirani, R.: An introduction to statistical learning, Springer, New York, Heidelberg, Dordbrecht, London, ISBN 978-1-4614-7137-0, 2013.
Jobbágy, E. G. and Jackson, R. B.: The vertical distribution of soil organic carbon and its relation to climate and vegetation, Ecol. Appl., 10, 423–436, 2000.
Jones, M. B. and Woodmansee, R. G.: Biogeochemical cycling in annual grassland ecosystems, Bot. Rev., 45, 111–144, https://doi.org/10.1007/BF02860854, 1979.
Kaiser, K., Guggenberger, G., Haumaier, L., and Zech, W.: Dissolved organic matter sorption on subsoils and minerals studied by 13C-NMR and DRIFT spectroscopy, Eur. J. Soil Sci., 48, 301–310, https://doi.org/10.1111/j.1365-2389.1997.tb00550.x, 1997.
Kaiser, M., Ellerbrock, R. H., and Gerke, H. H.: Long-term effects of crop rotation and fertilization on soil organic matter composition, Eur. J. Soil Sci., 58, 1460–1470, https://doi.org/10.1111/j.1365-2389.2007.00950.x, 2007.
Kaiser, M., Ellerbrock, R. H., Wulf, M., Dultz, S., Hierath, C., and Sommer, M.: The influence of mineral characteristics on organic matter content, composition, and stability of topsoils under long-term arable and forest land use, J. Geophys. Res.-Biogeo., 117, 1–16, https://doi.org/10.1029/2011JG001712, 2012.
Khedim, N., Cécillon, L., Poulenard, J., Barré, P., Baudin, F., Marta, S., Rabatel, A., Dentant, C., Cauvy-Fraunié, S., Anthelme, F., Gielly, L., Ambrosini, R., Franzetti, A., Azzoni, R. S., Caccianiga, M. S., Compostella, C., Clague, J., Tielidze, L., Messager, E., Choler, P., and Ficetola, G. F.: Topsoil organic matter build-up in glacier forelands around the world, Glob. Change Biol., 27, 1662–1677, https://doi.org/10.1111/gcb.15496, 2021.
Kleber, M., Nico, P. S., Plante, A., Filley, T., Kramer, M., Swanston, C., and Sollins, P.: Old and stable soil organic matter is not necessarily chemically recalcitrant: Implications for modeling concepts and temperature sensitivity, Glob. Change Biol., 17, 1097–1107, https://doi.org/10.1111/j.1365-2486.2010.02278.x, 2011.
Kleber, M., Bourg, I. C., Coward, E. K., Hansel, C. M., Myneni, S. C. B., and Nunan, N.: Dynamic interactions at the mineral–organic matter interface, Nat. Rev. Earth Environ., 2, 402–421, https://doi.org/10.1038/s43017-021-00162-y, 2021.
Kögel-Knaber, I. and Amelung, W. : Dynamics, Chemistry, and Preservation of Organic Matter in Soils, in: Treatise on Geochemistry, edited by: Holland, H. D. and Turekian, K. K., Elsevier, Oxford, 157–215, ISBN 9780080959757, 2014.
Kögel-Knabner, I. and Amelung, W.: Soil organic matter in major pedogenic soil groups, Geoderma, 384, 114785, https://doi.org/10.1016/j.geoderma.2020.114785, 2021.
Kramer, M. G., Sanderman, J., Chadwick, O. A., Chorover, J., and Vitousek, P. M.: Long-term carbon storage through retention of dissolved aromatic acids by reactive particles in soil, Glob. Change Biol., 18, 2594–2605, https://doi.org/10.1111/j.1365-2486.2012.02681.x, 2012.
Kramer, M. G., Lajtha, K., and Aufdenkampe, A. K.: Depth trends of soil organic matter C : N and 15N natural abundance controlled by association with minerals, Biogeochemistry, 136, 237–248, https://doi.org/10.1007/s10533-017-0378-x, 2017.
Kuhn, M.: caret: Classification and Regression Training, https://cran.r-project.org/package=caret (last access: 17 March 2022), 2020.
Lal, R.: Soil carbon stocks under present and future climate with specific reference to European ecoregions, Nutr. Cycl. Agroecosyst., 81, 113–127, https://doi.org/10.1007/s10705-007-9147-x, 2008.
Laub, M., Demyan, M. S., Nkwain, Y. F., Blagodatsky, S., Kätterer, T., Piepho, H.-P., and Cadisch, G.: DRIFTS band areas as measured pool size proxy to reduce parameter uncertainty in soil organic matter models, Biogeosciences, 17, 1393–1413, https://doi.org/10.5194/bg-17-1393-2020, 2020.
Lavallee, J. M., Soong, J. L., and Cotrufo, M. F.: Conceptualizing soil organic matter into particulate and mineral-associated forms to address global change in the 21st century, Glob. Change Biol., 26, 261–273, https://doi.org/10.1111/gcb.14859, 2020.
Lawrence, C. R., Harden, J. W., Xu, X., Schulz, M. S., and Trumbore, S. E.: Long-term controls on soil organic carbon with depth and time: A case study from the Cowlitz River Chronosequence, WA USA, Geoderma, 247/248, 73–87, https://doi.org/10.1016/j.geoderma.2015.02.005, 2015.
Lehmann, J. and Kleber, M.: The contentious nature of soil organic matter, Nature, 528, 60–68, https://doi.org/10.1038/nature16069, 2015.
Lehner, B., Verdin, K., and Jarvis, A.: New global hydrography derived from spaceborne elevation data, Eos, Transactions, AGU, 89, 93–94, https://doi.org/10.1029/2008EO100001, 2008.
Li, F., Chang, Z., Khaing, K., Zhou, Y., Zhao, H., Liang, N., Zhou, D., Pan, B., and Steinberg, C. E. W.: Organic matter protection by kaolinite over bio-decomposition as suggested by lignin and solvent-extractable lipid molecular markers, Sci. Total Environ., 647, 570–576, https://doi.org/10.1016/j.scitotenv.2018.07.456, 2019.
Mainka, M.: Mainka et al. 2022, Biogeosciences, Data and Codes, Zenodo [data set and code], https://doi.org/10.5281/zenodo.6366361, 2022.
Margenot, A. J., Calderón, F. J., Bowles, T. M., Parikh, S. J., and Jackson, L. E.: Soil organic matter functional group composition in relation to organic carbon, nitrogen, and phosphorus fractions in organically managed tomato fields, Soil Sci. Soc. Am. J., 79, 772–782, https://doi.org/10.2136/sssaj2015.02.0070, 2015.
Margenot, A. J., Calderón, F. J., Goyne, K. W., Mukome, F. N. D., and Parikh, S. J.: IR Spectroscopy, Soil Analysis Applications, Encycl. Spectrosc. Spectrom., 2, 448–454, https://doi.org/10.1016/B978-0-12-409547-2.12170-5, 2017.
Mehra, O. P. and Jackson, M. L.: Iron Oxide Removal from Soils and Clays by a Dithionite-Citrate System Buffered with Sodium Bicarbonate, Clays Clay Miner., 7, 317–327, https://doi.org/10.1346/CCMN.1958.0070122, 1958.
Mikutta, R., Kleber, M., Torn, M. S., and Jahn, R.: Stabilization of soil organic matter: Association with minerals or chemical recalcitrance?, Biogeochemistry, 77, 25–56, https://doi.org/10.1007/s10533-005-0712-6, 2006.
Mikutta, R., Schaumann, G. E., Gildemeister, D., Bonneville, S., Kramer, M. G., Chorover, J., Chadwick, O. A., and Guggenberger, G.: Biogeochemistry of mineral-organic associations across a long-term mineralogical soil gradient (0.3–4100 kyr), Hawaiian Islands, Geochim. Cosmochim. Ac., 73, 2034–2060, https://doi.org/10.1016/j.gca.2008.12.028, 2009.
Miller, B. A. and Schaetzl, R. J.: Precision of Soil Particle Size Analysis using Laser Diffractometry, Soil Sci. Soc. Am. J., 76, 1719–1727, https://doi.org/10.2136/sssaj2011.0303, 2012.
Mueller, K. E., Eissenstat, D. M., Müller, C. W., Oleksyn, J., Reich, P. B., and Freeman, K. H.: What controls the concentration of various aliphatic lipids in soil?, Soil Biol. Biochem., 63, 14–17, https://doi.org/10.1016/j.soilbio.2013.03.021, 2013.
Nardi, S., Tosoni, M., Pizzeghello, D., Provenzano, M. R., Cilenti, A., Sturaro, A., Rella, R., and Vianello, A.: Chemical Characteristics and Biological Activity of Organic Substances Extracted from Soils by Root Exudates, Soil Sci. Soc. Am. J., 69, 2012–2019, https://doi.org/10.2136/sssaj2004.0401, 2005.
Nunan, N., Lerch, T. Z., Pouteau, V., Mora, P., Changey, F., Kätterer, T., Giusti-Miller, S., and Herrmann, A. M.: Metabolising old soil carbon: Simply a matter of simple organic matter?, Soil Biol. Biochem., 88, 128–136, https://doi.org/10.1016/j.soilbio.2015.05.018, 2015.
Parikh, S. J., Goyne, K. W., Margenot, A. J., Mukome, F. N. D., and Calderón, F. J.: Soil chemical insights provided through vibrational spectroscopy, 126, 1–148, https://doi.org/10.1016/B978-0-12-800132-5.00001-8, 2014.
Paul, E. A.: The nature and dynamics of soil organic matter: Plant inputs, microbial transformations, and organic matter stabilization, Soil Biol. Biochem., 98, 109–126, https://doi.org/10.1016/j.soilbio.2016.04.001, 2016.
R Core Team: R: A language and environment for statistical computing, https://www.r-project.org/ (last access: 17 March 2022), 2020.
Reheis, M. C., Bright, J., Lund, S. P., Miller, D. M., Skipp, G., and Fleck, R. J.: A half-million-year record of paleoclimate from the Lake Manix Core, Mojave Desert, California, Palaeogeogr. Palaeocl., 365/366, 11–37, https://doi.org/10.1016/j.palaeo.2012.09.002, 2012.
Ryals, R., Kaiser, M., Torn, M. S., Berhe, A. A., and Silver, W. L.: Impacts of organic matter amendments on carbon and nitrogen dynamics in grassland soils, Soil Biol. Biochem., 68, 52–61, https://doi.org/10.1016/j.soilbio.2013.09.011, 2014.
Schmidt, M. W. I., Torn, M. S., Abiven, S., Dittmar, T., Guggenberger, G., Janssens, I. A., Kleber, M., Kögel-Knabner, I., Lehmann, J., Manning, D. A. C., Nannipieri, P., Rasse, D. P., Weiner, S., and Trumbore, S. E.: Persistence of soil organic matter as an ecosystem property, Nature, 478, 49–56, https://doi.org/10.1038/nature10386, 2011.
Six, J., Paustian, K., Elliott, E. T., and Combrink, C.: Soil Structure and Organic Matter I. Distribution of Aggregate-Size Classes and Aggregate-Associated Carbon, Soil Sci. Soc. Am. J., 64, 681–689, https://doi.org/10.2136/sssaj2000.642681x, 2000.
Sollins, P., Kramer, M. G., Swanston, C., Lajtha, K., Filley, T., Aufdenkampe, A. K., Wagai, R., and Bowden, R. D.: Sequential density fractionation across soils of contrasting mineralogy: Evidence for both microbial- and mineral-controlled soil organic matter stabilization, Biogeochemistry, 96, 209–231, https://doi.org/10.1007/s10533-009-9359-z, 2009.
Spielvogel, S., Prietzel, J., and Kögel-Knabner, I.: Soil organic matter stabilization in acidic forest soils is preferential and soil type-specific, Eur. J. Soil Sci., 59, 674–692, https://doi.org/10.1111/j.1365-2389.2008.01030.x, 2008.
Sposito, G., Skipper, N. T., Sutton, R., Park, S. H., Soper, A. K., and Greathouse, J. A.: Surface geochemistry of the clay minerals, P. Natl. Acad. Sci. USA, 96, 3358–3364, https://doi.org/10.1073/pnas.96.7.3358, 1999.
Stotzky, G. and Rem, L. T.: Influence of clay minerals on microorganisms. I. Montmorillonite and kaolinite on bacteria, Can. J. Microbiol., 12, 547–563, https://doi.org/10.1139/m66-078, 1966.
Todd-Brown, K. E. O., Randerson, J. T., Post, W. M., Hoffman, F. M., Tarnocai, C., Schuur, E. A. G., and Allison, S. D.: Causes of variation in soil carbon simulations from CMIP5 Earth system models and comparison with observations, Biogeosciences, 10, 1717–1736, https://doi.org/10.5194/bg-10-1717-2013, 2013.
Viscarra Rossel, R. A., Behrens, T., Ben-Dor, E., Brown, D. J., Demattê, J. A. M., Shepherd, K. D., Shi, Z., Stenberg, B., Stevens, A., Adamchuk, V., Aïchi, H., Barthès, B. G., Bartholomeus, H. M., Bayer, A. D., Bernoux, M., Böttcher, K., Brodský, L., Du, C. W., Chappell, A., Fouad, Y., Genot, V., Gomez, C., Grunwald, S., Gubler, A., Guerrero, C., Hedley, C. B., Knadel, M., Morrás, H. J. M., Nocita, M., Ramirez-Lopez, L., Roudier, P., Campos, E. M. R., Sanborn, P., Sellitto, V. M., Sudduth, K. A., Rawlins, B. G., Walter, C., Winowiecki, L. A., Hong, S. Y., and Ji, W.: A global spectral library to characterize the world's soil, Earth-Sci. Rev., 155, 198–230, https://doi.org/10.1016/j.earscirev.2016.01.012, 2016.
Von Lützow, M., Kögel-Knabner, I., Ludwig, B., Matzner, E., Flessa, H., Ekschmitt, K., Guggenberger, G., Marschner, B., and Kalbitz, K.: Stabilization mechanisms of organic matter in four temperate soils: Development and application of a conceptual model, J. Plant Nutr. Soil Sci., 171, 111–124, https://doi.org/10.1002/jpln.200700047, 2008.
Vranova, V., Rejsek, K., and Formanek, P.: Aliphatic, Cyclic, and Aromatic Organic Acids, Vitamins, and Carbohydrates in Soil: A Review, ScientificWorldJournal, 2013, 524239, https://doi.org/10.1155/2013/524239, 2013.
Wei, Y., Wu, X., Xia, J., Shen, X., and Cai, C.: Variation of Soil Aggregation along the Weathering Gradient: Comparison of Grain Size Distribution under Different Disruptive Forces, PLoS ONE, 11, e0160960, https://doi.org/10.1371/journal.pone.0160960, 2016.
White, A. F., Blum, A. E., Schulz, M. S., Bullen, T. D., Harden, J. W., and Peterson, M. L.: Chemical Weathering of a Soil Chronosequence on Granite Alluvium I. Reaction Rates Based on Changes in Soil Mineralogy, Geochim. Cosmochim. Ac., 60, 2533–2550, 1996.
White, A. F., Schulz, M. S., Vivit, D. V., Blum, A. E., Stonestrom, D. A., and Harden, J. W.: Chemical weathering rates of a soil chronosequence on granitic alluvium: III. Hydrochemical evolution and contemporary solute fluxes and rates, Geochim. Cosmochim. Ac., 69, 1975–1996, https://doi.org/10.1016/j.gca.2004.10.003, 2005.
Xu, Y., He, J., Cheng, W., Xing, X., and Li, L.: Natural 15N abundance in soils and plants in relation to N cycling in a rangeland in Inner Mongolia, J. Plant Ecol., 3, 201–207, https://doi.org/10.1093/jpe/rtq023, 2010.
Yang, Y., Ji, C., Chen, L., Ding, J., Cheng, X., and Robinson, D.: Edaphic rather than climatic controls over 13C enrichment between soil and vegetation in alpine grasslands on the Tibetan Plateau, Funct. Ecol., 29, 839–848, https://doi.org/10.1111/1365-2435.12393, 2015.
Zhao, Q., Poulson, S. R., Obrist, D., Sumaila, S., Dynes, J. J., McBeth, J. M., and Yang, Y.: Iron-bound organic carbon in forest soils: quantification and characterization, Biogeosciences, 13, 4777–4788, https://doi.org/10.5194/bg-13-4777-2016, 2016.