the Creative Commons Attribution 4.0 License.
the Creative Commons Attribution 4.0 License.
 | 14 Jun 2022
Causes of the extensive hypoxia in the Gulf of Riga in 2018
Stella-Theresa Stoicescu
Jaan Laanemets
Taavi Liblik
Māris Skudra
Oliver Samlas
Inga Lips
Urmas Lips
The Gulf of Riga is a relatively shallow bay connected to the deeper central Baltic Sea (Baltic Proper) via straits with sills. The decrease in the near-bottom oxygen levels from spring to autumn is a common feature in the gulf, but in 2018, extensive hypoxia was observed. We analyzed temperature, salinity, oxygen, and nutrient data collected in 2018, along with historical data available from environmental databases. Meteorological and hydrological data from the study year were compared with their long-term means and variability. We suggest that pronounced oxygen depletion occurred in 2018 due to a distinct development of vertical stratification. Seasonal stratification developed early and was stronger in spring–summer 2018 than on average due to high heat flux and weak winds. Dominating northeasterly winds in early spring and summer supported the inflow of saltier waters from the Baltic Proper that created an additional deep pycnocline restricting vertical transport between the near-bottom layer (NBL) and the water column above. The estimated oxygen consumption rate in the NBL in spring–summer 2018 was about 1.7 , which exceeded the oxygen input to the NBL due to advection and vertical mixing. Such a consumption rate leads to near-bottom hypoxia in all years when vertical mixing in autumn reaches the seabed later than on average according to the long-term (1979–2018) meteorological conditions. The observed increase in phosphate concentrations in the NBL in summer 2018 suggests a significant sediment phosphorus release in hypoxic conditions counteracting the mitigation measures to combat eutrophication. Since climate change projections predict that meteorological conditions comparable to those in 2018 will occur more frequently, extensive hypoxia would be more common in the Gulf of Riga and other coastal basins with similar morphology and human-induced elevated input of nutrients.
- Article
(9404 KB) - Full-text XML
- BibTeX
- EndNote


Coastal dead zones have expanded in the oceans since the 1960s, a phenomenon which is mostly caused by increased primary production as a result of eutrophication (Diaz and Rosenberg, 2008). Geographic settings such as openness of the basin and hydrographic conditions such as the strength and onset of stratification affect the magnitude of near-bottom hypoxia (Codiga et al., 2009; Liblik et al., 2020; Murphy et al., 2011; Ukrainskii and Popov, 2009; Zhang et al., 2010). Current and projected climate changes continue to affect the marine environment; e.g., increased temperature and strengthening of stratification in estuaries cause decreases in oxygen solubility and vertical mixing, respectively, which could lead to enhanced oxygen depletion of bottom waters (Bindoff et al., 2019).
The Baltic Sea is strongly influenced by eutrophication and changing climate conditions (Conley et al., 2009; Gustafsson et al., 2012; Kabel et al., 2012). The primary drivers behind eutrophication are excessive amounts of nutrients that enter the marine environment through rivers and the atmosphere (HELCOM, 2018b; Reusch et al., 2018). Hypoxic conditions have been found throughout the Baltic Sea as quasi-permanent, seasonal, or exceptional infrequent phenomena (Carstensen and Conley, 2019; Conley et al., 2007, 2011; Karlson et al., 2002). Hypoxia and anoxia have occurred in open water areas of the Baltic Proper below the halocline (∼ 70–80 m) on an almost permanent basis since the 1950s (HELCOM, 2018c; Karlson et al., 2002). Occasionally, oxygen conditions in this central basin are improved by Major Baltic Inflows (e.g., Matthäus and Franck, 1992; Schinke and Matthäus, 1998; Schmale et al., 2016; Liblik et al., 2018). However, these improved oxygen conditions are short-lived because, in the long-term, the inflows enhance stratification and thereby reduce vertical oxygen transport (Conley et al., 2002).
In the shallower regions, where the halocline is absent, but a seasonal thermocline restricts vertical mixing, oxygen consumption could lead to temporal near-bottom hypoxia and sediment phosphorus release in late summer–autumn (Lukkari et al., 2009; Puttonen et al., 2014, 2016; Walve et al., 2018). For instance, such seasonal hypoxic events have occurred in the northern Baltic coastal areas and Åland archipelago, influenced by large-scale eutrophication driven by nutrients from agriculture and local fish farms (Bonsdorff et al., 1996). Sedimentation of organic matter, stimulated by nutrient inputs, can cause severe oxygen deficiency under specific meteorological and hydrographic conditions, as observed in the southern Baltic in 1994 and 2002 (e.g., Conley et al., 2007; Powilleit and Kube, 1999).
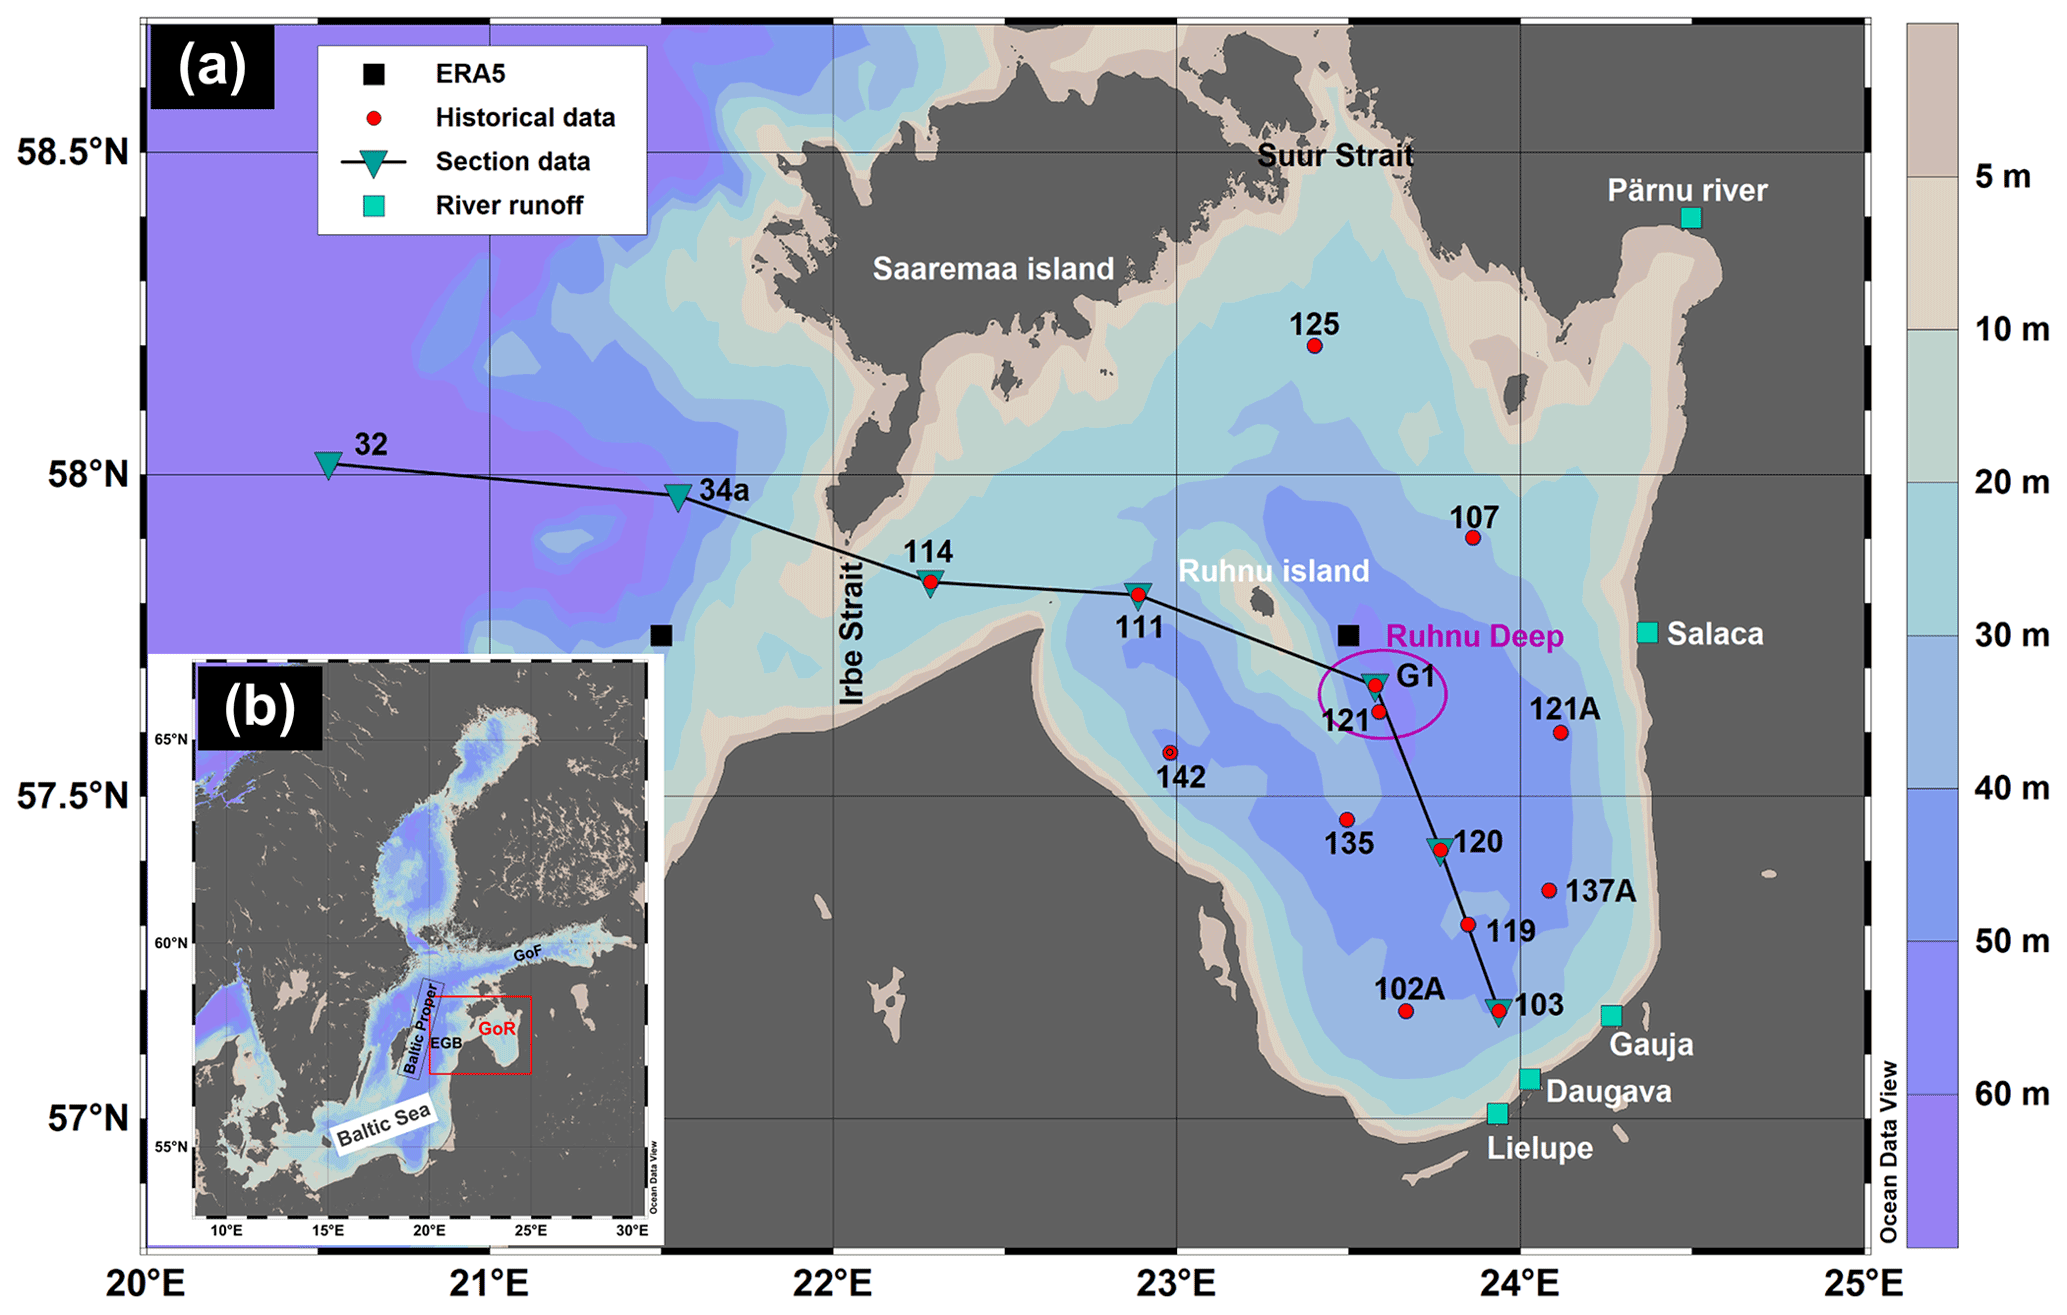
Figure 1(a) – Map of the study area in the Gulf of Riga (GoR) with bottom topography. Red-filled circles represent the locations of monitoring stations. Inverted triangles represent the stations used for section figures. Black-filled squares represent the grid cell center points of ERA5 data (grid cell resolution 0.25∘ × 0.25∘). Green-filled squares denote rivers from which runoff data were used. EGB – Eastern Gotland Basin and GoF – Gulf of Finland. (b) Study area in the Baltic Sea. This map was generated using Ocean Data View 5.2.0 software (Schlitzer, 2019).
One of the shallow areas where seasonal hypoxia can occur is the Gulf of Riga (GoR) in the eastern part of the Baltic Sea (e.g., Berzinsh, 1995, and references therein; Aigars and Carman, 2001; Eglīte et al., 2014; Aigars et al., 2015). The Gulf of Riga is a semi-enclosed basin (Fig. 1) with a surface area of 16 330 km2, a volume of 424 km3, and a mean depth of 26 m (Ojaveer, 1995; HELCOM, 2002). Its deeper central area, situated east of the island of Ruhnu, has depths of up to 56 m (Stiebrins and Väling, 1996). The water and salt budgets of the gulf are governed by river discharge, precipitation–evaporation balance, and water exchange with the Baltic Proper through the connecting straits. The long-term (1950–2015) mean river runoff is about 36 km3 yr−1 (Johansson, 2016), and the average freshwater flux due to the difference between the surface precipitation and evaporation rates is about 2.5 km3 yr−1 (Omstedt et al., 1997). Five larger rivers (Daugava, Lielupe, Gauja, Pärnu, and Salaca) enter the southern and eastern parts of the gulf, with the Daugava River contributing about 70 % of the total riverine input (Yurkovskis et al., 1993). Considering the gulf's annual water volume and salt content balance, Lilover et al. (1998) estimated that its water renewal period would be about 3 years.
GoR water exchange with the Baltic Proper takes place via the Irbe Strait in the west (about 70 %–80 % of water exchange) and the Suur Strait in the north (Astok et al., 1999; Petrov, 1979). The Irbe Strait has a sill depth of 25 m and a cross-section area of 0.4 km2, while these hydrographical features are 5 m and 0.04 km2, respectively, for the Suur Strait. Lips et al. (1995) suggested that the gulf's deep waters could be renewed in summer by inflows of saltier water from the eastern Baltic Proper over the sill in the Irbe Strait – which is deeper and wider – while inflows through the shallow Suur Strait are arrested in the surface layer. The near-bottom inflows through the Irbe Strait are intensified by the northerly and northeasterly winds, which cause upwelling events along the eastern coast of the Baltic Proper. Model simulations by Raudsepp and Elken (1995) also showed that strong northerly wind events could create substantial near-bottom inflows of saltier Baltic Proper waters. However, when downwelling occurs along the eastern coast of the Baltic Proper, the inflowing water is warmer than that of the near-bottom waters in the Gulf of Riga in summer and can spread buoyantly at the intermediate depths (Liblik et al., 2017).
Because of the shallowness of the basin, the entire water column is well mixed in winter. In summer, stratification is mainly maintained by the seasonal thermocline, which begins developing in April and is at its strongest in August, while the contribution of haline stratification is relatively moderate (Stipa et al., 1999; Liblik et al., 2017). Based on conductivity–temperature–depth (CTD) profiles from 1993–2012, Skudra and Lips (2017) revealed that the strongest stratification occurred in the years with the highest summer surface temperature and spring river discharge. A high correlation between the deep layer salinity in the Irbe Strait and the gulf was found by Skudra and Lips (2017), in accordance with the suggestion that the majority of water exchange between the Baltic Proper and the gulf occurs through the Irbe Strait.
Based on data from 1963 to 1990, a statistically significant decreasing trend of oxygen concentration in August was found for the entire 20–50 m layer in the gulf (Berzinsh, 1995). No trend was detected after that (HELCOM, 2009). The latest monitoring data are not analyzed for long-term trends and inter-annual variations in near-bottom oxygen concentrations; rather, model outcomes are used to describe the oxygen conditions (e.g., Jansson et al., 2020). It is well documented, however, that the anoxic and hypoxic areas have been expanding in the entire Baltic Sea in recent decades, due to both eutrophication and changes in climatic conditions (Hansson and Viktorsson, 2020; the analysis also included data from the Gulf of Riga).
Total annual nitrogen and phosphorus loads to the Gulf of Riga were estimated for 2017 at levels of 90 544 and 2 427 t yr−1, respectively, and are still higher than the maximum allowable inputs, according to the Baltic Sea Action Plan (HELCOM, 2022). Based on monitoring data since 1974, the phosphorus pool in the Gulf of Riga constantly increased until the mid-1990s (Yurkovskis, 2004) and was followed by stagnation (HELCOM, 2018a). Since riverine phosphorus input is < 15 % compared to the phosphorus pool in the water column (Yurkovskis, 2004), the changes in the latter are largely governed by internal processes. The phosphate flux from the sediments to the water column depends on the near-bottom oxygen conditions with maximum values at low DO concentrations. For instance, phosphorus release on the order of 100 was simulated at oxygen concentrations of 1–2 mg L−1 (Eglīte et al., 2014). Thus, the reoccurrence of conditions of low near-bottom oxygen supports sediment phosphorus release, which counteracts potential decreases in the external phosphorus load to the gulf.
Data from regular monitoring cruises and targeted surveys revealed extensive near-bottom hypoxia in the Gulf of Riga in summer–autumn 2018. Additionally, the weather conditions were extreme in summer 2018, manifested by a new air temperature maximum in Europe for April–September (Hoy et al., 2020). We have formulated three main questions for this study. Was the observed near-bottom hypoxia in the GoR in 2018 an exceptional event? What were the reasons behind the observed hypoxia? Was it a feature that could occur in the GoR and similar basins regularly and/or even more often in the future? We hypothesize that the earlier onset, strength, and duration of stratification, together with the unusually high winter river runoff, were the main contributors to the extensive near-bottom hypoxia in 2018. If this hypothesis holds, then one may speculate that the future occurrences of such events will likely increase. To test our hypotheses, we analyzed oceanographic and meteorological conditions in 2018 and compared them with the preceding years (2012–2017) and long-term means and variability.
Historical data on the near-bottom temperature, salinity, dissolved oxygen, and nutrient concentrations were downloaded from the Estonian environmental monitoring information system (KESE), Latvian environmental monitoring databases, ICES/HELCOM database, and SeaDataNet Pan-European infrastructure for ocean and marine data management (http://www.seadatanet.org, last access: 9 April 2019). More consistent near-bottom oxygen data were available from 2005; therefore, we limited the analysis to 2005–2018. HELCOM guidelines (HELCOM, 2017) were followed for the sampling and analytical detection of oxygen and nutrient concentrations in the monitoring laboratories.
Vertical profiles of temperature, salinity, and dissolved oxygen with temporal resolution of at least six times a year are available since 2012. The profiles were recorded using an Ocean Seven 320plus CTD probe (Idronaut s.r.l.) on board R/V Salme during Estonian and Latvian monitoring cruises (stations are shown in Fig. 1). The salinity and density anomaly is shown in the present study as absolute salinity (g kg−1) and sigma-0 (kg m−3) and were calculated using the TEOS-10 formula (IOC et al., 2010). The oxygen sensor (Idronaut s.r.l.) attached to the OS320plus probe was calibrated prior to each cruise. Oxygen profiles used for the analysis were quality-checked against the laboratory analysis of water samples using an OX 400 L DO (VWR International, LCC) analyzer. The accuracy of the Idronaut oxygen sensor is 0.1 mg L−1, while the accuracy of the laboratory dissolved oxygen analyzer is 0.5 % of the measured value. The primary dataset used to characterize the water column structure and dissolved oxygen and phosphates concentrations in 2018 was collected on 9–10 January, 17–18 April, 30 May, 11 July, 25 August, and 26–27 October.
The depth of the upper mixed layer (UML) was defined according to Liblik and Lips (2012) as the minimum depth, where ρz–ρ3 > 0.25 kg m−3, where ρz is the density anomaly at depth z and ρ3 at depth 3 m. The depth of the near-bottom mixed layer (NBL) was found similarly to UML, as the maximum depth, where |ρz–ρlast| > 0.1 kg m−3, where ρlast is the density anomaly at the maximum depth of a profile. An oxygen concentration of 2.9 mg L−1 (2 mL L−1) was used as the threshold concentration for defining hypoxia, and the upper boundary of the hypoxic layer was found as the minimum depth at which oxygen concentration was below the threshold. The estimated depth of the upper boundary of the hypoxic layer at station G1 and the gridded topography (EMODnet Bathymetry Consortium, 2020) were used to find the lateral extent of the hypoxic area, assuming an even horizontal depth distribution for the occurrence of hypoxia. The sea depth at station G1 is 54 m (Fig. 1). The profiles covered – in most cases – the depth range from 2 to 52 m. The water column structure was characterized by temperature, salinity, and density in the UML and NBL, and potential energy anomaly (PEA; Simpson et al., 1990) was calculated as
where h is the water column depth (50 m), ρ is water density, z is depth (vertical coordinate), and g = 9.81 m s−2.
Meteorological data for 1979–2018 were extracted from the ERA5 dataset (Hersbach et al., 2018) via Copernicus Services for characterizing local conditions in the gulf and upwelling-favorable conditions along the eastern coast of the Baltic Proper. Based on hourly data from a grid cell in the central gulf (see Fig. 1), the monthly mean net solar radiation, air temperature (2 m above surface), and wind speed (at the 10 m height) in 2018 were calculated and compared with monthly mean values and variability in 1979–2018. Runoff data of rivers Salaca, Gauja, Lielupe, and Daugava (Fig. 1) from 1993 to 2018 were received from the Latvian Environment, Geology and Meteorology Center as the estimated monthly runoff (m3 s−1). River Pärnu runoff data were obtained from the Estonian Weather Service.
For a more detailed analysis of the impact of meteorological and hydrological conditions on the development of stratification, changes in potential energy anomaly due to surface heating–cooling (Sb), wind mixing (Sm), and freshwater discharge from rivers (Sr) were estimated for the years 2012–2018:
The two former parameters were calculated as suggested by Simpson et al. (1990):
where QTOT is the surface heat flux and W is the wind speed. QTOT is the sum of the shortwave radiative heat flux, longwave radiative heat flux, sensible heat flux, and latent heat flux estimated using ERA5 data and surface salinity obtained from CTD casts interpolated between the measurements. Thermal expansion coefficient αv was calculated using the TEOS-10 formula (IOC et al., 2010), and specific heat of seawater cp = 4000 J (kg K)−1 was applied. In the formula for the shortwave radiative heat flux, an average albedo of 0.055 was used (Groeskamp and Iudicone, 2018; Séférian et al., 2017). Otherwise, we used the same methods of calculating surface heat flux components as Liblik and Lips (2012). For estimating Sm, constant values of efficiency of mixing and air density ρa = 1.25 kg m−3 were applied, and the effective drag coefficient CD was calculated according to Wu (1982). The changes in stratification due to river discharge were estimated using monthly runoff from the previous month. The flow in m3 s−1 was multiplied by a constant, which was found assuming that the average yearly change in PEA in 2012–2018 was equal to the change caused by the average runoff of 36 km yr−3 evenly distributed over the entire surface area of the gulf.
Wind data from a grid cell outside the gulf, but close to the Irbe Strait (see Fig. 1), were extracted from ERA5 data to calculate the north-northeast (NNE) component of wind stress as τNNE=CDρa|W|WNNE, where WNNE is the wind speed component directed towards NNE (south-southwest wind component). It is used to find the periods with upwelling-favorable conditions along the eastern coast of the Baltic Proper and for a more detailed analysis of inflows–outflows through the Irbe Strait in 2012–2018. Cumulative wind stress is calculated by summing up the hourly NNE components of wind stress multiplied by the time step of 1 h starting from 1 January each year.
We introduce a coarse method estimating oxygen consumption rates in the gulf NBL. The considered physical processes contributing to the measured changes in salinity and oxygen concentration in the NBL were (1) vertical diffusion and (2) lateral advection and mixing. Diffusive flux of salt and oxygen through the border between the NBL and the water column above was estimated using a similar approach as Stoicescu et al. (2019):
where the vertical diffusivity coefficient is calculated as , α is the empirical intensity factor of turbulence (we applied a constant value α = 1.5 × 10⁻⁷ m2 s−2), and N is the Brunt–Väisälä frequency defined by the vertical density gradient. The changes in salinity and oxygen concentration in the NBL can be found by multiplying the value of diffusive fluxes by the time between two measurements (t2−t1) and dividing it by the thickness of the NBL (hNBL) as
Knowing salinities of inflowing waters and gulf NBL waters at time steps t1 and t2 and the changes due to vertical diffusion, we can estimate the proportion of inflowing waters in the near-bottom water mass at time step t2. Using this proportion, we can also estimate the expected changes in the NBL oxygen concentration due to lateral transport and mixing as
where and are salinity and oxygen concentration in the NBL at station G1 and and at station 114 in the Irbe Strait (see Fig. 1) at an initial time step t1. is measured salinity in the NBL at station G1 at time step t2 corrected by the estimated salinity change due to vertical diffusion.
Due to oxygen consumption, measured oxygen concentration in the NBL at station G1 at time step t2 () should be lower than that found when considering only changes due to physical processes since no production is expected in the near-bottom layer that is well below the euphotic depth. Oxygen depletion due to consumption can be found as the sum of the measured oxygen depletion and changes in concentration due to diffusion and lateral advection and mixing:
Oxygen consumption rate per unit bottom area is calculated as
We have chosen the time step of 1 month or longer to estimate oxygen consumption rates based on the distance between the Irbe Strait and the Ruhnu Deep (120 km, measured along the deeper area of the gulf) and average (monthly) flow rates in the gulf of 5 cm s−1 (e.g., Soosaar et al., 2014; Lips et al., 2016).
The same methods were used to estimate phosphate fluxes due to physical processes and phosphorus release from the sediments. The measured concentrations in the near-bottom layer at station G1 were assigned to the gulf's water and at station 114 to the inflowing water. In Eqs. (4)–(8), oxygen concentration was replaced by phosphate concentration, and the difference in measured and expected phosphate concentrations in the gulf near-bottom layer was associated with the phosphorus release from the sediments. Since the vertical resolution of nutrient sampling was scarce (step was 10 m), we used only the deepest measured phosphate concentration as the value characterizing the entire NBL, and the vertical gradient was estimated between the phosphate concentrations at the deepest sampling point and 10–12 m above it.
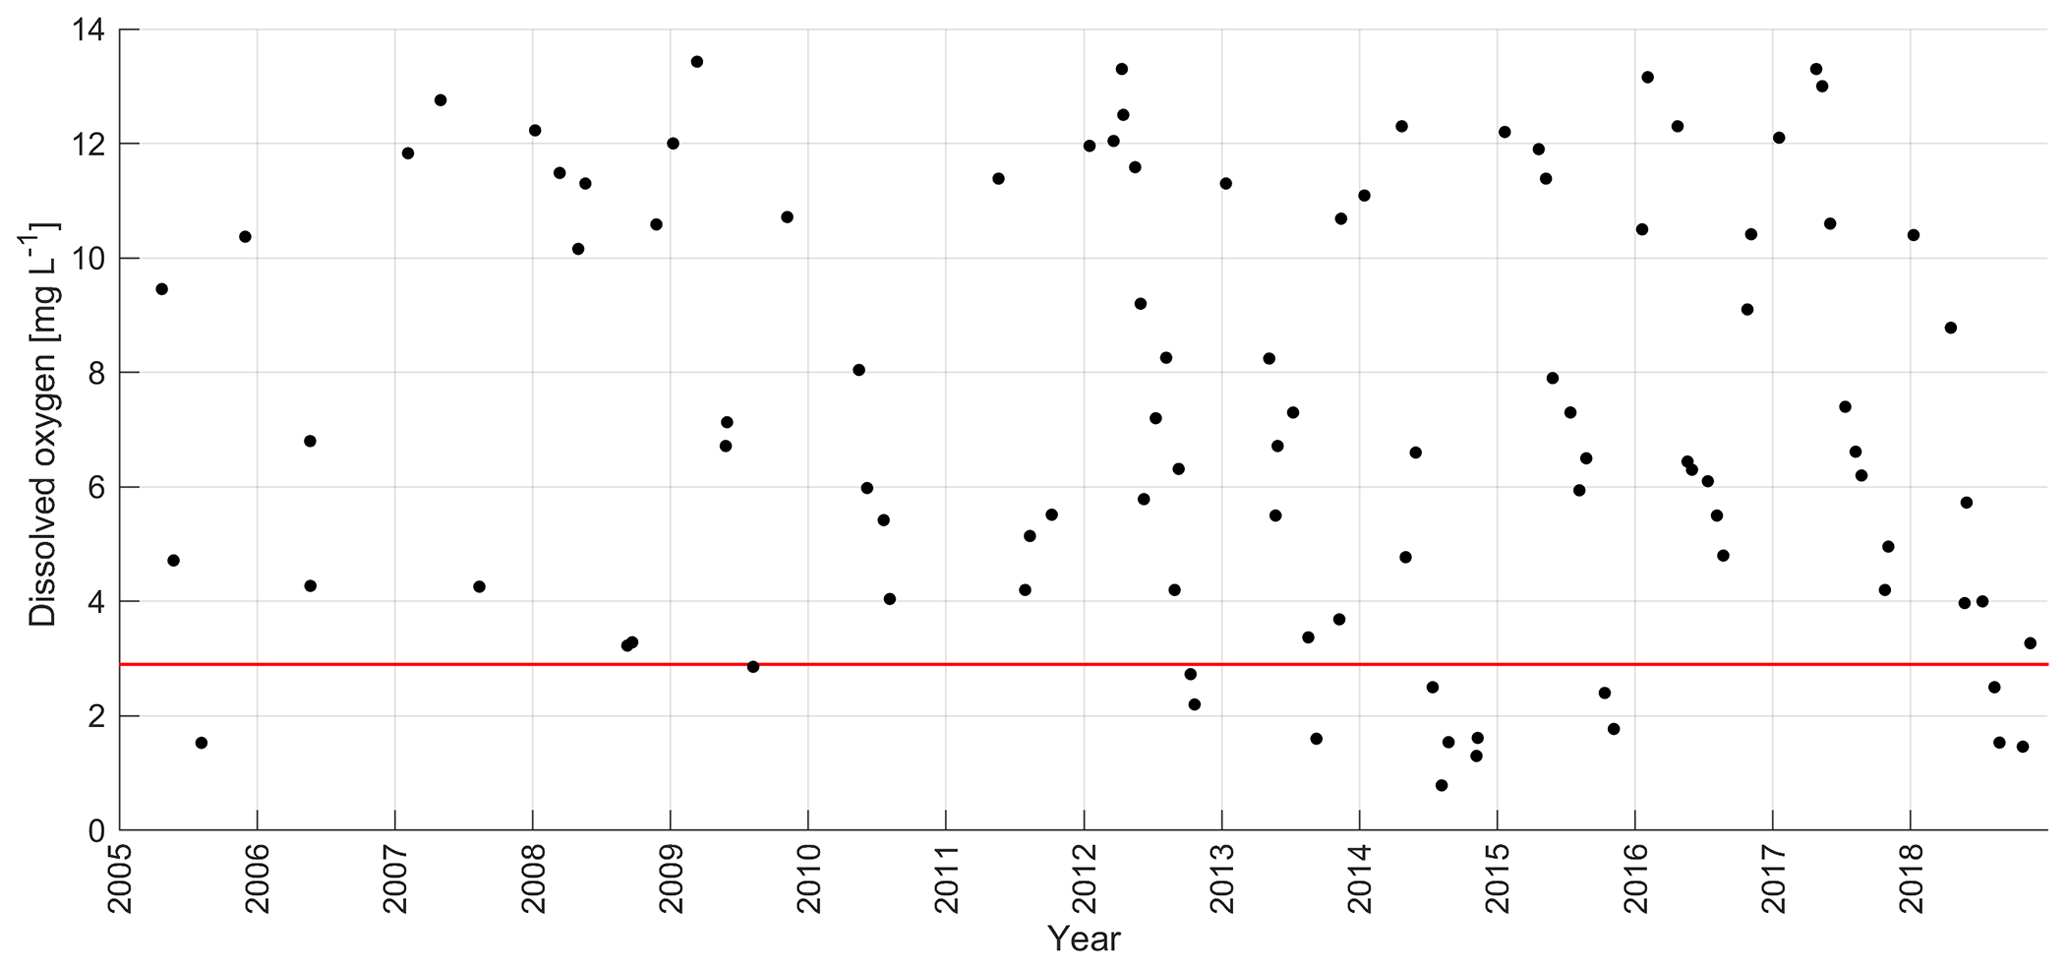
Figure 2Inter-annual variability of near-bottom dissolved oxygen concentration at monitoring stations G1 and 121 in 2005–2018. The red line denotes the oxygen concentration 2.9 mg L−1 (threshold concentration for hypoxia).
3.1 Inter-annual variability of dissolved oxygen in the near-bottom layer
We characterized the long-term development of oxygen conditions in the Gulf of Riga using near-bottom oxygen measurements at the deepest stations G1 and 121 (bottom depth 54 m) and yearly average late summer (August) and autumn (October–November) near-bottom oxygen concentrations at all stations with depth ≥ 40 m (see station locations in Fig. 1). Based on the data obtained from the deepest stations, late summer–autumn hypoxia occurred in about 50 % of years in 2005–2018 (Fig. 2). No hypoxia was observed in 2006–2011, except for one value close to 2.9 mg L−1 in 2009, but note the lower sampling frequency. Hypoxic conditions have been recorded every year since 2012, except for 2016 and 2017. Based on the data from all monitoring stations from 2005–2018, no trend in the deep layer oxygen concentrations was detected in summer, but a statistically significant (p < 0.05) trend at a rate of 0.45 was found in autumn (R2 = 0.50, n = 13). Thus, the monitoring data suggest that the hypoxic conditions observed in 2018 are – in general – in line with the long-term trend.
We studied the links between the long-term trend and variability of near-bottom oxygen and other environmental parameters, such as salinity and nutrient concentrations. No significant trend in near-bottom salinity was revealed in 2005–2018. Using simultaneously measured near-bottom salinity and oxygen values at station G1 from August to November in 2005–2018, we found a statistically significant (R2 = 0.24, n = 36, p < 0.05) negative relationship – low oxygen concentrations corresponded to high salinity values. However, there are examples where hypoxia occurred at salinities of 5.8 g kg−1 (in 2012 and 2015) and did not at 6.5 g kg−1 (in 2010).
The analysis of near-bottom phosphate concentrations at stations with depth ≥ 40 m revealed a statistically significant increase in concentrations in late summer (0.08 µM yr−1, R2 = 0.47, n = 14) and autumn (0.12 µM yr−1, R2 = 0.34, n = 13). A statistically significant negative correlation was obtained between the deep layer oxygen and phosphate concentrations in autumn (R2 = 0.79, n = 13, p < 0.05). The near-bottom-layer oxygen in autumn also significantly correlated with the next year's winter (January) phosphate concentration in the entire water column (R2 = 0.45, n = 9, p < 0.05). Thus, the impact of the hypoxia deepening is also seen in the trends of phosphate concentrations.
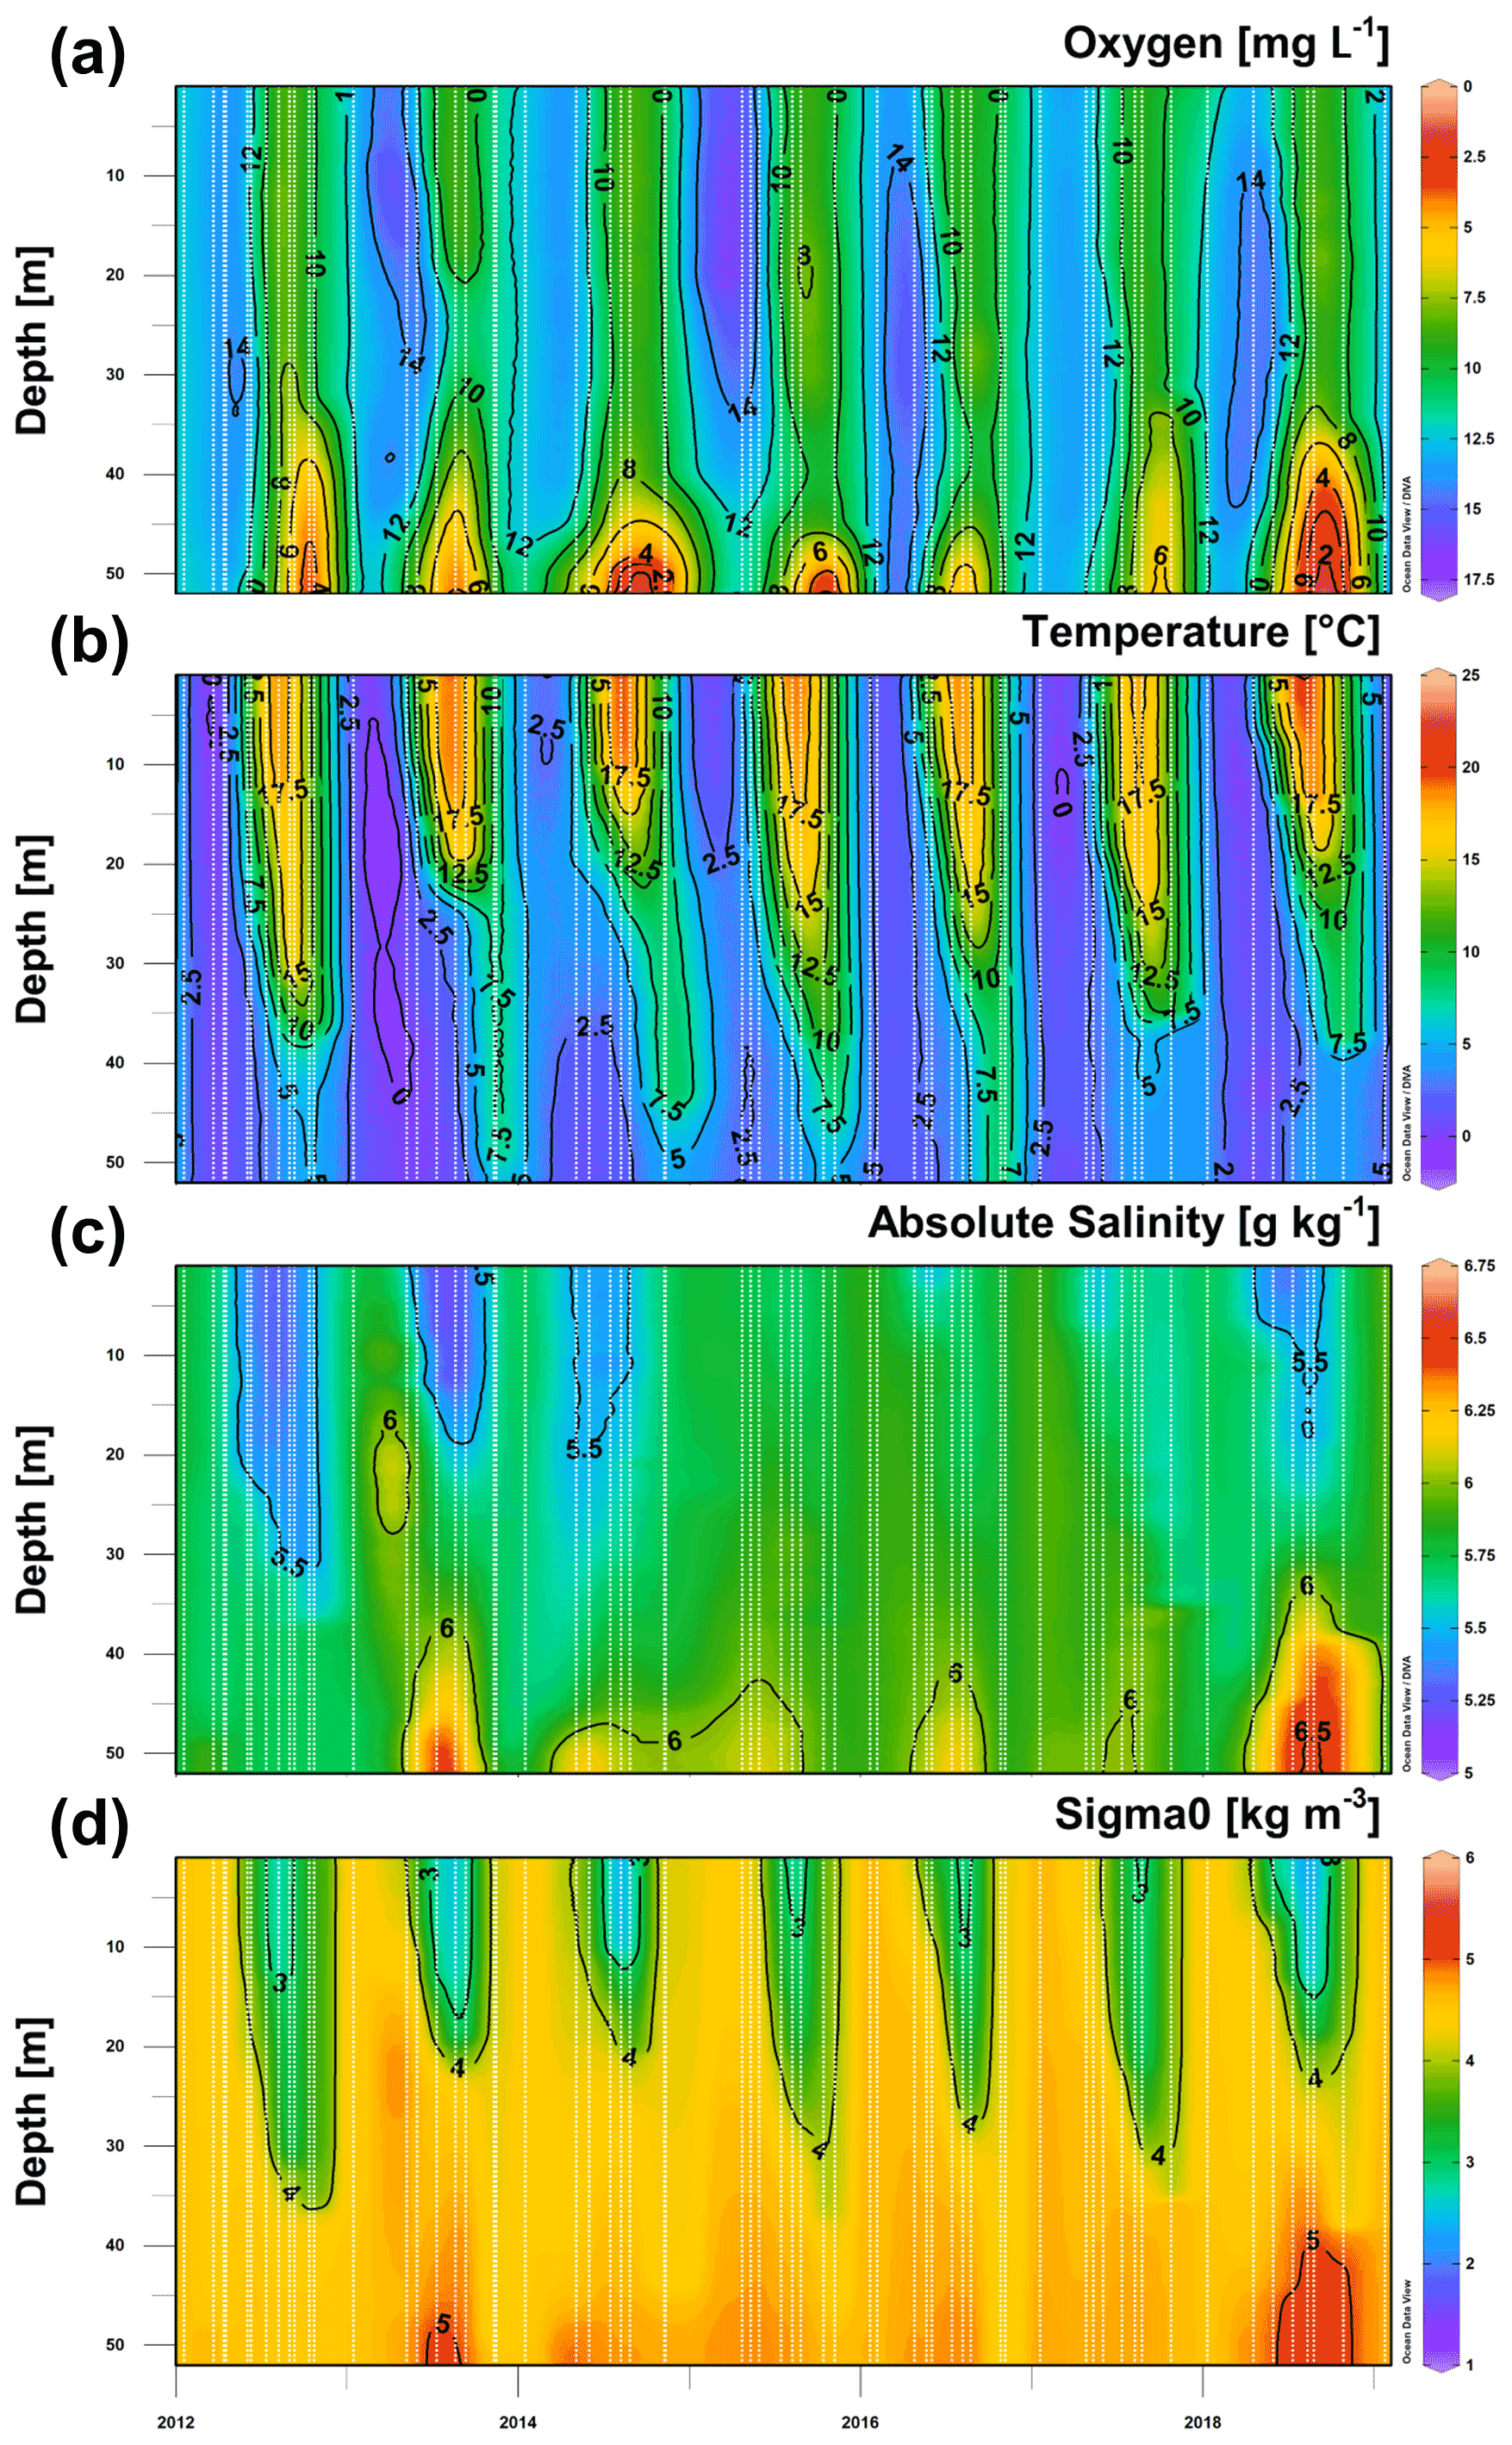
Figure 3Time series of the vertical distribution of oxygen concentration (a), temperature (b), salinity (c), and density anomaly (d) at stations G1 and 121 in 2012–2018 (including January 2019). Vertical white dashed lines mark the time of measured profiles.
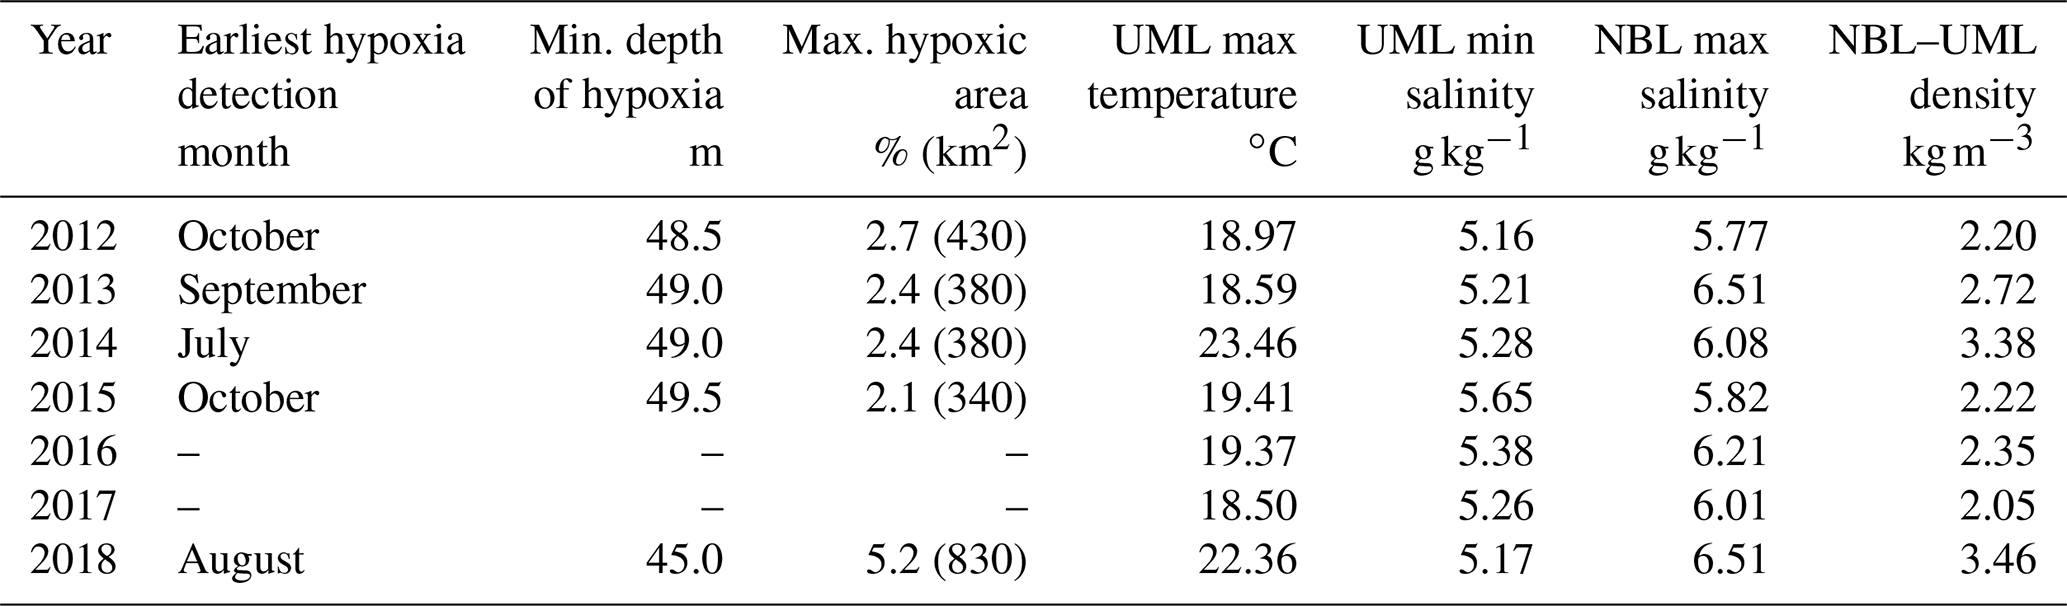
Table 1Characteristics of seasonal hypoxia and stratification parameters in the Gulf of Riga in 2012–2018, based on CTD profiles from May to November at stations G1 and 121. Observed maxima of UML temperature, NBL salinity, and density difference between NBL and UML and minima of UML salinity are given.
3.2 Seasonal and inter-annual variability in the vertical distribution
Based on the vertical profiles of dissolved oxygen collected at least every 2 months in 2012–2018, a clear seasonal pattern was apparent at all depths, with the largest amplitude occurring in the near-bottom layer (Fig. 3a). The lowest oxygen concentrations were measured in late summer–autumn, but the oxygen levels did not always drop below the hypoxia threshold (as in 2016 and 2017). The lowest oxygen concentrations were observed in 2014 (0.8 mg L−1) and 2018 (1.5 mg L−1). As pointed out above, hypoxia was observed in 2012–2015 and 2018, but the duration and vertical extent of hypoxia differed between the years (Fig. 3a, Table 1). The first occurrence of the seasonal hypoxia was observed in July in 2014, August in 2018, September in 2013, and October 2012 and 2015. The upper boundary of the hypoxic layer was at its shallowest depth in 2018 (45.0 m). Accordingly, the estimated spatial extent of hypoxia was the largest in 2018, when the hypoxic waters covered 5.2 % (830 km2) of the gulf's bottom area. In the other years with hypoxia (2012–2015), the estimates of the bottom area covered by hypoxic waters did not differ greatly, varying between 2.1 % and 2.7 % (340–430 km2).
Seasonal patterns also dominated the variability of vertical distributions of temperature, salinity, and density anomaly (Fig. 3b–d), but certain inter-annual differences in water column parameters can be noticed (Table 1). The observed UML temperature maxima were higher in the summers of 2014 and 2018. Lower summer UML salinities (≤ 5.2 g kg−1) were observed in 2012, 2013, and 2018, and increased NBL salinity values (≥ 6.5 g kg−1) were registered in the summers of 2013 and 2018. The largest density differences between the bottom and surface layer, 3.4 and 3.5 kg m−3 – which were mostly associated with high UML temperatures – were found in 2014 and 2018. High NBL salinity and low UML salinity contributed to the observed relatively strong water column stratification in 2013 (the third strongest stratification in 2012–2018), although the summer UML temperature remained low in 2013 (Table 1). The weakest vertical stratification was observed in 2017, when the density difference between the NBL and UML was close to 2.0 kg m−3.
Thus, the years with strong stratification (2013, 2014, and 2018; Table 1) were associated with high UML temperature, low UML salinity, and high NBL salinity and were among those with near-bottom hypoxia. In 2017, the stratification was the weakest, and hypoxia did not develop. Still, the density difference between the NBL and UML was weaker in 2012 and 2015 than in 2016 – but in 2012 and 2015, hypoxia was observed, whereas in 2016, it was not. A further, more detailed analysis of water column stratification is presented in Sect. 3.4 together with the description of meteorological and hydrological forcing data.
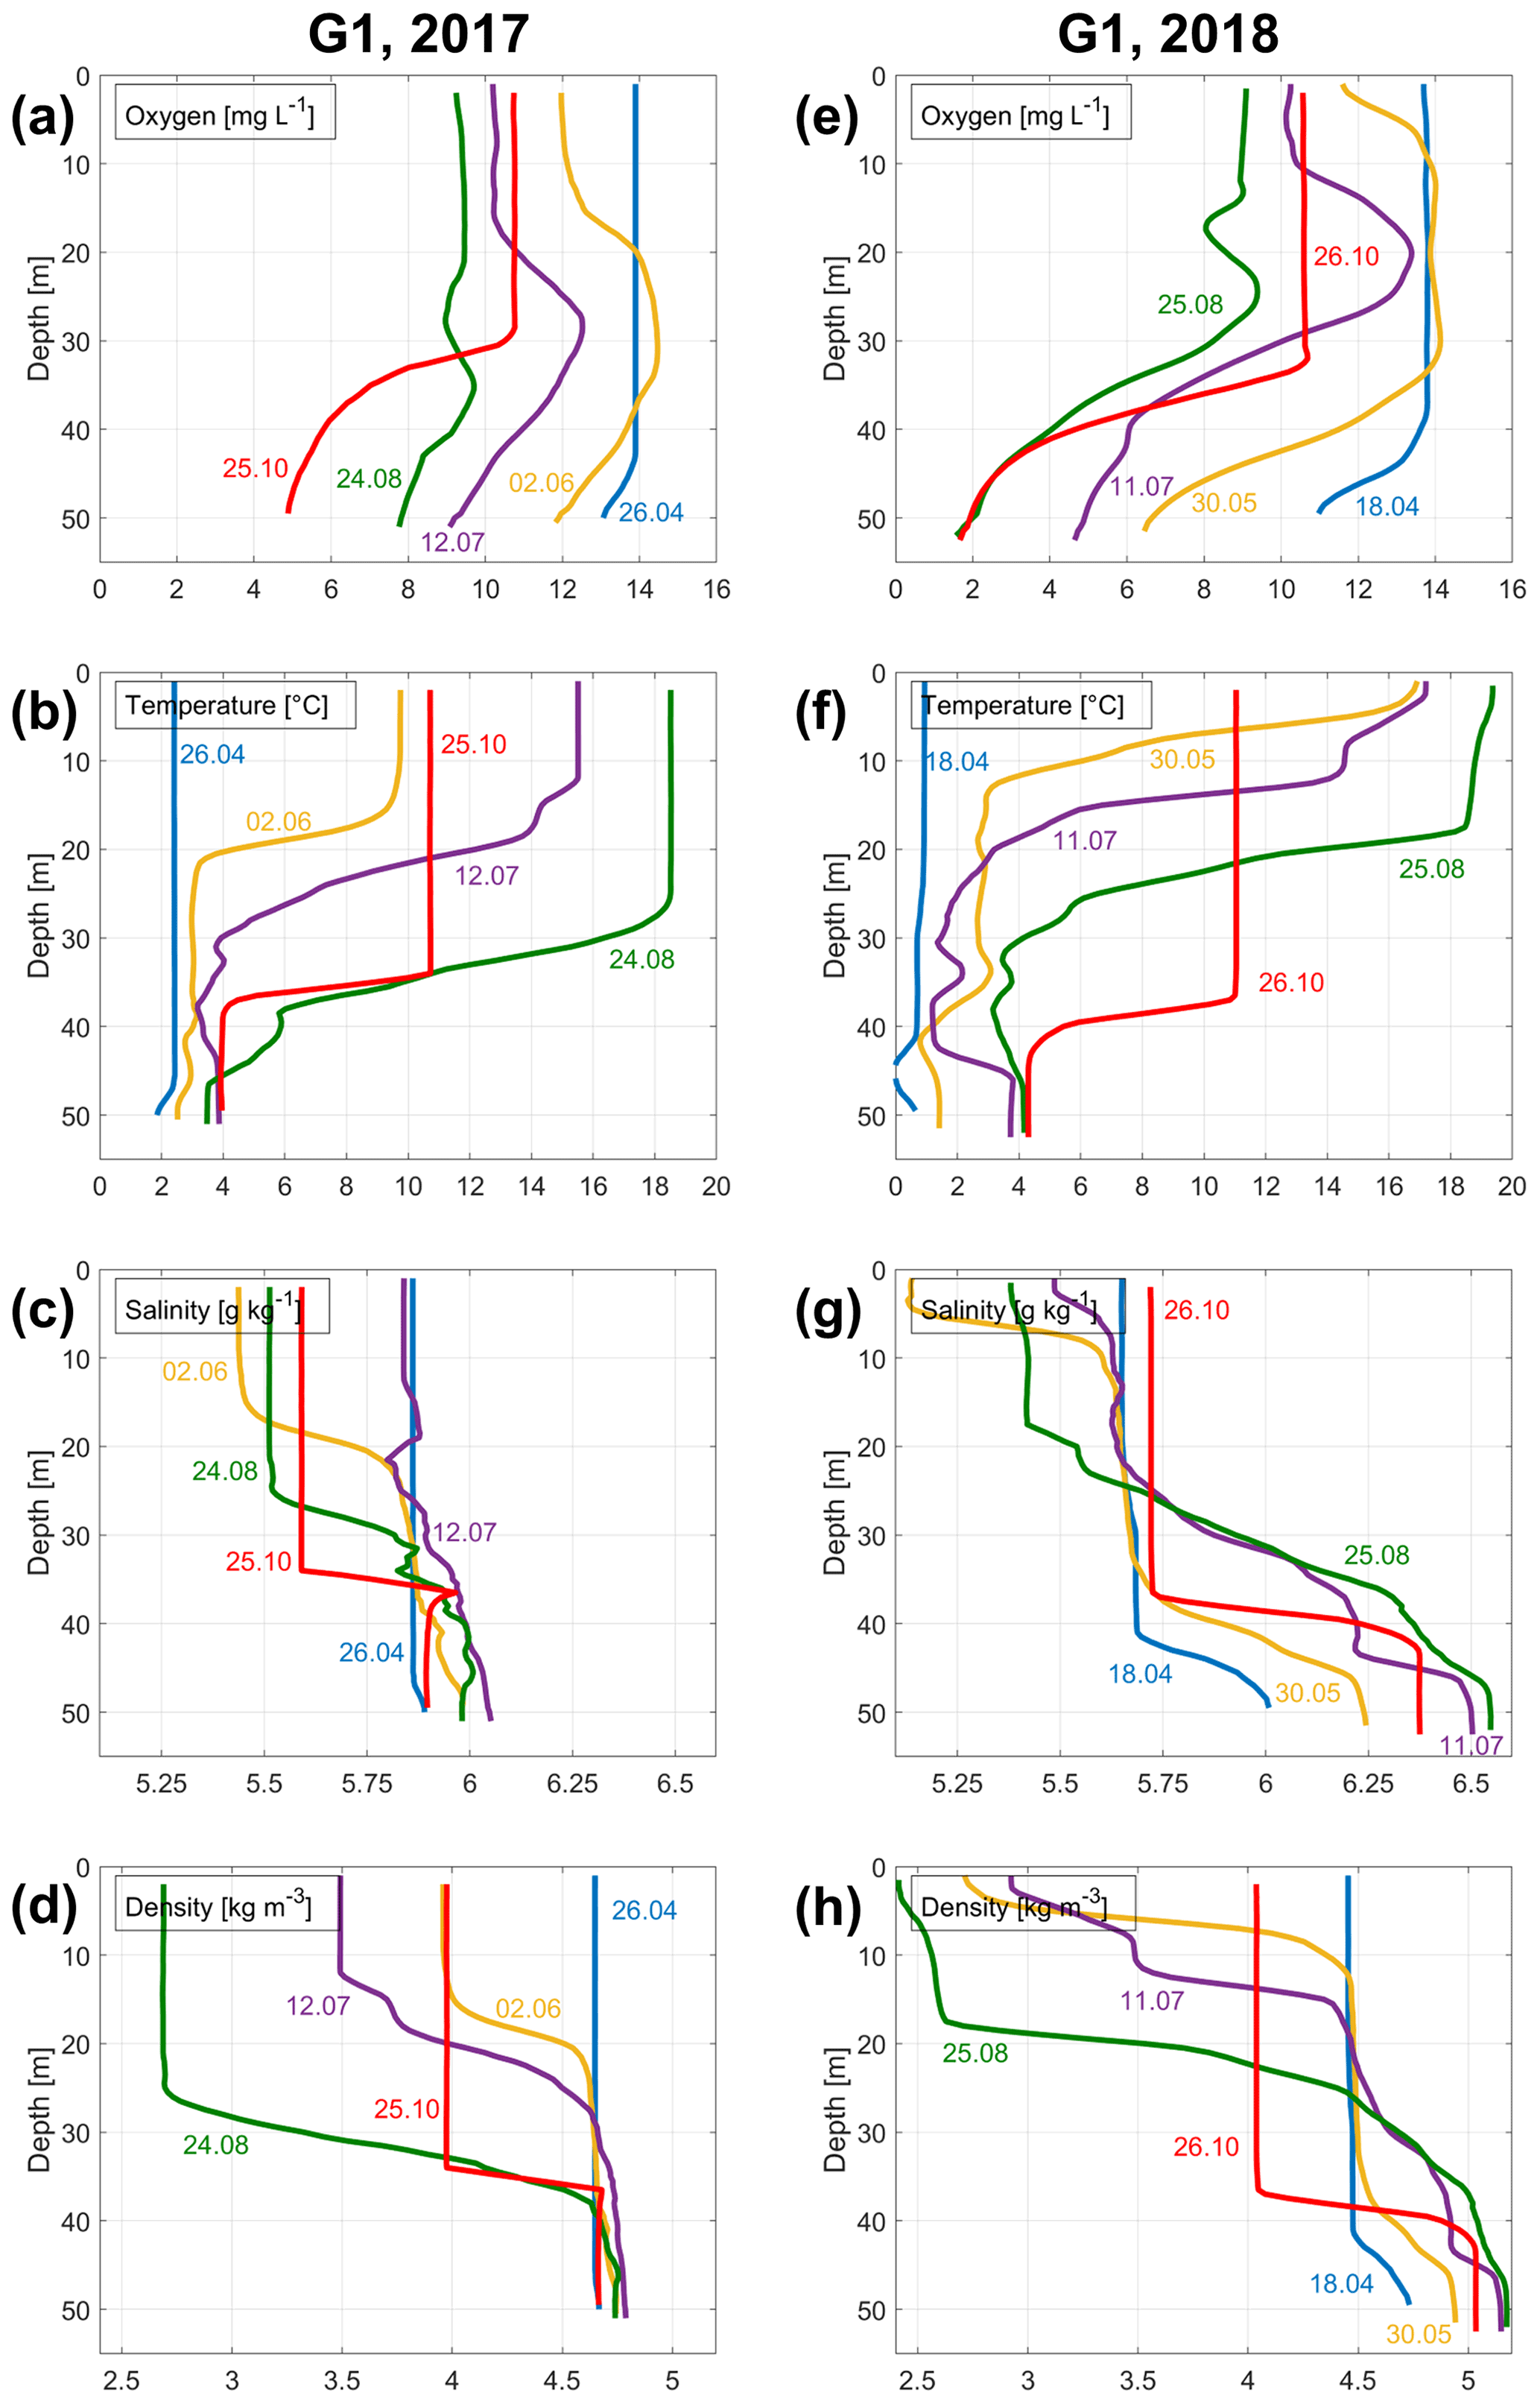
Figure 4Vertical profiles of dissolved oxygen concentration (a, e), temperature (b, f), salinity (c, g), and density anomaly (d, h) measured in the Ruhnu Deep (station G1; see location in Fig. 1) in 2017 (a–d) and 2018 (e–h).
3.3 Temporal development of hypoxia in 2018
To demonstrate the development of hypoxia and vertical stratification in 2018 in more detail and to compare it with that of the previous year without hypoxia, we present vertical profiles of temperature, salinity, density, and dissolved oxygen concentration in the Ruhnu Deep in 2017 and 2018 (Fig. 4). A major difference between the years is evident in a much faster decrease in near-bottom oxygen concentrations in spring 2018 than in 2017. Also, the development of vertical stratification in spring–early summer differed between these two years. In 2018, salinity stratification in the deep layer was established in the middle of April, and a very strong seasonal thermocline was formed by the end of May. In 2017, the seasonal thermocline was remarkably weaker in the beginning of June, compared to late May of 2018, and no secondary pycnocline developed in the deep layer in spring–summer.
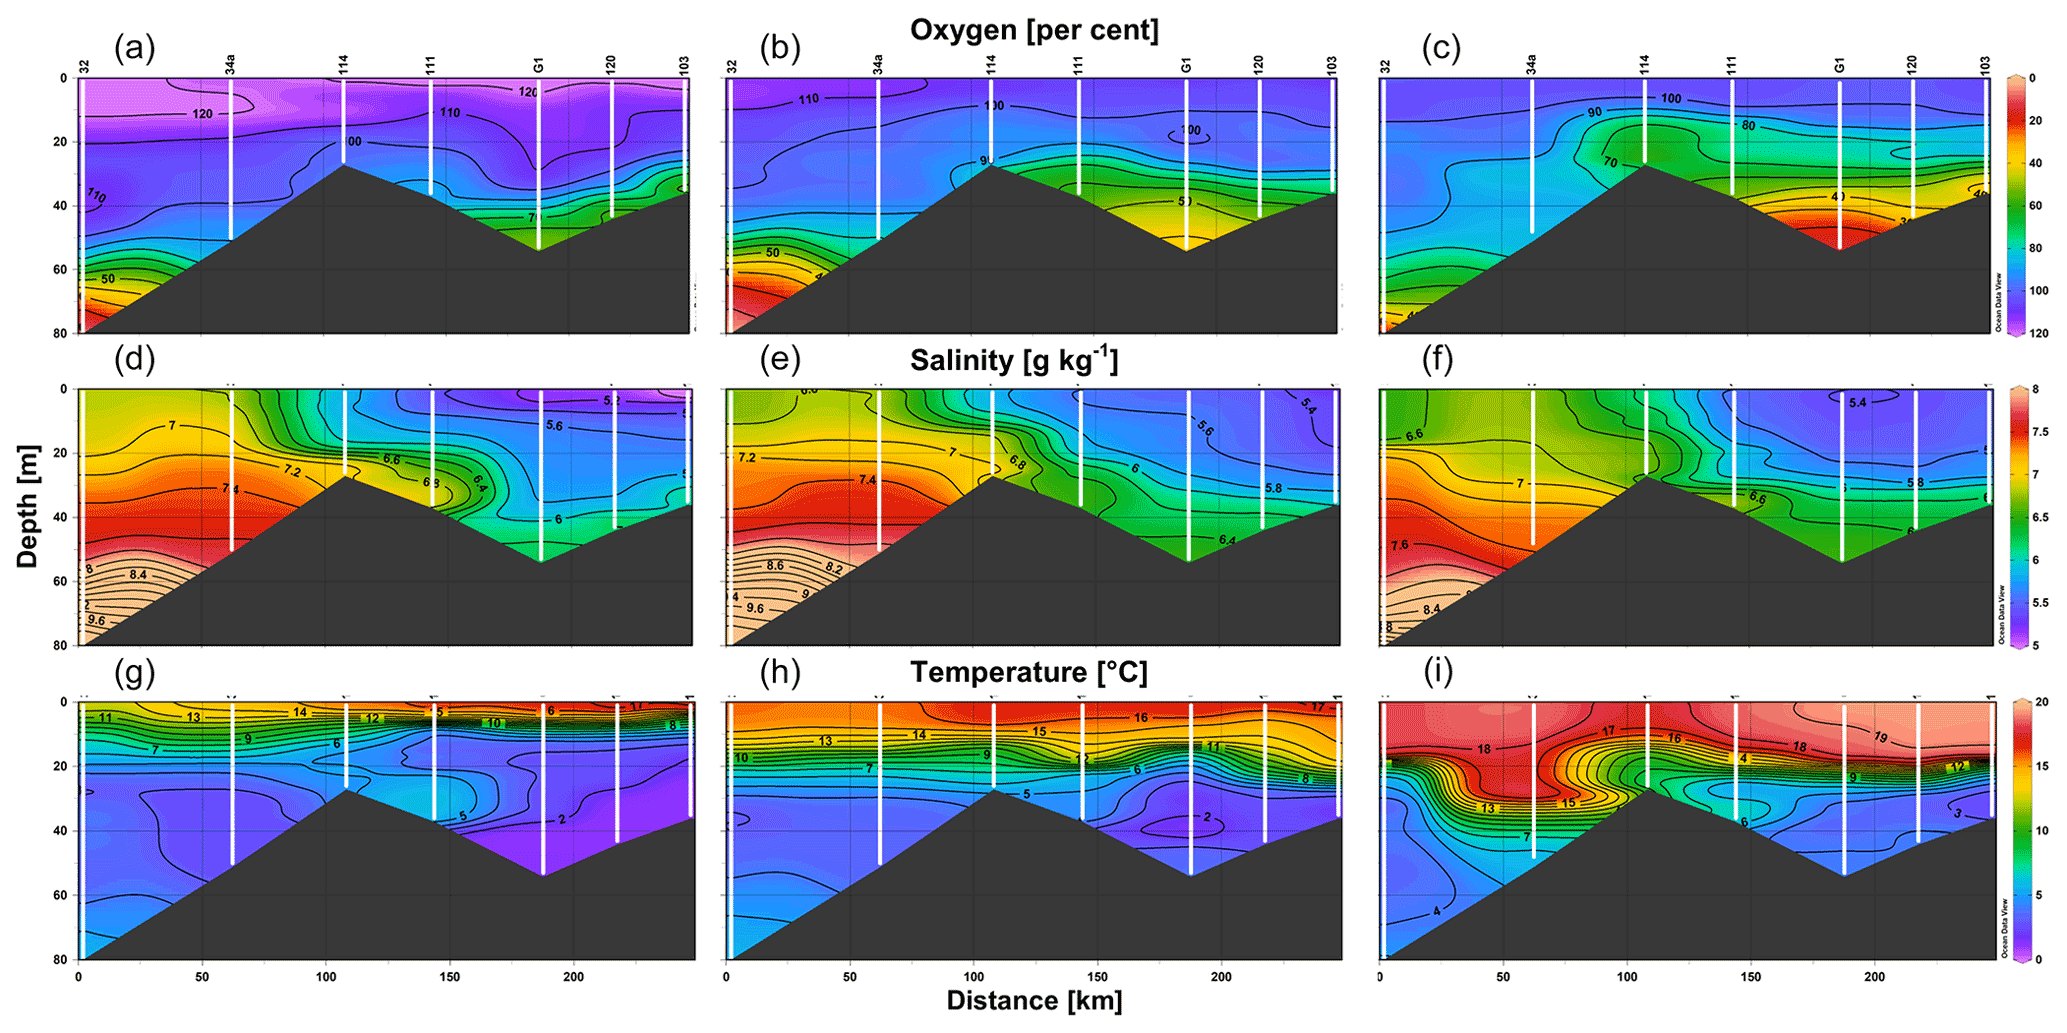
Figure 5Vertical sections of oxygen saturation (a–c), salinity (d–f), and temperature (g–i) on 30 May (a, d, g), 11 July (b, e, h), and 25–26 August (c, f, i) 2018 along the route from station 32 in the Baltic Proper through the Irbe Strait to station 103 near the Daugava River mouth in the Gulf of Riga (see the locations in Fig. 1).
The vertical sections of oxygen, salinity, and temperature (Fig. 5) demonstrate the spreading of waters from the eastern Baltic Proper to the Gulf of Riga over the Irbe Strait sill in late May and July 2018. However, at the end of August, the distribution patterns indicate that outflow from the gulf likely prevailed below the seasonal thermocline through the Irbe Strait (Fig. 5 lower panel). Oxygen concentrations in the near-bottom layer in the central gulf were at a level of 60 % saturation in late May, decreasing further to 40 % of saturation (< 5 mg L−1) by mid-July, and hypoxic conditions with oxygen saturation below 20 % were established by late August. We also point to an increase in salinity in the water layer of 35–45 m, which is seen on the consecutive profiles measured in July and August at station G1 (Fig. 4).
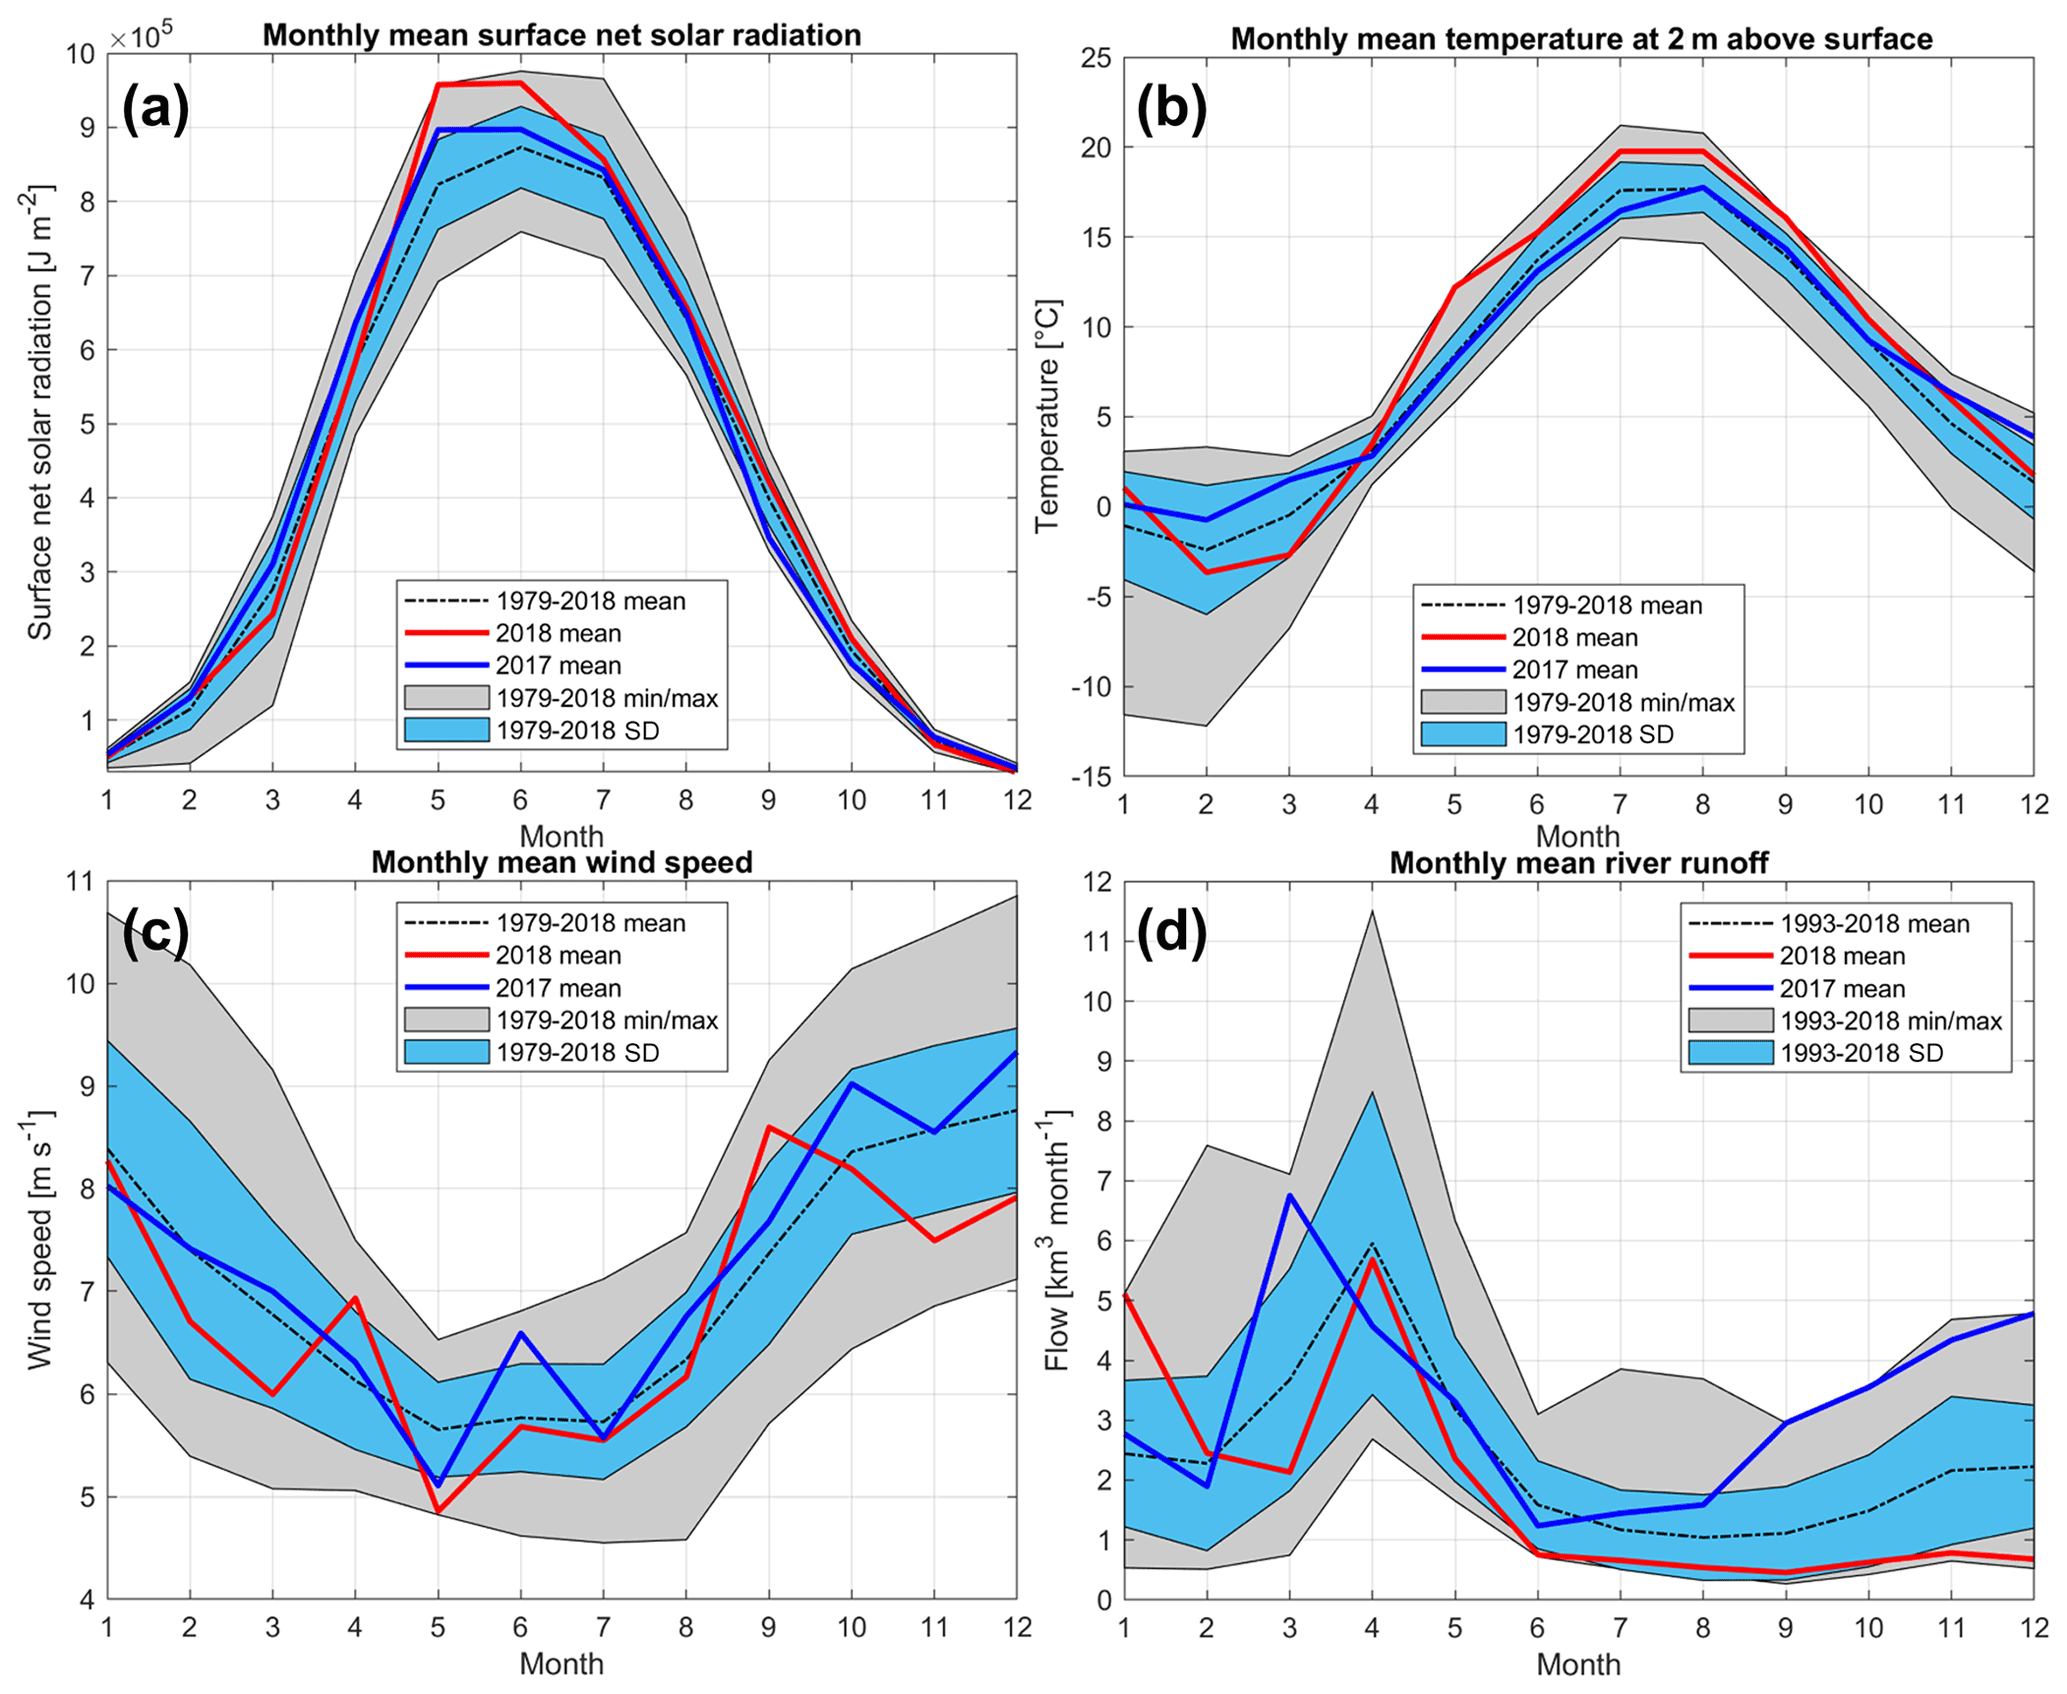
Figure 6Courses of monthly mean, minimum and maximum, and standard deviation of (a) surface radiation, (b) air temperature, and (c) wind speed for the period of 1979–2018 and (d) river runoff for the period of 1993–2018. The monthly mean values of listed parameters for 2017 and 2018 are shown as blue and red lines, respectively. For meteorological parameters, ERA5 data are used from the central Gulf of Riga (see the location of the grid cell in Fig. 1).
3.4 Analysis of meteorological and hydrological conditions
Solar radiation in 2018 was higher than that of the long-term average for all months from spring to autumn (Fig. 6a). Seasonal variation in air temperature in 2018 differed from the average, as well, with a rapid increase in April–May and higher monthly mean values than the long-term averages until October (Fig. 6b). The monthly average wind speed from February to August was lower in 2018 than the long-term mean for the respective month, except in April (Fig. 6c). The lowest wind speed for May in 1979–2018 was found in 2018. All these anomalies in meteorological conditions supported the observed fast development and strength of seasonal stratification in the GoR. As opposed to 2018, the solar radiation, air temperature, and wind speed in 2017 were mostly close to the long-term averages (Fig. 6a–c).
A comparison of monthly river runoff values from 2018 with the long-term mean values (1993–2018) shows that the 2018 runoff was mostly lower than the long-term mean – although within standard deviation limits (Fig. 6d). An exception was found in January 2018, when runoff was the largest on the record, being more than twice as large (5.11 km3 per month) as the long-term mean (2.44 km3 per month). The maximum or close to the maximum value of monthly river runoff was also observed in September–December 2017.
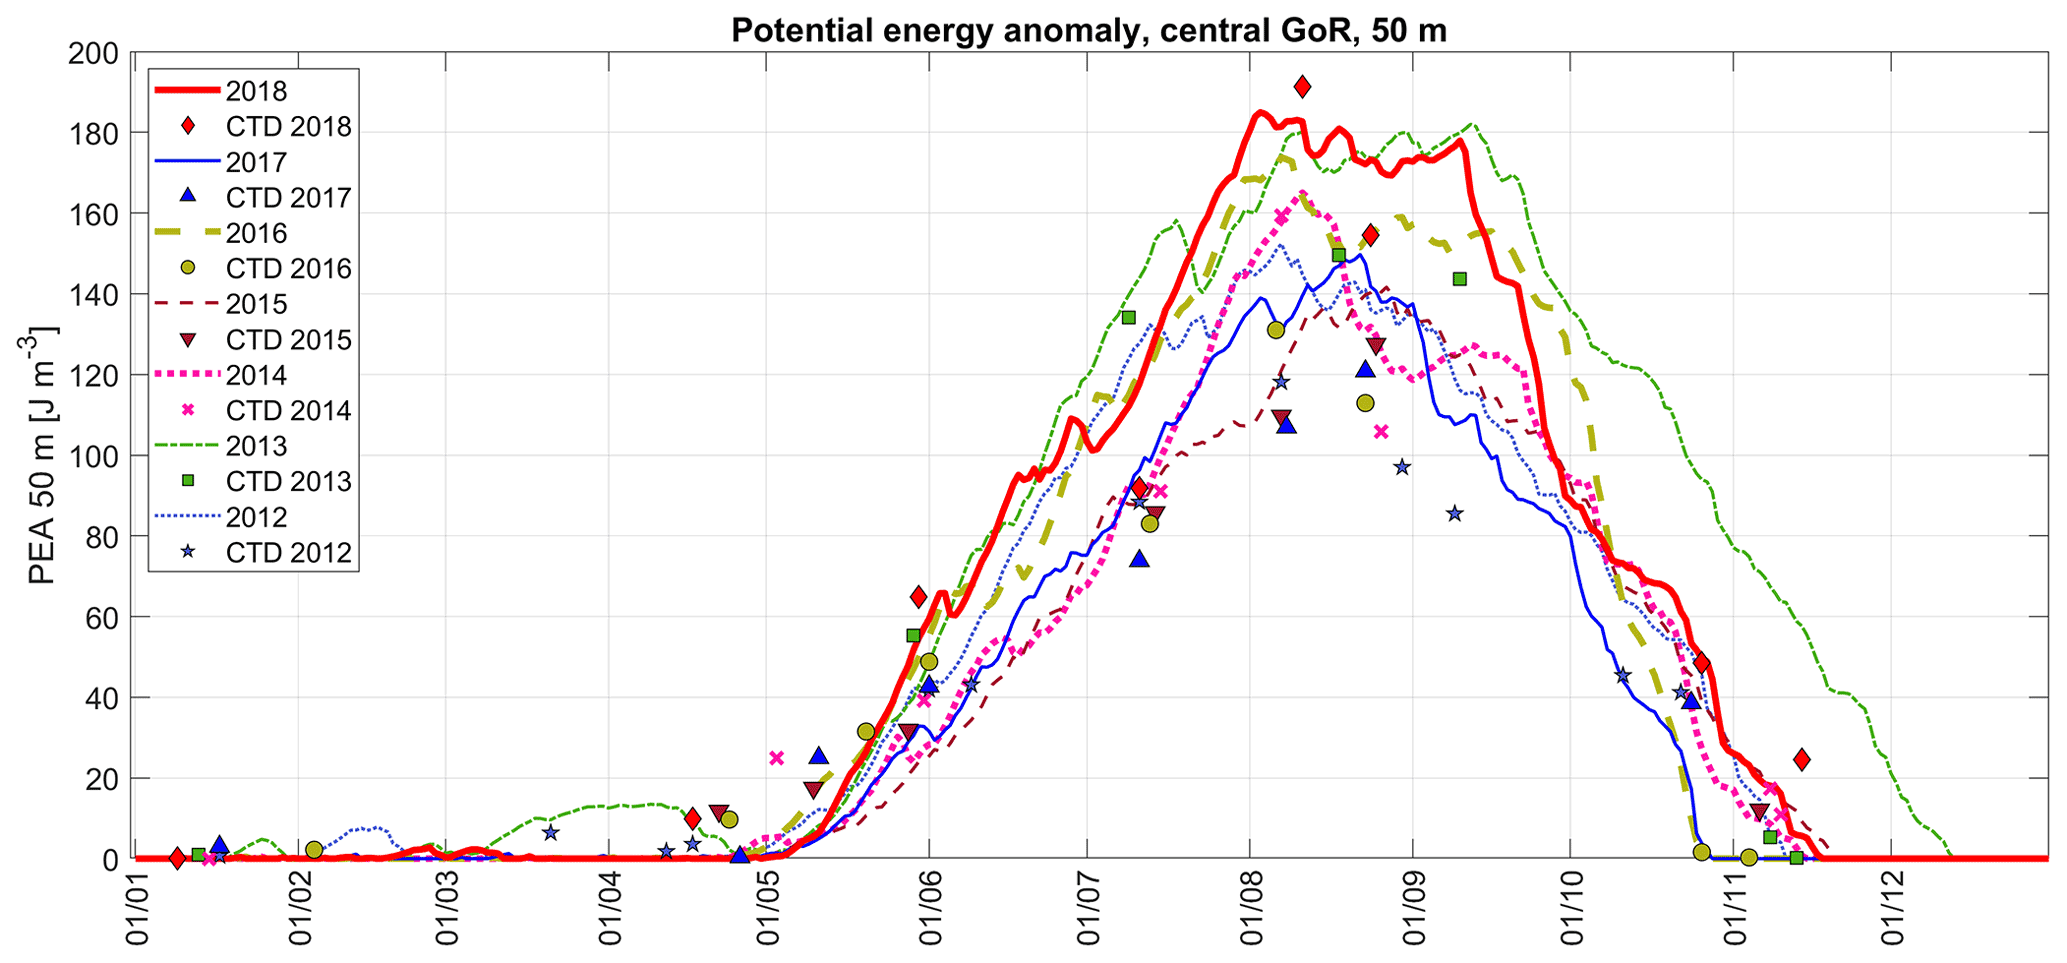
Figure 7Changes in vertical stratification (potential energy anomaly, PEA, characterizing energy needed to mix the water column fully) in the central Gulf of Riga in 2012–2018 based on CTD profiles (markers) and estimated using meteorological (ERA5 data are from the central Gulf of Riga) and river runoff data (curves; the methods are presented in Sect. 2).
The development of vertical stratification characterized by potential energy anomaly estimated using meteorological and river runoff data (Fig. 7) in general reflects the same differences between the years as the simple comparison of temperature, salinity, and density in the UML and NBL (Table 1). The fastest development of stratification and the strongest stratification at its peak were predicted for the summers of 2013 and 2018, and strong stratification was also characteristic for the summers of 2014 and 2016. The years 2012, 2015, and 2017 were among the years with the weakest stratification. A critical difference between the years can also be noticed during destratification in autumn. The longest stratified period was found for 2013, which was a remarkable year with the largest river runoff in spring (considering the period 2012–2018) and relatively high air temperatures in early summer and autumn. The earliest decay of vertical stratification is predicted for 2016 and 2017 – the water column was fully mixed by the end of October in both years. In comparison, the water column was fully mixed remarkably later in 2015 – in the second half of November.

Figure 8(a) Time series of along-coast (NNE–SSW) component of wind stress τNNE and cumulative wind stress in 2018 (6 h moving average is shown). (b) Cumulative wind stress for each year in 2012–2018. Average cumulative wind stress curve for 1979–2018 is shown in both panels. Data were extracted from the ERA5 grid point outside the gulf (see location in Fig. 1).
The analysis of the time series of the along-coast component (NNE–SSW) of wind stress supports the described inflow–outflow suggestions for 2018 (see Sect. 3.3). Upwelling-favorable winds with negative wind stress τNNE exceeding −0.2 N m−2 that could be related to the inflows of saltier waters into the Gulf of Riga were observed in February–March, May, early June, and late June 2018 (Fig. 8a). A major deviation from the long-term pattern is also evident in cumulative wind stress in 2018 – wind forcing from February to the end of July supported the near-bottom inflows (seen as the decrease in the cumulative wind stress; Fig. 8a). The winds from the opposite direction prevailed from the beginning of August. Thus, the inflows of sub-thermocline waters into the Gulf of Riga could have been blocked in late summer 2018, as also seen in Fig. 5, demonstrating the outflow of gulf deep layer waters to the Irbe Strait at the end of August.
Similar to 2018, the cumulative wind stress in 2013 largely deviated from the long-term mean (Fig. 8b). The inflow-favorable winds dominated in spring–summer, supporting the development of vertical stratification in the gulf's deep layer. A significant difference between these two years appeared in September – in 2013, the inflow-favorable winds persisted, while in 2018, the winds from opposite directions started to prevail. Inflow-supporting wind conditions were also observed in late spring–summer 2014, forming a relatively thin NBL (with its boundary at 46 m), and hypoxia appeared already in July 2014. Almost no inflow-supporting winds occurred in 2015. Although stratification was not strong and the NBL salinity was low this year (see Table 1), hypoxia developed in 2015, but later – in late October, while hypoxia in the other years was observed in July–September (Figs. 2 and 3). Cumulative wind stress graphs generally followed the long-term mean in 2016 and 2017 (Fig. 8b), and in these years, no hypoxia was observed.
Table 2Estimated changes in NBL salinity and oxygen concentration due to advection and diffusion (presented as the changes per month to ease the comparison between the periods) and estimated consumption rates from mid-April to late August 2018.

3.5 Estimates of oxygen consumption and sediment release of phosphates
We estimated fluxes of dissolved oxygen to the NBL at station G1 in summer 2018 due to vertical diffusion and lateral advection and mixing. Based on the gradient method (Eqs. 4 and 5), the estimated vertical diffusive flux varied between 0.26 and 0.43 , corresponding to the changes in NBL oxygen concentration from 0.50 to 1.05 mg L−1 per month (Table 2). The estimated changes in oxygen concentration due to advection (Eq. 6) had comparable values, varying from 0.48 to 1.24 mg L−1 per month. According to the measurements, the NBL oxygen concentration continuously decreased in summer 2018, showing that oxygen consumption had to be large enough to exhaust oxygen brought by diffusion and advection and cause further oxygen depletion in the NBL. We found that respiration could cause oxygen depletion in the NBL by 2.94–4.24 mg L−1 per month or, in total, by 16.2 mg L−1 from mid-April to late August 2018 (Eq. 7). The corresponding consumption rate per unit bottom area (Eq. 8) varied from 1.53 to 1.75 in 2018.
For the periods when inflows through the Irbe Strait are absent, the only physical process contributing to the changes in oxygen concentration in the gulf NBL is vertical diffusion/mixing. We suggested that such conditions of no inflows occurred in summer 2015, based on prevailing winds (Fig. 8b) and observed low salinity in the NBL at station G1 (Table 1). The vertical diffusive flux of oxygen was estimated at 0.49 in April–November 2015. If considering a similar oxygen consumption rate in 2015 as in 2018 (1.67 ), oxygen depletion in the NBL (with an average thickness of 16 m) could be 1.70 mg L−1 per month. Thus, this rate is enough to cause hypoxia in the near-bottom layer of the central gulf in late October 2015, as it was observed (see Figs. 2 and 3), but not earlier.
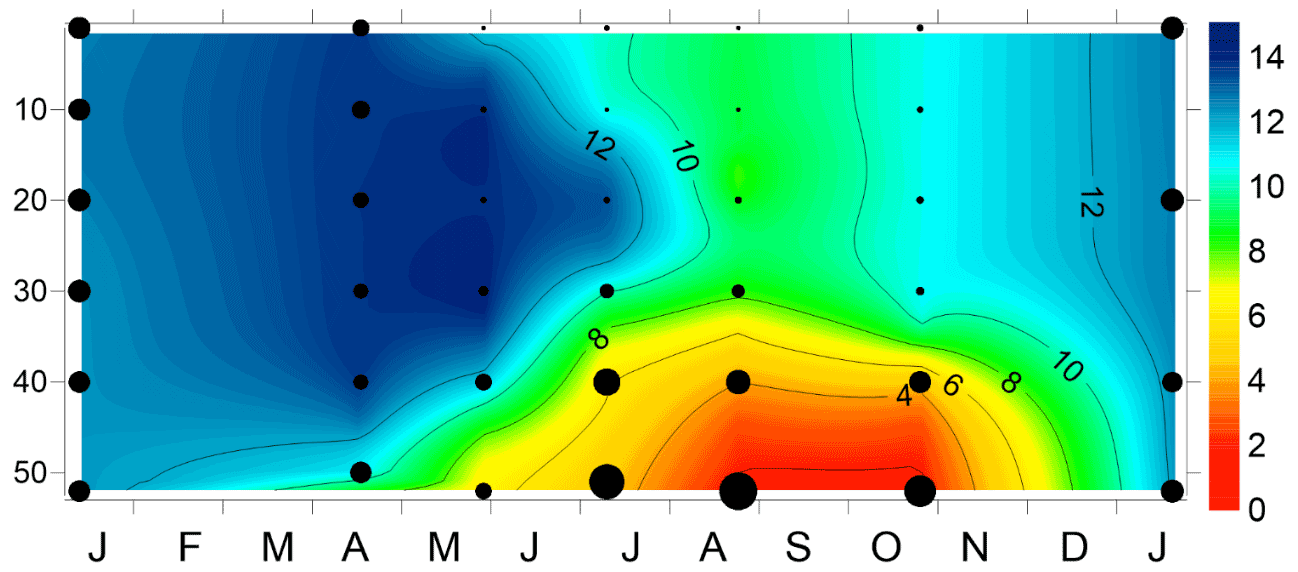
Figure 9Time series of vertical distribution of oxygen and phosphate concentration at station G1 in the Gulf of Riga from January 2018 to January 2019. Phosphate concentrations are indicated as black dots. The size of the dots is proportional to the measured concentrations ranging from the lower detection range of 0.06 to 2.25 µM.
Table 3Estimated changes in NBL phosphate concentration due to advection and diffusion and estimated sediment release of phosphates in the Gulf of Riga between the monitoring campaigns in 2018.
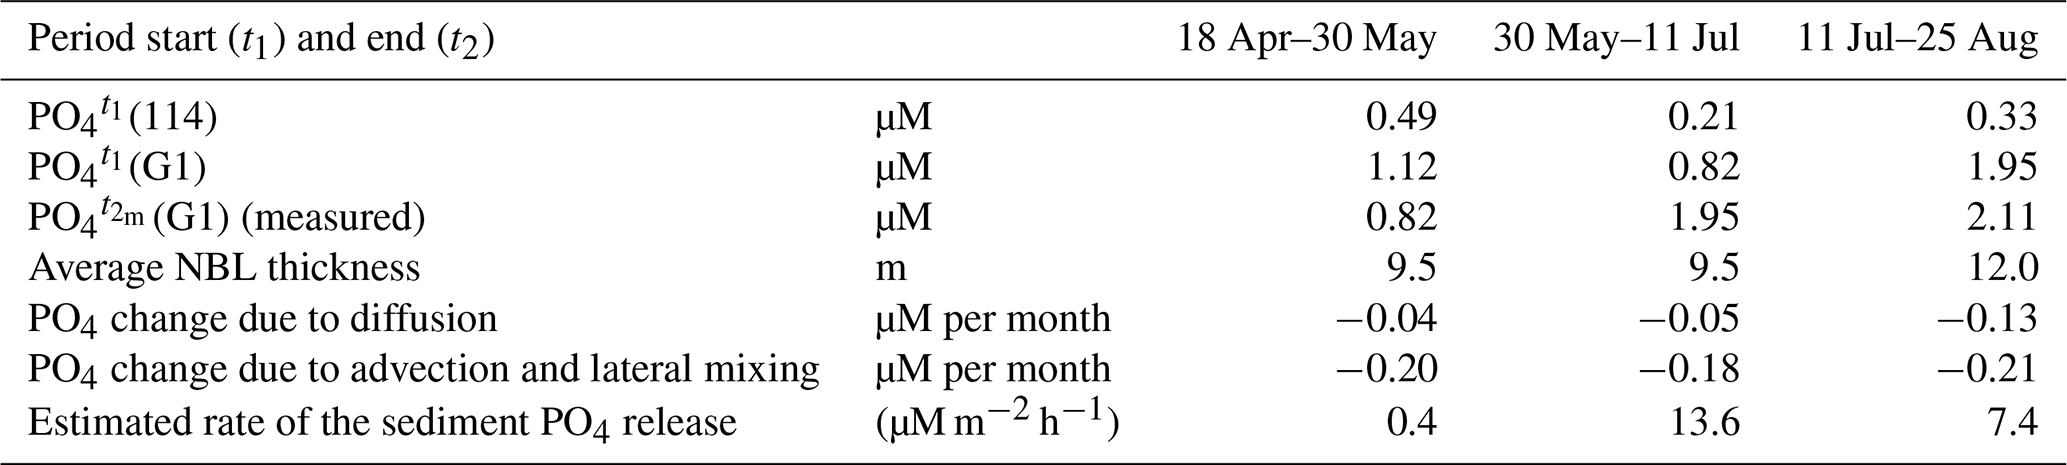
Simultaneously with the development of hypoxia, phosphate concentrations increased in the NBL at station G1 in summer 2018 (Fig. 9). The phosphate concentrations were already elevated in July when oxygen concentrations did not indicate hypoxic conditions at 2–3 m from the seabed. The estimated changes in phosphate concentrations due to lateral advection and mixing and vertical diffusion varied between −0.18 to −0.21 and −0.04 to −0.13 µM per month, respectively (Table 3). Since phosphate concentrations in the NBL continuously increased from spring to late summer (August), the sediment release of phosphates had to be large enough to compensate for the flux by physical processes and maintain the observed accumulation. The largest estimated phosphate flux from the sediments was 13.6 for the period from the end of May to mid-July 2018. From late April to late May, the phosphate flux from the sediments was minimal, which might be explained by relatively high oxygen concentrations in the NBL. Although the oxygen concentrations decreased and fell below the hypoxia threshold from mid-July to late August, the estimated sediment release for this period was lower (7.4 ) than from late May to mid-July.
Declining oxygen levels and more frequent hypoxia have been reported in many coastal environments, including the Baltic Sea (Caballero-Alfonso et al., 2015; Carstensen et al., 2014; Conley et al., 2009). We found a similar tendency in the Gulf of Riga with more frequent hypoxia in recent years and a statistically significant decreasing trend of deep layer oxygen concentrations (based on data in autumn 2005–2018). Thus, in general, we can state that the observed extensive hypoxia in 2018 was in agreement with the long-term changes in the GoR oxygen dynamics (Berzinsh, 1995; HELCOM, 2009). However, the reasons behind the largest extent of hypoxia, as observed in 2018, need further explanation.
It is well documented that the main causes of near-bottom hypoxia are elevated nutrient inputs, leading to high oxygen demand for organic matter decomposition, and topographic–hydrographic characteristics of coastal areas, restricting oxygen supply by physical processes (Carstensen et al., 2014; Virtanen et al., 2019). If oxygen consumption exceeds oxygen supply by vertical mixing and advection for a long enough period, hypoxia or even anoxia could occur (Fennel and Testa, 2019). Seasonal stratification is a major factor restricting oxygen supply to the near-bottom layer depending on its strength (Kralj et al., 2019) and the duration between its onset and decay (Fennel and Testa, 2019).
In 2018, fast warming of the surface layer and weak wind-induced mixing in spring resulted in strong vertical stratification. The peak of the spring bloom, which generates most of the sedimented organic material, is observed in the Gulf of Riga in April–May (Olli and Heiskanen, 1999; Purina et al., 2018). When the spring bloom material reaches the sediment surface, it triggers enhanced oxygen consumption, with the rate and delay depending on the bloom species composition, e.g., diatom-to-dinoflagellate ratio (Spilling et al., 2018). Aigars et al. (2015) found higher consumption rates in late spring–early summer than in late summer–autumn and related this result to the availability of degradable organic material, i.e., settling of spring bloom. Thus, the strength of stratification in spring–early summer is a crucial factor influencing the extent of seasonal hypoxia in the Gulf of Riga and similar coastal basins.
Since oxygen consumption at the sediment–water interface can have a large share in depth-integrated respiration (Boynton et al., 2018), separation of the near-bottom layer from the waters above may accelerate oxygen depletion in the NBL. For instance, Jokinen et al. (2018) suggested that a decrease in the water volume between the pycnocline and the seabed increased the probability of hypoxia occurrences in a shallow basin of the Archipelago Sea (Haverö). We suggest that besides the strong seasonal stratification and reduced vertical mixing, the haline stratification in the deep layer that already existed in spring was a crucial precondition for hypoxia development in 2018. A similar thin near-bottom layer with higher salinity was observed in early summer 2014, and in both years, summer deoxygenation was higher compared to other years. The year 2018 was specific since additional inflows of saltier waters in summer caused an uplift of the almost oxygen-depleted near-bottom waters. As a consequence, the boundary of hypoxic waters was at its shallowest depth, and the estimated extent of hypoxic bottoms was the largest in late summer–autumn 2018. Thus, although the development of hypoxia in 2018 was in accordance with the long-term trend, the co-occurrence of several factors made it an exceptional event.
Based on the introduced method, we estimated the oxygen consumption rate at 1.67 for spring–summer 2018. This result is higher than the estimates of consumption rates obtained for the Baltic Proper and the Gulf of Finland – 0.11–0.39 (Koop et al., 1990) and 0.46–0.53 (Conley et al., 1997), respectively, and closer to but slightly lower than the estimates based on the direct measurements in the Gulf of Riga by Aigars et al. (2015) – on average 2.3 . On the other hand, our estimates are much higher than found for the deep areas of the Baltic Proper, although it is stated that the consumption rates there have accelerated recently (Meier et al., 2018). We used the estimated consumption rate to explain the occurrence of hypoxia in 2015 with relatively weak stratification and suggest that seasonal stratification lasted long enough to reach hypoxia levels in late October 2015. No hypoxia was observed in 2016, although seasonal stratification was strong at its peak, because the water column was fully mixed before the autumn monitoring cruise in late October. We suggest that a longer duration of the stratified season in recent years, as also revealed by other authors, e.g., Wasmund et al. (2019), has increased the probability of hypoxia occurrences in the near-bottom layer of seasonally stratified coastal basins in autumn.
We analyzed the seasonal dynamics of vertical stratification depending on the local meteorological conditions to reveal the potential development of near-bottom oxygen conditions due to predicted climate changes. Stratification has strengthened in the Baltic Sea mostly due to increased surface layer temperature (Kniebusch et al., 2019; Liblik and Lips, 2019). In our assessment of the development of vertical stratification, according to Simpson et al. (1990), the surface heat flux and wind-induced mixing were the main contributors to its changes. River runoff had, in general, a lower contribution, although its influence was seen, e.g., in early spring 2013, which was the year with the highest river discharge (considering the period 2012–2018).
Earlier modeling studies have stated that possible future changes in climate, including warming that causes the strengthening of stratification and decreased oxygen solubility, and changes in precipitation/river runoff, influence the extent of hypoxia in the Baltic Sea (Meier et al., 2011). Strengthening of vertical stratification is predicted by the projected future increase in sea surface temperatures (Gröger et al., 2019; Meier and Saraiva, 2020; Saraiva et al., 2019b). Also, an increase in the total runoff to the Baltic Sea is predicted (Saraiva et al., 2019a, b), which could lead to a decrease in surface salinity, but these predictions are uncertain. Although climate projections for wind are uncertain in the Baltic Sea area (Christensen et al., 2015), a slight decrease in wind speed in spring is expected (Ruosteenoja et al., 2019). Lower wind speed reduces vertical mixing and enhances stratification. Thus, in general, the future projections seem to favor a strengthened stratification regime. When also considering a predicted winter river runoff increase due to intermittent melting (Stonevičius et al., 2017) – which would potentially bring additional nutrients and organic matter to the sea (Yurkovskis, 2004) – hypoxic events in the future would probably occur more often and perhaps be even more severe.
Although phosphorus inputs into the Gulf of Riga have decreased (HELCOM, 2018b), they are still higher than the maximum allowable inputs by about 1000 t yr−1 (HELCOM, 2022). Our analysis of the long-term nutrient data revealed a statistically significant increasing trend in near-bottom phosphate and total phosphorus concentrations in the stratified season. A negative correlation between the near-bottom phosphate and oxygen concentrations points to the internal load – the release of phosphates from the bottom sediments under low oxygen concentrations (van Helmond et al., 2020; Pitkänen et al., 2001). This result agrees with other studies based on long-term monitoring and targeted research data stating that the phosphorus dynamics in the Baltic Sea basins is largely defined by the meteorological and hydrographic conditions (Lehtoranta et al., 2017; Lips et al., 2017). Such internal phosphorus load also supports cyanobacterial nitrogen fixation and, thus, counteracts not only external phosphorus load reduction but also external nitrogen load reduction (Savchuk, 2018).
Based on the indirect method suggested in this study, the estimated phosphate fluxes from sediments reached up to 13.5 from the end of May to mid-July 2018. This estimate agrees with the earlier studies in the Gulf of Riga by Eglīte et al. (2014) and Aigars et al. (2015) and in the Gulf of Finland, e.g., by Pitkänen et al. (2001), who obtained a flux estimate of 13 or 17 . The observed increase in phosphate concentrations in the NBL in summer 2018, already before hypoxia development, agrees with the results by Aigars et al. (2015), showing that the phosphate flux did increase substantially at oxygen concentration < 6 mg L−1. They also found that the average phosphate fluxes from sediments gradually increased from low values of 2–5 in April–May to 55 in October 2012. Our maximum flux estimates from late May to mid-July are close to the values obtained by Aigars et al. (2015) in June–August, but we did not observe a further substantial increase in NBL phosphate concentrations in late summer–autumn 2018. The latter could indicate that almost all mobile phosphorus is released from the surface sediments in low-oxygen conditions (e.g., Walve et al., 2018). It is difficult to suggest what has been the major factor causing the observed long-term (2005–2018) increasing trend in near-bottom phosphate concentrations – either the strengthening of stratification and prolongation of the stratified season, larger phosphorus flux associated with the near-bottom inflow of saltier waters, or accumulation of mobile phosphorus in the sediments. An indication of increased phosphorus flux from the Baltic Proper is the revealed positive trend in phosphate concentrations in the near-bottom layer of the Irbe Strait. On the other hand, a shorter mixed season in winter could hinder the formation of an Fe-oxide-bound P pool, as suggested by van Helmond et al. (2020) for similar sites in the Stockholm archipelago with relatively low mixing and low bottom water oxygen concentrations in summer.
In conclusion, we suggest that the sequence of certain processes triggered the observed extensive hypoxia in the Gulf of Riga in 2018. Enhanced seasonal stratification was created by the rapid warming of the surface layer and calm wind conditions in spring, leading to restricted vertical mixing. Inflows of saltier waters through the Irbe Strait in spring–early summer maintained haline stratification in the deep layer that additionally constrained vertical mixing. Due to high respiration, hypoxia developed in the entire saltier near-bottom layer separated from the water layers above by the secondary pycnocline. Furthermore, the estimated oxygen consumption rate is large enough to lead to near-bottom hypoxia also in conditions of weaker stratification but a prolonged stratified season. The projections of meteorological and hydrological conditions anticipate that the frequency and extent of hypoxia will likely increase in the future. Since the internal load of phosphorus is linked to the near-bottom oxygen conditions, this scenario also predicts no fast reduction of nutrient concentrations in the Gulf of Riga and similar coastal basins.
Historical and forcing data can be found in databases (see Sect. 2). CTD data can be downloaded or accessed via SeaDataNet (https://www.seadatanet.org, last access: 18 June 2021; organization: Department of Marine Systems at Tallinn University of Technology).
STS was the main responsible person for developing methods, analyzing data, and writing the manuscript. UL and JL contributed to developing methods and writing the manuscript. TL contributed by analyzing the data and reviewing the manuscript. MS provided river inflow and Latvian CTD data and contributed to reviewing the manuscript. OS contributed by collecting and analyzing CTD data. IL contributed by analyzing the nutrient data and reviewing the manuscript.
The contact author has declared that neither they nor their co-authors have any competing interests.
Publisher's note: Copernicus Publications remains neutral with regard to jurisdictional claims in published maps and institutional affiliations.
We thank the agencies and institutes funding and implementing the marine environmental monitoring programs in Estonia and Latvia. Data were provided through the Estonian environmental monitoring information system (KESE), Latvian environmental monitoring database (Latvian Environmental, Geology and Meteorology Center), HELCOM/ICES database, SeaDataNet Pan-European infrastructure for ocean and marine data management, and Copernicus Climate Change Service information. We are thankful to the crew of RV Salme and colleagues who participated in the cruises and data exploration (Ilja Maljutenko for the help with ERA5 data).
This work was supported by the Estonian Ministry of Education institutional research funding (grant no. IUT19-6), the Estonian Research Council (grant no. PRG602), and the joint Baltic Sea research and development program (Art 185) through grant no. 03F0773A (BONUS INTEGRAL).
This paper was edited by Caroline P. Slomp and reviewed by Jacob Carstensen and two anonymous referees.
Aigars, J. and Carman, R.: Seasonal and spatial variations of carbon and nitrogen distribution in the surface sediments of the Gulf of Riga, Baltic Sea, Chemosphere, 43, 313–320, 2001.
Aigars, J., Poikāne, R., Dalsgaard, T., Eglīte, E., and Jansons, M.: Biogeochemistry of N, P and SI in the Gulf of Riga surface sediments: Implications of seasonally changing factors, Cont. Shelf Res., 105, 112–120, 2015.
Astok, V., Otsmann, M., and Suursaar, Ü.: Water exchange as the main physical process in semi-enclosed marine systems: the Gulf of Riga case, Hydrobiologia, 393, 11–18, https://doi.org/10.1023/A:1003517110726, 1999.
Berzinsh, V.: Hydrology, in: Ecosystem of the Gulf of Riga between 1920–1990, edited by: Ojaveer, E., Estonian Academy Publishers, Tallinn, 7–31, ISBN 9985-50-065-2, 1995.
Bindoff, N. L., Cheung, W. W. L., Kairo, J. G., Arístegui, J., Guinder, V. A., Hallberg, R., Hilmi, N., Jiao, N., Karim, M. S., Levin, L., O'Donoghue, S., Cuicapusa, S. R. P., Rinkevich, B., Suga, T., Tagliabue, A., and Williamson, P.: Changing Ocean, Marine Ecosystems, and Dependent Communities, in: IPCC Special Report on the Ocean and Cryosphere in a Changing Climate, edited by: Pörtner, H.-O., Roberts, D. C., Masson-Delmotte, V., Zhai, P., Tignor, M., Poloczanska, E., Mintenbeck, K., Alegría, A., Nicolai, M., Okem, A., Petzold, J., Rama, B., and Weyer, N. M., Cambridge University Press, Cambridge, UK and New York, NY, USA, 447–587, https://doi.org/10.1017/9781009157964.007, 2019.
Bonsdorff, E., Diaz, R. J., Rosenberg, R., Norkko, A., and Cutter Jr, G. R.: Characterization of soft-bottom benthic habitats of the Åland Islands, norther Baltic Sea, Mar. Ecol.-Prog. Ser., 142, 235–245, 1996.
Boynton, W. R., Ceballos, M. A. C., Bailey, E. M., Hodgkins, C. L. S., Humphrey, J. L., and Testa, J. M.: Oxygen and Nutrient Exchanges at the Sediment-Water Interface: a Global Synthesis and Critique of Estuarine and Coastal Data, Estuar. Coast., 41, 301–333, https://doi.org/10.1007/s12237-017-0275-5, 2018.
Caballero-Alfonso, A. M., Carstensen, J., and Conley, D. J.: Biogeochemical and environmental drivers of coastal hypoxia, J. Marine Syst., 141, 190–199, 2015.
Carstensen, J. and Conley, D. J.: Baltic Sea Hypoxia Takes Many Shapes and Sizes, Limnol. Oceanogr. Bull., 28, 125–129, https://doi.org/10.1002/lob.10350, 2019.
Carstensen, J., Andersen, J. H., Gustafsson, B. G., and Conley, D. J.: Deoxygenation of the Baltic Sea during the last century, P. Natl. Acad. Sci. USA, 111, 5628–5633, 2014.
Christensen, O. B., Kjellström, E., and Zorita, E.: in Second Assessment of Climate Change for the Baltic Sea Basin, in: Second Assessment of Climate Change for the Baltic Sea Basin, edited by: BACC II Author Team, Springer International Publishing, 217–233, https://doi.org/10.1007/978-3-319-16006-1_11, 2015.
Codiga, D. L., Stoffel, H. E., Decautis, C. F., Kiernan, S., and Oviatt, C. A.: Narragansett Bay Hypoxic Event Characteristics Based on Fixed-Site Monitoring Network Time Series: Intermittency, Geographic Distribution, Spatial Synchronicity, and Interannual Variability, Estuar. Coast., 32, 621–641, https://doi.org/10.1007/s12237-009-9165-9, 2009.
Conley, D. J., Stockenberg, A., Carman, R., Johnstone, R. W., Rahm, L., and Wulff, F.: Sediment-water Nutrient Fluxes in the Gulf of Finland, Baltic Sea, Estuar. Coast. Shelf S., 45, 591–598, 1997.
Conley, D. J., Humborg, C., Rahm, L., Savchuk, O. P., and Wulff, F.: Hypoxia in the Baltic Sea and Basin-Scale Changes in Phosphorus Biogeochemistry, Envrion. Sci. Technol., 36, 5315–5320, https://doi.org/10.1021/es025763w, 2002.
Conley, D. J., Carstensen, J., Ærtebjerg, G., Christensen, P. B., Dalsgaard, T., Hansen, J. L. S., and Josefson, A. B.: LONG-TERM CHANGES AND IMPACTS OF HYPOXIA IN DANISH COASTAL WATERS, Ecol. Appl., 17, S165–S184, https://doi.org/10.1890/05-0766.1, 2007.
Conley, D. J., Björck, S., Bonsdorff, E., Carstensen, J., Destouni, G., Gustafsson, B. G., Hietanen, S., Kortekaas, M., Kuosa, H., Meier, H. E. M., Müller-Karulis, B., Nordberg, K., Norkko, A., Nürnberg, G., Pitkänen, H., Rabalais, N. N., Rosenberg, R., Savchuk, O. P., Slomp, C. P., Voss, M., Wulff, F., and Zillén, L.: Hypoxia-Related Processes in the Baltic Sea, Environ. Sci. Technol., 43, 3412–3420, https://doi.org/10.1021/es802762a, 2009.
Conley, D. J., Carstensen, J., Aigars, J., Axe, P., Bonsdorff, E., Eremina, T., Haahti, B.-M., Humborg, C., Jonsson, P., Kotta, J., Lännegren, C., Larsson, U., Maximov, A., Medina, M. R., Lysiak-Pastuszak, E., Remeikaitė-Nikienė, N., Walve, J., Wilhelms, S., and Zillén, L.: Hypoxia Is Increasing in the Coastal Zone of the Baltic Sea, Environ. Sci. Technol., 45, 6777–6783, https://doi.org/10.1021/es201212r, 2011.
Diaz, R. J. and Rosenberg, R.: Spreading Dead Zones and Consequences for Marine Ecosystems, Science (80-.), 321, 926–929, https://doi.org/10.1126/science.1156401, 2008.
Eglīte, E., Lavrinovičs, A., Müller-Karulis, B., Aigars, J., and Poikāne, R.: Nutrient turnover at the hypoxic boundary: flux measurements and model representation for the bottom water environment of the Gulf of Riga, Baltic Sea, Oceanologia, 56, 711–735, 2014.
EMODnet Bathymetry Consortium: EMODnet Digital Bathymetry (DTM), https://sextant.ifremer.fr/record/bb6a87dd-e579-4036-abe1-e649cea9881a/ (last access: 28 April 2021), 2020.
Estonian Environment Agency: KESE [data set], https://kese.envir.ee/kese/, last access: 4 April 2019.
Estonian Weather Service: Hydrological data [data set], https://www.ilmateenistus.ee/siseveed/ajaloolised-vaatlusandmed/vooluhulgad/, last access: 23 March 2022.
Fennel, K. and Testa, J. M.: Biogeochemical Controls on Coastal Hypoxia, Annu. Rev. Mar. Sci., 11, 105–130, https://doi.org/10.1146/annurev-marine-010318-095138, 2019.
Groeskamp, S. and Iudicone, D.: The Effect of Air-Sea Flux Products, Shortwave Radiation Depth Penetration, and Albedo on the Upper Ocean Overturning Circulation, Geophys. Res. Lett., 45, 9087–9097, https://doi.org/10.1029/2018GL078442, 2018.
Gröger, M., Arneborg, L., Dieterich, C., Höglund, A., and Meier, H. E. M.: Summer hydrographic changes in the Baltic Sea, Kattegat and Skagerrak projected in an ensemble of climate scenarios downscaled with a coupled regional ocean–sea ice–atmosphere model, Clim. Dynam., 53, 5945–5966, https://doi.org/10.1007/s00382-019-04908-9, 2019.
Gustafsson, B. G., Schenk, F., Blenckner, T., Eilola, K., Meier, H. E. M., Müller-Karulis, B., Neumann, T., Ruoho-Airola, T., Savchuk, O. P., and Zorita, E.: Reconstructing the Development of Baltic Sea Eutrophication 1850–2006, Ambio, 41, 534–548, 2012.
Hansson, M. and Viktorsson, L.: REPORT OCEANOGRAPHY No. 70, 2020. Oxygen Survey in the Baltic Sea 2020 – Extent of Anoxia and Hypoxia, SMHI, ISSN 0283-1112, 1960–2020, 2020.
HELCOM: Environment of the Baltic Sea area 1994–1998, Balt. Sea Environ. Proc. No. 82B, Helsinki Commission, ISSN 0357-2994, 215, 2002.
HELCOM: Eutrophication in the Baltic Sea – An Integrated thematic assessment of the effects of nutrient enrichment and eutrophication in the Baltic Sea region, Balt. Sea Environ. Proc. No. 115B, Helsinki Commission, ISSN 0357-2994, 148, 2009.
HELCOM: Manual for the Marine Monitoring in the COMBINE Programme of HELCOM, https://helcom.fi/action-areas/monitoring-and-assessment/monitoring-guidelines/combine-manual/ (last access: 21 June 2021), 2017.
HELCOM: HELCOM Thematic assessment of eutrophication 2011-2016. Baltic Sea Environment Proceedings No. 156, Baltic Marine Environment Protection Commission, ISSN 0357-2994, 2018a.
HELCOM: Sources and pathways of nutrients to the Baltic Sea. Baltic Sea Environment Proceedings No. 153, Baltic Marine Environment Protection Commission, ISSN 0357-2994, 2018b.
HELCOM: State of the Baltic Sea – Second HELCOM holistic assessment 2011–2016. Baltic Sea Environment Proceedings 155, Baltic Marine Environment Protection Commission, ISSN 0357-2994, 2018c.
HELCOM: Inputs of nutrients to the sub-basins (2019), HELCOM core indicator report, https://helcom.fi/wp-content/uploads/2017/06/HELCOM-core-indicator-on-inputs-of-nutrients-for-period-1995-2019.pdf (last access: 10 January 2022), 2022.
Hersbach, H., Bell, B., Berrisford, P., Biavati, G., Horányi, A., Muñoz Sabater, J., Nicolas, J., Peubey, C., Radu, R., Rozum, I., Schepers, D., Simmons, A., Soci, C., Dee, D., and Thépaut, J.-N.: ERA5 hourly data on single levels from 1979 to present, Copernicus Clim. Chang. Serv. Clim. Data Store [data set], https://doi.org/10.24381/cds.adbb2d47, 2018.
Hoy, A., Hänsel, S., and Maugeri, M.: An endless summer: 2018 heat episodes in Europe in the context of secular temperature variability and change, Int. J. Climatol., 40, 6315–6336, https://doi.org/10.1002/joc.6582, 2020.
ICES: Oceanographic database [data set], https://www.ices.dk/data/dataset-collections/pages/default.aspx, last access: 16 April 2019.
IOC, SCOR and IAPSO: The International Thermodynamic Equation of Seawater – 2010: Calculation and Use of Thermodynamic Properties, Intergovernmental Oceanographic Commission, Manuals and Guides No. 56, UNESCO (English), 196 pp., 2010.
Jansson, A., Klais-Peets, R., Grinienė, E., Rubene, G., Semenova, A., Lewandowska, A., and Engström-Öst, J.: Functional shifts in estuarine zooplankton in response to climate variability, Ecol. Evol., 10, 11591–11606, https://doi.org/10.1002/ece3.6793, 2020.
Johansson, J.: Total and regional runoff to the Baltic Sea, HELCOM Balt. Sea Environ. Fact Sheets, Online, Helsinki Commission, https://helcom.fi/media/documents/BSEFS_Total-and-regional-runoff-to-the-Baltic-Sea-in-2015.pdf (last access: 9 June 2022), 2016.
Jokinen, S. A., Virtasalo, J. J., Jilbert, T., Kaiser, J., Dellwig, O., Arz, H. W., Hänninen, J., Arppe, L., Collander, M., and Saarinen, T.: A 1500-year multiproxy record of coastal hypoxia from the northern Baltic Sea indicates unprecedented deoxygenation over the 20th century, Biogeosciences, 15, 3975–4001, https://doi.org/10.5194/bg-15-3975-2018, 2018.
Kabel, K., Moros, M., Porsche, C., Neumann, T., Adolphi, F., Andersen, T. J., Siegel, H., Gerth, M., Leipe, T., Jansen, E., and Damsté, J. S. S.: Impact of climate change on the Baltic Sea ecosystem over the past 1,000 years, Nat. Clim. Change, 2, 871–874, 2012.
Karlson, K., Rosenberg, R., and Bonsdorff, E.: Temporal and spatial large-scale effects of eutrophication and oxygen deficiency on benthic fauna in Scandinavian and Baltic waters: a review, edited by: Gibson, R. N. et al. Oceanogr. Mar. Biol. Ann. Rev., 40, 427–489, 2002.
Kniebusch, M., Meier, H. E. M., Neumann, T., and Börgel, F.: Temperature Variability of the Baltic Sea Since 1850 and Attribution to Atmospheric Forcing Variables, J. Geophys. Res.-Oceans, 124, 4168–4187, https://doi.org/10.1029/2018JC013948, 2019.
Koop, K., Boynton, W. R., Wulff, F., and Carman, R.: Sediment-water oxygen and nutrient exchanges along a depth gradient in the Baltic Sea, Mar. Ecol. Prog. Ser., 63, 65–77, 1990.
Kralj, M., Lipizer, M., Čermelj, B., Celio, M., Fabbro, C., Brunetti, F., Francé, J., Mozetič, P., and Giani, M.: Hypoxia and dissolved oxygen trends in the northeastern Adriatic Sea (Gulf of Trieste), Deep-Sea Res. Pt. II, 164, 74–88, https://doi.org/10.1016/j.dsr2.2019.06.002, 2019.
Latvian Environment: Geology and Meteorology Center [data set], https://videscentrs.lvgmc.lv/, 2019.
Lehtoranta, J., Savchuk, O. P., Elken, J., Kim, D., Kuosa, H., Raateoja, M., Kauppila, P., Räike, A., and Pitkänen, H.: Atmospheric forcing controlling inter-annual nutrient dynamics in the open Gulf of Finland, J. Marine Syst., 171, 4–20, 2017.
Liblik, T. and Lips, U.: Variability of synoptic-scale quasi-stationary thermohaline stratification patterns in the Gulf of Finland in summer 2009, Ocean Sci., 8, 603–614, https://doi.org/10.5194/os-8-603-2012, 2012.
Liblik, T. and Lips, U.: Stratification Has Strengthened in the Baltic Sea – An Analysis of 35 Years of Observational Data, Front. Earth. Sci., 7, 174, https://doi.org/10.3389/feart.2019.00174, 2019.
Liblik, T., Skudra, M., and Lips, U.: On the buoyant sub-surface salinity maxima in the Gulf of Riga, Oceanologia, 59, 113–128, 2017.
Liblik, T., Naumann, M., Alenius, P., Hansson, M., Lips, U., Nausch, G., Tuomi, L., Wesslander, K., Laanemets, J., and Viktorsson, L.: Propagation of Impact of the Recent Major Baltic Inflows From the Eastern Gotland Basin to the Gulf of Finland, Front. Mar. Sci., 5, 222, https://doi.org/10.3389/fmars.2018.00222, 2018.
Liblik, T., Wu, Y., Fan, D., and Shang, D.: Wind-driven stratification patterns and dissolved oxygen depletion off the Changjiang (Yangtze) Estuary, Biogeosciences, 17, 2875–2895, https://doi.org/10.5194/bg-17-2875-2020, 2020.
Lilover, M.-J., Lips, U., Laanearu, J., and Liljebladh, B.: Flow regime in the Irbe Strait, Aquat. Sci., 60, 253–265, 1998.
Lips, U., Lilover, M.-J., Raudsepp, U., and Talpsepp, L.: Water renewal processes and related hydrographic structures in the Gulf of Riga, in: Hydrographic studies within the Gulf of Riga Project, 1993–1994, edited by: Toompuu, A. and Elken, J., Estonian Marine Institute Report Series No. 1, 1–34, ISBN 9985-9058-0-6, 1995.
Lips, U., Zhurbas, V., Skudra, M., and Väli, G.: A numerical study of circulation in the Gulf of Riga, Baltic Sea. Part I: Whole-basin gyres and mean currents, Cont. Shelf Res., 112, 1–13, 2016.
Lips, U., Laanemets, J., Lips, I., Liblik, T., Suhhova, I., and Suursaar, Ü.: Wind-driven residual circulation and related oxygen and nutrient dynamics in the Gulf of Finland (Baltic Sea) in winter, Estuar. Coast. Shelf S., 195, 4–15, 2017.
Lukkari, K., Leivuori, M., Vallius, H., and Kotilainen, A.: The chemical character and burial of phosphorus in shallow coastal sediments in the northeastern Baltic Sea, Biogeochemistry, 94, 141–162, https://doi.org/10.1007/s10533-009-9315-y, 2009.
Matthäus, W. and Franck, H.: Characteristics of major Baltic inflows—a statistical analysis, Cont. Shelf Res., 12, 1375–1400, https://doi.org/doi:10.1016/0278-4343(92)90060-W, 1992.
Meier, H. E. M. and Saraiva, S.: Projected Oceanographical Changes in the Baltic Sea until 2100, Oxford Research Encyclopedia of Climate Science, https://doi.org/10.1093/acrefore/9780190228620.013.699, 2020.
Meier, H. E. M., Andersson, H. C., Eilola, K., Gustafsson, B. G., Kuznetsov, I., Müller-Karulis, B., Neumann, T., and Savchuk, O. P.: Hypoxia in future climates: A model ensemble study for the Baltic Sea, Geophys. Res. Lett., 38, L24608, https://doi.org/10.1029/2011GL049929, 2011.
Meier, H. E. M., Väli, G., Naumann, M., Eilola, K., and Frauen, C.: Recently Accelerated Oxygen Consumption Rates Amplify Deoxygenation in the Baltic Sea, J. Geophys. Res.-Oceans, 123, 3227–3240, https://doi.org/10.1029/2017JC013686, 2018.
Murphy, R. R., Kemp, W. M., and Ball, W. P.: Long-Term Trends in Chesapeake Bay Seasonal Hypoxia, Stratification, and Nutrient Loading, Estuar. Coast., 34, 1293–1309, https://doi.org/10.1007/s12237-011-9413-7, 2011.
Ojaveer, E. (Ed.): Ecosystem of the Gulf of Riga between 1920 and 1990, Estonian Academy Publishers, Tallinn, 1995.
Olli, K. and Heiskanen, A.-S.: Seasonal stages of phytoplankton community structure and sinking loss in the Gulf of Riga, J. Marine Syst., 23, 165–184, https://doi.org/10.1016/S0924-7963(99)00056-1, 1999.
Omstedt, A., Meuller, L., and Nyberg, L.: Interannual, Seasonal and Regional Variations of Precipitation and Evaporation over the Baltic Sea, Ambio, 26, 484–492, 1997.
Petrov, V.: Water balance and water exchange between the Gulf of Riga and the Baltic Proper, Sb. Rab. Rizhskoj GO, 18, 20–40, 1979.
Pitkänen, H., Lehtoranta, J., and Räike, A.: Internal Nutrient Fluxes Counteract Decreases in External Load: The Case of the Estuarial Eastern Gulf of Finland, Baltic Sea, Ambio, 30, 195–201, https://doi.org/10.1579/0044-7447-30.4.195, 2001.
Powilleit, M. and Kube, J.: Effects of severe oxygen depletion on macrobenthos in the Pomeranian Bay (southern Baltic Sea): a case study in a shallow, sublittoral habitat characterised by low species richness, J. Sea Res., 42, 221–234, 1999.
Purina, I., Labucis, A., Barda, I., Jurgensone, I., and Aigars, J.: Primary productivity in the Gulf of Riga (Baltic Sea) in relation to phytoplankton species and nutrient variability, Oceanologia, 60, 544–552, https://doi.org/10.1016/j.oceano.2018.04.005, 2018.
Puttonen, I., Mattila, J., Jonsson, P., Karlsson, O. M., Kohonen, T., Kotilainen, A., Lukkari, K., Malmaeus, J. M., and Rydin, E.: Distribution and estimated release of sediment phosphorus in the northern Baltic Sea archipelagos, Estuar. Coast. Shelf S., 145, 9–21, https://doi.org/10.1016/j.ecss.2014.04.010, 2014.
Puttonen, I., Kohonen, T., and Mattila, J.: Factors controlling phosphorus release from sediments in coastal archipelago areas, Mar. Pollut. Bull., 108, 77–86, https://doi.org/10.1016/j.marpolbul.2016.04.059, 2016.
Raudsepp, U. and Elken, J.: Application of the GFDL circulation model for the Gulf of Riga, in: Hydrographic studies within the Gulf of Riga Project, 1993–1994, edited by: Toompuu, A. and Elken, J., Estonian Marine Institute Report Series No. 1, 143–176, ISBN 9985-9058-0-6, 1995.
Reusch, T. B. H., Dierking, J., Andersson, H. C., Bonsdorff, E., Carstensen, J., Casini, M., Czajkowski, M., Hasler, B., Hinsby, K., Hyytiäinen, K., Johannesson, K., Jomaa, S., Jormalainen, V., Kuosa, H., Kurland, S., Laikre, L., MacKenzie, B. R., Margonski, P., Melzner, F., Oesterwind, D., Ojaveer, H., Refsgaard, J. C., Sandström, A., Schwarz, G., Tonderski, K., Winder, M., and Zandersen, M.: The Baltic Sea as a time machine for the future coastal ocean, Sci. Adv., 4, eaar8195, https://doi.org/10.1126/sciadv.aar8195, 2018.
Ruosteenoja, K., Vihma, T., and Venäläinen, A.: Projected Changes in European and North Atlantic Seasonal Wind Climate Derived from CMIP5 Simulations, J. Climate, 32, 6467–6490, https://doi.org/10.1175/JCLI-D-19-0023.1, 2019.
Saraiva, S., Markus Meier, H. E., Andersson, H., Höglund, A., Dieterich, C., Gröger, M., Hordoir, R., and Eilola, K.: Baltic Sea ecosystem response to various nutrient load scenarios in present and future climates, Clim. Dynam., 52, 3369–3387, https://doi.org/10.1007/s00382-018-4330-0, 2019a.
Saraiva, S., Meier, H. E. M., Andersson, H., Höglund, A., Dieterich, C., Gröger, M., Hordoir, R., and Eilola, K.: Uncertainties in Projections of the Baltic Sea Ecosystem Driven by an Ensemble of Global Climate Models, Front. Earth Sci., 6, 244, https://doi.org/10.3389/feart.2018.00244, 2019b.
Savchuk, O. P.: Large-Scale Nutrient Dynamics in the Baltic Sea, 1970–2016, Front. Mar. Sci., 5, https://doi.org/10.3389/fmars.2018.00095, 2018.
Schinke, H. and Matthäus, W.: On the causes of major Baltic inflows – an analysis of long time series, Cont. Shelf Res., 18, 67–97, https://doi.org/10.1016/S0278-4343(97)00071-X, 1998.
Schlitzer, R.: Ocean Data View, [code] https://odv.awi.de (last access: 9 January 2020), 2019.
Schmale, O., Krause, S., Holtermann, P., Power Guerra, N. C., and Umlauf, L.: Dense bottom gravity currents and their impact on pelagic methanotrophy at oxic/anoxic transition zones, Geophys. Res. Lett., 43, 5225–5232, https://doi.org/10.1002/2016GL069032, 2016.
SeaDataNet: SeaDataNet Pan-European infrastructure for ocean and marine data management [data set], http://www.seadatanet.org, last access: 9 April 2019.
Séférian, R., Baek, S., Boucher, O., Dufresne, J.-L., Decharme, B., Saint-Martin, D., and Roehrig, R.: An interactive ocean surface albedo scheme (OSAv1.0): formulation and evaluation in ARPEGE-Climat (V6.1) and LMDZ (V5A), Geosci. Model Dev., 11, 321–338, https://doi.org/10.5194/gmd-11-321-2018, 2018.
Simpson, J. H., Brown, J., Matthews, J., and Allen, G.: Tidal Straining, Density Currents, and Stirring in the Control of Estuarine Stratification, Estuaries, 13, 125–132, https://doi.org/10.2307/1351581, 1990.
Skudra, M. and Lips, U.: Characteristics and inter-annual changes in temperature, salinity and density distribution in the Gulf of Riga, Oceanologia, 59, 37–48, 2017.
Soosaar, E., Maljutenko, I., Raudsepp, U., and Elken, J.: An investigation of anticyclonic circulation in the southern Gulf of Riga during the spring period, Cont. Shelf Res., 78, 75–84, https://doi.org/10.1016/j.csr.2014.02.009, 2014.
Spilling, K., Olli, K., Lehtoranta, J., Kremp, A., Tedesco, L., Tamelander, T., Klais, R., Peltonen, H., and Tamminen, T.: Shifting Diatom—Dinoflagellate Dominance During Spring Bloom in the Baltic Sea and its Potential Effects on Biogeochemical Cycling, Front. Mar. Sci., 5, 92–108, https://doi.org/10.3389/fmars.2018.00327, 2018.
Stiebrins, O. and Väling, P.: Bottom sediments of the Gulf of Riga, Geol. Surv. Latv. Riga, 4, ISBN 9984-9130-0-7, 1996.
Stipa, T., Tamminen, T., and Seppälä, J.: On the creation and maintenance of stratification in the Gulf of Riga, J. Marine Syst., 23, 27–49, 1999.
Stoicescu, S.-T., Lips, U., and Liblik, T.: Assessment of Eutrophication Status Based on Sub-Surface Oxygen Conditions in the Gulf of Finland (Baltic Sea), Front. Mar. Sci., 6, 54, https://doi.org/10.3389/fmars.2019.00054, 2019.
Stonevičius, E., Rimkus, E., Štaras, A., Kažys, J., and Valiuškevičius, G.: Climate change impact on the Nemunas River basin hydrology in the 21st century, Boreal Environ. Res., 22, 49–65, 2017.
Ukrainskii, V. V. and Popov, Y. I.: Climatic and hydrophysical conditions of the development of hypoxia in waters of the northwest shelf of the Black Sea, Phys. Oceanogr., 19, 140, https://doi.org/10.1007/s11110-009-9046-6, 2009.
van Helmond, N. A. G. M., Robertson, E. K., Conley, D. J., Hermans, M., Humborg, C., Kubeneck, L. J., Lenstra, W. K., and Slomp, C. P.: Removal of phosphorus and nitrogen in sediments of the eutrophic Stockholm archipelago, Baltic Sea, Biogeosciences, 17, 2745–2766, https://doi.org/10.5194/bg-17-2745-2020, 2020.
Virtanen, E. A., Norkko, A., Nyström Sandman, A., and Viitasalo, M.: Identifying areas prone to coastal hypoxia – the role of topography, Biogeosciences, 16, 3183–3195, https://doi.org/10.5194/bg-16-3183-2019, 2019.
Walve, J., Sandberg, M., Larsson, U., and Lännergren, C.: A Baltic Sea estuary as a phosphorus source and sink after drastic load reduction: seasonal and long-term mass balances for the Stockholm inner archipelago for 1968–2015, Biogeosciences, 15, 3003–3025, https://doi.org/10.5194/bg-15-3003-2018, 2018.
Wasmund, N., Nausch, G., Gerth, M., Busch, S., Burmeister, C., Hansen, R., and Sadkowiak, B.: Extension of the growing season of phytoplankton in the western Baltic Sea in response to climate change, Mar. Ecol.-Prog. Ser., 622, 1–16, 2019.
Wu, J.: Wind-stress coefficients over sea surface from breeze to hurricane, J. Geophys. Res.-Oceans, 87, 9704–9706, https://doi.org/10.1029/JC087iC12p09704, 1982.
Yurkovskis, A.: Long-term land-based and internal forcing of the nutrient state of the Gulf of Riga (Baltic Sea), J. Marine Syst., 50, 181–197, https://doi.org/10.1016/j.jmarsys.2004.01.004, 2004.
Yurkovskis, A., Wulff, F., Rahm, L., Andruzaitis, A., and Rodriguez-Medina, M.: A Nutrient Budget of the Gulf of Riga; Baltic Sea, Estuar. Coast. Shelf S., 37, 113–127, https://doi.org/10.1006/ecss.1993.1046, 1993.
Zhang, J., Gilbert, D., Gooday, A. J., Levin, L., Naqvi, S. W. A., Middelburg, J. J., Scranton, M., Ekau, W., Peña, A., Dewitte, B., Oguz, T., Monteiro, P. M. S., Urban, E., Rabalais, N. N., Ittekkot, V., Kemp, W. M., Ulloa, O., Elmgren, R., Escobar-Briones, E., and Van der Plas, A. K.: Natural and human-induced hypoxia and consequences for coastal areas: synthesis and future development, Biogeosciences, 7, 1443–1467, https://doi.org/10.5194/bg-7-1443-2010, 2010.