the Creative Commons Attribution 4.0 License.
the Creative Commons Attribution 4.0 License.
 | 08 Sep 2022
Excess radiation exacerbates drought stress impacts on canopy conductance along aridity gradients
Jing Wang
Xuefa Wen
Stomatal conductance (gs) of all coexisting species regulates transpiration in arid and semiarid grasslands prone to droughts. However, the effect of drought stress on canopy conductance (Gs) is debated, and the interactive effects of abiotic and biotic constraints on Gs remain poorly understood. Here, we used 18O enrichment above the source water (Δ18O) of leaf organic matter as a proxy for Gs in order to increase the understanding of these effects. Three grassland transects were established along aridity gradients on the Loess Plateau (LP), the Inner Mongolian Plateau (MP), and the Tibetan Plateau (TP), which differ with respect to solar radiation and temperature conditions. Results showed that Gs consistently decreased with increasing aridity within transects. Gs on the TP was lower than that on the other two plateaus for a given level of aridity due to low temperature and high radiation. The primary determinant of drought stress on Gs was soil moisture (SM) on the LP and MP, whereas it was the vapor pressure deficit (VPD) on the TP. Solar radiation exhibited a consistently negative effect on Gs via drought stress within transects, while temperature had negative effects on Gs on the TP but no effect on the LP or MP. Adding the interaction of leaf area and abiotic factors increases the percentage of explained variability in Gs by 17 % and 36 % on the LP and MP, respectively, although this is not the case on the TP, where the climate exerts an overwhelming effect. These results highlight the need to integrate multiple stressors and plant properties to determine spatial variability in Gs.
- Article
(1282 KB) - Full-text XML
- Companion paper
-
Supplement
(1779 KB) - BibTeX
- EndNote


Stomatal conductance (gs) of all coexisting species plays a significant role in water loss (transpiration) and carbon uptake (photosynthesis) at the ecosystem level, thereby coupling the water and carbon cycles (Jarvis and McNaughton, 1986; Martin-StPaul et al., 2017). Model linkages between gs at the species level and photosynthesis indicate that the biophysical response of gs at the species level varies depending on water, radiation, temperature, and leaf economic traits (Buckley, 2019; Farquhar et al., 1980; Leuning, 1995; Wright et al., 2004). However, experimental evidence has suggested that the strength of the gs species-level responses to changing environmental factors varies with species (Galmes et al., 2007) and that changes in environmental factors can have interactive effects on the variability in gs at the species level (Costa et al., 2015; Doupis et al., 2020; Zeuthen et al., 1997). Plant communities are simultaneously affected in the field by a variety of environmental stressors, and canopy conductance (Gs) is the cumulative rate of gs over time for co-occurring species (Xia et al., 2015). Nevertheless, how interactive effects of multiple environmental stressors and community traits regulate the spatial patterns of Gs remains largely unknown.
Drylands cover 41 % of the Earth's surface (Yao et al., 2020) and drive the variability in the global terrestrial carbon sink (Ahlstrom et al., 2015). The survival, transpiration, and productivity of plants growing in dry areas are simultaneously stressed by drought, high solar radiation, and temperature (Peguero-Pina et al., 2020). In addition, communities respond to drought, solar radiation, and temperature stressors by changing their functional traits (Fyllas et al., 2017; Martin-StPaul et al., 2017); this may ultimately affect Gs. Thus, Gs in drylands is expected to be influenced by the interaction of drought, high radiation, high temperature, and biotic factors.
Gs should be primarily limited by drought, which is often characterized by low soil moisture (SM) and a high vapor pressure deficit (VPD), in drylands (Liu et al., 2020). The limitation of SM and the VPD on gs at the species level involves two independent mechanisms: (1) low SM (available water in the soil for plant root uptake) reduces the soil water potential and hinders the transport of soil water to leaf; (2) a high VPD reduces the leaf water potential and increases the transpiration demand (Buckley, 2019; Oren et al., 1999). However, there is an ongoing debate regarding the relative role of SM and the VPD in determining the response of Gs to drought (Kimm et al., 2020; Liu et al., 2020; Novick et al., 2016). For instance, a global analysis demonstrated that SM stress is the dominant driver of Gs in xeric ecosystems (Novick et al., 2016). However, another study demonstrated that the variability in Gs in rain-fed maize and soybean over a precipitation gradient (283 to 683 mm per growing season) was mainly determined by the VPD stress (Kimm et al., 2020).
Solar radiation and temperature may directly regulate Gs (Buckley, 2019; Farquhar et al., 1980; Leuning, 1995) and adjust drought stress (Costa et al., 2015; Doupis et al., 2020; Zeuthen et al., 1997). However, previous studies have shown that the effects of the direction and intensity of solar radiation and temperature on gs at the species level strongly depend on their distribution range and the relationship with aridity. For example, the response of gs to solar radiation and temperature at the species level generally shows an increasing trend up to optimum values (Xu et al., 2021a), whereas excess radiation (Costa et al., 2015; Doupis et al., 2020; Zeuthen et al., 1997) and a high-temperature-associated high VPD or low SM (Seneviratne et al., 2010) would suppress gs. However, these effects are obscured by drought stress under natural conditions, which alone causes a reduction in gs at the species level (Duan et al., 2008; Fu et al., 2006). Consequently, it is difficult to disentangle whether the decline in Gs with increasing aridity is simply a consequence of drought stress or an interaction of multiple stressors.
Given that gs and photosynthesis are closely correlated at the species level (Leuning, 1995), environmental stressors should have an indirect effect on Gs by regulating community morphological traits. However, few studies have addressed this topic at the community scale, considering both environmental and plant regulators (Wang and Wen 2022a, b, c). Communities change their morphological functional traits to tolerate environmental stress, including leaf area (LA) and specific leaf area (SLA) (Wright et al., 2017). LA and SLA determine a plant's capacity to capture light (Poorter et al., 2009), leaf heat exchange (Wright et al., 2017), and the length of the water pathway through leaves (Kang et al., 2021) – all of which are closely related to transpiration and photosynthesis. Previous studies have focused primarily on the patterns of LA and SLA along environmental gradients (Peppe et al., 2011; Wright et al., 2017). For example, small-leaved species prevail in dry, hot, sunny environments or at high elevations (Wright et al., 2017). SLA generally decreases with increasing radiation and drought stress and increases with decreases in temperature (Poorter et al., 2009). Recently, a study conducted on woody species in eastern Qinghai–Tibet, China, showed that LA and stomatal size covaried with temperature (Kang et al., 2021), indicating that changes in LA and SLA may play important roles in regulating Gs.
To investigate the interactive effect of environmental stressors and biotic factors on Gs, three grassland transects were established along aridity gradients – one on the Loess Plateau (LP), one on the Inner Mongolian Plateau (MP), and one on the Tibetan Plateau (TP) – in arid and semiarid regions of China. The grassland transects span gradients of precipitation, SM, VPD, solar radiation, and temperature, and they provide an ideal platform for the exploration of the interactive effects of multiple stressors and biotic factors on Gs (Table S1 in the Supplement). In addition, the three grassland transects experience different solar radiation and temperature conditions at a given aridity, due to the differences in the geographical locations of the three plateaus. The order of the mean annual temperature and solar radiation across the sites is LP > MP > TP and LP < MP < TP, respectively. We hypothesized that (1) increasing solar radiation and/or air temperature along the aridity gradient will exacerbate drought stress impacts on Gs within transects, (2) high solar radiation and low temperatures will jointly suppress Gs at a given aridity among transects, and (3) integrating environmental stress and community functional traits will significantly improve the capacity for predicting Gs. To test our hypotheses, time-integrated Gs was represented by community-weighted 18O enrichment above the source water of leaf organic matter (Δ18O) (Cabrera et al., 2021; Hirl et al., 2021).
2.1 Study areas
In this study, we established three grassland transects spanning a broad range of climatic conditions and grassland types in arid and semiarid regions (i.e., the Loess Plateau, LP; the Inner Mongolian Plateau, MP; the Tibetan Plateau, TP) in China (Lyu et al., 2021). Transects were 600 km long on the LP, 1200 km on the MP, and 1500 km on the TP. In each transect, we selected 10 sampling sites with increasing aridity from east to west (calculated as 1− mean annual precipitation/potential evapotranspiration). SR and the growing season VPD increased whereas growing season SM decreased with increasing aridity (Table S1). Among transects, differences in aridity (Fig. 1a), precipitation (Figs. 1b, S1a; Table S2), growing season SM (Fig. 1c), community leaf area (Fig. 1h), and SLA (Fig. 1i) were not significant (P>0.05), whereas differences in the VPD (Figs. 1d, S1b; Table S2), SR (Figs. 1e, S1c; Table S2), and air temperature (Figs. 1f, S1d; Table S2) were significant. More details about the characteristics of climate, soil, and vegetation type at the 30 sampling sites can be found in Lyu et al. (2021).

Figure 1Comparison of aridity (a), growing season precipitation (b), soil moisture (SM) (c), vapor pressure deficit (VPD) (d), solar radiation (SR) (e), temperature (f), maximum temperature (Tempmax) (g), community leaf area (h), and specific leaf area (SLA) (i) among transects. The abbreviations used in the figure are as follows: LP – Loess Plateau, MP – Inner Mongolian Plateau, and TP – Tibetan Plateau. Lowercase letters indicate significant differences among transects (P<0.05). Error bars indicate the standard error of the mean; n=10.
2.2 Sampling and measurements
2.2.1 Sample processing
A field survey and sample collection were conducted during the peak growing season (July to August) in 2018. Within each of the 30 sites, we delineated eight 1 m × 1 m plots in a 100 m × 100 m sampling area. Plant species (identified by experienced plant taxonomists), the number of species, and the community structure were surveyed (Table S3). Aboveground biomass was collected by species for dry mass and stable isotope analyses.
2.2.2 Leaf area and specific leaf area analysis
Three individuals per site were collected as replications for each species, and 6–10 fresh, healthy, and mature leaves were selected from individuals of each species for LA determination with a portable scanner (CanoScan LiDE 110, Japan). ImageJ software was used to obtain LA values (Schneider et al., 2012). The leaves were then dried at 60 ∘C and weighed for leaf dry mass. SLA was calculated by dividing LA by leaf dry mass. Dried leaf samples were ground using a ball mill and then oven dried before δ18O analysis.
2.2.3 Stable isotope analysis
An isotope ratio mass spectrometer in continuous-flow mode (253 Plus, Thermo Fisher Scientific, Bremen, Germany) coupled with an elemental analyzer (FLASH 2000 HT, Thermo Fisher Scientific, Bremen, Germany) was used to determine δ18O values (Wang et al., 2021a, b). Isotope ratios are expressed as per mil deviations relative to Vienna Standard Mean Ocean Water (VSMOW) (oxygen) standards. Long-term precision for the instrument was <0.2 ‰ for δ18O measurements. Leaf δ18O at the species level ranged from 12.07 ‰ to 35.35 ‰ on the LP, from 17.42 ‰ to 32.65 ‰ on the MP, and from 12.07 ‰ to 35.35 ‰ on the TP (Fig. S2, Table S4).
We expressed observed leaf δ18O as Δ18O at the species level (Δ18OL) in order to remove the source water effects on leaf δ18O (Guerrieri et al., 2019; Helliker and Richter, 2008; Maxwell et al., 2018):
where δ18OL and δ18OS are the δ18O of the bulk leaf at the species level and source water, respectively. Generally, data on the long-term stem water isotopic composition for each species are not available. As precipitation is the only or the main source of water in dryland ecosystems, we assumed that the amount-weighted δ18O of precipitation during the growing season can reflect the δ18O of source water (Guerrieri et al., 2019; Maxwell et al., 2018). The δ18O of monthly precipitation at each site was simulated using longitude, latitude, and elevation according to Bowen et al. (2005). Δ18O at the species level ranged from 21.69 ‰ to 43.89 ‰ on the LP, from 24.68 ‰ to 41.68 ‰ on the MP, and from 21.69 ‰ to 43.89 ‰ on the TP (Fig. S2, Table S3).
Given that leaf δ18O at the species level is affected by the leaf water evaporation process, variability in stomatal conductance (gs) is expected to be evident in leaf δ18O (Barbour 2007; Barbour and Farquhar 2000; Farquhar et al., 1998). A negative relationship between Δ18O and gs has been observed at both the species (Barbour and Farquhar, 2000; Cabrera-Bosquet et al., 2011; Grams et al., 2007; Moreno-Gutierrez et al., 2012) and canopy (Cabrera et al., 2021; Hirl et al., 2021) scales as well as among communities along soil (Ramirez et al., 2009) and climatic (Keitel et al., 2006) gradients. Consequently, we selected O as a proxy for gs at the species level in this study.
2.3 Community O, LA, and SLA
Plant community parameters (O, LA, and SLA) were defined for each sampling site, and they were calculated as an average of eight quadrats. The respective O, LA, and SLA were scaled from the leaf to community levels as follows:
Here, n is the species richness (number of species) of the community, and BFi is the ratio of aboveground biomass of the ith species to the total aboveground biomass of the community. LAL and SLAL represent values of LA and SLA at the leaf scale. The aboveground biomass of each species was obtained by directly weighing the dried plant tissue per quadrat. Community O was used in this study as a proxy for canopy conductance (Gs) (Cabrera et al., 2021; Hirl et al., 2021). We also derived Gs from gross primary productivity (GPP) and the community ratio of intercellular to atmospheric CO2 partial pressure (Cabrera-Bosquet et al., 2011).
2.4 Auxiliary dataset
Climate variables were obtained from the standard (19-variable) WorldClim Bioclimatic variables for WorldClim version 2 (1 km2; https://www.worldclim.org/, last access: 3 September 2022; Fick and Hijmans, 2017). The growing season (April–October) and annual mean air temperature, maximum temperature, actual water vapor pressure, and cumulative precipitation were calculated from monthly values. The VPD was calculated from the actual water vapor pressure and temperature (Grossiord et al., 2020). The aridity index (calculated as 1 − mean annual precipitation/potential evapotranspiration) was obtained from the Consultative Group for International Agricultural Research Consortium for Spatial Information (CGIAR-CSI; https://cgiarcsi.community/, last access: 3 September 2022). Solar radiation was derived from “A dataset of reconstructed photosynthetically active radiation in China (1961–2014)” (Liu et al., 2017). Soil moisture content within the top 10 cm depth was obtained from the remote-sensing-based surface soil moisture (RSSSM) dataset at a 0.1∘ spatial resolution (Chen et al., 2021) with an approximate 10 d temporal resolution.
2.5 Statistical analysis
Linear regressions were used to describe the patterns of climatic variables and Gs along an aridity gradient (carried out in MATLAB, version 2018b; The Math Works, Inc., 2018). Differences in climate variables among the three transects were tested with a one-way ANOVA with Duncan's post hoc multiple comparisons (SPSS Statistics 20; IBM Corp, 2011). To explore bivariate relationships between each of our hypothesized drivers (water variables and plant attributes) and Gs, we conducted a Pearson correlation analyses using IBM SPSS 20 software. We tested the differences in the slopes and intercepts of the linear regression between Gs and aridity using standardized major axis (SMA) regression fitting (“smatr 3” package in R) (Warton et al., 2012). To determine the interactive effects of climate variables and plant properties on variability in Gs along an aridity gradient, we fitted structural equation models using the “lavaan” package in R (R Foundation for Statistical Computing; R Core Team 2012) based on the current knowledge of the interactive relationships between climate variables, plant properties, and Gs (Figs. S3, 4). We chose the final models with high-fit statistics: comparative fit index >0.95, standardized root-mean-square residual <0.08, and P value >0.8.
3.1 Variability in O along aridity gradients
Bivariate linear regression between community O and aridity showed that O decreased linearly with increasing aridity within transects (Fig. 2a). The SMA regression fitting demonstrated that intercepts of SMA were significantly different from each other (P<0.05), whereas the slopes were not (P>0.05). The order of the intercepts was as follows: LP > MP > TP (P<0.05; Table S5). The intercepts of SMA significantly decreased with increasing growing season SR (P<0.05; Fig. 3b) and significantly increased with increasing growing season temperature (P<0.05; Fig. 3c). Significant differences in community O were found among transects (P<0.001), and the order was LP > MP > TP (Fig. 2b).
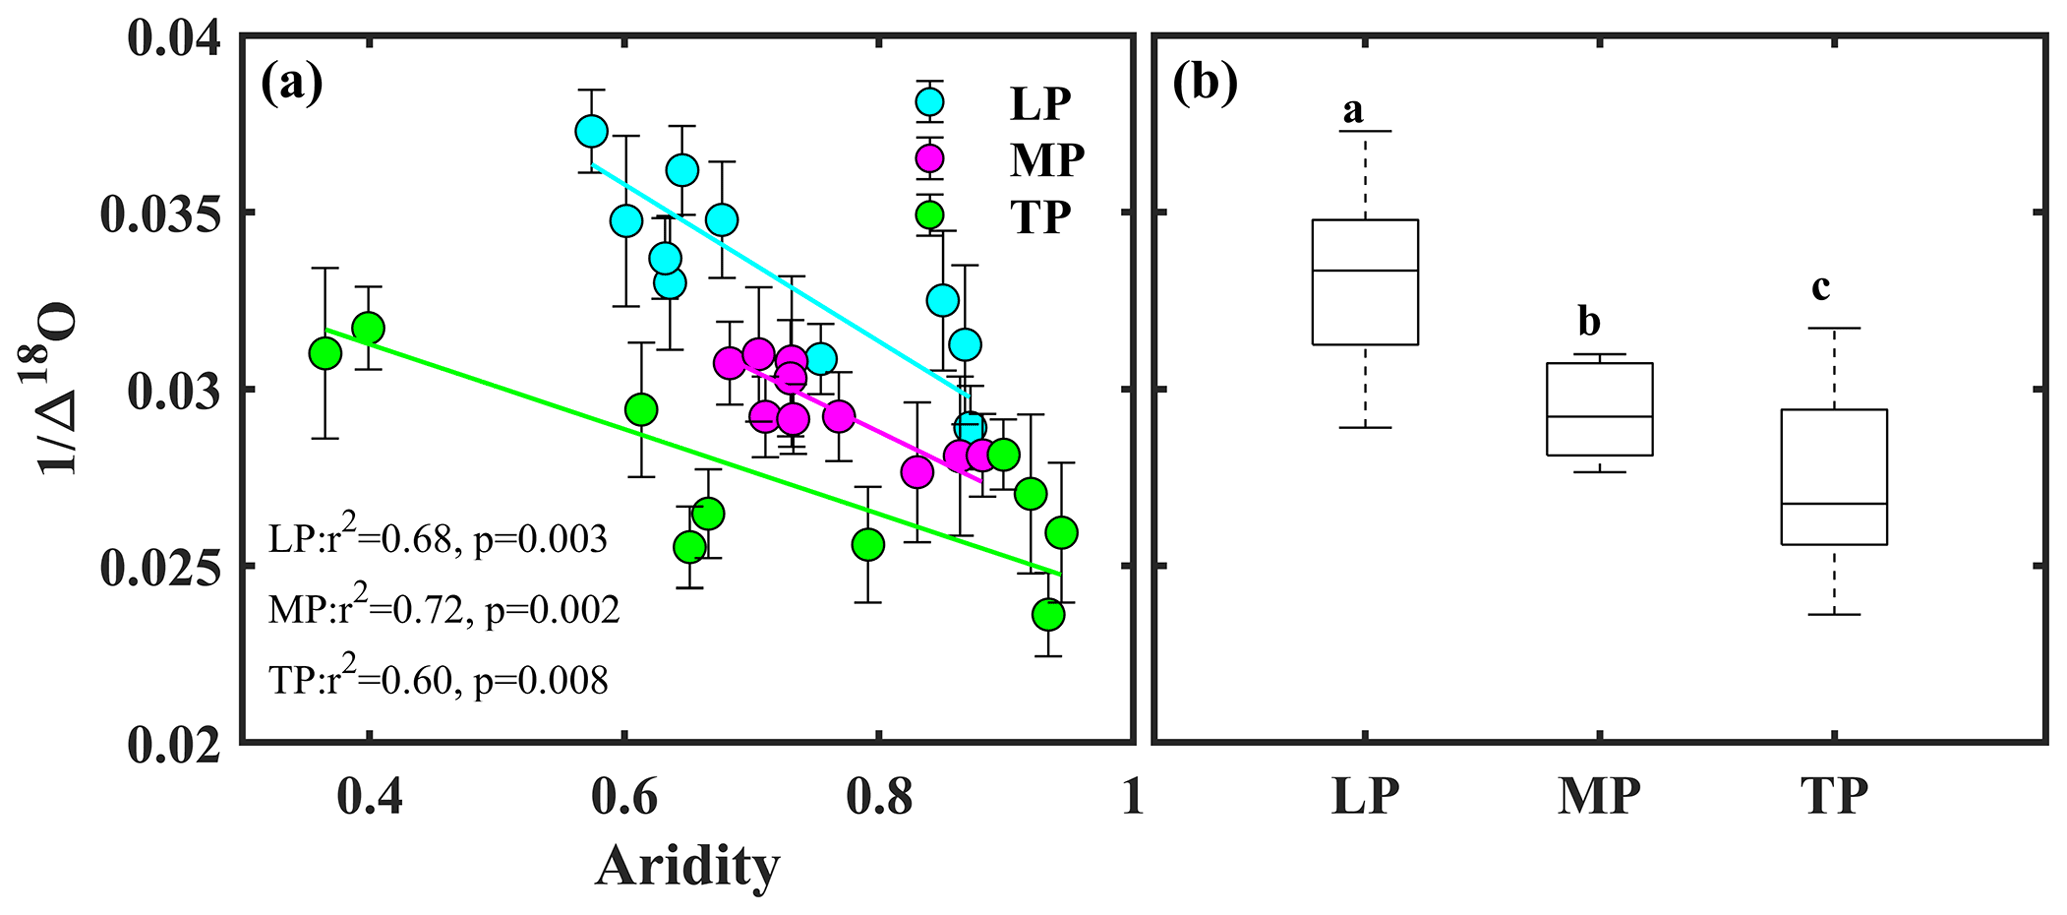
Figure 2Patterns of community O along an aridity gradient (a) within transects and (b) among transects. The different letters in panel (b) indicate significant differences (P<0.001) among transects. Δ18O denotes 18O enrichment above the source water of leaf organic matter, LP represents the Loess Plateau, MP represents the Inner Mongolian Plateau, and TP represents the Tibetan Plateau.
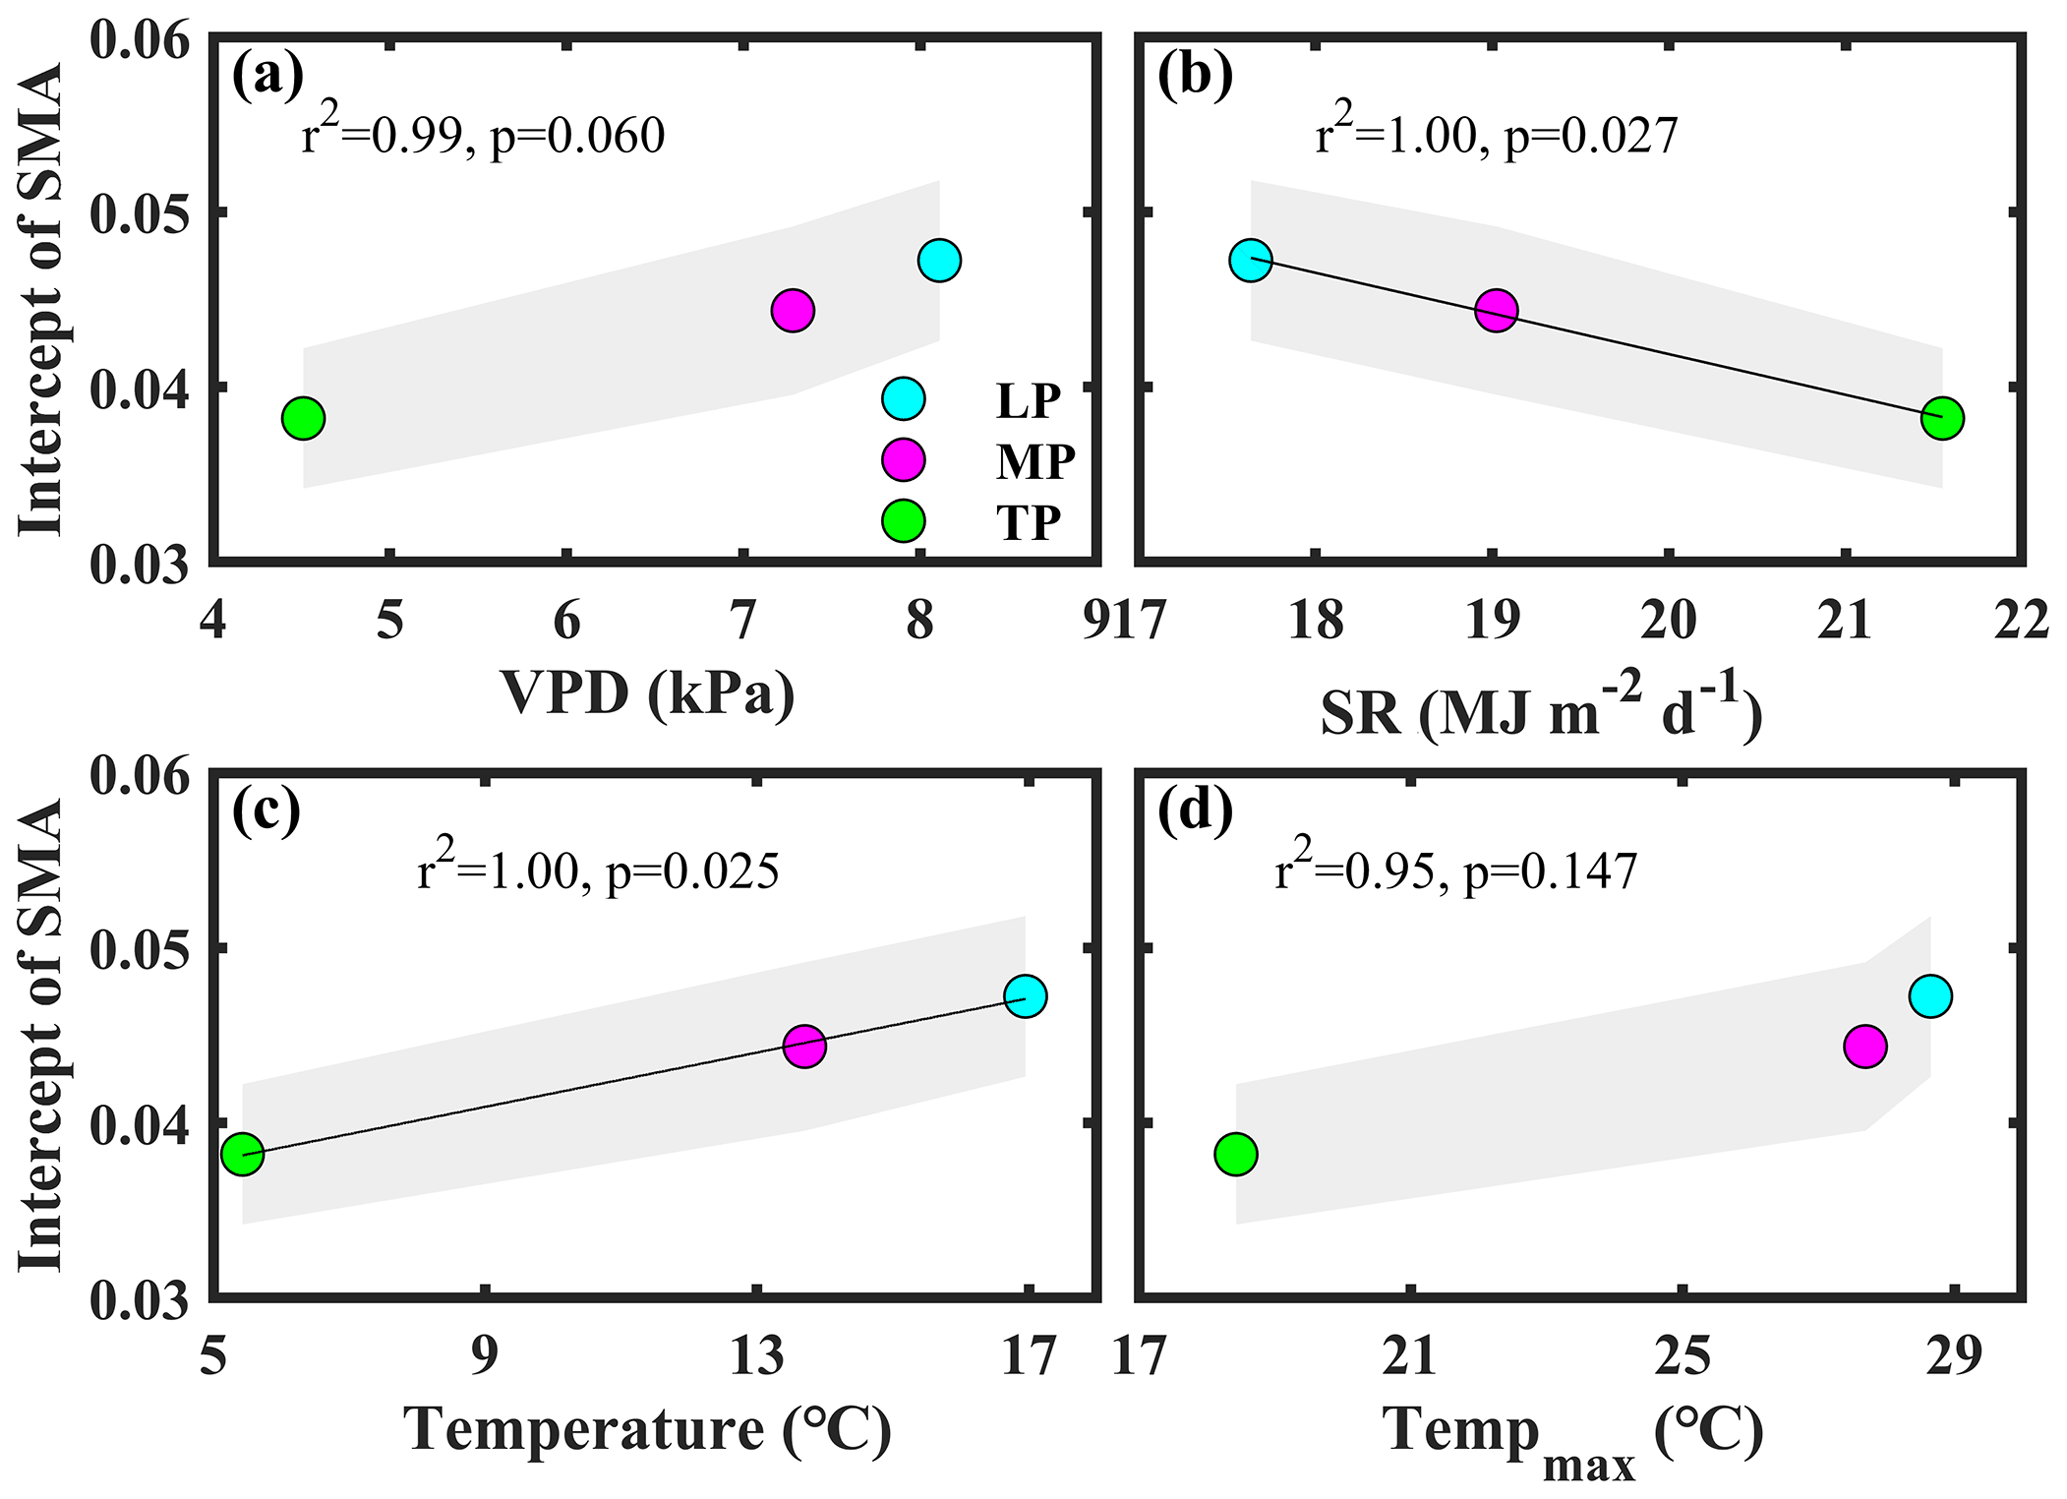
Figure 3Patterns of the intercept obtained from standardized major axis (SMA) analysis among transects. The variables mentioned in the figure are as follows: VPD – vapor pressure deficit, SR – solar radiation, and Tempmax – maximum temperature. LP represents the Loess Plateau, MP represents the Inner Mongolian Plateau, and TP represents the Tibetan Plateau. The shaded area represents the 95 % confidence interval of the SMA intercept.
3.2 Effects of SM and the VPD on the variability in community O
The Pearson correlation analysis showed that community O was positively correlated with SM along aridity gradients within three transects (P<0.05; Table 1), while a significant relationship between O and the VPD was only observed on the TP (P<0.01). Partial correlation analyses showed that O was not related to SM (P>0.05) after controlling for the VPD, indicating that variability in O on the TP was mainly determined by the VPD. SR exhibited negative correlations with O on all three plateaus (P<0.05). Both mean temperature (Tempmean) and Tempmax were significantly and positively correlated with O on the LP (P<0.05), but they were negatively correlated with O on the TP (P<0.05); however, there were no significant correlations between either Tempmean or Tempmax and O on the MP (P>0.05). Positive correlations were found between O and LA on the LP and MP (P<0.05), and negative correlations were found between O and SLA on the TP (P<0.05).
Table 1The Pearson correlation coefficients for correlations of community O with environmental factors and with plant properties.
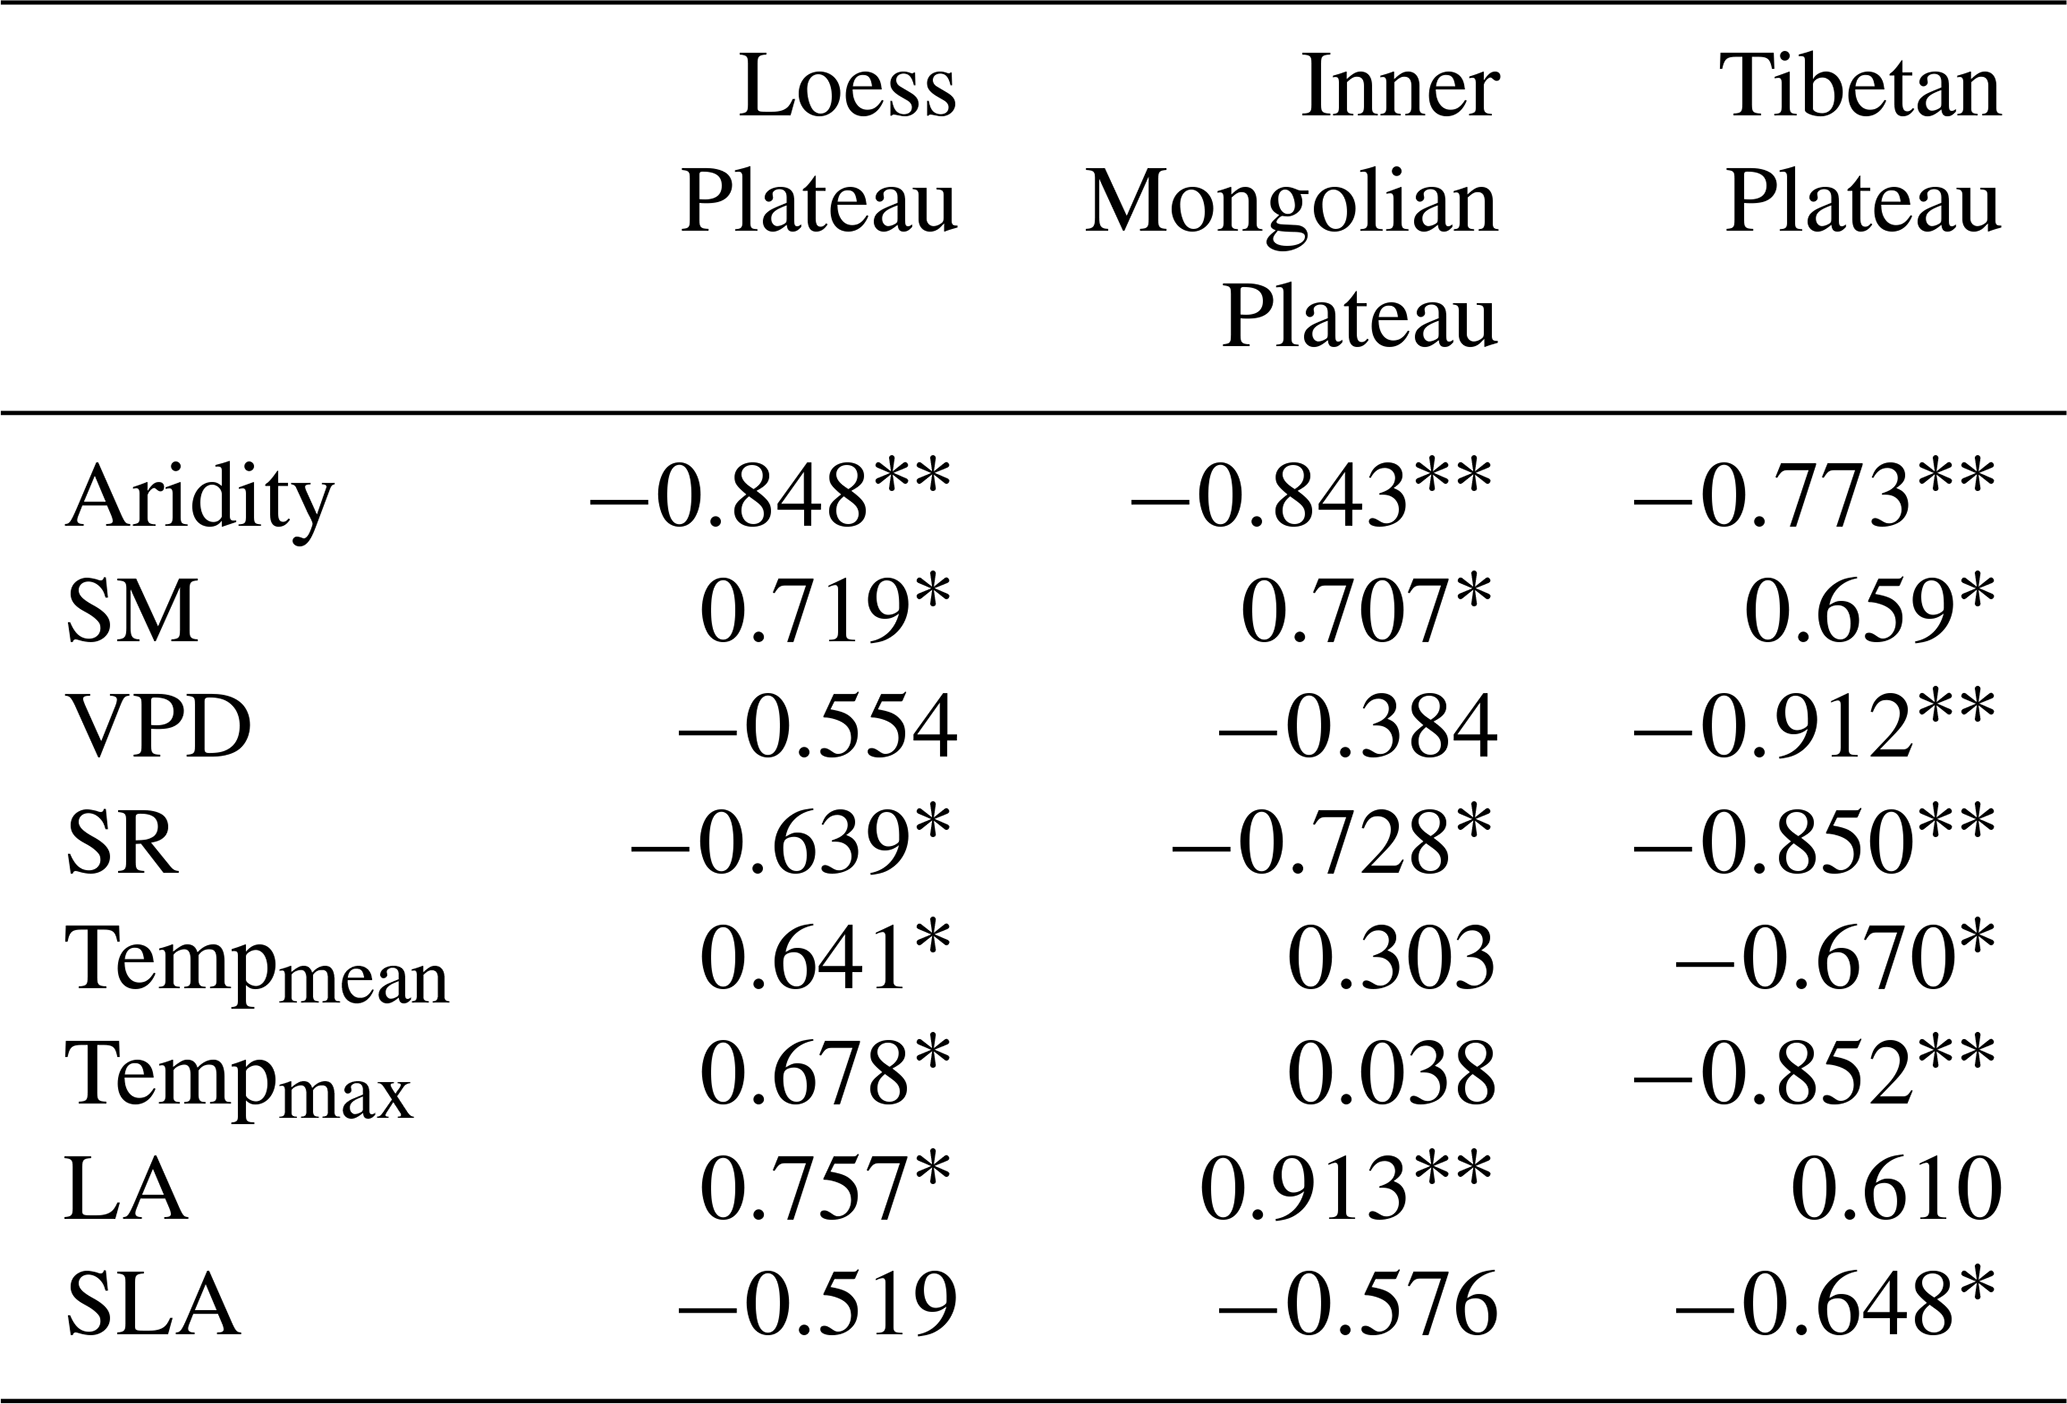
“” denotes P<0.01. “*” denotes P<0.05. The variables listed in the table are as follows: SM – soil moisture, VPD – vapor pressure deficit, SR – total solar radiation, Tempmean – mean temperature, Tempmax – maximum temperature, LA – log-transformed leaf area, and SLA – log-transformed specific leaf area.
The interactive effects of environmental factors (Table 1) on community O within transects were determined with structural equation models (SEMs) (Fig. 4a, b, c). SR, acting via SM, exhibited negative effects on O on the LP (SPCI , where SPCI denotes the standardized path coefficient of indirect effect) (Fig. 4a). Tempmax did not exert a significant effect on O on the LP (P>0.05). SR exhibited a negative indirect effect on O via SM on the MP (SPCI ) (Fig. 4b). The negative indirect effects of SR (SPCI ) and Tempmax (SPCI ) on O via the VPD on the TP were similar (Fig. 4c).
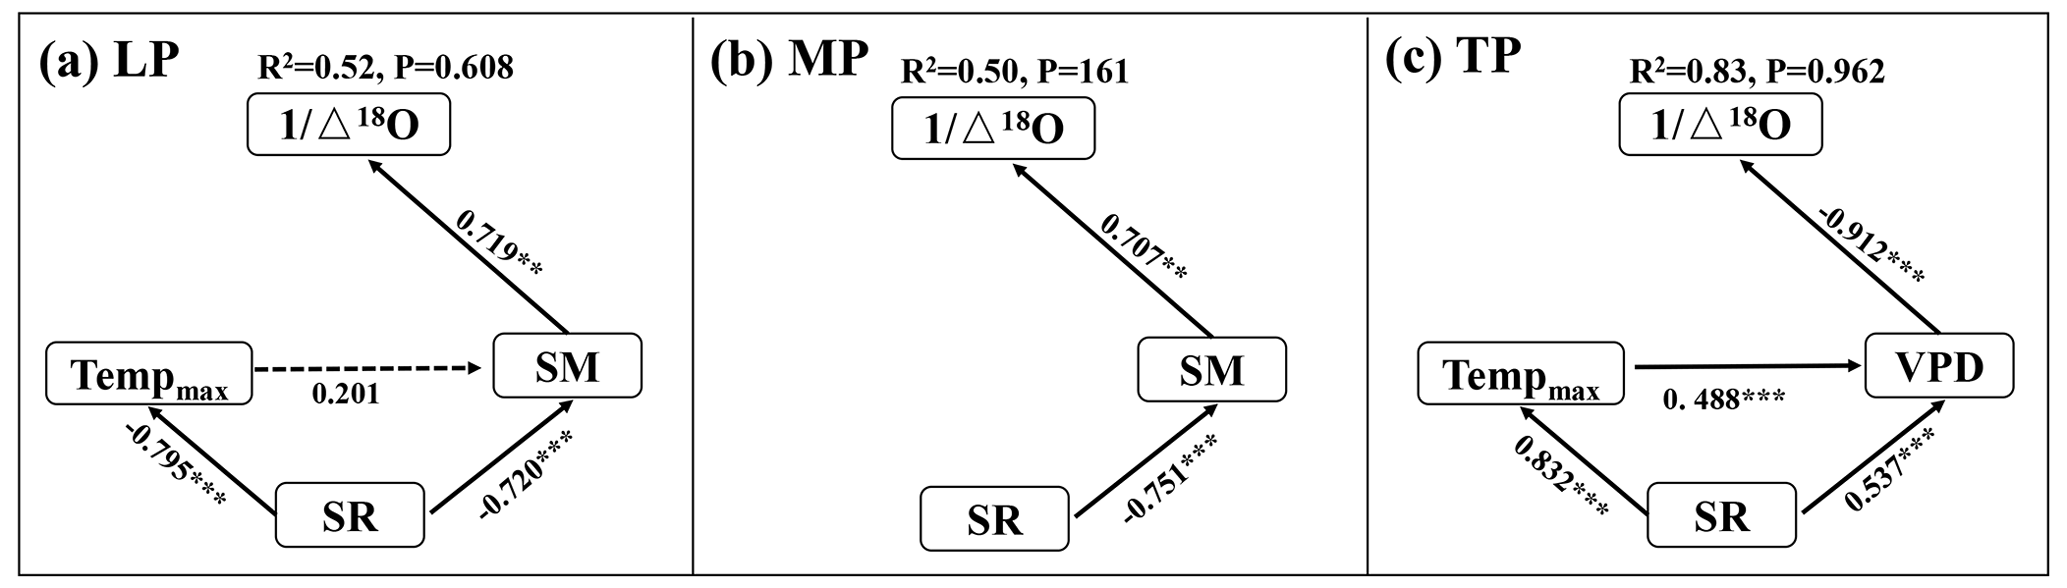
Figure 4Structural equation models of abiotic factors explaining community O on the Loess Plateau (LP) (a), the Inner Mongolian Plateau (MP) (b), and the Tibetan Plateau (TP) (c). The variables mentioned in the figure are as follows: Δ18O – 18O enrichment above the source water of leaf organic matter, Tempmax – maximum temperature, SR – solar radiation, SM – soil moisture, and VPD – vapor pressure deficit. The solid and dashed arrows represent significant and non-significant relationships in a fitted SEM, respectively. “” denotes P<0.001, “” denotes P<0.01, and “*” denotes P<0.05.
3.3 Interactive effects of abiotic and biotic factors on the variability in O
When community LA and SLA were incorporated into the SEM, the community O prediction significantly improved on the LP and MP, but there was no change on the TP (Fig. 5). In particular, LA had a positive effect on O on the LP, and its effect (SPCD = 0.517, where SPCD denotes the standardized path coefficient of direct effect) was slightly larger than that of SM (SPCD = 0.430) (Fig. 5a). LA exhibited a positive direct effect on O on the MP, whereas the effect of SM was not statistically significant (Fig. 5b). However, SLA did not directly affect O on the TP (P>0.05; Fig. 5c).
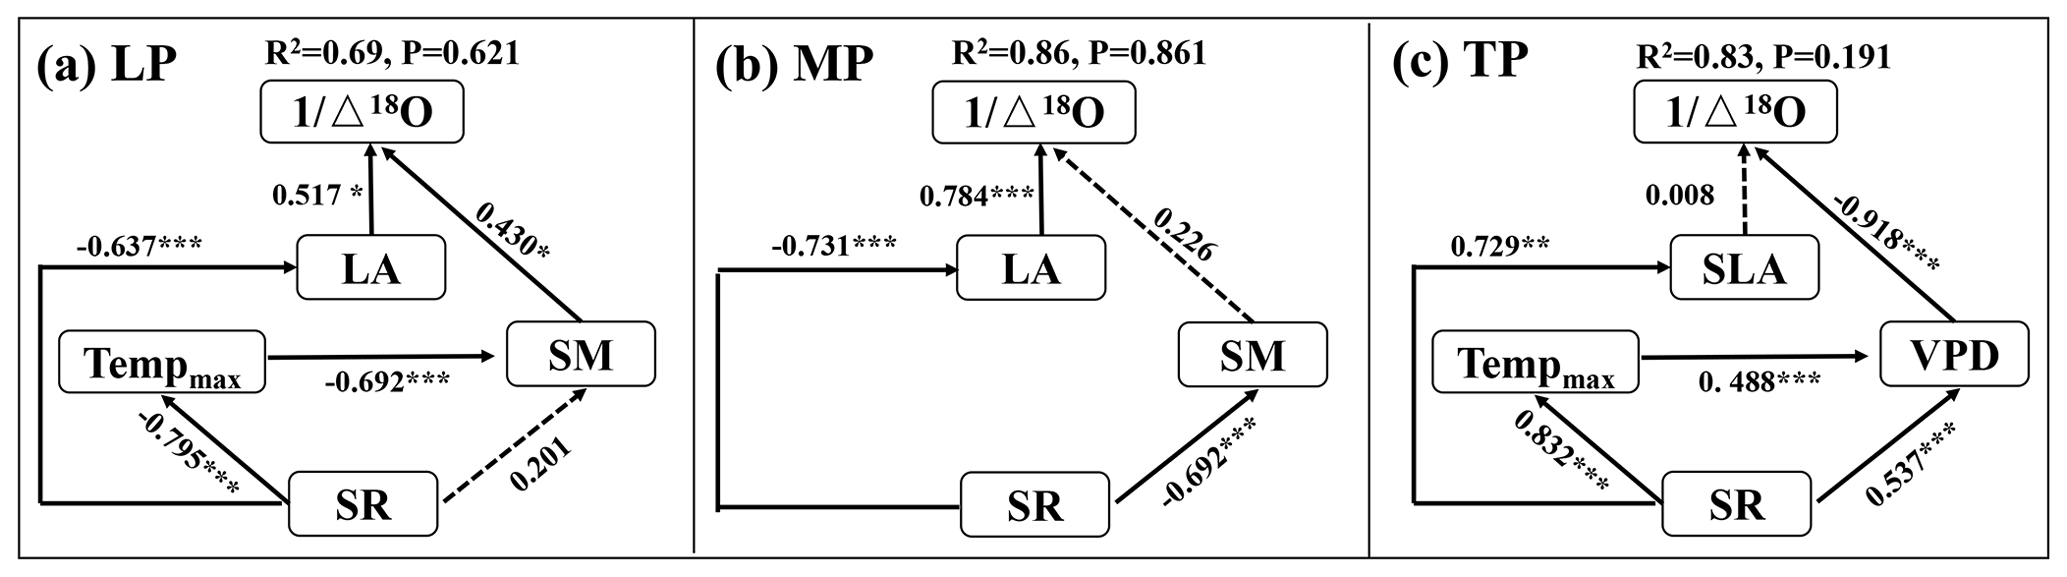
Figure 5Structural equation models of abiotic and biotic factors explaining community O on the Loess Plateau (LP) (a), the Inner Mongolian Plateau (MP) (b), and the Tibetan Plateau (TP) (c). The variables mentioned in the figure are as follows: Δ18O – 18O enrichment above the source water of leaf organic matter, Tempmax – maximum temperature, SR – solar radiation, SM – soil moisture, VPD – vapor pressure deficit, LA – log-transformed leaf area, and SLA – log-transformed specific leaf area. The solid and dashed arrows represent significant and non-significant relationships in a fitted SEM, respectively. “” denotes P<0.001, “” denotes P<0.01, and “*” denotes P<0.05.
4.1 Radiation and temperature regulates variability in canopy conductance within transects via drought stress
Community Δ18O in this study was relatively high (from a low of 26.8 ‰ on the LP to a high of 42.4 ‰ on the TP) (Fig. 2a, Table S1). A previous study conducted in a temperate grassland (mean annual precipitation was 753 mm) reported a Δ18O of 28.2 ‰–30.53 ‰(Hirl et al., 2021). This indicated that the canopy conductance (Gs), presented by community O, was relatively low in this study, and the community reduces Gs in response to drought stress.
The decreasing Gs with aridity within transects was mainly due to drought stress, coupled with the effects of high solar radiation and/or temperature. However, the relative roles of SM and the VPD in restricting Gs along an aridity gradient were different across the three transects (Table 1). In this study, we found that the variability in Gs was limited by SM on the LP and MP, whereas it was mainly limited by the VPD on the TP. In addition, a global meta-analysis demonstrated that ecosystem conductance was mainly limited by low SM at xeric sites and by the VPD at mesic sites (Novick et al., 2016). This indicated that drought stress may be primarily controlled by SM on the LP and MP, but it may be limited by both SM and the VPD on the TP. An eddy covariance study conducted on the TP demonstrated that GPP in the growing season was significantly limited by SM and the VPD; however, the accumulated GPP was primarily determined by SM (Xu et al., 2021b). This may be because the dominant factors of drought stress differ at different spatial and temporal scales.
Solar radiation and temperature regulated within-transect variability in Gs via drought stress (Fig. 4). Solar radiation exhibited consistently negative effects on Gs because it increased with increasing aridity within the three transects (Fig. 1h, Table S1). These results are consistent with those of Fu et al. (2006), who demonstrated that the net CO2 exchange in grasslands on the MP and shrublands on the TP was significantly reduced by high solar radiation. In this study, solar radiation exhibited a negative effect on Gs via drought stressors (Fig. 4a, b, c). On the one hand, increasing solar radiation can decrease SM by increasing energy partitioning into evaporation and transpiration (Zhang et al., 2019). In fact, solar radiation had negative effects on SM in the three transects in this study (Table S6). On the other hand, increasing solar radiation can increase the VPD by increasing temperatures (Grossiord et al., 2020). However, a positive relationship between temperature and the VPD was only observed on the TP (Table S2).
The within-transect drought stress on Gs was exacerbated by higher temperatures on the TP (Fig. 4c). On the TP, the temperature increased with increasing aridity (Table S1), and it was negatively related to SM and positively related to the VPD (Fig. 4c, Table S6). As with solar radiation, increases in temperature tend to increase evaporation and transpiration, ultimately reducing SM, while the VPD always increases with increasing temperatures (Grossiord et al., 2020; Oren et al., 1999). Consequently, increasing temperatures exacerbate soil and atmospheric drought, ultimately reducing Gs along an aridity gradient on the TP. However, the temperature exhibited negative correlations with community O on the LP, whereas it did not exhibit significant effects on community O in the SEM models (Fig. 4a). The reason for this may be that temperature was significantly correlated with SM on the LP (Table S6).
4.2 Interacting effects of abiotic and biotic factors on the variability in canopy conductance within transects
Our results indicate that solar radiation and temperature indirectly regulated variability in Gs along an aridity gradient within transects via leaf morphological properties. Including LA increased the percentage of explained variability in Gs by 17 % and 36 % on the LP and MP, respectively (Fig. 5a, b), over models which excluded plant variables. This highlights the need to integrate plant properties related to light capture and heat exchange when examining spatial variability in Gs. To the best of our knowledge, this study is the first in which leaf morphological properties have been included to quantify the relative contributions of climatic and vegetation variables on Gs. Specifically, solar radiation exhibited negative effects on Gs via LA on the LP and MP (Fig. 5a, b). Kang et al. (2021) noted that plants tend to balance light capture with damage from high solar radiation. Solar radiation increased with increasing aridity on the LP and MP (Table S6). Consequently, our results demonstrate that communities on the LP and MP prevail by reducing LA to avoid damage at the expense of light capture.
Our earlier preliminary study (Wang and Wen 2022a) demonstrated that gs was significantly affected by LA on the TP at the species level. However, the effect of community LA on Gs was weak (P=0.061; Fig. S5a), and variability in Gs along an aridity gradient was controlled by SLA (Fig. S5b, Table 1). This highlighted the difference in biological drivers of gs at the leaf and canopy scales. Contrary to the results from the dry grassland species in Mediterranean (Prieto et al., 2018) and karst communities in subtropical regions (Wang et al., 2021a), community O significantly decreased with SLA in this study (Fig. S5, Table S1). This indicates that the traditional leaf economic spectrum theory may not be supported at the community level on the TP due to multiple environmental stressors. SLA generally decreases with increasing solar radiation and increases with temperature and water availability (Poorter et al., 2009). In this study, community SLA was negatively related to soil moisture and positively related to maximum temperature (Table S6), indicating that changes in community SLA were mainly controlled by maximum temperature. However, the direct effect of SLA on Gs in the structural equation was not significant (Fig. 5c). This effect may be obscured by drought stress.
4.3 Differences in canopy conductance among transects
Significant differences in community O for a given level of aridity were found among transects (Fig. 2a). Among transects, only the differences in the VPD, solar radiation, and temperature were significant (P>0.05; Figs. 1, S1). In general, plants decrease their gs at the species level to respond to an increasing VPD (Grossiord et al., 2020). The intercept of the linear regression between aridity and community O decreased with a decreasing VPD among transects (P>0.05; Fig. 3a). This indicated that the difference in the VPD was not a contributor to the difference in Gs among transects.
The differences in Gs among transects may be attributed to the direct effects of solar radiation and temperature on Gs and photosynthesis (Yu et al., 2002). Solar radiation exhibited a negative effect on the intercept of the linear regression between aridity and community O among transects (P<0.05; Fig. 3b). Excess ultraviolet-B radiation (Duan et al., 2008), insufficient thermal dissipation, and enhanced photorespiration under high solar radiation (Cui et al., 2003) can decrease photosynthesis, ultimately reducing gs at the species level. For example, Yu et al. (2002) observed that photosynthesis in wheat on the TP was lower at the leaf level than that on the North China Plain due to the high solar radiation on the TP.
The transect with a low temperature exhibited a low intercept of the linear regression between aridity and community O (Fig. 3c), indicating that Gs differences among transects were also inhibited by low temperature. Generally, photosynthesis and Gs increased with temperature below the optimum temperature (Xu et al., 2021a). For example, the rate of photosynthesis was lower in a cold than in a warm environment (Yu et al., 2002).
4.4 Using community-weighted O as an indicator of canopy conductance
Positive relationships between community O and Gs derived from GPP by Cabrera-Bosquet et al. (2011) (LP: r2=68, p=0.003; MP: r2=0.76, p=0.001; TP: r2= 0.67, p=0.004) indicated that community O is an effective indicator of the growing-season-integrated Gs along aridity gradients (Cabrera et al., 2021; Hirl et al., 2021). However, caution is advised for studies at large scales (Moreno-Gutierrez et al., 2012; Prieto et al., 2018) because leaf Δ18O is influenced by multiple environmental conditions, such as the δ18O of source water, temperature, and VPD (Song et al., 2011).
Interspecific differences in rooting and water acquisition depth and phenology among coexisting species can lead to substantial differences in the δ18O of their water sources (Moreno-Gutierrez et al., 2012). Previous studies have found that the depth of water uptake of co-occurring species in grasslands was commonly located in shallow soil layers throughout dry and wet periods (Bachmann et al., 2015; Hirl et al., 2019; Prieto et al., 2018). Differences in water acquisition depth could be ruled out as a major source of interspecific variation in leaf δ18O in this study (Prieto et al., 2018). However, soil evaporation always exhibited increasing trends with increasing aridity and usually resulted in heavy enrichment in δ18O in the remaining soil water used by plants (Lyu et al., 2021). Longer rainless periods and heavier evaporative enrichment of soil water along the aridity gradient could also contribute to a decreasing trend in community O. Consequently, our results may overestimate the decreasing trend in Gs along the aridity gradient.
The decreasing trend in community Δ18O along aridity gradients may originate from the temperature and VPD via their effects on evaporation and isotopic exchange between water and organic molecules (Barbour and Farquhar, 2000; Helliker and Richter, 2008; Song et al., 2011). For example, the equilibrium fractionation factor for water evaporation is dependent on temperature (Bottinga and Craig, 1968). Temperature and VPD gradients between leaf and ambient air influence the evaporative gradient from leaf to air (Helliker and Richter, 2008; Song et al., 2011). In addition, biochemical 18O-fractionation during cellulose synthesis is sensitive to temperature, and the proportion of oxygen in cellulose derived from source water is sensitive to humidity (Hirl et al., 2021).
The potential effects of temperature and the VPD on Δ18O via evaporation and isotopic exchange between water and organic molecules could be ruled out in this study. The growing season temperature variation was small along three transects (LP = 3.3 ∘C, MP = 4.9 ∘C, and TP = 3.8 ∘C; Table S1). However, community Δ18O ranged from 3.89 ‰ on the MP to 7.78 ‰ on the LP (Table S1, Fig. 2a). Previous studies have demonstrated that the sensitivity of temperature to Δ18O was approximately 0.23 ‰ ∘C−1 (Helliker and Richter, 2008; Song et al., 2011). It seems that the changes in temperature were not a main contributor to the large variability in community Δ18O. Meanwhile, a positive relationship between community O and temperature was observed on the LP (P<0.05), and a negative relationship was observed between community O and the VPD on the TP (Table 1). However, partial correlation analyses showed that community O was not related to temperature (P>0.05) nor the VPD after controlling for Gs (data not shown). This indicates that the variability in community O was mainly determined by Gs.
This study highlights the need to integrate multiple stressors and plant properties when determining the spatial variability in Gs and to directly link species-level observations of physiological processes to canopy-level observations of functions at a large spatial scale. Specifically, our results demonstrate that excess radiation and low temperatures interacted to exacerbate drought stress impacts on Gs across transects, while solar radiation exacerbates drought stress impacts on Gs within transects. The effects of drought stress on Gs can be mitigated by decreasing temperatures in warm environments, whereas they can be aggravated by increasing temperatures in cold environments. The primary determinant of drought stress on Gs was soil moisture in LP and MP, whereas it was the vapor pressure deficit on the TP. The ability to predict variability in Gs could be significantly improved by integrating multiple stressors and leaf area on the LP and MP, although this would not be the case for the TP due to an overwhelming effect of climate.
Requests for leaf δ18O and Δ18O data should be directed to Xuefa Wen (wenxf@igsnrr.ac.cn), and requests for leaf area and specific leaf area at the species level should be directed to Nianpeng He (Henp@igsnrr.ac.cn).
The supplement related to this article is available online at: https://doi.org/10.5194/bg-19-4197-2022-supplement.
JW and XW planned and designed the research. JW performed experiments and analyzed data. All authors jointly wrote the manuscript. All co-authors contributed critically to the drafts and gave final approval for publication.
The contact author has declared that none of the authors has any competing interests.
Publisher’s note: Copernicus Publications remains neutral with regard to jurisdictional claims in published maps and institutional affiliations.
We thank the “Functional Trait database of terrestrial ecosystems in China (China_Traits)” for sharing leaf area and specific leaf area data.
This research has been supported by the National Natural Science Foundation of China (grant nos. 41991234 and 32001137).
This paper was edited by Aninda Mazumdar and reviewed by three anonymous referees.
Ahlstrom, A., Raupach, M. R., Schurgers, G., Smith, B., Arneth, A., Jung, M., Reichstein, M., Canadell, J. G., Friedlingstein, P., Jain, A. K., Kato, E., Poulter, B., Sitch, S., Stocker, B. D., Viovy, N., Wang, Y. P., Wiltshire, A., Zaehle, S., and Zeng, N.: The dominant role of semi-arid ecosystems in the trend and variability of the land CO2 sink, Science, 348, 895–899, 2015.
Bachmann, D., Gockele, A., Ravenek, J. M., Roscher, C., Strecker, T., Weigelt, A., and Buchmann, N.: No Evidence of Complementary Water Use along a Plant Species Richness Gradient in Temperate Experimental Grasslands, PLoS One, 10, e0116367, https://doi.org/10.1371/journal.pone.0116367, 2015.
Barbour, M.: Stable oxygen isotope composition of plant tissue: a review, Funct. Plant Biol., 34, 83–94, 2007.
Barbour, M. M. and Farquhar, G. D.: Relative humidity- and ABA-induced variation in carbon and oxygen isotope ratios of cotton leaves, Plant Cell Environ., 23, 473–485, 2000.
Bottinga, Y. and Craig, H.: Oxygen isotope fractionation between CO2 and water, and the isotopic composition of marine atmospheric CO2, Earth Planet. Sci. Lett., 5, 285–295, 1968.
Bowen, G. J., Wassenaar, L. I., and Hobson, K. A.: Global application of stable hydrogen and oxygen isotopes to wildlife forensics, Oecologia, 143, 337–348, 2005.
Buckley, T. N.: How do stomata respond to water status?, New Phytol., 224, 21–36, 2019.
Cabrera-Bosquet, L., Albrizio, R., Nogues, S., and Araus, J. L.: Dual Δ13CO response to water and nitrogen availability and its relationship with yield in field-grown durum wheat, Plant Cell Environ., 34, 418–433, 2011.
Cabrera, J. C. B., Hirl, R. T., Schaeufele, R., Macdonald, A., and Schnyder, H.: Stomatal conductance limited the CO2 response of grassland in the last century, Bmc Biol., 19, 50, https://doi.org/10.1186/s12915-021-00988-4, 2021.
Chen, Y., Feng, X., and Fu, B.: An improved global remote-sensing-based surface soil moisture (RSSSM) dataset covering 2003–2018, Earth Syst. Sci. Data, 13, 1–31, https://doi.org/10.5194/essd-13-1-2021, 2021.
Costa, A. C., Rezende-Silva, S. L., Megguer, C. A., Moura, L. M. F., Rosa, M., and Silva, A. A.: The effect of irradiance and water restriction on photosynthesis in young jatoba-do-cerrado (Hymenaea stigonocarpa) plants, Photosynthetica, 53, 118–127, 2015.
Cui, X. Y., Tang, Y. H., Gu, S., Nishimura, S., Shi, S. B., and Zhao, X. Q.: Photosynthetic depression in relation to plant architecture in two alpine herbaceous species, Environ. Exp. Bot., 50, 125–135, 2003.
Doupis, G., Chartzoulakis, K. S., Taskos, D., and Patakas, A.: The effects of drought and supplemental UV-B radiation on physiological and biochemical traits of the grapevine cultivar “Soultanina”, Oeno One, 4, 687–698, 2020.
Duan, B. L., Xuan, Z. Y., Zhang, X. L., Korpelainen, H., and Li, C. Y.: Interactions between drought, ABA application and supplemental UV-B in Populus yunnanensis, Physiol. Plantarum, 134, 257–269, 2008.
Farquhar, G. D., Barbour, M. M., and Henry, B. K.: Interpretation of oxygen isotope composition of leaf material, in: Stable isotopes: integration of biological, ecological and geochemical processes, edited by: Griffiths, H., BIOS Scientific Publishers, Oxford, 27–62, https://doi.org/10.1201/9781003076865-3, 1998.
Farquhar, G. D., Caemmerer, S. V., and Berry, J. A.: A biochemical-model of photosynthetic CO2 assimilation in leaves of C3 species, Planta, 149, 78–90, 1980.
Fick, S. E. and Hijmans, R. J.: WorldClim 2: new 1 km spatial resolution climate surfaces for global land areas, Int. J. Climatol., 37, 4302–4315, 2017.
Fu, Y. L., Yu, G. R., Sun, X. M., Li, Y. N., Wen, X. F., Zhang, L. M., Li, Z. Q., Zhao, L., and Hao, Y. B.: Depression of net ecosystem CO2 exchange in semi-arid Leymus chinensis steppe and alpine shrub, Agric. For. Meteorol., 137, 234–244, 2006.
Fyllas, N. M., Bentley, L. P., Shenkin, A., Asner, G. P., Atkin, O. K., Diaz, S., Enquist, B. J., Farfan-Rios, W., Gloor, E., Guerrieri, R., Huasco, W. H., Ishida, Y., Martin, R. E., Meir, P., Phillips, O., Salinas, N., Silman, M., Weerasinghe, L. K., Zaragoza-Castells, J., and Malhi, Y.: Solar radiation and functional traits explain the decline of forest primary productivity along a tropical elevation gradient, Ecol. Lett,, 20, 730–740, 2017.
Galmes, J., Medrano, H., and Flexas, J.: Photosynthetic limitations in response to water stress and recovery in Mediterranean plants with different growth forms, New Phytol., 175, 81–93, 2007.
Grams, T. E. E., Kozovits, A. R., Haeberle, K.-H., Matyssek, R., and Dawson, T. E.: Combining δ13C and δ18O analyses to unravel competition, CO2 and O3 effects on the physiological performance of different-aged trees, Plant Cell Environ., 30, 1023–1034, 2007.
Grossiord, C., Buckley, T. N., Cernusak, L. A., Novick, K. A., Poulter, B., Siegwolf, R. T. W., Sperry, J. S., and McDowell, N. G.: Plant responses to rising vapor pressure deficit, New Phytol., 226, 1550–1566, 2020.
Guerrieri, R., Belmecheri, S., Ollinger, S. V., Asbjornsen, H., Jennings, K., Xiao, J. F., Stocker, B. D., Martin, M., Hollinger, D. Y., Bracho-Garrillo, R., Clark, K., Dore, S., Kolb, T., Munger, J. W., Novick, K., and Richardson, A. D.: Disentangling the role of photosynthesis and stomatal conductance on rising forest water-use efficiency, P. Natl. Acad. Sci. USA, 116, 16909–16914, 2019.
Helliker, B. R. and Richter, S. L.: Subtropical to boreal convergence of tree-leaf temperatures, Nature, 454, 511–514, 2008.
Hirl, R. T., Schnyder, H., Ostler, U., Schäufele, R., Schleip, I., Vetter, S. H., Auerswald, K., Baca Cabrera, J. C., Wingate, L., Barbour, M. M., and Ogée, J.: The 18O ecohydrology of a grassland ecosystem – predictions and observations, Hydrol. Earth Syst. Sci., 23, 2581–2600, https://doi.org/10.5194/hess-23-2581-2019, 2019.
Hirl, R. T., Ogee, J., Ostler, U., Schaufele, R., Cabrera, J. C. B., Zhu, J. J., Schleip, I., Wingate, L., and Schnyder, H.: Temperature-sensitive biochemical O-18-fractionation and humidity-dependent attenuation factor are needed to predict delta O-18 of cellulose from leaf water in a grassland ecosystem, New Phytol., 229, 3156–3171, https://doi.org/10.1111/nph.17111, 2021.
IBM Corp: IBM SPSS Statistics for Windows, Version 20.0, IBM Corp [computer program], https://www.ibm.com/support/pages/node/724851 (last access: 7 September 2022), 2011.
Jarvis, P. G. and McNaughton, K. G.: Stomatal control of transpiration – scaling up from leaf to region, Adv. Ecol. Res., 15, 1–49, 1986.
Kang, X. M., Li, Y. A., Zhou, J. Y., Zhang, S. T., Li, C. X., Wang, J. H., Liu, W., and Qi, W.: Response of Leaf Traits of Eastern Qinghai-Tibetan Broad-Leaved Woody Plants to Climatic Factors, Front. Plant Sci., 12, 679726, https://doi.org/10.3389/fpls.2021.679726, 2021.
Keitel, C., Matzarakis, A., Rennenberg, H., and Gessler, A.: Carbon isotopic composition and oxygen isotopic enrichment in phloem and total leaf organic matter of European beech (Fagus sylvatica L.) along a climate gradient, Plant Cell Environ., 29, 1492–1507, 2006.
Kimm, H., Guan, K. Y., Gentine, P., Wu, J., Bernacchi, C. J., Sulman, B. N., Griffis, T. J., and Lin, C.J.: Redefining droughts for the US Corn Belt: The dominant role of atmospheric vapor pressure deficit over soil moisture in regulating stomatal behavior of Maize and Soybean, Agric. For. Meteorol., 287, 107930, https://doi.org/10.1016/j.agrformet.2020.107930, 2020.
Leuning, R.: A critical-appraisal of a combined stomatal-photosynthesis model for C-3 plants, Plant Cell Environ., 18, 339–355, 1995.
Liu, H., Hu, B., Wang, Y., Liu, G., Tang, L., Ji, D., Bai, Y., Bao, W., Chen, X., Chen, Y., Ding, W., Han, X., He, F., Huang, H., Huang, Z., Li, X., Li, Y., Liu, W., Lin, L., Ouyang, Z., Qin, B., Shen, W., Shen, Y., Su, H., Song, C., Sun, B., Sun, S., Wang, A., Wang, G., Wang, H., Wang, S., Wang, Y., Wei, W., Xie, P., Xie, Z., Yan, X., Zeng, F., Zhang, F., Zhang, Y., Zhang, Y., Zhao, C., Zhao, W., Zhao, X., Zhou, G., and Zhu, B.: Two ultraviolet radiation datasets that cover China, Adv. Atmos. Sci., 34, 805–815, 2017.
Liu, L. B., Gudmundsson, L., Hauser, M., Qin, D. H., Li, S. C., and Seneviratne, S. I.: Soil moisture dominates dryness stress on ecosystem production globally, Nat. Commun., 11, 4892, https://doi.org/10.1038/s41467-020-18631-1, 2020.
Lyu, S. D., Wang, J., Song, X. W., and Wen, X. F.: The relationship of δD and δ18O in surface soil water and its implications for soil evaporation along grass transects of Tibet, Loess, and Inner Mongolia Plateau, J. Hydrol., 600, 126533, https://doi.org/10.1016/j.jhydrol.2021.126533, 2021.
Martin-StPaul, N., Delzon, S., and Cochard, H.: Plant resistance to drought depends on timely stomatal closure, Ecol. Lett., 20, 1437–1447, 2017.
Maxwell, T., Silva, L., and Horwath, W.: Integrating effects of species composition and soil properties to predict shifts in montane forest carbon-water relations, P. Natl. Acad. Sci. USA, 115, E4219–E4226, 2018.
Moreno-Gutierrez, C., Dawson, T. E., Nicolas, E., and Querejeta, J. I.: Isotopes reveal contrasting water use strategies among coexisting plant species in a Mediterranean ecosystem, New Phytol., 196, 489–496, 2012.
Novick, K. A., Ficklin, D. L., Stoy, P. C., Williams, C. A., Bohrer, G., Oishi, A. C., Papuga, S. A., Blanken, P. D., Noormets, A., Sulman, B. N., Scott, R. L., Wang, L. X., and Phillips, R. P.: The increasing importance of atmospheric demand for ecosystem water and carbon fluxes, Nat. Clim. Change, 6, 1023–1027, 2016.
Oren, R., Sperry, J. S., Katul, G. G., Pataki, D. E., Ewers, B. E., Phillips, N., and Schafer, K. V. R.: Survey and synthesis of intra- and interspecific variation in stomatal sensitivity to vapour pressure deficit, Plant Cell Environ., 22, 1515–1526, 1999.
Peguero-Pina, J. J., Vilagrosa, A., Alonso-Forn, D., Ferrio, J. P., Sancho-Knapik, D., and Gil-Pelegrin, E.: Living in Drylands: Functional Adaptations of Trees and Shrubs to Cope with High Temperatures and Water Scarcity, Forests, 11, 1028, https://doi.org/10.3390/f11101028, 2020.
Peppe, D. J., Royer, D. L., Cariglino, B., Oliver, S. Y., Newman, S., Leight, E., Enikolopov, G., Fernandez-Burgos, M., Herrera, F., Adams, J. M., Correa, E., Currano, E. D., Erickson, J. M., Hinojosa, L. F., Hoganson, J. W., Iglesias, A., Jaramillo, C. A., Johnson, K. R., Jordan, G. J., Kraft, N. J. B., Lovelock, E. C., Lusk, C. H., Niinemets, U., Penuelas, J., Rapson, G., Wing, S. L., and Wright, I. J.: Sensitivity of leaf size and shape to climate: global patterns and paleoclimatic applications, New Phytol., 190, 724–739, 2011.
Poorter, H., Niinemets, U., Poorter, L., Wright, I. J., and Villar, R.: Causes and consequences of variation in leaf mass per area (LMA): a meta-analysis, New Phytol., 182, 565–588, 2009.
Prieto, I., Querejeta, J., Segrestin, J., Volaire, F., and Roumet, C.: Leaf carbon and oxygen isotopes are coordinated with the leaf economics spectrum in Mediterranean rangeland species, Funct. Ecol., 32, 612–625, 2018.
Ramirez, D. A., Querejeta, J. I., and Bellot, J.: Bulk leaf δ18O and δ13C reflect the intensity of intraspecific competition for water in a semi-arid tussock grassland, Plant Cell Environ., 32, 1346–1356, 2009.
R Core Team: R: A Language and Environment for Statistical Computing, R Foundation for Statistical Computing [computer program], https://www.R-project.org/ (last access: 7 September 2022), 2012
Schneider, C. A., Rasband, W. S., and Eliceiri, K. W.: NIH Image to ImageJ: 25 years of image analysis, Nat. Methods, 9, 671–675, 2012.
Seneviratne, S. I., Corti, T., Davin, E. L., Hirschi, M., Jaeger, E. B., Lehner, I., Orlowsky, B., and Teuling, A. J.: Investigating soil moisture–climate interactions in a changing climate: A review, Earth-Sci. Rev., 99, 125–161, 2010.
Song, X., Barbour, M. M., Saurer, M., and Helliker, B. R.: Examining the large-scale convergence of photosynthesis-weighted tree leaf tem pe analysis of multiple data sets, New Phytol., 192, 912–924, 2011.
The Math Works, Inc.: MATLAB, 9.5.0, The MathWorks Inc. [computer program], https://ww2.mathworks.cn/products/compiler/matlab-runtime.html (last access: 7 September 2022), 2018.
Wang, J. and Wen, X. F.: Divergence and conservative of stomatal conductance in coexisting species in response to climatic stress in Tibetan Plateau, Ecol. Indic., 138, 108843, https://doi.org/10.1016/j.ecolind.2022.108843, 2022a.
Wang, J. and Wen, X. F.: Increasing relative abundance of C4 plants mitigates a dryness-stress effect on gross primary productivity along an aridity gradient in grassland ecosystems, Plant Soil, https://doi.org/10.1007/s11104-022-05529-8, 2022b.
Wang, J. and Wen, X.: Limiting resource and leaf functional traits jointly determine distribution patterns of leaf intrinsic water use efficiency along aridity gradients, Front. Plant Sci., 13, 909603, https://doi.org/10.3389/fpls.2022.909603, 2022c.
Wang, J., Wen, X. F., Lyu, S., and Guo, Q. J.: Soil properties mediate ecosystem intrinsic water use efficiency and stomatal conductance via taxonomic diversity and leaf economic spectrum, Sci. Total Environ., 783, 146968, https://doi.org/10.1016/j.scitotenv.2021.146968, 2021a.
Wang, J., Wen, X. F., Lyu, S. D., and Guo, Q. J.: Transition in multi-dimensional leaf traits and their controls on water use strategies of co-occurring species along a soil limiting-resource gradient, Ecol. Indic., 128, 107838, https://doi.org/10.1016/j.ecolind.2021.107838, 2021b.
Warton, D. I., Duursma, R. A., Falster, D. S., and Taskinen, S.: smatr 3 – an R package for estimation and inference about allometric lines, Methods Ecol. Evol., 3, 257–259, 2012.
Wright, I. J., Reich, P. B., Westoby, M., Ackerly, D. D., Baruch, Z., Bongers, F., Cavender-Bares, J., Chapin, T., Cornelissen, J. H. C., Diemer, M., Flexas, J., Garnier, E., Groom, P. K., Gulias, J., Hikosaka, K., Lamont, B. B., Lee, T., Lee, W., Lusk, C., Midgley, J. J., Navas, M. L., Niinemets, U., Oleksyn, J., Osada, N., Poorter, H., Poot, P., Prior, L., Pyankov, V. I., Roumet, C., Thomas, S. C., Tjoelker, M. G., Veneklaas, E. J., and Villar, R.: The worldwide leaf economics spectrum, Nature, 428, 821–827, 2004.
Wright, I. J., Dong, N., Maire, V., Prentice, I. C., Westoby, M., Diaz, S., Gallagher, R. V., Jacobs, B. F., Kooyman, R., Law, E. A., Leishman, M. R., Niinemets, U., Reich, P. B., Sack, L., Villar, R., Wang, H., and Wilf, P.: Global climatic drivers of leaf size, Science, 357, 917–921, 2017.
Xia, J. Y., Niu, S. L., Ciais, P., Janssens, I. A., Chen, J. Q., Ammann, C., Arain, A., Blanken, P. D., Cescatti, A., Bonal, D., Buchmann, N., Curtis, P. S., Chen, S. P., Dong, J. W., Flanagan, L. B., Frankenberg, C., Georgiadis, T., Gough, C. M., Hui, D. F., Kiely, G., Li, J. W., Lund, M., Magliulo, V., Marcolla, B., Merbold, L., Montagnani, L., Moors, E. J., Olesen, J. E., Piao, S. L., Raschi, A., Roupsard, O., Suyker, A. E., Urbaniak, M., Vaccari, F. P., Varlagin, A., Vesala, T., Wilkinson, M., Weng, E., Wohlfahrt, G., Yan, L. M., and Luo, Y. Q.: Joint control of terrestrial gross primary productivity by plant phenology and physiology, P. Natl. Acad. Sci. USA, 112, 2788–2793, 2015.
Xu, J. M., Wu, B. F., Ryu, D., Yan, N. N., Zhu, W. W., and Ma, Z. H.: A canopy conductance model with temporal physiological and environmental factors, Sci. Total Environ., 791, 148283, https://doi.org/10.1016/j.scitotenv.2021.148283, 2021a.
Xu, M. J., Zhang, T., Zhang, Y. J., Chen, N., Zhu, J. T., He, Y. T., Zhao, T. T., and Yu, G. R.: Drought limits alpine meadow productivity in northern Tibet, Agric. For. Meteorol., 303, 108371, https://doi.org/10.1016/j.agrformet.2021.108371, 2021b.
Yao, J. Y., Liu, H. P., Huang, J. P., Gao, Z. M., Wang, G. Y., Li, D., Yu, H. P., and Chen, X. Y.: Accelerated dryland expansion regulates future variability in dryland gross primary production, Nat. Commun., 11, 10, https://doi.org/10.1038/s41467-020-15515-2, 2020.
Yu, Q., Liu, Y., Liu, J., and Wang, T.: Simulation of leaf photosynthesis of winter wheat on Tibetan Plateau and in North China Plain, Ecol. Model., 155, 205–216, 2002.
Zeuthen, J., Mikkelsen, T. N., Paludan-Müller, G., and Ro-Poulsen, H.: Effects of increased UV-B radiation and elevated levels of tropospheric ozone on physiological processes in European beech (Fagus sylvatica), Physiol. Plantarum, 100, 281–290, 1997.
Zhang, T., Shen, S., and Cheng, C. X.: Impact of radiations on the long-range correlation of soil moisture: A case study of the A'rou superstation in the Heihe River Basin, J. Geogr. Sci., 29, 1491–1506, 2019.