the Creative Commons Attribution 4.0 License.
the Creative Commons Attribution 4.0 License.
 | 17 Nov 2022
Eddy-enhanced primary production sustains heterotrophic microbial activities in the Eastern Tropical North Atlantic
Kevin W. Becker
Arne Bendinger
Johannes Hahn
Anja Engel
Mesoscale eddies modulate the ocean's physical, chemical, and biological properties. In cyclonic eddies (CEs), nutrient upwelling can stimulate primary production by phytoplankton. Yet, how this locally enhanced autotrophic production affects heterotrophy and consequently the metabolic balance between the synthesis and the consumption of dissolved organic matter (DOM) remains largely unknown. To fill this gap, we investigated the horizontal and vertical variability in auto- and heterotrophic microbial activity (biomass production and respiration) within a CE that formed off Mauritania and along the ∼ 900 km zonal corridor between Mauritania and the Cape Verde islands in the Eastern Tropical North Atlantic (ETNA). Our results show how the physical disturbances caused by the CE affected the biomass distribution of phyto- and bacterioplankton and their metabolic activities. The injection of nutrients into the sunlit surface resulted in enhanced autotrophic pico- and nanoplankton abundance and generally increased autotrophic activity as indicated by chlorophyll a (Chl a) concentration, primary production (PP), and extracellular release rates. However, the detailed eddy survey also revealed an uneven distribution of these variables with, for example, the highest Chl a concentrations and PP rates occurring near and just beyond the CE's periphery. The heterotrophic bacterial activity was similarly variable. Optode-based community respiration (CR), bacterial respiration (BR) estimates, and bacterial biomass production (BP) largely followed the trends of PP and Chl a. Thus, a submesoscale spatial mosaic of heterotrophic bacterial abundance and activities occurred within the CE that was closely related to variability in autotrophic production. Consistent with this, we found a significant positive correlation between concentrations of semi-labile dissolved organic carbon (SL-DOC; here the sum of dissolved hydrolysable amino acids and dissolved combined carbohydrates) and BR estimates. Extracellular release of carbon as indicated by primary production of dissolved organic carbon (PPDOC) was variable with depth and laterally and not always sufficient to compensate the bacterial carbon demand (BCD: BR + BP), with PPDOC accounting for between 28 % and 110 % of the BCD. Bacterial growth efficiency (BGE: BP / BCD) ranged between 1.7 % and 18.2 %. We estimated the metabolic state to establish whether the CE was a source or a sink of organic carbon. We showed that the CE carried a strong autotrophic signal in the core (PP CR > 1). Our results suggest that submesoscale (0–10 km) processes lead to highly variable metabolic activities in both photoautotrophic and heterotrophic microorganisms. Overall, we revealed that the CEs not only trap and transport coastal nutrients and organic carbon to the open ocean but also stimulate phytoplankton growth, generating freshly produced organic matter during westward propagation. This drives heterotrophic processes and may contribute to the previously observed net heterotrophy in open Atlantic surface waters.
- Article
(6756 KB) - Full-text XML
-
Supplement
(1941 KB) - BibTeX
- EndNote


Mesoscale eddies (10–100 km) are ubiquitous in the ocean, affecting upper-ocean biogeochemistry and ecology. For example, upwelling of nutrients inside eddies can enhance primary production and carbon export (Cheney and Richardson, 1976; Arístegui et al., 1997). The sense of rotation and their vertical structure classify cyclonic (CEs), anticyclonic (ACEs; e.g. Chelton et al., 2011), and anticyclonic mode water eddies (ACMEs; D'Asaro, 1988). In eastern boundary upwelling systems (EBUS), eddies typically form by flow separation along slope boundary currents at topographic headlands (D'Asaro, 1988; Molemaker et al., 2015; Thomsen et al., 2016). Eddies have lifespans from days to months and can travel several hundred to thousands of kilometres across ocean basins (Chelton et al., 2011). In the North Atlantic Ocean, eddies generated in the highly productive Canary Upwelling System (CanUS) may laterally propagate to the oligotrophic Subtropical North Atlantic Gyre (SNAG), transporting nutrients and carbon from the coast to the open ocean (McGillicuddy et al., 2003; Karstensen et al., 2015; Schütte et al., 2016). Various studies demonstrated the impact of eddies on primary production (PP) on a global scale. However, the effects of eddies vary regionally, and studies with higher spatial resolution of eddies combined with advances in in situ observation, remote sensing, and modelling are still needed to better describe the physical and biological properties of the upper ocean (see review by McGillicuddy, 2016, and references therein). For example, Couespel et al. (2021) performed global warming simulations using a representation of mid-latitude double-gyre circulation. They showed that at the finest model resolution (∘), eddies can mitigate the decline in primary production (−12 % at ∘ vs. −26 % at 1∘). Modelling studies have long urged consideration of the effects of eddies on PP at submesoscale levels (0.1–10 km) to provide more realistic estimates of the oceanic carbon cycle (Lévy et al., 2001). Eddies modulate the mixed layer depth by upwelling (CEs), downwelling (ACEs), or frontogenesis from eddy–eddy interaction, thereby creating spatial variability in nutrient concentration within and around eddies on the submesoscale (see reviews by Mahadevan, 2016, and McGillicuddy, 2016). In addition, the nonlinear response of phytoplankton growth to nutrient availability and advection of phytoplankton by currents makes plankton distribution and community composition highly variable within and around eddies (Lochte and Pfannkuche, 1987). As a consequence, the spatial distribution of PP across eddies can be highly variable (e.g. Falkowski et al., 1991; Ewart et al., 2008; Singh et al., 2015).
Bacterial activity is directly coupled to PP, as autotrophic cells release their main substrate dissolved organic matter (DOM). DOM release by phytoplankton mainly occurs via two mechanisms: (1) passive leakage of small molecules by diffusion across the cell membrane and (2) active exudation of DOM into the surrounding environment (Engel et al., 2004). Environmental conditions, such as temperature, nutrient availability (e.g. Borchard and Engel, 2012), and light conditions (e.g. Cherrier et al., 2015) affect the amount and the elemental stoichiometry of released DOM. Patchiness of phytoplankton primary productivity and nutrient availability within eddies may thus lead to spatial heterogeneity of extracellular release rates (e.g. Lasternas et al., 2013; Rao et al., 2021) and DOM quality (e.g. Wear et al., 2020). DOM quality impacts bacterial biomass production (BP), bacterial respiration (BR), and bacterial growth efficiency (BGE; e.g. Neijssel and de Mattos, 1994; Russell and Cook, 1995; Robinson, 2008; Lipson, 2015). BGE is the ratio between BP and the bacterial carbon demand (BCD), which is the sum of respired carbon and carbon incorporated into biomass (BP + BR). Lønborg et al. (2011) observed that BGE decreases with the increasing ratio of phytoplankton-derived DOM. BGE is a critical parameter for estimating the amount of consumed organic carbon used to build biomass by heterotrophic bacteria (Anderson and Ducklow, 2001). So far, BGE has been reported for ACEs from the Mediterranean Sea (Christaki et al., 2021) but not for CEs and ACMEs. In general, several studies showed a patchy distribution of bacterial abundance, BP (Ewart et al., 2008; Baltar et al., 2010), BR (Mouriño-Carballido, 2009; Jiao et al., 2014), community respiration (CR; Mouriño-Carballido and McGillicuddy, 2006; Mouriño-Carballido, 2009), and the metabolic balance between the production and consumption of organic matter (Maixandeau et al., 2005; Ewart et al., 2008; Mouriño-Carballido and McGillicuddy, 2006; Mouriño-Carballido, 2009) within eddies. Yet, insights into the distribution of phytoplankton and their activities within mesoscale eddies are limited due to insufficient fine-scale vertical- and horizontal-resolution studies to adequately describe these distributions. Thus, data on eddy-induced changes in primary production, extracellular release, and semi-labile DOM concentration, as well as the responses of heterotrophic microbial metabolic activities, are scarce. Understanding how eddies modulate microbial activities will enhance our knowledge about the fate of organic carbon and the overall CO2 source/sink function in the ocean, particularly in EBUS, where eddy generation is high (Pegliasco et al., 2015).
Here, we studied the impact of a CE on microbial carbon cycling along a 900 km zonal corridor of the westward propagating eddies between the Cape Verde islands and the Mauritania Upwelling System (13–20∘ N), a sub-region of the CanUS (13–33∘ N; Arístegui et al., 2009). About 146 ± 44 eddies with a lifetime of more than 7 d are generated per year in this region (Schütte et al., 2016). Along this corridor, a CE was sampled at high spatial resolution to resolve the heterogeneity of microbial processes at the submesoscale. We determined phytoplankton (<20 µm) cell abundance, primary production, and extracellular release and linked those measurements of autotrophic activity to semi-labile DOM concentration and heterotrophic bacterial activity. Our study provides new insights into (1) microbial carbon cycling and (2) factors controlling microbial metabolic activities within and around CEs formed in EBUS.
2.1 Study area and eddy characterisation
Sampling was conducted in the ETNA between the Cape Verde archipelago and the Mauritanian coast during cruise M156 (3 July to 1 August 2019; Fig. 1a) on the R/V Meteor. Samples were collected during the relaxation period, which is typically from May to July following the upwelling season (January to March; Lathuilière et al., 2008). A CE was sampled at high spatial resolution along two zonal transects (from 19.1 to 18.2∘ W at 18.3∘ N and from 18.5 to 17.1∘ W at 18.6∘ N) and one meridional transect (from 19.4 to 18∘ N at 18.4 to 18.1∘ W). The zonal transect slightly shifted east–west of the eddy core position. The reason for that was the deformed eddy shape (see Fig. 1a), which made it challenging to identify the centre of the eddy and required rerouting of the ship's track during the survey. In addition, we sampled water along an 18∘ N transect, a typical coast to open ocean trajectory of eddies in this region (Schütte et al., 2016). Salinity, temperature, depth, and O2 concentration were determined using a Seabird 911 plus CTD system equipped with two independently working sets of temperature–conductivity–oxygen sensors. The oxygen sensor was calibrated against discrete water samples using the Winkler method (Strickland and Parsons, 1968; Wilhelm, 1888). Seawater samples were collected using 10 L Niskin bottles attached to the CTD Rosette. A total of 25 stations (Table S1) were sampled, 14 of them inside or in the vicinity of the CE. Sampling was conducted in the epipelagic layer (0–200 m), including samples from the surface mixed layer, the Chl a maximum, and the shallow oxygen minimum zone (OMZ; < 50 µmol kg−1 between 0–200 m depth) when present.
Sea surface height (SSH) and acoustic Doppler current profiler (ADCP) velocity data (Fig. 1) characterised the eddy as a CE. Based on the angular momentum eddy detection and tracking algorithm (AMEDA; Le Vu et al., 2018), the eddy was estimated to be 1.5 months old. The centre of the eddy and the core radius were determined using ADCP reconstructions assuming an axis-symmetric vortex (Fig. 1). On 22 July 2019, the eddy centre was located at 18.69∘ N, 18.05∘ W, with a core radius of 40.5 ± 5.7 km. The mean azimuthal velocity in the CE was 19.9 ± 0.7 cm s−1, and the absolute dynamic topography (ADT) associated with the CE core was ∼ 23 cm on 23 July 2019. However, as the eddy shape was deformed, the ADCP reconstruction did not constrain well the physical border of the eddy (Fig. S1). Therefore, we combined sea surface temperature (23.44 ± 0.47 ∘C), salinity (39.95 ± 0.04), and Chl a (1.35 ± 0.73 µg L−1) data to approximate the area influenced by the eddy (Fig. 1b, c, d). We classified stations into “core” and “periphery” of the eddy. Stations that were outside and westward of the eddy influence were referred to as “open ocean” and those close to the coast as “coastal”. Just beyond the eddy periphery, at St. E3, a front was observed with surface temperature and salinity (not compensated by density) different from the adjacent stations (Fig. 1b). Hence, we referred to that station as “frontal zone”. The classification of stations is thoroughly discussed in the Supplement, and the sampling time, location, and distance from the eddy centre are given in Table S1.
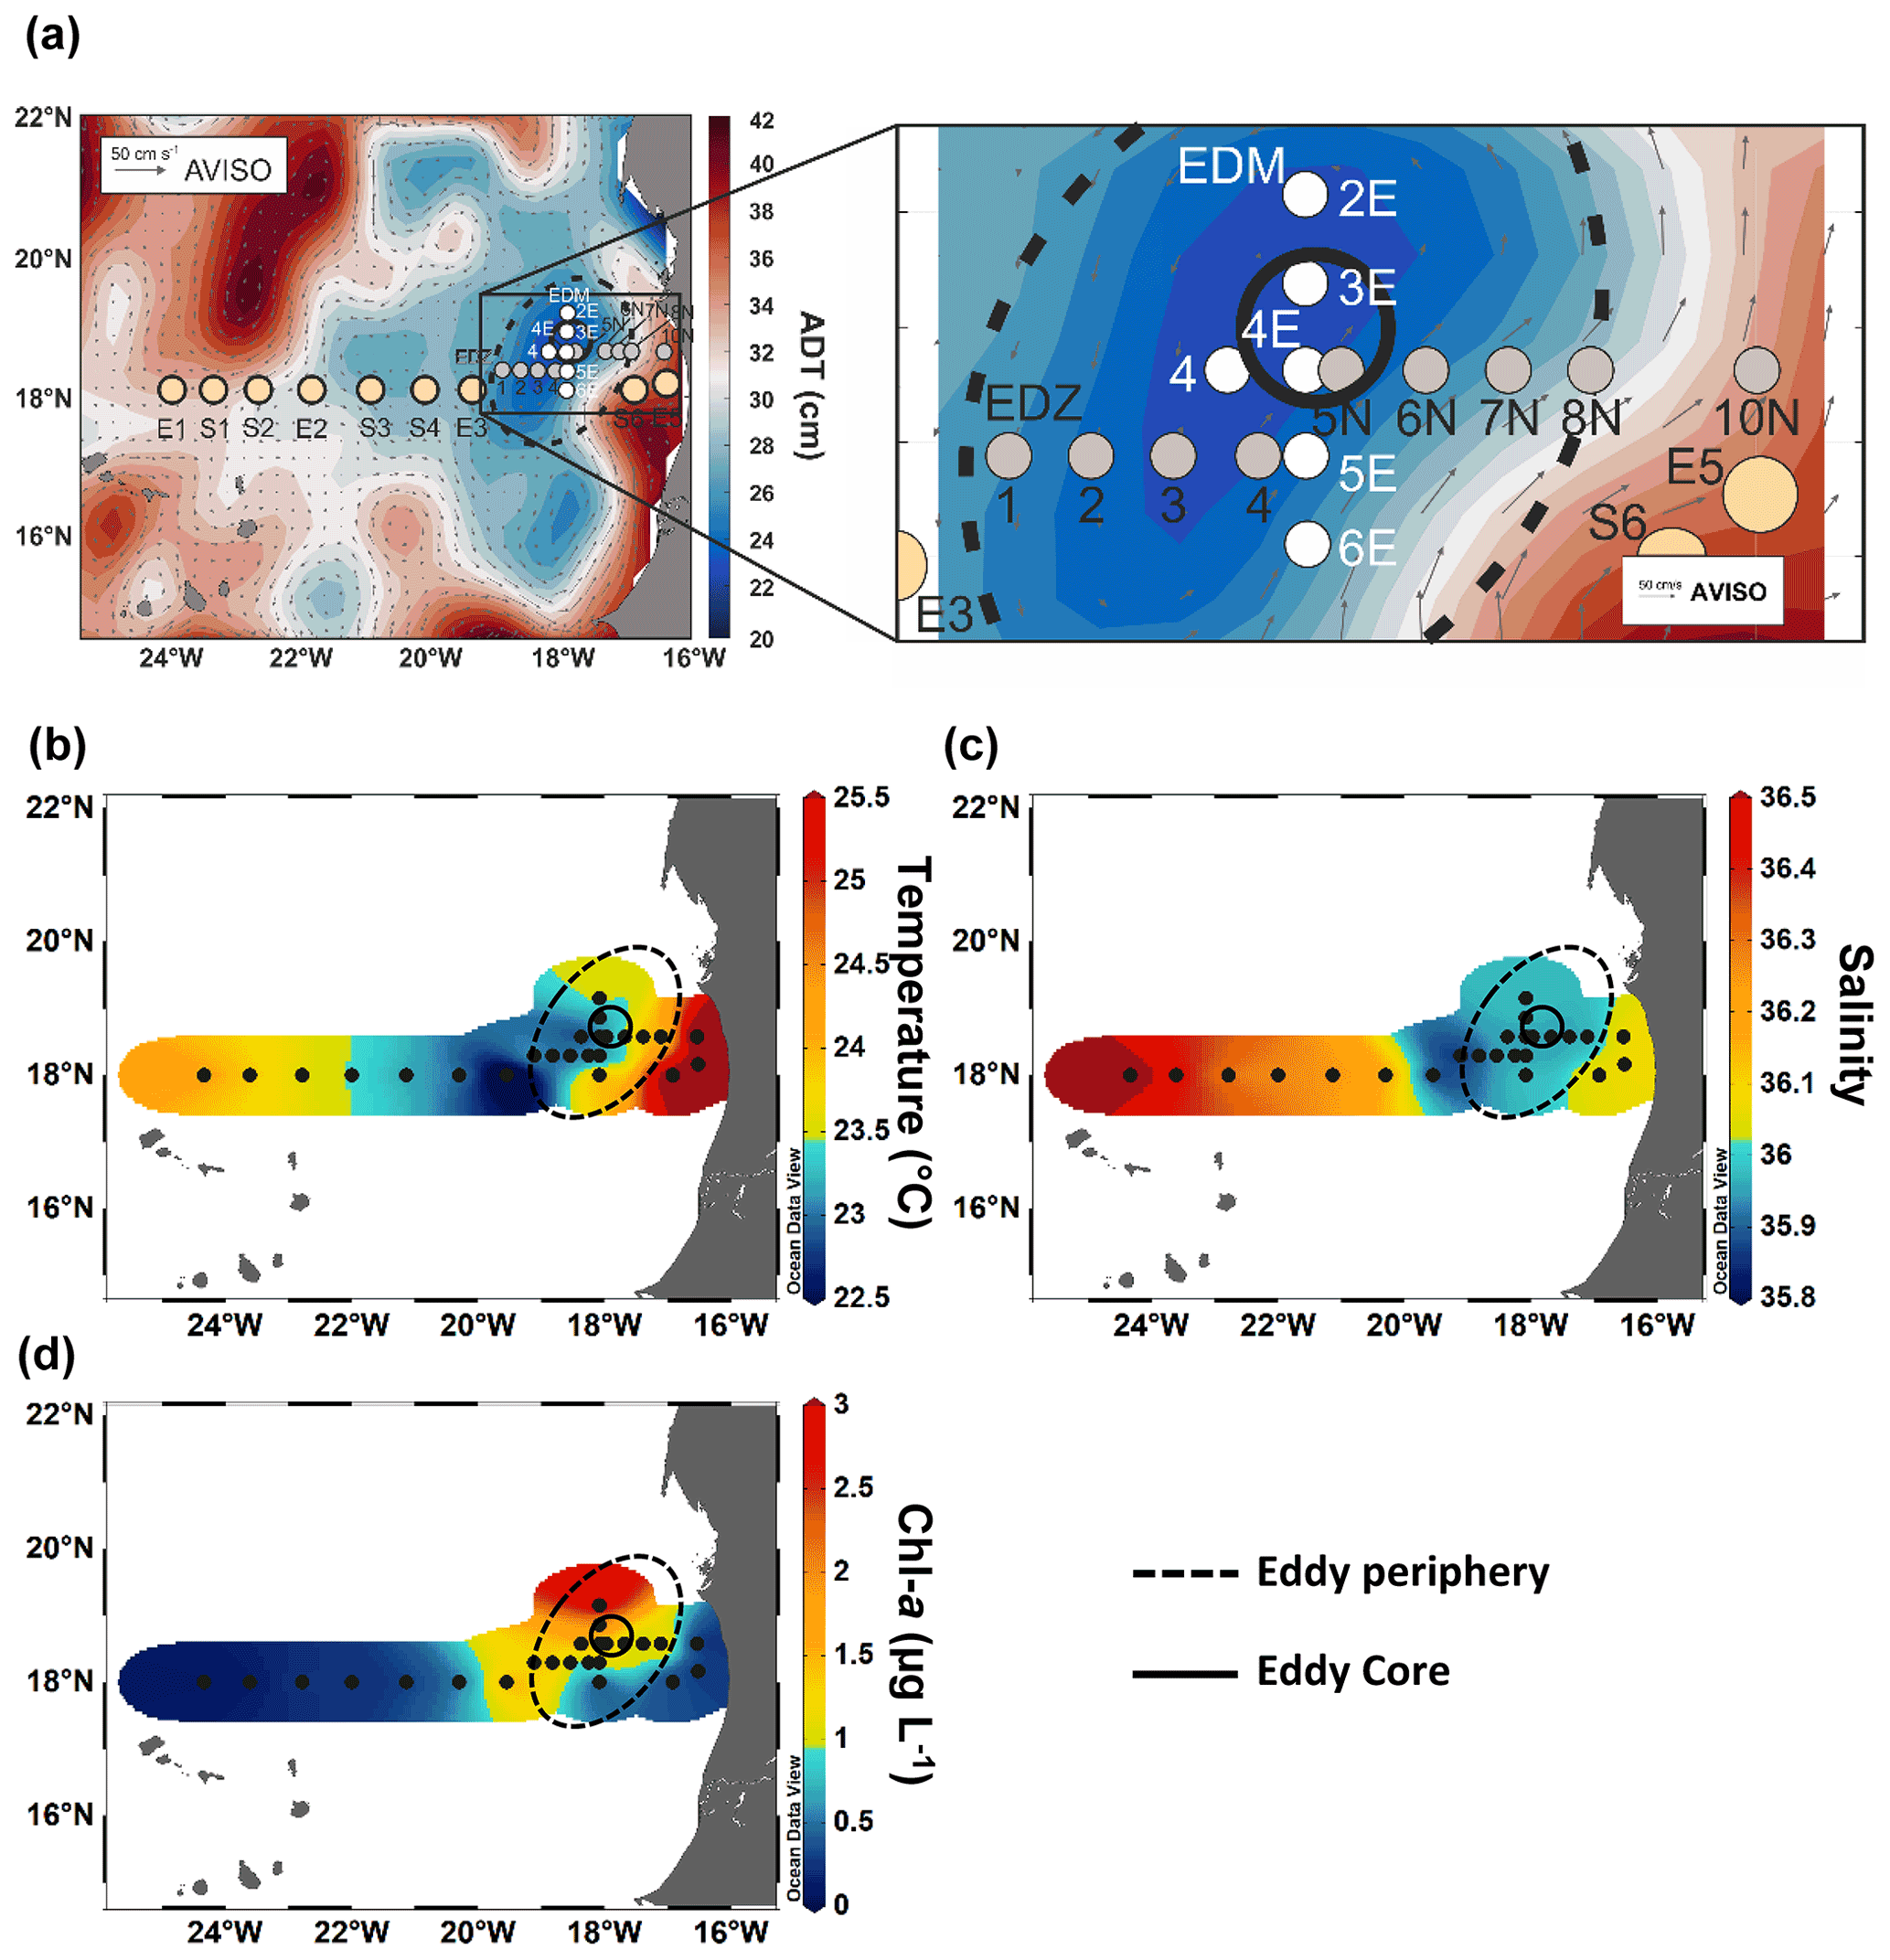
Figure 1Sampling stations during RV Meteor cruise M156 including zoom-in into the eddy (a), temperature at 5 m depth (b), salinity at 5 m depth (c), and chlorophyll a at 5 m depth (d). The background in (a) shows the variations in absolute dynamic topography (ADT) obtained from https://www.aviso.altimetry.fr, last access: 4 December 2021. The direction and speed of surface water geostrophic currents are shown as arrows. The solid circle in (a)–(d) indicates the core of the eddy, and the dashed circle outlines the periphery.
2.2 Chemical analyses
Nutrient concentrations were determined at selected stations (Table S1). Nutrients were measured on board from duplicate unfiltered seawater samples (11 mL). Ammonium (NH) was analysed based on Solórzano (1969) and phosphate (PO4), nitrate (NO), nitrite (NO), and silicate (Si(OH)4) were measured photometrically with continuous-flow analysis on an auto-analyser (QuAAtro; Seal Analytical) based on Hansen and Koroleff (1999). Detection limits for NH, PO4, NO3, NO2, and Si(OH)4 were 0.1, 0.02, 0.1, 0.02, and 0.2 µmol L−1, respectively. Dissolved inorganic nitrogen (DIN) was calculated as the sum of NH, NO, and NO.
To estimate the fraction of semi-labile dissolved organic carbon (SL-DOC), we determined high-molecular-weight (HMW > 1 kDa) dissolved combined carbohydrates (dCCHO) and dissolved hydrolysable amino acids (dHAA) as the main biochemical components of DOM (Carlson, 2002). For dCCHO analysis, duplicate samples (20 mL) were filtered through 0.45 µm Acrodisc filters, collected in combusted glass vials (8 h, 450 ∘C) and frozen (−20 ∘C) until analysis based on Engel and Händel (2011) with a detection limit of 1 µg L−1. The analysis detected 11 monomers: arabinose, fucose, galactose, galactosamine, galacturonic acid, glucosamine, glucose, glucuronic acid, rhamnose, co-elute mannose, and xylose. For dHAA analysis, duplicate samples (4 mL) were filtered through 0.45 µm Acrodisc filters, collected in combusted glass vials (8 h, 450 ∘C), and frozen (−20 ∘C) until analysis. After in-line derivatisation (2 min) with o-phthaldialdehyde and mercaptoethan, dHAA were separated by high-performance liquid chromatography (HPLC; Agilent Technologies, USA) and detected fluorometrically. The HPLC was equipped with a C18 column (Phenomenex, USA) (Lindroth and Mopper, 1979; Dittmar et al., 2009). The analysis classified 13 monomers with a precision < 5 % and a detection limit of 2 nmol L−1: alanine, arginine, aspartic acid, isoleucine, glutamic acid, glycine, leucine, phenylalanine, serine, threonine, tyrosine, valine, and γ-aminobutyric acid (GABA). The calculations for the carbon content of dCCHO and dHAA were based on carbon atoms contained in the identified monomers. The sum of dCCHO and dHAA carbon content is referred to as SL-DOC.
For Chl a, 1 L seawater samples were filtered onto 25 mm GF/F filters (0.7 µm pore size, Whatman, GE Healthcare Life Sciences, UK) and subsequently frozen (−20 ∘C) until extraction using 90 % acetone for photometric analyses (Turner Designs, USA) slightly modified based on Evans et al. (1987).
Bacteria were quantified using a flow cytometer (FACSCalibur, Becton Dickinson, Oxford, UK). Seawater samples (1.7 mL) were fixed with 85 µL glutaraldehyde (1 % final concentration) and stored at −80 ∘C until analysis. Samples were stained with SYBR Green I (molecular probes), enumerated with a laser emitting at 488 nm, and detected by their signature in a plot of side scatter (SSC) versus green fluorescence (FL1). Heterotrophic bacteria were distinguished from photosynthetic bacteria (Prochlorococcus and Synechococcus) by their signature in a plot of red fluorescence (FL2) versus green fluorescence (FL1). Yellow-green latex beads (1 µm, Polysciences) were used as an internal standard (Gasol and del Giorgio, 2000). Cell counts were determined with the CellQuest software (Becton Dickinson). For autotrophic pico and nanoplankton <20 µm, 2 mL samples were fixed with formaldehyde (1 % final concentration) and stored frozen (−80 ∘C) until analysis. Red and orange autofluorescence was used to identify Chl a and phycoerythrin cells. Cell counts were determined with CellQuest software (Becton Dickinson); picoplankton and nanoplankton populations containing Chl a and/or phycoerythrin (i.e. Synechococcus) were identified and enumerated. We converted the cell abundance of the different autotrophic pico- and nanoplankton populations into biomass assuming 43 fg C per cell for Prochlorococcus, 120 fg C per cell for Synechococcus, 500 fg C per cell for eukaryotic picoplankton, and 3.100 fg C per cell for eukaryotic nanoplankton based on Hernández-Hernández et al. (2020). We report the autotrophic pico- and nanoplankton biomass as the sum of eukaryotic pico- and nanoplankton and cyanobacteria (Prochlorococcus and Synechococcus) biomass. The abundance of eukaryotic pico- and nanoplankton and cyanobacteria (Prochlorococcus and Synechococcus) can be found in Table S2.
2.3 Microbial activities
Primary production (PP) was determined from 14C incorporation according to Nielsen (1952) and Gargas (1975). Polycarbonate bottles (Nunc EasYFlask, 75 cm2) were filled with 260 mL prefiltered (mesh size of 200 µm) sample and spiked with 50 µL of a ∼ 11 µCi NaH14CO solution (Perkin Elmer, Norway). A total of 200 µL was removed immediately after spiking and transferred to a 5 mL scintillation vial for determination of added activity. Then, 50 µL of 2N NaOH and 4 mL scintillation cocktail (Ultima Gold AB) were added. Duplicate samples from the top three depths at selected stations (Table S1) were incubated in 12 h light and 12 h dark at 22 ∘C, which was the average temperature of the upper 100 m depth (22 ± 3 ∘C) along the transect. The incubator was set to reproduce three light levels – 1200–1400, 350, and 5 µE – with high values representing surface irradiance at the time of sampling. The incubation length was chosen for two reasons. First, we expected low productivity of the open ocean phytoplankton community due to low biomass and low nutrient concentrations at the start of the incubation. Under these conditions, short-term incubations of only a few hours may underestimate PP because carbon assimilation by algal cells may be too low to discriminate against 14C adsorption as determined in blank dark incubation (Engel et al., 2013). Moreover, the release of freshly assimilated carbon into the DOM pool has a timescale of several hours because of the equilibration of the tracer and because metabolic processes of organic carbon exudation follow those of carbon fixation inside the cell (Engel et al., 2013). Incubations were stopped by filtration of a 70 mL sub-sample onto 0.4 µm polycarbonate filters (Nuclepore). Particulate primary production (PPPOC) was determined from material collected on the filter, while the filtrate was used to determine dissolved primary production (PPDOC). All filters were rinsed with 10 mL sterile filtered (<0.2 µm) seawater and then acidified with 250 µL 2N HCl to remove inorganic carbon (Descy et al., 2002). Filters were transferred into 5 mL scintillation vials, and 4 mL scintillation cocktail (Ultima Gold AB) was added. To determine PPDOC, 4 mL of filtrate was transferred to 20 mL scintillation vials and acidified with 100 µL 1N HCl. Scintillation vials were left open in the fume hood for 14 h to remove inorganic carbon. Then, 100 µL of 2N NaOH and 15 mL scintillation cocktail were added. All samples were counted the following day in a liquid scintillation analyser (Packard Tri-Carb, model 1900 A).
Primary production (PP) of organic carbon was calculated according to Gargas (1975):
where a1 and a2 are the activities (DPM: disintegrations per minute) of the added solution and the sample corrected for the dark sample, respectively, and DI12C is the concentration (µmol L−1) of dissolved inorganic carbon (DIC) in the sample. DIC concentration was calculated from total alkalinity using the R package seacarb (Gattuso et al., 2020). Total alkalinity of the seawater was acquired through the open-cell titration method (Dickson et al., 2007). The value 1.05 is a correction factor for the discrimination between 12C and 14C, as the uptake of the 14C isotope is 5 % slower than the uptake of 12C, k1 is a correction factor for sub-sampling (bottle volume filtered volume), and k2 is the incubation time (d−1). Total primary production (PPTOT; µmol C L−1 d−1) was derived from the sum of PPPOC and PPDOC according to
The percentage of extracellular release (PER; %) was calculated as
Bacterial biomass production (BP) rates were measured through the incorporation of labelled leucine (3H) (specific activity 100 Ci mmol−1; Biotrend) using the microcentrifuge method (Kirchman et al., 1985; Smith and Azam, 1992). Duplicate samples and one killed control (1.5 mL each) were labelled using 3H-leucine at a final concentration of 20 nmol L−1. BP was determined down to 800 m depth, and, for practical reasons, we chose an incubation temperature of 14 ∘C as an average over this depth interval. However, in this paper, only data from the top 100 m depth are shown, and BP rates were corrected for the difference between incubation and in situ temperature (Eq. 4). All samples were incubated for 6 h in the dark with headspace. Controls were poisoned with trichloroacetic acid. All samples were measured on board with a liquid scintillation analyser (Packard Tri-Carb, model 1900 A). 3H-leucine uptake was converted to carbon units by applying a conversion factor of 1.55 kg C mol−1 leucine (Simon and Azam, 1989).
BP rates from incubations at 14 ∘C were converted to BP rates at 22 ∘C following the equation from López-Urrutia and Morán (2007):
Community respiration (CR) rates were estimated from quadruplicate incubations by measuring changes in dissolved oxygen over 24–36 h at the same temperature as used for BP (14 ∘C) using optode spot mini sensors (PreSens PSt3; Precision Sensing GmbH, Regensburg, Germany). The detection limit (DL) for CR was 0.55 µmol O2 L−1 d−1.
CR at 22 ∘C was estimated using the extrapolation from Regaudie-De-Gioux and Duarte (2012):
CR was converted into bacterial respiration (BR) based on Aranguren-Gassis et al. (2012):
A respiratory quotient of 1 was used to convert oxygen consumption into carbon respiration (del Giorgio and Cole, 1998).
We estimated the bacterial carbon demand (BCD) as follows:
Bacterial growth efficiency (BGE) was calculated from BP and BCD:
Detailed information on procedures and calculations of microbial activities are provided in the Supplement.
2.4 Data analysis
Statistical analyses and calculations were conducted using the software R (v4.0.3) in R studio (v1.1.414; Ihaka and Gentleman, 1996). Analysis of variances (ANOVA) and Tukey's test were performed on the different parameters by grouping the stations by their position (Table S1). Seawater density was calculated using R package oce v1.3.0 (Kelley, 2018), and the mixed layer maximum depth was determined as the depth at which a change from the surface density of 0.125 kg m−3 has occurred (Levitus, 1982). Erroneous estimates of mixed layer maximum depth have been corrected manually on five profiles. Other R packages used in this study include corrplot v0.84 (Dray, 2008) and ggplot2 v3.3.3 (Wickham, 2016). Section plots were made using Ocean Data View v5.6.2 (Schlitzer, 2020). Depth integrated values were calculated using the midpoint rule.
3.1 Hydrographic conditions
Along the zonal transect, open ocean waters (from 20 to 24.5∘ W) had a temperature range of 13.45–24.2 ∘C and a salinity between 35.55–36.79 in the upper 200 m depth (Fig. 2a and b). The average mixed layer depth was 35 ± 7 m (Fig. 3a; Table S1). Oxygen concentrations (Fig. 2c) decreased with depth, while nutrient concentrations increased (Fig. 2d–e). Nutrients were depleted (<0.5, <0.2, and <0.5 µmol L−1 for DIN, PO4, and Si(OH)4, respectively) in the mixed layer.
At the coastal stations (16.51–16.92∘ W), the temperature had a range of 14.6–26.1 ∘C and a salinity between 35.53 and 36.08 in the upper 200 m depth (Fig. 2a and b). Here, the mixed layer was shallower than in the open ocean but not significantly (Tukey, p>0.05), with an average depth of 24.5 ± 9 m (Fig. 3a; Table S1). Oxygen was decreasing with depth, and a shallow oxygen minimum zone (OMZ; <50 µmol kg−1) was detected between 80 and 200 m depth (Fig. 2c). Nutrients (Fig. 2d–e) were depleted at the surface (5 m depth), while the deeper coastal waters (∼ 80 to 200 m depth) were colder and richer in nutrients than the open ocean waters, with on average 3.4-fold higher nutrient concentrations (DIN, PO4, Si(OH)4) when integrated over 100 m depth (data not shown).
In the CE (“periphery” and “core”), waters had a temperature range of 13.2–24.2 ∘C and a salinity between 35.48 and 36.36 in the upper 200 m depth (Fig. 2a and b). A compression of isopycnals with a strong doming of the isotherms, isohalines, and nutrient isolines was observed (Fig. 2a–b, d–f). A shallow OMZ was detected from ∼ 30 to ∼ 100 m depth with the lowest oxygen concentration (<10 µmol kg−1) between 30–40 m. The mixed layer was significantly shallower (Tukey, p<0.05) in the CE periphery and in the CE core than in the open ocean with an average of 15 ± 6 m and 20 ± 2 m depth, respectively (Fig. 3a). At the surface (5 m depth), nutrients were depleted (<0.5, <0.2, and <0.5 µmol L−1 for DIN, PO4, and Si(OH)4, respectively) only in the most eastern (17.11∘ W, 18∘ N) and western (18.83–19.11∘ W, 18.58∘ N) parts of the CE periphery (Fig. 2d–f). In the core, nutrient concentrations were also lowest in the surface water but richer in nutrients than in the ambient waters.
The frontal zone station E3 (19.55∘ W) was distinct from the adjacent stations with respect to surface temperature (1 ∘C colder; Fig. 2a). A doming of the nutrient isolines was observed (Fig. 2d–f), and nutrient concentrations integrated over 100 m depth at St. E3 were ∼ 3-fold higher than at the open ocean S4 (20.3∘ W) and ∼ 1.2-fold higher than at the CE periphery at St. EDZ-1 (19.11∘ W).
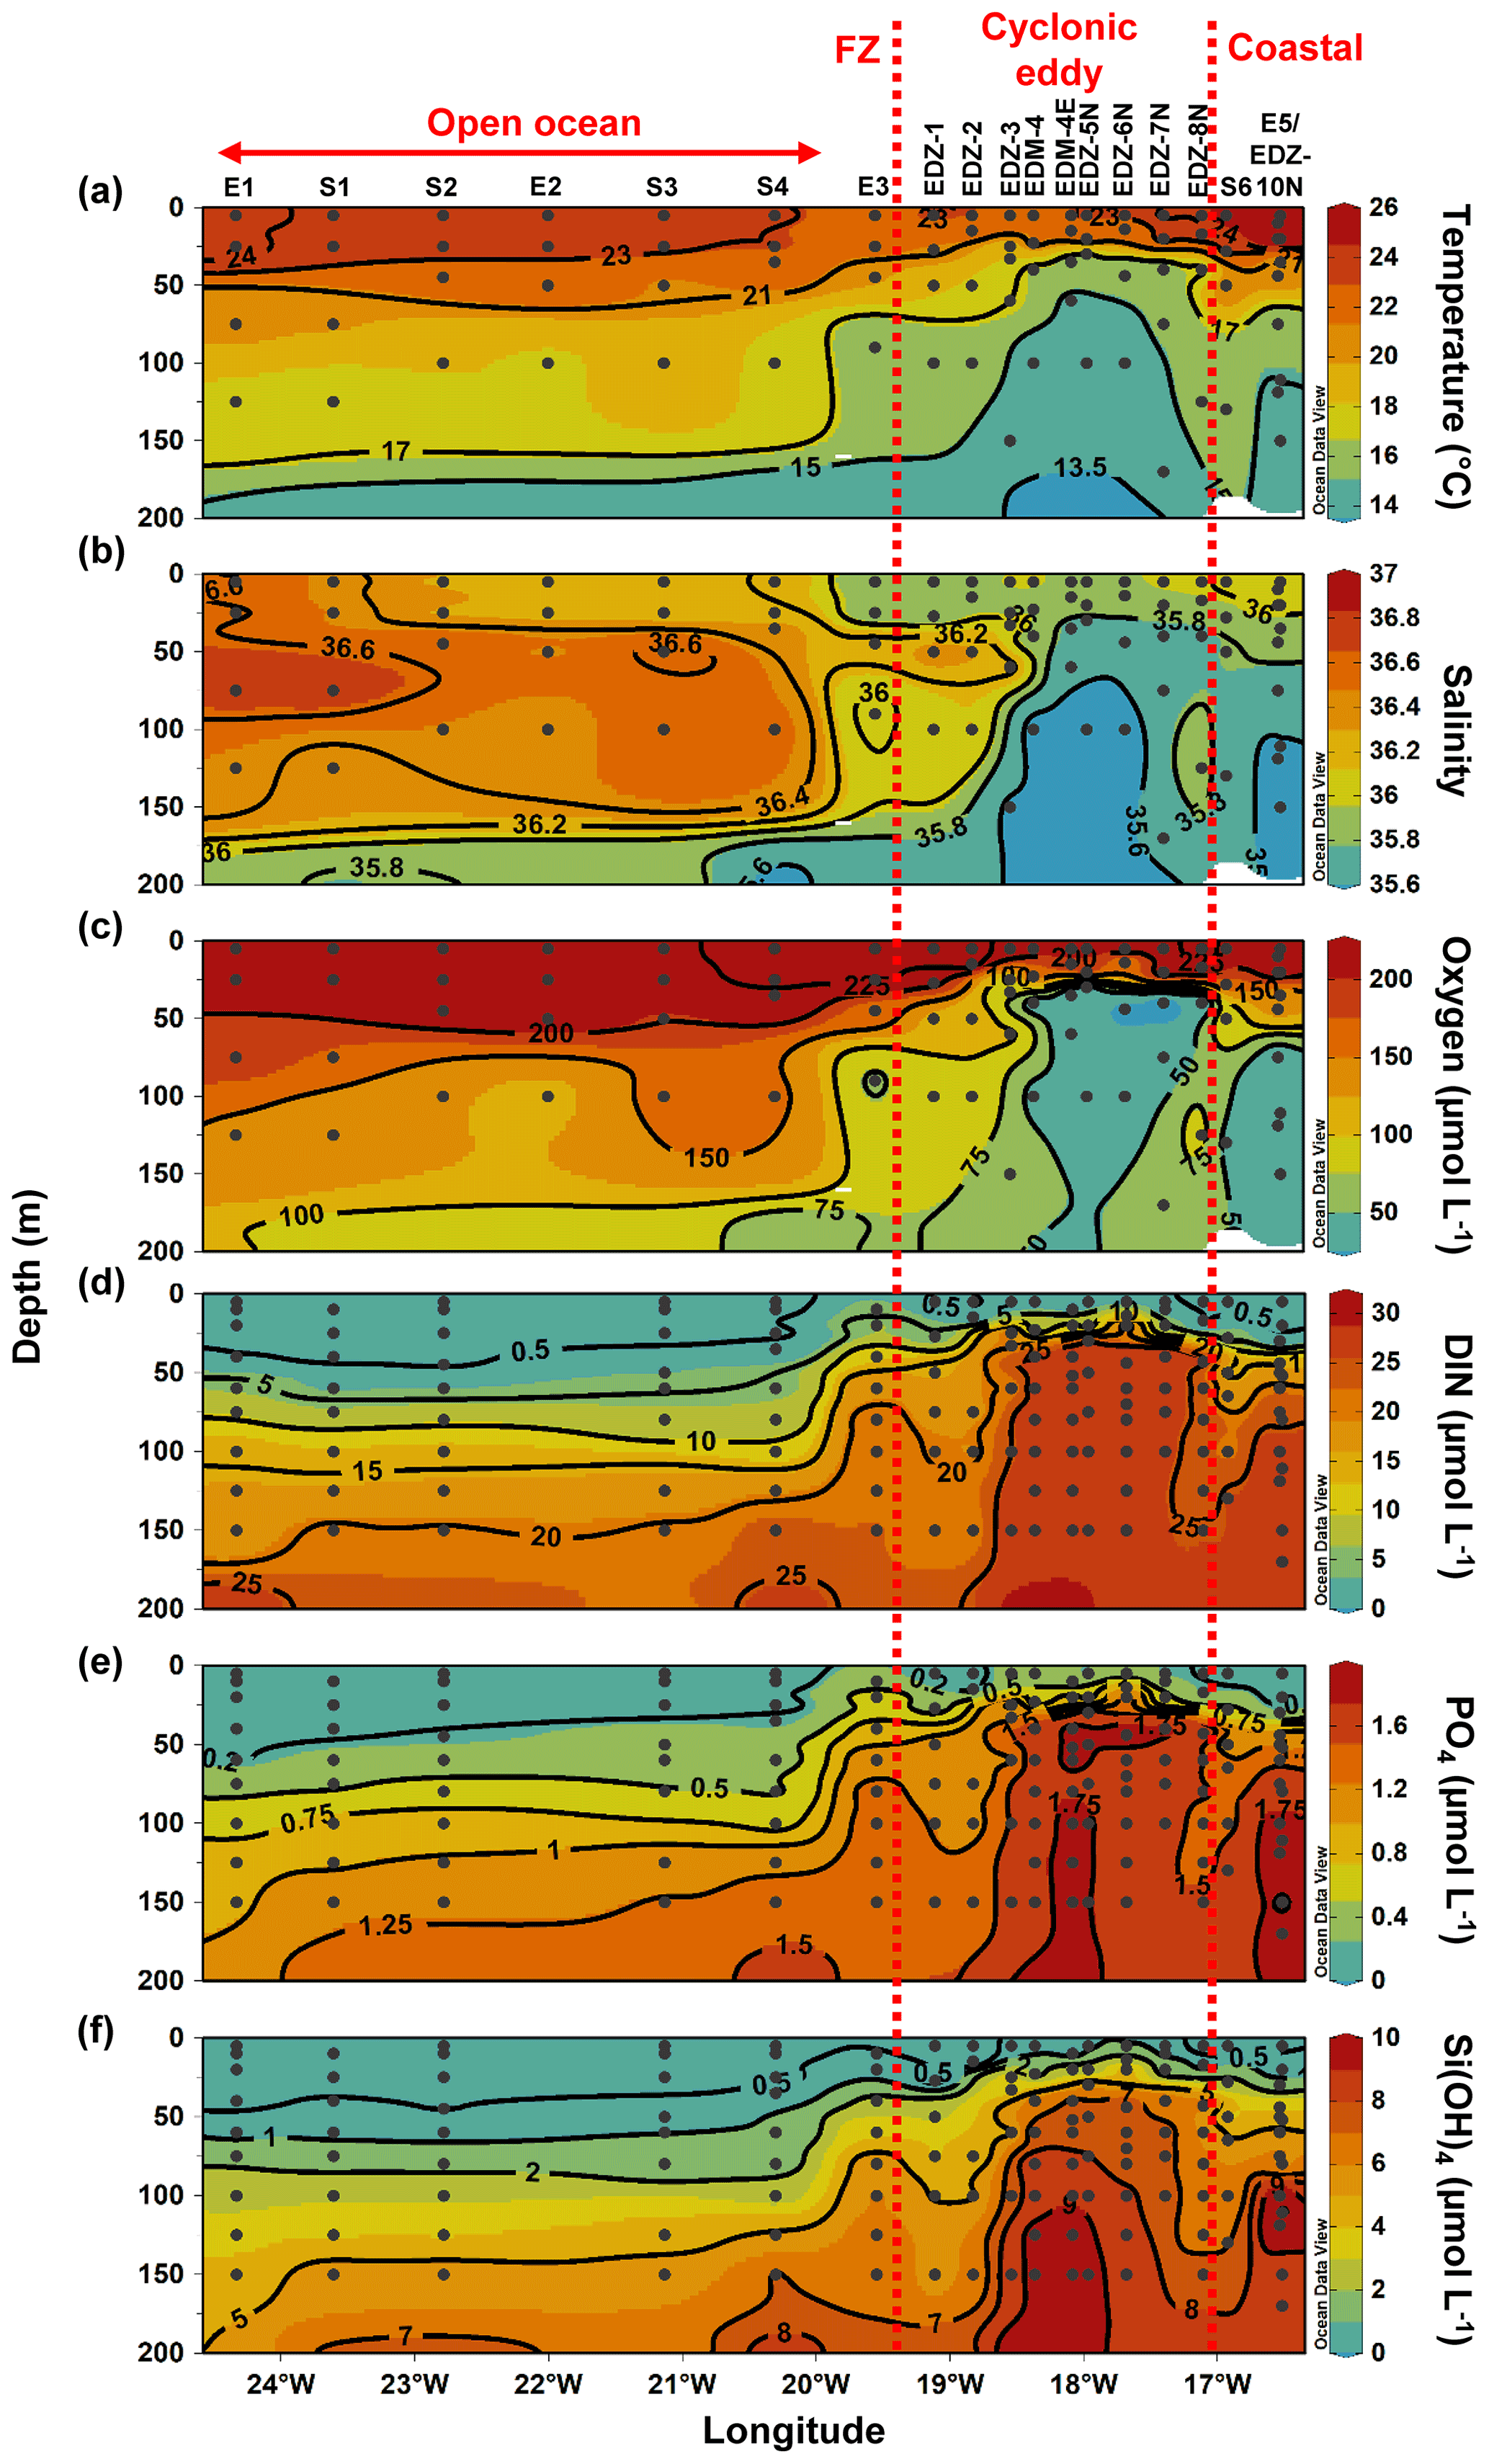
Figure 2Epipelagic distribution (0–200 m) of temperature (a), salinity (b), oxygen (c), total inorganic nitrogen (DIN) (d), phosphate (PO4) (e), and silicate (Si(OH)4) (f). Dashed red lines show the western and eastern boundaries of the cyclonic eddy periphery. FZ refers to frontal zone.
3.2 Chlorophyll a and primary production
In order to compare stations along the zonal transect and within the eddy, data were integrated over the water column (0–100 m depth). Along the zonal transect, depth-integrated Chl a concentration ranged between 11.7 and 58.7 mg m−2 and decreased from the coastal to the open ocean stations (Table 1; Fig. 3b). Depth distribution showed a Chl a maximum in the open ocean around ∼ 75 m from 23.61 to 24.33∘ W and around ∼ 50 m from 22.78 to 20.3∘ W, up to 0.68 µg L−1 (Fig. 4a). At the coastal stations, the Chl a maximum was found between 30–40 m depth with values up to 0.96 µg L−1. Integrated biomass of autotrophic pico- and nanoplankton (Table 1) ranged between 1.6 and 7.8 and between 3.6 and 6.1 g C m−2 in the open ocean and at the coastal stations, respectively. In the open ocean waters, the depth distribution of autotrophic pico- and nanoplankton biomass (Fig. 4b) showed a gradient from west to east with a concentration maximum at ∼ 75 m from 23.61 to 24.33∘ W, a concentrations maximum at ∼ 50 m from 22 to 22.78∘ W, and a concentrations maximum between 5–25 m from 21.13 to 20.3∘ W. Concentrations reached up to 166 µg C L−1. At the coastal stations, the maximum autotrophic pico- and nanoplankton biomass was found between 30–40 m depth with values up to 117 µg C L−1. Both Chl a concentration and autotrophic pico- and nanoplankton biomass did not vary significantly between the open ocean and the coastal stations (Tukey, p>0.05). Integrated total and dissolved primary production (PPTOT; PPDOC; Table 1) remained fairly constant with ranges of 101–137 and 42.8–78 mmol C m−2 d−1, respectively, at the coastal and the open ocean stations. An exception was the station furthest offshore (24.33∘ W), where rates decreased sharply to 25.8 mmol C m−2 d−1 for PPTOT and to 12.3 mmol C m−2 d−1 for PPDOC. The integrated percentage of extracellular release (PER; Table 1) ranged between 42.3 % and 67.5 %. PPDOC and PER did not vary significantly between the open ocean and the coastal stations (Tukey, p>0.05). PPTOT and PPDOC decreased with depth except for station E2 (Fig. 4c), while PER increased (Fig. 4d).
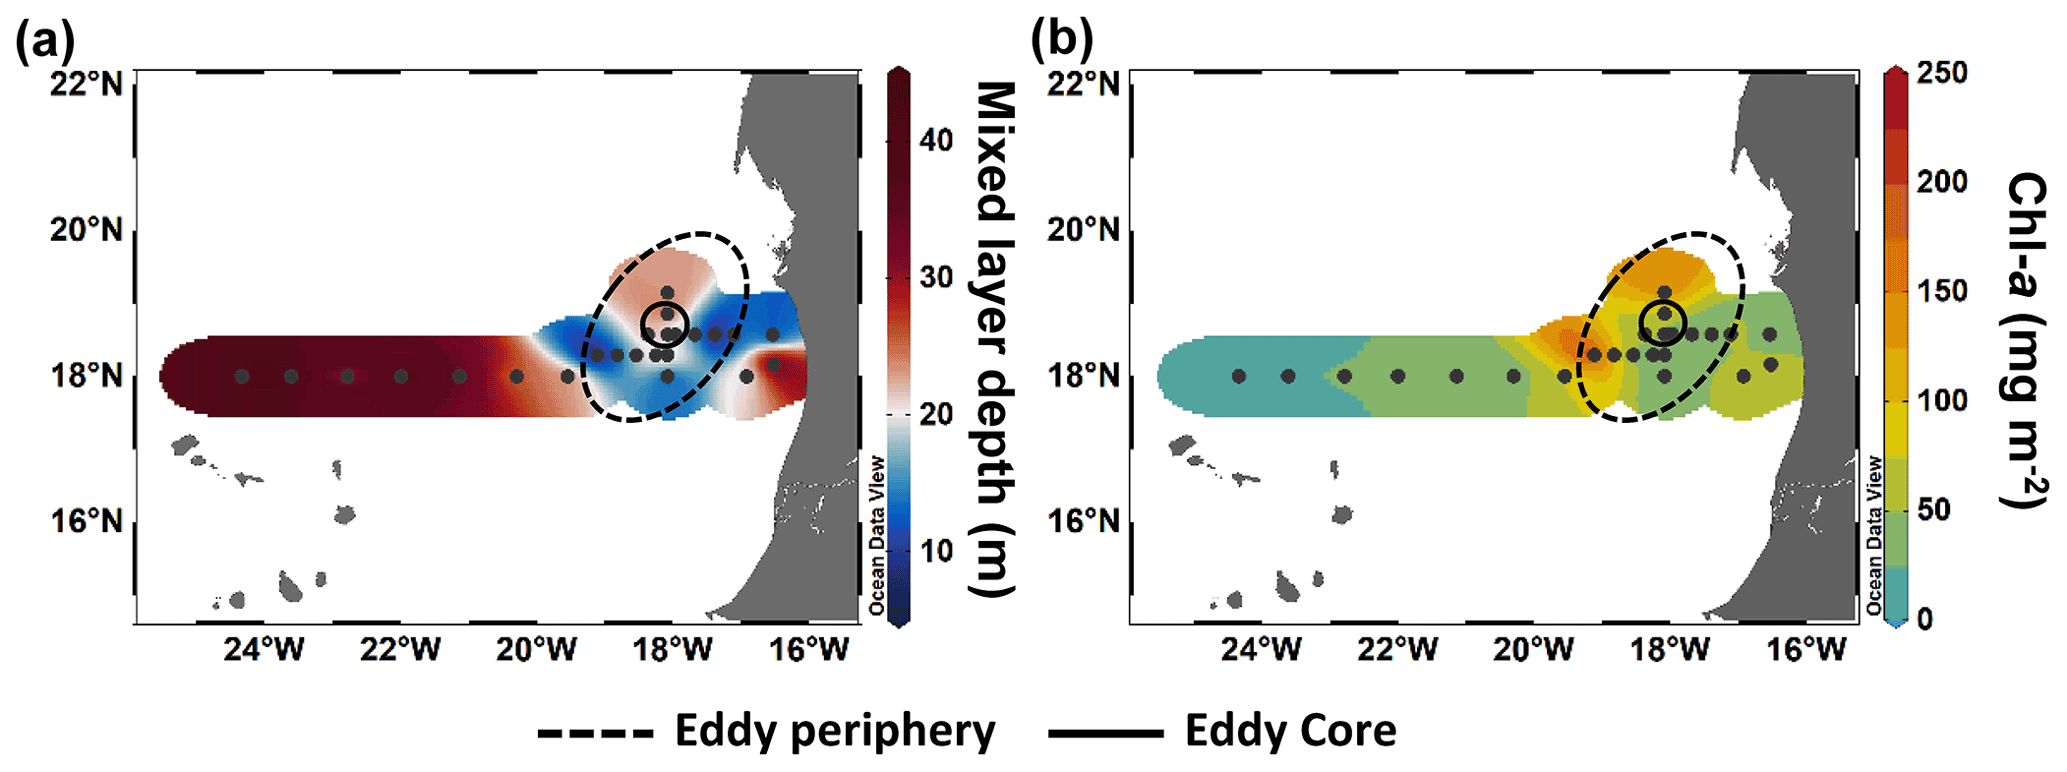
Figure 3Spatial distribution of maximum mixed layer depth (a) and integrated chlorophyll a (Chl a) over 100 m depth (b) during M156.
In the CE (core and periphery) and at the frontal zone, integrated Chl a concentration ranged from 17.2 to 225 mg m−2 (Table 1). The Chl a distribution (Fig. 3a) showed a clear spatial separation with the highest values (98.7–225 mg m−2) in the western and northern (148 mg m−2) parts of the CE and lowest values (26.8–37.5 mg m−2) in the southern and eastern parts. Depth distribution of Chl a concentration also differed across the eddy, with values >0.5 µg L−1 reaching down to 45 m depth at the frontal zone and the western part of the CE and down to 30 m depth in the eastern part of the CE (Fig. 4a). The highest concentrations were detected in the western part of the eddy with 8.7 µg L−1 at station EDZ-1 at 27 m. Within the upper 30 m, Chl a concentration within the CE was significantly higher than at the open ocean and the coastal stations (ANOVA, p<0.05). Integrated autotrophic pico- and nanoplankton biomass ranged between 0.3 and 4.7 g C m−2 in the CE (Table 1). Depth distribution of autotrophic pico- and nanoplankton biomass (Fig. 4b) showed low biomass in the upper 40 m (<25 µg C L−1) from 18.83 to 19.11∘ W. In contrast, higher biomass (>25 µg C L−1) occurred in the more eastern stations of the CE (17.11 to 18.54∘ W) and westwards from the frontal zone (19.55∘ W). In the eddy, autotrophic pico- and nanoplankton biomass reached higher concentrations mainly within the upper 40 m, with values up to 191 µg C L−1. Depth-integrated PPTOT and PPDOC rates were significantly higher in the CE and at the frontal zone than in the open ocean and the coastal stations (Tukey, p<0.05) with values ranging from 245 to 687 mmol C m−2 d−1 and from 95.9 to 238 mmol C m−2 d−1, respectively (Table 1). PPTOT rates (Fig. 4c; Table 2) were fairly constant across the CE's surface (5 m depth), ranging between 11.2 and 13.7 µmol C L−1 d−1, but varied strongly between 15–40 m depth (0.2–14.5 µmol C L−1 d−1). The highest PPTOT rates were found in the frontal zone with up to 25.0 µmol C L−1 d−1 at the surface. The range of PPDOC rates (Table 2; Fig. 4d) was larger in the CE (0.2–4.9 µmol C L−1 d−1) and the frontal zone (0.7–7.8 µmol C L−1 d−1) than in the open ocean and at the coastal stations. Integrated PER had a range of 29.4 %–40.8 % (Table 1). Compared to open ocean and coastal stations, a slightly lower PER was observed within the upper 40 m (Fig. 4e) for the CE and frontal zone.
Table 1Chlorophyll a (Chl a) and abundance, biomass, and activity of phyto- and bacterial plankton, integrated over the upper 100 m depth. “–” indicates that the variable was not measured. Sampling date, time, and depth can be found in Table S1.
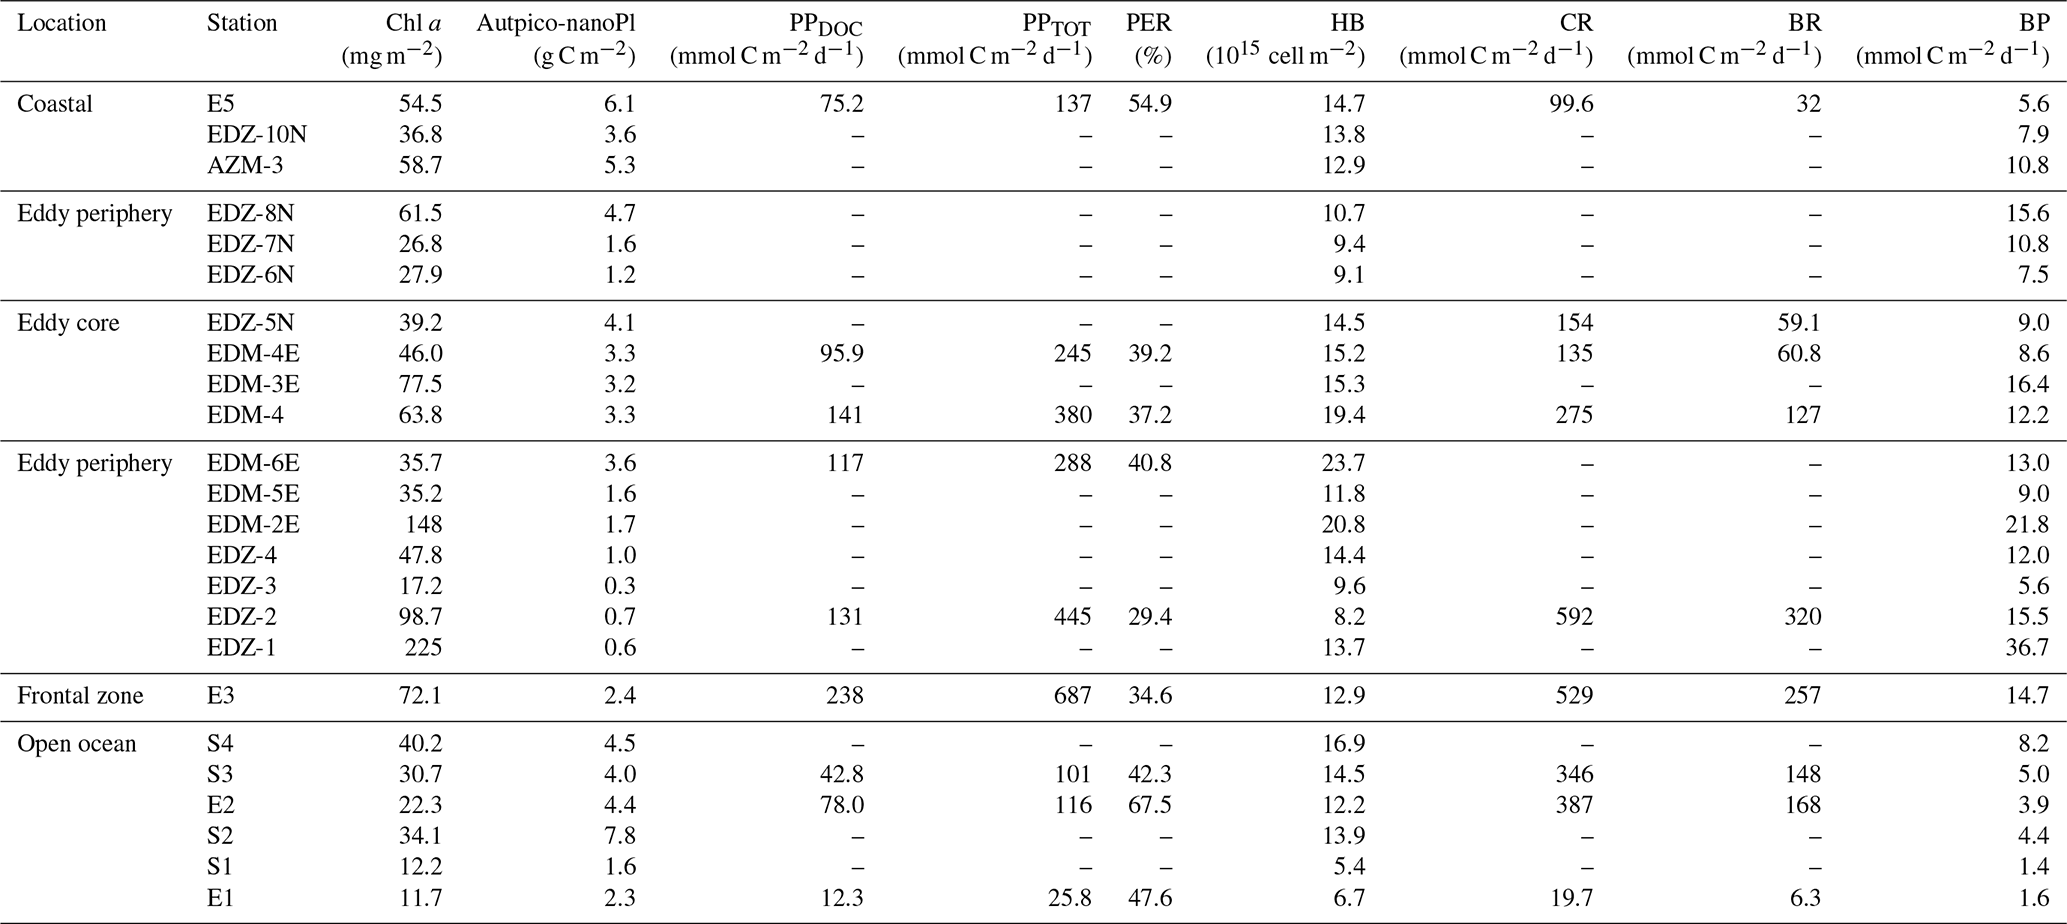

Figure 4Depth distribution of phytoplankton biomass and activity from the surface to 100 m. Chlorophyll a (Chl a; a), autotrophic pico- and nanoplankton biomass (Aut pico-nanoplankton; b), total primary production (PPTOT; c), dissolved primary production (PPDOC; d), and percentage of extracellular release (PER; e). Dashed red lines show the western and eastern boundaries of the cyclonic eddy periphery. FZ refers to frontal zone.
3.3 Bacterial abundance and activities
Heterotrophic bacterial abundance decreased with depth and was highest in the upper 50 m at all stations (Fig. 5a). At the coastal and open ocean stations, integrated (0–100 m) heterotrophic bacteria abundance ranged between 12.9–14.7 and 5.4–16.9×10¹⁵ cells m−2, respectively (Table 1). No significant differences in heterotrophic bacterial abundance were observed between the open ocean and coastal stations (Tukey, p>0.05). In the open ocean waters, the lowest integrated BR and CR rates were observed at the station furthest offshore (E1), with 6.3 and 19.7 mmol C m−2 d−1, respectively (Table 1). At the other open ocean stations, integrated BR and CR rates ranged between 148–168 and 346–348 mmol C m−2 d−1, respectively, which was higher than at the coastal station with BR rates of 32 and CR rates of 98 mmol C m−2 d−1. Overall, BR and CR rates were higher in the open ocean stations than in the coastal ones with the highest rates (>1 and >2.5 µmol C L−1 d−1, respectively) in the top 60 m (Figs. 5b, S4a). Integrated BP, in contrast, was generally higher at the coastal stations with 5.6–10.8 mmol C m−2 d−1 compared to the open ocean ones with 1.4–8.2 mmol C m−2 d−1 (Table 1). However, volumetric BP rates were not significantly different from the open ocean (Tukey, p>0.05), where BP rates were more variable. At the coastal stations, the highest BP rates were observed either at the surface (5 m) or at around ∼ 40 m depth, while in the open ocean, the highest rates were constantly found in the surface samples (Fig. 5c). BGE was determined for the upper 50 m and showed little variability with depth (Table 2; Fig. 5d). However, BGE was significantly higher (Tukey, p<0.05) at the coastal stations (9.6 ± 3.7 % to 14.1 ± 1.7 %) compared to the open ocean ones (1.7 ± 0.1 % to 4.2 ± 0.04 %). We estimated the predominance of autotrophy or heterotrophy in the system by dividing the PPTOT rates by CR (Mouriño-Carballido and McGillicuddy, 2006). Heterotrophic conditions () occurred at the open ocean stations throughout the water column, while autotrophic conditions () prevailed at the coastal St. E5 ( ratio ranging from 0.7 to 1.9; Table 2). This pattern was preserved when data were integrated over the mixed layer (Fig. 6). PPDOC rates were sufficient to satisfy the BCD at the coastal St. E5 but not in the open ocean stations (Table 2).
In the CE and at the frontal zone, integrated heterotrophic bacterial abundance ranged from 8.2–23.7×10¹⁵ cells m−2 (Table 1). In the CE, substantial variation in bacterial abundance occurred within the upper 20 m (Fig. 5a), with an abundance of <1×10⁹ cells L−1 in the western periphery of the CE and >3×10⁹ cells L−1 in the CE core stations. Depth-integrated BR and CR ranged between 59.1 and 320 and between 135 and 592 mmol C m−2 d−1, respectively (Table 1). Elevated BR and CR rates (>1 and 2.5 µmol C L−1 d−1, respectively) were only present in the upper ∼ 30–40 m of the CE (Figs. 5b, S4a). Integrated BP rates ranged from 5.6 to 36.7 mmol C m−2 d−1 in the CE and at the frontal zone stations (Table 1). BP rates were elevated in the upper 40 m of the CE and at the frontal zone and significantly higher than in the majority of the coastal and open ocean stations (Tukey, p<0.05). Stations in the core of the CE had BGEs (Table 2; Fig. 5d) significantly higher than at the stations located in the open ocean (Tukey, p<0.05). BGE had a range of 2.7 ± 2.9 % to 18.3 ± 1.0 % and 5.1 ± 0.2 % to 5.5 ± 2.4 % in the CE and the frontal zone stations, respectively. The highest BGE was observed at 15 m depth in the CE core (18.3 %, St. EDM-4E). The CE and frontal zone stations showed net heterotrophy and net autotrophy (Table 2), with a ratio ranging from 0.2 to 1.9. When integrated over the mixed layer (Fig. 6), stations within the core of the CE and at the frontal zone were net autotrophic, with a ratio ranging from 1.42 to 1.85, while net heterotrophy occurred at the eddy periphery. PPDOC was on average equivalent to 71 % of the BCD within the CE and at the frontal zone, ranging from 27.9 % to 110 % (Table 2).
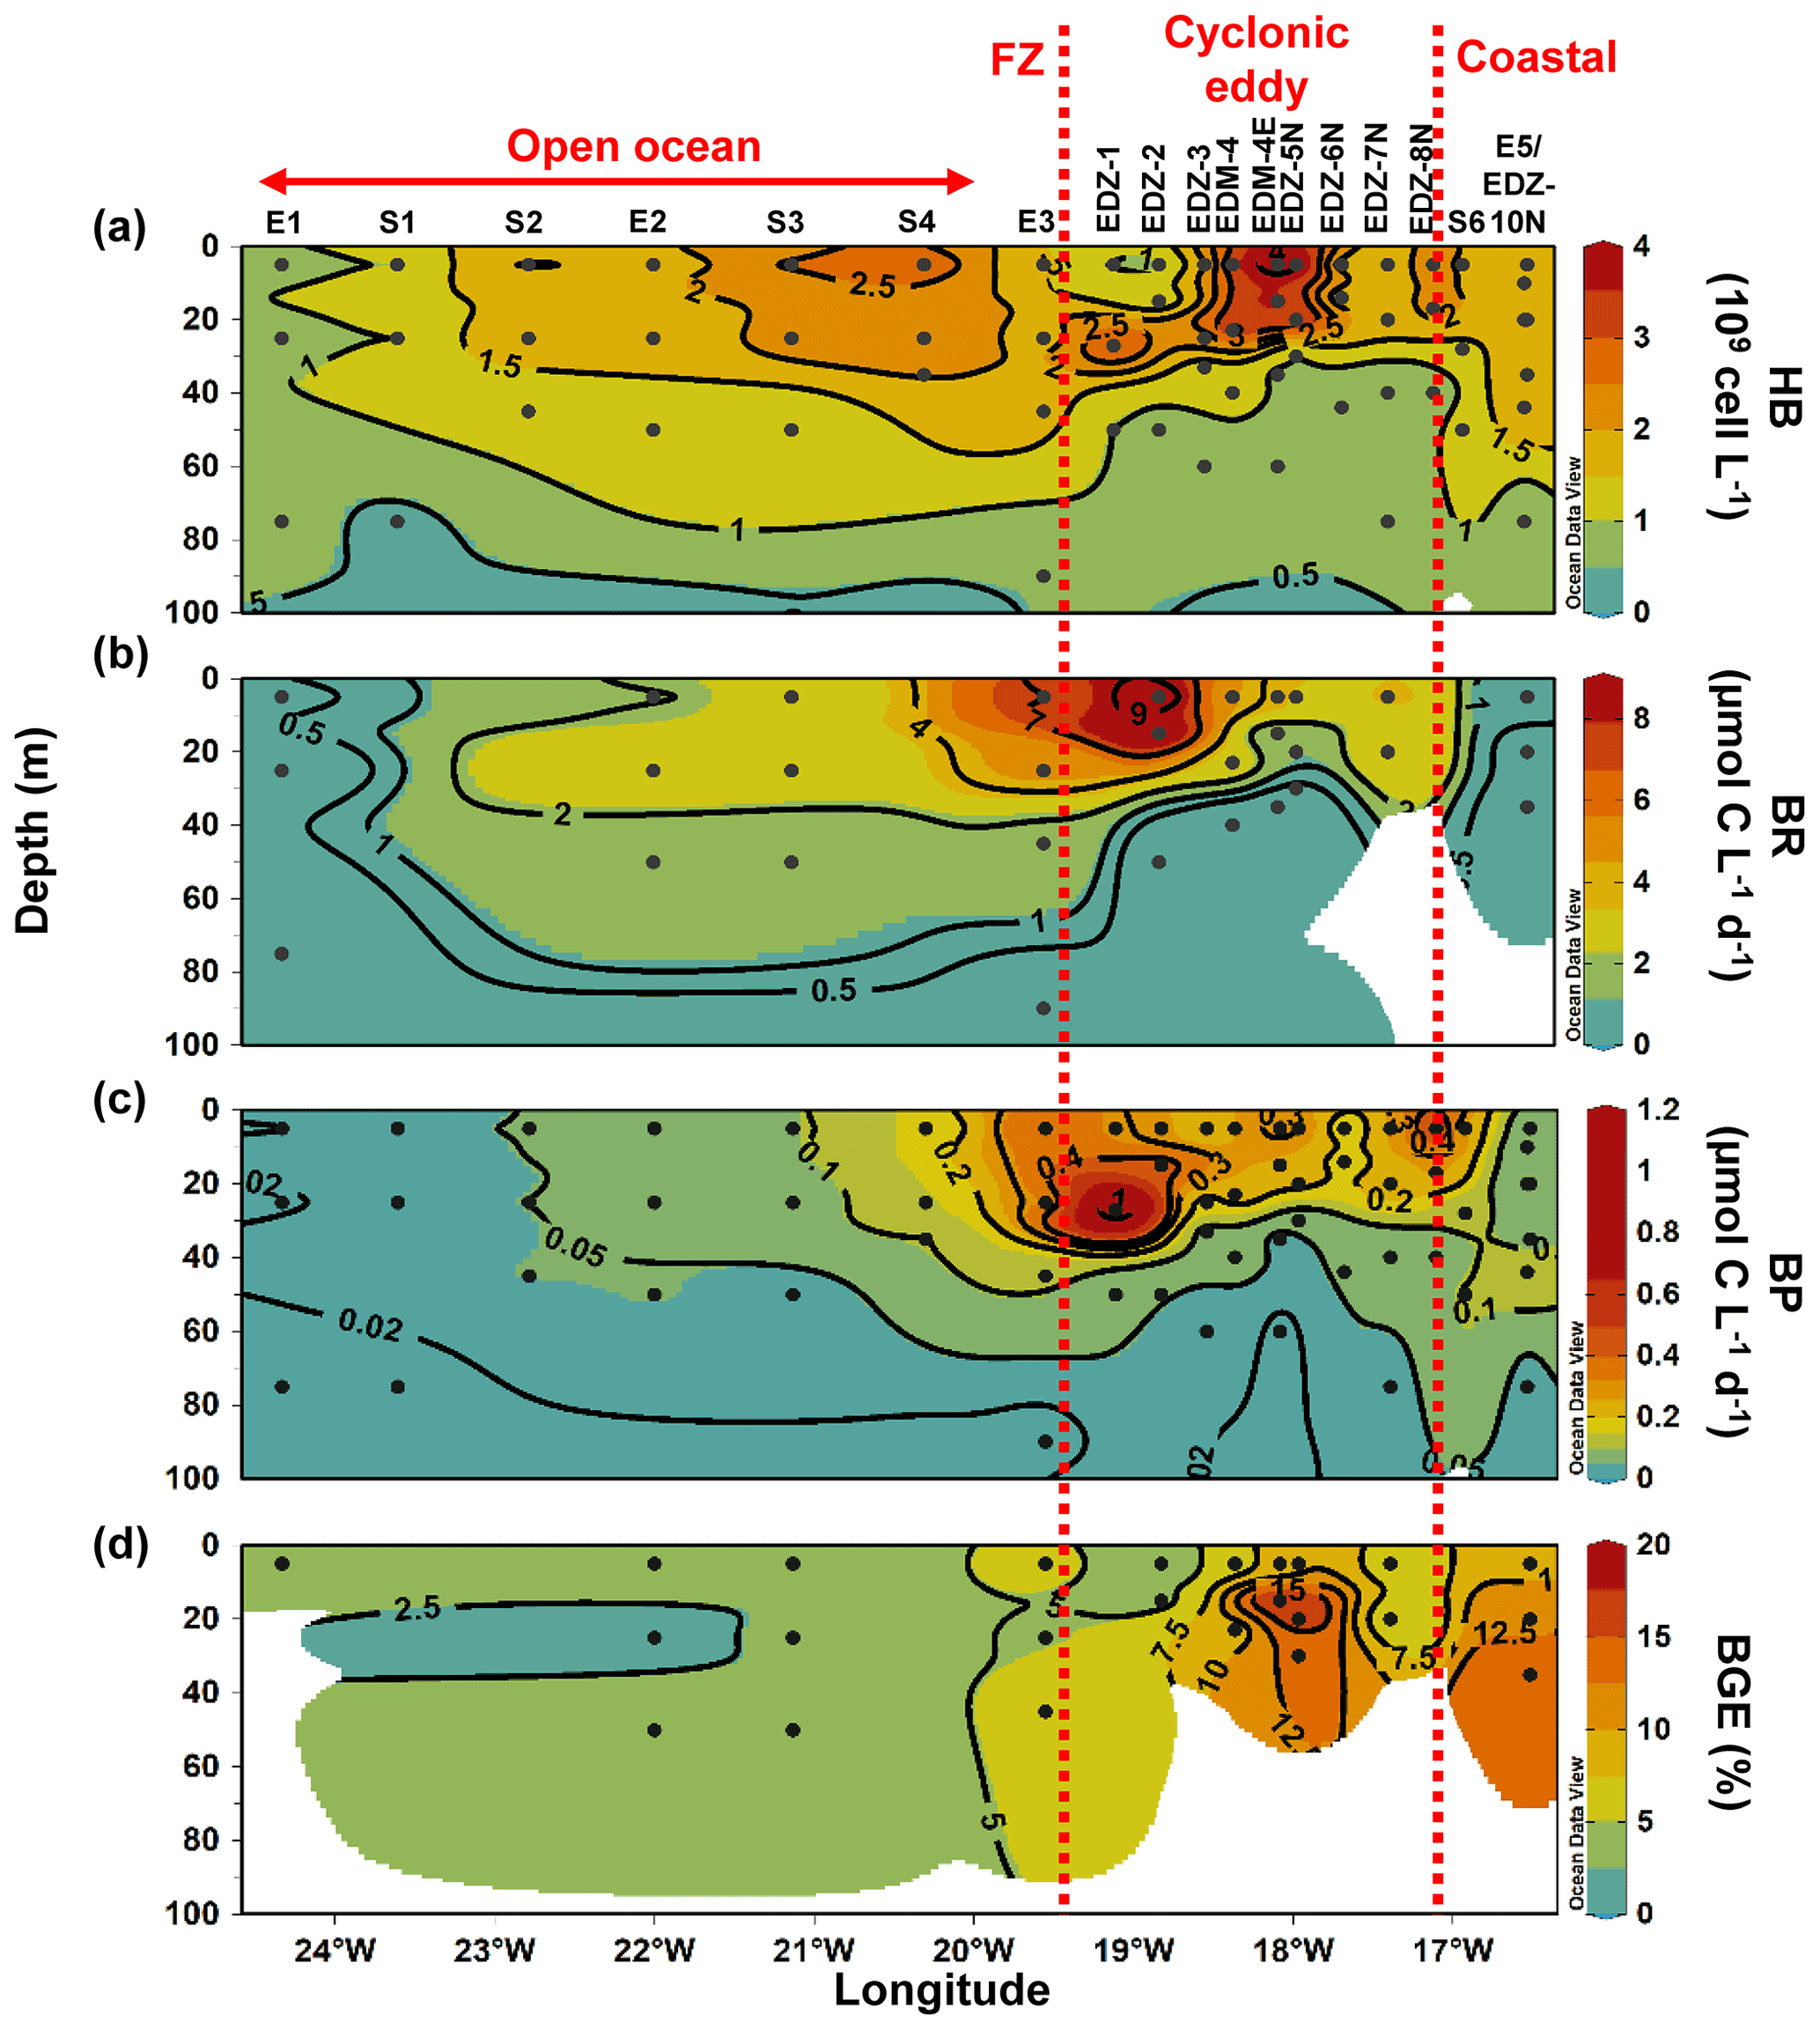
Figure 5Depth distribution of heterotrophic bacterial abundance and activities from the surface to 100 m. Heterotrophic bacterial abundance (HB; a), bacterial respiration (BR; b), bacterial production (BP; c), and bacterial growth efficiency (BGE; d). Dashed red lines show the western and eastern boundaries of the cyclonic eddy periphery. FZ refers to frontal zone. BP and CR rates at in situ temperature were estimated based on López-Urrutia and Morán (2007) and on Regaudie-de-Gioux and Duarte (2012). BR rates were estimated from measured and temperature-corrected CR rates based on Aranguren-Gassis et al. (2012). Details are provided in the methods section and the Supplement.
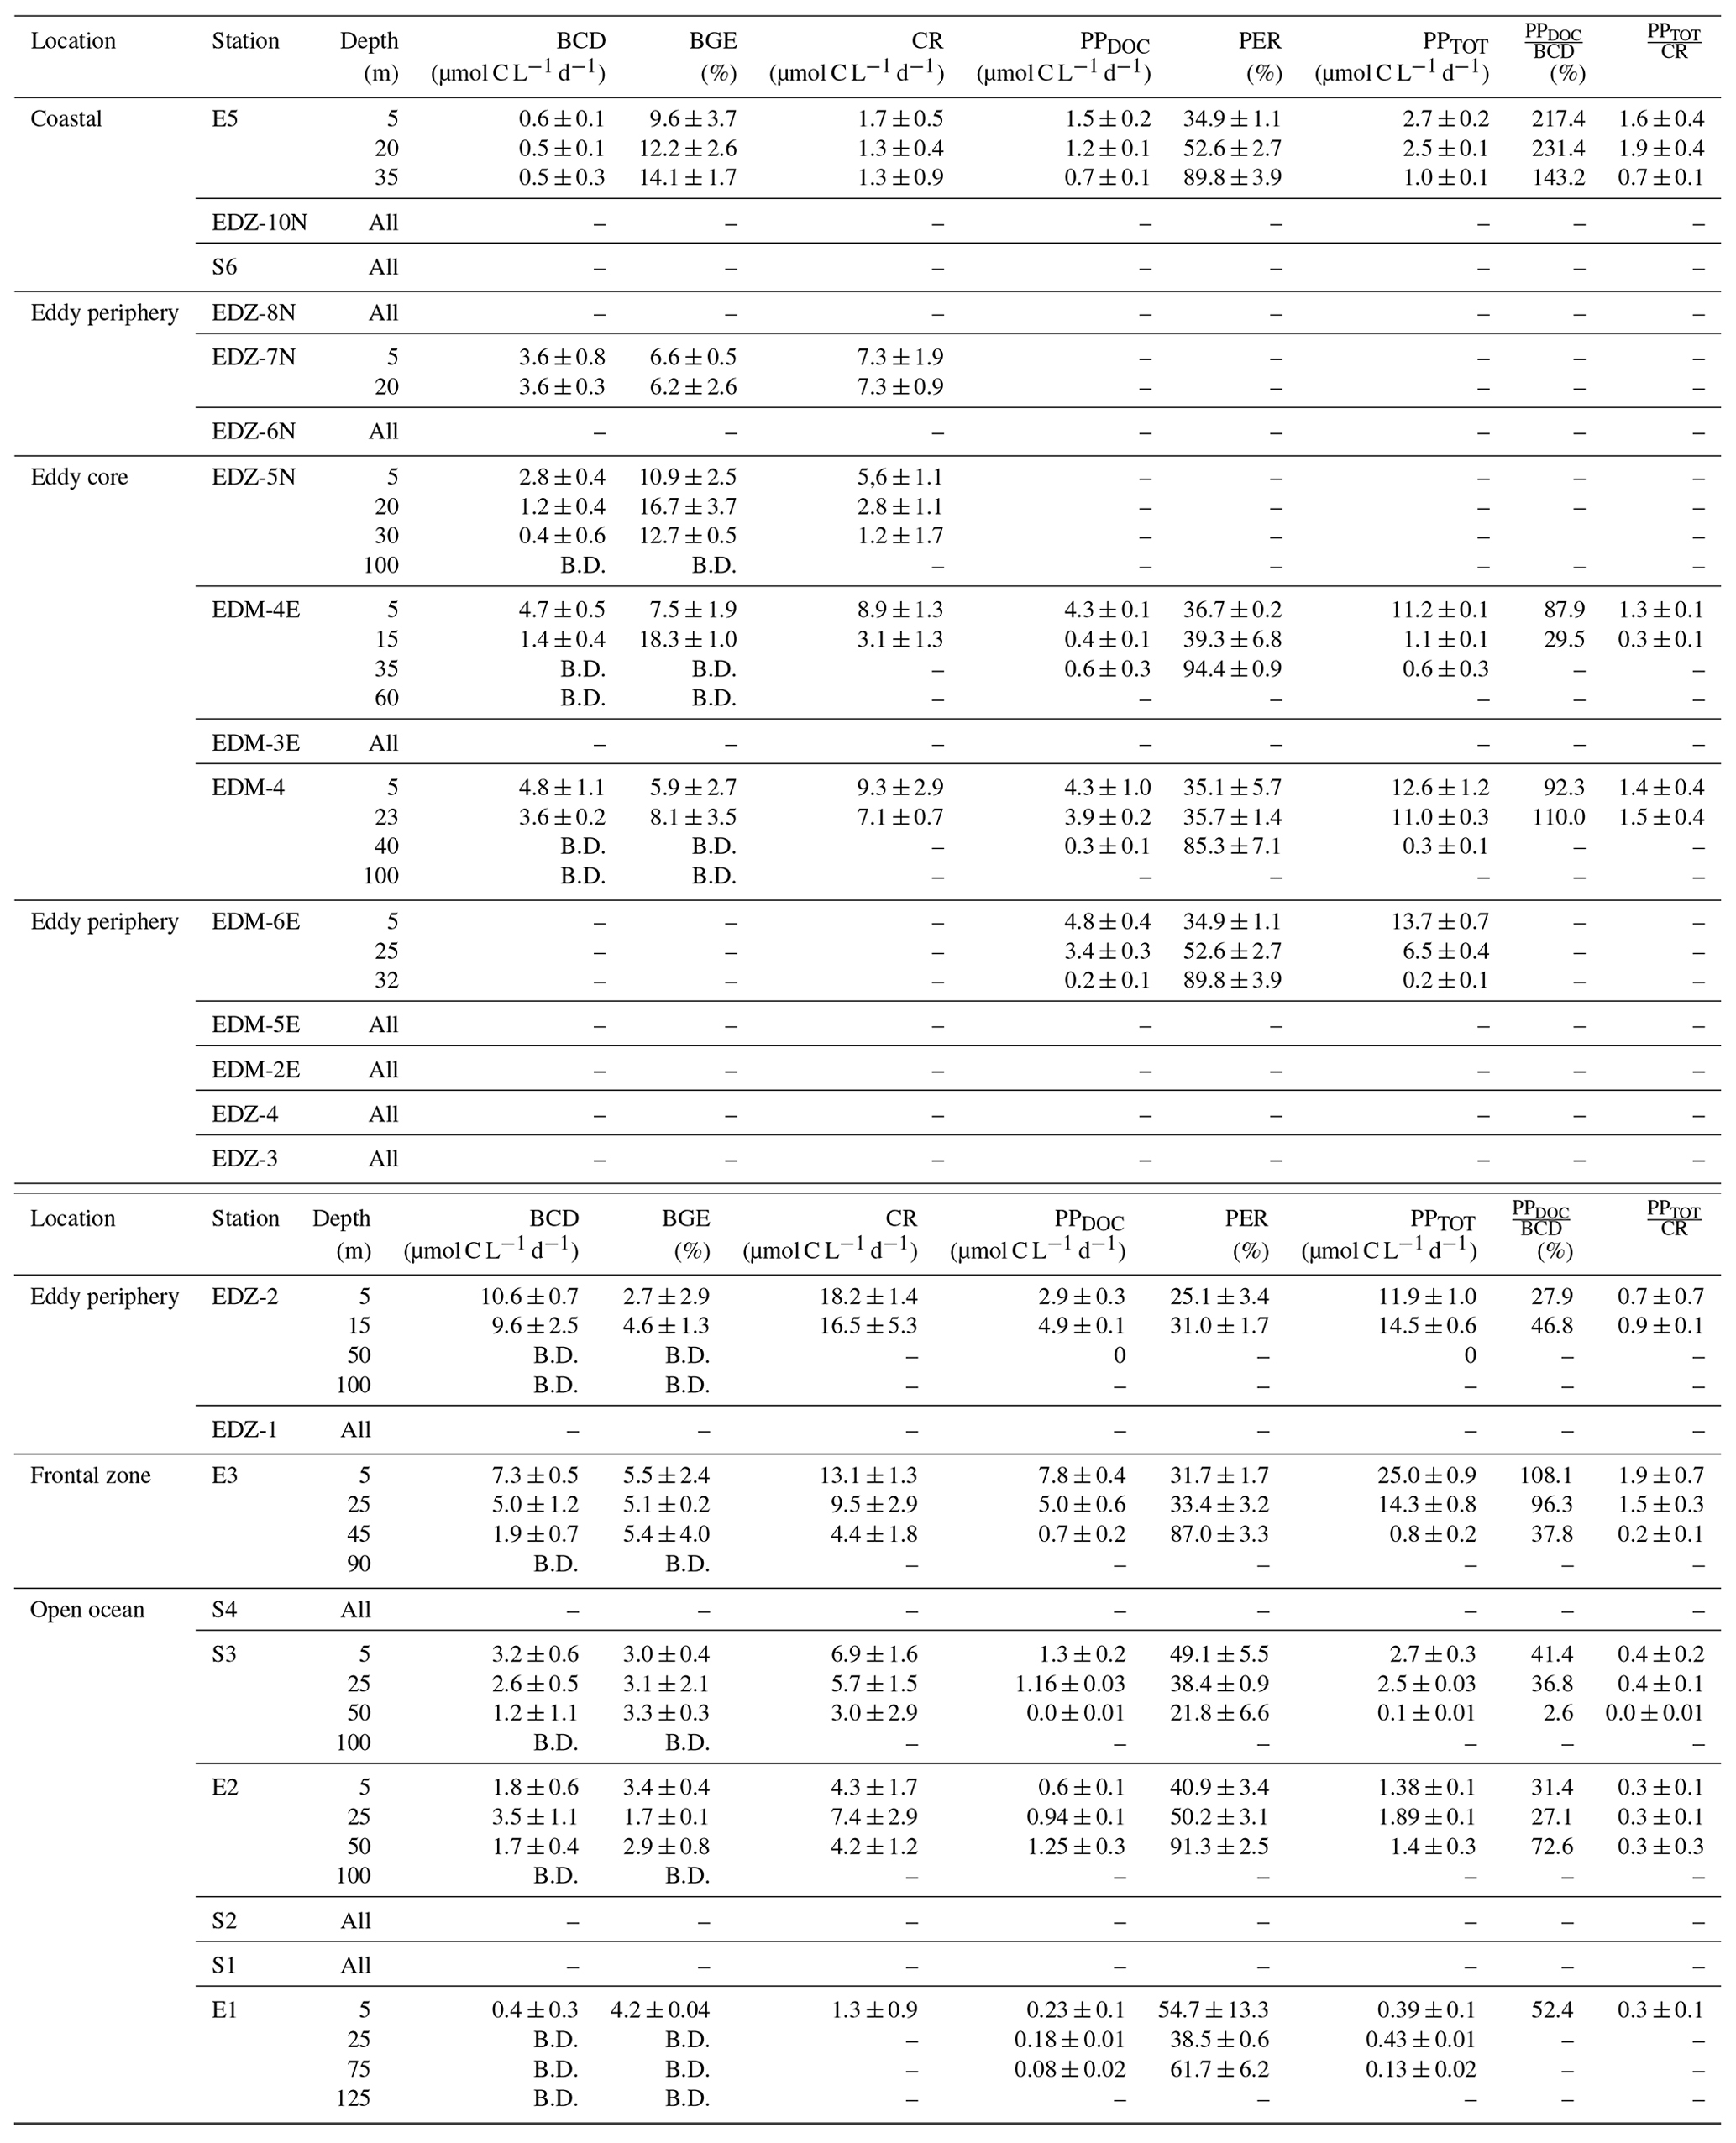
Table 2Average (mean) ± standard deviation of microbial metabolic activities during M156: bacterial carbon demand (BCD); bacterial growth efficiency (BGE); dissolved primary production (PPDOC); percentage of extracellular release (PER); total primary production (PPTOT); the ratio between PPDOC and BCD (); and the ratio between PPTOT and CR (). BCD and BGE were obtained from temperature-corrected BP and BR rates (see text). “–” indicates that the parameter was not measured, and “B.D.” signifies below detection (see text). Sampling date, time, and depth are given in Table S1.
3.4 Semi-labile dissolved organic carbon
Between coastal and open ocean stations, SL-DOC concentration was not significantly different (Tukey, p>0.05; Fig. S4b) with ranges of 1.9–8.0 µmol L−1 at the coastal and 1.6–18.9 µmol L−1 at the open ocean stations. At those sites, SL-DOC distribution was rather uniform in the upper 40 m with SL-DOC >5 µmol L−1, except from the station furthest offshore (St. E1) where SL-DOC > 5 µmol L−1 was limited to shallow depths (5 m). In the CE and at the frontal zone, SL-DOC concentration was clearly elevated and increased from east to west with an overall range of 1.4–54.4 µmol L−1. At the frontal zone, SL-DOC concentration >5 µmol L−1 was detectable down to 90 m depth.

Figure 6Integrated total primary production (PPTOT) and community respiration (CR) rates over the mixed layer during M156.
3.5 Correlation analysis
We applied a Pearson correlation matrix (Fig. 7) to reveal significant correlations between the measured parameters in the stations outside (open ocean + coastal) and inside (cyclonic eddy + frontal zone) the area influenced by the eddy. In both regimes, temperature correlated negatively with nutrients (DIN, PO4, and Si(OH)4; , −0.67, and −0.67, respectively, for the stations outside and , −0.96, and −0.95 for the stations inside the area influenced by the eddy, p<0.001) and positively with bacterial abundances (r=0.51 and 0.68, respectively, p<0.001).
In the stations outside the influence of the eddy, total (PPTOT) and dissolved primary production (PPDOC) rates were not correlated to Chl a or autotrophic pico- and nanoplankton biomass (p>0.05). In contrast, heterotrophic bacterial abundance (HB) and the bacterial biomass production (BP) were correlated to primary productivity rates (r=0.85 and r=0.82, respectively, for PPTOT and r=0.77 and 0.77, respectively, for PPDOC, p<0.001), Chl a (r=0.64 and 0.72, respectively, p<0.001), autotrophic pico- and nanoplankton biomass (r=0.42 and 0.46, respectively, p<0.001), and the concentration of semi-labile DOC (SL-DOC; r=0.61 and 0.56 , p<0.001). However, bacterial respiration (BR) was not correlated to any variable (p>0.05).
In the stations influenced by the eddy, PPTOT was positively correlated to Chl a (r=0.55, p<0.05), whereas PPDOC (r=0.47, p>0.05) was not, and both were not correlated to the autotrophic pico- and nanoplankton biomass. Chl a and SL-DOC were significantly correlated (r=0.36, p<0.001). In contrast to the stations outside the eddy, HB was not correlated to PPTOT, PPDOC, and SL-DOC (p>0.05) but was still strongly correlated to Chl a and autotrophic pico- and nanoplankton biomass (r=0.57 and 0.76, respectively, p<0.001). BP, in contrast, was correlated to PPTOT and PPDOC (r=0.63 and 0.59, respectively, p<0.05) and strongly to Chl a (r=0.92, p<0.001). BP correlated also to autotrophic pico- and nanoplankton biomass and to SL-DOC, albeit to a lesser extent (r=0.41 and 0.43, respectively, p<0.05). In contrast to stations not influenced by the eddy, BR was strongly correlated to Chl a and SL-DOC (r=0.83 and 0.76, respectively, p<0.001). However, BR was not significantly correlated to autotrophic pico- and nanoplankton biomass, PPTOT, and PPDOC (, 0.61, and 0.50, respectively, p>0.05).
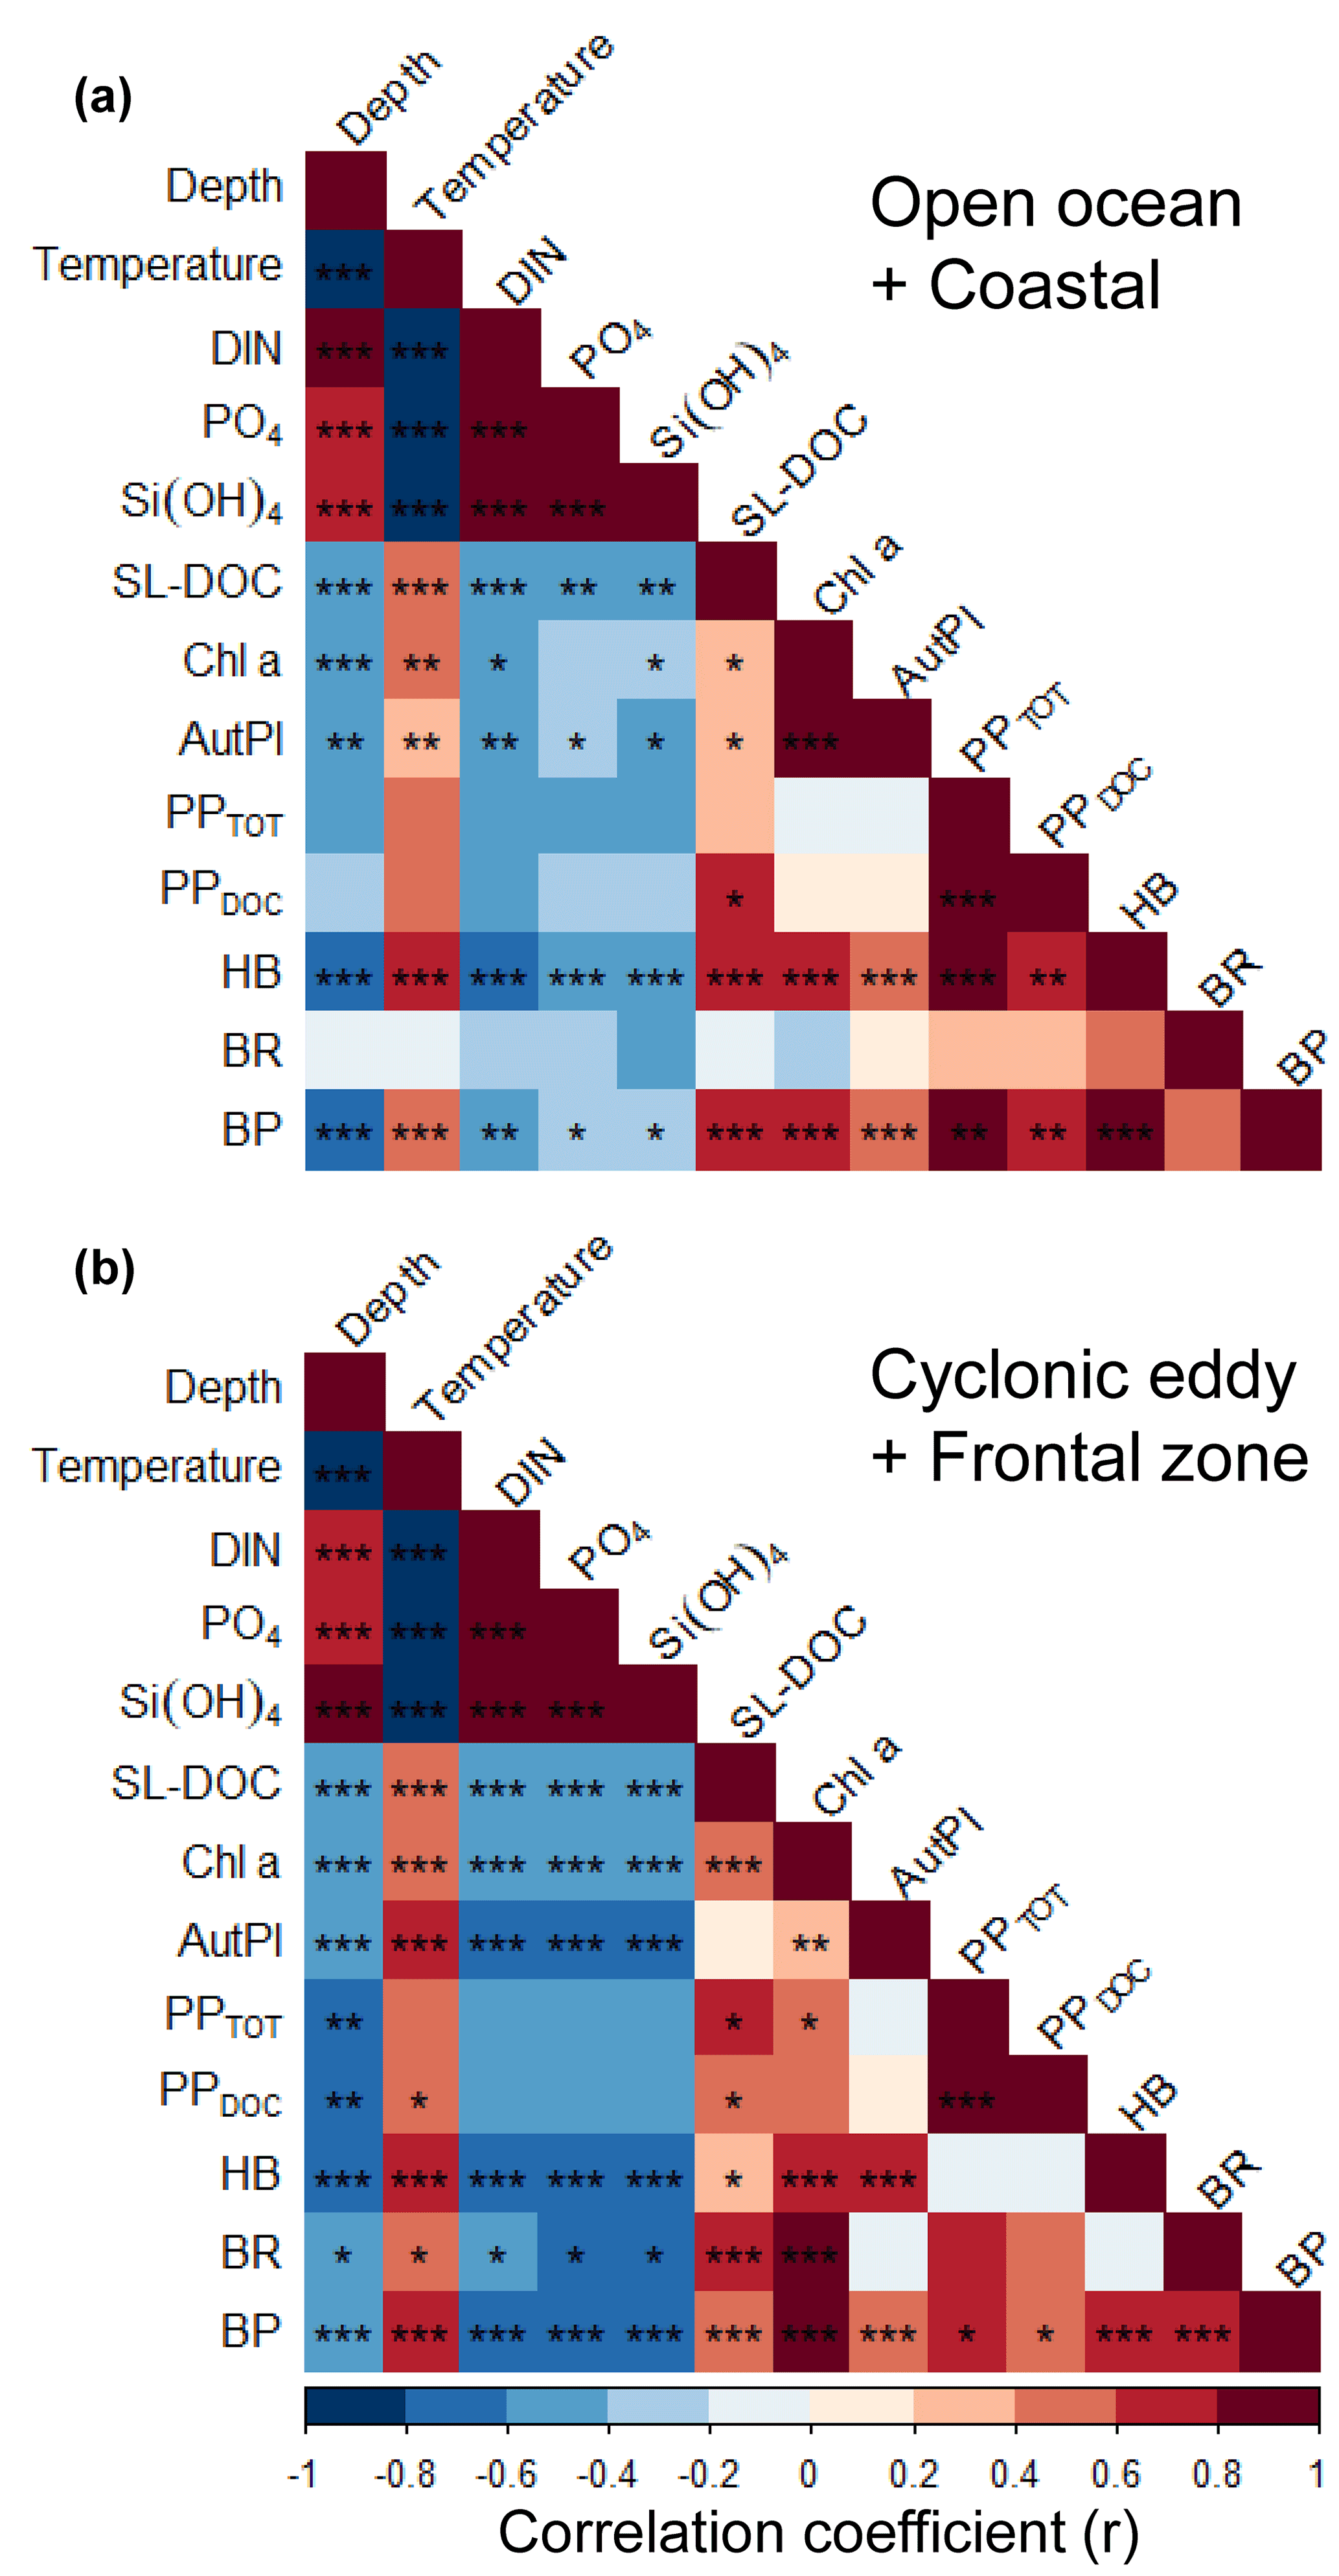
Figure 7Pearson correlation matrix of biochemical parameters, metabolic activities, and bacterial abundance in the upper 100 m in samples not influenced by the cyclonic eddy (i.e. coastal and open ocean stations) (a) and samples influenced by the cyclonic eddy (b). Statistical significance: <0.001, <0.01, * <0.05.
4.1 Effect of a cyclonic eddy on the distribution of phytoplankton abundance and activity in the Mauritanian upwelling system
In general, coastal Chl a concentration during this study was not as high as observed in earlier studies with strong coastal upwelling (e.g. Alonso-Sáez et al., 2007; Agustí and Duarte, 2013; Arístegui et al., 2020). This might be related to the relatively weak upwelling resulting from weak surface winds along the Mauritanian coast typically occurring during summer when our samples were collected (Pelegrí and Peña-Izquierdo, 2015). Consequently, during summer, fewer nutrients reach the euphotic zone. At the same time, offshore surface wind remained strong, enhanced vertical mixing, and may explain why coastal Chl a concentration was only slightly higher compared to the open ocean. When excluding the eddy-influenced stations, there was no marked gradient in phytoplankton productivity either, unlike other regions of the CanUS (Demarcq and Somoue, 2015; Arístegui et al., 2020). PPTOT and PPDOC rates stayed rather constant from the coast to the open ocean and were in the range of reported rates in oligotrophic offshore waters of the CanUS (Agustí and Duarte, 2013; Lasternas and Agustí, 2014). The spatial distribution of SL-DOC was relatively uniform as well when considering the coastal and open ocean stations only. PER in our study was on average 51.1 ± 17 % in both the open ocean and the coastal stations, which is in contrast to previous findings. For example, Agustí and Duarte (2013) reported PER to range from ∼ 1 % in “healthy” communities from the upwelled waters of the CanUS to ∼ 70 % in “dying” communities from the oligotrophic waters of the ETNA. PER values have been reported to increase with nutrient depletion (Obernosterer and Herndl, 1995; Agustí and Duarte, 2013; Lasternas et al., 2014; Piontek et al., 2019) among other factors (see review by Mühlenbruch et al., 2018). Since upwelling was weak during our sampling period, low nutrient concentrations in the surface waters might explain the relatively high PER that we observed near the coast.
The CE broke this rather uniform distribution of phytoplankton productivity from the coastal to the open ocean waters. Chl a isolines were pushed towards the surface in the CE (Fig. 4a). A similar uplifting of Chl a isolines towards the surface has been reported for other eddies (Lochte and Pfannkuche, 1987; Feng et al., 2007; Noyon et al., 2019) and might result from phytoplankton relocation through intense vertical mixing by strong surface winds (Feng et al., 2007; Noyon et al., 2019). Before our eddy survey, strong surface winds occurred offshore (Supplement Fig. S5), which might explain the high Chl a concentration (>0.5 µg L−1) that we found at the surface (5 m) of all stations within the CE. Within the eddy, we observed that Chl a was higher in the western than in the eastern part of the eddy (Figs. 3b and 4a). Chelton et al. (2011) showed based on satellite observations that due to the rotational flow and the westward propagation of CEs, Chl a tends to accumulate in their southwest quadrants while being lower in their northeast quadrants. To the best of our knowledge, this is the first time that high-resolution in situ sampling could demonstrate this specific submesoscale Chl a distribution within a CE. Outside of the CE boundaries, we noticed a thermal front with colder surface water. Thermal fronts have been detected outside of the periphery of eddies and are interpreted to result from eddy–eddy interaction (see review by Mahadevan, 2016) and/or eddy–wind interaction (Xu et al., 2019). In this frontal zone, we observed higher nutrient concentrations than in the adjacent stations including the western part of the CE periphery and a doming of the nutrient isolines, which indicates upwelling (see Fig. 2). Consequently, Chl a was elevated and “compressed” to the surface in this area similar to in the CE (Fig. 4a).
Our flow cytometry data (Fig. S6) showed that cyanobacteria (Synechococcus) and eukaryotic pico- and nanoplankton within the CE were unevenly distributed. This suggests that the phytoplankton community of the CE was likely distinct from the surrounding waters but also variable on the submesoscale within the CE. This is consistent with previous studies on phytoplankton distributions in eddies (e.g. Lochte and Pfannkuche, 1987; Lasternas et al., 2013; Hernández-Hernández et al., 2020). Moreover, the mixed layer was also highly variable within the CE and so were PPTOT rates (Table S1, Figs. 3 and 6). We observed a 3-fold variation in depth-integrated PPTOT rates over 100 m depth (Table 1) within the CE which is consistent with earlier observations of a 5-fold variation in primary production integrated over the euphotic zone in a CE in the subtropical Pacific Ocean (Falkowski et al., 1991). Overall, primary productivity was enhanced within the CE and the frontal zone with an average 4-fold increase in depth-integrated PPTOT rates over 100 m depth than in the open ocean and coastal stations. This is consistent with Löscher et al. (2015), who found that depth-integrated primary productivity over the Chl a maximum of a CE in the Mauritanian upwelling system was 3-fold higher than in the surrounding waters. Extracellular release rates (PPDOC) were also enhanced within the eddy, but PER was slightly lower at the eddy surface (Fig. 4d, e). We propose two hypotheses regarding this distribution: (1) the lower PER was due to a higher proportion of larger phytoplankton (e.g. diatoms), which have lower turnover rates and therefore lower PER (Malinsky-Rushansky and Legrand, 1996) and/or (2) the upwelling of nutrients generated by the CE might have enhanced the physiological health of the phytoplankton community (Agustí and Duarte 2013).
4.2 Variations in heterotrophic bacterial abundance and activity associated with a cyclonic eddy
Along the zonal transect, in the stations not affected by the eddy (open ocean + coastal stations), a significant positive correlation was observed between HB abundance and PPTOT rates (Fig. 7a). Those variables were rather uniformly distributed from the coast to the offshore waters excluding samples influenced by the eddy, which is in agreement with earlier findings by Bachmann et al. (2018) for the Mauritanian upwelling system during summer. Both our BR and BP were also within the range of reported rates for coastal and offshore waters of the CanUS (Reinthaler et al., 2006; Alonso-Sáez et al., 2007; Vaqué et al., 2014). BP rates slightly decreased from the coast to the open ocean when samples from the eddy were not considered. Similar trends were found in the CanUS with different upwelling intensities and during different seasons (Alonso-Sáez et al., 2007; Vaqué et al., 2014). The distinct distribution of BP and BR rates affected the distribution of the BGE, which was higher in the coastal than in the open ocean stations. Overall, our BGEs represent the lower end of global ocean values, but similarly low BGEs have been observed for other EBUS, such as the CanUS (Alonso-Sáez et al., 2007), the California upwelling system (del Giorgio et al., 2011), and the Humboldt upwelling system (Maßmig et al., 2020). Yet, we report an average BGE 2 times lower than Alonso-Sáez et al. (2007), which may be due to differences in upwelling intensity. Indeed, Kim et al. (2017) denoted that BGE increased with increasing upwelling intensity in the Ulleung Basin. At the coast, PPDOC rates were sufficient to compensate for the BCD, indicating a strong trophic dependence of bacteria on phytoplankton, whereas in the open ocean PPDOC rates covered between 2.6 % to 78 %, indicating a much lower trophic dependence of bacteria on phytoplankton. Therefore, in the open ocean, other carbon sources (i.e. PPPOC, SL-DOC) must have been used to compensate the BCD. SL-DOC compounds have a turnover of weeks to months, which allows them to escape rapid microbial degradation (Hansell et al., 2009). Consequently, we hypothesise that the BCD in the open ocean was sustained through SL-DOC produced in excess near the coast and transported offshore. Indeed, in the CanUS, currents and eddies have been shown to laterally transport DOC offshore up to 2000 km (Lovecchio et al., 2018).
Within the CE-influenced stations (CE + frontal zone), HB abundance was disconnected from the PPTOT rates (Fig. 7b). For example, in the southwestern periphery and the frontal zone HB abundances were relatively low, while both PPTOT rates and Chl a concentrations were relatively high (Fig. 4a, c). Hernández-Hernández et al. (2020) reported a similar observation with a strong heterogeneity of HB biomass distribution within a CE in the CanUS. Attachment to particles, viral lysis, or grazing by nanoflagellates might have led to a selective reduction in HB abundance. However, the exact reasons for the low HB occurrence at the eddy periphery and the frontal zone are unknown. Despite the low HB abundance, BP was particularly stimulated in these areas. On average, BP was 3-fold higher in the eddy-influenced stations compared to the open ocean ones when integrated over 100 m. This is in accordance with earlier studies from the Sargasso Sea (Ewart et al., 2008), the CanUS (Baltar et al., 2010), and the Mediterranean Sea (Belkin et al., 2022), where enhanced BP has been observed in CEs. As stated previously, the upwelling induced by the CE and the frontal zone led to higher phytoplankton biomass, which was likely responsible for this overall increase in BP. However, it is noteworthy that BP and PPTOT rates were less correlated than in the zonal transect. BR rates were also enhanced at the surface of the CE and followed a similar trend as BP. SL-DOC concentrations showed a strong positive correlation with BR, indicating that high-molecular-weight DOC compounds (>1 kDa) are an available carbon source for heterotrophic microbes (Amon and Benner, 1994, 1996; Benner and Amon, 2015). PPDOC rates in the CE covered 27.9 % to 110 % of the BCD, suggesting a moderate to strong trophic dependence of bacteria on phytoplankton in CE. Although PPTOT may satisfy the BCD in the CE (43.1 % to 341 %), a question remains about why BGE was so variable and low in some parts of the CE with values down to 2.7 %. One explanation might be that variability in nutrient availability in the surface waters limited the building of bacterial biomass (Thingstad et al., 1997; Jansson et al., 2006; Berggren et al., 2010), but this requires further study.
Overall, we showed that autotrophy prevails in the upper 100 m depth of Mauritanian coastal waters, while heterotrophy prevailed offshore. This is consistent with a modelling study from Lovecchio et al. (2017). The CE and the associated frontal zone fuelled phytoplankton nutrient needs and maintained autotrophy further offshore inside of the eddy and especially in the frontal zone, where the highest PPTOT were measured. Mouriño-Carballido (2009) reported from indirect estimations of net community production that the frontal zones between CEs and ACEs are among the most productive areas in the northwest subtropical Atlantic Ocean. Previous studies have shown that the trophic balance could switch from autotrophy to heterotrophy in an eddy within a month (Maixandeau et al., 2005; Mouriño-Carballido and McGillicuddy, 2006). Here we showed that both autotrophy and heterotrophy can occur within a single eddy. This urges the need for more high-resolution eddy studies in order to better estimate their impact on plankton metabolic activities and carbon cycling.
Our results highlight the ability of a CE to be an autotrophic vector toward the open ocean with organic matter freshly produced by the phytoplankton community inside. Yet, despite the strong autotrophy associated with the CE, phytoplankton exudation of DOM was not always enough to compensate for bacterial metabolic needs. Even if BP was enhanced in the CE, the BGE was rather low and varied substantially. Instead, heterotrophic bacteria preferentially used DOM for respiration. Microbial metabolic activity dynamics within eddies are complex and require further investigations to better understand and unravel carbon cycling in these features.
All data will be made available at the PANGAEA database https://doi.pangaea.de/10.1594/PANGAEA.950510 (Devresse et al., 2022).
The supplement related to this article is available online at: https://doi.org/10.5194/bg-19-5199-2022-supplement.
QD, KWB, and AE designed the scientific study, analysed the data, and wrote the paper. AB did the eddy reconstruction, and both AB and JH commented on the paper.
The contact author has declared that none of the authors has any competing interests.
Publisher’s note: Copernicus Publications remains neutral with regard to jurisdictional claims in published maps and institutional affiliations.
This article is part of the special issue “Concerted multidisciplinary and multi-platform eddy studies off West Africa: mesoscale and sub-mesoscale dynamics and physical-chemical-biological coupling (BG/ESSD/OS inter-journal SI)”. It is not associated with a conference.
We thank the captain and the crew of the R/V Meteor for their support during the M156 cruise. We thank Jon Roa, Tania Klüver and Lindsay Scheidemann for sampling on board. We thank the two anonymous reviewers for their constructive comments on earlier versions of the manuscript. We thank Jon Roa and Sandra Golde additionally for the analysis of dissolved organic matter and Tania Klüver for cell counting and bacterial and phytoplankton activity analyses. We thank Bettina Domeyer and Regina Surberg for the nutrient analyses. This study has been conducted using EU Copernicus Marine Service information. The results contain modified Copernicus Climate Change Service information for 2020. Neither the European Commission nor ECMWF is responsible for any use that may be made of the Copernicus information or data it contains. This study is a contribution of the REEBUS project (Role of Eddies in the Carbon Pump of Eastern Boundary Upwelling Systems) sub-projects WP1 and WP4.
This research has been supported by the Bundesministerium für Bildung, Wissenschaft, Forschung und Technologie (grant no. 03F0815A).
The article processing charges for this open-access publication were covered by the GEOMAR Helmholtz Centre for Ocean Research Kiel.
This paper was edited by Anthony Bosse and reviewed by two anonymous referees.
Agustí, S. and Duarte, C. M.: Phytoplankton lysis predicts dissolved organic carbon release in marine plankton communities, Biogeosciences, 10, 1259–1264, https://doi.org/10.5194/bg-10-1259-2013, 2013.
Alonso-Sáez, L., Gasol, J. M., Arístegui, J., Vilas, J. C., Vaqué, D., Duarte, C. M., and Agustí, S.: Large-scale variability in surface bacterial carbon demand and growth efficiency in the subtropical northeast Atlantic Ocean, Limnol. Oceanogr., 52, 533–546, https://doi.org/10.4319/lo.2007.52.2.0533, 2007.
Amon, R. M. W. and Benner, R.: Rapid cycling of high molecular weight dissolved organic matter in the ocean, Nature 369, 549–552, https://doi.org/10.1038/369549a0, 1994.
Amon, R. M. W. and Benner, R.: Bacterial utilization of different size classes of dissolved organic matter, Limnol. Oceanogr., 41, 41–51, https://doi.org/10.4319/lo.1996.41.1.0041, 1996.
Anderson, T. R. and Ducklow, H. W.: Microbial loop carbon cycling in ocean environments studied using a simple steady-state model, Aquat. Microb. Ecol., 26, 37–49, 2001.
Aranguren-Gassis, M., Teira, E., Serret, P., Martínez-García, S., and Fernández, E.: Potential overestimation of bacterial respiration rates in oligotrophic plankton communities, Mar. Ecol. Prog. Ser., 453, 1–10, https://doi.org/10.3354/meps09707, 2012.
Arístegui, J., Tett, P., Hernández-Guerra, A., Basterretxea, G., Mon- tero, M. F., Wild, K., Sangrá, P., Hernández-León, S., Cantón, M., García-Braun, J. A., Pacheco, M., and Barton, E. D.: The influence of island-generated eddies on Chl a distribution: a study of mesoscale variation around Gran Canaria, Deep-Sea Res., 44, 71–96, 1997.
Arístegui, J., Barton, E. D., Álvarez-Salgado, X. A., Santos, A. M. P., Figueiras, F. G., Kifani, S., Hernández-León, S., Mason, E., Machú, E., and Demarcq, H.: Sub-regional ecosystem variability in the Canary Current upwelling, Prog. Oceanogr., 83, 33–48, https://doi.org/10.1016/j.pocean.2009.07.031, 2009.
Arístegui, J., Montero, M. F., Hernández-Hernández, N., Alonso-González, I. J., Baltar, F., Calleja, M. L., and Duarte, C. M.: Variability in Water-Column Respiration and Its Dependence on Organic Carbon Sources in the Canary Current Upwelling Region, Front. Earth Sci., 8, 1–12, 2020.
Bachmann, J., Hassenrück, C., Gärdes, A., Iversen, M. H., Heimbach, T., Kopprio, G. A., and Grossart, H. P.: Environmental Drivers of Free-Living vs. Particle-Attached Bacterial Community Composition in the Mauritania Upwelling System, Front. Microbiol., 9, 1–13, https://doi.org/10.3389/fmicb.2018.02836, 2018.
Baltar, F., Arístegui, J., Gasol, J. M., Lekunberri, I., and Herndl, G. J.: Mesoscale eddies: Hotspots of prokaryotic activity and differential community structure in the ocean, ISME J., 4, 975–988, https://doi.org/10.1038/ismej.2010.33, 2010.
Belkin, N., Guy-Haim, T., Rubin-Blum, M., Lazar, A., Sisma-Ventura, G., Kiko, R., Morov, A. R., Ozer, T., Gertman, I., Herut, B., and Rahav, E.: Influence of cyclonic and anticyclonic eddies on plankton in the southeastern Mediterranean Sea during late summertime, Ocean Sci., 18, 693–715, https://doi.org/10.5194/os-18-693-2022, 2022.
Benner, R. and Amon, R. M. W.: The size-reactivity continuum of major bioelements in the ocean, Ann. Rev. Mar. Sci., 7, 185–205, https://doi.org/10.1146/annurev-marine-010213-135126, 2015.
Berggren, M., Laudon, H., Jonsson, A., and Jansson, M.: Nutrient constraints on metabolism affect the temperature regulation of aquatic bacterial growth efficiency, Microb. Ecol., 60, 894–902, https://doi.org/10.1007/s00248-010-9751-1, 2010.
Borchard, C. and Engel, A.: Organic matter exudation by Emiliania huxleyi under simulated future ocean conditions, Biogeosciences, 9, 3405–3423, https://doi.org/10.5194/bg-9-3405-2012, 2012
Carlson, C. A.: Production and Removal Processes, chap. 4, in: Biogeochemistry of Marine Dissolved Organic Matter, edited by: Hansell, D. A. and Carlson, C. A., Academic Press AP, 805, 91–151, https://doi.org/10.1016/b978-012323841-2/50006-3, 2002.
Chelton, D. B., Gaube, P., Schlax, M. G., Early, J. J., and Samelson, R. M.: The Influence of Nonlinear Mesoscale Eddies on Near-Surface Oceanic Chlorophyll, Science, 334, 328–333, 2011.
Cheney, R. E. and Richardson, P. L.: Observed Decay of a Cyclonic Gulf Stream Ring, Deep-Sea Res.-Oceanogr., 23, 143–155, https://doi.org/10.1016/S0011-7471(76)80023-X, 1976.
Cherrier, J., Valentine, S. K., Hamill, B., Jeffrey, W. H., and Marra, J. F.: Light-mediated release of dissolved organic carbon by phytoplankton, J. Mar. Syst., 147, 45–51, 2015.
Christaki, U., Gueneugues, A., Liu, Y., Blain, S., Catala, P., Colombet, J., Debeljak, P., Jardillier, L., Irion, S., Planchon, F., Sassenhagen, I., Sime-Ngando, T., and Obernosterer, I.: Seasonal microbial food web dynamics in contrasting Southern Ocean productivity regimes, Limnol. Oceanogr., 66, 108–122, https://doi.org/10.1002/lno.11591, 2021.
Couespel, D., Lévy, M., andand Bopp, L.: Oceanic primary production decline halved in eddy-resolving simulations of global warming, Biogeosciences, 18, 4321-4349, https://doi.org/10.5194/bg-18-4321-2021, 2021.
D'Asaro, E. A.: Generation of submesoscale vortices: A new mechanism, J. Geophys. Res., 93, 6685–6693, https://doi.org/10.1029/JC093iC06p06685, 1988.
del Giorgio, P. A. and Cole, J. J.: Bacterial Growth Efficiency in Natural Aquatic Systems, Annu. Rev. Ecol. Evol. Syst., 29, 503–541, https://doi.org/10.1146/annurev.ecolsys.29.1.503, 1998.
del Giorgio, P. A., Condon, R., Bouvier, T., Longnecker, K., Bouvier, C., Sherr, E., and Gasol, J. M.: Coherent patterns in bacterial growth, growth efficiency, and leucine metabolism along a northeastern Pacific inshore – offshore transect, Limnol. Oceanogr., 56, 1–16, https://doi.org/10.4319/lo.2011.56.1.0001, 2011.
Demarcq, H. and Somoue, L.: Phytoplankton and primary productivity off Northwest Africa, in: Oceanographic and biological features in the Canary Current Large Marine Ecosystem, edited by: Valdés, L. and Déniz-González, I., IOC-UNESCO, Pari, IOC Technical Series, No. 115, 161–174, http://hdl.handle.net/1834/9186, 2015.
Descy, J. P., Leporcq, B., Viroux, L., François, C., and Servais, P.: Phytoplankton production, exudation and bacterial reassimilation in the River Meuse (Belgium), J. Plank. Res., 24, 161–166, https://doi.org/10.1093/plankt/24.3.161, 2002.
Devresse, Q., Becker, K. W., and Engel, A.: Microbial activity and nutrients measured from water bottle samples in a cyclonic eddy during METEOR cruise M156, off Mauritania, PANGAEA [data set], https://doi.pangaea.de/10.1594/PANGAEA.950510 (last access: 14 November 2022), 2022.
Dickson, A. G., Sabine, C. L., and Christian, J. R.: Guide to Best Practices for Ocean CO2 measurements, PICES Special Publication, The North Pacific Marine Science Organization (PICES), 3, 191 pp., 2007.
Dittmar, T., Cherrier, J., and Ludwichowski, K. U.: The analysis of amino acids in seawater, in: Practical guidelines for the analysis of seawater, edited by: Wurl, O., CRC Press, Boca Raton, ISBN: 978-1-4200-7306-5, 2009.
Dray, S.: On the number of principal components: A test of dimensionality based on measurements of similarity between matrices, Comput. Stat. Data Anal., 52, 2228–2237, 2008.
Engel, A., Thoms, S., Riabesell, U., Rochelle-Newall, E., and Zondervan, I.: Polysaccharide aggregation as a potential sink of marine dissolved organic carbon, Nature, 428, 929–932, https://doi.org/10.1038/nature02453, 2004.
Engel, A., Händel, N., Wohlers, J., Lunau, M., Grossart, H. P., Sommer, U., and Riebesell, U.: Effects of sea surface warming on the production and composition of dissolved organic matter during phytoplankton blooms: Results from a mesocosm study, J. Plank. Res., 33, 357–372, https://doi.org/10.1093/plankt/fbq122, 2011.
Engel, A., Borchard, C., Piontek, J., Schulz, K. G., Riebesell, U., and Bellerby, R.: CO2 increases 14C primary production in an Arctic plankton community, Biogeosciences, 10, 1291–1308. https://doi.org/10.5194/bg-10-1291-2013, 2013.
Evans, C. A., O'Reily, J. E., and Thomas, J. P.: A handbook for measurement of Chl a a and primary production, Texas A and M University, College Station, Tex., ISBN: 9780948277078, 0948277076, 1987.
Ewart, C. S., Meyers, M. K., Wallner, E. R., McGillicuddy, D. J., and Carlson, C. A.: Microbial dynamics in cyclonic and anticyclonic mode-water eddies in the northwestern Sargasso Sea, Deep-Sea Res. Pt. II, 55, 1334–1347, https://doi.org/10.1016/j.dsr2.2008.02.013, 2008.
Falkowski, P. G., Ziemann, D., Kolber, Z., and Bienfang P. K.: Role of eddy pumping in enhancing primary production in the ocean, Nature, 352, 55–58, https://doi.org/10.1038/352055a0, 1991.
Feng, M., Majewski, L. J., Fandry, C. B., and Waite, A. M.: Characteristics of two counter-rotating eddies in the Leeuwin Current system off the Western Australian coast, Deep-Sea Res. Pt. II, 54, 961–980, https://doi.org/10.1016/j.dsr2.2006.11.022, 2007.
Gargas, E.: A Manual for Phytoplankton Primary Production Studies in the Baltic, The Baltic Marine Biologists, edited by: Gargas, E., Hørsholm, Denmark: Water Quality Institute, 2, 88 pp., 1975.
Gasol, J. M. and del Giorgio, P. A.: Using flow cytometry for counting natural planktonic bacteria and understanding the structure of planktonic bacterial communities, Sci. Mar., 64, 197–224, 2000.
Gattuso, J. P., Epitalon, J. M., Lavigne, H., and Orr, J.: seacarb: seawater carbonate chemistry, R package version 3.2.13, http://CRAN.R-project.org/package=seacarb (last access: 23 February 2021), 2020.
Hansen, H. P. and Koroleff, F.: Determination of nutrients, in: Methods of Seawater Analysis, edited by: Grasshoff, K., Klaus, K., and Ehrhardt, M., John Wiley, Hoboken, NJ, 159–229, https://doi.org/10.1002/9783527613984.ch10, 1999.
Hansell, D. A., Carlson, C. A., Repeta, D. J., and Schlitzer, R.: Dissolved organic matter in the ocean a controversy stimulates new insights, Oceanogr., 22, 202–211, https://doi.org/10.5670/oceanog.2009.109, 2009.
Hernández-Hernández, N., Arístegui, J., Montero, M. F., Velasco-Senovilla, E., Baltar, F., Marrero-Díaz, Á., Martínez-Marrero, A., and Rodríguez-Santana, Á.: Drivers of Plankton Distribution Across Mesoscale Eddies at Submesoscale Range, Front. Mar. Sci., 7, 1–13, https://doi.org/10.3389/fmars.2020.00667, 2020.
Ihaka, R. and Gentleman, R.: R: a language for data analysis and graphics, J. Comput. Graph. Stat., 5, 299, https://doi.org/10.2307/1390807, 1996.
Jansson, M., Bergström, A. K., Lymer, D., Vrede, K., and Karlsson, J.: Bacterioplankton growth and nutrient use efficiencies under variable organic carbon and inorganic phosphorus ratios, Microb. Ecol., 52, 358–364, https://doi.org/10.1007/s00248-006-9013-4, 2006.
Jiao, N., Robinson, C., Azam, F., Thomas, H., Baltar, F., Dang, H., Hardman-Mountford, N. J., Johnson, M., Kirchman, D. L., Koch, B. P., Legendre, L., Li, C., Liu, J., Luo, T., Luo, Y. W., Mitra, A., Romanou, A., Tang, K., Wang, X., and Zhang, R.: Mechanisms of microbial carbon sequestration in the ocean – Future research directions, Biogeosciences, 11, 5285–5306, https://doi.org/10.5194/bg-11-5285-2014, 2014.
Karstensen, J., Fiedler, B., Schütte, F., Brandt, P., Körtzinger, A., Fischer, G., Zantopp, R., Hahn, J., Visbeck, M., and Wallace, D.: Open ocean dead zones in the tropical North Atlantic Ocean, Biogeosciences, 12, 2597–2605, https://doi.org/10.5194/bg-12-2597-2015, 2015.
Kelley, D. E.: Oceanographic Analysis with R, New York, Springer-Verlag, https://doi.org/10.1007/978-1-4939-8844-0, 2018.
Kim, B., Kim, S. H., Kwak, J. H., Kang, C. K., Lee, S. H., and Hyun, J. H.: Heterotrophic bacterial production, respiration, and growth efficiency associated with upwelling intensity in the Ulleung Basin, East Sea, Deep-Sea Res. Pt. II, 143, 24–35, https://doi.org/10.1016/j.dsr2.2017.07.002, 2017.
Kirchman, D., K'nees, E., and Hodson, R.: Leucine incorporation and its potential as a measure of protein synthesis by bacteria in natural aquatic systems, Appl. Environ. Microbiol., 49, 599–607, https://doi.org/10.1128/aem.49.3.599-607.1985, 1985.
Lasternas, S. and Agustí, S.: The percentage of living bacterial cells related to organic carbon release from senescent oceanic phytoplankton, Biogeosciences, 11, 6377–6387, https://doi.org/10.5194/bg-11-6377-2014, 2014.
Lasternas, S., Piedeleu, M., Sangrà, P., Duarte, C. M., and Agustí, S.: Forcing of dissolved organic carbon release by phytoplankton by anticyclonic mesoscale eddies in the subtropical NE Atlantic Ocean, Biogeosciences, 10, 2129–2143, https://doi.org/10.5194/bg-10-2129-2013, 2013.
Lathuilière, C., Echevin, V., and Lévy, M.: Seasonal and intraseasonal surface Chl a – a variability along the northwest African Coast, J. Geophys. Res.-Ocean., 113, C05007, https://doi.org/10.1029/2007JC004433, 2008.
Le Vu, B., Stegner, A., and Arsouze, T.: Angular momentum eddy detection and tracking algorithm (AMEDA) and its application to coastal eddy formation, J. Atmos. Ocean. Technol., 35, 739–762, https://doi.org/10.1175/JTECH-D-17-0010.1, 2018.
Levitus, S.: Climatological atlas of the World Ocean, NOAA Prof. Pap., 13, 1–41, 1982.
Lévy, M., Klein, P., and Treguier, A. M.: Impact of submesoscale physics on production and subduction of phytoplankton in an oligotrophic regime, J. Mar. Res., 59, 535–565, 2001.
Lindroth, P. and Mopper, K.: High performance liquid chromatographic determination of subpicomole amounts of amino acids by precolumn fluorescence derivatization with o-phthaldialdehyde, Anal. Chem., 51, 1667–1674, https://https://doi.org/10.1021/ac50047a019, 1979.
Lipson, D. A.: The complex relationship between microbial growth rate and yield and its implications for ecosystem processes, Front. Microbiol., 6, 615, https://doi.org/10.3389/fmicb.2015.00615, 2015.
Lochte, K. and Pfannkuche, O.: Cyclonic cold-core eddy in the eastern North Atlantic, II. Nutrients, phytoplankton and bacterioplankton, Mar. Ecol. Prog. Ser., 39, 153–164, https://doi.org/10.3354/meps039153, 1987.
Lønborg, C., Martínez-García, S., Teira, E., and Álvarez-Salgado, X. A.: Bacterial carbon demand and growth efficiency in a coastal upwelling system, Aquat. Microb. Ecol., 63, 183–191, https://doi.org/10.3354/ame01495, 2011.
López-Urrutia, Á. and Morán, X. A. G.: Resource limitation of bacterial production distorts the temperature dependence of oceanic carbon cycling, Ecology, 88, 817–822, https://doi.org/10.1890/06-1641, 2007.
Löscher, C. R., Fischer, M. A., Neulinger, S. C., Fiedler, B., Philippi, M., Schütte, F., Singh, A., Hauss, H., Karstensen, J., Körtzinger, A., Künzel, S., and Schmitz, R. A.: Hidden biosphere in an oxygen-deficient Atlantic open-ocean eddy: Future implications of ocean deoxygenation on primary production in the eastern tropical North Atlantic, Biogeosciences, 12, 7467–7482, https://doi.org/10.5194/bg-12-7467-2015, 2015.
Lovecchio, E., Gruber, N., Münnich, M., and Lachkar, Z.: On the long-range offshore transport of organic carbon from the Canary Upwelling System to the open North Atlantic, Biogeosciences, 14, 3337–3369, https://doi.org/10.5194/bg-14-3337-2017, 2017.
Lovecchio, E., Gruber, N., and Münnich, M: Mesoscale contribution to the long-range offshore transport of organic carbon from the Canary Upwelling System to the open North Atlantic, Biogeosciences, 15, 5061–5091, https://doi.org/10.5194/bg-15-5061-2018, 2018.
Mahadevan, A.: The Impact of Submesoscale Physics on Primary Productivity of Plankton, Annu. Rev. Mar. Sci., 8, 161–184, https://doi.org/10.1146/annurev-marine-010814-015912, 2016.
Maixandeau, A., Lefevre, D., Karayanni, H., Christaki, U., VanWambeke, F., Thyssen, M., Denis, M., Fernandez, C. I., Uitz, J., Leblanc, K., and Queguiner, B.: Microbial community production, respiration, and structure of the microbial food web of an ecosystem in the northeastern Atlantic Ocean, J. Geophys. Res.-Ocean., 110, C07S17, https://doi.org/10.1029/2004JC002694, 2005.
Malinsky-Mushansky, Z. N. and Legrand, C.: Excretion of dissolved organic carbon by phytoplankton of different sizes and subsequent bacterial uptake, Mar. Ecol. Prog. Ser., 132, 249–255, 1996.
Maßmig, M., Lüdke, J., Krahmann, G., and Engel, A.: Bacterial degradation activity in the eastern tropical South Pacific oxygen minimum zone, Biogeosciences, 17, 215–230, https://doi.org/10.5194/bg-17-215-2020, 2020.
McGillicuddy Jr., D. J., Anderson, L. A., Doney S. C., and Maltrud, M. E.: Eddy-driven sources and sinks of nutrients in the upper ocean: Results from a 0.1∘ resolution model of the North Atlantic, Global Biogeochem. Cy., 17, 1035, https://doi.org/10.1029/2002GB001987, 2003.
McGillicuddy, D. J.: Mechanisms of Physical-Biological-Biogeochemical Interaction at the Oceanic Mesoscale, Annu. Rev. Mar. Sci., 8, 125–159, https://doi.org/10.1146/annurev-marine-010814-015606, 2016.
Molemaker, M. J., McWilliams, J. C., and Dewar, W. K.: Submesoscale generation of mesoscale anticyclones near a separation of the California Undercurrent, J. Phys. Oceanogr., 45, 613–629, https://doi.org/10.1175/JPO-D-13-0225.1, 2015.
Mouriño-Carballido, B. and McGillicuddy, D. J.: Mesoscale variability in the metabolic balance of the Sargasso Sea, Limnol. Oceanogr., 51, 2675–2689, https://doi.org/10.4319/lo.2006.51.6.2675, 2006.
Mouriño-Carballido, B.: Eddy-driven pulses of respiration in the Sargasso Sea, Deep-Sea Res. Pt. I, 56, 1242–1250, https://doi.org/10.1016/j.dsr.2009.03.001, 2009.
Mühlenbruch, M., Grossart, H. P., Eigemann, F., and Voss, M.: Mini-review: Phytoplankton-derived polysaccharides in the marine environment and their interactions with heterotrophic bacteria, Environ. Microbiol., 20, 2671–2685, https://doi.org/10.1111/1462-2920.14302, 2018.
Neijssel, O. M. and De Mattos, M. J. T.: Micro Review The energetics of bacterial growth: a reassessment, Mol. Microbiol., 13, 179–182, 1994.
Nielsen, E. S.: The use of radio-active carbon (c14) for measuring organic production in the sea, ICES Mar. Sci., 18, 117–140, https://doi.org/10.1093/icesjms/18.2.117, 1952.
Noyon, M., Morris, T., Walker, D., and Huggett, J.: Plankton distribution within a young cyclonic eddy off south-western Madagascar, Deep-Sea Res. Pt. II, 166, 141–150, https://doi.org/10.1016/j.dsr2.2018.11.001, 2019.
Obernosterer, I. and Herndl, G. J.: Phytoplankton extracellular release and bacterial growth: Dependence on the inorganic N : P ratio, Mar. Ecol. Prog. Ser., 116, 247–258, https://doi.org/10.3354/meps116247, 1995.
Pegliasco, C., Chaigneau, A., and Morrow, R.: Main eddy vertical structures observed in the four major Eastern Boundary Upwelling Systems, J. Geophys. Res.-Ocean., 120, 6008–6033, https://doi.org/10.1002/2015JC010950, 2015.
Pelegrí, J. L. and Peña-Izquierdo, J.: Eastern boundary currents off North-West Africa, in: Oceanographic and biological features in the Canary Current Large Marine Ecosystem, edited by: Valdés, L. and Déniz-González, I., IOC-UNESCO, Paris, IOC Technical Series, No. 115, 81–92, http://hdl.handle.net/1834/9179 (last access: 4 March 2019), 2015.
Piontek, J., Endres, S., Le Moigne, F. A. C., Schartau, M., and Engel, A.: Relevance of Nutrient-Limited Phytoplankton Production and Its Bacterial Remineralization for Carbon and Oxygen Fluxes in the Baltic Sea, Front. Mar. Sci., 6, 1–16, https://doi.org/10.3389/fmars.2019.00581, 2019.
Rao, D. N., Chopra, M., Rajula, G. R., Durgadevi, D. S. L., and Sarma, V. V. S. S.: Release of significant fraction of primary production as dissolved organic carbon in the Bay of Bengal, Deep-Sea Res. Pt. I, 168, 1–27, https://doi.org/10.1016/j.dsr.2020.103445, 2021.
Regaudie-De-Gioux, A. and Duarte, C. M.: Temperature dependence of planktonic metabolism in the ocean, Global Biogeochem. Cy., 26, GB1015, https://doi.org/10.1029/2010GB003907, 2012.
Reinthaler, T., Bakker, K., Manuels, R., van Ooijen, J., and Herndl, G. J.: Erratum to Fully automated spectrophotometric approach to determine oxygen concentrations in seawater via continuous-flow analysis, Limnol. Oceanogr. Method., 5, 72–72, https://doi.org/10.4319/lom.2007.5.72, 2006.
Robinson C.: Heterotrophic bacterial respiration, in: Microbial ecology of the oceans, edited by: Kirchman, D. L., 2nd Edn., 299–334, Wiley, 2008.
Russell, J. B. and Cook, M. G.: Energetics of Bacterial Growth: Balance of Anabolic and Catabolic Reactions, Microbiol Rev., 59, 48–62, 1995.
Schlitzer, R.: Ocean Data View, https://odv.awi.de (last access: 21 April 2022), 2020.
Schütte, F., Brandt, P., and Karstensen, J.: Occurrence and characteristics of mesoscale eddies in the tropical northeastern Atlantic Ocean, Ocean Sci., 12, 663–685, https://doi.org/10.5194/os-12-663-2016, 2016.
Simon, M. and Azam, F.: Protein content and protein synthesis rates of planktonic marine bacteria, Mar. Ecol. Prog. Ser., 51, 201–213, 1989.
Singh, A., Gandhi, N., Ramesh, R., and Prakash, S.: Role of cyclonic eddy in enhancing primary and new production in the Bay of Bengal, J. Sea Res., 97, 5–13, https://doi.org/10.1016/j.seares.2014.12.002, 2015.
Smith, D. and Azam, F.: A simple, economical method for measuring bacterial protein synthesis rates in seawater using, Mar. Microb. Food Webs, 6, 107–114, 1992.
Solórzano, L.: Determination of Ammonia in Natural Waters by the Phenolhypochlorite Method, Limnol. Oceanogr., 14, 799–801, 1969.
Strickland, J. D. H. and Parsons, T. R.: A Practical Handbook of Seawater Analysis, Bull. Fish. Res. Board Can., 167, 1–311, 1968.
Thingstad, T. F., Hagström, Å., and Rassoulzadegan, F.: Accumulation of degradable DOC in surface waters: Is it caused by a malfunctioning microbial loop?, Limnol. Oceanogr., 42, 398–404, https://doi.org/10.4319/lo.1997.42.2.0398, 1997.
Thomsen, S., Kanzow, T., Krahmann, G., Greatbatch, J. R., Dengler, M., and Lavik, G. S.: The formation of a subsurface anticyclonic eddy in the Peru-Chile Undercurrent and its impact on the near-coastal salinity, oxygen, and nutrient distributions, J. Geophys. Res.-Ocean., 121, 476–501, https://doi.org/10.1002/2015JC010878, 2016.
Vaqué, D., Alonso-Sáez, L., Arístegui, J., Agustí, S., Duarte, C. M., Montserrat Sala, M., Vázquez-Domínguez, E., and Gasol, J. M.: Bacterial production and losses to predators along an Open ocean productivity gradient in the Subtropical North East Atlantic Ocean, J. Plank. Res., 36, 198–213, https://doi.org/10.1093/plankt/fbt085, 2014.
Wear, E. K., Carlson, C. A., and Church, M. J.: Bacterioplankton metabolism of phytoplankton lysates across a cyclone-anticyclone eddy dipole impacts the cycling of semi-labile organic matter in the photic zone, Limnol. Oceanogr., 65, 1608–1622, https://doi.org/10.1002/lno.11409, 2020.
Wickham, H.: tidyverse: Easily Install and Load “Tidyverse” Packages, See https://cran.r-project.org/package=tidyverse (last access: 4 May 2022), 2016.
Wilhelm, W. L.: Die Bestimmung des im Wasser gelösten Sauerstoffes, Ber. Dtsch. Chem. Ges., 21, 2843–2854, 1888.
Xu, G., Dong, C., Liu, Y., Gaube, P., and Yang, J.: Chl a Rings around Ocean Eddies in the North Pacific, Sci. Rep., 9, 1–8, https://doi.org/10.1038/s41598-018-38457-8, 2019.