the Creative Commons Attribution 4.0 License.
the Creative Commons Attribution 4.0 License.
 | 02 Dec 2022
Controls on the relative abundances and rates of nitrifying microorganisms in the ocean
Emily J. Zakem
Barbara Bayer
Wei Qin
Alyson E. Santoro
Yao Zhang
Naomi M. Levine
Nitrification controls the oxidation state of bioavailable nitrogen. Distinct clades of chemoautotrophic microorganisms – predominantly ammonia-oxidizing archaea (AOA) and nitrite-oxidizing bacteria (NOB) – regulate the two steps of nitrification in the ocean, but explanations for their observed relative abundances and nitrification rates remain incomplete and their contributions to the global marine carbon cycle via carbon fixation remain unresolved. Using a mechanistic microbial ecosystem model with nitrifying functional types, we derive simple expressions for the controls on AOA and NOB in the deep, oxygenated open ocean. The relative biomass yields, loss rates, and cell quotas of AOA and NOB control their relative abundances, though we do not need to invoke a difference in loss rates to explain the observed relative abundances. The supply of ammonium, not the traits of AOA or NOB, controls the relatively equal ammonia and nitrite oxidation rates at steady state. The relative yields of AOA and NOB alone set their relative bulk carbon fixation rates in the water column. The quantitative relationships are consistent with multiple in situ datasets. In a complex global ecosystem model, nitrification emerges dynamically across diverse ocean environments, and ammonia and nitrite oxidation and their associated carbon fixation rates are decoupled due to physical transport and complex ecological interactions in some environments. Nevertheless, the simple expressions capture global patterns to first order. The model provides a mechanistic upper estimate on global chemoautotrophic carbon fixation of 0.2–0.5 Pg C yr−1, which is on the low end of the wide range of previous estimates. Modeled carbon fixation by AOA (0.2–0.3 Pg C yr−1) exceeds that of NOB (about 0.1 Pg C yr−1) because of the higher biomass yield of AOA. The simple expressions derived here can be used to quantify the biogeochemical impacts of additional metabolic pathways (i.e., mixotrophy) of nitrifying clades and to identify alternative metabolisms fueling carbon fixation in the deep ocean.
- Article
(5095 KB) - Full-text XML
- BibTeX
- EndNote


Remineralizing organisms control organic matter storage and nutrient cycling in the biosphere. Organic nitrogen is remineralized and oxidized in sequential steps, each carried out by distinct groups of organisms. Heterotrophs oxidize organic carbon for energy and typically excrete nitrogen in simplified, reduced forms, such as urea and ammonium (NH, here referred to interchangeably with ammonia, NH3). Excretion of reduced nitrogen in shallow, sunlit waters predominantly resupplies primary production locally. At depth, remineralization maintains the marine “biological pump” of carbon (Volk and Hoffert, 1985) and the excreted nitrogen is oxidized by chemoautotrophic nitrifying microorganisms to nitrate (NO), which fills the deep ocean.
In the ocean and most aquatic environments, nitrification is a two-step process carried out by two distinct microbial clades: ammonia-oxidizing archaea (AOA) and nitrite-oxidizing bacteria (NOB) (Ward, 2008). AOA are the most ubiquitous chemoautotrophs in the dark ocean (Karner et al., 2001; Wuchter et al., 2006; Santoro et al., 2019), due in part to their small cell size (Könneke et al., 2005; Santoro and Casciotti, 2011). Larger NOB are equally widespread but less numerous (Santoro et al., 2010, 2019; Pachiadaki et al., 2017), though the NOB metalloenzyme nitrite oxidoreductase has been shown to be one of the most abundant proteins in the mesopelagic ocean (Saito et al., 2020). Both chemoautotrophic metabolisms are much less efficient than photoautotrophy, though their underlying redox reactions suggest that ammonia oxidation should yield more biomass than nitrite oxidation.
Our understanding of the global-scale biogeochemical roles of AOA and NOB remains incomplete. The role of NOB in the global carbon cycle in particular remains unclear. Currently, estimates of global carbon fixation by NOB range over an order of magnitude (Pachiadaki et al., 2017; Zhang et al., 2020; Bayer et al., 2022). Recent studies demonstrate that some types of NOB are metabolically diverse, with the ability to break down urea, oxidize compounds other than NO, and reduce NO in addition to O2 (Koch et al., 2014, 2015; Füssel et al., 2017; Bayer et al., 2020), though the large-scale biogeochemical impacts of this versatility are also unclear.
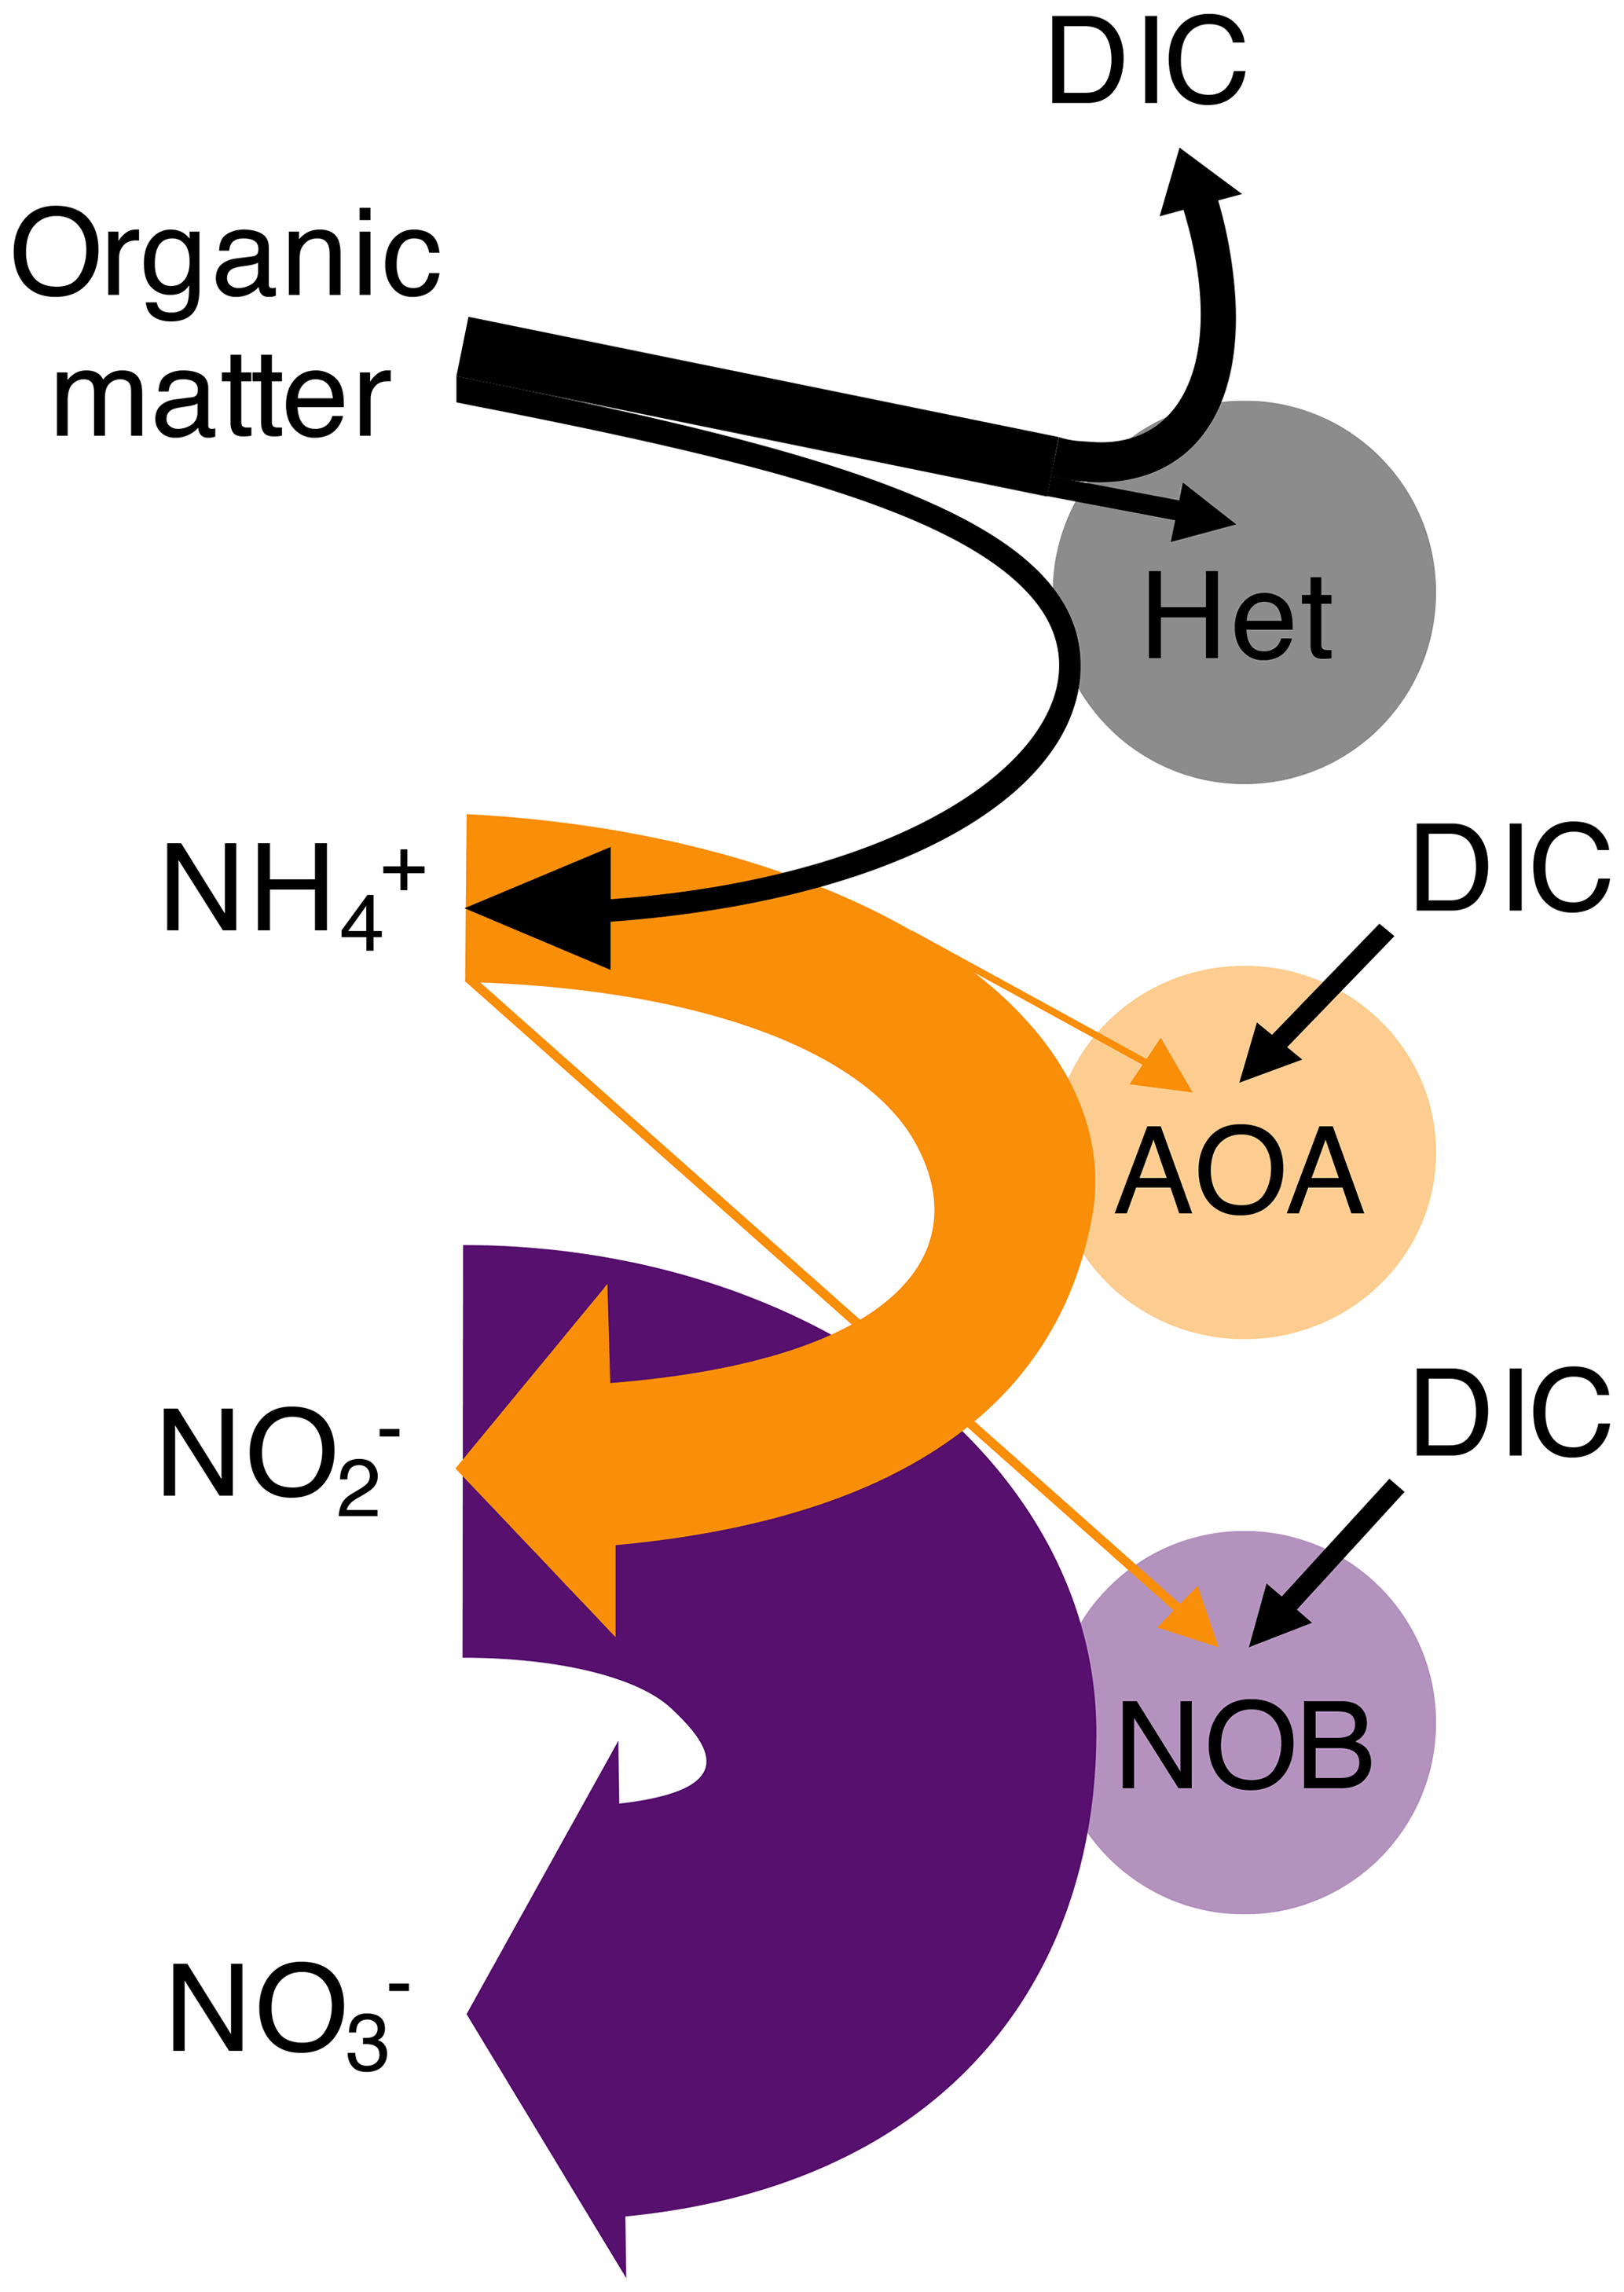
Figure 1Schematic of the nitrogen remineralization sequence driven by microbial functional types. Organic matter is consumed by heterotrophic organisms (Het), with ammonium (NH) and dissolved inorganic carbon (DIC) as waste products. Chemoautotrophic ammonia-oxidizing archaea (AOA) consume NH and excrete nitrite (NO). Chemoautotrophic nitrite-oxidizing bacteria (NOB) consume NO and excrete nitrate (NO). AOA and NOB may assimilate NH (as illustrated) or simple organic nitrogen compounds. Straight arrows indicate the substrates used for biomass synthesis, while horseshoe-shaped arrows indicate respiration substrates and products. The widths of each of the arrows correspond to the metabolic budgets used in this study. For example, NOB require significantly more NO than the amount of NH required by AOA to produce the same amount of biomass. Though not indicated, heterotrophs may also fix DIC in the dark ocean.
In order to anticipate present and future biogeochemical impacts of nitrifying microorganisms, we must better understand the controls on their abundances and rates. Observations show AOA at consistently higher abundances (7- to 11-fold) than NOB in the water column (Fig. 2a; Santoro et al., 2010, 2019; Zhang et al., 2020) yet relatively equal rates of NH3 and NO oxidation (Dore and Karl, 1996; Ward, 2008; Zhang et al., 2020). What controls these patterns? Second, how do these nitrification rates relate to in situ chemoautotrophic carbon fixation rates across scales from cellular to global levels? Here, we use a mechanistic ecosystem model to interpret observations of the nitrification system. We mechanistically and quantitatively explain the relationships between nitrifier abundances and their transformations of N and C in the water column across scales.
.
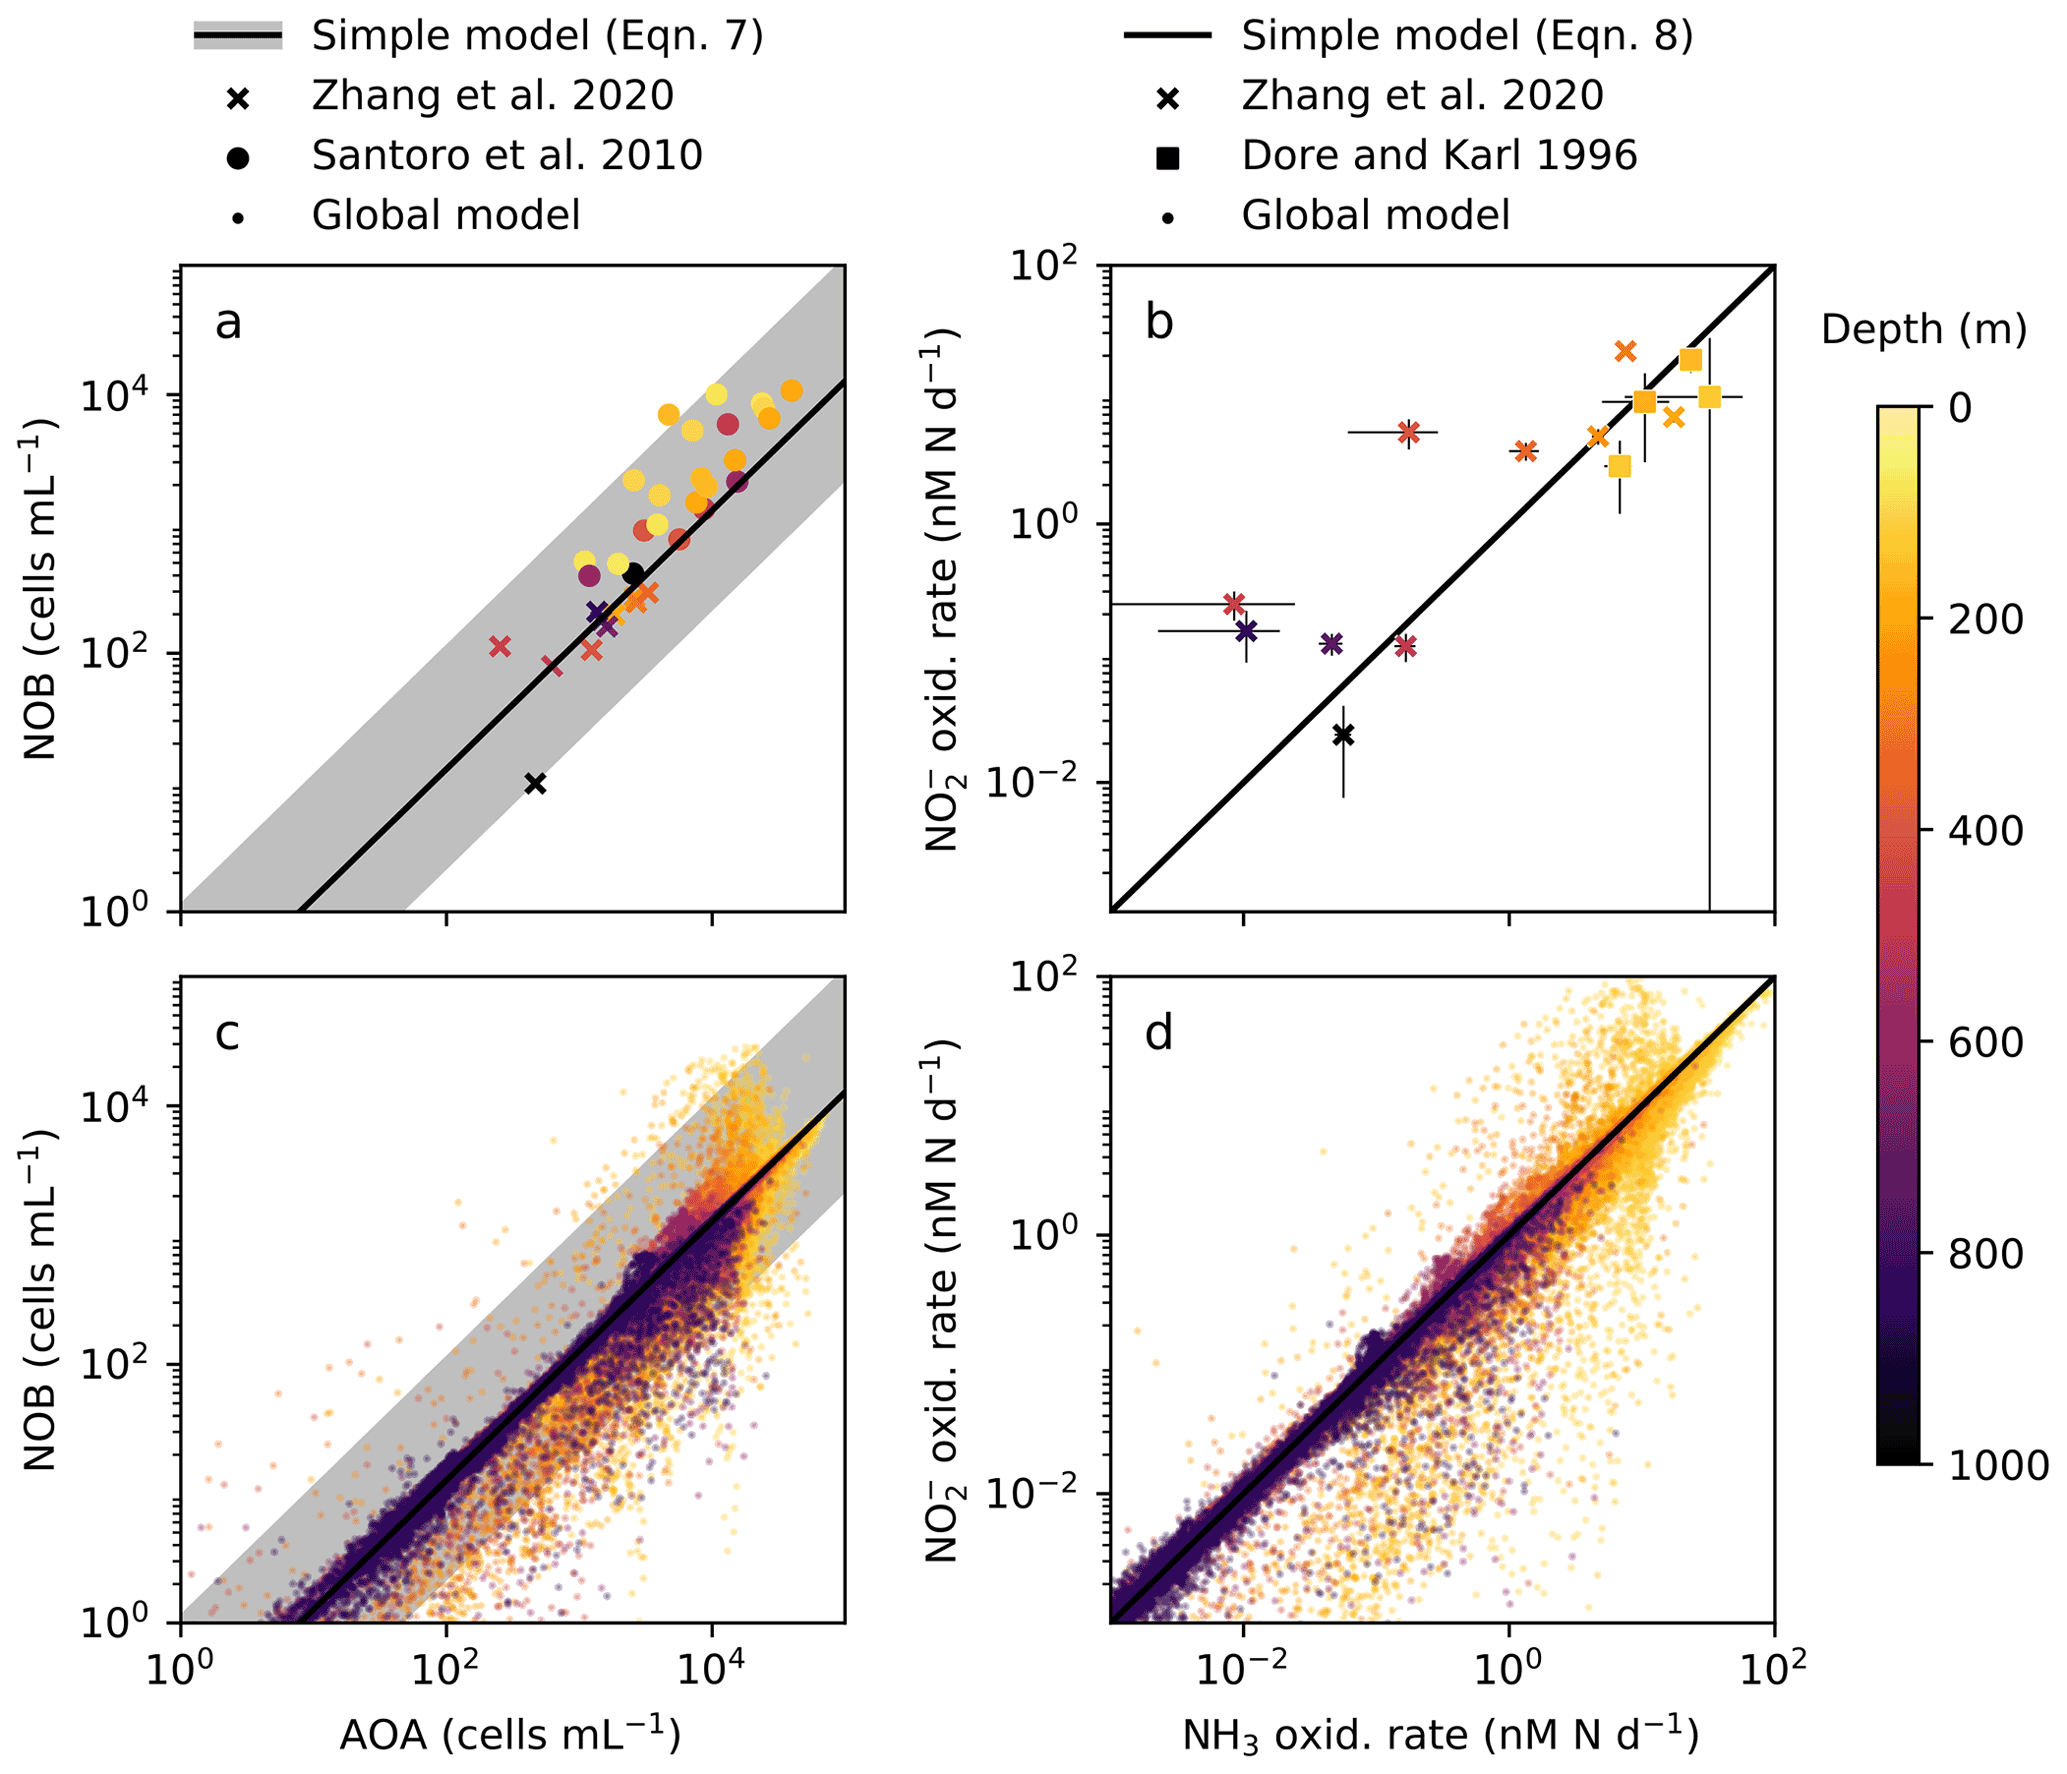
Figure 2The simple expressions relating nitrifying microorganism abundances and rates compared to ocean observations and global model output below the 1 % light level. (a), (c) Abundances of ammonia-oxidizing archaea (AOA) and nitrite-oxidizing bacteria (NOB) (archaeal amoA and NOB 16S gene abundances from Zhang et al., 2020, and Santoro et al., 2010). (b), (d) Ammonia (NH3) and nitrite (NO) oxidation rates (measured rates from Zhang et al., 2020, and Dore and Karl, 1996).
Previous work constructed a theoretically grounded ecological model of nitrifying populations that is useful for large-scale biogeochemical modeling (Zakem et al., 2018). The model resolves remineralization explicitly with dynamic populations of heterotrophic and nitrifying microorganisms (Fig. 1). Redox-informed, cellular-level metabolic budgets relate nutrient utilization and excretion rates to biomass synthesis rates. When incorporated into an ocean biogeochemical model, the locations of nitrification emerge dynamically from ecological interactions, without relying on an assumption of light inhibition. Competition between nitrifiers and phytoplankton for NH and NO results in the common, but not exclusive, restriction of nitrification from the sunlit surface. This fundamental, energetics-based explanation for exclusion from sunlit waters suggests that light inhibition (or lack of photoprotective machinery) may have evolved as a consequence of this exclusion (Zakem et al., 2018).
Here, using this ecosystem model, we first provide simple, mechanistic expressions for the relative abundances, nitrification rates, and carbon fixation rates of AOA and NOB in the dark, oxygenated ocean. This allows us to explain patterns exhibited in multiple sets of in situ observations using just a few parameters. Second, we examine how these expressions become relevant with depth by comparing a high-resolution, dynamic water column model to the observations. Third, we investigate global-scale relationships using a three-dimensional, global configuration of the ecosystem model.
We employ a marine ecosystem model that resolves the growth, respiration, and mortality of ammonia- and nitrite-oxidizing biomass, representing aggregated populations of AOA and NOB (Zakem et al., 2018). The model also resolves phytoplankton, heterotrophic bacteria, and zooplankton biomasses and inorganic nitrogen concentrations. Respiration by the microbial populations (including zooplankton) constitutes all of the remineralization of organic matter back into its inorganic constituents. Temperature modifies the metabolic rates of all populations, as detailed in Appendix A. In the Appendix, we provide the full set of model equations as well as detailed descriptions of the configurations and parameter values. Here, we present (1) the key model equations describing nitrification, (2) an overview of the different model configurations, and (3) the key parameter values used to describe and differentiate the two nitrifying populations and the treatment of their uncertainty.
2.1 Key equations
Following Zakem et al. (2018), the growth rates of the ammonia-oxidizing archaeal (μAOA) and nitrite-oxidizing bacterial (μNOB) functional types are calculated from their biomass yields and uptake rates of reduced nitrogen (assumed to be the limiting nutrients) as
where and are the biomass yields of AOA and NOB, respectively (as mol biomass synthesized per mol NH or NO utilized); VmaxN (mol NH or NO per mol biomass) is the specific maximum uptake rate; and KN (mol NH or NO L−1) is the half-saturation concentration for uptake. We thus here define “uptake” as the total N utilized for both assimilation into biomass and for oxidation for energy. Here, we assume that AOA and NOB populations have similar uptake kinetics in the deep ocean, following the results of Zhang et al. (2020), though we demonstrate below that the uptake kinetics do not have a significant impact on the results of this study. Each state variable in the model (tracer C) is transported by the ocean circulation according to velocities u and diffusion coefficients κ as
where SC are additional sources and sinks. For biomass concentrations (BAOA and BNOB; mol N L−1) and dissolved organic nitrogen (DIN) concentrations (mol N L−1):
where L (t−1) is the specific biomass loss rate function and , , and are uptake of DIN by phytoplankton P. Excretion of NH () by heterotrophic bacteria (Bhet) and zooplankton (Z) supplies NH according to their growth efficiencies. The biomass losses of all populations supply the dissolved and particulate pools of organic matter that are remineralized by the heterotrophs. Loss rate L represents biomass losses to grazing, viral lysis, maintenance, and senescence and is a function of both the population's biomass and that of zooplankton predator Z (Appendix A). In the model versions presented, we assume one microzooplankton grazer preys on all non-photoautotrophic microbial populations (Bhet, BAOA, and BNOB). The actual food web configuration is not known and different configurations are possible, and so our uncertainty estimates account for a wide range in variation of loss rates between the populations. We assume that both AOA and NOB consume NH (or simple organic compounds such as urea) for assimilation into biomass synthesis. Because these assimilation terms are small relative to the other terms due to the low nitrifier biomass yields (i.e., ), they are negligible in the solutions. Light inhibition is not imposed upon the nitrifying populations. Rather, the restriction of nitrification from the sunlit surface emerges as a consequence of ecological interactions (Zakem et al., 2018).
2.2 Model configurations
We use a hierarchy of configurations of the ecosystem model to answer our research questions. First, we use a set of equations that are simplified to represent the dynamics in the dark, oxygenated ocean, neglecting the impacts of phytoplankton and physical transport. We examine the steady-state balances at a single point. This allows us to develop simple, linear expressions for the relative abundances and rates of AOA and NOB functional types as functions of just a few parameters. Appendix C provides the simplified set of equations and the derivation of these expressions.
Second, we use a vertical water column model of the full, dynamic ecosystem (with phytoplankton, heterotrophic bacteria, zooplankton, and physical transport) to compare the results to observations from the western Pacific Ocean. This allows us to evaluate and visualize how the simple expressions from the point balances become relevant at depth. Attenuation of light and mixing with depth provide the physical structure of the 2000 m stratified water column (Appendix B). We assume that oxygen and micronutrients are abundant so that NH and NO limit the growth of AOA and NOB, respectively. Nitrogen is conserved over the domain. Equations are integrated forward in time until an equilibrium state is reached. Because the model resolves nitrogen-based biomass, we convert the biomass yields and elemental quotas using elemental ratio RNC from the measured C:N contents of AOA and NOB (Bayer et al., 2022; Table A1). To quantify model uncertainty, we randomly draw parameter values from ranges in yields, loss rate parameters, and cell quotas of the AOA and NOB functional types to construct an ensemble of 2000 equilibrium model solutions. We illustrate the range between the 5th and 95th percentiles of the ensemble. Table A1 lists all parameter values, including the ranges used for the ensemble. Unless noted as Gaussian, uniform distributions are used.
Third, we analyze global-scale relationships using a 3D global configuration of the ecosystem model. The global model allows us to examine whether the simple point balances are relevant across the diverse environments of the global ocean and to estimate globally integrated rates. The nitrification ecosystem model is integrated with MIT general circulation model (MITgcm) and coupled to the ECCO-GODAE state estimate of the ocean circulation ( horizontal resolution; 23 vertical levels; Follows et al., 2007; Dutkiewicz et al., 2015b; Wunsch and Heimbach, 2007). The ecosystem component resolves the cycling of carbon, nitrogen, phosphorus, iron, and silica. AOA and NOB growth are limited by oxygen, according to redox-based respiration budgets, as well as phosphorus and iron requirements for biomass synthesis, as in Zakem et al. (2018). In addition to the AOA and NOB populations, we resolve six phytoplankton populations, four zooplankton populations, two heterotrophic bacteria types, and multiple anaerobic heterotrophic (nitrate-reducing and denitrifying) and chemoautotrophic (anammox) metabolic functional types. The configuration is identical to that of Zakem et al. (2018) except for (1) the incorporation of the recently measured biomass yields from Bayer et al. (2022), which are higher than the previous model input values and so result in higher nitrifier biomass and C fixation rates; (2) the assumption of equal uptake kinetic parameters for AOA and NOB following the results of Zhang et al. (2020), which increases the competitive ability of NOB against phytoplankton for DIN in the euphotic zone and so increases nitrite oxidation rates slightly there; and (3) the assumption that the metabolic rates of nitrifying microorganisms are sensitive to temperature using the same temperature sensitivity function as for the other microbial populations. This impacts the global estimates only slightly, well within our reported uncertainty range (in Zakem et al., 2018, nitrifier metabolic rates were not modified by temperature following the empirical results of Horak et al., 2013). These three exceptions are also included in the water column model configuration.
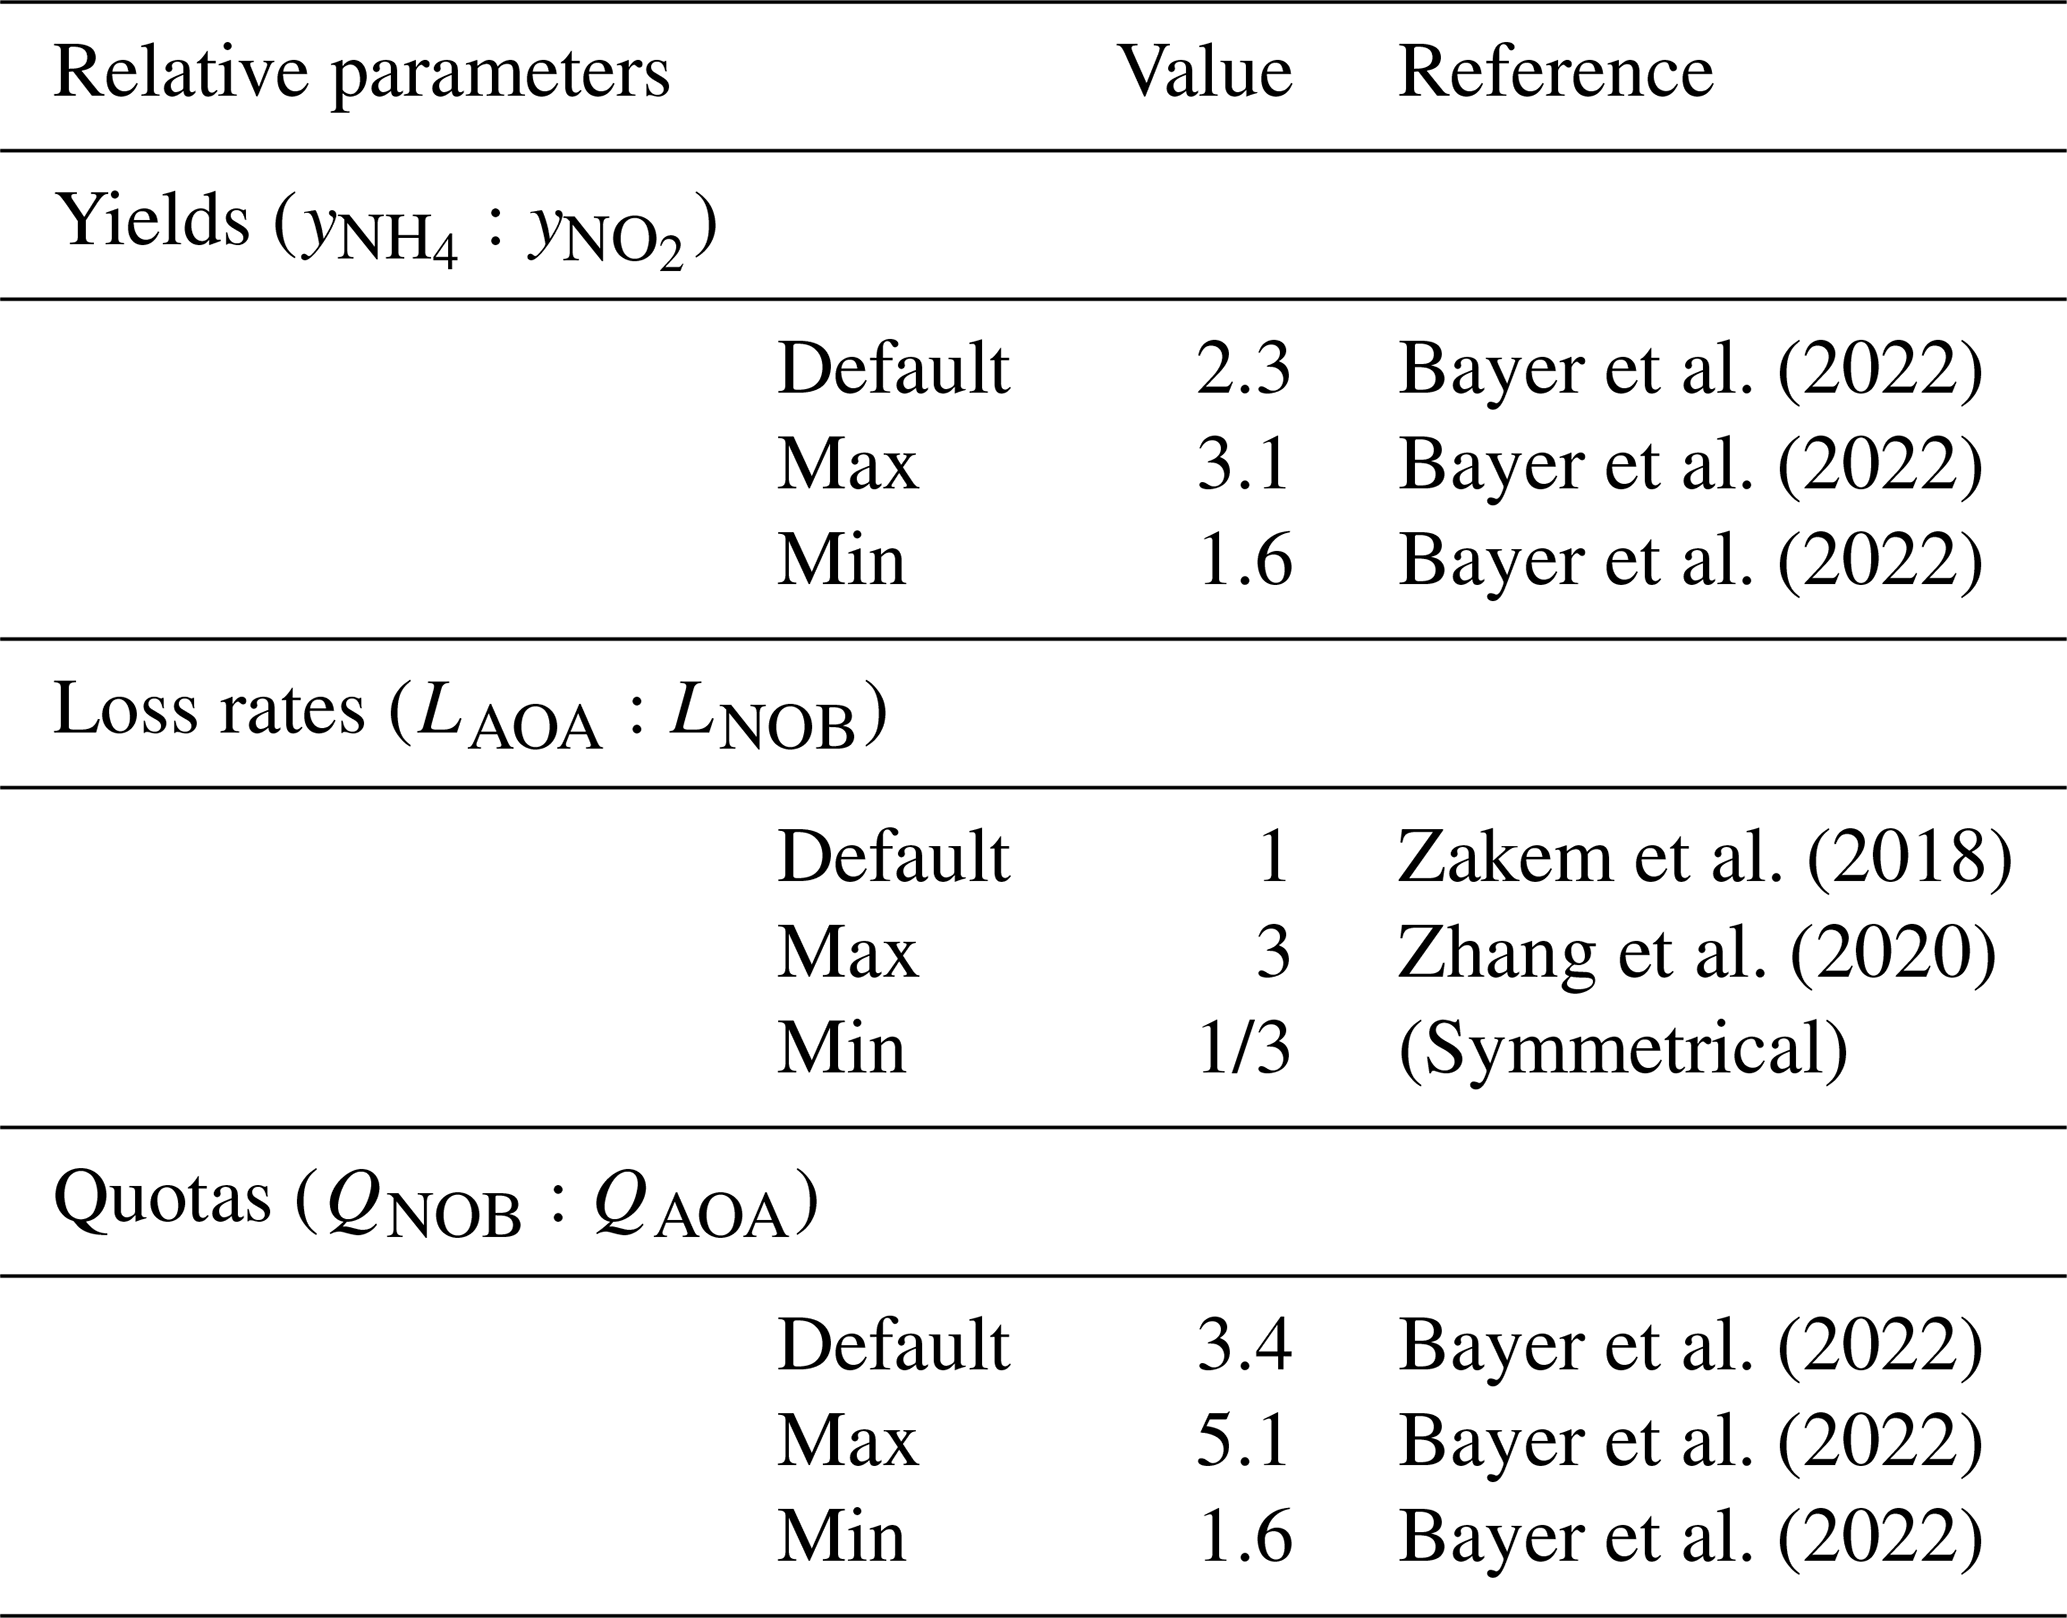
Bayer et al. (2022)Bayer et al. (2022)Bayer et al. (2022)Zakem et al. (2018)Zhang et al. (2020)Bayer et al. (2022)Bayer et al. (2022)Bayer et al. (2022)Table 1Relative parameter values used to describe marine AOA and NOB functional types. See Table A1 for absolute values.
We estimate a range of globally integrated rates by incorporating a range of AOA and NOB yields and loss rate parameters into multiple global simulations (Tables 1, A1). After sensitivity tests, we constructed three global model versions: one using the default parameter values, one in which the range of nitrifier parameter values gave the lowest estimate of the rates (specifically, the lower estimates of the yields and the higher estimates of loss rate parameters for both AOA and NOB), and one in which they gave the highest estimate of the rates (specifically, the upper estimates of the yields and the lower estimates of the loss rate parameters). For the grazing rates, we varied the grazing palatability coefficient, which modulates the rate of grazing on each prey population individually. We initialized the global model with climatological nutrient concentrations and the default parameter values. Branching from a 200-year integration, the three versions are each integrated for an additional 50 years. We checked the output at intermediate time points to assure that the nitrification and carbon fixation rates reach an additional quasi-steady state by 50 years.
Additional uncertainty in global nitrification and associated carbon fixation rates exists due to uncertainty in the flux of organic matter exported out of the sunlit surface. As we later clarify in our results, nitrification rates at depth are predominantly set by this export flux via the supply of NH from its remineralization. Therefore, we treat the uncertainty due to the export flux by considering that the export flux in our global model is larger (12–13 Pg C yr−1) than previous estimates (5–11 Pg C yr−1; Schlitzer, 2000; Henson et al., 2011; Siegel et al., 2014). In the model, the export flux is controlled by the parameters that dictate the rate of organic matter uptake by heterotrophic microbes combined with the sinking rate of the particulate organic matter (POM). Here, we use the same heterotrophic activity parameterization as in Zakem et al. (2018). Because the model provides an upper bound on the export flux, it provides an upper bound on deep nitrification rates. This is a pragmatic approach because the resulting modeled global rates are lower than many previous estimates. The resulting range of the export flux in Table 3 reflects the choice of cutoff to exclude the very high values of export in the coastal grid points, where the model has no skill. Across the three global model versions, the export flux remained the same with respect to the degree of accuracy represented in Table 3.
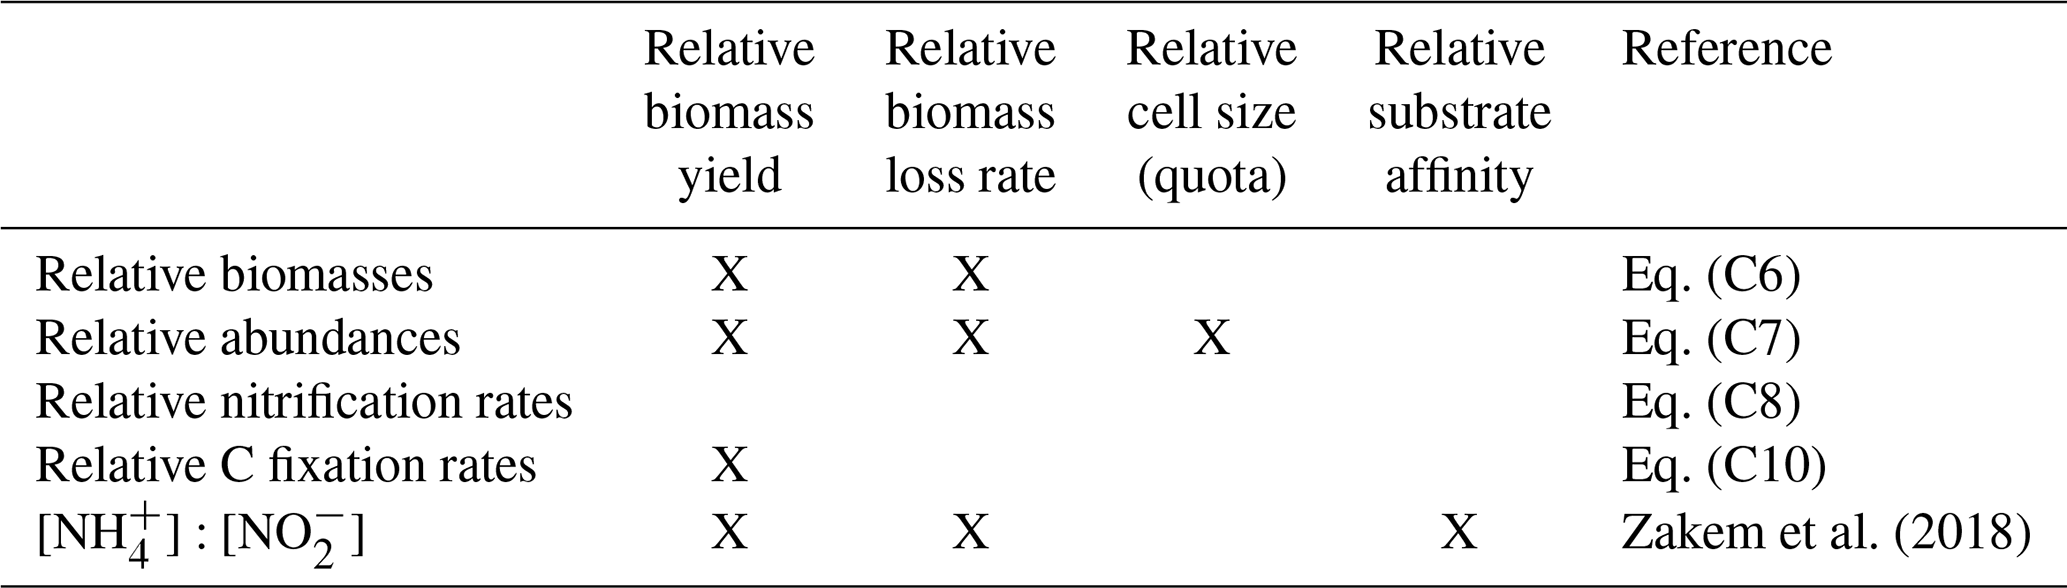
Zakem et al. (2018)Table 2Summary of the factors governing the relative abundances and water column rates of AOA and NOB in the dark, oxygenated ocean. The yield refers to the amount of biomass synthesized per amount of dissolved inorganic nitrogen utilized.
We choose to use the water column model to compare with the observed water column profiles, rather than evaluating the relevant grid points from the global model because (1) the global model is appropriate for exploring and understanding large-scale patterns, but its solutions do not precisely match the dynamics at a particular single location, and (2) the water column model allows us to efficiently equilibrate model solutions to 2000 m depth at a higher resolution. While the 3D global model captures patterns in the balance between net primary production and remineralization broadly, it does not accurately resolve the export flux at any one location. Because improving model resolution of the export flux is beyond the scope of this study, in the water column model we calibrate the parameters that control the sinking flux of organic matter (specifically, the parameters setting heterotrophic bacteria, POM, and DOM (dissolved organic matter)) so that the NH supply rate at depth is consistent with the observed profiles. This allows the aspects of the nitrification system relevant to this study to emerge dynamically in the solutions.
2.3 Parameter values
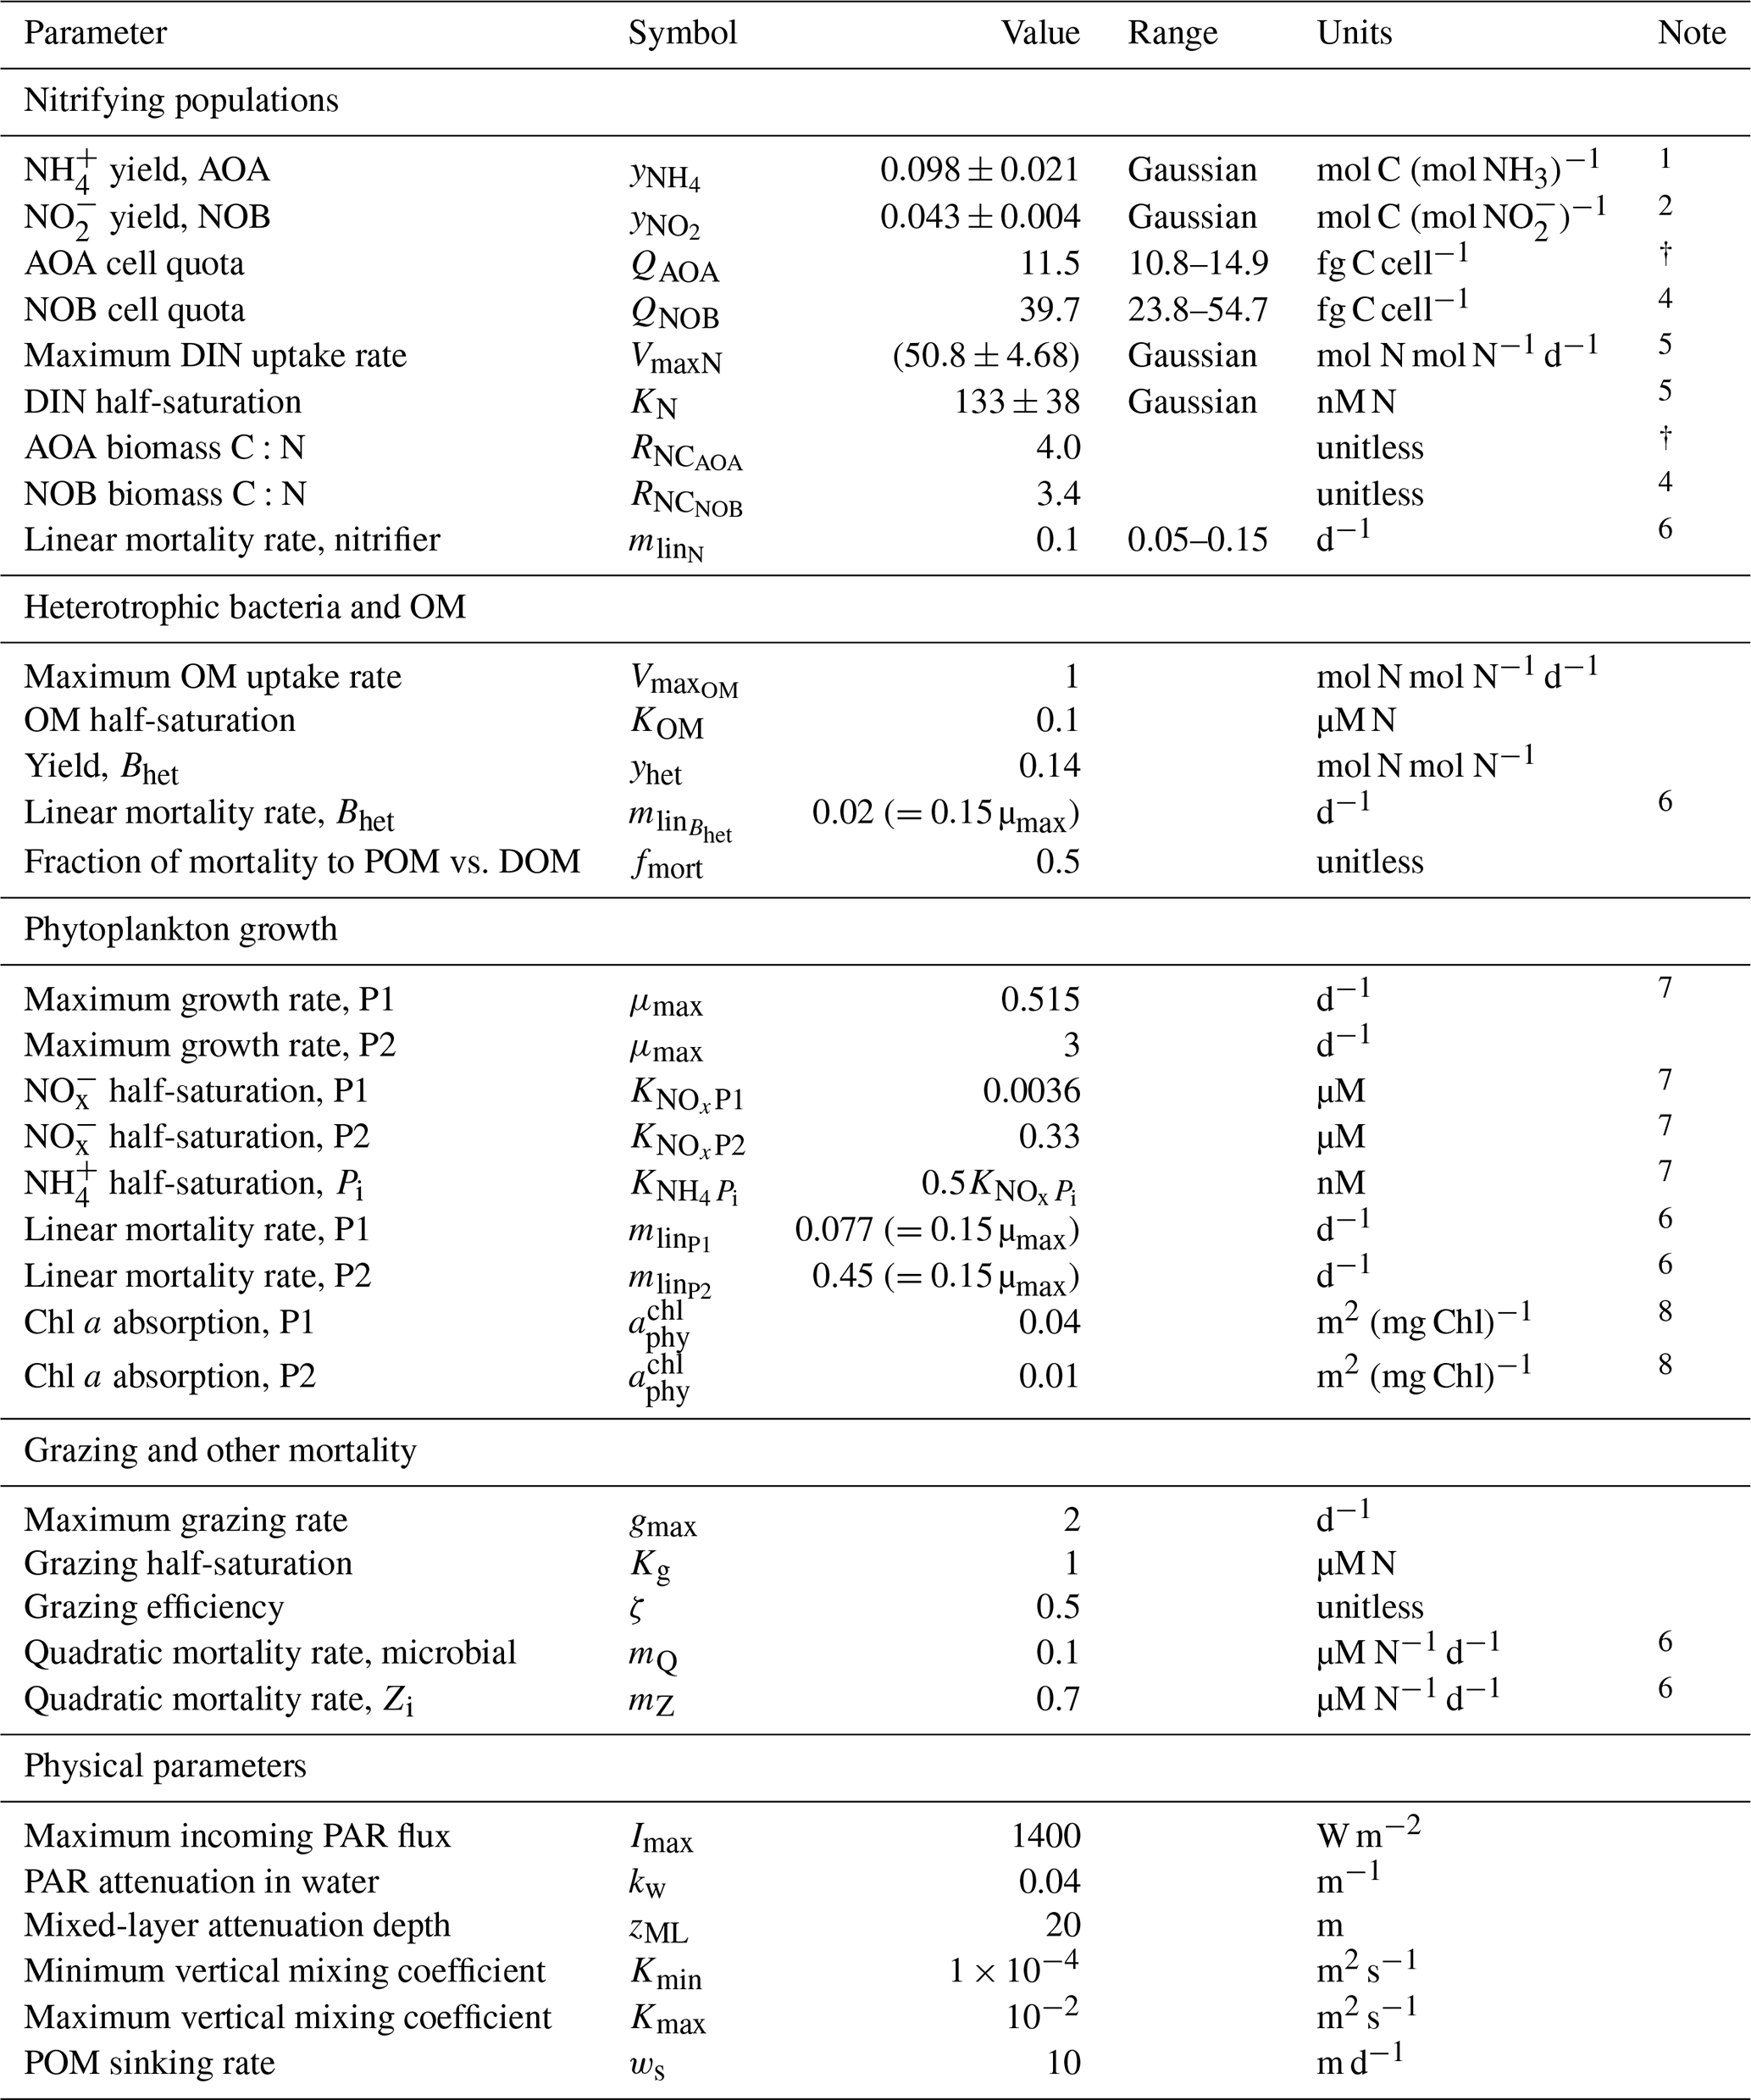
We parameterize the model of the nitrifying populations using a best estimate (default) set of parameter values and their uncertainties. The relative values and ranges are summarized in Table 1 (see Table A1 for absolute values and ranges). For the biomass yields and cell quotas, we use recently published measurements for AOA and NOB grown in environmentally relevant conditions: natural seawater at 15 ∘C and 1 µM substrate (Tables 1 and 2 in Bayer et al., 2022). Specifically, for AOA, we incorporate the average and standard deviation of the measured C fixation yields and carbon quotas of two marine-relevant organisms: Ca. Nitrosopelagicus U25 and Nitrosopumilus sp. CCS1. For NOB, we use the measured C fixation yield and carbon content of Nitrospina sp. Nb-3. This provides the following parameters for the yields, considering both the carbon assimilated into biomass and any excreted in dissolved form, and quotas: for AOA, a yield of 0.098 ± 0.021 mol C fixed per mol NH3 oxidized and cell quota of 11.5 ± 2.0 fg C per cell and for NOB, a yield of 0.043 ± 0.004 mol C fixed per mol NO oxidized and a cell quota of 39.8 ± 11.2 fg C per cell. The yield for Nitrospina is higher than many previous studies because it was enhanced by growth in natural seawater and because the study accounted for the fact that C fixation lagged behind NO oxidation (Bayer et al., 2022).
Differences in the loss rates between AOA and NOB populations in the ocean are not well known. Recent studies have suggested differences in opposing directions. Zhang et al. (2020) inferred that AOA loss rates are higher than those of NOB, while Kitzinger et al. (2020) inferred that NOB loss rates are higher than those of AOA. Given this uncertainty, we assume equal default mortality parameters so that the specific loss rates (L) of AOA and NOB are equal in the equilibrated solutions (note that this results in the biomass-dependent loss rates (LB) of AOA exceeding those of NOB in proportion to the resulting differences in biomass). We then consider a wide range in loss rates between AOA and NOB by incorporating a -fold to 3-fold relative difference in the mortality parameters of AOA and NOB in all model configurations. This is the magnitude of the difference in loss rates inferred in Zhang et al. (2020).
3.1 Simple expressions
We derive expressions that relate the rates and abundances of AOA and NOB functional type populations as simple, yet mechanistic, functions of a few parameters (with derivations in Appendix C). Table 2 summarizes the factors impacting the relationships. Here, we show that when incorporating our estimates of parameter values, these expressions are consistent with observations in the dark, oxygenated ocean.
3.1.1 Relative abundances
The simple expressions capture the observed difference in the relative cellular abundances of AOA to NOB (Fig. 2a). The steady-state balances suggest that the relative cellular abundances of AOA to NOB reflect three factors: their relative biomass yields, cell quotas, and population loss rates (Table 2, Eq. C7). We can calculate the impact of each factor using our default parameter estimates to understand why the model captures the 7- to 11-fold observed difference. The higher biomass yield (2.3-fold on average) and smaller cell quota (3.5-fold on average) of AOA both contribute to the calculated higher abundance of AOA relative to NOB. In the default simple model (black line in Fig. 2a), we assume equal population loss rates. If AOA are subject to a higher mortality rate than NOB (as inferred by Zhang et al., 2020), AOA abundance would be reduced and the abundance difference would be smaller (though AOA abundance may still be higher than NOB abundance). If AOA have a lower mortality rate than NOB (as inferred by Kitzinger et al., 2020), the abundance difference would be larger. However, we find that we do not need to invoke a difference in mortality rates to explain the observed relative abundances.
3.1.2 Nitrification rates
The simple expressions capture the observed pattern of similar rates of NH3 and NO oxidation in the dark ocean (Fig. 2b; Dore and Karl, 1996; Ward, 2008; Zhang et al., 2020). The model clarifies that at steady state, NH3 and NO oxidation rates are both set solely by the NH supply rate from heterotrophic excretion (Eq. C8). Interestingly, this suggests that metabolic and ecological traits of the nitrifying microorganisms do not impact the nitrification rates in steady-state, dark, and oxygenated environments (Table 2). Rather, population growth rates and abundances adjust to process the NH supply at equal rates. In contrast, in dynamic environments (when the steady-state approximation is not valid), organism-specific traits matter, and nitrification rates may be decoupled from the NH supply or from one another. Decoupling may also occur at the base of the euphotic zone where phytoplankton are active, if either AOA or NOB are a better competitor than the other against phytoplankton for DIN. Additionally, NO oxidation may exceed NH3 oxidation at steady state if other NO is supplied, such as from anaerobic NO reduction (Füssel et al., 2012; Beman et al., 2013; Babbin et al., 2020; Santoro et al., 2021).
3.1.3 Carbon fixation rates
The simple expressions indicate that the relative carbon fixation rates of AOA and NOB in the water column are proportional to their relative biomass yields (Eq. C10). A thermodynamics-based theoretical estimate suggests that the AOA yield is approximately 3-fold higher than the NOB yield when assuming equal cost of biomass synthesis (Zakem et al., 2018). Measured biomass yields and direct measurements of C fixation rates relative to nitrification rates are consistent with the theoretical estimates, with AOA yield 2–4-fold higher than NOB yield (Watson and Waterbury, 1971; Martens-Habbena et al., 2009; Santoro and Casciotti, 2011; Spieck et al., 2014; Qin et al., 2014; Berg et al., 2015; Bayer et al., 2019, 2022; Zhang et al., 2020; Kitzinger et al., 2020). The recently published 2.3-fold higher yield value incorporated here, in contrast to the 3-fold theoretical value, suggests that the cost of biomass synthesis may be higher for AOA than NOB (Bayer et al., 2022), which we discuss and analyze below.
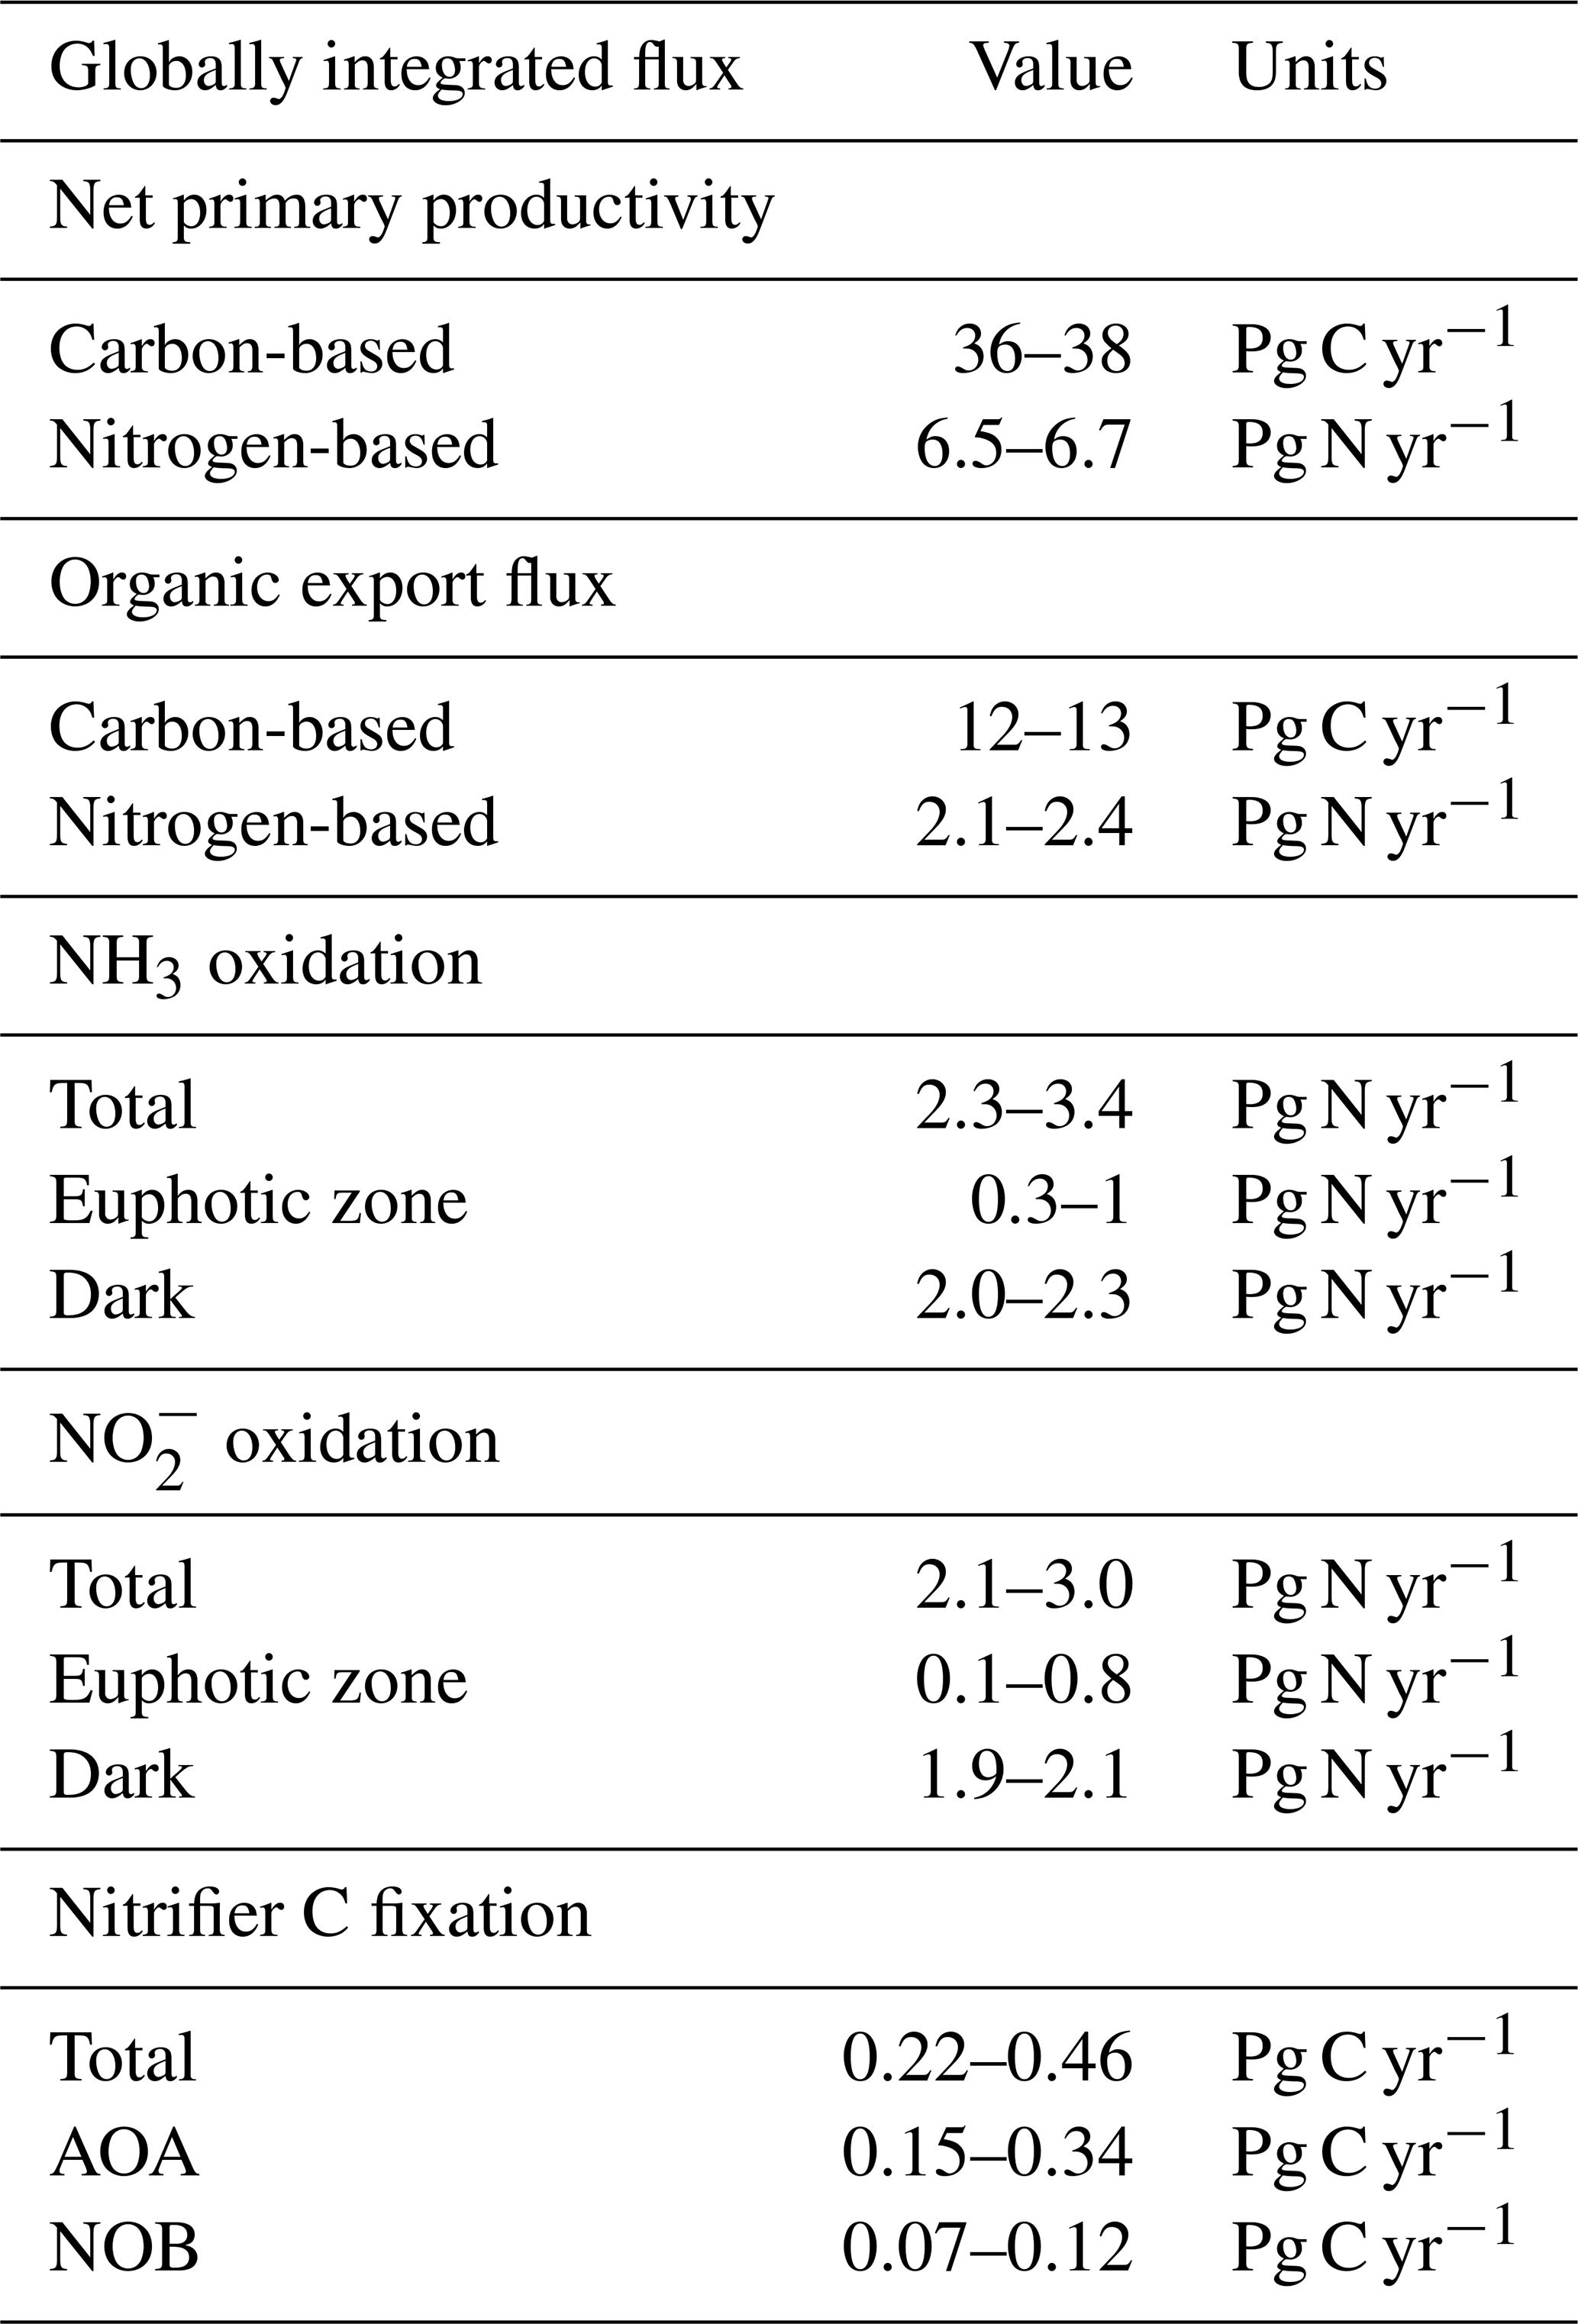
Table 3Globally integrated rates from the global ecosystem model (Darwin-MITgcm). The range of nitrification and associated C fixation rates reflects sensitivity to the range of yield and population loss rate parameters of the modeled AOA and NOB functional type populations across multiple simulations. Export is calculated as the flux of particulate organic matter at the base of the euphotic zone (the 1 % light level). The range of export values reported reflects the choice of cutoff of unrealistically high values in coastal waters and remains the same across the multiple simulations.
3.1.4 No impact of uptake kinetics in the dark ocean
At steady state (i.e., ), the parameters governing substrate uptake rates do not impact the nitrifiers' relative abundances or rates. In contrast, previous work demonstrates how uptake kinetics (specifically, affinities) do impact the steady-state concentrations of NH and NO (Table 2; Zakem et al., 2018) (to clarify, we note that in Zakem et al., 2018, the impact of affinity on cell abundance is due to an assumed correlation of affinity with cell size). However, we expect that uptake kinetics should impact nitrifier abundances and rates in dynamic environments and in the euphotic zone, when in competition with phytoplankton matters. For this reason, we turn to fully dynamic versions of the ecosystem model to determine to what degree the simple, steady-state point balances are useful in interpreting nitrification rates and abundances at larger scales.
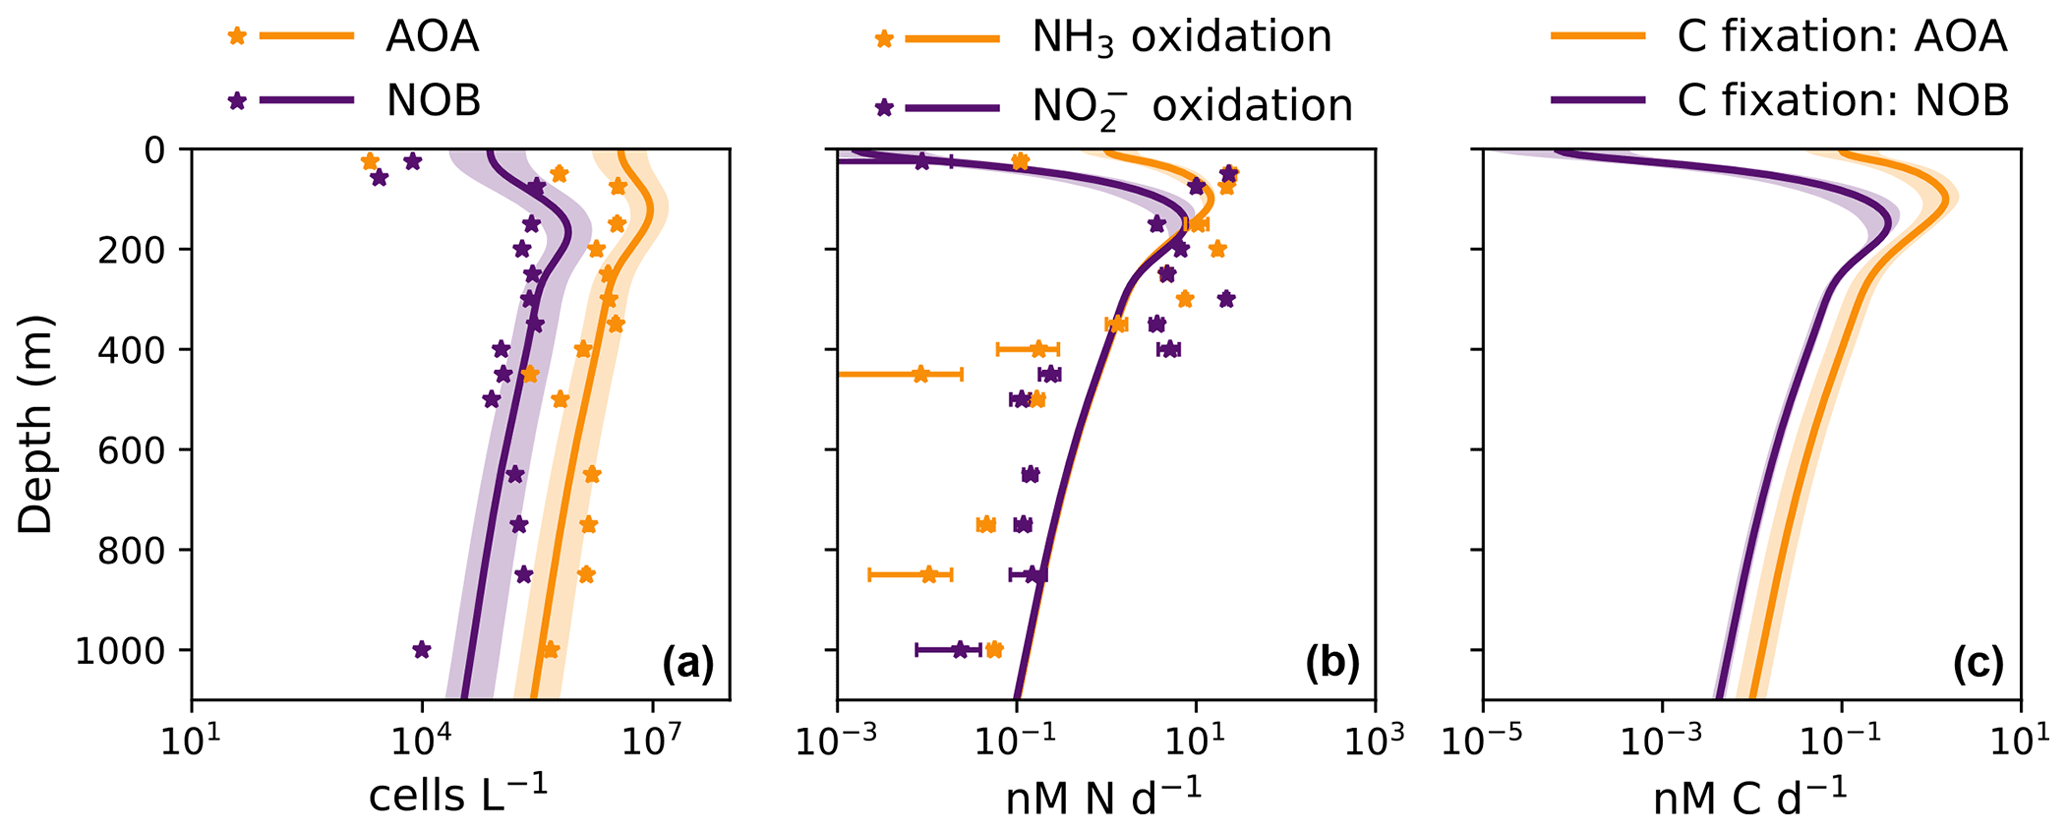
Figure 3Water column model solutions compared to observations in the western Pacific Ocean. Solid lines are model solutions, and marked points are measurements from Zhang et al. (2020). The shaded areas denote the 5th and 95th percentiles of the ensemble of model solutions in which the AOA and NOB parameter values are varied. (a) Abundances of ammonia-oxidizing archaea (AOA; measured with amoA) and nitrite-oxidizing bacteria (NOB; measured with 16S). (b) NH3 and NO oxidation rates. (c) Model prediction of the carbon fixation rates associated with AOA and NOB.
3.2 Vertical profiles
The water column ecosystem model captures much of the observed profiles from the western Pacific Ocean (Fig. 3, Zhang et al., 2020). Nitrifier abundances and nitrification rates peak just below the euphotic zone, where remineralization rates are higher, and then attenuate with depth as productivity declines. Below the surface, the model solutions capture the observed patterns and converge to the simple expressions. AOA abundances exceed NOB abundances (Fig. 3a), and NH3 and NO oxidation rates decline in proportion with one another over depth (Fig. 3b). Since the associated in situ C fixation rates were not measured, we can use the model to predict the water column C fixation rates of AOA and NOB (Fig. 3c). AOA C fixation is significantly (2.3-fold) higher than NOB C fixation at depth, directly reflecting the higher yield of AOA.
The observations exhibit more variation in the deep ocean than the model solutions. Measured abundances and nitrification rates increase and decrease together around the average state captured by the model. The lack of variability in the model reflects the simplifications of the one-dimensional physical configuration. In reality, time-varying circulation, vertical mixing, variability in the sinking organic matter flux, and biological patchiness can produce these fluctuations. To embrace some of this complexity, as well as other complexity due to variations in average surface productivity and oxygen availability, we next turn to the global model results.
3.3 Global patterns and integrals
We analyze nitrification activity at the global scale using the three-dimensional, global configuration of the ecosystem model. This allows us to investigate how the relationships among AOA and NOB vary across diverse environments and whether the simple expressions derived from the steady-state point balances are able to match the solutions given this complexity. We compare the global results to the simple expressions (Fig. 2c, d), and then calculate globally integrated nitrification and associated C fixation rates.
3.3.1 Correlation of NPP, export, and nitrification
The model demonstrates an expected global-scale correlation between NPP, the particulate organic carbon export flux, and nitrifier activity (Fig. 4), which is consistent with many observations (Ward, 2008; Newell et al., 2013; Smith et al., 2016; Santoro et al., 2017; Laperriere et al., 2020; Santoro et al., 2021). Vertically integrated nitrification rates and associated chemoautotrophic C fixation rates increase with NPP. Primary production indirectly fuels subsurface nitrification via the supply of sinking organic substrate and subsequent remineralization (Kirchman, 2000).
3.3.2 Deviations due to physical transport
Global model output matches the simple expressions to first order (Fig. 2c, d). However, there are significant deviations compared to the equilibrium solutions in the water column model. Many of these deviations reflect the impacts of physical transport. Previous work has demonstrated how the physical transport of biomass impacts microbial diversity and ecological interactions in locations where the timescales of transport are similar to the timescales of microbial growth (Clayton et al., 2013). Such short timescales of physical events can result in the co-occurrence of nitrifiers and phytoplankton in locations in which one group would be otherwise outcompeted. Many of the shallower locations plotted in Fig. 2 are examples of this case.
3.3.3 Decoupling of nitrification rates
In many locations, AOA abundances and NH3 oxidation rates are higher than NOB abundances and NO oxidation rates (Fig. 2c and d). In the model, AOA are better competitors than NOB against phytoplankton because of their higher biomass yield. Therefore, AOA can persist at higher light levels than NOB in the model. This may not be realistic, particularly if metabolically versatile NOB have an equally large or larger maximum potential growth rate than AOA (Kitzinger et al., 2020). Many of these events occur at or near the base of the euphotic zone, closer to the surface mixed layer, and so the transport of nitrifier biomass upwards into the euphotic zone also contributes to this mechanism of decoupling.
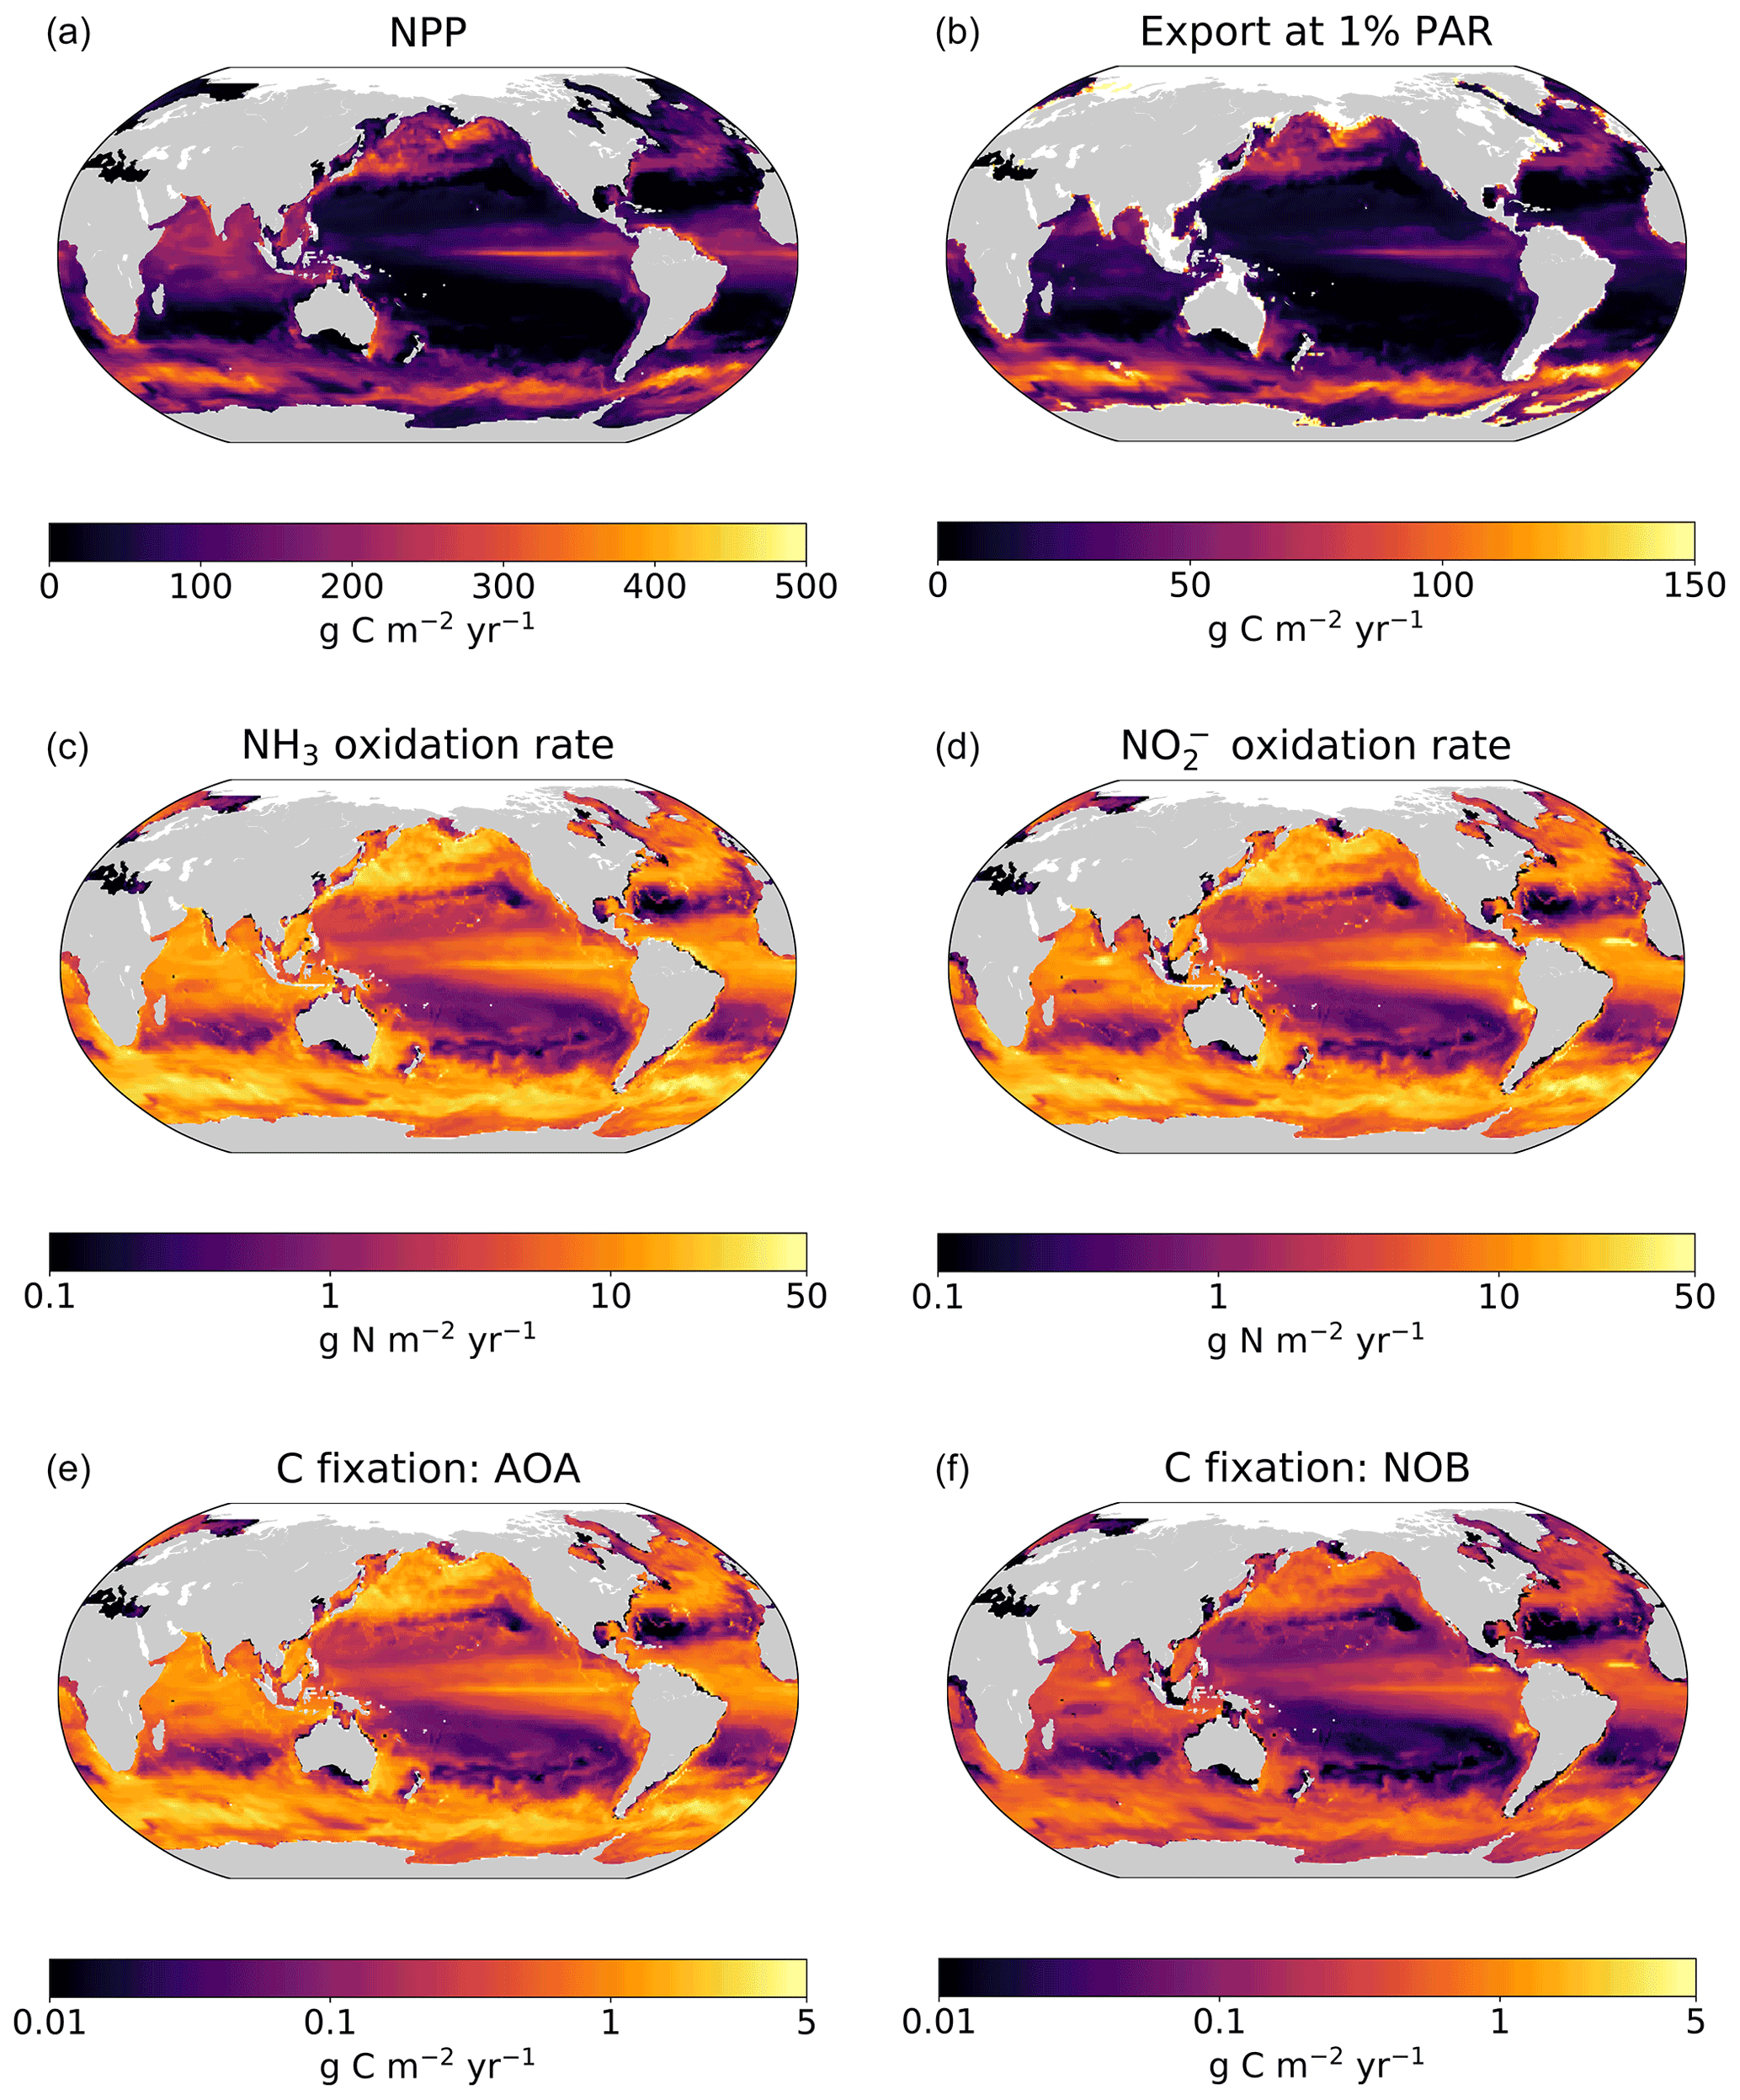
Figure 4Output from the global ecosystem model (Darwin-MITgcm). (a) Net primary productivity (NPP). (b) Export of particulate organic carbon from the euphotic zone (calculated at the 1 % light level). (c) Ammonia oxidation rate. (d) Nitrite oxidation rate. (e) Rate of carbon fixation associated with ammonia-oxidizing archaea (AOA). (d) Rate of carbon fixation associated with nitrite-oxidizing bacteria (NOB). All panels depict annual averages after 250 years of integration. Panels (a) and (c–f) depict vertically integrated quantities.
In contrast, NOB abundances and NO oxidation rates are higher than AOA abundances and NH3 oxidation rates at locations where NO has accumulated due to anaerobic NO reduction (Figs. 4, A1). Where [NO] > 10 µM in the annually averaged solutions, integrated NO oxidation is roughly 10× higher than NH3 oxidation (about 20 vs. 2 Tg N yr−1). The higher nitrification and C fixation rates of NOB (evident in Fig. 4d and f) indicate the well-known locations of permanently anoxic oxygen minimum zones (Paulmier and Ruiz-Pino, 2009; Kwiecinski and Babbin, 2021). Enhanced NO oxidation in and near anoxic zones is consistent with observations (Füssel et al., 2012; Babbin et al., 2020; Saito et al., 2020; Santoro et al., 2021). Though both AOA and NOB growth becomes limited by oxygen supply in anoxic zones, physical transport and the accumulation of NO (but not NH) enhance NO oxidation rates on average in these areas.
3.3.4 Integrated rates
Modeled global NPP and nitrification rates are consistent with previous estimates (Table 3). Global NPP is similar to other global model and remote-sensing-based estimates at about 40 Pg C yr−1 (Séférian et al., 2020), equating to photoautotrophic N assimilation of about 7 Pg N yr−1. Like previous comparisons of Darwin-MITgcm model simulations with satellite-based observations of NPP (Dutkiewicz et al., 2015b, 2019), modeled NPP is higher in the Southern Ocean and lower in oligotrophic gyres than observations suggest, though observations are sparse at high latitudes. The modeled export flux is closely coupled with modeled NPP, and so the export flux likely contains similar biases. Due to our heterotrophic activity parameterization, the modeled particulate organic matter export flux (12–13 Pg C yr−1, or 2.1–2.4 Pg N yr−1, at the 1 % light level) is larger than other estimates (5–11 Pg C yr−1; Schlitzer, 2000; Henson et al., 2011; Siegel et al., 2014). This choice to overestimate the export flux allows us to provide a meaningful constraint on global rates. Because deep nitrification rates are set by the export flux of organic nitrogen, the upper bound on the export flux provides an upper bound on dark nitrification rates. Variation in nitrifier parameter values does not significantly change the export flux. In all models, the export flux remained the same with respect to the degree of accuracy represented in Table 3.
Global nitrification rates reach a magnitude that is a substantial fraction of N-based NPP, at 2–3 Pg N yr−1. Nitrification is higher than the export of organic nitrogen because nitrification emerges in the euphotic zone in the model: 10 %–30 % of the nitrification rates are in waters at or above the 1 % light level. Dark nitrification rates are, as expected, roughly equal to the export flux of organic nitrogen (Table 3). Thus, a lower export flux would lower modeled dark nitrification rates proportionally. Despite the enhanced NO oxidation due to NO accumulation near anoxic zones, the global NO oxidation rate (2.1–3.0 Pg N yr−1) is lower than the global NH3 oxidation rate (2.3–3.4 Pg N yr−1). This is due to the inferior competitive ability of modeled NOB relative to AOA against phytoplankton, as discussed above. These nitrification rates are within the range of other estimates of 1.5–4.6 Pg N yr−1 (Gruber, 2008; Wuchter et al., 2006).
Modeled global chemoautotrophic C fixation by the nitrifying populations is also within the range of previous estimates. Modeled AOA fix 0.15–0.34 Pg C yr−1 and NOB fix 0.07–0.12 Pg C yr−1 (Table 3). Our point balance analysis allows us to determine the reason for the substantially higher C fixation values of AOA: the simple expressions clarify that this difference predominantly reflects the higher yield of AOA and not the decoupling of nitrification rates. Summed together, the total model C fixation rate from nitrification is 0.22–0.46 Pg C yr−1, about 1 % of NPP (Table 3, Fig. 4). These values are similar to the 0.4 Pg C yr−1 estimated by Wuchter et al. (2006) for AOA but nearly an order of magnitude less than the ∼1 Pg C yr−1 estimated by Pachiadaki et al. (2017) for NOB. For both AOA and NOB combined, the total is on par with the 0.40 Pg C yr−1 estimated by Middelburg (2011), higher than the 0.1–0.2 Pg C yr−1 estimated by Zhang et al. (2020), and higher than the 0.1 Pg C yr−1 estimated by Bayer et al. (2022). Though we use the same yields as Bayer et al. (2022), that study estimates a lower global chemoautotrophic C fixation rate than here because it incorporates a lower estimate of the organic export flux from the euphotic zone into the calculation and because the global model here also includes nitrification in the euphotic zone.
4.1 Linking theory and observations
We develop quantitative relationships between AOA and NOB rates and abundances, derived from a theoretical model of the ecology of nitrification, that are consistent with observations in the open ocean. This alignment of theoretical and empirical understanding is a critical first step towards our ultimate goal of predicting how the nitrification ecosystem will change with the environment. The relationships consist of simple, linear, yet mechanistic functions of a few metabolic and ecological parameters. Even with their simple forms, they serve to clarify the ecological dynamics at play in sometimes nonintuitive ways. For example, it was not necessarily obvious that uptake kinetics should not influence nitrifier abundances or rates in the dark ocean, in contrast to dynamic (i.e., coastal or some surface) environments, where population differences in uptake kinetics would matter. This is consistent with the conclusions of Sun et al. (2017) that differences in substrate affinity do not impact the apparent rates of NO oxidation below the surface layer.
4.2 Linking micro-scale and global-scale relationships
Our resulting relationships are relevant at the level of the cell as well as the level of the global marine ecosystem. For example, the measured yields of the nitrifying populations are important parameters for predicting global C fixation rates. This connection between the micro-scale and global scales is one of the benefits of employing mechanistic microbial ecosystem models. In contrast, biogeochemical models that parameterize nitrification using a bulk rate constant do not provide the framework necessary for directly linking laboratory measurements to global-scale dynamics. Furthermore, because the mechanistic model allows for nitrification to emerge dynamically, rather than relying on prescribed light inhibition, the model anticipates significant rates of nitrification in the euphotic zone (10 %–30 % of the global total). As Yool et al. (2007) articulate, this impacts the relationship between nitrate and “new production” in the ocean.
4.3 Higher N yield but lower energetic efficiency of AOA
In this study, we employed recently published yields for AOA and NOB populations in environmentally relevant conditions for which the AOA yield is 2.3-fold higher than NOB (Bayer et al., 2022). This difference in yield is similar to the results of Kitzinger et al. (2020) (see discussion in Zakem et al., 2020) but lower than the theoretical 3-fold difference estimated in Zakem et al. (2018). This suggests that marine NOB may be able to optimize their cellular machinery for greater overall efficiency of energy use than AOA. How can NOB obtain a higher energetic efficiency but a lower N yield? Using the metabolic framework of Zakem et al. (2018), the fraction of electrons channeled towards synthesis vs. respiration (i.e., anabolism vs. catabolism) is represented as parameter f (Rittman and McCarty, 2001). The yields can then be expressed as functions of f for each type: and . The coefficients reflect the elemental stoichiometry of the e−-normalized redox reactions where biomass synthesis is normalized to 1 mol N. The ratio of the yields between AOA and NOB using this framework is 3fAOA:fNOB. Therefore, fAOA can be smaller than fNOB while is still larger than . We can calculate f using the yield values here ( and ), the C:N of biomass used here (4.0 for AOA and 3.4 for NOB), and an estimate of denominator d, representing the number of electron equivalents corresponding to the oxidation states of the constituents used for biomass synthesis (d = 20±4; Zakem et al., 2018). This suggests the following e−-partitioning fractions: and . This suggests that AOA has a lower efficiency than NOB with respect to energy despite the significantly higher yield with respect to DIN utilization. This is also consistent with the calculations of Bayer et al. (2022).
4.4 An upper estimate of C fixation from nitrification
The global ecosystem model is a useful tool for estimating global nitrification and associated C fixation rates. The model estimate integrates over the wide range in productivity rates across the ocean (Fig. 4) and allows for euphotic zone nitrification to emerge dynamically from microbial interactions. In the range of simulations used in this study, the contribution of nitrification to chemoautotrophic C fixation is 0.2–0.5 Pg C yr−1. The contribution of AOA (0.2–0.3 Pg C yr−1) is higher than that of NOB (about 0.1 Pg C yr−1).
Despite the uncertainties inherent in global ecosystem models, we argue that this estimate constitutes an upper estimate of the chemoautotrophic C fixation rates associated with nitrification. First, the nitrifier C fixation yields input into the model are higher than many previous estimates, and they include the fixed C that is lost to DOC release rather than just that incorporated into biomass (Bayer et al., 2022). Thus, our parameter values provide an upper estimate of the C fixation associated with a given nitrification rate. Second, because the modeled organic export flux is roughly 10 % higher than the upper bound of previous estimates, the model may overestimate dark nitrification rates. Third, our simulation includes a significant amount of emergent euphotic zone nitrification, and so 10 %–30 % of nitrifier C fixation is within the euphotic zone in the model. Euphotic zone nitrification is widely observed (Ward, 1987; Dore and Karl, 1996; Ward, 2005; Stephens et al., 2020), though usually not accounted for in biogeochemical models that prescribe light inhibition for nitrification rather than allowing it to emerge from the interactions of dynamic nitrifying populations. For these reasons, the resulting upper bounds of the modeled global C fixation rates (0.34 Pg C yr−1 for AOA and 0.12 Pg C yr−1 for NOB) are more likely to be overestimates than underestimates.
It is possible that metabolisms other than nitrification contribute to deep ocean C fixation. Our upper estimate of the modeled C fixation rate from nitrification (0.5 Pg C yr−1) is substantially less than the 1–10 Pg C yr−1 of deep carbon fixation estimated by Baltar and Herndl (2019). Given that nitrification rates wane sharply with depth in the dark ocean (Ward, 1987; Dore and Karl, 1996; Newell et al., 2013; Zhang et al., 2020; Figs. 2 and 3), the contribution of nitrification to deep C fixation may decrease substantially with depth (Pachiadaki et al., 2017). As nitrification wanes, a diverse microbial community carrying out other metabolisms, such as sulfur oxidation, may dominate C fixation rates (Swan et al., 2011).
4.5 Diagnosing additional metabolisms
The resulting quantitative relationships derived here can serve as a metric for determining whether additional chemoautotrophic C-fixing metabolisms or the metabolic versatility of NOB matter for large-scale biogeochemical cycling. Our analysis suggests that the 10-fold higher rates of C fixation inferred for the deep ocean could be attributed to alternative (non-nitrifying) chemoautotrophic clades of microorganisms. Second, departures from the relationships in the deep ocean may be used to quantify departures from canonical nitrification. For example, recent studies suggest that a lifestyle of pure nitrification is not a valid assumption for many NOB because they exhibit metabolic versatility (Koch et al., 2014, 2015; Füssel et al., 2017; Bayer et al., 2020). Three factors impact the relative abundances of AOA to NOB for canonical nitrification (Eq. C7): the relative yields, cell quotas, and loss rates (i.e., population turnover rates). If these three factors are constrained, any additional difference in AOA : NOB may indicate an alternative metabolism at play. Therefore, careful measurements of the relevant parameters can help to tease apart these factors and quantify the contribution of alternative NOB metabolisms.
This work provides simple, mechanistic relationships for the abundances and rates of AOA and NOB that are consistent with observations. The simple expressions explain multiple sets of in situ observations as linear functions of a few parameters. We provide an upper estimate on global carbon fixation rates from nitrification of 0.2–0.5 Pg C yr−1, with AOA contributing to higher rates than NOB. If dark ocean C fixation rates are higher than this estimate, alternative metabolisms fueling C fixation likely play a significant role in the marine carbon cycle.
Here, we provide the full detailed set of equations used for the water column model. The three-dimensional ocean model uses the same terms but resolves additional phytoplankton and zooplankton functional types as well as the cycling of other elements, as explained above (Sect. 2.2). All populations and nutrients are resolved as concentrations of nitrogen: the biomass of eight functional type populations (ammonia-oxidizing archaea BAOA; nitrite-oxidizing bacteria BNOB; two populations of phytoplankton Pi: a slower-growing, smaller, cyanobacteria-like gleaner and a faster-growing, larger, diatom-like opportunist, Dutkiewicz et al., 2009; heterotrophic bacteria Bhet; and three microzooplankton grazers Zi), three inorganic nutrients (NH, NO, and NO), sinking particulate organic matter (POM), and dissolved organic matter (DOM). Nitrogen is conserved over the domain. Oxygen and micronutrients are assumed to be sufficiently abundant as to not limit the growth rates. All metabolic rates, including mortality rates, are modified as a function of temperature following the Arrhenius equation, following Dutkiewicz et al. (2015a) as outlined in Zakem et al. (2018). Each tracer C is diffused by diffusion coefficients κ as
where SC are additional sources and sinks as follows:
where μi is the growth rate of each microbial population calculated from the limiting uptake rate of the required substrates of each. Heterotrophic bacteria growth is limited by the sum of DOM and POM according to uptake kinetic parameters (maximum uptake rate and half-saturation constant KOM) and growth efficiency yhet. See Table A1 for all parameter values (unless otherwise stated, parameters are identical to those in Zakem et al., 2018). For phytoplankton, the growth rate is limited by a maximum growth rate μmax, photosynthetic rate based on light availability, and the uptake Vi of all three inorganic nitrogen species as detailed in Zakem et al. (2018). Values for the maximum growth rate and the half-saturation constants were computed as functions of cell size for a cell diameter (equivalent spherical diameter (ESD)) of 0.6 µM for P1 (cyanobacteria-like) and 20 µM for P2 (diatom-like) using the data-based allometric relationships in Litchman et al. (2007) as in Ward et al. (2012). The effective half-saturation constants with respect to μmax were calculated from those with respect to maximum uptake rate Vmax with an estimate of the minimum cell quota Qmin from the relationships in Litchman et al. (2007), following Verdy et al. (2009) and Ward et al. (2012). Zooplankton populations grow at grazing rate g, calculated as a saturating function of their prey biomass with maximum grazing rate gmax, half-saturation constant Kg, and growth efficiency ζ (Armstrong, 1994; Zakem et al., 2018). NH is excreted by heterotrophic bacteria and zooplankton in proportion to their growth efficiencies. DOM and POM are sourced from the mortalities of all biomasses. fPOM is the diagnostic fraction of total non-living organic matter in particulate form (i.e., POM/(POM + DOM)), and fmort is the assigned fraction of mortality that is partitioned into POM vs. DOM. POM sinks at rate ws. In addition to grazing, microbial populations are subject to losses according to both linear mortality rate and quadratic mortality rate mQ, which represent losses to maintenance and senescence and losses to viral lysis, respectively. Quadratic mortality rate mZ represents predation of zooplankton by higher trophic levels.
Table A1Parameter values for the water column model, including ranges for the ensemble.
1 Table 2 in Bayer et al. (2022) for Ca. Nitrosopelagicus brevis U25 and Nitrosopumilus sp. CCS1 (natural seawater).
2 Table 2 in Bayer et al. (2022) for Nitrospina gracilis Nb-3 (natural seawater).
3 Table 1 in Bayer et al. (2022) for Ca. Nitrosopelagicus brevis U25 and Nitrosopumilus sp. CCS1 (all growth stages).
4 Table 1 in Bayer et al. (2022) for Nitrospina gracilis Nb-3 (all growth stages).
5 From Martens-Habbena et al. (2009) for AOA, with conversion to N-based biomass as in Zakem et al. (2018).
6 Mortality rates, like all metabolic rates, are modified by temperature as in Zakem et al. (2018).
7 Computed using data-based allometric relationships in Litchman et al. (2007) as in Ward et al. (2012).
8 Following Dutkiewicz et al. (2015a). See Zakem et al. (2018) for photosynthesis-rate parameterization.
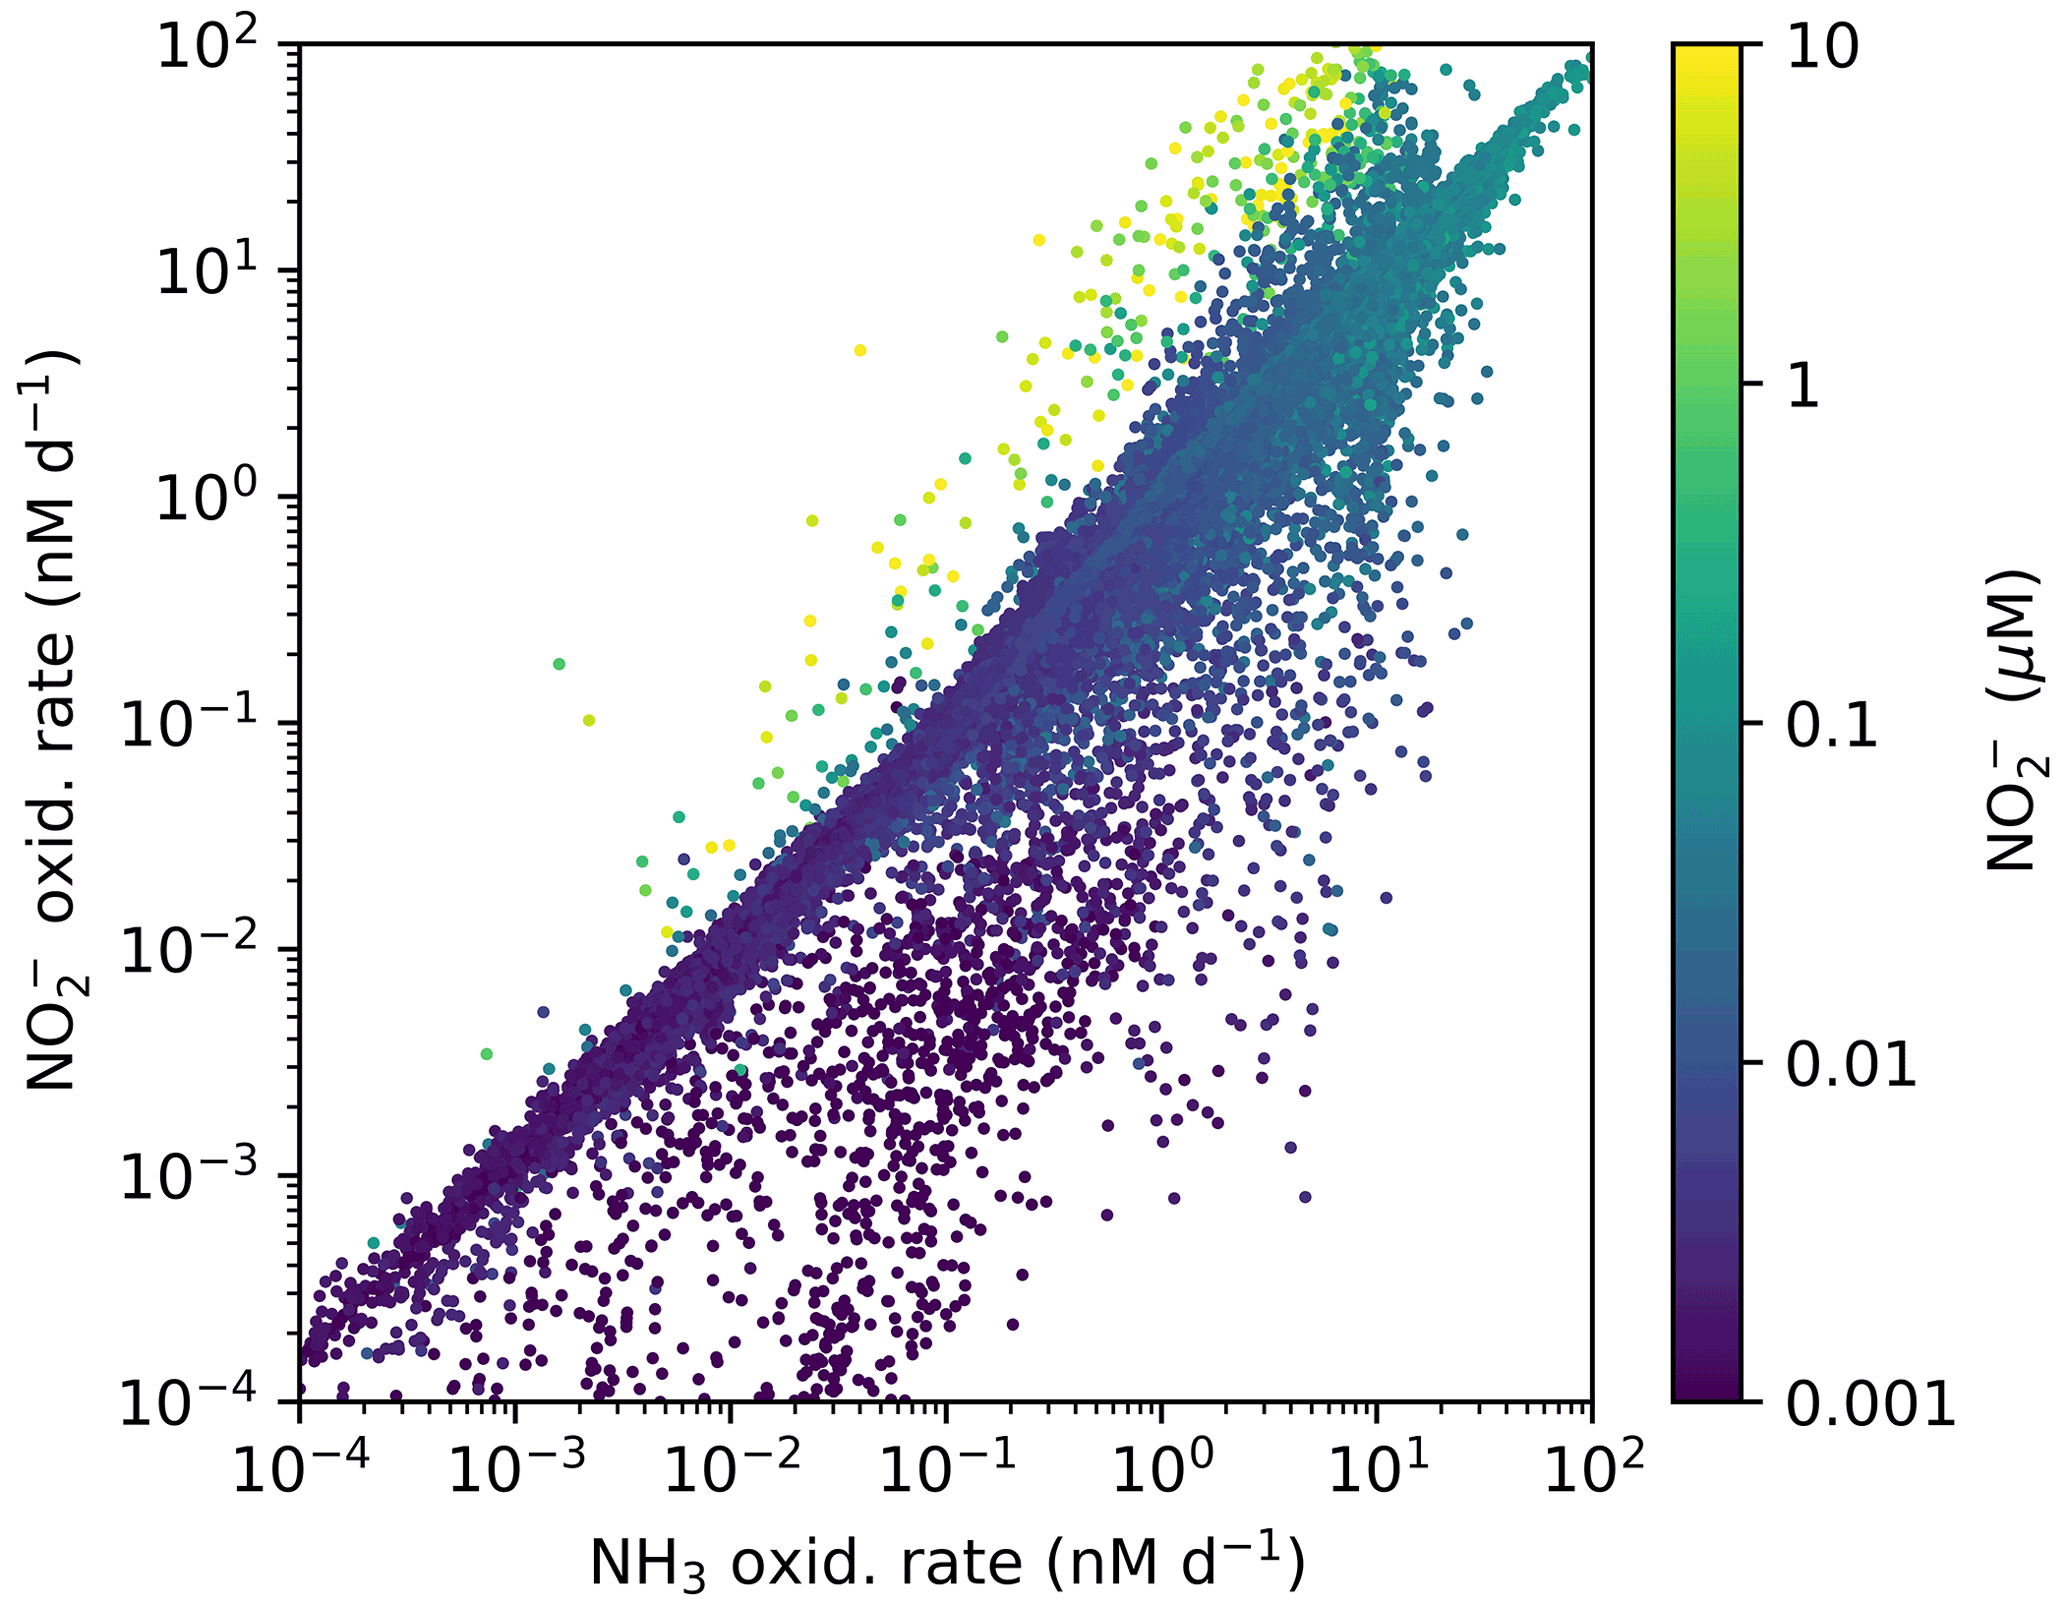
Figure A1Annually averaged aerobic NO oxidation rate against NH3 oxidation rate with associated local concentration of NO in the global ecosystem model (Darwin-MITgcm). The locations where NO oxidation exceeds NH3 oxidation correspond to the anoxic zone locations where NO has accumulated due to anaerobic NO reduction. Physical transport combines NO and O2. See Zakem et al. (2019) for details of anaerobic functional type parameterizations.
In the water column model, light and mixing attenuate with depth to form the stratified structure of a typical marine water column. Light energy I decreases with depth z according to the attenuation coefficients for water kw:
The mixed layer is imposed by varying the vertical diffusion coefficient KZ with depth, from a maximum Kmax at the surface to a minimum Kmin with a length scale of zmld. Vertical mixing increases at the bottom of the domain with a 100 m length scale, which avoids numerical error and simulates a bottom boundary mixed layer. KZ (m2 s−1) is calculated as
where H is the height of the domain (2000 m).
We derive quantitative and mechanistic relationships between nitrifier abundances and rates that can be used to explain observations in the dark, oxygenated, and open ocean. To accomplish this, we use a set of simplified model equations. We focus on the characteristics of the nitrification ecosystem below the sunlit layer and so neglect phytoplankton activity. We neglect physical transport, since ocean transport rates are typically slow relative to microbial activity rates at depth. We assume that NOB, as well as AOA, consume either NH or simple organic compounds such as urea for assimilation into biomass, but we neglect this term in the equations because it is small relative to the other terms due to the low nitrifier yields (i.e., using the syntax explained below). This term is included in the full ecosystem model (including the 1D and 3D versions here), but it is negligible in all model solutions. With these simplifications, the following equations describe the relevant aspects of the nitrification ecosystem in the dark, oxygenated ocean:
where BAOA and BNOB (mol C L−1) are the biomass concentrations of NH3-oxidizing archaeal (AOA) and NO-oxidizing bacterial (NOB) functional types, each with associated growth rate μ (t−1), specific loss rate L (t−1), and yield y (mol biomass synthesized per mol NH or NO utilized). The loss rate L represents biomass losses to grazing, viral lysis, maintenance, and senescence. We include a simplified equation for dissolved inorganic carbon (DIC) to clarify how the model resolves nitrifier carbon fixation. Excretion of NH () and DIC (eDIC) by heterotrophic biomass (Bhet) represents the activity of both microheterotrophs and larger zooplankton.
We then analyze the steady-state balances of Eqs. (1)–(4). The steady-state approximation is valid when the changes in microbial biomass and nutrient concentrations are small relative to their fluxes (i.e., growth rates and nitrification rates), which captures the dynamics of the open ocean on average over time.
C1 Relative abundances
Assuming steady state (e.g., μi=Li and ), we estimate the relative biomass concentrations B (mol C L−1) of AOA and NOB from Eqs. C1, C2, and C4 as
We can calculate cellular abundances X (cells L−1) using an estimate of the cell quota Q (mol C cell−1) as . This gives the relative abundances of AOA and NOB as
This suggests that the ratio of AOA to NOB cells is directly proportional to the ratio of their biomass yields and inversely proportional to the ratio of their loss rates and cell quotas.
C2 Nitrification rates
The steady state of Eqs. (C3) and (C4) relates the three rates r of DIN transformation (mol N L−1 t−1):
This suggests that the three N-cycling rates – NH supply from heterotrophic excretion, NH3 oxidation, and NO oxidation – are relatively equal in the dark ocean when other sources or sinks of NH and NO are negligible.
C3 Carbon fixation rates
Assuming solely chemoautotrophic growth and no excess C fixation, the rate of carbon fixation is directly proportional to the production rate of each population i as , where μ is the growth rate and Bi is the carbon-based concentration of biomass. The relative C fixation rates (mol C L−1 t−1) for AOA and NOB are then
Plugging in the above expression for the relative biomasses (Eq. C6) simplifies this ratio to
This suggests that the ratio of AOA carbon fixation to NOB carbon fixation is directly proportional to the ratio of their biomass yields with respect to DIN utilization. Furthermore, the relationships between AOA and NOB C fixation rates and their respective nitrogen oxidation rates in the water column are
This suggests that at steady state, the macro-scale (water column) matches the micro-scale (cell): the ratio of the water column C fixation rate to nitrification rate is directly proportional to the nitrifier's biomass yield with respect to DIN utilization. Excess C fixation, perhaps resulting in the excretion of DOC, decouples these relationships, since in this case the biomass yield (mol B synthesized per mol DIN) differs from the C fixation yield (mol C fixed per mol DIN).
Water column model code, Darwin-MITgcm model code, and output files are available at Zenodo (https://doi.org/10.5281/zenodo.6384810, Zakem, 2022).
EJZ designed and executed the research. BB, AS, WQ, and YZ contributed to the model development. NML contributed to the analysis of the results. EJZ wrote the paper with contributions from BB, AS, YZ, and NML.
The contact author has declared that none of the authors has any competing interests.
Publisher’s note: Copernicus Publications remains neutral with regard to jurisdictional claims in published maps and institutional affiliations.
Emily J. Zakem thanks the Simons Foundation for the Simons Postdoctoral Fellowship in Marine Microbial Ecology.
Emily J. Zakem was supported by the Simons Foundation Postdoctoral Fellowship in Marine Microbial Ecology. Barbara Bayer was supported by the Austrian Science Fund (FWF) project J4426-B. Alyson E. Santoro was supported by a Simons Foundation Early Career Investigator Award in Marine Microbial Ecology and Evolution (no. 345889) and the US National Science Foundation (award OCE-1924512). Yao Zhang was supported by the National Science Fund for Distinguished Young Scholars (no. 42125603). Naomi M. Levine was supported by the Simons Foundation: The Simons Collaboration on Principles of Microbial Ecology (PriME no. 542389).
This paper was edited by Caroline P. Slomp and reviewed by Christopher Somes and one anonymous referee.
Armstrong, R. A.: Grazing limitation and nutrient limitation in marine ecosystems: Steady state solutions of an ecosystem model with multiple food chains, Limnol. Oceanogr., 39, 597–608, https://doi.org/10.4319/lo.1994.39.3.0597, 1994. a
Babbin, A. R., Buchwald, C., Morel, F. M., Wankel, S. D., and Ward, B. B.: Nitrite oxidation exceeds reduction and fixed nitrogen loss in anoxic Pacific waters, Mar. Chem., 224, 103814, https://doi.org/10.1016/j.marchem.2020.103814, 2020. a, b
Baltar, F. and Herndl, G. J.: Ideas and perspectives: Is dark carbon fixation relevant for oceanic primary production estimates?, Biogeosciences, 16, 3793–3799, https://doi.org/10.5194/bg-16-3793-2019, 2019. a
Bayer, B., Vojvoda, J., Reinthaler, T., Reyes, C., Pinto, M., and Herndl, G. J.: Nitrosopumilus adriaticus sp. nov. and Nitrosopumilus piranensis sp. nov., two ammonia-oxidizing archaea from the Adriatic Sea and members of the class Nitrososphaeria, Int. J. Syst. Evol. Microb., 69, 1892–1902, https://doi.org/10.1099/ijsem.0.003360, 2019. a
Bayer, B., Saito, M. A., McIlvin, M. R., Lücker, S., Moran, D. M., Lankiewicz, T. S., Dupont, C. L., and Santoro, A. E.: Metabolic versatility of the nitrite-oxidizing bacterium Nitrospira marina and its proteomic response to oxygen-limited conditions, ISME J., 15, 1025–1039, https://doi.org/10.1038/s41396-020-00828-3, 2020. a, b
Bayer, B., McBeain, K., Carlson, C. A., and Santoro, A. E.: Carbon content, carbon fixation yield and dissolved organic carbon release from diverse marine nitrifiers, Limnol. Oceanogr., https://doi.org/10.1002/lno.12252, 2022. a, b, c, d, e, f, g, h, i, j, k, l, m, n, o, p, q, r, s, t, u, v
Beman, J. M., Leilei Shih, J., and Popp, B. N.: Nitrite oxidation in the upper water column and oxygen minimum zone of the eastern tropical North Pacific Ocean., ISME J., 7, 2192–205, https://doi.org/10.1038/ismej.2013.96, 2013. a
Berg, C., Listmann, L., Vandieken, V., Vogts, A., and Jürgens, K.: Chemoautotrophic growth of ammonia-oxidizing Thaumarchaeota enriched from a pelagic redox gradient in the Baltic Sea, Front. Microbiol., 5, 786, https://doi.org/10.3389/fmicb.2014.00786, 2015. a
Clayton, S., Dutkiewicz, S., Jahn, O., and Follows, M. J.: Dispersal, eddies, and the diversity of marine phytoplankton, Limnol. Oceanogr., 3, 182–197, https://doi.org/10.1215/21573689-2373515, 2013. a
Dore, J. E. and Karl, D. M.: Nitrification in the euphotic zone as a source for nitrite, nitrate, and nitrous oxide at Station ALOHA, Limnol. Oceanogr., 41, 1619–1628, https://doi.org/10.4319/lo.1996.41.8.1619, 1996. a, b, c, d, e
Dutkiewicz, S., Follows, M. J., and Bragg, J. G.: Modeling the coupling of ocean ecology and biogeochemistry, Global Biogeochem. Cy., 23, 1–15, https://doi.org/10.1029/2008GB003405, 2009. a
Dutkiewicz, S., Hickman, A. E., Jahn, O., Gregg, W. W., Mouw, C. B., and Follows, M. J.: Capturing optically important constituents and properties in a marine biogeochemical and ecosystem model, Biogeosciences, 12, 4447–4481, https://doi.org/10.5194/bg-12-4447-2015, 2015a. a, b
Dutkiewicz, S., Morris, J. J., Follows, M. J., Scott, J., Levitan, O., Dyhrman, S. T., and Berman-Frank, I.: Impact of ocean acidification on the structure of future phytoplankton communities, Nat. Clim. Change, 5, 1002–1006, https://doi.org/10.1038/nclimate2722, 2015b. a, b
Dutkiewicz, S., Hickman, A. E., Jahn, O., Henson, S., Beaulieu, C., and Monier, E.: Ocean colour signature of climate change, Nat. Commun., 10, 578, https://doi.org/10.1038/s41467-019-08457-x, 2019. a
Follows, M. J., Dutkiewicz, S., Grant, S., and Chisholm, S. W.: Emergent biogeography of microbial communities in a model ocean, Science, 315, 1843–1846, https://doi.org/10.1126/science.1138544, 2007. a
Füssel, J., Lam, P., Lavik, G., Jensen, M. M., Holtappels, M., Günter, M., and Kuypers, M. M. M.: Nitrite oxidation in the Namibian oxygen minimum zone, ISME J., 6, 1200–1209, https://doi.org/10.1038/ismej.2011.178, 2012. a, b
Füssel, J., Lücker, S., Yilmaz, P., Nowka, B., van Kessel, M. A. H. J., Bourceau, P., Hach, P. F., Littmann, S., Berg, J., Spieck, E., Daims, H., Kuypers, M. M. M., and Lam, P.: Adaptability as the key to success for the ubiquitous marine nitrite oxidizer Nitrococcus, Sci. Adv., 3, e1700807, https://doi.org/10.1126/sciadv.1700807, 2017. a, b
Gruber, N.: The Marine Nitrogen Cycle: Overview and Challenges, in: Nitrogen in the Marine Environment, edited by: Capone, D. G., Bronk, D. A., Mulholland, M. R., and Carpenter, E. J., chap. 1, 1–50, Academic Press, 2nd edn., 2008. a
Henson, S. A., Sanders, R., Madsen, E., Morris, P. J., Le Moigne, F., and Quartly, G. D.: A reduced estimate of the strength of the ocean's biological carbon pump, Geophys. Res. Lett., 38, L04606, https://doi.org/10.1029/2011GL046735, 2011. a, b
Horak, R. E. a., Qin, W., Schauer, A. J., Armbrust, E. V., Ingalls, A. E., Moffett, J. W., Stahl, D. a., and Devol, A. H.: Ammonia oxidation kinetics and temperature sensitivity of a natural marine community dominated by Archaea., ISME J., 7, 2023–33, https://doi.org/10.1038/ismej.2013.75, 2013. a
Karner, M. B., Delong, E. F., and Karl, D. M.: Archaeal dominance in the mesopelagic zone of the Pacific Ocean, Nature, 409, 507–510, https://doi.org/10.1038/35054051, 2001. a
Kirchman, D. L.: Uptake and Regeneration of Inorganic Nutrients by Marine Heterotrophic Bacteria, in: Microbial Ecology of the Oceans, edited by: Kirchman, D. L., Wiley-Liss, Inc, 261–288, 2000. a
Kitzinger, K., Marchant, H. K., Bristow, L. A., Herbold, C. W., Padilla, C. C., Kidane, A. T., Littmann, S., Daims, H., Pjevac, P., Stewart, F. J., Wagner, M., and Kuypers, M. M.: Single cell analyses reveal contrasting life strategies of the two main nitrifiers in the ocean, Nat. Commun., 11, 767, https://doi.org/10.1038/s41467-020-14542-3, 2020. a, b, c, d, e
Koch, H., Galushko, A., Albertsen, M., Schintlmeister, A., Gruber-Dorninger, C., Lücker, S., Pelletier, E., Le Paslier, D., Spieck, E., Richter, A., Nielsen, P. H., Wagner, M., and Daims, H.: Microbial metabolism: Growth of nitrite-oxidizing bacteria by aerobic hydrogen oxidation, Science, 345, 1052–1054, https://doi.org/10.1126/science.1256985, 2014. a, b
Koch, H., Lücker, S., Albertsen, M., Kitzinger, K., Herbold, C., Spieck, E., Nielsen, P. H., Wagner, M., and Daims, H.: Expanded metabolic versatility of ubiquitous nitrite-oxidizing bacteria from the genus Nitrospira., P. Natl. Acad. Sci. USA, 112, 11371–11376, https://doi.org/10.1073/pnas.1506533112, 2015. a, b
Könneke, M., Bernhard, A. E., De La Torre, J. R., Walker, C. B., Waterbury, J. B., and Stahl, D. A.: Isolation of an autotrophic ammonia-oxidizing marine archaeon, Nature, 437, 543–546, https://doi.org/10.1038/nature03911, 2005. a
Kwiecinski, J. V. and Babbin, A. R.: A High-Resolution Atlas of the Eastern Tropical Pacific Oxygen Deficient Zones, Global Biogeochem. Cy., 35, https://doi.org/10.1029/2021GB007001, 2021. a
Laperriere, S. M., Morando, M., Capone, D. G., Gunderson, T., Smith, J. M., and Santoro, A. E.: Nitrification and nitrous oxide dynamics in the Southern California Bight, Limnol. Oceanogr., 66, 1–14, https://doi.org/10.1002/lno.11667, 2020. a
Litchman, E., Klausmeier, C. A., Schofield, O. M., and Falkowski, P. G.: The role of functional traits and trade-offs in structuring phytoplankton communities: scaling from cellular to ecosystem level., Ecol. Lett., 10, 1170–1181, https://doi.org/10.1111/j.1461-0248.2007.01117.x, 2007. a, b, c
Martens-Habbena, W., Berube, P. M., Urakawa, H., de la Torre, J. R., and Stahl, D. A.: Ammonia oxidation kinetics determine niche separation of nitrifying Archaea and Bacteria., Nature, 461, 976–979, https://doi.org/10.1038/nature08465, 2009. a, b
Middelburg, J. J.: Chemoautotrophy in the ocean, Geophys. Res. Lett., 38, L24604, https://doi.org/10.1029/2011GL049725, 2011. a
Newell, S. E., Fawcett, S. E., and Ward, B. B.: Depth distribution of ammonia oxidation rates and ammonia-oxidizer community composition in the Sargasso Sea, Limnol. Oceanogr., 58, 1491–1500, https://doi.org/10.4319/lo.2013.58.4.1491, 2013. a, b
Pachiadaki, M. G., Sintes, E., Bergauer, K., Brown, J. M., Record, N. R., Swan, B. K., Mathyer, M. E., Hallam, S. J., Lopez-Garcia, P., Takaki, Y., Nunoura, T., Woyke, T., Herndl, G. J., and Stepanauskas, R.: Major role of nitrite-oxidizing bacteria in dark ocean carbon fixation, Science, 358, 1046–1051, 2017. a, b, c, d
Paulmier, A. and Ruiz-Pino, D.: Oxygen minimum zones (OMZs) in the modern ocean, Prog. Oceanogr., 80, 113–128, https://doi.org/10.1016/j.pocean.2008.08.001, 2009. a
Qin, W., Amin, S. a., Martens-Habbena, W., Walker, C. B., Urakawa, H., Devol, a. H., Ingalls, a. E., Moffett, J. W., Armbrust, E. V., and Stahl, D. a.: Marine ammonia-oxidizing archaeal isolates display obligate mixotrophy and wide ecotypic variation, P. Natl. Acad. Sci. USA, 111, 12504–12509, https://doi.org/10.1073/pnas.1324115111, 2014. a
Rittman, B. E. and McCarty, P. L.: Environmental Biotechnology: Principles and Applications, McGraw-Hill, ISBN 1259002888, 9781259002885, 2001. a
Saito, M. A., McIlvin, M. R., Moran, D. M., Santoro, A. E., Dupont, C. L., Rafter, P. A., Saunders, J. K., Kaul, D., Lamborg, C. H., Westley, M., Valois, F., and Waterbury, J. B.: Abundant nitrite-oxidizing metalloenzymes in the mesopelagic zone of the tropical Pacific Ocean, Nat. Geosci., 13, 355–362, https://doi.org/10.1038/s41561-020-0565-6, 2020. a, b
Santoro, A. E. and Casciotti, K. L.: Enrichment and characterization of ammonia-oxidizing archaea from the open ocean: phylogeny, physiology and stable isotope fractionation, ISME J., 5, 1796–808, https://doi.org/10.1038/ismej.2011.58, 2011. a, b
Santoro, A. E., Casciotti, K. L., and Francis, C. A.: Activity, abundance and diversity of nitrifying archaea and bacteria in the central California Current., Environ. Microbiol., 12, 1989–2006, https://doi.org/10.1111/j.1462-2920.2010.02205.x, 2010. a, b, c
Santoro, A. E., Saito, M. A., Goepfert, T. J., Lamborg, C. H., Dupont, C. L., and Ditullio, G. R.: Thaumarchaeal ecotype distributions across the equatorial Pacific Ocean and their potential roles in nitrification and sinking flux attenuation, Limnol. Oceanogr., 62, 1984–2003, https://doi.org/10.1002/lno.10547, 2017. a
Santoro, A. E., Richter, R. A., and Dupont, C. L.: Planktonic marine archaea, Annu. Rev. Mar. Sci., 11, 131–158, https://doi.org/10.1146/annurev-marine-121916-063141, 2019. a, b, c
Santoro, A. E., Buchwald, C., Knapp, A. N., Berelson, W. M., Capone, D. G., and Casciotti, K. L.: Nitrification and Nitrous Oxide Production in the Offshore Waters of the Eastern Tropical South Pacific, Global Biogeochem. Cy., 35, 1–21, https://doi.org/10.1029/2020GB006716, 2021. a, b, c
Schlitzer, R.: Applying the adjoint method for biogeochemical modeling: Expot of particulate matter in the World Ocean, Geophys. Monogr., 114, 107–124, https://doi.org/10.1029/GM114p0107, 2000. a, b
Séférian, R., Berthet, S., Yool, A., Palmiéri, J., Bopp, L., Tagliabue, A., Kwiatkowski, L., Aumont, O., Christian, J., Dunne, J., Gehlen, M., Ilyina, T., John, J. G., Li, H., Long, M. C., Luo, J. Y., Nakano, H., Romanou, A., Schwinger, J., Stock, C., Santana-Falcón, Y., Takano, Y., Tjiputra, J., Tsujino, H., Watanabe, M., Wu, T., Wu, F., and Yamamoto, A.: Tracking Improvement in Simulated Marine Biogeochemistry Between CMIP5 and CMIP6, Current Climate Change Reports, 6, 95–119, https://doi.org/10.1007/s40641-020-00160-0, 2020. a
Siegel, D., Buesseler, K., Doney, S., Sailley, S., Behrenfeld, M., and Boyd, P.: Global assessment of ocean carbon export by combining satellite observations and food-web models, Global Biogeochem. Cy., 28, 181–196, https://doi.org/10.1002/2013GB004743, 2014. a, b
Smith, J. M., Damashek, J., Chavez, F. P., and Francis, C. A.: Factors influencing nitrification rates and the abundance and transcriptional activity of ammonia-oxidizing microorganisms in the dark northeast Pacific Ocean, Limnol. Oceanogr., 61, 596–609, https://doi.org/10.1002/lno.10235, 2016. a
Spieck, E., Keuter, S., Wenzel, T., Bock, E., and Ludwig, W.: Characterization of a new marine nitrite oxidizing bacterium, Nitrospina watsonii sp. nov., a member of the newly proposed phylum “Nitrospinae”, Syst. Appl. Microbiol., 37, 170–176, https://doi.org/10.1016/j.syapm.2013.12.005, 2014. a
Stephens, B. M., Wankel, S. D., Beman, J. M., Rabines, A. J., Allen, A. E., and Aluwihare, L. I.: Euphotic zone nitrification in the California Current Ecosystem, Limnol. Oceanogr., 65, 790–806, https://doi.org/10.1002/lno.11348, 2020. a
Sun, X., Ji, Q., Jayakumar, A., and Ward, B. B.: Dependence of nitrite oxidation on nitrite and oxygen in low-oxygen seawater, Geophys. Res. Lett., 44, 7883–7891, https://doi.org/10.1002/2017GL074355, 2017. a
Swan, B. K., Martinez-Garcia, M., Preston, C. M., Sczyrba, A., Woyke, T., Lamy, D., Reinthaler, T., Poulton, N. J., Masland, E. D. P., Gomez, M. L., Sieracki, M. E., DeLong, E. F., Herndl, G. J., and Stepanauskas, R.: Potential for chemolithoautotrophy among ubiquitous bacteria lineages in the dark ocean, Science, 333, 1296–1300, https://doi.org/10.1126/science.1203690, 2011. a
Verdy, A., Follows, M., and Flierl, G.: Optimal phytoplankton cell size in an allometric model, Mar. Ecol. Prog. Ser., 379, 07909, https://doi.org/10.3354/meps07909, 2009. a
Volk, T. and Hoffert, M. I.: Ocean carbon pumps: analysis of relative strengths and efficiencies in ocean-driven atmospheric CO2 changes, in: The carbon cycle and atmospheric CO2: Natural variations Archean to present. Chapman conference papers, 1984, edited by: Sundquist, E. T. and Broecker, W. S., American Geophysical Union, 99–110, 1985. a
Ward, B. A., Dutkiewicz, S., Jahn, O., and Follows, M. J.: A size-structured food-web model for the global ocean, Limnol. Oceanogr., 57, 1877–1891, https://doi.org/10.4319/lo.2012.57.6.1877, 2012. a, b, c
Ward, B. B.: Nitrogen transformations in the Southern California Bight, Deep Sea Res., 34, 785–805, https://doi.org/10.1016/0198-0149(87)90037-9, 1987. a, b
Ward, B. B.: Temporal variability in nitrification rates and related biogeochemical factors in Monterey Bay, California, USA, Mar. Ecol. Prog. Ser., 292, 97–109, https://doi.org/10.3354/meps292097, 2005. a
Ward, B. B.: Nitrification in marine systems, in: Nitrogen in the Marine Environment, edited by: Capone, D. G., Bronk, D. A., Mulholland, M. R., and Carpenter, E. J., chap. 5, Academic Press, 199–262, 2008. a, b, c, d
Watson, S. W. and Waterbury, J. B.: Characteristics of two marine nitrite oxidizing bacteria, Nitrospina gracilis nov. gen. nov. sp. and Nitrococcus mobilis nov. gen. nov. sp, Arch. Mikrobiol., 77, 203–230, https://doi.org/10.1007/BF00408114, 1971. a
Wuchter, C., Abbas, B., Coolen, M. J. L., Herfort, L., Van, J., Timmers, P., Strous, M., Teira, E., Herndl, G. J., Middelburg, J. J., Schouten, S., and Damsté, J. S. S.: Archaeal nitrification in the ocean, P. Natl. Acad. Sci. USA, 103, 12317–12322, https://doi.org/10.1073/pnas.0600756103, 2006. a, b, c
Wunsch, C. and Heimbach, P.: Practical global oceanic state estimation, Physica D, 230, 197–208, https://doi.org/10.1016/j.physd.2006.09.040, 2007. a
Yool, A., Martin, A. P., Fernandez, C., and Clark, D.: The significance of nitrification for oceanic new production, Nature, 447, 999–1002, https://doi.org/10.1038/nature05885, 2007. a
Zakem, E. J.: eco-nitrify_Cfixation, https://doi.org/10.5281/zenodo.6384810, Zenodo [code], last access: 25 March 2022. a
Zakem, E. J., Al-Haj, A., Church, M. J., Van Dijken, G. L., Dutkiewicz, S., Foster, S. Q., Fulweiler, R. W., Mills, M. M., and Follows, M. J.: Ecological control of nitrite in the upper ocean, Nat. Commun., 9, 1206, https://doi.org/10.1038/s41467-018-03553-w, 2018. a, b, c, d, e, f, g, h, i, j, k, l, m, n, o, p, q, r, s, t, u, v, w, x
Zakem, E. J., Mahadevan, A., Lauderdale, J. M., and Follows, M. J.: Stable aerobic and anaerobic coexistence in anoxic marine zones, ISME J., 14, 288–301, https://doi.org/10.1038/s41396-019-0523-8, 2019. a
Zakem, E. J., Polz, M. F., and Follows, M. J.: Redox-informed models of global biogeochemical cycles, Nat. Commun., 11, 5680, https://doi.org/10.1038/s41467-020-19454-w, 2020. a
Zhang, Y., Qin, W., Hou, L., Zakem, E. J., Wan, X., Zhao, Z., Liu, L., Hunt, K. A., Jiao, N., Kao, S.-J., Tang, K., Xie, X., Shen, J., Li, Y., Chen, M., Dai, X., Liu, C., Deng, W., Dai, M., Ingalls, A. E., Stahl, D. A., and Herndl, G. J.: Nitrifier adaptation to low energy flux controls inventory of reduced nitrogen in the dark ocean, P. Natl. Acad. Sci. USA, 117, 4823–4830, 2020. a, b, c, d, e, f, g, h, i, j, k, l, m, n, o, p, q
- Abstract
- Introduction
- The model
- Results
- Discussion
- Conclusions and outlook
- Appendix A: Model equations
- Appendix B: Water column physical environment
- Appendix C: Simple expressions
- Code availability
- Author contributions
- Competing interests
- Disclaimer
- Acknowledgements
- Financial support
- Review statement
- References