the Creative Commons Attribution 4.0 License.
the Creative Commons Attribution 4.0 License.
 | 22 Dec 2022
Nitrate isotope investigations reveal future impacts of climate change on nitrogen inputs and cycling in Arctic fjords: Kongsfjorden and Rijpfjorden (Svalbard)
Marta Santos-Garcia
Raja S. Ganeshram
Robyn E. Tuerena
Margot C. F. Debyser
Katrine Husum
Philipp Assmy
Haakon Hop
Ongoing climate change in the Arctic has caused tidewater glaciers to retreat while increasing the discharge of freshwater and terrestrial material into fjords. This can affect both nutrient inputs and cycling within the fjord systems. In particular, tidewater glaciers and the presence of associated subglacial meltwater plumes can have a large impact on fjord circulation and biogeochemistry. In this study, we assess the influence of tidewater glaciers on nitrogen inputs and cycling in two fjords in Svalbard during the summer using stable isotopic analyses of dissolved nitrate (δ15N and δ18O) in combination with nutrient and hydrographic data. Kongsfjorden receives inputs from tidewater glaciers, whereas Rijpfjorden mainly receives surface inputs from land-terminating glaciers. Results showed that both fjords are enriched in nutrients from terrestrial inputs. Nutrient ratios indicate excess Si and P relative to N. In both fjords, terrestrial nitrate from snowpack and glacier melting are identified as the dominant sources based on high δ18O-NO and low δ15N-NO of dissolved nitrate. In Kongsfjorden, mixed-layer nitrate is completely consumed within the fjord system, which we attribute to vigorous circulation at the glacial front influenced by the subglacial plume and longer residence time in the fjord. This is in contrast to Rijpfjorden where nutrients are only partially consumed perhaps due to surface river discharge and light limitation. In Kongsfjorden, we estimate terrestrial and marine N contributions to the nitrate pool from nitrogen isotopic values (δ15N-NO), and this suggests that nearly half the nitrate in the subglacial plume (50 ± 3 %) and the water column (44 ± 3 %) originates from terrestrial sources. We show that terrestrial N contributes significantly to the regenerated N pool (63 %–88 %) within this fjord suggesting its importance in sustaining productivity here. Given this importance of terrestrial nutrient sources within the fjords, increase in these inputs due to climate change can enhance the fjord nutrient inventory, productivity and nutrient export offshore. Specifically, increasing Atlantification and warmer Atlantic Water will encourage tidewater glacier retreat and in turn increase surface discharge. In fjords akin to Rijpfjorden this is expected to foster more light limitation and less dynamic circulation, ultimately aiding the export of nutrients offshore contributing to coastal productivity. Climate change scenarios postulated for fjords such as Kongsfjorden include more terrestrial N-fuelled productivity and N cycling within the fjord, less vigorous circulation due to the retreat of tidewater glaciers, and the expansion of oxygen-depleted deep waters isolated by the sill.
- Article
(6624 KB) - Full-text XML
- BibTeX
- EndNote


In Arctic marine ecosystems, temperature anomalies of +2 ∘C have led to increased discharge of freshwater (Beszczynska-Möller et al., 2012) and fluxes of carbon and nutrients across the land–ocean interface with profound implications for coastal ecosystems and biogeochemical cycling (McGovern et al., 2020). Nitrate (NO) is the predominant form of fixed nitrogen (N) used by organisms in the ocean and is normally deemed to be the limiting nutrient in the Arctic Ocean (Yamamoto-Kawai et al., 2006). Phosphate and silica are also essential for algal growth in marine environments (Egge, 1998). In fjordic and coastal settings in the Arctic, terrestrial inputs of N could be important (Kumar et al., 2018), and these inputs are changing with polar warming through a myriad of factors such as increased river discharge, permafrost thaw, soil N cycling and vegetation changes (Holmes et al., 2012).
The assessment of the impact of N fluxes, cycling and fate in a fjordic setting due to climate change is complicated by seasonally varying circulation patterns. Fjordic circulation responds to winter cooling and sea-ice formation, as well as summer freshwater discharge. In turn, these processes also influence the nitrogen fluxes, cycling and ultimate fate. Circulation in fjords can be restricted owing to its narrow shape and the presence of a sill (Svendsen et al., 2002; Dürr et al., 2011). The ineffective tidal mixing, alongside freshwater influxes, contributes to the development of a very sharp halocline and stratified water column during the summer months (Geyer and Ralston, 2011; Monteban et al., 2020). Deep convective mixing occurs in the autumn due to cooling of surface water (thermal convection) and in the winter due to sea-ice formation and brine release (haline convection) (Cottier et al., 2007). Remnants of winter cooled waters can persist into the summer and are characterised by low temperatures and a wide salinity range reflecting their variable origin (De Rovere et al., 2022). In spring, temperature rises, and ice break-up begins, leading to a reduction in salinity and the re-establishment of the strong summer pycnocline (Cottier et al., 2010). This pattern of fjordic circulation is subject to climate change on a pan-Arctic scale through increased freshwater inputs, glacial retreat and by warm marine waters entering the fjords.
In Svalbard, freshwater discharge is expected to increase by 200 % before 2100 (RCP4.5 scenario; Adakudlu et al., 2019). Increased freshwater discharge, glacial retreat, snow and permafrost melt, and reduced sea-ice cover are ongoing climate change trends in many parts of the Arctic (Arctic Climate Impact Assessment (ACIA), 2005). Increased freshwater inputs are expected to alter convective mixing in fjords possibly isolating deep waters below the sill. Enhanced freshwater inputs and stratification can impact both terrestrial N supply and cycling processes. On a pan-Arctic scale, increased river discharge is accompanied by enhanced N inputs (Holmes et al., 2012; McGovern et al., 2020). Therefore, it is hypothesised that (i) increasing freshwater inputs will alter N supply and cycling leading to changes in the nutrient status and availability within the fjord and (ii) this will alter the exchange of nutrients between the fjord and offshore.
Arctic fjords are experiencing widespread glacial retreat (Kohler et al., 2007; Østby et al., 2017). The loss of tidewater glaciers has a significant impact on fjord circulation as they contribute to additional freshwater flux from glacial melt (Cowan, 1992; Ingvaldsen et al., 2001). At marine terminating glacier fronts, subglacial discharge enters the fjord at depth – specifically at the glacial grounding line during the summer (Cowton et al., 2015; Carroll et al., 2015, 2016). As a result of its lower density, the submarine glacial melt forms an upwelling plume enhancing vertical mixing by the entrainment of fjord waters (Everett et al., 2018; Halbach et al., 2019). The plumes are strongest at the glacier fronts and decrease with increasing distance from land due to dilution and mixing (Darlington, 2015; Hopwood et al., 2020). Moreover, upwelling plumes can entrain and elevate remnant winter cooled waters from the bottom of fjords, leading to the presence of a distinct, cold and relatively saline water mass throughout the water column close to the tidewater glacier front (Torsvik et al., 2019). Recent studies have shown that meltwater plumes not only play a prominent role in vertical mixing at glacier fronts but also enhance subsurface lateral mixing (Torsvik et al., 2019). Importantly, plumes also promote the transfer of heat from the ocean to the glacier front in large Greenland fjords, thereby drawing in warmer waters from offshore (Straneo et al., 2010; Cowton et al., 2015). However, in the smaller fjord systems in Svalbard, this invigorated lateral circulation is mainly confined within the fjords (Torsvik et al., 2019).
Ongoing “Atlantification” has caused the increased prevalence of warm Atlantic waters displacing cold Arctic coastal waters off Svalbard (Polyakov et al., 2017). This phenomenon has been linked to increases in sea water temperatures, shortened sea-ice-covered period, altered freshwater inputs and enhanced light penetration (David and Krishnan, 2017; Hop et al., 2019; Hop and Wiencke, 2019). Although it is evident that Svalbard fjords are subject to both marine and terrestrial climate change, the net impact of these changes on N sources and cycling processes is currently unclear. The purpose of this study is to close this gap by conducting a detailed study of N sources and cycling using novel isotopic tools in two Svalbard fjords, allowing (i) improved predictions of changes in the inventory of nutrients within sub-Arctic and Arctic fjords and (ii) an assessment of the future changes in exchange of nutrients between the fjords and offshore areas. This is the first study to present a quantitative account of terrestrial contribution to the nitrate pool and primary productivity in Arctic fjords.
2.1 Sampling sites
The sub-Arctic fjord of Kongsfjorden (79.0∘ N, 11.7∘ E) and Arctic Rijpfjorden (80.0∘ N, 22.3∘ E), located on the islands of Spitsbergen and Nordaustlandet, Svalbard, respectively (Fig. 1), are ideal locations to document changes in N dynamics affected by freshwater influxes and the retreat of local glaciers (Fig. A1). Important hydrographic features around Svalbard include the Fram Strait and the Barents Sea (Fig. 1a). The Fram Strait is one of the main gateways into and out of the Arctic Ocean (Ilicak et al., 2016). Kongsfjorden samples were collected during the Norwegian Polar Institute Monitoring Cruises on RV Lance between 29 July and 2 August 2017 (NP2017) and from 13 and 15 July 2018 (NP2018). These samples were from four areas, namely near glacier fronts (Kb5–7, only sampled during NP2018 cruise), fjord (Kb0–3), continental shelf (V12) and continental slope (V10 and V6) (Fig. 1b).
Rijpfjorden was sampled between 3 and 5 August 2017 (NP2017) (Fig. 1c–d), where sample locations are divided into inner fjord (R1, 2), outer fjord (R3), continental shelf (R4–5) and continental slope (R6–7B) stations. The inner fjord and the outer fjord basins are separated by a shallow sill at around 40 m depth.
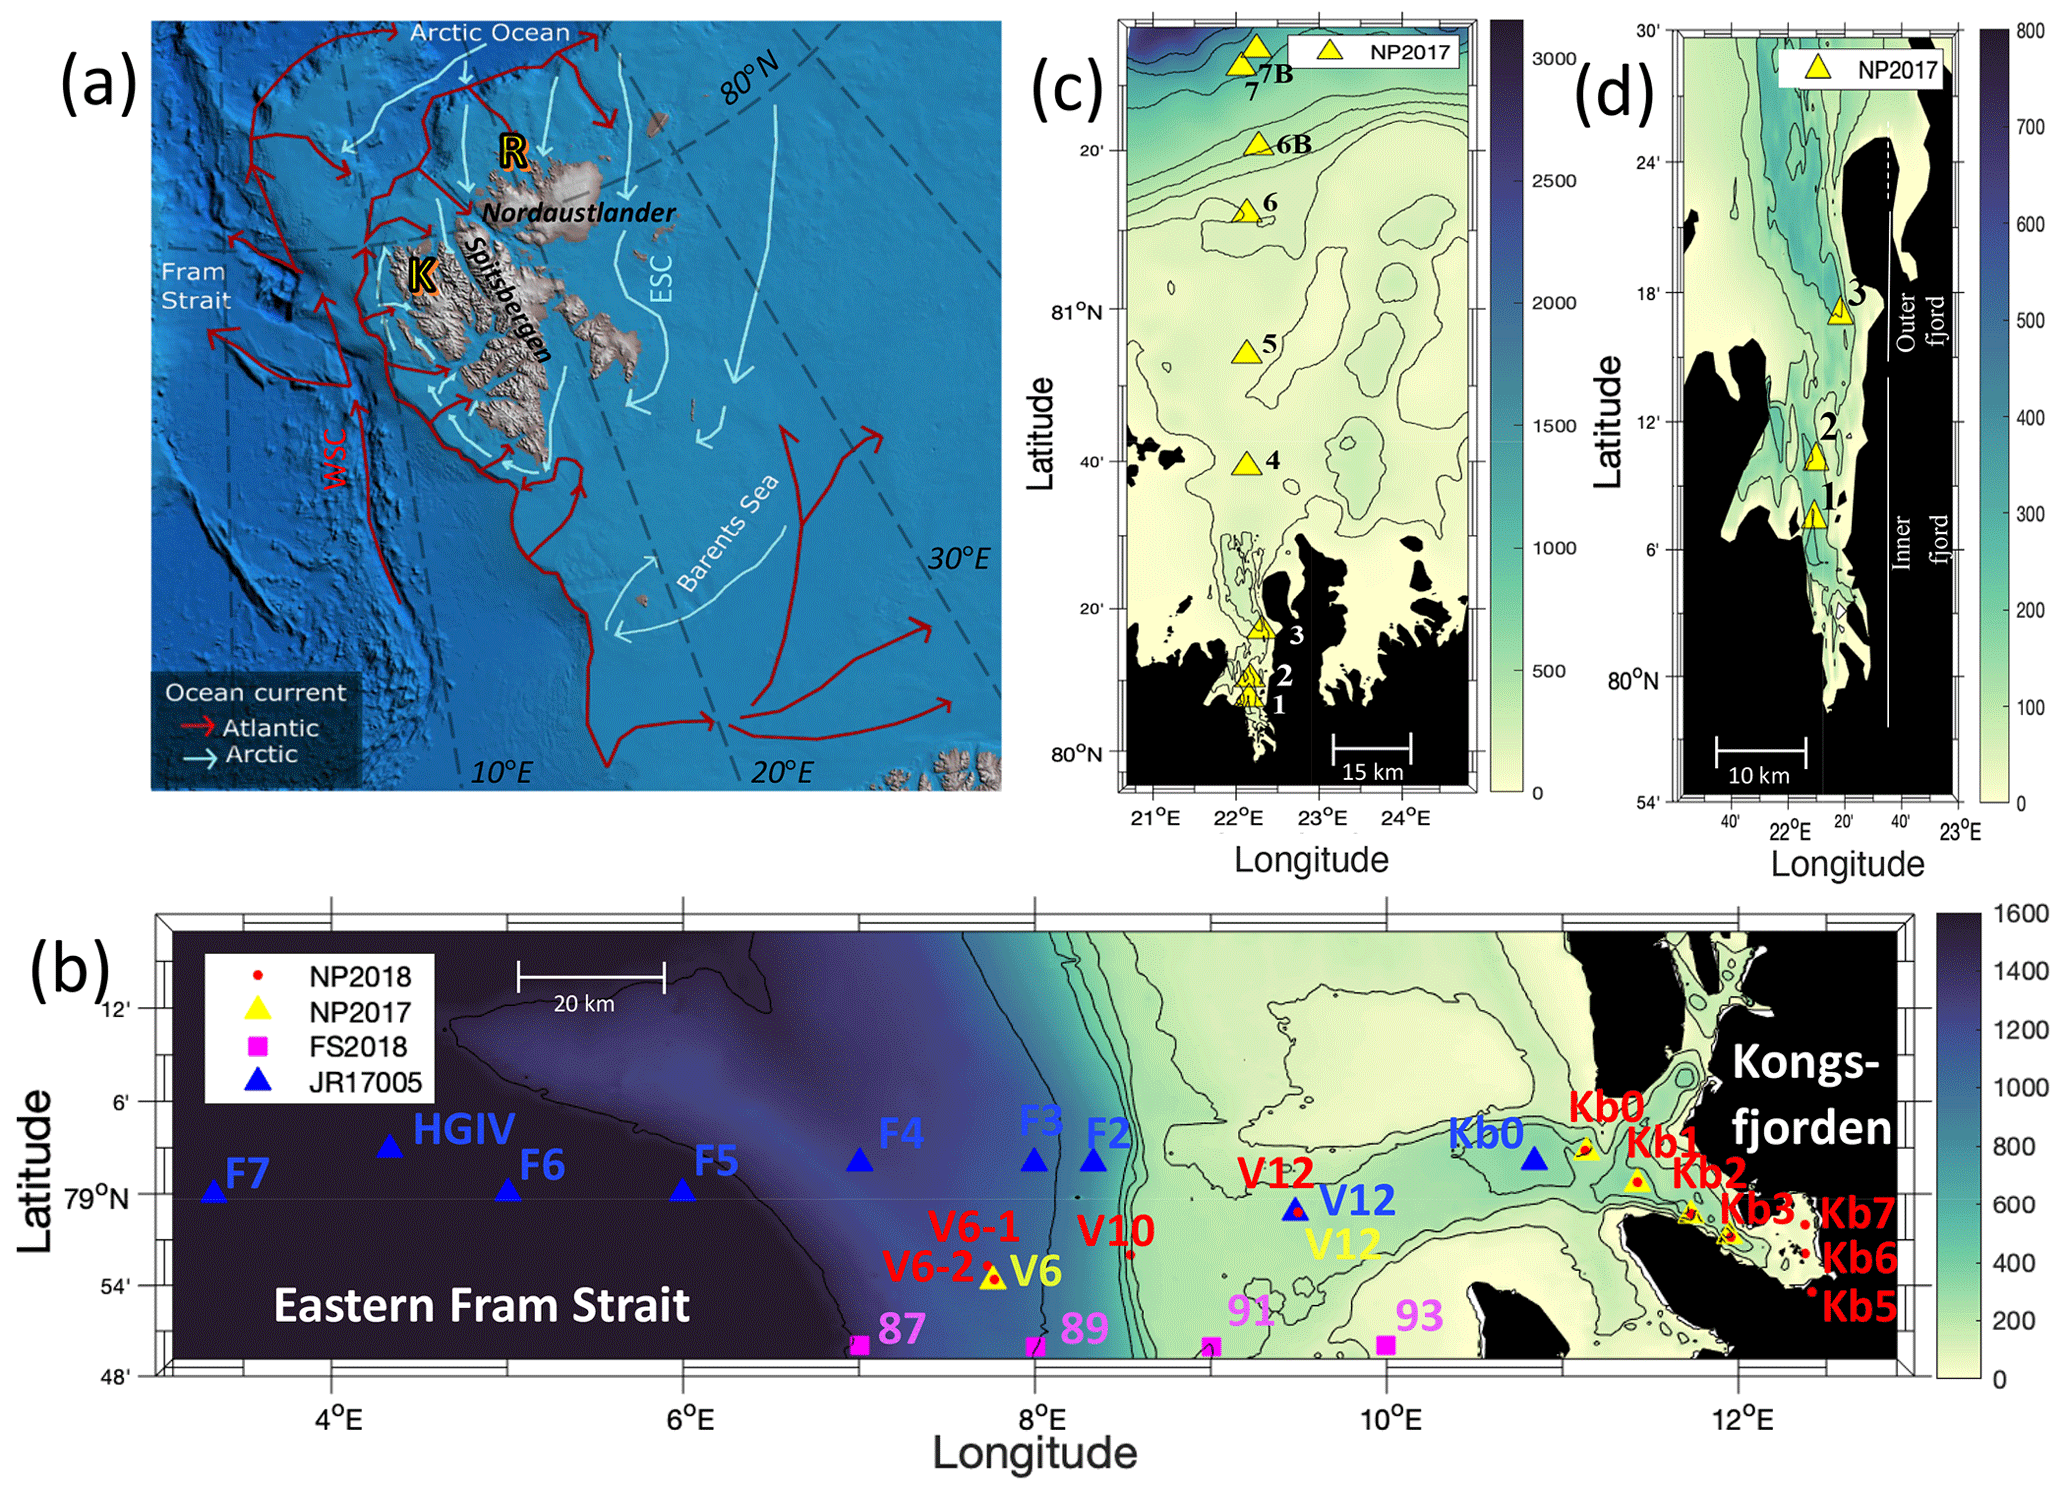
Figure 1Maps of the Norwegian archipelago of Svalbard, including close-ups of the two study fjords, Kongsfjorden and Rijpfjorden, with an indication of sampling sites. In (a), Atlantic and Arctic water currents are depicted in red and blue, respectively. K denotes Kongsfjorden, R Rijpfjorden, WSC West Spitsbergen Current and ESC East Spitsbergen Current. This subplot is based on Hop et al. (2019), Eriksen et al. (2018), and Leifer et al. (2018) and was designed using Global Mapper software (v.20.0, 2018) and bathymetry data from IBCAO v.3 by Jakobsson et al. (2012). In (b), the bathymetric map of Kongsfjorden, Svalbard, and the eastern side of Fram Strait illustrates sampling sites of the Norwegian Polar Institute Monitoring Cruises (2017, yellow triangles; 2018, red dots) for δ15N-NO and δ18O-NO determination. Samples were taken in the fjord (Kb0–3, 5–7), as well as on the shelf (V12) and continental slope (V10 and V6). Data from sampling sites of FS2018 (pink squares) and JR17005 (blue triangles) cruises were also used for better coverage of offshore conditions. Shipboard measurements from cruise JR17005 were taken from the RSS James Clark Ross as part of the UK Changing Arctic Oceans programme in May–June 2018. Cruise FS2018 took place on the RV Kronprins Haakon as part of the Fram Strait Arctic Outflow Observatory in August–September 2018. In (c) and (d), the bathymetric map of Rijpfjorden, Svalbard, illustrates sampling sites of the Norwegian Polar Institute monitoring cruises (NP2017, yellow triangles) for δ15N-NO and δ18O-NO determination. In (c) all sample locations are shown, namely in the inner fjord (R1–2), outer fjord (R3), and on the shelf (R4–R5) and continental slope (R6–R7B). In (d) a zoom-in map of the inner and outer fjord region is shown. Colour coding corresponds to depth in metres.
2.2 Nutrient and isotopic analysis
Water samples were collected from Niskin bottles mounted on a rosette equipped with a CTD system recording conductivity, temperature and pressure. In addition, other parameters measured were salinity (PSU), chlorophyll a fluorescence (mg m−3) and oxygen (mL L−1). Dissolved inorganic nutrient concentrations (nitrate, nitrite, silicate and phosphate) from both cruises were analysed at the Institute of Marine Research. The samples were collected in 20 mL scintillation vials, fixed with 0.2 mL chloroform and stored refrigerated until sample analysis. Nitrite, nitrate, phosphate and silicate were measured spectrophotometrically at 540, 540, 810 and 810 nm, respectively, on a modified Skalar autoanalyser. The measurement uncertainty for nitrite was 0.06 mmol L−1 and 10 % or less for nitrate, phosphate and silicate. Water samples for isotopic analysis were prefiltered and frozen immediately after collection.
The denitrifier method for dual nitrogen and oxygen isotopes was used for the isotopic analysis of dissolved nitrate (Sigman et al., 2001; McIlvin and Casciotti, 2011). The denitrifier method takes advantage of the denitrifying bacteria Pseudomonas aureofaciens with limited N-reductase activity which transform NO to N2O (Sigman et al., 2001; Casciotti et al., 2002). Nitrous oxide was extracted from 20mL vial headspace by a Combi PAL auto-sampler and transported by a continuous flow of helium gas through a GasBench II coupled with a Delta V Advantage.
Two standards, USGS 34 and IAEA N3, were used as reference for isotope ratio mass spectrometry (IRMS) analysis. δ15NAIR values of these standards were 1.8 ± 0.2 (USGS 34) and 4.7 ± 0.2 (IAEA N3), and δ18OVSMOW values were −27.9 ± 0.6 (USGS 34) and 25.6 ± 0.6 (IAEA N3). Each standard was individually prepared at 2, 5, 15 and 30 µmol concentrations. To overcome the discrepancies in δ18O, solutions were prepared in milli-Q H2O and low-nutrient seawater, respectively (McIlvin and Casciotti, 2011). Also, internal standards, from North Atlantic Deep Water, were used in order to represent the average Atlantic Water δ15N signature. This standard was run with each batch to check for inter-run comparability. IRMS analysis was carried out at the University of Edinburgh using ISODAT 2.5 software. Isotopic measurements were determined relative to a reference peak.
Measurements of δ15N-NO and δ18O-NO were corrected to AIR and VSMOW, respectively, with the use of the correction scheme in Weigand et al. (2016) and following Tuerena et al. (2021a, b) and the reference standards.
Averaged data reproducibility (1σ) across all runs was 0.3 and 0.5 for δ15N and δ18O, respectively, determined using internal standards with isotopic values of 4.8 ± 0.2 ‰ (δ15NAIR) and 1.8 ± 0.6 ‰ (δ18OVSMOW). These deviations can be approximated to normal variability (0.2 ‰ and 0.6 ‰ for δ15N and δ18O, respectively).
Nutrient and isotopic data from the JR17005 and FS2018 cruises were previously reported in Tuerena et al. (2021a) and Debyser et al. (2022), respectively. All nutrient and isotopic data are combined with hydrographical data obtained from a conductivity–temperature–depth rosette and processed using Matlab_R2020a software to document N dynamics.
2.3 Data analysis, processing and visualisation
Cross-section figures of Kongsfjorden were designed using a global Topo15.1 bathymetry dataset with a spatial resolution of 4 km (Smith and Sandwell, 1997). Bathymetric cross-section figures of Rijpfjorden are based on data from the Norwegian Mapping Authority Hydrographic Service and IBCAO database version 4.1.
The degree of stratification (Δρ, kg m−3) was calculated as the difference in potential density between 10 and 40 m depth. In addition, apparent oxygen utilisation (AOU, µmol kg−1) was computed using the equation AOU = [O2]saturated − [O2]seawater. Meanwhile, the oxygen saturation (%) was given by [O2]seawater [O2]saturated×100.
The semi-conservative tracers N* and Si* were calculated from inorganic nutrient concentrations where N* = NOx − 16 × PO4+2.9 (Gruber and Sarmiento, 1997) and Si* = SiOH4 − NOx (Sarmiento et al., 2004) are indicative of deviations from Redfield stoichiometry and 1:1 proportions, respectively. Negative N* values reflect N deficit and excess phosphate, while positive N* values reflect excess nitrate relative to phosphate.
Regression analyses were computed to ascertain the significance of observed linear trends (p value ≤ 0.05). All statistical analyses are included in Appendix B (Table B1).
3.1 Environmental setting and water mass characterisation
Based on the temperature (θ in ∘ C) and salinity (S in PSU), three different water masses were identified in Kongsfjorden (13–15 July 2018), Rijpfjorden (3–5 August 2017), and their adjoining continental shelves and slopes following Pérez-Hernández et al. (2017). On the western side of Svalbard, warm and salty Atlantic Water (AW; θ>1, S>34.9) is carried northward along the shelf edge by the West Spitsbergen Current (WSC; Fig. 1) and enters the Arctic Ocean, supplying the continental slope at Kongsfjorden (Figs. 2, A2) and other fjords along the way (Fig. 3; Cottier et al., 2005; Cokelet et al., 2008; Renner et al., 2018; Skogseth et al., 2020). These warm waters also fill intermediate depths across the whole Arctic Basin (known as Arctic Intermediate Water, AIW; , S>34.9; Figs. 2, 3, A2) and represent an important supply pathway for nutrients (Beszczynska-Möller et al., 2012; Randelhoff et al., 2018). Occasionally, AW protrudes onto the shelf area, and thus there is an interplay between the intrusion of AW at depth and meltwater at the surface (Onarheim et al., 2014). This was the case at Kongsfjorden, where Atlantic Water dominance extended onto the continental shelf (via a trough called “Kongsfjordrenna”), as shown by salinity and temperature profiles above 40 m depth, with salinity 34.9 PSU and temperature 5.6∘ C (Fig. A3). This intrusion was also associated with a chlorophyll a maximum of 4–6 mg m−3 (Fig. A3). This is in agreement with recent studies reporting AW intrusions into Kongsfjorden (6.5 mg m−3 chlorophyll maximum; Payne and Roesler, 2019).
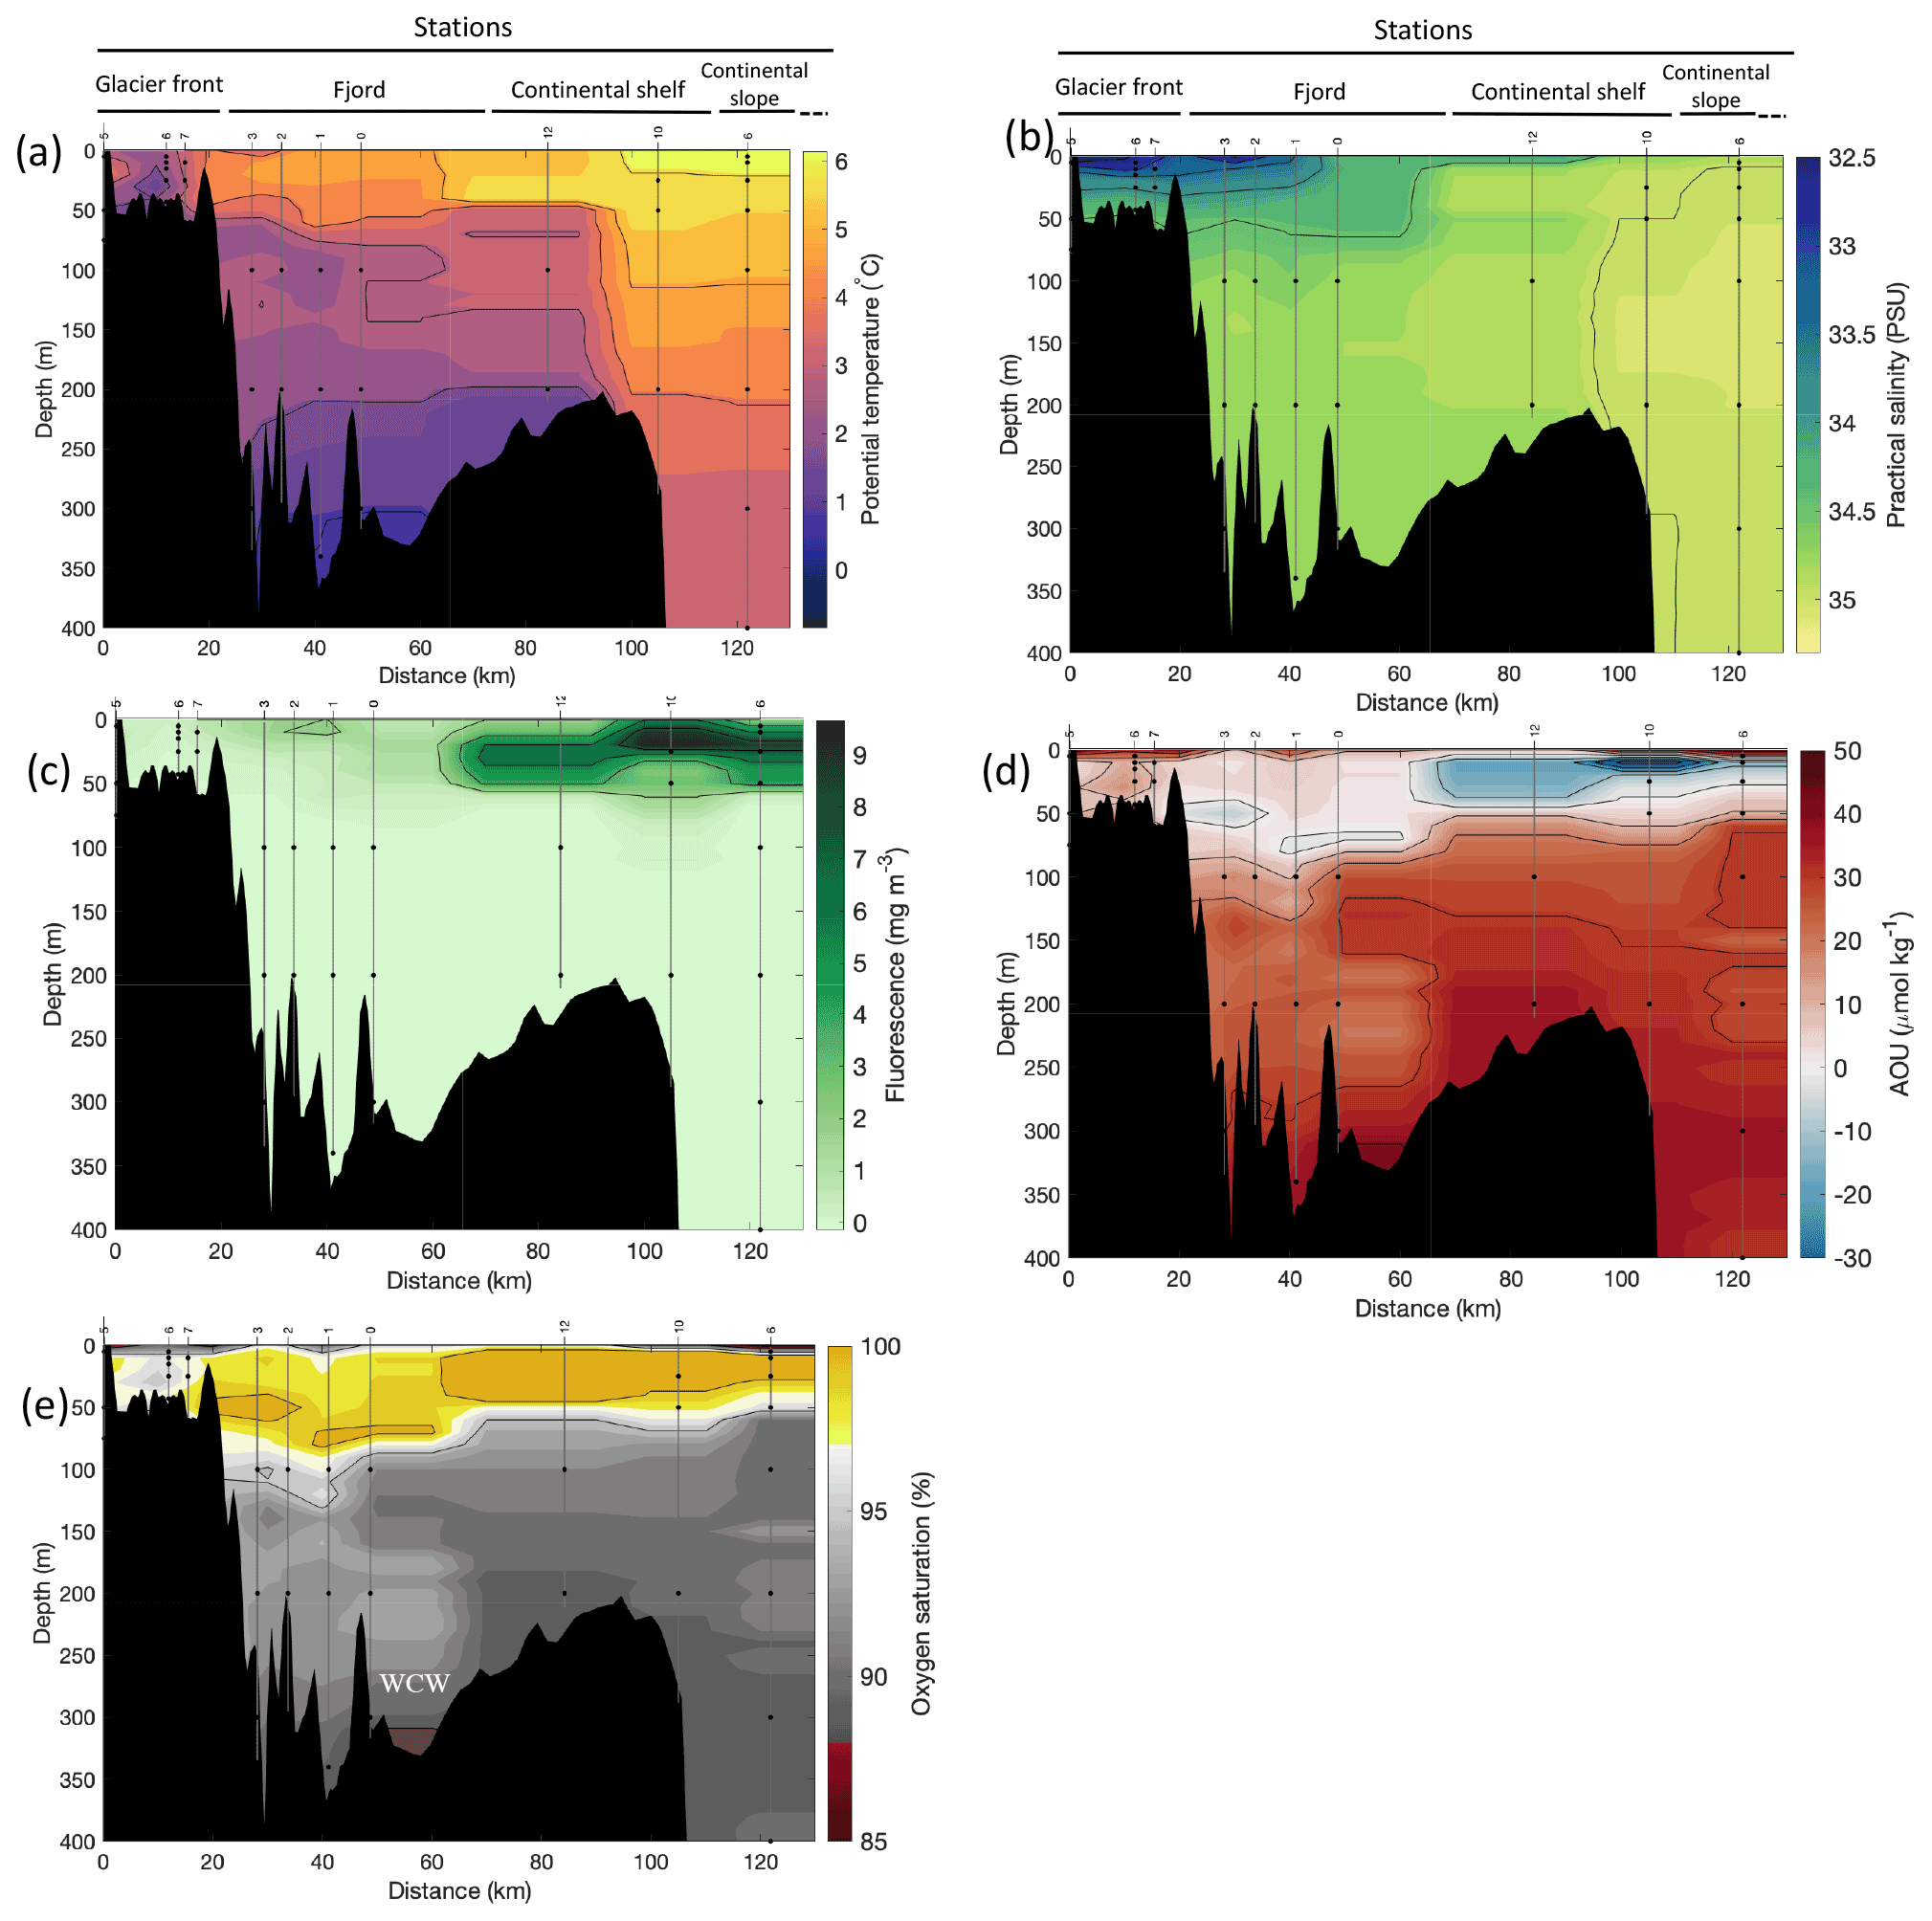
Figure 2Cross-sections across Kongsfjorden of (a) potential temperature (∘ C), (b) salinity (PSU), (c) fluorescence (mg m−3), (d) apparent oxygen utilisation (AOU, µmol kg−1) and (e) oxygen saturation (%). Data from CTD casts from NP2018 cruise. Vertical grey lines indicate the individual CTD casts where water samples were collected for isotopic analysis, with sampling depths indicated by the black dots and station number indicated above each line. Distance is shown as the cumulative distance between successive stations. WCWs: winter cooled waters.
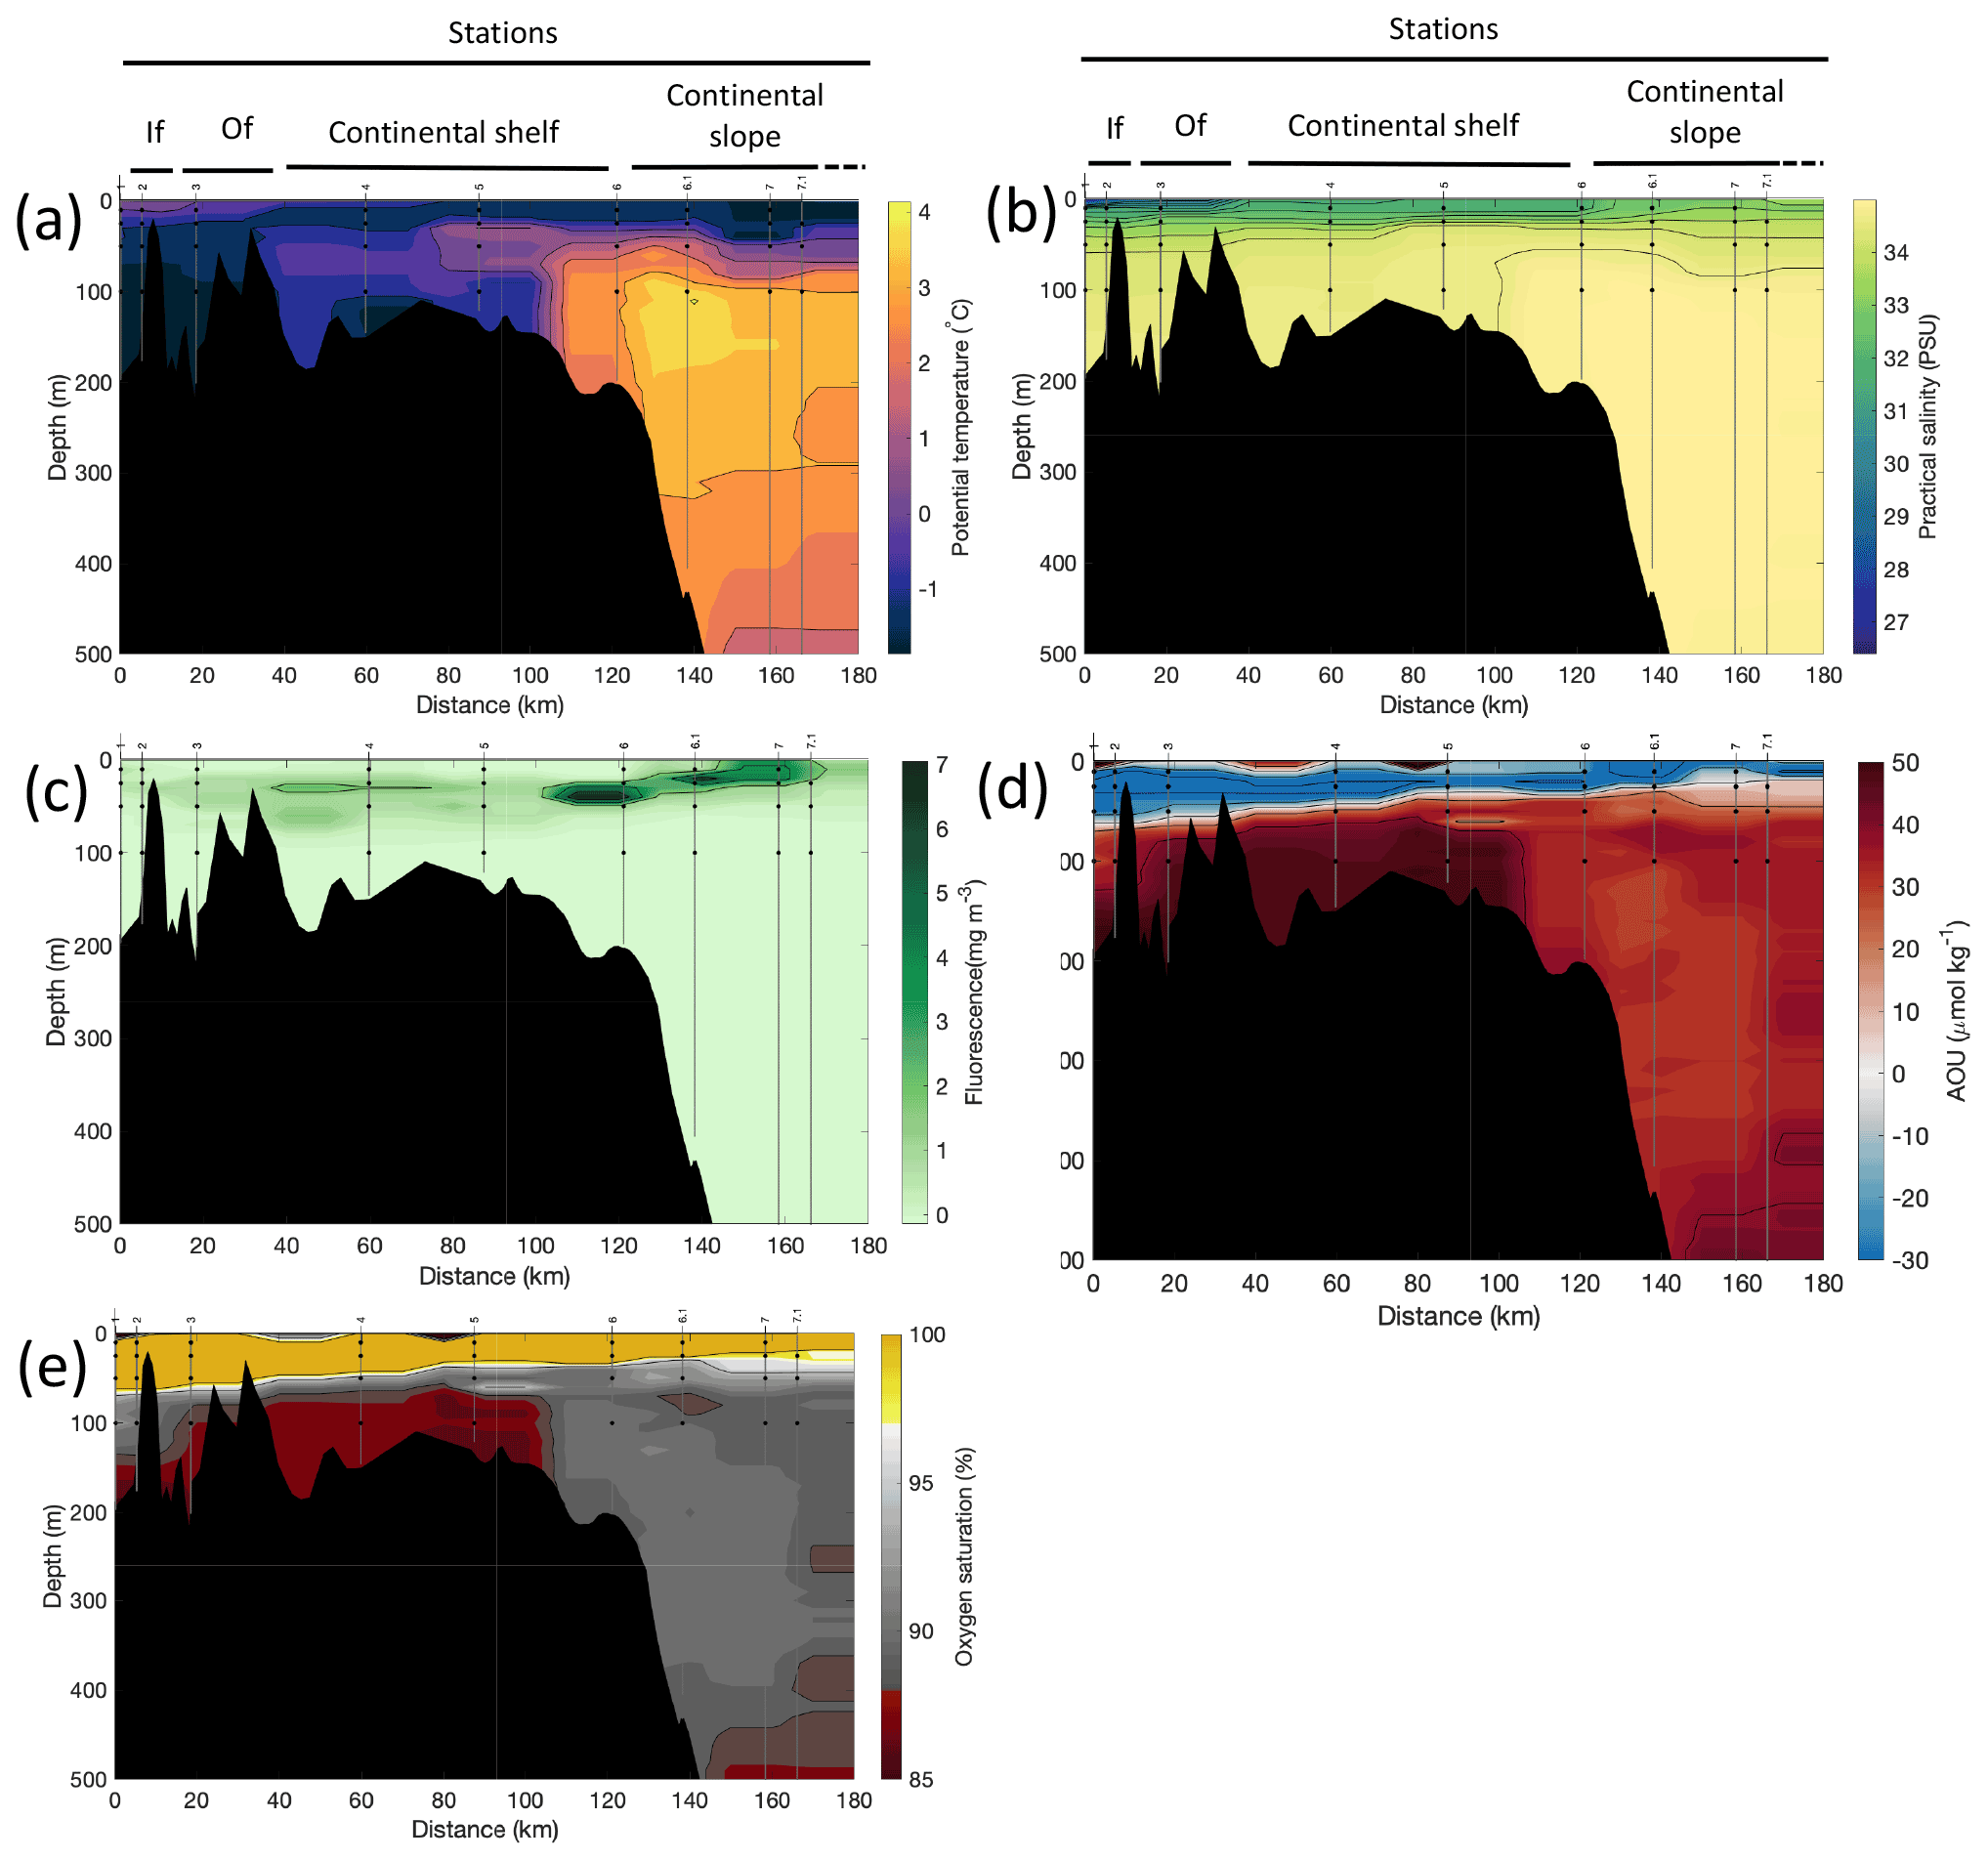
Figure 3Cross-sections across Rijpfjorden of (a) potential temperature (∘ C), (b) salinity (PSU), (c) fluorescence (mg m−3), (d) apparent oxygen utilisation (AOU, µmol kg−1) and (e) oxygen saturation (%). Data from CTD casts from NP2017 cruise. Vertical grey lines indicate the individual CTD casts where water samples were collected for isotopic analysis, with sampling depths indicated by the black dots and station number indicated above each line. Distance is shown as the cumulative distance between successive stations. “If”, inner fjord; “Of”, outer fjord.
Similarly, in the northern coast of Svalbard, the Atlantic influence remains substantial as AW travels eastward towards the Nansen Basin (Cokelet et al., 2008; Renner et al., 2018). However, fjords on the northern coast – including Rijpfjorden – have a wider continental shelf and are under a weaker AW influence compared to those on the western coast with a narrower continental shelf (Hop et al., 2019). For instance, the mouth of Rijpfjorden is 60 km away from the shelf, whereas that of Kongsfjorden is 45 km from the shelf (Howe et al., 2010). Rijpfjorden does experience occasional inflow of Atlantic-origin water during summer to late autumn (Wallace et al., 2010; Hop et al., 2019). Although warmer water extends between 25 and 100 m depth at the continental shelf off Rijpfjorden (Fig. 3a), the temperature was not warm enough to be characteristic of AW (θ<1; Fig. 3a), nor were the fluorescence peak (Fig. 3c) values as high as those seen in the AW intrusion in Kongsfjorden (Payne and Roesler, 2019). Instead, the shelf at Rijpfjorden was dominated by Polar Surface Water (PSW) (Fig. A2), which is a mixture of AW, river runoff, precipitation and ice melt (Rudels, 1989).
Within the fjords, two variants of Polar Surface Water (PSW) were recognised, namely inshore PSW (iPSW) and warm PSW (PSWw) (Fig. A2). In detail, iPSW is a mixture of ice melt and AW (θ≥2, S≤34.9), while PSWw (, S≤34.9) is a mixture between PSW and warm AW (Rudels et al., 2005; Cokelet et al., 2008). Kongsfjorden was dominated by iPSW, whereas Rijpfjorden was governed by PSW, and in both fjords the presence of PSWw was limited.
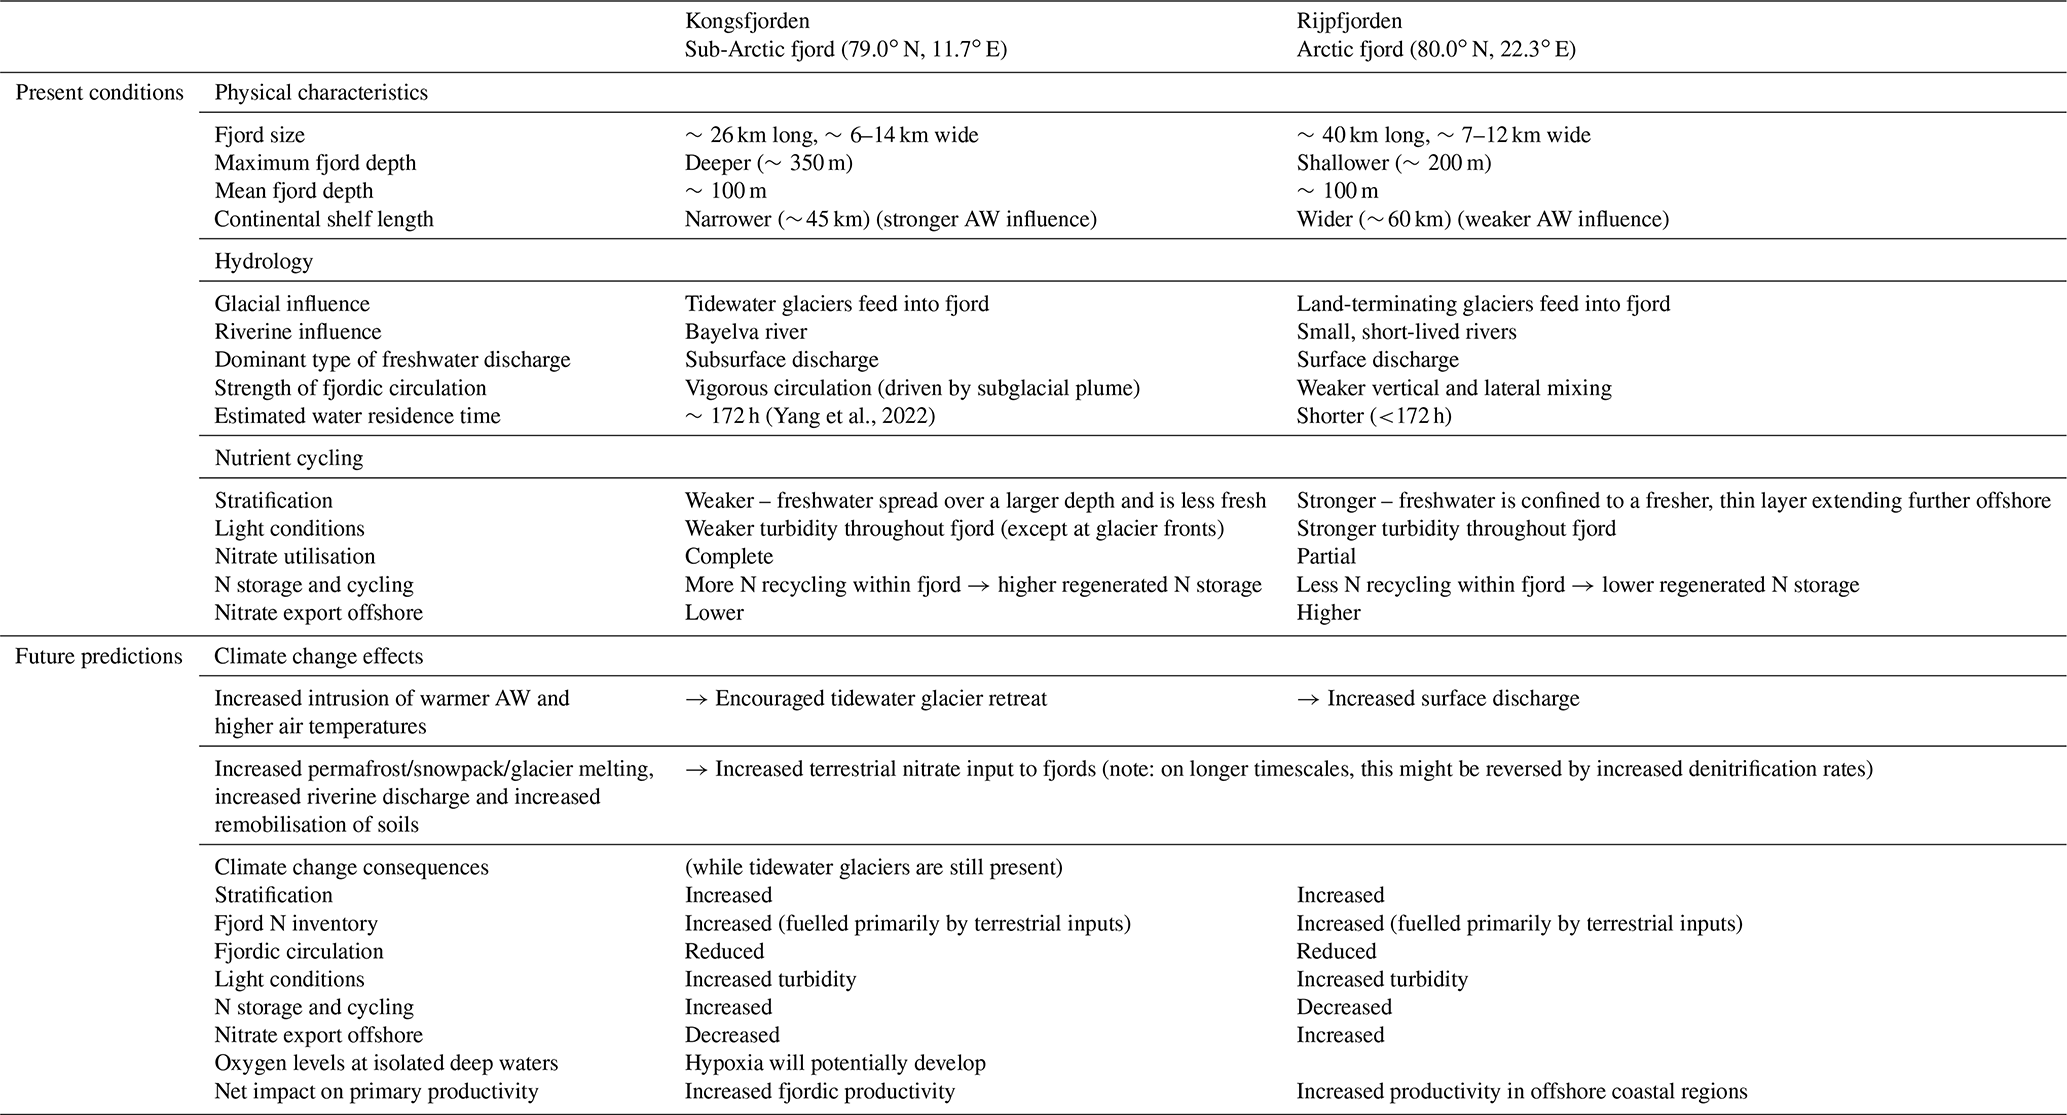
Kongsfjorden and Rijpfjorden not only experience different degrees of AW influence and variations in PSW but also have other contrasting physical characteristics which are relevant to N cycling. These characteristics include fjord size and geometry, as well as the presence of tidewater glaciers, all of which in turn affect circulation and residence times. Kongsfjorden is significantly deeper (350 m) than Rijpfjorden (ca. 200 m), although their mean depths are similar (100 m) and so are their sizes (Kongsfjorden is 26 km long, 6–14 km wide; Rijpfjorden is 40 km long, 7–12 km wide). The average water residence time for Kongsfjorden is 172 h, and for Rijpfjorden this is expected to be much less (Torsvik et al., 2019; Yang et al., 2022). While Kongsfjorden experiences contributions of subglacial freshwater from five tidewater glaciers including Kongsbreen and Kronebreen (Fig. A1; How et al., 2017) and direct runoff from the Bayelva river, Rijpfjorden only receives surface freshwater input from relatively small glacially fed rivers with short-lived summer flow as inferred from satellite imagery (Wang et al., 2013). One important element of Kongsfjorden circulation is the subsurface discharge of meltwater from subglacial plumes (Darlington, 2015). The meltwater plumes play a prominent role in vertical and lateral exchanges and consequently act as a nutrient pump – as documented by numerous studies (Darlington, 2015; How et al., 2017; Schild et al., 2017; Halbach et al., 2019; Torsvik et al., 2019). Notably, the magnitude of the effect of subglacial discharge and the glacier front plume in Kongsfjorden varies spatially along the glacial front owing to topographical differences along the Kongsbreen and Kronebreen glacier fronts. In particular, the Kongsbreen front is deeper and narrower than that at Kronebreen, and this constrains the lateral movement of water; thus this plume has a clearer vertical structure (Torsvik et al., 2019). In contrast, the Kronebreen front shows a less pronounced effect of the subglacial discharge and glacier front plume as lateral movement of water is unconstrained allowing mixing with adjacent fjord waters. Nonetheless, a topographic barrier below 35 m restricts lateral mixing below this depth along the Kronebreen transect (Torsvik et al., 2019). In Rijpfjorden, marine terminating glaciers are absent, and freshwater inputs from land occur at the surface. This surface input, the smaller size and limited marine influence due to the broader shelf lead to contrasting conditions between Rijpfjorden and Kongsfjorden.
The degree of stratification (Δρ) in the upper 40 m of the water column increases landwards in both fjords (Table A1; Figs. 2b, 3b) reflecting freshwater discharge. Notably, stratification was stronger in Rijpfjorden, particularly in the most offshore stations, compared to Kongsfjorden (Table A1). While in Kongsfjorden the freshwater layer was thicker in the proximity of the tidewater glacier fronts (Fig. 2b), in Rijpfjorden, freshwater was confined to a thin surface layer that extends further offshore (Fig. 3b; Table A1). It is also worth noting that in Kongsfjorden, AW seems to be drawn in at the continental shelf over the same depth range as the freshwater layer. This feature is attributed to glacier-induced lateral circulation set up by the subglacial plume in fjords with tidewater glaciers (Svendsen et al., 2002; Cottier et al., 2005; Straneo et al., 2010; Cowton et al., 2015; Tverberg et al., 2019).
Additionally, the cross-sections identified a fourth water mass, winter cooled water (WCW; Cottier et al., 2005), in the deeper part of the fjord basins (ca. >300 m at Kongsfjorden and ca. >100 m at Rijpfjorden) characterised by low potential temperatures (θ<1.1∘ C at Kongsfjorden; Fig. 2a; θ<−1∘ C at Rijpfjorden; Fig. 3a), high apparent oxygen utilisation (AOU) of >40 µmol kg−1 (Figs. 2d, 3d) and oxygen saturation of <90 % (Figs. 2e, 3e). Isolation and retention of such winter waters is attributed to reduced vertical exchange in the deep fjord basins mainly due to restricted circulation owing to the presence of a sill at 200 m outside Kongsfjorden (in “Kongsfjordrenna”) (Fig. 2) and at 25 m depth in Rijpfjorden (Cottier et al., 2010; Fig. 3). The high AOU characteristics of these water masses is indicative of their long residence time and isolation from the atmosphere (Svendsen et al., 2002), and as such these water masses are sensitive to hypoxia impacted by small changes in productivity, nutrient cycling and isolation time.
3.2 Nutrient concentrations and isotopic ratios
Depth profiles of temperature, salinity, chlorophyll a fluorescence, nutrient concentrations, N*, Si* and isotopic ratios in Kongsfjorden and Rijpfjorden are illustrated in Figs. 4a–j and 5a–j, respectively. In addition, cross-sections of nutrients, the semi-conservative tracers N* and Si*, and isotopes (δ15N-NO and δ18O-NO) are also shown in Fig. 6a–g and Fig. 7a–g for Kongsfjorden and Rijpfjorden, respectively. In Kongsfjorden, temperature throughout the water column at the glacier front (Kb5–7, at Kronebreen and Kongsbreen transects) was strikingly lower than in the fjord and further offshore (Fig. 4a), indicating a distinct water mass formed at the front that cannot be traced offshore. It is suggested that these cold and saline waters are remnants of winter cooled waters resulting from heat loss to the atmosphere and contact with the glacier front (Torsvik et al., 2019; De Rovere et al., 2022). Only at Kronebreen front (Fig. A1, station Kb5), temperatures increased to values similar to fjord temperatures at 20–35 m depth (Fig. 4a). Here lateral movement is less constrained than in Kongsbreen front, and, thus, more mixing is possible (Torsvik et al., 2019). In contrast, in Rijpfjorden, temperature profiles did not show a distinct water mass at the fjord end (Fig. 5a). In addition, the halocline in Kongsfjorden was spread over a larger depth (∼ 50 m depth) and was less sharp than in Rijpfjorden (Figs. 4b, 5b), as supported by salinity cross-sections (Figs. 2b, 3b). This is a characteristic feature of fjords with tidewater glaciers where plume set-up disperses salinity due to mixing and entrainment (Torsvik et al., 2019). In summary, Kongsfjorden exhibits the features of dynamic circulation associated with the subglacial plume set-up, which is absent in Rijpfjorden.
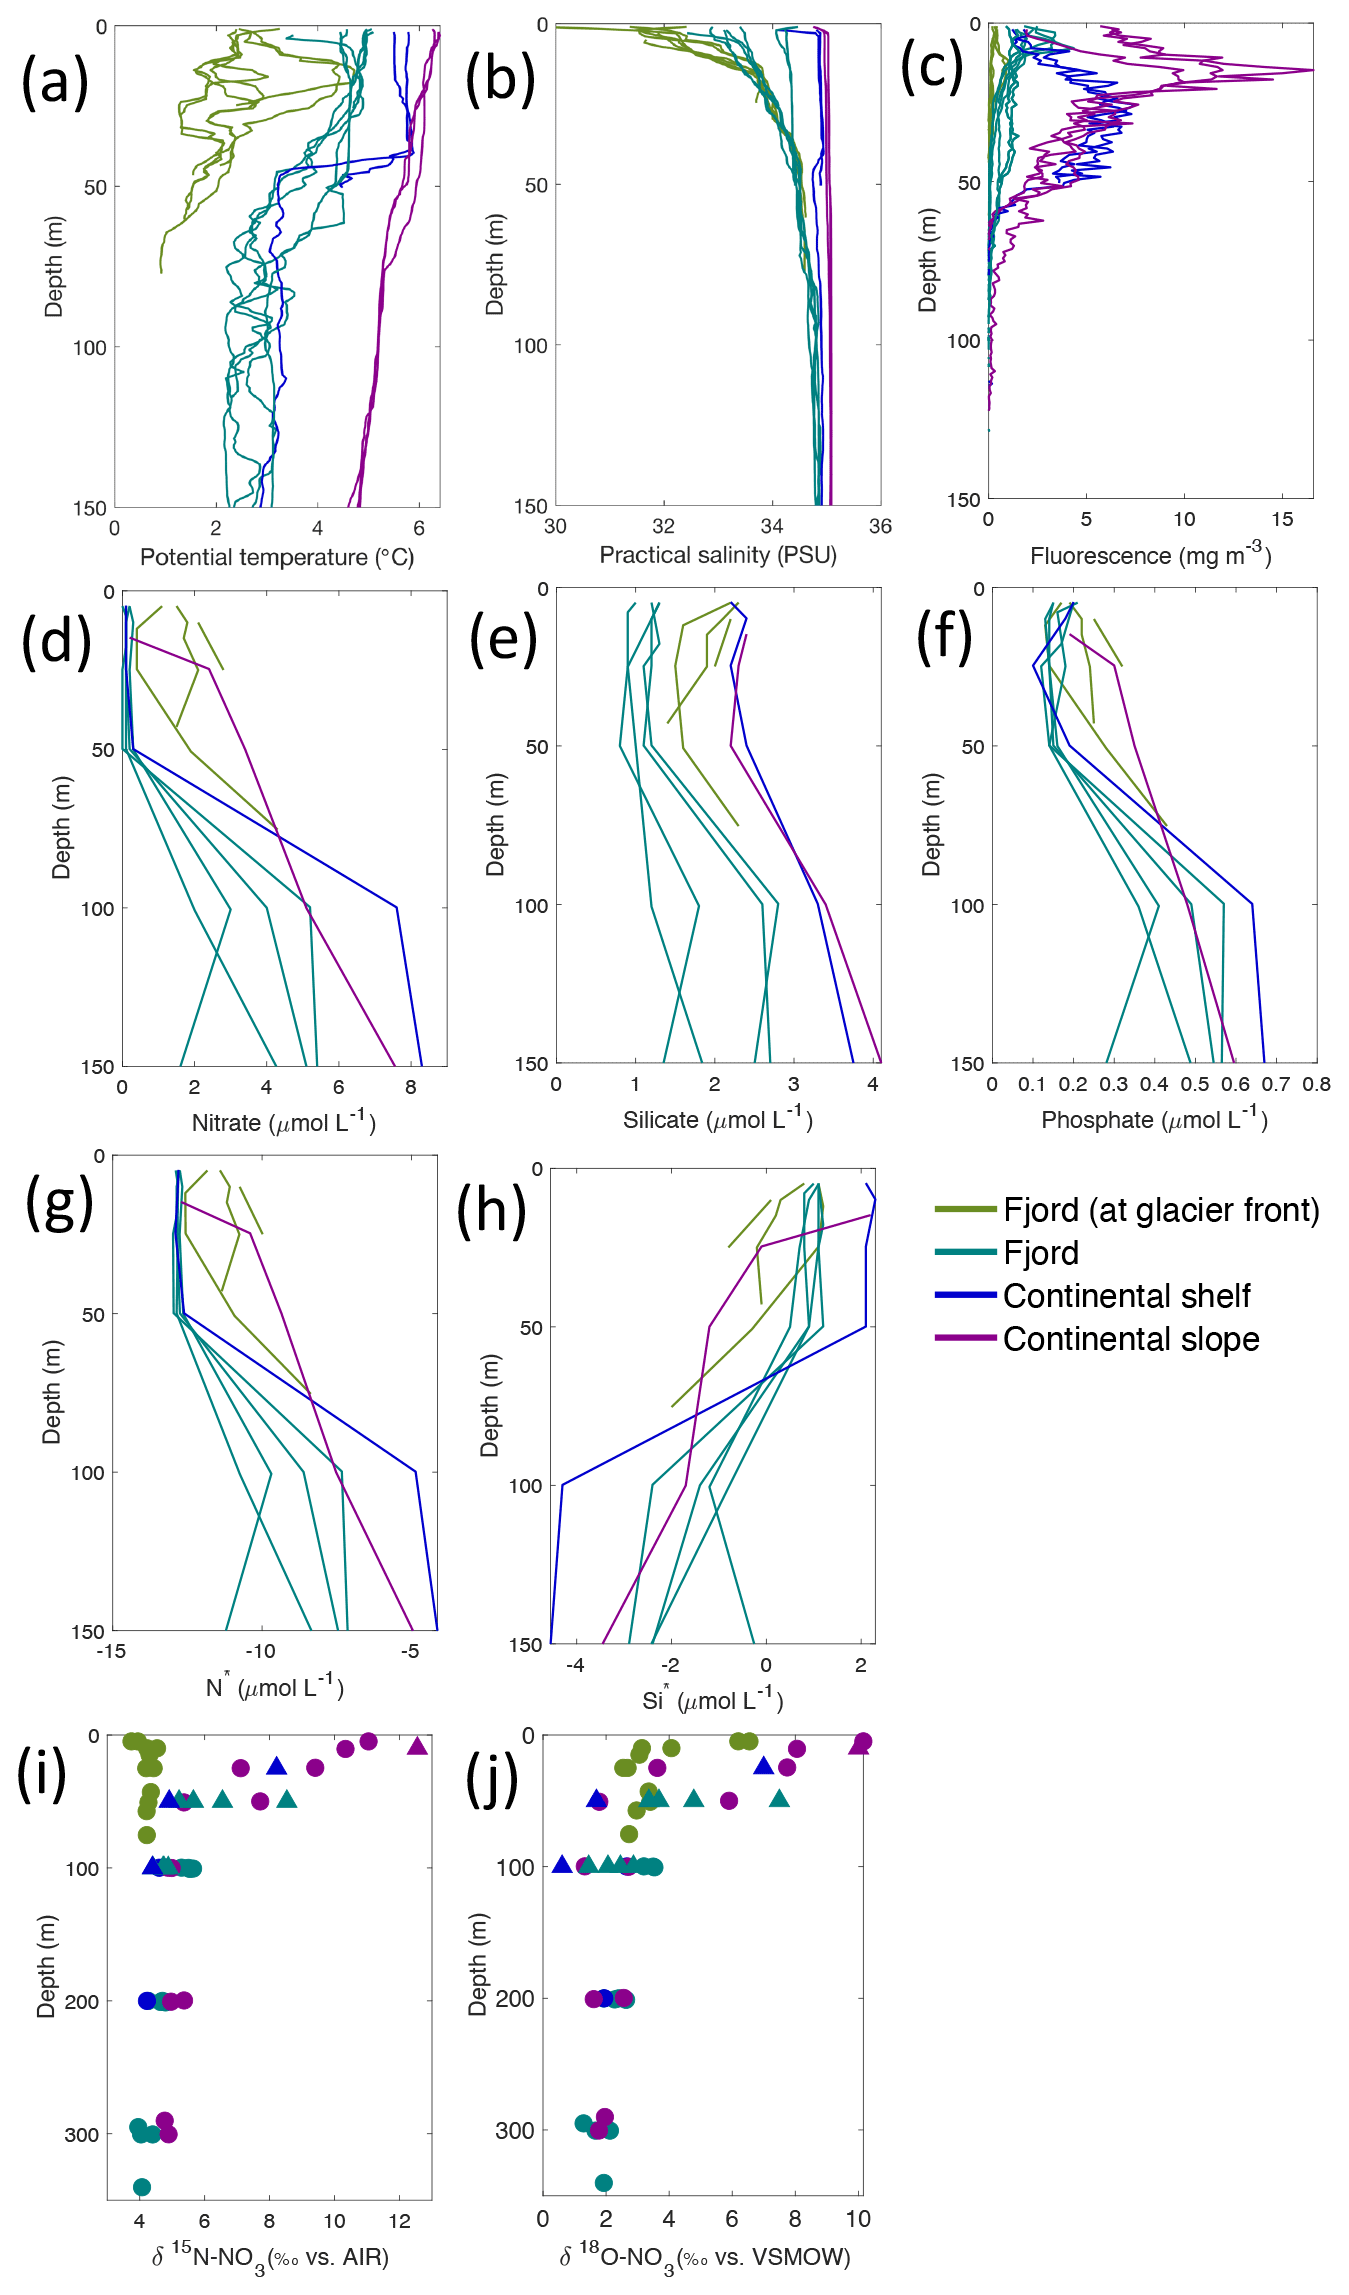
Figure 4Depth profiles of (a) temperature (∘C), (b) salinity (PSU), (c) fluorescence (mg L−1), (d) nitrate (µmol L−1), (e) silicate (µmol L−1), (f) phosphate (µmol L−1), (g) N* (µmol L−1), (h) Si* (µmol L−1), (i) δ15N-NO (‰) and (j) δ18O-NO (‰) from Kongsfjorden using NP2018 (circles and solid lines) and NP2017 (triangles) cruise samples. Colour denotes locations in Kongsfjorden at glacier fronts, fjord, continental shelf and slope. Note: standard deviations of the isotopic values reported in (i) and (j) are 0.33 ‰ and 0.47 ‰ for δ15N and δ18O, respectively.
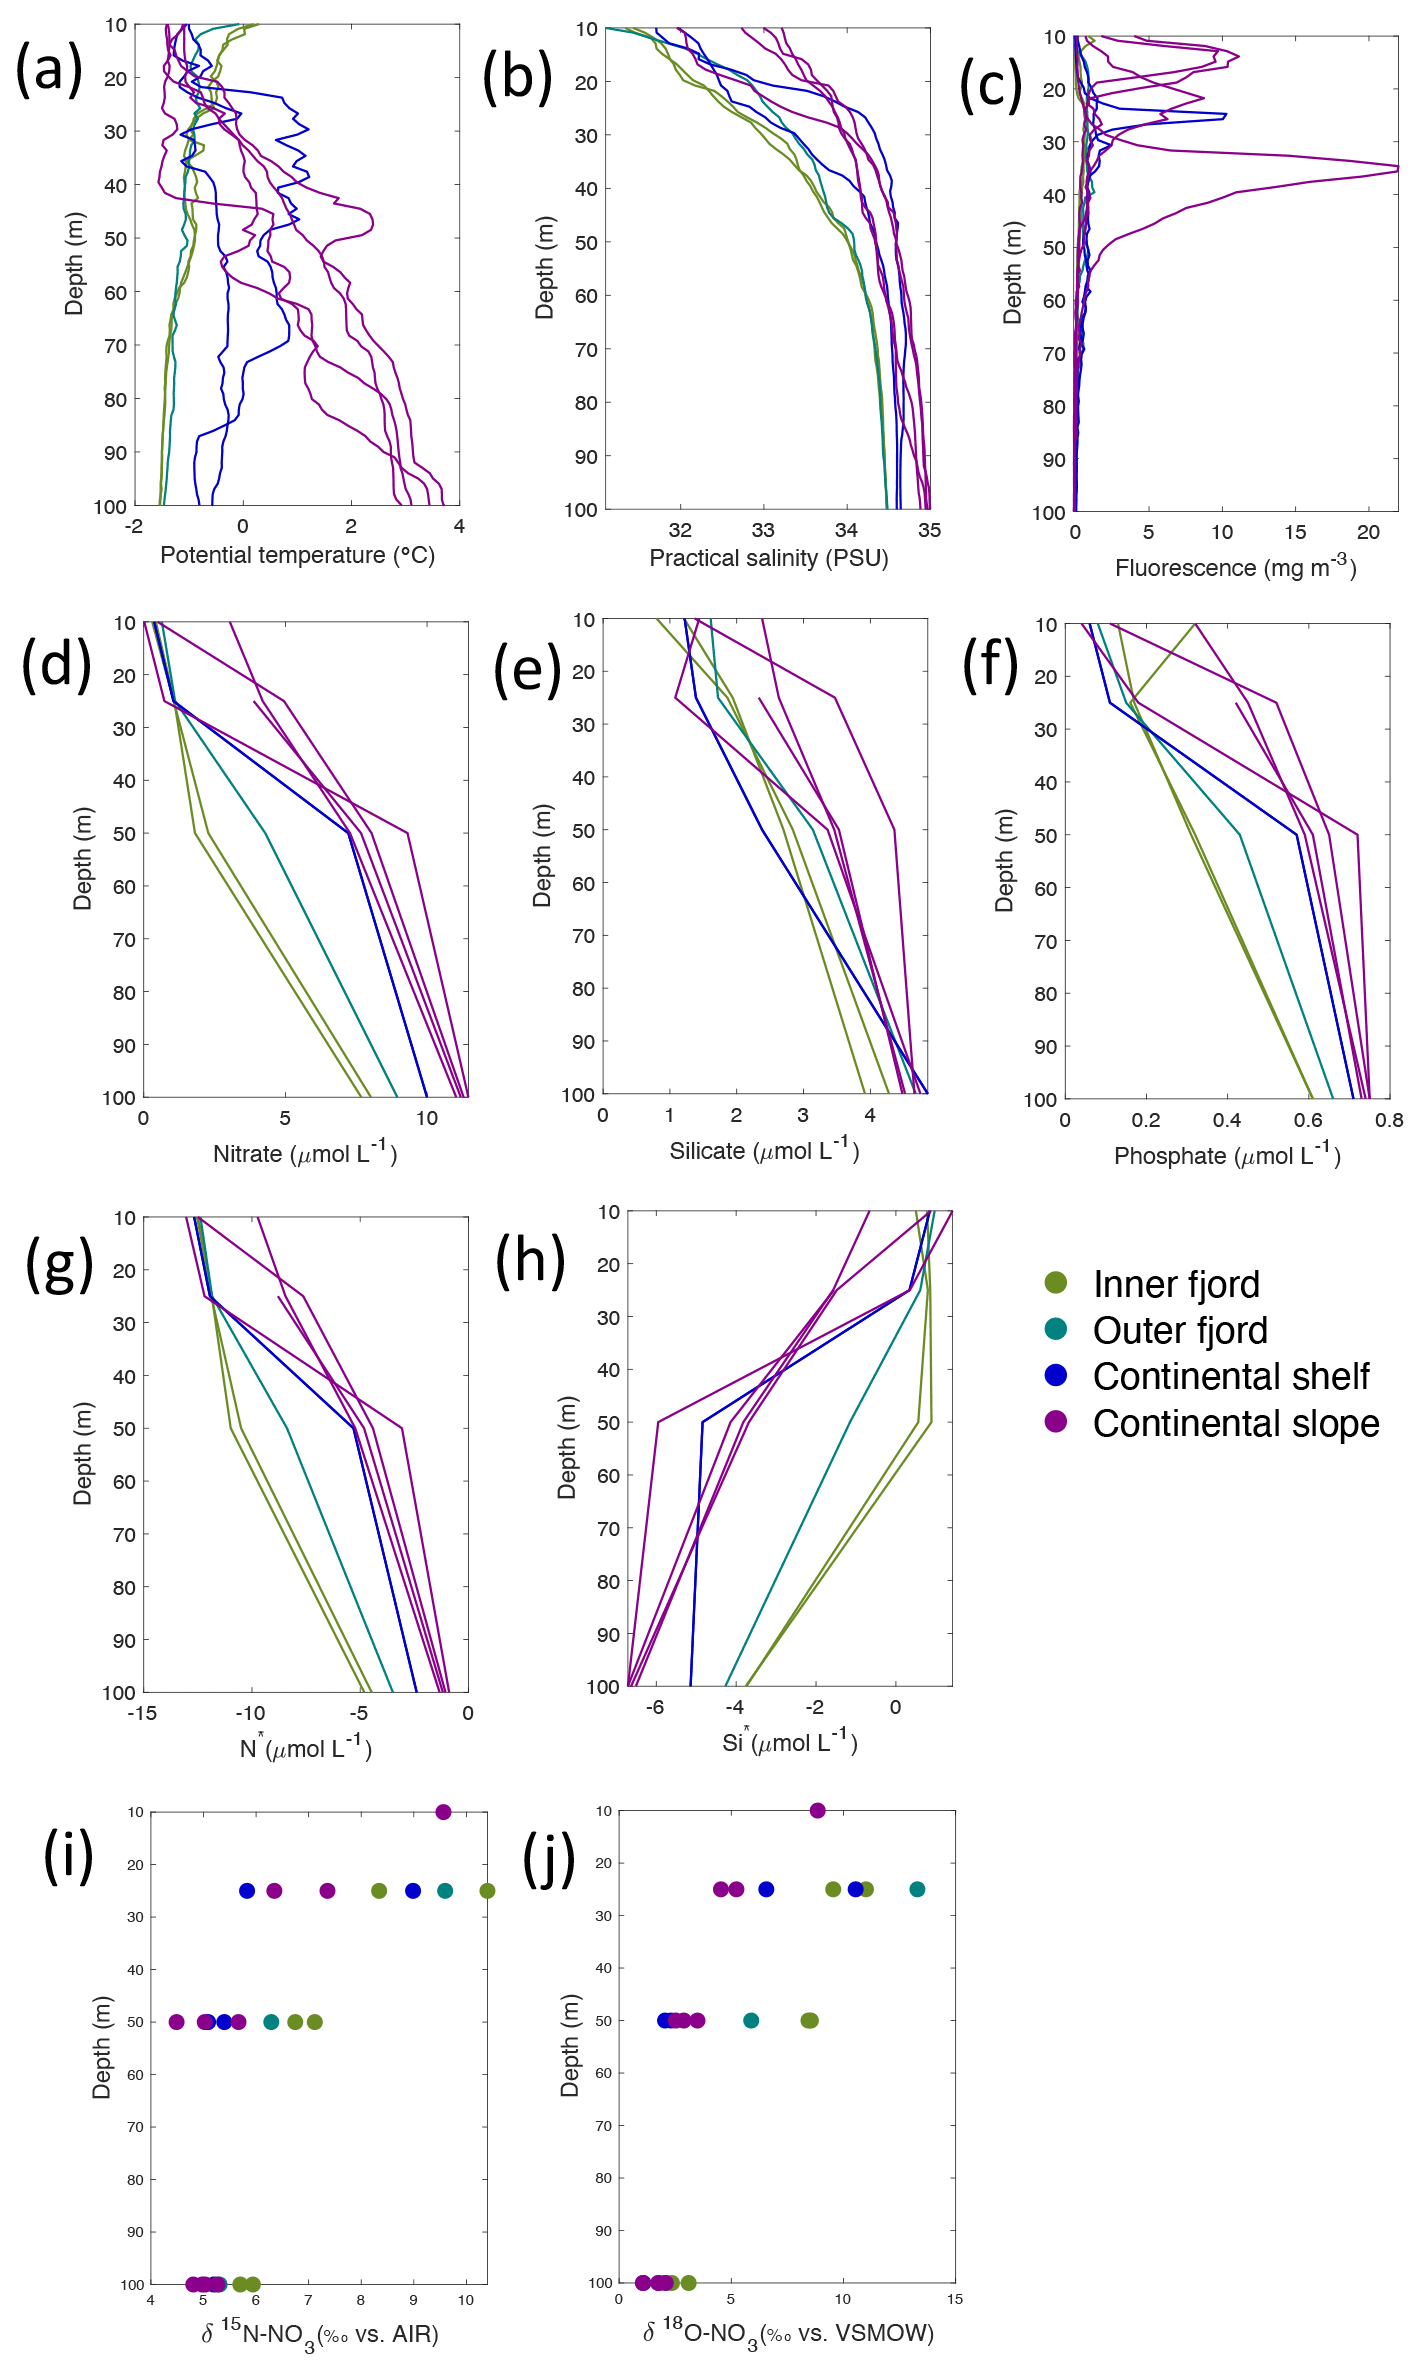
Figure 5Depth profiles of (a) temperature (∘C), (b) salinity (PSU), (c) fluorescence (mg m−3), (d) nitrate (µmol L−1), (e) silicate (µmol L−1), (f) phosphate (µmol L−1), (g) N*(µmol L−1), (h) Si* (µmol L−1), (i) δ15N-NO (‰) and (j) δ18O-NO (‰) from Rijpfjorden using NP2017 cruise samples. Colour denotes locations in Rijpfjorden (at inner fjord, outer fjord, continental shelf and slope). Note: standard deviations of the isotopic values reported in (i) and (j) are 0.33 ‰ and 0.47 ‰ for δ15N and δ18O, respectively.
Nutrient and N* concentrations in Kongsfjorden were low or below the limit of detection (<1 µmol L−1 nitrate, <0.2 µmol L−1 phosphate, <−12.7 µmol L−1 N*) throughout the top 50 m in mid- to outer-fjord (Kb0–3) and continental shelf (V12) stations (Figs. 4d, f, g, 6a, c, d) due to uptake by phytoplankton, as demonstrated by elevated chlorophyll concentrations (Fig. 4c). Such low nitrate and phosphate concentrations at these fjord stations were located within and above the halocline, whereas those at the continental shelf were related to the warmer AW intrusion (Fig. 4a, b). In Rijpfjorden, although the lowest nutrient and N* concentrations were found above the halocline (∼ 50 m depth), in general they were higher with 1 µmol L−1 nitrate, >0.2 µmol L−1 phosphate and >−12.5 µmol L−1 N* both in the fjord and at the shelf stations (Figs. 5d, f, g, 7a, c, d). These slightly higher nutrient concentrations in the stratified layers of Rijpfjorden may indicate incomplete nutrient utilisation at the surface as terrestrial inputs are unlikely to be much higher compared to Kongsfjorden.
In both fjords, coinciding with the base of the halocline, i.e. below 50 m depth, nitrate, silicate, phosphate and N* concentrations increased in all stations (Figs. 4d–g, 5d–g), while the isotopic ratios and Si* decreased (Figs. 4h–j, 5h–j). Decrease in nutrient concentration towards the surface accompanied by increases in δ15N-NO and δ18O-NO (Figs. 4i, j, 5i, j) are trends associated with uptake by phytoplankton, while the increases in N* with depth are associated with nutrient regeneration. Higher Si* (>0) towards the surface implies the presence of nutrient inputs carrying excess Si with respect to N (Figs. 4h, 6e). In contrast, nutrient concentrations were higher in the glacier front at Kongsfjorden (Kb5–7) than in other fjord sampling sites. These high nutrient values were associated with low salinity (Fig. 4b), they showed no defined depth-dependent trend (Fig. 4d, f), and Si concentrations were generally high enough to overcome Si limitation while N deficiency persisted (Si*>0 and N*<0; Figs. 4g, h, 6d, e). Moreover, δ15N-NO was low and clustered at around 4.3 ± 0.1 ‰ (Fig. 4i) indicating a source dependence rather than uptake.
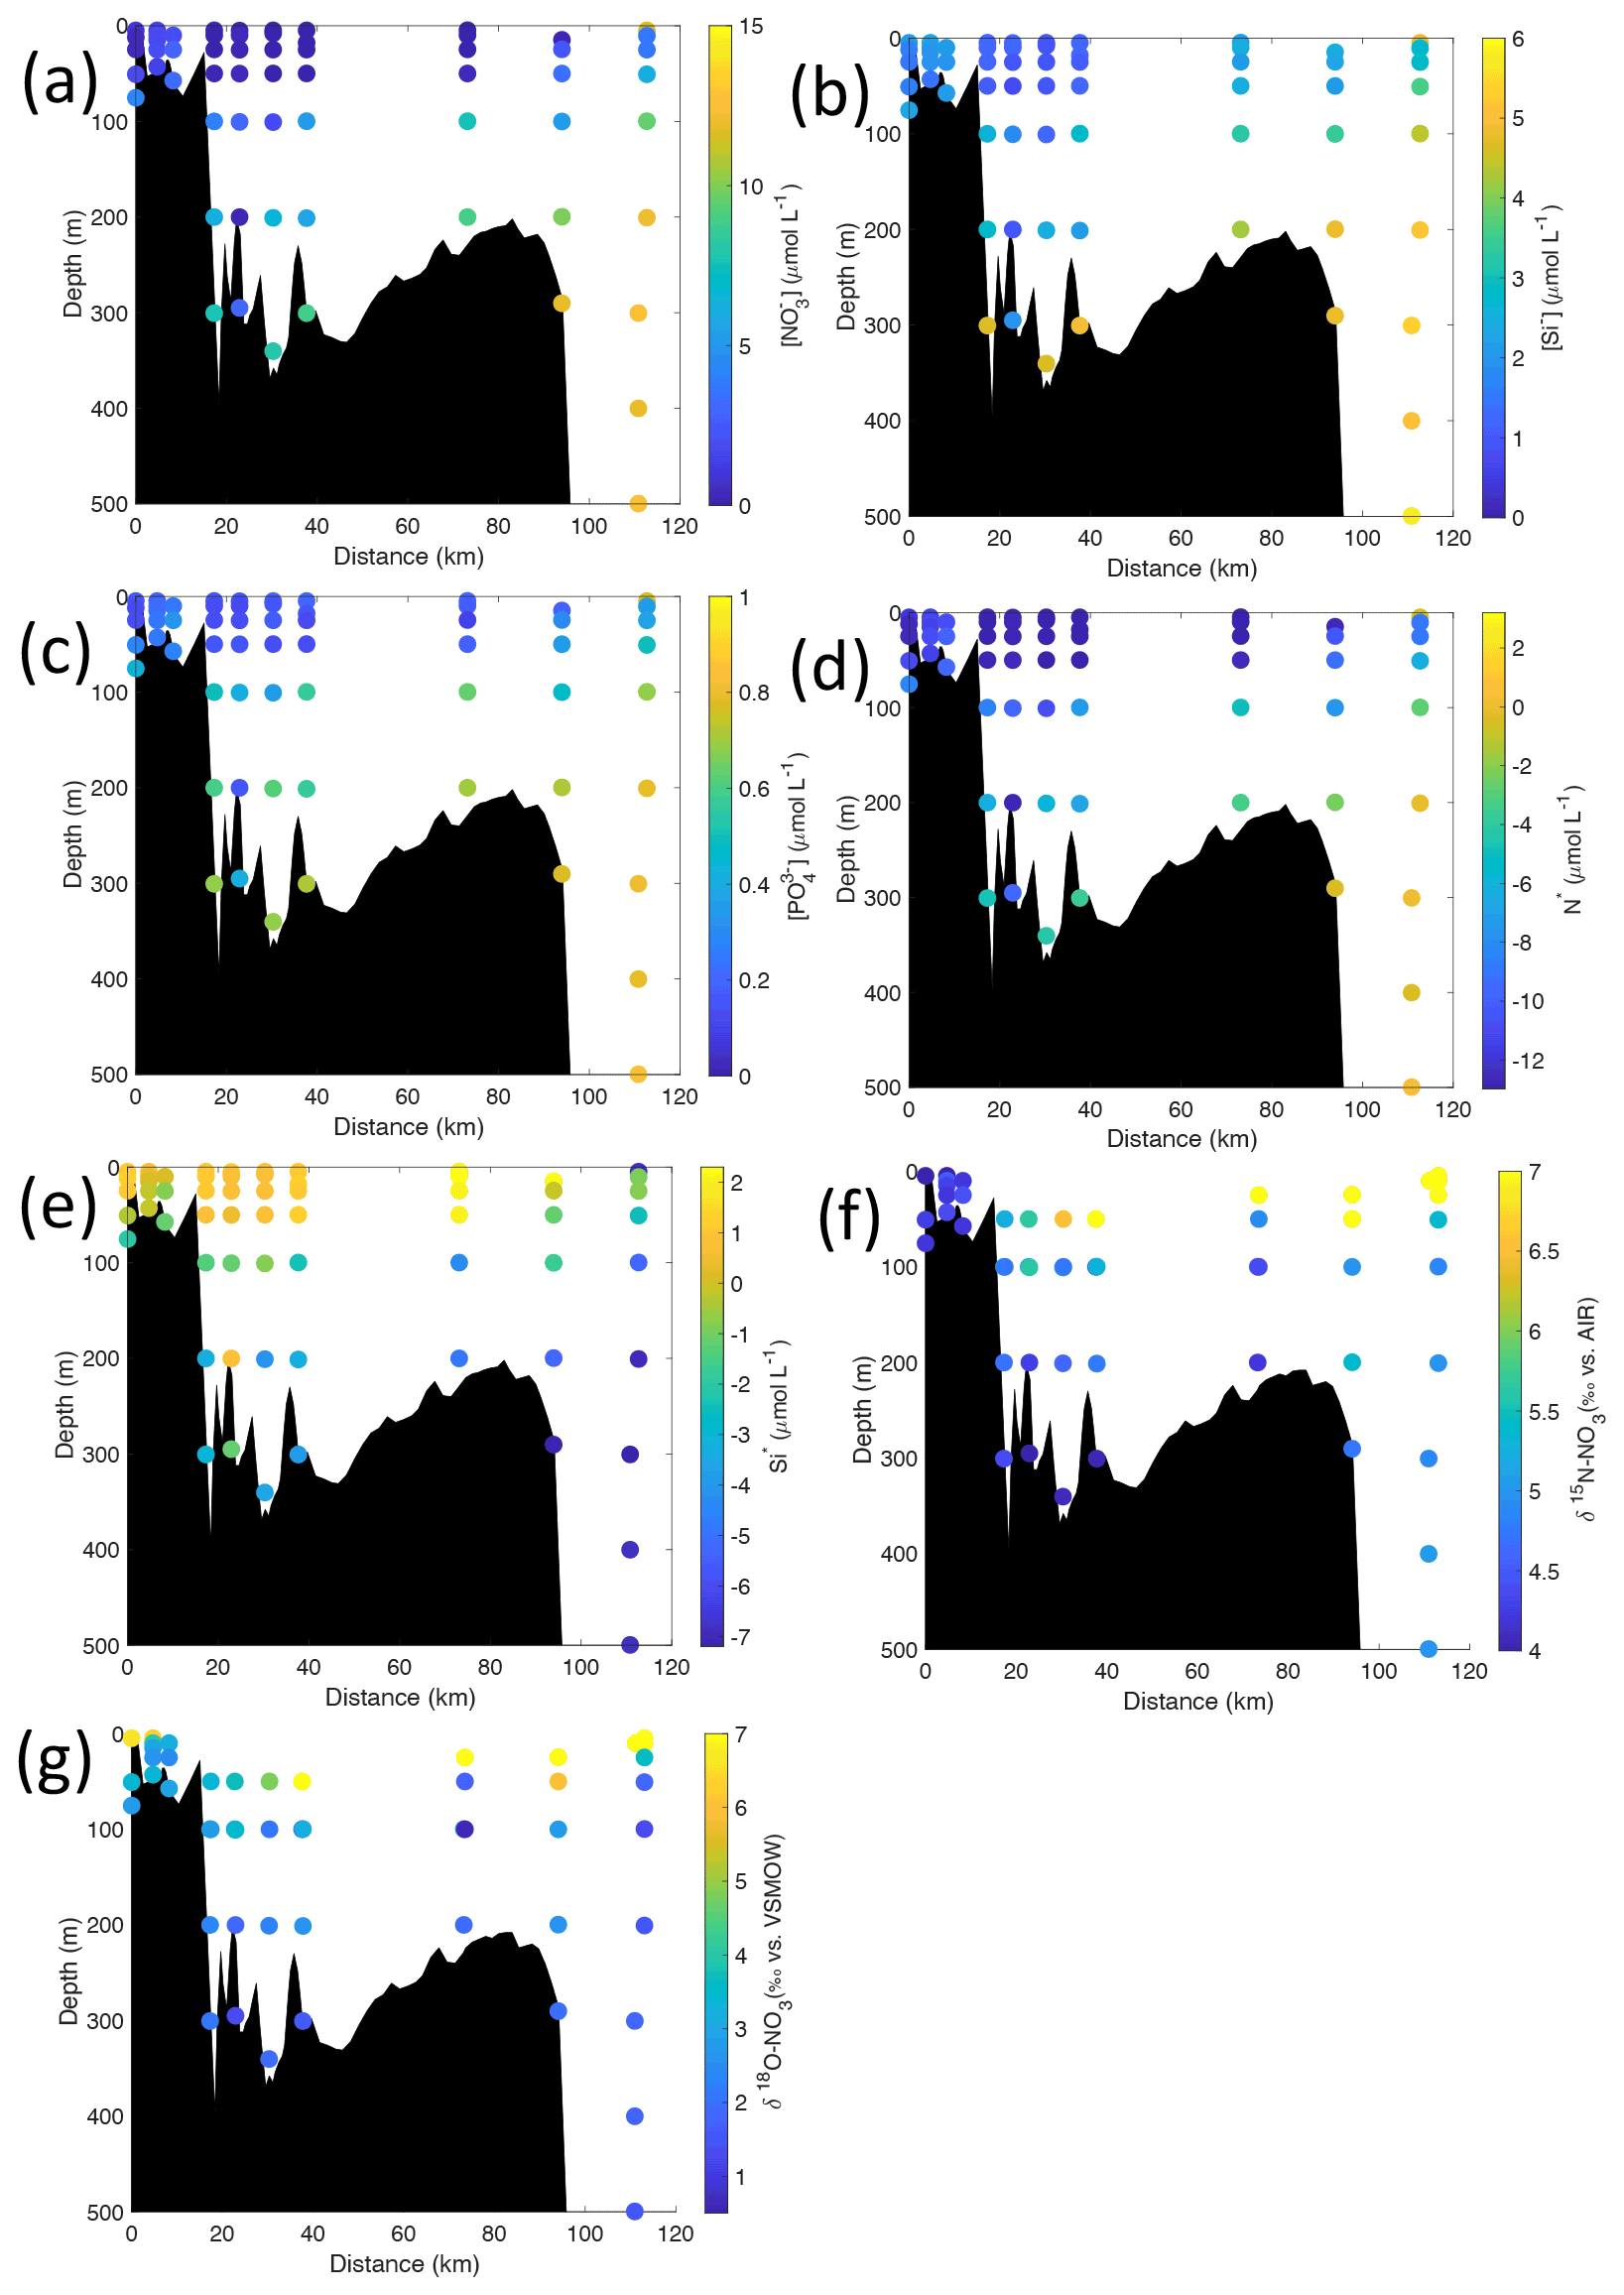
Figure 6Cross-sections across Kongsfjorden of (a) nitrate (µmol L−1), (b) silicate (µmol L−1), (c) phosphate (µmol L−1), (d) N* (µmol L−1), (e) Si* (µmol L−1), (f) δ15N-NO (‰) and (g) δ18O-NO (‰). Nutrient cross-sections use data from NP2018, while isotope cross-sections use NP2017 and NP2018 data. Distance is shown as the cumulative distance between successive stations. Note: standard deviations of the isotopic values reported in (f) and (g) are 0.33 ‰ and 0.47 ‰ for δ15N and δ18O, respectively.
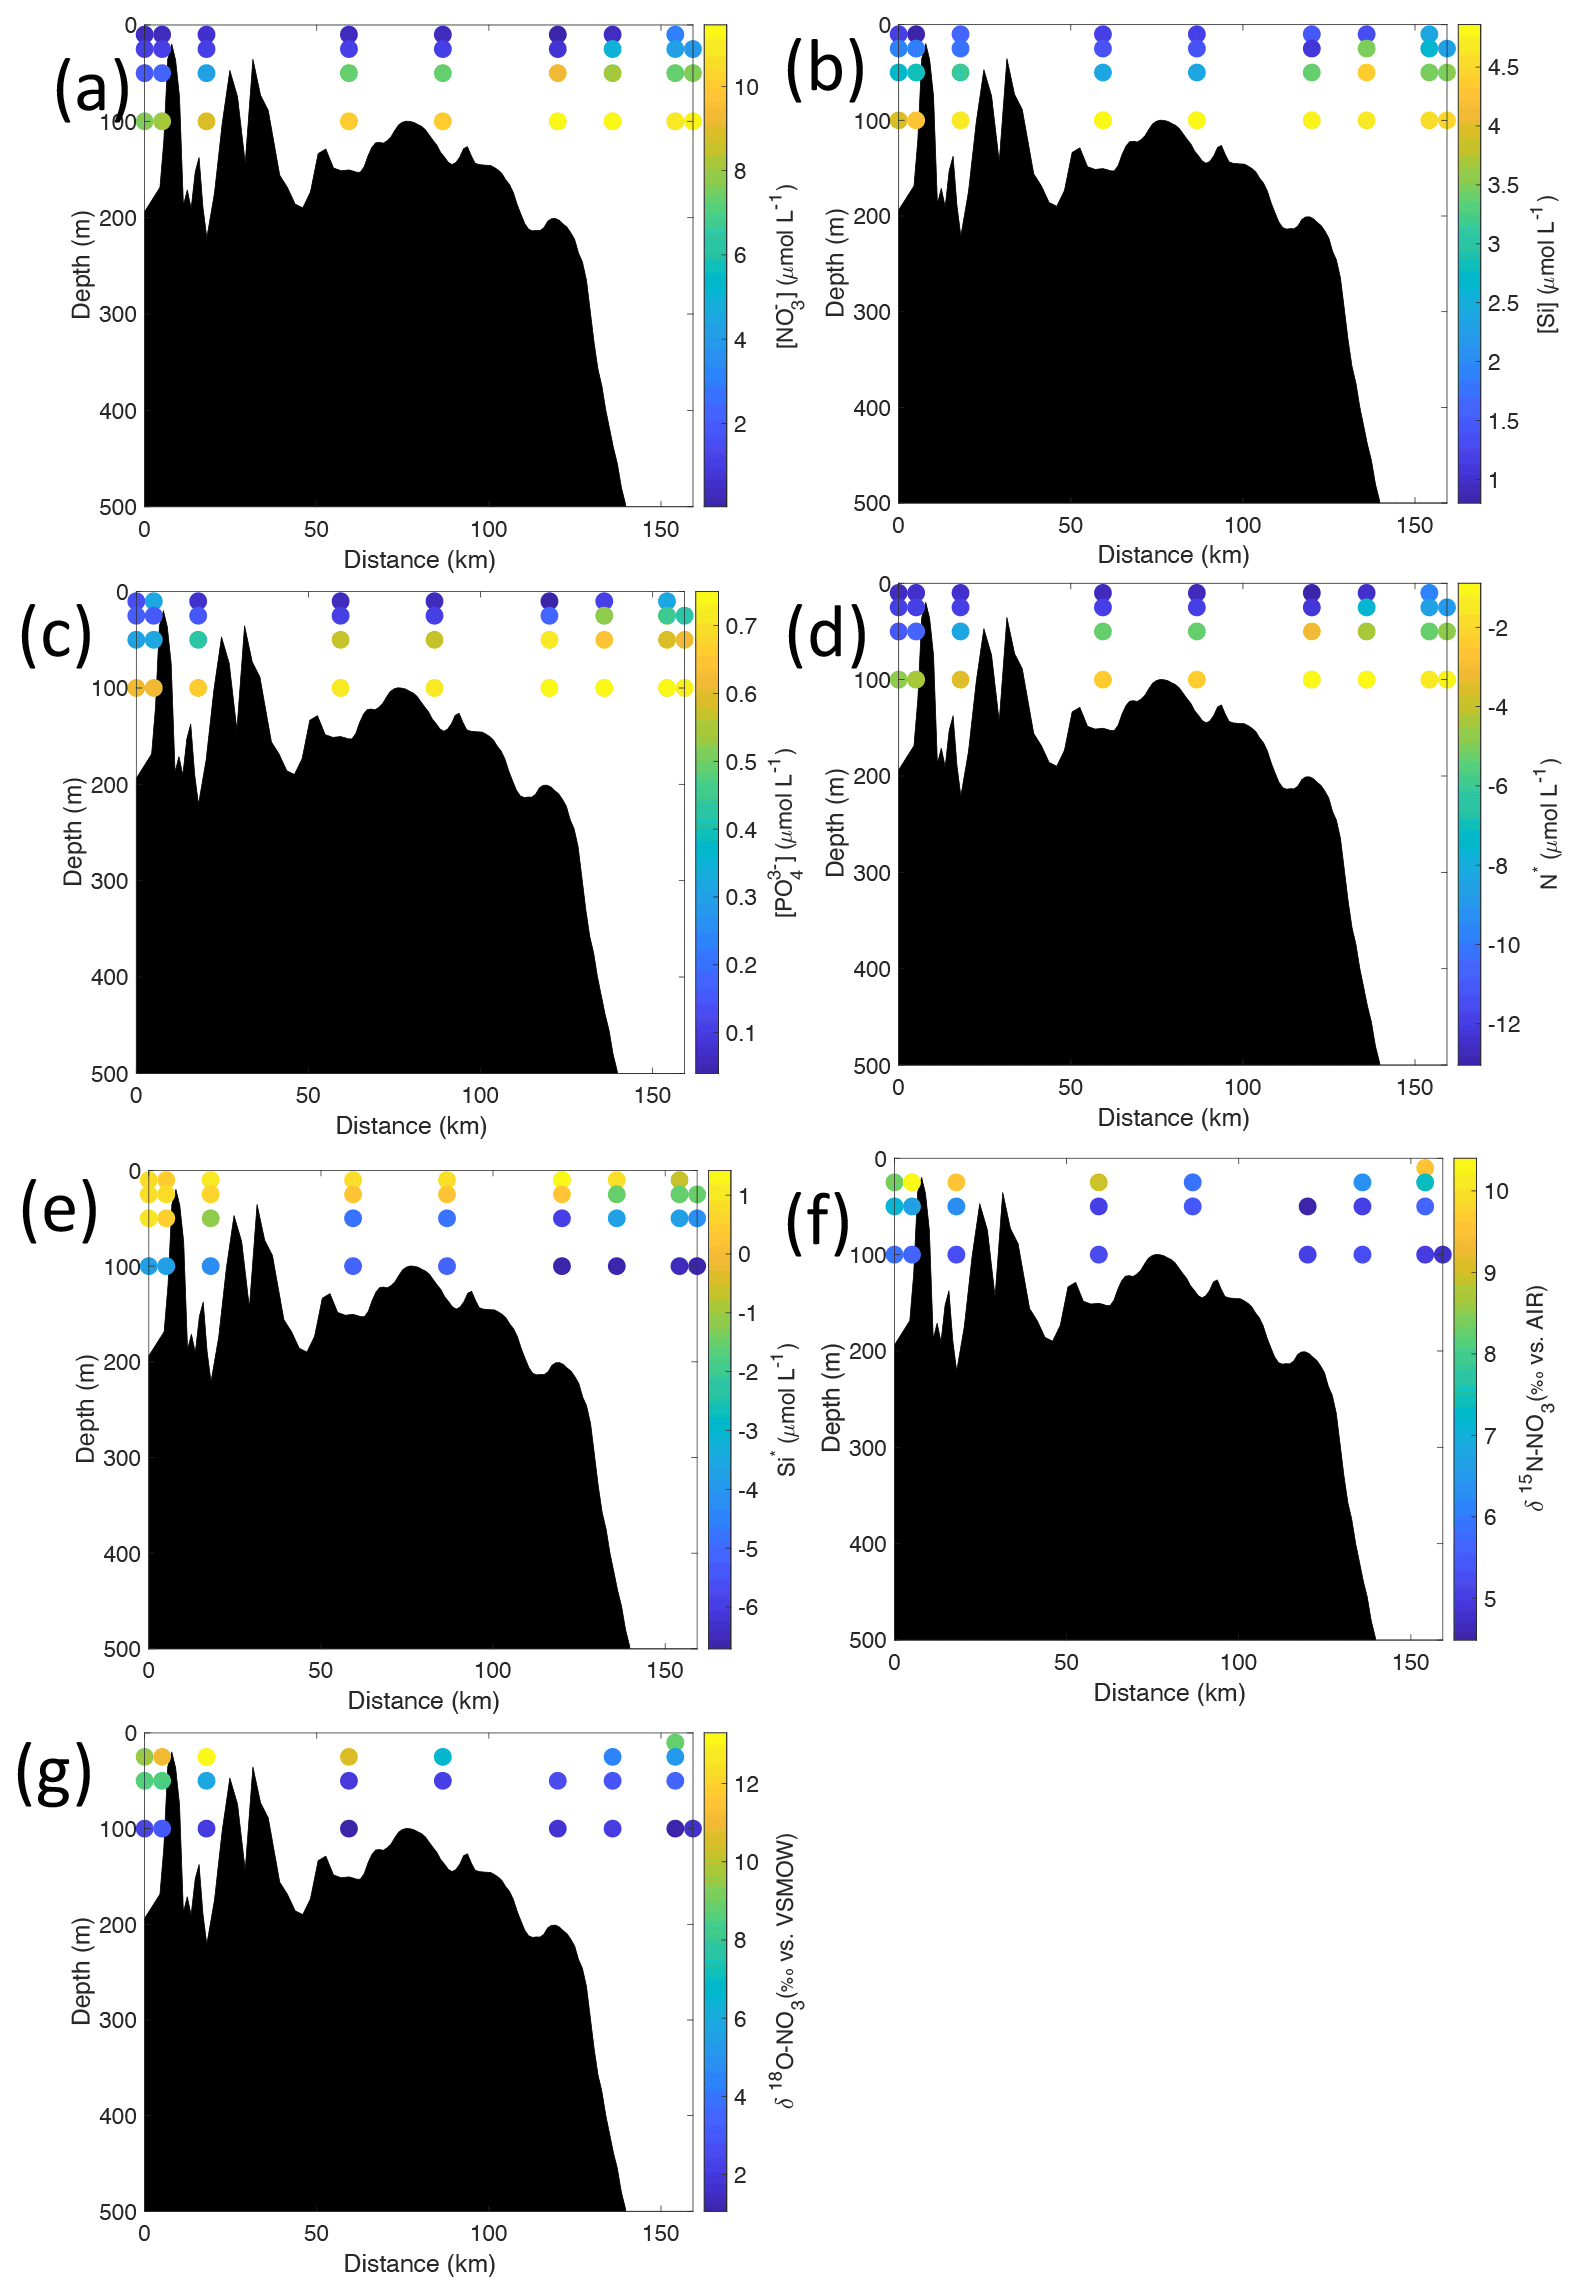
Figure 7Cross-sections across Rijpfjorden of (a) nitrate (µmol L−1), (b) silicate (µmol L−1), (c) phosphate (µmol L−1), (d) N*(µmol L−1), (e) Si* (µmol L−1), (f) δ15N-NO (‰) and (g) δ18O-NO (‰) using NP2017 data. Distance is shown as the cumulative distance between successive stations. Note: standard deviations of the isotopic values reported in (f) and (g) are 0.33 ‰ and 0.47 ‰ for δ15N and δ18O, respectively.
Conversely, nutrient and N* concentrations reached 3.2 µmol L−1 nitrate, 0.3 µmol L−1 phosphate and −10.4 µmol L−1 N* at 25 m depth in the continental slope at Kongsfjorden (Figs. 4d, f, g, 6a, c, d), decreasing towards the surface. There, elevated δ15N-NO and δ18O-NO with increasing proximity to the water surface (Figs. 4i, j, 6f, g) are explained by uptake by phytoplankton. The same interpretations also apply to the continental slope of Rijpfjorden (Figs. 5d–j, 7a–g).
In Rijpfjorden, δ15N-NO and δ18O-NO values taken at the deepest sampling depth of 100 m showed enrichments in isotopic values from the shelf and slope stations into the fjord. Namely the δ15N-NO at fjord stations was 5.8 ± 0.2 ‰, which was higher than the shelf and slope signature of 5.4 ± 0.4 ‰ (Fig. 5i). Meanwhile, δ18O-NO at fjord stations (2.7 ± 0.5 ‰) also showed an enrichment with respect to shelf and slope stations (2.2 ± 0.7 ‰) (Fig. 5j). Noticeably, δ15N-NO and δ18O-NO signatures at shelf and slope stations fall within the range of AW signatures (δ18OAW-NO ± 0.3 ‰; δ15NAW-NO ± 0.1 ‰; Tuerena et al., 2021b).
4.1 Nutrient limitation and terrestrial nutrient inputs
In Kongsfjorden, higher nutrient concentrations at the glacier front stations suggest nutrient inputs from glacial discharge plumes. Concentrations of 1–4 µmol L−1 nitrate, 0.2–0.4 µmol L−1 phosphate and 1.5–2.5 µmol L−1 silicate found within the halocline in stations near glacier fronts can only be explained by this terrestrial supply as the halocline presence clearly restricts nutrient mixing from depths into the upper 50 m – as was shown in nutrient profiles in other fjord stations (Figs. 4d–f, 5d–f). Indeed, glacial meltwater has been found to be enriched in these nutrients, with concentrations broadly ranging from 0.24–1.60 µmol L−1 nitrate, 0–0.19 µmol L−1 phosphate and 1.72–3.47 µmol L−1 silicate (Halbach et al., 2019). In Rijpfjorden, where nutrient concentrations were generally higher than in Kongsfjorden, there are no tidewater glaciers, but this does not rule out the presence of terrestrial inputs from surface meltwater flow through streams. In fact, terrestrial inputs are potentially responsible for the enrichment in silicate (>1 µmol L−1) and phosphate (>0.2 µmol L−1) in inner Rijpfjorden. Marine inputs cannot explain higher concentrations in Rijpfjorden as AW intrusion is too weak to extend to the continental shelf.
On the continental shelf outside Kongsfjorden, a strong thermocline at ∼ 40 m pointed to a strong marine influence through the intrusion of AW between 20–50 m (34.9 PSU, 5.6∘ C) into the fjord. This intrusion was associated with a chlorophyll a maximum of 4–6 mg m−3 and nutrient depletion due to phytoplankton growth, thus suggesting a potential marine contribution to the nutrient pool of Kongsfjorden. Vertical supply of nutrients from underlying modified PSW (34.7 PSU, 3∘ C) was likely hindered by the strong thermocline. Likewise, outside of the sill, AW was well-mixed and dominates throughout the whole water column, hosting a phytoplankton bloom with a fluorescence peak (14 mg m−3) at 20 m depth.
Marine nutrient contribution to productivity in both fjords is hindered by the strong halocline that develops in summer, and as a result mixing is restricted to winter overturning. In addition, AW is relatively nutrient poor as nutrient depletion occurred before entering the fjord (Cottier et al., 2010). Therefore, terrestrial nutrient inputs which occur throughout the summer with higher nutrient concentrations than marine inputs can be more important in these fjords during the summer (Hopwood et al., 2020).
Terrestrial inputs, evident from glacier front profiles, can be distinguished using nutrient stoichiometry by plotting nitrate concentrations against phosphate (Fig. 8a) and against silicate concentrations (Fig. 8b). N and P concentrations in Kongsfjorden, Rijpfjorden and eastern Fram Strait are shown in Fig. 8a along with lines representing the Redfield ratio (N : P, 1:15 and 1:16). Linear trends with a slope similar to Redfield ratios indicate phytoplankton uptake and regeneration stoichiometry. Thus, most of the fjord samples show the influence of nutrient uptake and recycling. In Fig. 8a, ΔN ΔP at Kongsfjorden and Rijpfjorden was 16.8 (R2 0.96, p value ≤ 0.05) as the slope conforms broadly to the Redfield ratio. However, the x intercept (0.14 µmol PO L−1) suggests surplus supply of phosphate from riverine input into the fjords and the inner shelf area (Fig. 8a; McGovern et al., 2020). It has been reported that discharge from the Bayelva river into Kongsfjorden contributes 60 µmol PO L−1, equivalent to 5.4 t yr−1 using a total discharge of 29×106 m3 recorded in 2012 (Zhu et al., 2016), whereas Rijpfjorden receives P input by glacially fed rivers (Wang et al., 2013). In general, the P intercept is consistent with the suggestion that nutrients supplied from Arctic soils are enriched in phosphate relative to nitrate due to the loss of N via denitrification owing to waterlogging during the summer months (Hayashi et al., 2018).
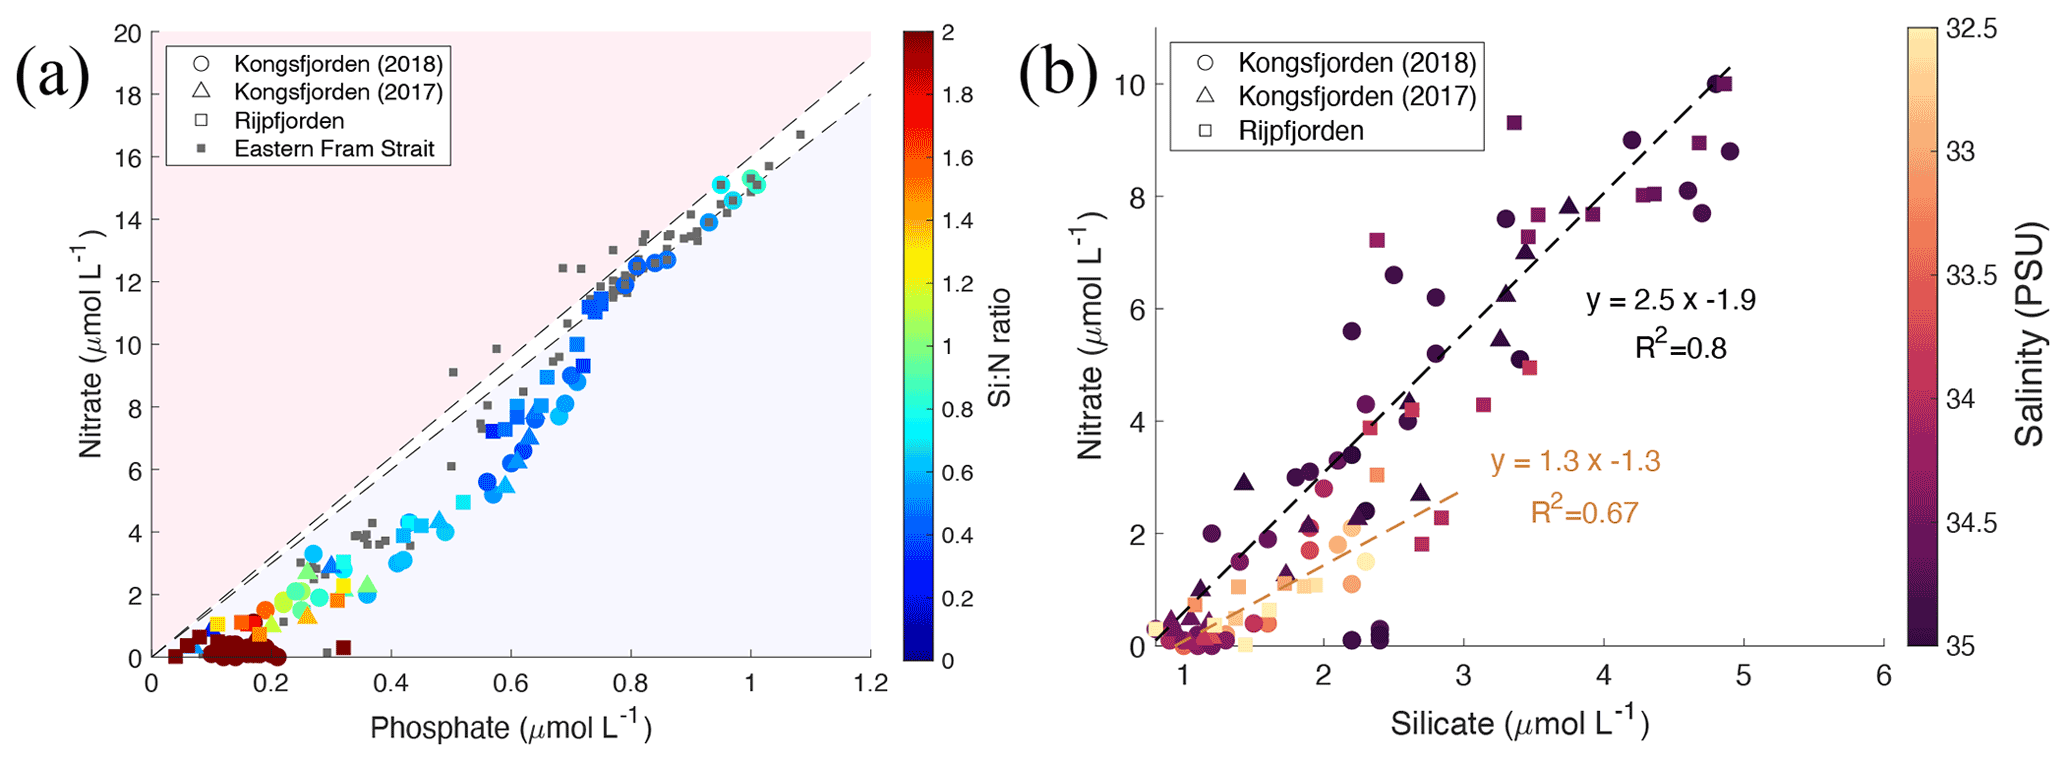
Figure 8Correlation of nutrient concentrations throughout the whole water column of Kongsfjorden and Rijpfjorden. (a) Nitrate (µmol L−1) vs. phosphate (µmol L−1) in relation to the Redfield ratio (dashed lines for 1:15 and 1:16). In (a) colour coding for circles corresponds to Si : N ratio. Circles correspond to data measured in Kongsfjorden during NP2018 cruise. Triangles correspond to data measured in Kongsfjorden during NP2017 cruise. Squares correspond to data measured in Rijpfjorden during NP2017 cruise. Dark grey squares correspond to data from eastern Fram Strait (JR17005 and FS2018 cruises). (b) Nitrate (µmol L−1) vs. silicate (µmol L−1) in Kongsfjorden (NP2018, circles; NP2017, triangles) and Rijpfjorden (NP2017, squares). Black regression line includes all points with salinity over 33.5 PSU. Light brown regression line includes all points with salinity below 33.5 PSU. In (b) colour coding corresponds to salinity. All p values ≤ 0.05. Note: regression results are in Table B1.
In contrast, marine inputs cannot explain the P intercept recorded in Kongsfjorden and Rijpfjorden as AW in eastern Fram Strait shows an intercept of ∼ 0 (Tuerena et al., 2021a; Fig. 8a). Thus, the nutrient stoichiometry of Kongsfjorden and Rijpfjorden is influenced by terrestrial nutrient inputs. Broadly, despite this terrestrial input, the nutrient data plotted in Fig. 8a indicate rapid N depletion in the upper water column of both fjords. This can be explained by stratification and excess terrestrial P inputs relative to the Redfield ratio.
Inshore and fjord samples that show excess P also show higher Si : N ratios due to terrestrial Si supply both in Kongsfjorden and Rijpfjorden (Fig. 8a; Dugdale and Wilkerson, 2001). When nitrate vs. silicate concentrations are plotted using salinity as a third variable, most stations follow a linear trend with a N : Si ratio of 2.5 (Fig. 8b). Outliers are associated with low salinity (<33.5 PSU) and have a lower N : Si ratio of 1.3 indicative of Si enrichment (relative to NO) from terrestrial discharge (Fig. 8b). This is supported by Si* profiles, where values are higher within the halocline (Figs. 4h, 6e). These outliers correspond to the innermost stations at both fjords and are represented as high Si : N ratios (>1) in Fig. 8a. Furthermore, in Kongsfjorden, data also suggest that terrestrial silicate is supplied through the glacial discharge plume (Fig. 8b), most likely from glacier meltwater enriched in silicate from weathering of siliceous rocks (Dugdale and Wilkerson, 2001; Halbach et al., 2019). Meanwhile, in Rijpfjorden, silicate is supplied through glacially fed rivers rather than directly by tidewater glaciers (Wang et al., 2013). In contrast, AW is a poor source of silica, with silicate limitation (Krisch et al., 2020) and phosphate deficiency evident in surface waters (Tuerena et al., 2021a) and making only a limited contribution to the halocline in both fjords. Therefore, it is suggested that Kongsfjorden and Rijpfjorden have the potential to act as a source of silicate and to a lesser extent phosphate to AW offshore. This aspect is discussed below taking into consideration the fjord residence times.
Both Kongsfjorden and Rijpfjorden receive terrestrial nutrients enriched in Si and P relative to N via glacial plumes and riverine input, which are then consumed by phytoplankton uptake within the fjord (Fig. 8). Here we evaluate the potential impact of this on siliceous diatoms (Egge, 1998) by comparing Si : N uptake ratios within vs. outside of the fjord (Fig. 9).
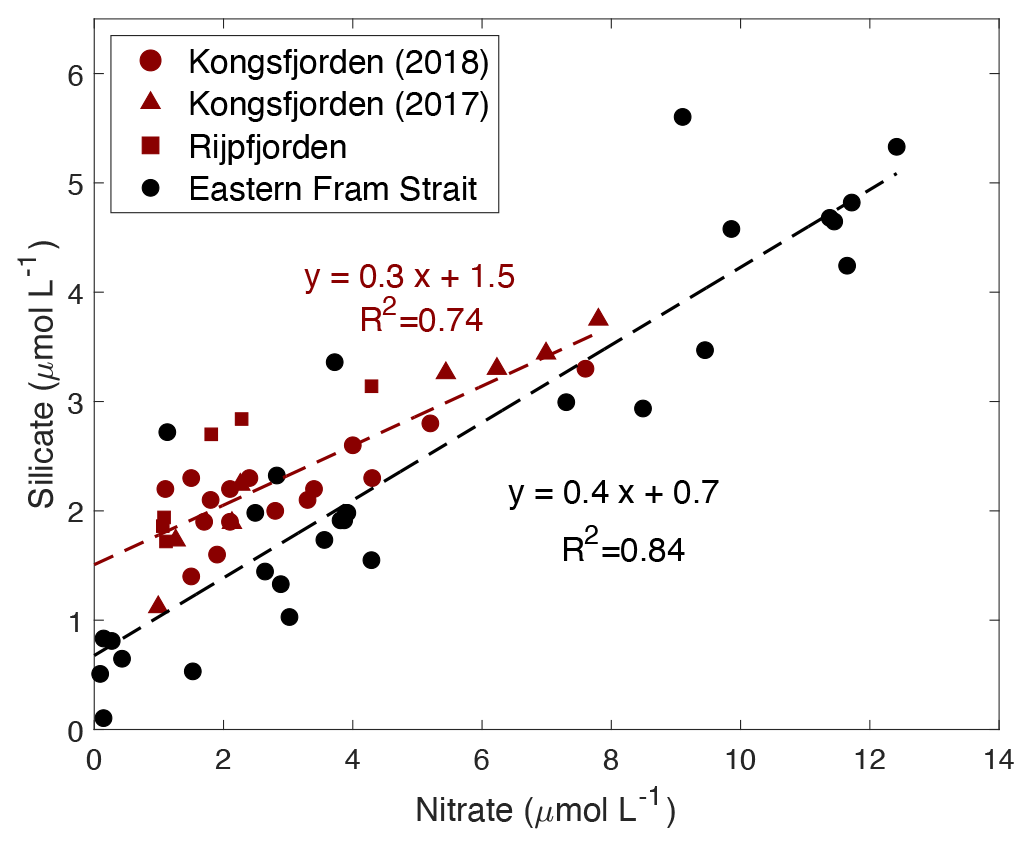
Figure 9Correlation of silicate (µmol L−1) vs. nitrate (µmol L−1) in the upper water column (<100 m) within the fjord (Kongsfjorden: NP2018 – dark red circles and NP2017 – dark red triangles; Rijpfjorden: dark red squares) and outside of the fjord (eastern Fram Strait; black circles). Dashed dark red line is the regression line for Kongsfjorden (NP2018, 2017) and Rijpfjorden (NP2017) surface data. Dashed black line is the regression line for eastern Fram Strait (JR17005 and FS2018) surface data. All p values ≤ 0.05. Note: regression results are in Table B1.
In both fjords, data from surface waters (<100 m) indicate an Si : N uptake ratio of 0.3 (R2=0.74, p≤0.05) and in the eastern Fram Strait of 0.4 (R2=0.84, p≤0.05) (Fig. 9). This suggests that the diatom production as a proportion of the whole phytoplankton community is higher in the eastern Fram Strait (ca. 40 % of phytoplankton are diatoms) compared to fjord stations (ca. 30 %) given that the diatom Si : N uptake ratio is ∼ 1 (Brzezinski, 1985). This implies that terrestrial Si inputs have no significant impact on phytoplankton composition. This is probably because terrestrial Si inputs are insufficient to overcome the Si limitation as all fjordic samples fall below 5 µmol Si L−1, which is generally thought to be the threshold for kinetic Si limitation (Krause et al., 2018; Fig. 9). Si limitation in the fjord can be explained by the “silicate pump”, whereby more Si is rapidly lost to the deep – through sinking of biogenic silica or Si(OH)4-rich faecal pellets – compared to N, and Si resupply is further prevented by stratification (Dugdale et al., 1995). Nevertheless, it should be noted that the diatom Si : N uptake ratio may be greater than 1 in the eastern Fram Strait owing to transient Fe limitation reported here (Krisch et al., 2020). Thus, the overall higher Si : N ratio in the eastern Fram Strait relative to Kongsfjorden may also result from this process.
Several lines of evidence support higher diatom abundance outside of the fjord as diatoms generally dominate the phytoplankton assemblage in Arctic spring blooms (Hodal et al., 2012; Krause et al., 2019; Hegseth et al., 2019). The uptake ratio reported herein (ca. 0.4) in eastern Fram Strait suggests phytoplankton succession and a shift from diatom dominance in the spring bloom to nano- and picoplankton communities in summer months (Strom et al., 2006). Such phytoplankton succession is triggered by the depletion of nutrients from surface waters following the spring bloom and has been previously reported outside of Kongsfjorden (Rokkan Iversen and Seuthe, 2011; Kulk et al., 2018). Previous studies have documented that small nano- and picophytoplankton dominate the phytoplankton community throughout the summer in Kongsfjorden (Piquet et al., 2014; Kulk et al., 2018), although phytoplankton abundances can be patchy and succession can vary from year to year due to sea-ice duration and hydrological conditions. There are reports of diatoms being more abundant in cold years and small flagellates during warmer years (Piwosz et al., 2015). The results presented here therefore reflect an integration over the summer growing season sampled. However, in general, small phytoplankton cells thrive in fresher and oligotrophic surface waters due to their large surface-area-to-volume ratio which provides effective acquisition of nutrient solutes and photons and hydrodynamic resistance to sinking (Li et al., 2009).
Thus, our results document terrestrial nutrient inputs within the fjords, P inputs occur in excess of the Redfield ratio (N : P =16), and the excess terrestrial Si inputs might not necessarily by themselves favour greater diatom production later in the season due to progressive nutrient limitation within the fjords.
4.2 Identifying isotopic signatures of N source versus cycling in Svalbard fjords
Dual isotope signatures of δ15N-NO and δ18O-NO, as well as nitrate concentrations, are used to delineate the relative importance of various terrestrial sources. δ15N-NO and δ18O-NO were used to trace nitrogen cycling processes as they exhibit characteristic isotopic fractionation trends (Sigman and Fripiat, 2019) and offer insight into the relative importance of potential nitrate sources (Sigman and Casciotti, 2001) (see Appendix C). In Fig. 10, δ15N-NO is plotted against the natural log of nitrate concentration with salinity as a third variable. If biological uptake-dominated changes in nitrate concentration and composition, data would show a linear relationship, as expected from Rayleigh fractionation, and the slope of the line would represent the fractionation factor (ε; Altabet and Francois, 2001). Fractionation during uptake would lead to ε within the range 3–10 (Wankel et al., 2009). Indeed, ε of 4.9 ‰ was recorded in the Fram Strait (Tuerena et al., 2021b), and for comparison the trend line from this Fram Strait study is shown as a dotted line in Fig. 10. In Kongsfjorden and Rijpfjorden, most fjordic samples do not show the linear trend conforming to Rayleigh fractionation. Deviation from the linear relationship increases landwards within the fjord, where innermost stations show a slope near 0 (Fig. 10). This suggests that the isotopic signatures of nitrate are not governed by assimilation processes alone and that mixing between marine and terrestrial nitrate sources influence isotopic signals significantly. Nutrient dilution effect from freshwater input can be ruled out as salinity alone could not explain the isotope effect in Fig. 10 (see Fig. A4 for justification). Additionally, the terrestrial source is significantly lower in δ15N as the trends indicate lighter signatures with proximity to land in both fjords (Fig. 10). Importantly, the lowest δ15N signatures with no slope are found in the Kongsfjorden glacial front samples where terrestrial inputs of P and Si are identified (Fig. 8). The remnants of winter cooled waters at Kronebreen and Kongsbreen (Halbach et al., 2019; Hopwood et al., 2020) have distinctly lighter isotopic values (δ15N-NO of 3.9–4.3 ‰) relative to the rest of the fjordic samples indicating a larger contribution from terrestrial sources rather than marine sources (AW δ15N-NO of 5.1 ± 0.1 ‰; Tuerena et al., 2021b) causing significant deviations from uptake-dominated fractionation trends. Meanwhile, the epsilon value of the remaining fjordic samples (ε=1.8 ‰) can be approximated to that in salinity-stratified PSW and in northern Barents Sea (ε=2 ‰; Tuerena et al., 2021b).
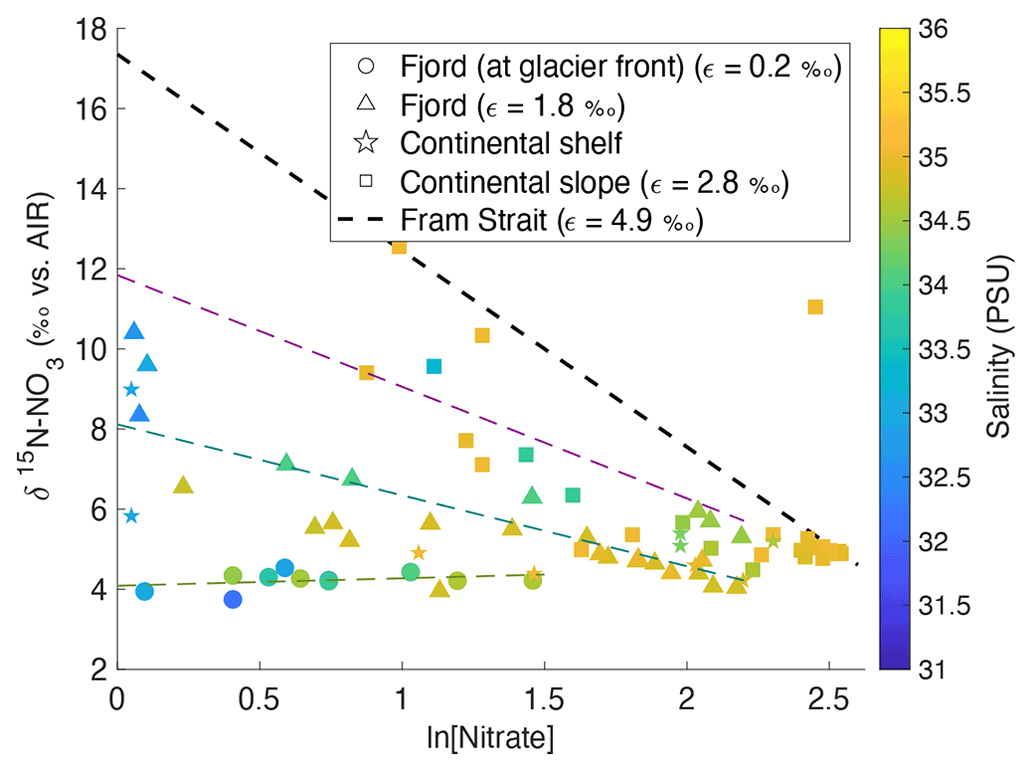
Figure 10δ15N-NO3 vs. ln (nitrate concentration) in the top 600 m in Kongsfjorden (NP2017, triangles; NP2018, circles) and Rijpfjorden (NP2017, squares) with salinity as a third variable. Shapes represent locations, namely at glacier fronts (circles), fjord (triangles), continental shelf (stars) and slope (squares). The gradients of the regression lines are representative of fractionation factor (ε) for samples at glacier front (dotted light green line, ε= 0.2 ‰), fjord (dotted dark green line, ε= 1.8 ‰) and continental slope (dotted magenta line, ε= 2.8 ‰). The regression line for continental shelf samples was excluded due to insufficient data points. Dotted black line represents biological assimilation in Fram Strait where ε is equal to 4.9 ‰, as reported in Tuerena et al. (2021b). Equation of the line () was estimated knowing that the gradient was equal to 4.9 and assuming initial δ15N-NO of 5.1 ‰ and initial nitrate concentration of 11.8 µM, as reported in Tuerena et al. (2021b). Note: standard deviations of the isotopic values reported are 0.33 ‰ and 0.47 ‰ for δ15N and δ18O, respectively.
A plot of δ15N-NO vs. δ18O-NO with depth as the third variable is shown in Fig. 11a. Data from Kongsfjorden and Rijpfjorden show three clear trends. Firstly, data from Kongsfjorden – with the exception of glacier front stations – and data from the continental slope outside of Rijpfjorden showed a positive correlation (R2 0.98, p value ≤0.05) with a slope close to 1, whereby isotopic signatures are heavier at shallower depth (Fig. 11a). This is indicative of nitrate assimilation by phytoplankton which fractionates both isotopes equally, that is δ15N-NO: δ18O-NO ratio approaching 1 (DiFiore et al., 2009; Sigman et al., 2009a). Although it is inferred that biological uptake mainly determines the isotopic trends in these samples, the slight deviation from 1 (ca. 0.8) may also result from simultaneous uptake and recycling. During recycling, δ18O of nitrate gets reset closer to water values with an added isotopic fractionation effect of 1.1 ‰ (Buchwald et al., 2012; Sigman et al., 2009a). In these fjordic settings, δ18O is estimated to be ca. 0.3 ‰ according to the equation δ18O–18.42 derived for Kongsfjorden (Tiwari et al., 2018) using the average salinity (S) of 34.8 ± 0.006 PSU in the winter cooled waters. For comparison purposes, another δ15N-NO3 vs. δ18O-NO3 plot is presented (Fig. 11b) using only stations from the continental shelf and slope of Kongsfjorden, as well as from eastern Fram Strait. Data show a positive correlation (R2 0.77, p value ≤ 0.05) with a slope of 0.8, with δ18O-NO3 values clustering at 2.0 ± 0.6 ‰ and at 4.9 ± 0.2 ‰ for δ15N-NO; these values are indicative of the initial isotopic signatures of the marine endmember. A comparison of Fig. 11a and b, reveals that the slope of the line from Kongsfjorden samples is similar to the slope of offshore and Fram Strait samples (∼ 0.8). In summary, biological uptake is the most likely determinant of the isotopic trends in these samples.
However, as expected, the glacier front stations in Kongsfjorden deviated significantly from the 1:1 line, with δ15N-NO values clustering around 4.3 ± 0.1 ‰, and meanwhile, δ18O-NO ranged from 2.3 ‰ to 6.5 ‰ (Fig. 11a). This deviation was caused by relatively light δ15N-NO and enriched δ18O-NO signatures, which were derived from terrestrial sources, in comparison to other fjordic stations. In addition to the deviation from 1:1 relationship, isotopic values of these samples did not show any linear trend. This indicates source dominance rather than uptake. These samples were previously identified within the glacial discharge plume (S<33.5 PSU) with high silicate values deviating from the Si : N line (Fig. 8b). These samples incorporate terrestrial nitrate source signatures which are rapidly lost away from the glacial plume through biological uptake.
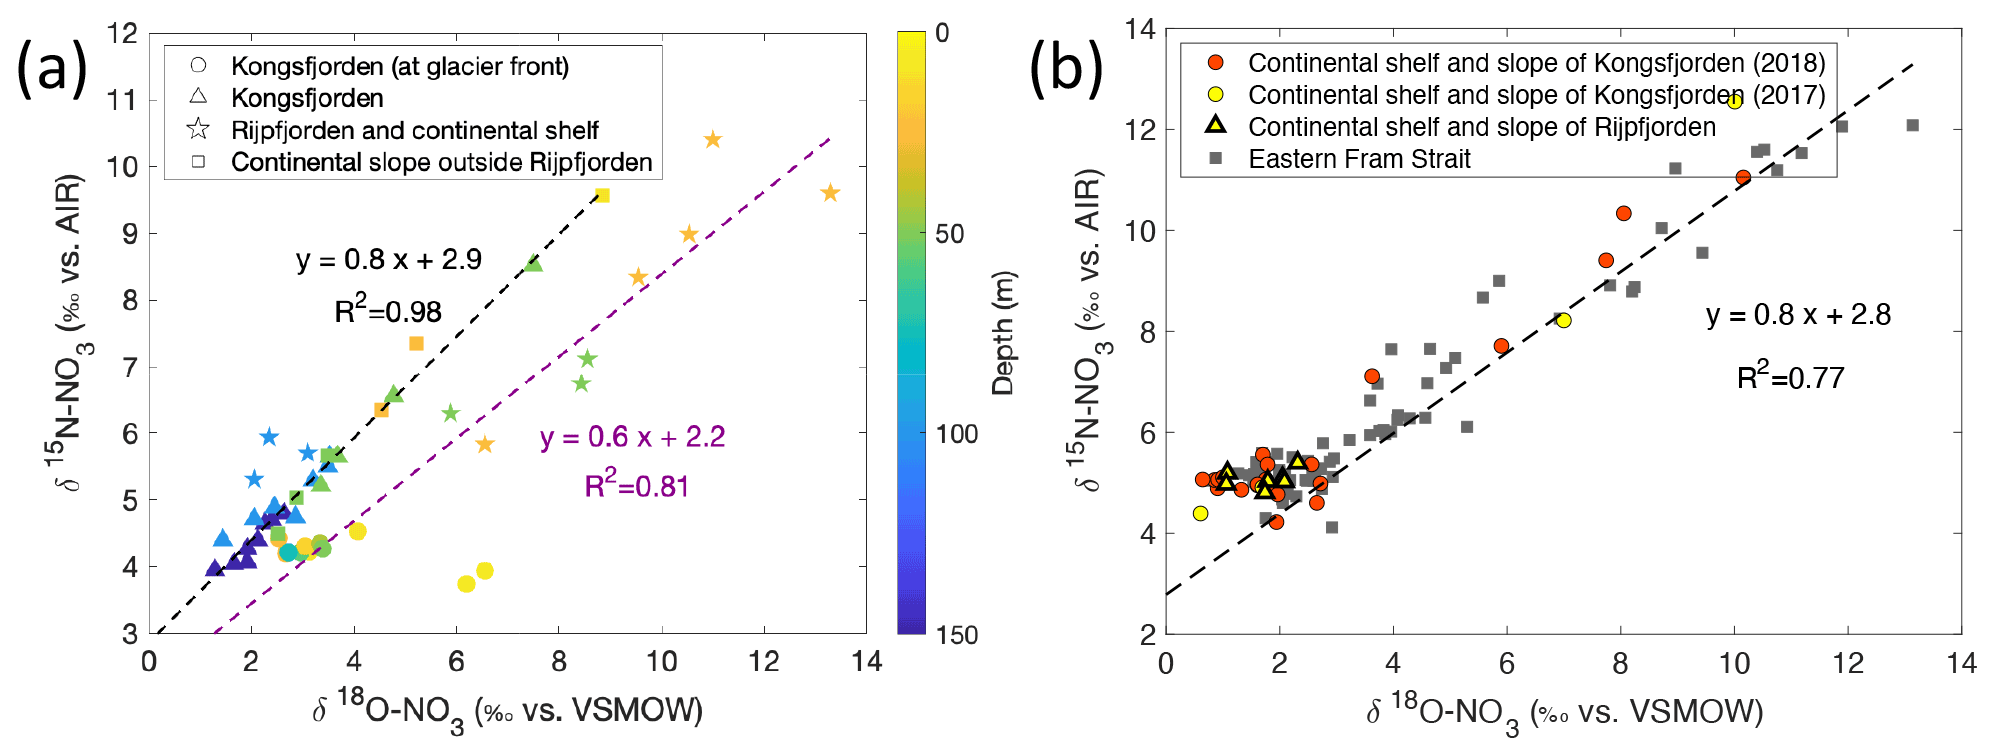
Figure 11Correlation of δ15N-NO3 vs. δ18O-NO3. (a) δ15N-NO3 vs. δ18O-NO3 and regression line (dashed line) for data reported in Kongsfjorden (NP2018, NP2017) and Rijpfjorden (NP2017). In (a) colour coding corresponds to depth, and shapes represent different locations (at glacier fronts (◦), Kongsfjorden (△), Rijpfjorden and its continental shelf (⋆), and continental slope outside of Rijpfjorden (□)). Note that for the shelf and slope of Rijpfjorden, samples affected by AW intrusion were excluded. Dashed black line is the regression line for all Kongsfjorden (NP2017–2018) and continental slope stations outside of Rijpfjorden (not influenced by AW). Dashed purple line is the regression analysis for all Rijpfjorden and continental shelf surface values (not under the influence of AW). (b) δ15N-NO3 vs. δ18O-NO3, using data from all stations offshore of Kongsfjorden (continental shelf and slope – NP2018, red circles; NP2017, yellow circles), stations under AW influence offshore of Rijpfjorden (continental shelf and slope, yellow triangles) and from eastern Fram Strait (JR17005 and FS2018; dark grey squares). Dashed black line is the regression line taking data from all offshore data (NP2018, NP2017, JR17005 and FS2018). All p values ≤ 0.05. Note: Rijpfjorden samples under AW influence include shelf stations (i.e. R4, R5) below 25 m depth and slope stations (i.e. R6, R6B and R7B) below 100 m. Note: regression results are in Table B1. Standard deviations of the isotopic values reported in (a) and (b) are 0.33 ‰ and 0.47 ‰ for δ15N and δ18O, respectively.
In Fig. 11a, fjord and continental shelf samples at Rijpfjorden also deviated from the 1:1 line – falling on a slope of 0.6 (R2 0.81, p value ≤ 0.05). Interestingly, the extension of the line of best fit of Rijpfjorden data crosses the cluster of data points comprising the glacier front Kongsfjorden stations (i.e. the terrestrial endmember signature). However, the samples themselves do not fall within the cluster and instead show enriched isotopic signatures. This is indicative of the input of terrestrial nitrate in Rijpfjorden with relatively light δ15N-NO and enriched δ18O-NO signatures similar to the glacial plume samples of Kongsfjorden but subsequently modified by uptake and recycling as described below.
Unlike Kongsfjorden, nitrate is not completely depleted in Rijpfjorden indicating partial nitrate utilisation which leads to heavy residual nitrate signatures where δ18O-NO reaches values as high as 14 ‰ and δ15N-NO up to 10 ‰ (Fig. 11a). The lower gradient (0.6 instead of 0.8) is indicative of partial uptake and regeneration. The partial uptake leads to heavy signatures of δ15N-NO and δ18O-NO, but simultaneous recycling forces δ18O towards lower values close to δ18O. This δ18O can be assumed to be the same in both fjords (0.3 ‰). Thus, isotopic composition reveals the importance of the terrestrial nitrate source in both fjords, as well as differences between the two fjords in the way nitrate is consumed and recycled.
In Kongsfjorden, nitrate uptake is complete with near-zero nitrate values above the halocline with the exception of those in proximity to the subglacial plume at the glacial front. When nitrate is present it reflects the additional terrestrial source and its isotopic signature. In contrast, nitrate is not fully consumed in near-surface waters of Rijpfjorden leading to significant isotopic fractionation. There, the isotopic trends in Fig. 11a – where the fractionation line passes through the glacial plume samples representing terrestrial endmember in this setting – suggest a significant terrestrial nitrate contribution in Rijpfjorden which is subsequently masked by mixing with partially utilised nitrate. This partly explains why the terrestrial source signatures with low δ15N-NO signature, evident in Kongsfjorden, are not as obvious in Rijpfjorden (Fig. 11a). The difference in nitrate utilisation suggested above in these two fjords can arise from the nature of circulation in these fjords which is discussed in detail below in the context of the role of the subglacial plume in nutrient dynamics.
4.3 The role of the subglacial plume in nitrate use and cycling
The difference in nitrate utilisation suggested above in the fjords can arise from the nature of circulation in these fjords and the difference in light limitation resulting from surface and subsurface discharge. In Rijpfjorden, the fjord stations show strong freshwater stratification, and the fresher water is confined to a shallow surface layer resulting from surface discharge from rivers (Figs. 3b, 5b). In contrast, at the glacial front of Kongsfjorden meltwater influences a larger depth in the water column with less fresh surface waters (Figs. 2b, 4b, A2). This reflects the presence of the subglacial plume in Kongsfjorden where the plume rises from the grounding line of tidewater glaciers at 60 m depth (Darlington, 2015) increasing mixing between meltwater and the entrained saltwater over a larger depth range near the surface (Everett et al., 2018). This is in agreement with a previous study which documented the plume to extend to 40 m depth in this fjord (Torsvik et al., 2019). It is worth noting that the meltwater plume in Kongsfjorden is mainly subglacial freshwater as opposed to glacial surface melt (How et al., 2017).
Importantly, the magnitude of the effect of the subglacial discharge and glacier front plume in Kongsfjorden varies spatially along the glacial front owing to topographical differences along Kongsbreen (Kb6–7) and Kronebreen (Kb5) transects. Along both fronts, a distinct cool and saline water mass was identified as remnant winter cooled waters formed due to heat loss to the atmosphere and contact with the glacier front (De Rovere et al., 2022). Studies by Torsvik et al. (2019) attributed the presence of this water mass in Kongsfjorden to its entrainment and elevation by the glacial plume dynamics. However, along Kronebreen front these winter cooled waters undergo mixing with fjord water as shown by temperature above 3.5 ∘C and salinity above 33.5 PSU at 20–35 m depth (Fig. 4a, b), and the presence of the subglacial discharge at the glacier front plume is less distinct. At Kronebreen front, mixing associated with the plume is topographically unconstrained – as opposed to in Kongsbreen – as it is wider, thus allowing lateral water movement (Torsvik et al., 2019). The lack of mixing below 35 m depth is explained by a topographic barrier that restricts the exchange of water masses as suggested by particle analysis (Torsvik et al., 2019).
Whether the release of glacially eroded, entrained sediments (Elverhøi et al., 1983; Trusel et al., 2010; Kehrl et al., 2011) occurs through surface or subsurface discharge can impact light limitation. Rijpfjorden experienced direct surface discharge release through glacially fed rivers (Wang et al., 2013). This surface release of sediments is expected to encourage stronger light limitation at the surface than subsurface discharge, as suspended sediments remain near the surface due to strong stratification (Cowton et al., 2015; Carroll et al., 2015, 2016). Near-zero fluorescence values in the inner fjord of Rijpfjorden support the theory that productivity could be hindered by light limitation. In contrast, in Kongsfjorden, turbidity associated with sediment discharge is subject to dynamic mixing associated with subglacial plumes (Cowton et al., 2015; Carroll et al., 2015, 2016) which invigorate vertical mixing and lateral exchange of water. In such a dynamic setting, with weak stratification, the turbidity caused by glacially eroded sediments is relatively more dispersed, increasing light penetration away from the plumes which facilitates plankton blooms (Calleja et al., 2017). Such tidewater glacier-related circulation dynamics have been documented in Kongsfjorden (Darlington, 2015; How et al., 2017; Schild et al., 2017; Halbach et al., 2019). The longer residence times and the dynamic circulation associated with tidewater glaciers in Kongsfjorden lead to the complete utilisation of nutrients at the surface and recycling at depth within the fjord (i.e. increased regenerated nutrient storage), inhibiting the export of nutrients offshore. In Rijpfjorden, light limitation retards nutrient utilisation (Torsvik et al., 2019) leading to only partial use as suggested by the isotope data. Moreover, the differences could also result from delayed nutrient utilisation in Rijpfjorden compared to Kongsfjorden due to its more extensive ice cover. Other additional factors could be the shallower depth of Rijpfjorden and thus shorter residence time, which facilitates shelf exchange before nutrients are fully utilised (Straneo and Cenedese, 2015; Morlighem et al., 2017). This increases the opportunity for exporting the heavy, partially utilised nitrate from Rijpfjorden into the shelf where it can be subsequently utilised and enhance primary productivity.
As a final note, the scenario described for Rijpfjorden is representative of what is happening in Greenland and other Arctic fjords that are currently experiencing tidewater glacier retreat onto land (Nuth et al., 2013; Meire et al., 2017; Kanna et al., 2018). The implication is that, with increasing Atlantification and warmer AW in the future, AW intrusion in Arctic fjords will strengthen and thus encourage tidewater glacier retreat. This will favour surface discharge of terrestrial nutrients and less dynamic circulation, leading to light limitation and retarded use of nutrients and, ultimately, aiding the export of nutrients offshore. The significance of this stems from the fact that the Greenland ice sheet and its associated tidewater glaciers have been suggested to be an important source of nutrients to the wider Arctic Basin and thus exert an important control on overall Arctic net primary production (Hawkings et al., 2015), with terrestrial nutrient inputs currently estimated to support 28 %–51 % of net primary production basinwide (Nuth et al., 2013; Terhaar et al., 2021). It is worth noting some differences between Svalbard and Greenland settings. Some Greenland fjords have very deep tidewater glaciers and receive smaller terrestrial N inputs due to less soil; thus marine sources of nutrients could be relatively more important (Cape et al., 2019).
4.4 Fingerprinting terrestrial N source signatures and contributions to N inventory
In a fjordic setting, various sources of terrestrial nitrogen are discharged and mixed with marine sources, subjected to varying degrees of uptake and recycling with the fjords and the residual exported to the shelf. Previous studies show that terrestrial N inputs exhibit high seasonality, often peaking in the summer months (McGovern et al., 2020), and have δ15N-NO values typically ranging from 0 to 5 ‰ (Holmes et al., 2012; Sigman and Fripiat, 2019). Snowpack melting and release of nitrate from atmospheric sources also have significant implications for the isotopic signatures. The snowpack acts as a sink for 15N-depleted atmospheric reactive nitrogen (δ15N-NO: ∼ −6.5 ‰) (Heaton et al., 2004; Björkman et al., 2014; Vega et al., 2015). Some studies highlight the role of nitrification and nitrified ammonium from a variety of sources to be an additional contributor of nitrate from melting snowpack (Hodson et al., 2005; Wynn et al., 2007; Halbach et al., 2019). Other terrestrial inputs, such as tidewater glacier melting, may contain N from bird faeces (δ15N-NO, ∼ 8 ‰; Skrzypek et al., 2015) and N from microbial degradation of organic matter in the glacier ice (D'Angelo et al., 2018), which can contribute to moderately N-rich meltwater runoff (Shi et al., 2018). Although N2 fixation in diazotrophic bacteria has been reported in the Arctic regions (Blais et al., 2012; Zehr and Capone, 2020), including the glacial environment of Svalbard (Telling et al., 2011), the magnitude of this source remains poorly constrained. Low isotope values of δ15N-NO have been attributed to terrestrial N2 fixation in Svalbard (∼ −0.5 ‰) (Skrzypek et al., 2015).
The isotopic studies indicate significant terrestrial N inputs in both fjord systems considered. In Kongsfjorden, the glacier front samples identified with terrestrial sources of nitrate have isotopic signatures that do not show evidence for uptake and isotopic fractionation. These samples have δ15N-NO values clustering around 4.3 ± 0.1 ‰, and meanwhile, δ18O-NO ranges from 2.3 ‰ to 6.5 ‰. Although the isotopic signature of the terrestrial N is masked by mixing and partial use of nitrate in Rijpfjorden, the isotope fractionation trend line passes through the glacial front samples of Kongsfjorden, indicating similar terrestrial source signatures in both fjords (Fig. 11a). This provides the opportunity (1) to identify the origin of terrestrial sources and (2) to delineate the terrestrial and marine component of N in the upwelling plume at the glacial front.
High δ18O-NO values (60 ‰–86 ‰; Heaton et al., 2004) have been reported within atmospherically deposited nitrate related to ozone-depleted air in Svalbard's snowpack (Björkman et al., 2014). Meanwhile low δ15N-NO in snowfall has been attributed to long-range atmospheric transport deposition over the Arctic Ocean (δ15Nsnowfall of −4 ‰; Heaton et al., 2004; Vega et al., 2015). In general, nitrate from this source is expected to have lighter δ15N and heavier δ18O relative to marine values (δ18O-NO of 2.0 ± 0.6 ‰ and δ15N-NO of 4.9 ± 0.2 ‰; Fig. 11b; Appendix C). In this regard it is important to note that during warm summers as much as 50 % of the annual snowpack accumulation in Svalbard may melt (Pohjola et al., 2002). Therefore it is expected that the dominant terrestrial source could be melting of seasonal snowpacks and glacier ice because it acts as a sink for atmospheric reactive nitrogen with high δ18O-NO and low δ15N-NO signatures as previously mentioned (Björkman et al., 2014; Vega et al., 2015). The predominance of this source is consistent with the isotopic composition (lighter δ15N and heavier δ18O) of nitrate in the Kongsfjorden glacial front and from the intersection of the line of best fit at Rijpfjorden through these data (Fig. 11a).
An additional contributor of nitrate from melting snowpack is nitrified ammonium (Hodson et al., 2005; Wynn et al., 2007; Halbach et al., 2019). However, this ammonium-sourced nitrate is lighter (δ15N = −4.4 to −3.5 ‰, δ18O = -0.3 ‰; Wynn et al., 2007). Other terrestrial inputs such as bird guano would enrich the δ15N-NO signature in the fjord (ca. 8 ‰; Bokhorst et al., 2007; Szpak et al., 2012; Skrzypek et al., 2015). We regard these as minor sources as they cannot produce the combination of light δ15N (4.3 ± 0.1 ‰) and heavy δ18O values (2.3 ‰–6.5 ‰) that we recorded at the glacial front stations. In particular the heavy δ18O values (2.3 ‰–6.5 ‰) recorded in the glacial front can only come from atmospherically deposited nitrate in ice packs subsequently transported through meltwater discharge.
Overall, the δ15N-NO value of 4.3 ± 0.1 ‰ (Fig. 11a) could be considered as nitrate sourced from the upwelling plume. The influence of biological uptake in the glacier front discharge plume is expected to be low as high suspended matter hinders light penetration and phytoplankton production in the plume regions (Kumar et al., 2018). This is supported by very low chlorophyll contents (<0.8 mg m−3, this work), and high mineral matter load in GF/F filters supports this contention. The fact that the δ15N-NO values strongly cluster around 4.3 ‰ without any relationship to nitrate concentration as would be expected from uptake also supports this (Fig. 10). However, the plume dynamics involve some degree of mixing with marine sources due to entrainment of underlying marine waters. This mixing is evaluated below.
In Kongsfjorden, the published terrestrial endmember value for δ15N-NO is 3.5 ‰ (Kumar et al., 2018). This number is derived from a dual C and N isotope mixing model based on Kongsfjorden sediments. Thus the 4.3 ‰ value evident for δ15N-NO at the fjord front can be regarded as an admixture of terrestrial N (ca. 3.5 ‰; Kumar et al., 2018) and marine sources (ca. 5.1 ± 0.1 ‰; Tuerena et al., 2021b) in equal proportions ( = 50 ± 3 %). Note that the marine endmember of 5.1 ± 0.1 ‰ (Tuerena et al., 2021b) is used in the mixing calculation instead of that estimated from continental shelf and slope samples (4.9 ± 0.2 ‰; Fig. 11b) as it is a better representation of pure AW signal, while the latter is likely altered by advected terrestrial nutrients from the glacier front. The glacial front samples containing marine N in equal proportion to terrestrial N is consistent with entrainment and mixing that occurs during upwelling of the subglacial plume that draws nitrate from remnant winter cooled waters through lateral mixing as suggested by recent studies at Kronebreen and Kongsbreen fronts (Halbach et al., 2019; Hopwood et al., 2020).
Additionally, the contribution of terrestrial vs. marine sources to the overall nutrient inventory of Kongsfjorden can be estimated. Using the average δ15N value calculated from fjord basin samples below 100 m of 4.4 ± 0.3 ‰ δ15N-NO (Fig. 4i) and avoiding isotopic fractionation during phytoplankton assimilation, which is evident in shallower samples, this value provides an estimate of marine contribution of ( =) 56 ± 3 %. Thus marine contribution gains some importance, and terrestrial inputs remain significant (44 ± 3 %).
Errors in these estimates stem from applying annually integrated terrestrial endmember estimates from sediments to water column snapshots of marine and terrestrial mixing documented during this study. For example, terrestrial inputs from early-season melt will give signatures closer to snowmelt, while late season incorporates heavier values due to denitrification in waterlogged soils and pockets of local anoxia in glaciers and stronger washout of guano (Wynn et al., 2007; Hayashi et al., 2018). These processes can also have large spatial variability within the ice pack (Ansari et al., 2013). Nevertheless, this assessment indicates that terrestrial sources of N make an important contribution to the dissolved pool of nitrate in the glacial front, as well as to the water column N inventory, of the fjord.
In summary, we conclude that (i) snow and ice melt are the major sources of terrestrial nitrate to these fjords, (ii) at the glacial front, the nitrate is sourced from an equal admixture of terrestrial and marine sources, and (iii) the terrestrial contribution remains significant to the whole fjord nutrient inventory even when considering deep waters. The prevalence of terrestrial N contribution at depth can be explained by N regeneration from sinking organic matter. Winter convection can also mix terrestrial N to the deep water, but this source is likely to be small. In the next section, nutrient regeneration is quantified relative to winter convection, which will allow the relative contribution of terrestrial vs. marine nutrients to overall fjord productivity to be understood.
4.5 Terrestrial N contribution to primary productivity in Kongsfjorden during the summer
Terrestrial inputs are an important contributor to the nutrient pool in the fjords, but what is its relative contribution to productivity in the fjord? To estimate this we use the WCW in Kongsfjorden, which occupies the deep basin between the land and the sill and has the longest residence time in Kongsfjorden as illustrated by high AOU and low oxygen saturation (Fig. 2d, e; Svendsen et al., 2002). Given low WCW renewal rates, this water mass should have received a prolonged supply of regenerated nitrogen via settling particulate organic nitrogen with limited physical exchange with the surface, and the isotopic signatures are not affected by biological uptake since water mass formation. We can therefore use WCW to quantify the terrestrial contribution to productivity in the fjord as seen in the integrated regenerated nitrate pool and the preformed nitrate pool inherited by the water mass during formation through winter convection using dual isotopes of N and O.
This methodology exploits the difference in isotopic fractionation engendered during remineralisation and nitrification processes. The principle enabling this calculation is that, while the δ15N of remineralised NO records isotopic signatures of reactive N assimilated at the sea surface, δ18O of remineralised NO is reset close to that of ambient water in which regeneration occurs (see Appendix C). Using δ18OWCW (1.9 ± 0.2 ‰) measured in this study, ambient water δ18O ‰ estimated in Kongsfjorden (Tiwari et al., 2018) and δ18OAW=2.8 ± 0.3 ‰ previously measured for Atlantic waters outside Kongsfjorden (Tuerena et al., 2021b), we estimate 65 ± 15 % of the nitrate in the WCW is regenerated (see Appendix D for more details). Furthermore the estimated N isotopic composition of this remineralised nitrate (δ15Nreg: 3.7 ‰–4.1 ‰; Appendix D) demonstrates a major contribution of terrestrial sources (63 %–88 %) to fjord primary productivity and recycling as opposed to marine sources (12 %–37 %) (summarised in Table 1). The higher proportion of terrestrial N in the regenerated N pool demonstrates its importance to primary production in the fjord and reflects the fact that terrestrial sources are supplied directly above the halocline throughout the summer growing season, whereas uptake of marine nutrients is hindered by the strong halocline that develops during the summer. This should be considered as a very broad estimate given the uncertainties associated with δ15Nreg estimates. These include (i) limited sampling points in WCW (n=3), (ii) empirical data used as an approximation of δ18OAW and , and (iii) the percentage of regenerated nitrate (65 ± 15 %). Nevertheless, these estimates demonstrate the importance of terrestrial N inputs in supporting productivity (63 %–88 %), while advection of marine nutrients is an important contributor (56 ± 3 %) to the overall N inventory of Kongsfjorden (Hegseth et al., 2019). The former is consistent with McGovern et al. (2020) showing the important influence of terrestrial nutrients on fjord productivity in Svalbard. The latter conclusion is supported by Hegseth et al. (2019).
Table 1Summary of isotopic signatures (‰), endmember values (‰), and terrestrial and marine contributions (%) calculated in Kongsfjorden.
One important aspect of this conclusion is that terrestrial N sources account for 63 %–88 % of fjord productivity and contribute in similar proportion to the regenerated pool of N in the deep isolated water masses of the fjord. Terrestrial inputs are expected to increase with climate warming and with the relocation of N held in soils and permafrosts (Vonk et al., 2015). Such enhanced terrestrial N inputs will have a direct effect of increasing surface productivity, the pool of regenerated/recycled N and the fjord N inventory. Such enhanced N cycling in extreme conditions would result in oxygen depletion of the isolated water masses such as the WCW. An added effect is the retreat of tidewater glaciers and absence of vigorous lateral circulation associated with subglacial plumes, which can further inhibit mixing, increase isolation of deep water masses and cause an expansion of oxygen-depleted waters.
4.6 Future changes
Our results and analysis suggest that terrestrial N inputs contribute to nearly one-half of the summer nitrate inventory in these fjords and support a large proportion of the productivity in summer due to its input to the surface stratified layer. Secondly, the presence or absence of a subglacial plume can influence the relative use of nitrate within the fjord and its exchange with the open ocean. Both of these aspects are subject to future change.
It is expected that future warming will increase the source and magnitude of terrestrial inputs with key implications for the nutrient inventory, fjord primary productivity and nutrient export offshore. Permafrost melting is likely to gain importance, mobilising nutrients and in turn increasing terrestrial input into the marine environment (Vonk et al., 2015). This study shows that terrestrial N contributions account for nearly half of the N inventory, and much of the productivity in Kongsfjorden and, therefore, future increase in terrestrial N supply is likely to increase productivity, as well as the storage and cycling of N within Arctic fjords.
Table 2Summary table of present conditions and future predictions of Kongsfjorden's and Rijpfjorden's hydrology and nutrient cycling characteristics.
This comparative study between two fjords illustrates the importance of tidewater glaciers in nitrate use and cycling within the fjords. The widespread retreat of tidewater glaciers in the Arctic and Greenland (Østby et al., 2017; Slater et al., 2019) has important implications for N exchange between fjords and the open ocean. It is expected that tidewater glaciers will retreat in Kongsfjorden to become land-terminating glaciers with strengthening Atlantification and warmer AW (Torsvik et al., 2019). The surface meltwater flow can decrease primary productivity via light and nutrient limitation as documented in the case of Rijpfjorden. Ultimately, given that N is the limiting nutrient in the Arctic Ocean and marine settings in general, this would aid the export of N offshore and contribute to the overall net primary production in the Arctic Ocean (Terhaar et al., 2021).
The broad differences discussed here are likely to change with Arctic settings, for instance in Greenland fjords where terrestrial N supply is limited, due to the lack of N storage in soils, marine N supply is more important (Cape et al., 2019). Here subglacial plumes invigorate marine N supply through upwelling from depth in the fjord, and this fuels much of the productivity (e.g. Meire et al., 2017). The retreat of glaciers can reduce this marine N supply from upwelling thus inhibiting productivity. In the case of Svalbard fjords, terrestrial N supply is significant and is likely to gain further prominence in the future due to the remobilisation of soil and permafrost N. In addition, we show that roughly half the N stored in deep fjord waters is also of terrestrial origin recycled within the fjord. Thus climate change is likely to increase productivity and N cycling and storage within the fjord. However, on longer timescales, if the distance between the fjord and the retreating glaciers becomes large enough, there will be more time for denitrification during transport, which may deplete the nutrient pool before it is discharged into the fjord. Once glaciers fully melt, nutrient inputs will be mainly associated with seasonal snow melt with opportunities for enhanced N cycling and removal in soils potentially reducing nutrient inputs.
Regarding the export of nutrients offshore, climate change can have contrasting results depending on the size of the fjords and its circulation. Increased terrestrial N inputs and freshwater discharge are expected to increase export rather than storage in Rijpfjorden, as unused nutrients are flushed offshore given its shorter residence time. Thus, fjords with fast exchange rates like Rijpfjorden have more potential to alter pan-Arctic productivity as nutrients are exported offshore. In fjords like Kongsfjorden, additional N inputs in the future can increase terrestrial N recycled within the fjord as biological uptake there is more complete. In Kongsfjorden, recycled nutrients are stored in isolated waters such as the WCW, and this pool will increase due to the larger nutrient supply. In addition, the retreat of tidewater glaciers has the effect of reducing mixing in the fjord and potential for increasing retention of winter waters (Torsvik et al., 2019). The combination of greater productivity fuelled by terrestrial N, larger pool of N cycling within the fjord and reduced circulation in the absence of tidewater glaciers can lead to reduced oxygen levels and possibly hypoxia in isolated deep waters of these fjords. The postulated contrasting responses of Kongsfjorden and Rijpfjorden to climate change are summarised in Table 2.
Kongsfjorden and Rijpfjorden are highly influenced by terrestrial nutrient inputs of N, P and Si. Particularly, terrestrial nitrate sources are key contributors to the NO pool in the fjords and are roughly equal in proportion to marine contributions from AW. These terrestrial inputs carry excess silicate and phosphate relative to nitrate with respect to marine sources. Nitrate from snowpack and glacier melting are identified as dominant sources of terrestrial NO in both fjords based on high δ18O-NO and low δ15N-NO. In Kongsfjorden, stratification contributes to both nutrient limitations. Biological uptake of these nutrients indicates that nitrate and possibly silicate limit primary production despite terrestrial input. N and Si limitation is partly caused by excess terrestrial P and in the case of Si also through effective removal through the “silicate pump”. In Rijpfjorden, isotopic signatures indicate that nitrate is not fully utilised, which may reflect light limitation and shallow stratification associated with the surface runoff. The contrast in nitrate use in these two fjords is attributed to the nature of meltwater inputs, which is subglacial in Kongsfjorden and surface in Rijpfjorden, and the resulting differences in circulation and stratification. As a result Rijpfjorden contributes terrestrial NO to the coastal sea, whereas in Kongsfjorden terrestrial NO is mainly retained and recycled within the fjord.
Given the significance of terrestrial nitrate sources in Svalbard fjords, it is postulated that continuing Arctic warming and enhanced meltwater discharge and terrestrial NO inputs will impact fjordic primary productivity, as well as the NO exchange offshore. The larger size and vigorous circulation associated with surface glacial plumes currently leads to the complete use of nutrients in surface waters of Kongsfjorden. Here, increase in terrestrial inputs and the retreat of tidewater glaciers due to climate change is postulated to increase productivity and nutrient cycling within the fjord possibly leading to more oxygen depletion in isolated deep waters which may expand given the less vigorous circulation in the absence of the subglacial plume. In contrast, such changes in smaller fjords will lead to conditions akin to Rijpfjorden where surface inputs lead to strong stratification and light limitation which limits NO use and favours the export offshore of unused nutrients. This condition could become more common with ongoing glacial retreat in many small Arctic fjords. The implication is that future increases in terrestrial nutrient inputs in smaller fjords such as Rijpfjorden have a greater potential to enhance primary productivity offshore by exporting the unused nutrients.
Table A1Spatial distribution of the degree of stratification (Δρ, kg m−3) in Kongsfjorden and Rijpfjorden with an indication of location (at glacier fronts, fjord, continental shelf and slope) and stations.
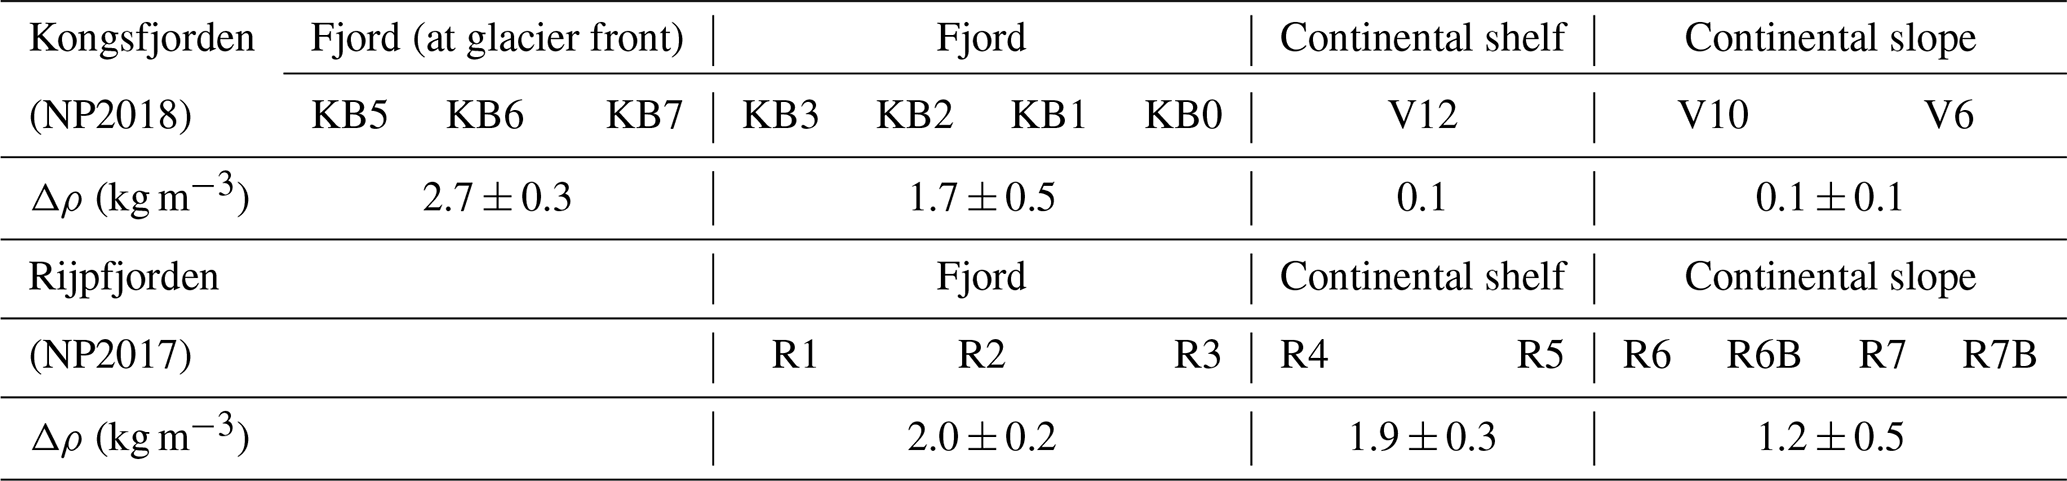
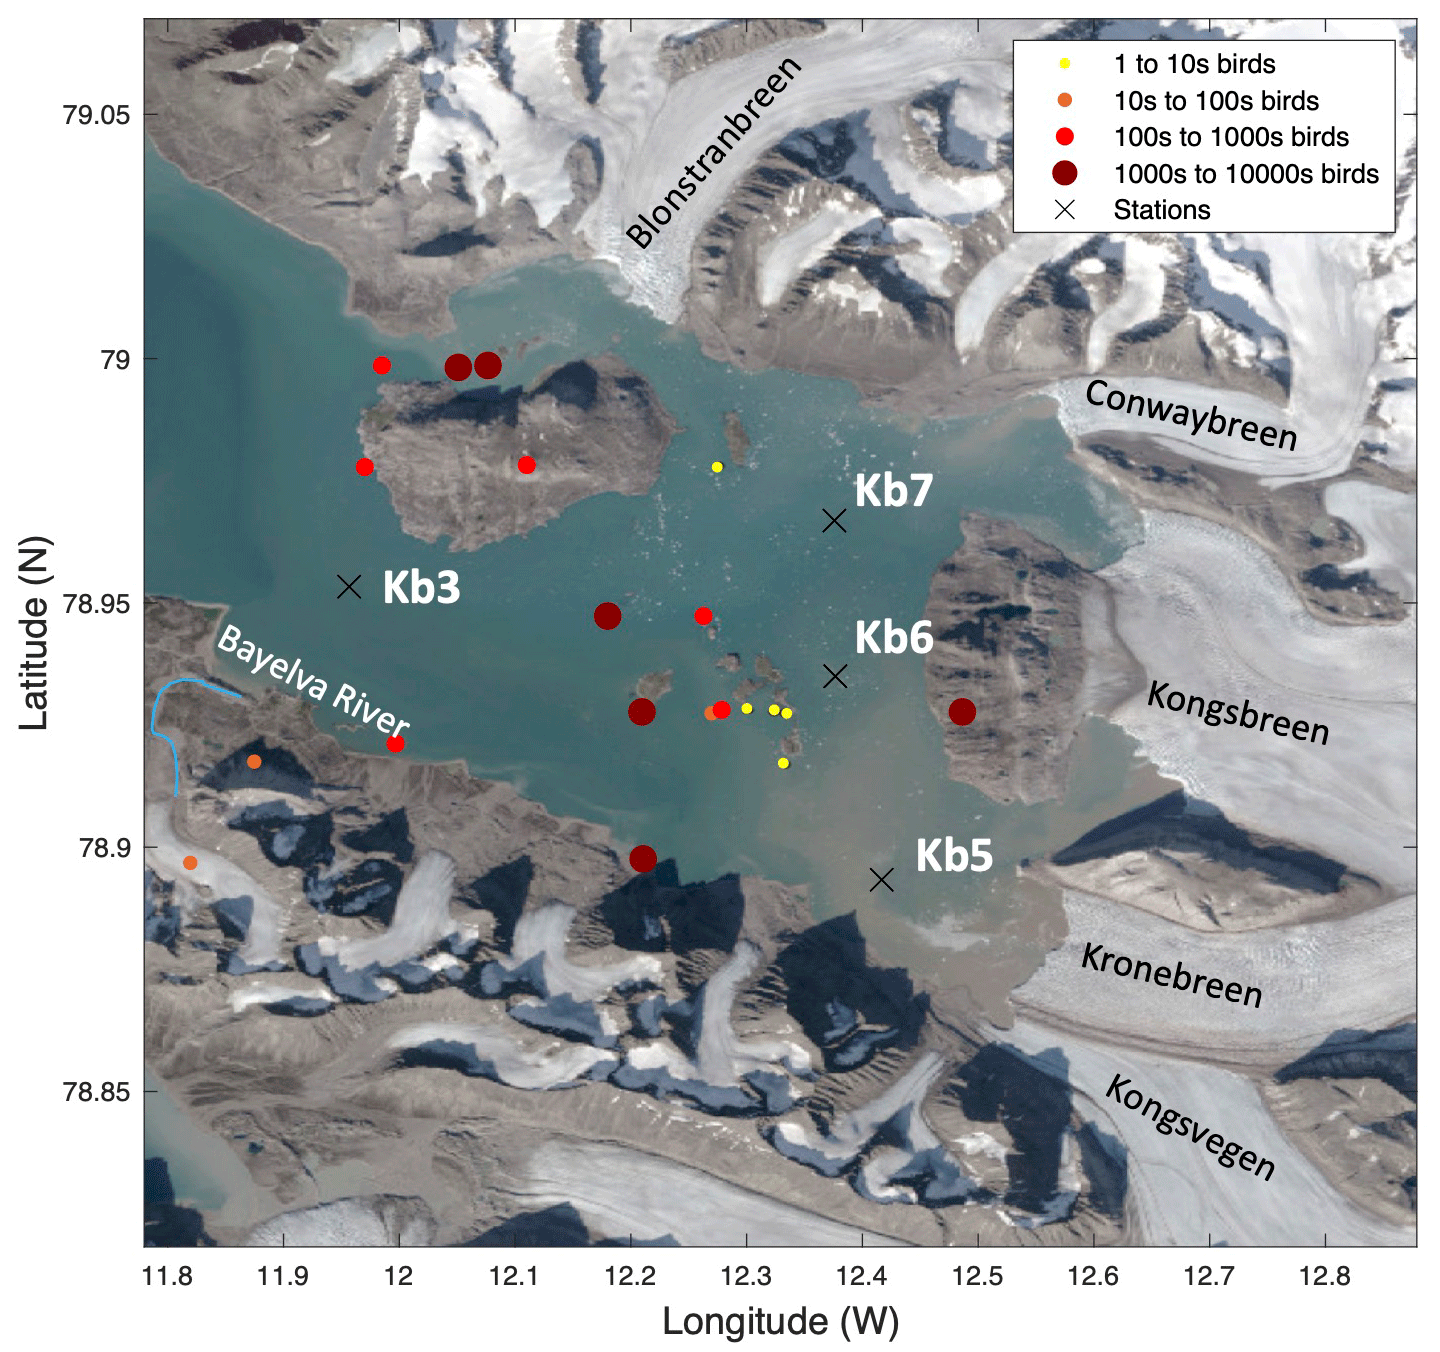
Figure A1Seabird colonies, tidewater glaciers and river in Kongsfjorden, with an indication of the innermost NP2018 stations. Basemap satellite image from the Norwegian Polar Institute (https://geodata.npolar.no/, last access: 13 December 2022). Seabird colony data from Strøm et al. (2008) and glacier names from Meslard et al. (2018).

Figure A2Temperature (θ) and salinity (S) diagrams for Kongsfjorden and Rijpfjorden study areas (a) Temperature–salinity plot for all CTD casts from NP2018 cruise taken in Kongsfjorden. Colours are indicative of different regions along Kongsfjorden; namely light green illustrates the fjordic region at the glacier front (i.e. closest to land), dark green is the remaining stations in the fjord, dark blue is the shelf, and magenta is the continental slope and offshore. Dashed lines represent density (kg m−3). (b) Temperature–salinity plot for all CTD casts from NP2017 cruise taken in Rijpfjorden, Svalbard. Colours are indicative of different regions along Rijpfjorden; namely light green illustrates the inner fjord region, dark green is the outer fjord stations, dark blue is the shelf, and magenta is the continental slope and offshore. Polygons indicate water types. AW, Atlantic Water; AIW, Arctic Intermediate Water; PSW, Polar Surface Water; iPSW, inshore Polar Surface Water; PSWw, warm Polar Surface Water. Marginal plots show density distribution of 1 m binned salinity (x axis) and temperature (y axis) values. Notice how at lower densities (shallower depths) polar surface waters are dominant, whilst AWs are more predominant at greater densities (greater depths). Water mass classification was based on that by Peìrez-Hernaìndez et al. (2017).
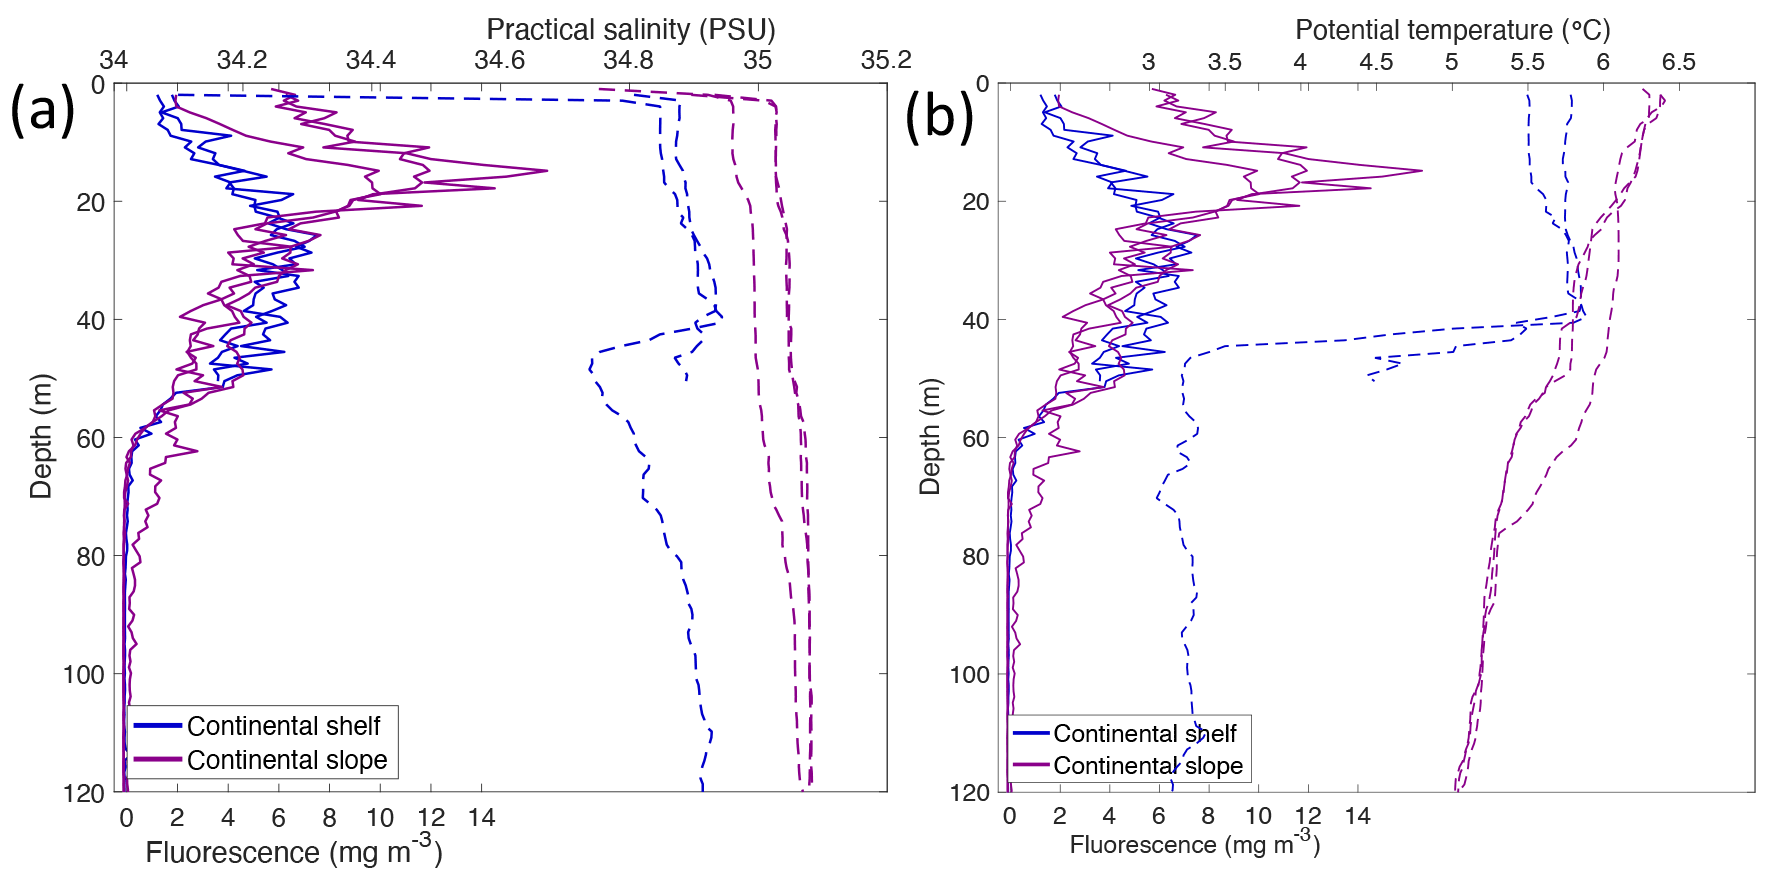
Figure A3Profiles of (a) fluorescence (lines) and salinity (dashed lines) and (b) fluorescence (lines) and temperature (dashed lines). CTD data taken in continental shelf (blue) and slope (magenta) of Kongsfjorden during NP2018.

Figure A4Nitrate concentrations vs. salinity in the top 600 m in Kongsfjorden (NP2017, triangles; NP2018, circles) and Rijpfjorden (NP2017, squares). Colours represent locations, namely at glacier fronts (light green) and fjord (dark green). Note how changes in nitrate concentrations are independent of salinity. Specifically, in (a) changes in salinity are not accompanied by a change in nitrate concentrations and vice versa in (b).
Table B1Regression analyses (i.e. number of observations and p values) for key linear models used in this study with an indication of the figure they correlate to.
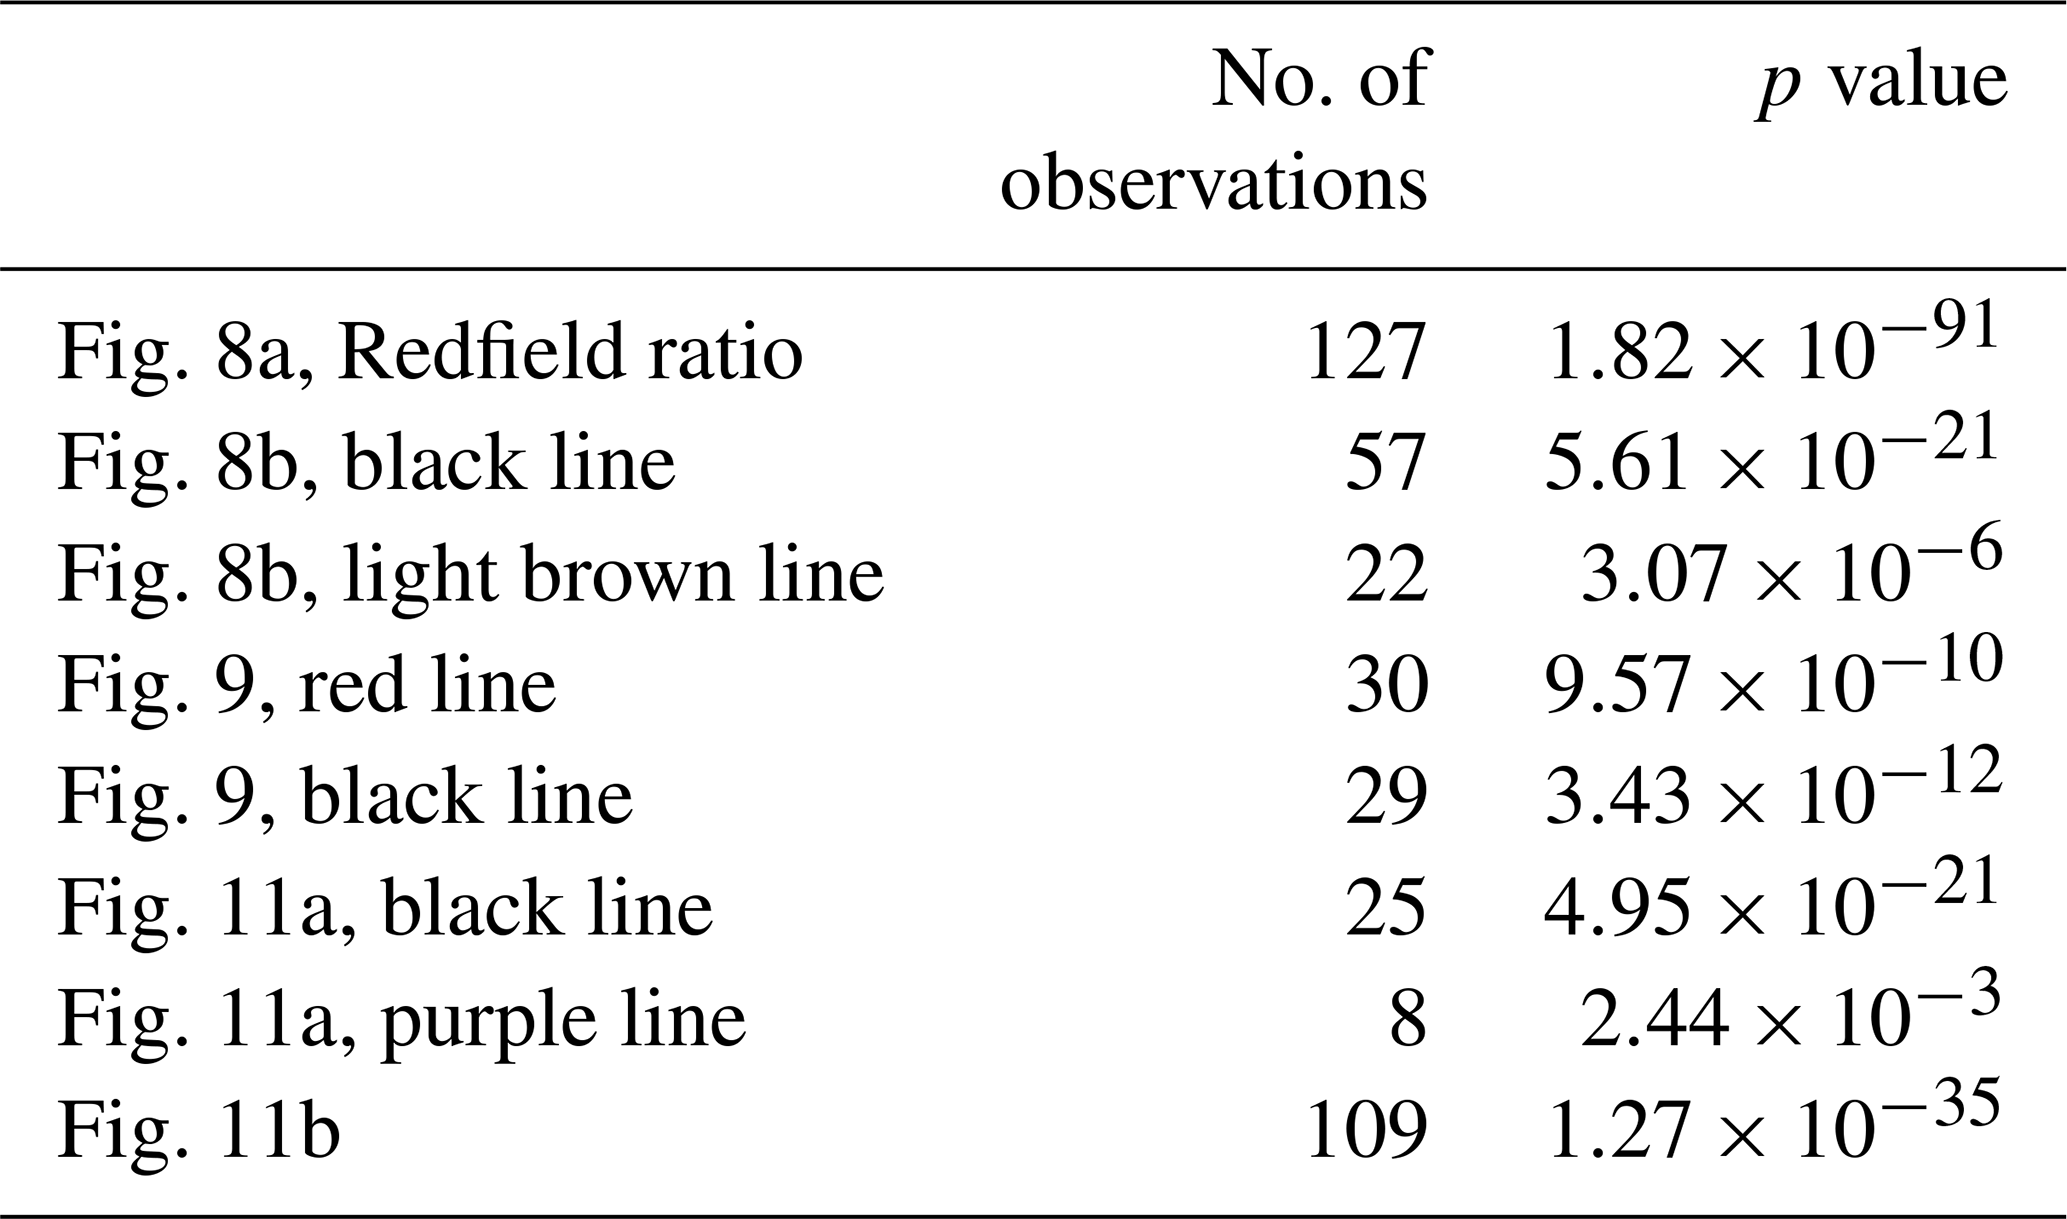
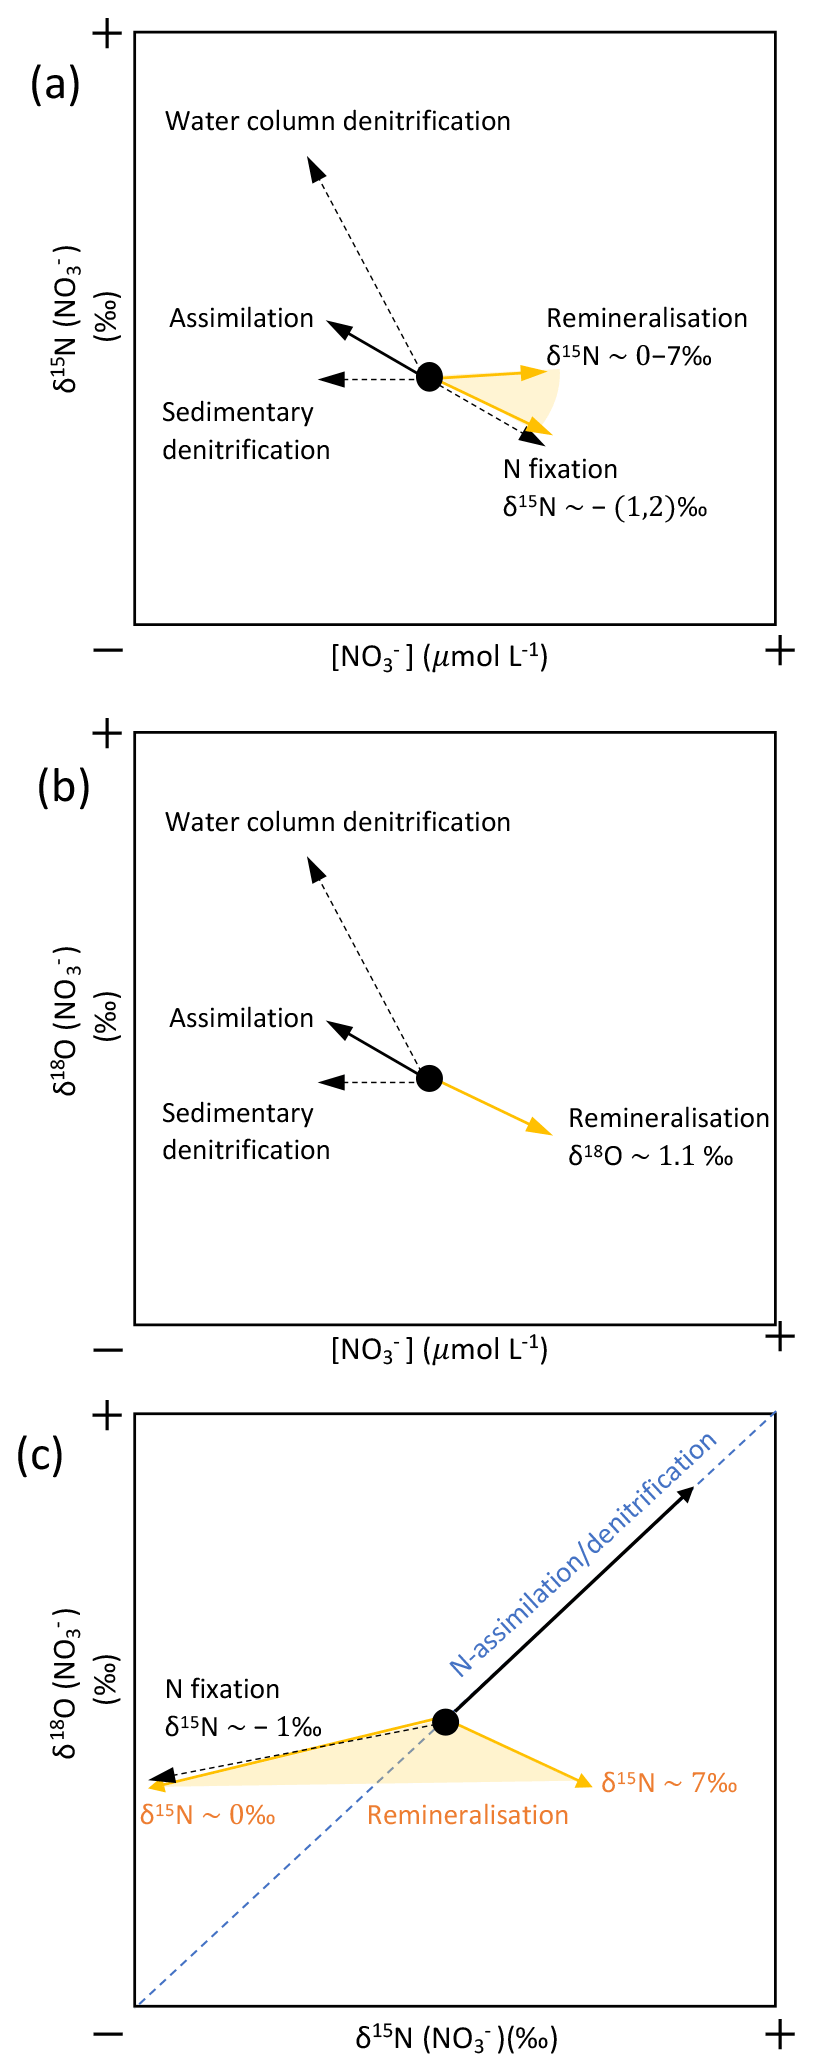
Figure C1The effect of different marine N cycle processes on (a) δ15N-NO and [NO], (b) δ18O-NO and [NO], and (c) δ15N-NO and δ18O-NO. The values of δ15N-NO and δ18O-NO designated by the black dot in (a), (b) and (c) represent global oceanic values, namely 5 ‰ and 2 ‰, respectively. Dashed arrows denote processes that add or remove fixed N from the ocean, while solid arrows denote a component of the internal cycling of oceanic fixed N. In (a), the orange shading represents variation in δ15N-NO caused by the δ15N of the organic N being remineralised. In (c), the dashed blue line represents the 1:1 ratio at which N assimilation and denitrification occur. Moreover, the orange shading represents variation in the δ15N : δ18O ratio of the organic N being remineralised. Compiled from Sigman and Fripiat (2019), Ryabenko (2013), Dähnke and Thamdrup (2013), and Sigman and Casciotti (2001).
Biologically mediated N transformation processes result in kinetic stable isotope fractionation often with unique fractionation factors which can be exploited to delineate these processes (Sigman and Fripiat, 2019). For instance, photosynthetic uptake preferentially incorporates the lighter isotope 14N as opposed to the heavier 15N, leading to kinetic fractionation (Ryabenko, 2013). The 15N : 14N ratio resulting from that fractionation is presented as δ15N (Eq. C1).
where (15N 14N)standard is the reference standard, measured in atmospheric N2.
Isotopic fractionation caused by a given biological process is known as the kinetic effect, ε. According to Eq. (C2), ε is defined by the difference in rates with which the two N isotopes are converted into a product in such a manner that each N cycle process also has a characteristic isotope effect (Sigman and Casciotti, 2001).
where 14k and 15k are the rate coefficients of the reaction for 14N- and 15N-containing reactant, respectively.
This ε value can be used to distinguish two types of fractionation during assimilation. These are, firstly, Rayleigh fractionation corresponding to a closed system and, secondly, steady state fractionation, which occurs in open systems where there is a resupply of nutrients (Sigman and Casciotti, 2001).
In addition, δ18O values of N derivatives offer additional important constraints on natural processes (Kendall, 1998), where the 18O : 16O ratio of nitrate is measured relative to the standard Vienna Standard Mean Ocean Water (VSMOW).
Dual isotope signatures of δ15N and δ18O can provide insight of nitrate inputs, such as the percentage contribution of terrestrial vs. marine sources, as well as various N cycling processes (Sigman and Casciotti, 2001; Casciotti et al., 2002). The effect of various N cycling processes on N and O isotopic signatures of nitrate and its concentrations is summarised in Fig. C1. The balance between N2 fixation and denitrification renders mean δ15N and δ18O values of 5 ‰ and 2 ‰, respectively, in the deep ocean, where δ15N ranges between ∼ 1 and 20 ‰ (Brandes and Devol, 2002; Sigman et al., 2009b; Tuerena et al., 2015). Values higher than 5 ‰ (δ15N) and 2 ‰ (δ18O) in near-surface waters result from fractionation during assimilation by phytoplankton at the ocean surface which enriches the residual pools of both δ15N-NO and δ18O-NO (Fig. C1) (Altabet and Francois, 2001; Sigman and Casciotti, 2001). In comparison with marine nitrate, terrestrial sources of nitrate often have low values of δ15N-NO and high values of δ18O-NO subject to variable N inputs from N fixation and atmospheric deposition on land (Heaton et al., 2004) and are further modified by soil processes such as denitrification and ammonia volatilisation to varying degrees (Fig. C1a; Carpenter et al., 1997; Kendall, 1998).
Isotopic analyses of δ15N and δ18O of nitrate can also provide quantitative estimates of the regenerated nitrate pool – as opposed to preformed nitrate (Sigman and Fripiat, 2019). The principle behind this is that regeneration moves the δ18O-NO signature towards that of δ18O (H2O) while conserving the δ15N-NO signature (Granger et al., 2018) (Fig. C1b). Variations in δ15N-NO : δ18O-NO provide information about the δ15N-NO from remineralisation (regenerated nitrate pool) and thus also of the N exported and recycled from the euphotic zone (Sigman et al., 2005; Casciotti and Buchwald, 2012; Smart et al., 2015). Processes that remove nitrate such as assimilation and denitrification fractionate (δ15N-NO : δ18O-NO) in a 1:1 ratio (Fig. C1c; DiFiore et al., 2009; Sigman et al., 2009a). The isotopic effects are best expressed in the residual nitrate pool when the processes are incomplete, leaving the residual pool enriched as uptake preferentially utilises the lighter isotopes (Sigman and Casciotti, 2001). On complete biological utilisation of nitrate, the mass balance dictates that the products of the reaction (biomass) reflect the isotopic signatures of the initial nitrate source. This allows for the assessment of relative nitrate utilisation by various uptake processes.
Step 1 – calculating the percentage of regenerated nitrate in the winter cooled water (WCW)
-
Using the equation in Tiwari et al. (2018) (Eq. D1).
where S in WCW = 34.8 ± 0.006 PSU (NP2018).
Previous field and modelling studies have used a nitrifying δ18O value of 1.1 ‰ plus δ18O (Buchwald et al., 2012; Sigman et al., 2009a; Eq. D2). Thus,
-
Using the equation in Tuerena et al. (2021b).
Since regeneration is calculated in the most saline and dense marine waters of the fjords, the δ18O values of Atlantic waters can be used (Granger et al., 2018; Tuerena et al., 2021b). Thus, the following equation from Tuerena et al. (2021b) (Eq. D3) was used to calculate the proportion of regenerated nitrate (NO NO) and resulted in a value of 50 %–80 % regeneration (65 % average).
where δ18Omeas=δ18O-NO measured in WCW = 1.9 ± 0.2 ‰ (data at >300 m, n=3) and δ18OAW=2.8 ± 0.3 ‰ (Tuerena et al., 2021b). δ18Oreg was 1.4 ‰, calculated using Eqs. (D1)–(D2) and NO3reg NO3tot= proportion of regenerated nitrate.
Step 2 – calculating δ15Nreg
The 65 % regeneration estimate was then used to determine the δ15N of remineralised NO (x Eq. D4). The δ15N of preformed NO is given as a range between the conservative estimate of 4.3 ± 0.1 ‰ (terrestrial estimate in this study) and 5.1 ± 0.1 ‰ (marine endmember; Tuerena et al., 2021b) which assumes all preformed nitrate is of marine origin.
where x is δ15N of remineralised NO, δ15NWCW=δ15N-NO measured in WCW = 4.2 ± 0.2 ‰ (data at >300 m, n=3), δ15Npreformed ranges between 4.3 ± 0.1 and 5.1 ± 0.1 ‰ (Tuerena et al., 2021b), is the proportion of regenerated nitrate, and is the proportion of preformed nitrate (derived from Eq. D3).
The resulting δ15N values of 3.7 ‰–4.1 ‰ of remineralised NO (see Eq. D5) demonstrates the major contribution of terrestrial sources (63 %–88 %) to fjord primary productivity as opposed to marine sources (12 %–37 %) (summarised in Table 1). This is explained by the fact that terrestrial sources occur in constant supply, whereas uptake of marine nutrients is hindered by the strong halocline that develops during the summer (see Sect. 4.5).
Please contact Marta Santos-Garcia (m.santosgarcia@ed.ac.uk) regarding data availability.
MSG and RSG wrote the paper. MSG measured nitrate isotopes for NP2017 and NP2018. RET and MCFD measured nitrate isotopes for JR17005 and FS2018, respectively. All authors contributed to the final version of the paper.
The contact author has declared that none of the authors has any competing interests.
Publisher's note: Copernicus Publications remains neutral with regard to jurisdictional claims in published maps and institutional affiliations.
This work resulted from the ARISE project (NE/P006310/1 awarded to Raja S. Ganeshram), part of the Changing Arctic Ocean programme funded by the UKRI Natural Environment Research Council (NERC). This study was also supported by the Norwegian Polar Institute's Centre for Ice, Climate and Ecosystems (ICE) and the Research Council of Norway. We would like to thank the captain and crew of the RV Lance.
This research has been supported by the Natural Environment Research Council (grant no. NE/P006310/1), the Norwegian Polar Institute and the Research Council of Norway (project no. 244646).
This paper was edited by Yuan Shen and reviewed by two anonymous referees.
Adakudlu, M., Andersen, J., Bakke, J., Beldring, S., Benestad, R., Bilt, W. V. D., and Wong, W. K.: Climate in Svalbard 2100 – a knowledge base for climate adaptation. Norway, Norwegian Centre of Climate Services (NCCS) for Norwegian Environment Agency (Miljødirektoratet), 208 pp., NCCS report, Norwegian Centre for Climate Services (NCCS) for Norwegian Environment Agency (Miljødirektoratet), https://doi.org/10.25607/OBP-888, 2019.
Altabet, M. A. and Francois, R.: Nitrogen isotope biogeochemistry of the Antarctic Polar Frontal Zone at 170∘ W, Deep-Sea Res. Pt. II, 48, 4247–4273, https://doi.org/10.1016/S0967-0645(01)00088-1, 2001.
Ansari, A. H., Hodson, A J, Heaton, T. H. E., Kaiser, J., and Marca-Bell, A.: Stable isotopic evidence for nitrification and denitrification in a High Arctic glacial ecosystem, Biogeochemistry, 113, 341–357, https://doi.org/10.1007/s10533-012-9761-9, 2013.
Arctic Climate Impact Assessment (ACIA).: Arctic Climate Impact Assessment, 1042 pp., Cambridge Univ. Press, Cambridge, UK, ISBN: 13 978-0-521-86509, 2005.
Beszczynska-Moller, A., Fahrbach, E., Schauer, U., and Hansen, E.: Variability in Atlantic water temperature and transport at the entrance to the Arctic Ocean, 19972010, ICES J. Mar. Sci., 69, 852–863, https://doi.org/10.1093/ICESJMS/FSS056, 2012.
Björkman, M. P., Vega, C. P., Kühnel, R., Spataro, F., Ianniello, A., Esposito, G., Kaiser, J., Marca, A., Hodson, A., Isaksson, E., and Roberts, T. J.: Nitrate postdeposition processes in Svalbard surface snow, J. Geophys. Res.-Atmos., 119, 12953–12976, https://doi.org/10.1002/2013JD021234, 2014.
Blais, M., Tremblay, J. -É., Jungblut, A. D., Gagnon, J., Martin, J., Thaler, M., and Lovejoy, C.: Nitrogen fixation and identification of potential diazotrophs in the Canadian Arctic, Global Biogeochem. Cy., 26, GB3022, https://doi.org/10.1029/2011GB004096, 2012.
Bokhorst, S., Huiskes, A., Convey, P., and Aerts, R.: External nutrient inputs into terrestrial ecosystems of the Falkland Islands and the Maritime Antarctic region, Polar Biol., 30, 1315–1321, 2007.
Brandes, J. A. and Devol, A. H.: A global marine-fixed nitrogen isotopic budget: Implications for Holocene nitrogen cycling, Global Biogeochem. Cy., 16, 67–1, https://doi.org/10.1029/2001GB001856, 2002.
Brzezinski, M. A.: The Si : C : N ratio of marine diatoms: interspecific variability and the effect of some environmental variables1, J. Phycol., 21, 347–357, https://doi.org/10.1111/J.0022-3646.1985.00347.X, 1985.
Buchwald, C., Santoro, A. E., Mcilvin, M. R., and Casciotti, K. L.: Oxygen isotopic composition of nitrate and nitrite produced by nitrifying cocultures and natural marine assemblages, Limnol. Oceanogr., 57, 1361–1375, https://doi.org/10.4319/lo.2012.57.5.1361, 2012.
Calleja, M. L. I., Kerherve, P., Bourgeois, S., Kedra, M., Leynaert, A., Devred, E., Babin, M., and Morata, N.: Effects of increase glacier discharge on phytoplankton bloom dynamics and pelagic geochemistry in a high Arctic fjord, Progr. Oceanogr., 159, 195–210, https://doi.org/10.1016/j.pocean.2017.07.005, 2017.
Cape, M. R., Straneo, F., Beaird, N., Bundy, R. M., and Charette, M. A.: Nutrient release to oceans from buoyancy-driven upwelling at Greenland tidewater glaciers, Nat. Geosci., 12, 34–39, https://doi.org/10.1038/S41561-018-0268-4, 2019.
Carpenter, E. J., Harvey, H. R., Brian, F., and Capone, D. G.: Biogeochemical tracers of the marine cyanobacterium Trichodesmium, Deep-Sea Res. Pt. I, 44, 27–38, https://doi.org/10.1016/S0967-0637(96)00091-X, 1997.
Carroll, D., Sutherland, D. A., Shroyer, E. L., Nash, J. D., Catania, G. A., and Stearns, L. A.: Modeling turbulent subglacial meltwater plumes: Implications for fjord-scale buoyancy-driven circulation, J. Phys. Oceanogr., 45, 2169–2185, https://doi.org/10.1175/JPO-D-15-0033.1, 2015.
Carroll, D., Sutherland, D. A., Hudson, B., Moon, T., Catania, G. A., Shroyer, E. L., Nash, J. D., Bartholomaus, T. C., Felikson, D., Stearns, L. A., Noël, B. P. Y., and van den Broeke, M. R.: The impact of glacier geometry on meltwater plume structure and submarine melt in Greenland fjords, Geophys. Res. Lett., 43, 9739–9748, https://doi.org/10.1002/2016GL070170, 2016.
Casciotti, K. L. and Buchwald, C.: Insights on the marine microbial nitrogen cycle from isotopic approaches to nitrification, Front. Microbiol., 3, p. 356, https://doi.org/10.3389/FMICB.2012.00356, 2012.
Casciotti, K. L., Sigman, D. M., Hastings, M. G., Böhlke, J. K., and Hilkert, A.: Measurement of the oxygen isotopic composition of nitrate in seawater and freshwater using the denitrifier method, Anal. Chem., 74, 4905–4912, https://doi.org/10.1021/AC020113W, 2002.
Cokelet, E. D., Tervalon, N., and Bellingham, J. G.: Hydrography of the West Spitsbergen Current, Svalbard Branch: Autumn, J. Geophys. Res, 113, 1006, https://doi.org/10.1029/2007JC004150, 2008.
Cottier, F., Tverberg, V., Inall, M., Svendsen, H., Nilsen, F., and Griffiths, C.: Water mass modification in an Arctic fjord through cross-shelf exchange: The seasonal hydrography of Kongsfjorden, Svalbard, J. Geophys. Res.-Ocean., 110, 1–18, https://doi.org/10.1029/2004JC002757, 2005.
Cottier, F. R., Nilsen, F., Enall, M. E., Gerland, S., Tverberg, V., and Svendsen, H.: Wintertime warming of an Arctic shelf in response to large-scale atmospheric circulation, Geophys. Res. Lett., 34, https://doi.org/10.1029/2007GL029948, 2007.
Cottier, F. R., Nilsen, F., Skogseth, R., Tverberg, V., Skardhamar, J., and Svendsen, H.: Arctic fjords: a review of the oceanographic environment and dominant physical processes, Geol. Soc. Lond. Spec. Publ., 344, 35–50, https://doi.org/10.1144/SP344.4, 2010.
Cowan, E. A.: Meltwater and tidal currents: Controls on circulation in a small glacial fjord, Estuar. Coast. Shelf Sci., 34, 381–392, https://doi.org/10.1016/S0272-7714(05)80077-0, 1992.
Cowton, T., Slater, D., Sole, A., Goldberg, D., and Nienow, P.: Modeling the impact of glacial runoff on fjord circulation and submarine melt rate using a new subgrid-scale parameterization for glacial plumes, J. Geophys. Res.-Ocean., 120, 796–812, https://doi.org/10.1002/2014JC010324, 2015.
Dähnke, K. and Thamdrup, B.: Nitrogen isotope dynamics and fractionation during sedimentary denitrification in Boknis Eck, Baltic Sea, Biogeosciences, 10, 3079–3088, https://doi.org/10.5194/bg-10-3079-2013, 2013.
D'Angelo, A., Giglio, F., Miserocchi, S., Sanchez-Vidal, A., Aliani, S., Tesi, T., Viola, A., Mazzola, M., and Langone, L.: Multi-year particle fluxes in Kongsfjorden, Svalbard, Biogeosciences, 15, 5343–5363, https://doi.org/10.5194/bg-15-5343-2018, 2018.
Darlington, E. F.: Meltwater delivery from the tidewater glacier Kronebreen to Kongsfjorden, Svalbard; insights from in-situ and remote-sensing analyses of sediment plumes, Doctoral dissertation, Loughborough University, https://hdl.handle.net/2134/19399 (last access: 20 December 2022), 2015.
David, T. D. and Krishnan, K. P.: Recent variability in the Atlantic water intrusion and water masses in Kongsfjorden, an Arctic fjord, Polar Sci., 11, 30–41, https://doi.org/10.1016/J.POLAR.2016.11.004, 2017.
Debyser, M. C. F., Pichevin, L., Tuerena, R. E., Dodd, P. A., Doncila, A., and Ganeshram, R. S.: Tracing the role of Arctic shelf processes in Si and N cycling and export through the Fram Strait: Insights from combined silicon and nitrate isotopes, Biogeosciences, 19, 5499–5520, https://doi.org/10.5194/bg-19-5499-2022, 2022.
De Rovere, F., Langone, L., Schroeder, K., Miserocchi, S., Giglio, F., Aliani, S., and Chiggiato, J.: Water masses variability in inner Kongsfjorden (Svalbard) during 2010–2020, Front. Mar. Sci., 9, https://doi.org/10.3389/fmars.2022.741075, 2022.
DiFiore, P. J., Sigman, D. M., and Dunbar, R. B.: Upper ocean nitrogen fluxes in the Polar Antarctic Zone: Constraints from the nitrogen and oxygen isotopes of nitrate, Geochem. Geophy. Geosy., 10, Q11016, https://doi.org/10.1029/2009GC002468, 2009.
Dugdale, R. C. and Wilkerson, F. P.: Sources and fates of silicon in the ocean: The role of diatoms in the climate and glacial cycles, Sci. Mar., 65, 141–152, https://doi.org/10.3989/SCIMAR.2001.65S2141, 2001.
Dugdale, R. C., Wilkerson, F. P., and Minas, H. J.: The role of a silicate pump in driving new production, Deep-Sea Res. Pt. I, 42, 697–719, https://doi.org/10.1016/0967-0637(95)00015-X, 1995.
Dürr, H. H., Laruelle, G. G., van Kempen, C. M., Slomp, C. P., Meybeck, M., and Middelkoop, H.: Worldwide Typology of nearshore coastal systems: Defining the estuarine filter of river inputs to the Oceans, Estuar. Coast., 34, 441–458, https://doi.org/10.1007/S12237-011-9381-Y/TABLES/5, 2011.
Egge, J. K.: Are diatoms poor competitors at low phosphate concentrations?, J. Mar. Syst., 16, 191–198, https://doi.org/10.1016/S0924-7963(97)00113-9, 1998.
Elverhøi, A., Lønne, Ø., and Seland, R..: Glaciomarine sedimentation in a modern fjord environment, Spitsbergen, Polar Res., 1, 127–149, https://doi.org/10.3402/POLAR.V1I2.6978, 1983.
Eriksen, E., Gjøsæter, H., Prozorkevich, D., Shamray, E., Dolgov, A., Skern-Mauritzen, M., Stiansen, J. E., Kovalev, Y., and Sunnanå, K.: From single species surveys towards monitoring of the Barents Sea ecosystem, Prog. Oceanogr., 166, 4–14, https://doi.org/10.1016/J.POCEAN.2017.09.007, 2018.
Everett, A., Kohler, J., Sundfjord, A., Kovacs, K. M., Torsvik, T., Pramanik, A., Boehme, L., and Lydersen, C.: Subglacial discharge plume behaviour revealed by CTD-instrumented ringed seals, Sci. Rep., 8, 13467, https://doi.org/10.1038/s41598-018-31875-8, 2018
Geyer, W. R. and Ralston, D. K.: The dynamics of strongly stratified estuaries, Treat. Estuar. Coast. Sci., 2, 37–51, https://doi.org/10.1016/B978-0-12-374711-2.00206-0, 2011.
Granger, J., Sigman, D. M., Gagnon, J., Tremblay, J. E., and Mucci, A.: On the properties of the Arctic halocline and deep water masses of the Canada Basin from nitrate isotope ratios, J. Geophys. Res.-Ocean., 123, 5443–5458, https://doi.org/10.1029/2018JC014110, 2018.
Gruber, N. and Sarmiento, J. L.: Global patterns of marine nitrogen fixation and denitrification, Global Biogeochem. Cy., 11, 235–266, https://doi.org/10.1029/97GB00077, 1997.
Halbach, L., Vihtakari, M., Duarte, P., Everett, A., Granskog, M. A., Hop, H., Kauko, H. M., Kristiansen, S., Myhre, P. I., Pavlov, A. K., Pramanik, A., Tatarek, A., Torsvik, T., Wiktor, J. M., Wold, A., Wulff, A., Steen, H., and Assmy, P.: Tidewater glaciers and bedrock characteristics control the phytoplankton growth environment in a fjord in the Arctic, Front. Mar. Sci., 6, p. 254, https://doi.org/10.3389/FMARS.2019.00254/BIBTEX, 2019.
Hawkings, J. R., Wadham, J. L., Tranter, M., Lawson, E., Sole, A., Cowton, T., Tedstone, A. J., Bartholomew, I., Nienow, P., Chandler, D., and Telling, J.: The effect of warming climate on nutrient and solute export from the Greenland Ice Sheet, Geochem. Perspect. Lett., 1, 94–104, https://doi.org/10.7185/GEOCHEMLET.1510, 2015.
Hayashi, K., Tanabe, Y., Ono, K., Loonen, M. J. J. E., Asano, M., Fujitani, H., Tokida, T., Uchida, M., and Hayatsu, M.: Seabird-affected taluses are denitrification hotspots and potential N2O emitters in the High Arctic, Sci. Rep., 8, 1–11, https://doi.org/10.1038/s41598-018-35669-w, 2018.
Heaton, T. H. E., Wynn, P., and Tye, A. M.: Low 15N 14N ratios for nitrate in snow in the High Arctic (79∘ N), Atmos. Environ., 38, 5611–5621, https://doi.org/10.1016/J.ATMOSENV.2004.06.028, 2004.
Hegseth, E. N., Assmy, P., Wiktor, J. M., Wiktor, J., Kristiansen, S., Leu, E., Tverberg, V., Gabrielsen, T. M., Skogseth, R., and Cottier, F.: Phytoplankton seasonal dynamics in Kongsfjorden, Svalbard and the adjacent shelf, in: The Ecosystem of Kongsfjorden, Svalbard, eds Haakon Hop and Christian Wiencke, Cham, Springer, 173–227, https://doi.org/10.1007/978-3-319-46425-1_6, Chap. 3 – Pelagic Production, Phytoplankton and Zooplankton, 2019.
Hodal, H., Falk-Petersen, S., Hop, H., Kristiansen, S., and Reigstad, M.: Spring bloom dynamics in Kongsfjorden, Svalbard: Nutrients, phytoplankton, protozoans and primary production, Polar Biol., 35, 191–203, 2012.
Hodson, A. J., Mumford, P. N., Kohler, J., and Wynn, P. M.: The High Arctic glacial ecosystem: new insights from nutrient budgets, Biogeochemistry, 72, 233–256, https://doi.org/10.1007/S10533-004-0362-0, 2005.
Holmes, R. M., McClelland, J. W., Peterson, B. J., Tank, S. E., Bulygina, E., Eglinton, T. I., Gordeev, V. V., Gurtovaya, T. Y., Raymond, P. A., Repeta, D. J., Staples, R., Striegl, R. G., Zhulidov, A. V., and Zimov, S. A.: Seasonal and annual fluxes of nutrients and organic matter from large rivers to the Arctic Ocean and surrounding seas, Estuar. Coast., 35, 369–382, 2012.
Hop, H. and Wiencke, C.: Editorial: The ecosystem of Kongsfjorden, Svalbard. Advances in Polar Ecology 2, Springer, Cham, https://doi.org/10.1007/978-3-319-46425-1_1, 2019
Hop, H., Assmy, P., Wold, A., Sundfjord, A., Daase, M., Duarte, P., Kwasniewski, S., Gluchowska, M., Wiktor, J. M., Tatarek, A., Wiktor, J., Kristiansen, S., Fransson, A., Chierici, M., and Vihtakari, M.: Pelagic ecosystem characteristics across the Atlantic Water Boundary Current from Rijpfjorden, Svalbard, to the Arctic ocean during summer (2010–2014), Front. Mar. Sci., 6, 181, https://doi.org/10.3389/fmars.2019.00181, 2019.
Hopwood, M. J., Carroll, D., Dunse, T., Hodson, A., Holding, J. M., Iriarte, J. L., Ribeiro, S., Achterberg, E. P., Cantoni, C., Carlson, D. F., Chierici, M., Clarke, J. S., Cozzi, S., Fransson, A., Juul-Pedersen, T., Winding, M. H. S., and Meire, L.: Review article: How does glacier discharge affect marine biogeochemistry and primary production in the Arctic?, The Cryosphere, 14, 1347–1383, https://doi.org/10.5194/tc-14-1347-2020, 2020.
How, P., Benn, D. I., Hulton, N. R. J., Hubbard, B., Luckman, A., Sevestre, H., Pelt, W. J. J. V., Lindbäck, K., Kohler, J., and Boot, W.: Rapidly changing subglacial hydrological pathways at a tidewater glacier revealed through simultaneous observations of water pressure, supraglacial lakes, meltwater plumes and surface velocities, The Cryosphere, 11, 2691–2710, https://doi.org/10.5194/tc-11-2691-2017, 2017.
Howe, J. A., Harland, R., Cottier, F. R., Brand, T., Willis, K. J., Berge, J. R., Grøsfjeld, K., and Eriksson, A.: Dinoflagellate cysts as proxies for palaeoceanographic conditions in Arctic fjords, Geol. Soc. Spec. Publ., 344, 61–74, https://doi.org/10.1144/SP344.6, 2010.
Ilicak, M., Drange, H., Wang, Q., Gerdes, R., Aksenov, Y., Bailey, D., Bentsen, M., Biastoch, A., Bozec, A., Böning, C., Cassou, C., Chassignet, E., Coward, A. C., Curry, B., Danabasoglu, G., Danilov, S., Fernandez, E., Fogli, P. G., Fujii, Y., Griffies, S. M., Iovino, D., Jahn, A., Jung, T., Large, W. G., Lee, C., Lique, C., Lu, J., Masina, S., George Nurser, A. J., Roth, C., Salas y Mélia, D., Samuels, B. L., Spence, P., Tsujino, H., Valcke, S., Voldoire, A., Wang, X., and Yeager, S. G.: An assessment of the Arctic Ocean in a suite of interannual CORE-II simulations. Part III: Hydrography and fluxes, Ocean Model., 100, 141–161, https://doi.org/10.1016/J.OCEMOD.2016.02.004, 2016.
Ingvaldsen, R., Reitan, M. B., Svendsen, H., and Asplin, L.: The upper layer circulation in Kongsfjorden and Krossfjorden – A complex fjord system on the west coast of Spitsbergen (scientific paper), Memoirs of National Institute of Polar Research, Special Issue, 54, 393–407, 2001.
Jakobsson, M., Mayer, L., Coakley, B., Dowdeswell, J. A., Forbes, S., Fridman, B., Hodnesdal, H., Noormets, R., Pedersen, R., Rebesco, M., Schenke, H. W., Zarayskaya, Y., Accettella, D., Armstrong, A., Anderson, R. M., Bienhoff, P., Camerlenghi, A., Church, I., Edwards, M., Gardner, J. V., Hall, J. K., Hell, B., Hestvik, O., Kristoffersen, Y., Marcussen, C., Mohammad, R., Mosher, D., Nghiem, S. V., Pedrosa, M. T., Travaglini, P. G., and Weatherall, P.: The International Bathymetric Chart of the Arctic Ocean (IBCAO) Version 3.0, Geophys. Res. Lett., 39, 12609, https://doi.org/10.1029/2012GL052219, 2012.
Kanna, N., Sugiyama, S., Ohashi, Y., Sakakibara, D., Fukamachi, Y., and Nomura, D.: Upwelling of macronutrients and dissolved inorganic carbon by a subglacial freshwater driven plume in Bowdoin Fjord, Northwestern Greenland, J. Geophys. Res.-Biogeo., 123, 1666–1682, https://doi.org/10.1029/2017JG004248, 2018.
Kehrl, L. M., Hawley, R. L., Powell, R. D., and Brigham-Grette, J.: Glacimarine sedimentation processes at Kronebreen and Kongsvegen, Svalbard, J. Glaciol., 57, 841–847, https://doi.org/10.3189/002214311798043708, 2011.
Kendall, C.: Tracing nitrogen sources and cycling in catchments, Isot. Tracers Catchment Hydrol., chap. 16 – Tracing Nitrogen Sources and Cycling, in: Catchments, edited by: Kendall, C. and Mcdonnell, J. J., Isotope Tracers in Catchment Hydrology, Elsevier, ISBN: 9780444815460, 519–576, https://doi.org/10.1016/B978-0-444-81546-0.50023-9, 1998.
Kohler, J., James, T. D., Murray, T., Nuth, C., Brandt, O., Barrand, N. E., Aas, H. F., and Luckman, A.: Acceleration in thinning rate on western Svalbard glaciers, Geophys. Res. Lett., 34, 18, https://doi.org/10.1029/2007GL030681, 2007.
Krause, J. W., Duarte, C. M., Marquez, I. A., Assmy, P., Fernández-Méndez, M., Wiedmann, I., Wassmann, P., Kristiansen, S., and Agustí, S.: Biogenic silica production and diatom dynamics in the Svalbard region during spring, Biogeosciences, 15, 6503–6517, https://doi.org/10.5194/bg-15-6503-2018, 2018.
Krause, J. W., Schulz, I. K., Rowe, K. A., Dobbins, W., Winding, M. H. S., Sejr, M. K., Duarte, C. M., and Agustí, S.: Silicic acid limitation drives bloom termination and potential carbon sequestration in an Arctic bloom, Sci. Rep., 9, 1–11, https://doi.org/10.1038/s41598-019-44587-4, 2019.
Krisch, S., Browning, T. J., Graeve, M., Ludwichowski, K.-U., Lodeiro, P., Hopwood, M. J., Roig, S., Yong, J.-C., Kanzow, T., and Achterberg, E. P.: The influence of Arctic Fe and Atlantic fixed N on summertime primary production in Fram Strait, North Greenland Sea, Sci. Rep., 10, 15230, https://doi.org/10.1038/s41598-020-72100-9, 2020.
Kulk, G., van de Poll, W. H., and Buma, A. G. J.: Photophysiology of nitrate limited phytoplankton communities in Kongsfjorden, Spitsbergen, Limnol. Oceanogr., 63, 2606–2617, https://doi.org/10.1002/LNO.10963, 2018.
Kumar, V., Tiwari, M., and Rengarajan, R.: Warming in the Arctic captured by productivity variability at an Arctic fjord over the past two centuries, PLoS One, 13, e0201456, https://doi.org/10.1371/JOURNAL.PONE.0201456, 2018.
Leifer, I., Chen, F. R., McClimans, T., Muller Karger, F., and Yurganov, L.: Satellite ice extent, sea surface temperature, and atmospheric methane trends in the Barents and Kara seas, The Cryosphere Discuss. [preprint], https://doi.org/10.5194/tc-2018-75, in review, 2018.
Li, W. K. W., McLaughlin, F. A., Lovejoy, C., and Carmack, E. C.: Smallest algae thrive as the Arctic Ocean freshens, Science, 326, p. 539, https://doi.org/10.1126/science.1179798/suppl_file/li.som.pdf, 2009.
McGovern, M., Pavlov, A. K., Deininger, A., Granskog, M. A., Leu, E., Søreide, J. E., and Poste, A. E.: Terrestrial inputs drive seasonality in organic matter and nutrient biogeochemistry in a high Arctic fjord system (Isfjorden, Svalbard), Front. Mar. Sci., 7, 542563, https://doi.org/10.3389/FMARS.2020.542563/BIBTEX, 2020.
McIlvin, M. R. and Casciotti, K. L.: Technical updates to the bacterial method for nitrate isotopic analyses, Anal. Chem., 83, 1850–1856, https://doi.org/10.1021/AC1028984, 2011.
Meire, L., Mortensen, J., Meire, P., Juul-Pedersen, T., Sejr, M. K., Rysgaard, S., Nygaard, R., Huybrechts, P., and Meysman, F. J. R.: Marine-terminating glaciers sustain high productivity in Greenland fjords, Glob. Change Biol., 23, 5344–5357, https://doi.org/10.1111/GCB.13801, 2017.
Meslard, F., Bourrin, F., Many, G., and Kerhervé, P.: Suspended particle dynamics and fluxes in an Arctic fjord (Kongsfjorden, Svalbard), Estuar. Coast. Shelf Sci., 204, 212–224, https://doi.org/10.1016/J.ECSS.2018.02.020, 2018.
Monteban, D., Pedersen, J. O. P., and Nielsen, M. H.: Physical oceanographic conditions and a sensitivity study on meltwater runoff in a West Greenland fjord: Kangerlussuaq, Oceanologia, 62, 460–477, https://doi.org/10.1016/J.OCEANO.2020.06.001, 2020.
Morlighem, M., Williams, C. N., Rignot, E., An, L., Arndt, J. E., Bamber, J. L., Catania, G., Chauché, N., Dowdeswell, J. A., Dorschel, B., Fenty, I., Hogan, K., Howat, I., Hubbard, A., Jakobsson, M., Jordan, T. M., Kjeldsen, K. K., Millan, R., Mayer, L., Mouginot, J., Noël, B. P. Y., O'Cofaigh, C., Palmer, S., Rysgaard, S., Seroussi, H., Siegert, M. J., Slabon, P., Straneo, F., van den Broeke, M. R., Weinrebe, W., Wood, M., and Zinglersen, K. B.: BedMachine v3: Complete bed topography and ocean bathymetry mapping of Greenland from multibeam echo sounding combined with mass conservation, Geophys. Res. Lett., 44, 11051–11061, https://doi.org/10.1002/2017GL074954, 2017.
Nuth, C., Kohler, J., König, M., von Deschwanden, A., Hagen, J. O., Kääb, A., Moholdt, G., and Pettersson, R.: Decadal changes from a multi-temporal glacier inventory of Svalbard, The Cryosphere, 7, 1603–1621, https://doi.org/10.5194/tc-7-1603-2013, 2013.
Onarheim, I. H., Smedsrud, L. H., Ingvaldsen, R. B., and Nilsen, F.: Loss of sea ice during winter north of Svalbard, Dynam. Meteorol. Oceanogr., 66, 23933, https://doi.org/10.3402/TELLUSA.V66.23933, 2014.
Østby, T. I., Vikhamar Schuler, T., Ove Hagen, J., Hock, R., Kohler, J., and Reijmer, C. H.: Diagnosing the decline in climatic mass balance of glaciers in Svalbard over 1957–2014, The Cryosphere, 11, 191–215, https://doi.org/10.5194/tc-11-191-2017, 2017.
Payne, C. M. and Roesler, C. S.: Characterizing the influence of Atlantic water intrusion on water mass formation and phytoplankton distribution in Kongsfjorden, Svalbard, Cont. Shelf Res., 191, 104005, https://doi.org/10.1016/J.CSR.2019.104005, 2019.
Pérez-Hernández, M. D., Pickart, R. S., Pavlov, V., Våge, K., Ingvaldsen, R., Sundfjord, A., Renner, A. H. H., Torres, D. J., and Erofeeva, S. Y.: The Atlantic Water boundary current north of Svalbard in late summer, J. Geophys. Res.-Ocean., 122, 2269–2290, https://doi.org/10.1002/2016JC012486, 2017.
Piquet, A. M. T., van de Poll, W. H., Visser, R. J. W., Wiencke, C., Bolhuis, H., and Buma, A. G. J.: Springtime phytoplankton dynamics in Arctic Krossfjorden and Kongsfjorden (Spitsbergen) as a function of glacier proximity, Biogeosciences, 11, 2263–2279, https://doi.org/10.5194/bg-11-2263-2014, 2014.
Piwosz, K., Spich, K., Calkiewicz, J., Weydmann, A., Kubiszyn, A. M., and Wiktor, J. M.: Distribution of small phytoflagellates along an Arctic fjord transect, Environ. Microbiol., 17, 2393–2406, https://doi.org/10.1111/1462-2920.12705, 2015.
Pohjola, V. A., Moore, J. C., Isaksson, E., Jauhiainen, T., van de Wal, R. S. W., Martma, T., Meijer, H. A. J., Vaikmäe, R., Pohjola, V. A., Moore, J. C., Isaksson, E., Jauhiainen, T., van de Wal, R. S. W., Martma, T., Meijer, H. A. J., and Vaikmäe, R.: Effect of periodic melting on geochemical and isotopic signals in an ice core from Lomonosovfonna, Svalbard, J. Geophys. Res.-Atmos., 107, ACL 1-1–ACL 1-14, https://doi.org/10.1029/2000JD000149, 2002.
Polyakov, I. V., Pnyushkov, A. V., Alkire, M. B., Ashik, I. M., Baumann, T. M., Carmack, E. C., Goszczko, I., Guthrie, J., Ivanov, V. V., Kanzow, T., Krishfield, R., Kwok, R., Sundfjord, A., Morison, J., Rember, R., and Yulin, A.: Greater role for Atlantic inflows on sea-ice loss in the Eurasian Basin of the Arctic Ocean, Science, 356, 285–291, 2017.
Randelhoff, A., Reigstad, M., Chierici, M., Sundfjord, A., Ivanov, V., Cape, M., Vernet, M., Tremblay, J.-É, Bratbak, G., and Kristiansen, S.: Seasonality of the physical and biogeochemical hydrography in the inflow to the Arctic Ocean through Fram Strait, Front. Mar. Sci., 5, p. 224, https://doi.org/10.3389/fmars.2018.00224, 2018
Renner, A. H. H., Sundfjord, A., Janout, M. A., Ingvaldsen, R. B., Beszczynska-Möller, A., Pickart, R. S., and Pérez-Hernández, M. D.: Variability and redistribution of heat in the Atlantic Water Boundary Current north of Svalbard, J. Geophys. Res.-Ocean., 123, 6373–6391, https://doi.org/10.1029/2018JC013814, 2018.
Rokkan Iversen, K. and Seuthe, L.: Seasonal microbial processes in a high-latitude fjord (Kongsfjorden, Svalbard): I. Heterotrophic bacteria, picoplankton and nanoflagellates, Polar Biol., 34, 731–749, https://doi.org/10.1007/S00300-010-0929-2/TABLES/6, 2011.
Rudels, B.: The formation of polar surface water, the ice export and the exchanges through the Fram Strait, Prog. Oceanogr., 22, 205–248, https://doi.org/10.1016/0079-6611(89)90013-X, 1989.
Rudels, B., Björk, G., Nilsson, J., Winsor, P., Lake, I., and Nohr, C.: The interaction between waters from the Arctic Ocean and the Nordic Seas north of Fram Strait and along the East Greenland Current: results from the Arctic Ocean-02 Oden expedition, J. Mar. Syst., 1–2, 1–30, https://doi.org/10.1016/J.JMARSYS.2004.06.008, 2005.
Ryabenko, E.: Stable Isotope Methods for the Study of the Nitrogen Cycle, in: Topics in Oceanography, edited by: Zambianchi, E., London, IntechOpen, 1–40, https://doi.org/10.5772/56105, 2013.
Sarmiento, J. L., Gruber, N., Brzezinski, M. A., and Dunne, J. P.: High-latitude controls of thermocline nutrients and low latitude biological productivity, Nature, 427, 56–60, https://doi.org/10.1038/nature02204.1., 2004.
Schild, K. M., Hawley, R. L., Chipman, J. W., and Benn, D. I.: Quantifying suspended sediment concentration in subglacial sediment plumes discharging from two Svalbard tidewater glaciers using Landsat-8 and in situ measurements, Int. J. Rem. Sens. 38, 6865–6881, https://doi.org/10.1080/01431161.2017.1365388, 2017.
Shi, F., Shi, X., Su, X., Fang, X., Wu, Y., Cheng, Z., and Yao, Z.: Clay minerals in Arctic Kongsfjorden surface sediments and their implications on provenance and paleoenvironmental change, Acta Oceanol. Sin. 37, 29–38, https://doi.org/10.1007/S13131-018-1220-6, 2018.
Sigman, D. M. and Casciotti, K. L.: Nitrogen Isotopes in the Ocean, Encycl. Ocean Sci., 1884–1894, Elsevier, https://doi.org/10.1006/rwos.2001.0172, 2001.
Sigman, D. M. and Fripiat, F.: Nitrogen isotopes in the ocean, Encycl. Ocean Sci., 3, 263–278, https://doi.org/10.1016/B978-0-12-409548-9.11605-7, 2019.
Sigman, D. M., Casciotti, K. L., Andreani, M., Barford, C., Galanter, M., and Böhlke, J. K.: A Bacterial method for the nitrogen isotopic analysis of nitrate in seawater and freshwater, Anal. Chem., 73, 4145–4153, https://doi.org/10.1021/AC010088E, 2001.
Sigman, D. M., Granger, J., DiFiore, P. J., Lehmann, M. M., Ho, R., Cane, G., and van Geen, A.: Coupled nitrogen and oxygen isotope measurements of nitrate along the eastern North Pacific margin, Global Biogeochem. Cy., 19, 4, https://doi.org/10.1029/2005GB002458, 2005.
Sigman, D. M., DiFiore, P. J., Hain, M. P., Deutsch, C., and Karl, D. M.: Sinking organic matter spreads the nitrogen isotope signal of pelagic denitrification in the North Pacific, Geophys. Res. Lett., 36, 8, https://doi.org/10.1029/2008GL035784, 2009a.
Sigman, D. M., DiFiore, P. J., Hain, M. P., Deutsch, C., Wang, Y., Karl, D. M., Knapp, A. N., Lehmann, M. F., and Pantoja, S.: The dual isotopes of deep nitrate as a constraint on the cycle and budget of oceanic fixed nitrogen, Deep-Sea Res. Pt. I, 56, 1419–1439, https://doi.org/10.1016/J.DSR.2009.04.007, 2009b.
Skogseth, R., Olivier, L. L. A., Nilsen, F., Flack, E., Fraser, N., Tverberg, V., Ledang, A. B., Vader, A., Jonassen, M. O., Søreide, J., Cottier, F., Berge, J., Ivanov, B. V., and Falk-Petersen, S.: Variability and decadal trends in the Isfjorden (Svalbard) ocean climate and circulation – An indicator for climate change in the European Arctic, Progr. Oceanogr., 187, 102394, https://doi.org/10.1016/j.pocean.2020.102394, 2020.
Skrzypek, G., Wojtuń, B., Richter, D., Jakubas, D., Wojczulanis-Jakubas, K., and Samecka-Cymerman, A.: Diversification of nitrogen sources in various tundra vegetation types in the High Arctic, PLoS One, 10, e0136536, https://doi.org/10.1371/journal.pone.0136536, 2015.
Slater, D. A., Straneo, F., Felikson, D., Little, C. M., Goelzer, H., Fettweis, X., and Holte, J.: Estimating Greenland tidewater glacier retreat driven by submarine melting, The Cryosphere, 13, 2489–2509, https://doi.org/10.5194/tc-13-2489-2019, 2019.
Smart, S. M., Fawcett, S. E., Thomalla, S. J., Weigand, M. A., Reason, C. J. C., and Sigman, D. M.: Isotopic evidence for nitrification in the Antarctic winter mixed layer, Global Biogeochem. Cy., 29, 427–445, https://doi.org/10.1002/2014GB005013, 2015.
Smith, W. H. F. and Sandwell, D. T.: Global sea floor topography from satellite altimetry and ship depth soundings, Science, 277, 1956–1962, https://doi.org/10.1126/SCIENCE.277.5334.1956, 1997.
Straneo, F. and Cenedese, C.: The Dynamics of Greenland's glacial fjords and their role in climate, Ann. Rev. Mar. Sci., 7, 89–112, https://doi.org/10.1146/ANNUREV-MARINE-010213-135133, 2015.
Straneo, F., Hamilton, G. S., Sutherland, D. A., Stearns, L. A., Davidson, F., Hammill, M. O., Stenson, G. B., and Rosing-Asvid, A.: Rapid circulation of warm subtropical waters in a major glacial fjord in East Greenland, Nat. Geosci., 3, 182–186, https://doi.org/10.1038/NGEO764, 2010.
Strøm, H., Descamps, S., and Bakken, V.: Seabird Colonies by the Barents Sea, White Sea and Kara Sea, Norwegian Polar Institute, Tromsø, Norway [data set], https://doi.org/10.21334/npolar.2008.fd4fd3aa, 2008.
Strom, S. L., Olson, M. B., Macri, E. L., and Mordy, C. W.: Cross-shelf gradients in phytoplankton community structure, nutrient utilization, and growth rate in the coastal Gulf of Alaska, Mar. Ecol. Prog. Ser., 328, 75–92, https://doi.org/10.3354/MEPS328075, 2006.
Svendsen, H., Beszczynska-Møller, A., Hagen, J. O., Lefauconnier, B., Tverberg, V., Gerland, S., Ørbæk, J. B., Bischof, K., Papucci, C., Zajaczkowski, M., Azzolini, R., Bruland, O., Wiencke, C., Winther, J.-G., and Dallmann, W.: The physical environment of Kongsfjorden–Krossfjorden, an Arctic fjord system in Svalbard, Polar Res., 21, 133–166, https://doi.org/10.1111/J.1751-8369.2002.TB00072.X, 2002.
Szpak, P., Longstaffe, F. J., Millaire, J. F., and White, C. D.: Stable isotope biogeochemistry of seabird guano fertilization: results from growth chamber studies with maize (Zea mays), PLoS One, 7, e33741, https://doi.org/10.1371/JOURNAL.PONE.0033741, 2012.
Telling, J., Anesio, A. M., Tranter, M., Irvine-Fynn, T., Hodson, A., Butler, C., and Wadham, J.: Nitrogen fixation on Arctic glaciers, Svalbard, J. Geophys. Res.-Biogeo., 116, G3, https://doi.org/10.1029/2010JG001632, 2011.
Terhaar, J., Lauerwald, R., Regnier, P., Gruber, N., and Bopp, L.: Around one third of current Arctic Ocean primary production sustained by rivers and coastal erosion, Nat. Commun., 12, 1–10, https://doi.org/10.1038/s41467-020-20470-z, 2021.
Tiwari, M., Nagoji, S., Kumar, V., Tripathi, S., and Behera, P.: Oxygen isotope-salinity relation in an Arctic fjord (Kongsfjorden): Implications to hydrographic variability, Geosci. Front., 9, 1937–1943, https://doi.org/10.1016/J.GSF.2017.12.007, 2018.
Torsvik, T., Albretsen, J., Sundfjord, A., Kohler, J., Sandvik, A. D., Skarðhamar, J., Lindbäck, K., and Everett, A.: Impact of tidewater glacier retreat on the fjord system: Modeling present and future circulation in Kongsfjorden, Svalbard, Estuar. Coast. Shelf Sci., 220, 152–165, https://doi.org/10.1016/J.ECSS.2019.02.005, 2019.
Trusel, L. D., Powell, R. D., Cumpston, R. M., and Brigham-Grette, J.: Modern glacimarine processes and potential future behaviour of Kronebreen and Kongsvegen polythermal tidewater glaciers, Kongsfjorden, Svalbard, Geol. Soc. Spec. Publ., 344, 89–102, https://doi.org/10.1144/SP344.9, 2010.
Tuerena, R. E., Ganeshram, R. S., Geibert, W., Fallick, A. E., Dougans, J., Tait, A., Henley, S. F., and Woodward, E. M. S.: Nutrient cycling in the Atlantic basin: The evolution of nitrate isotope signatures in water masses, Global Biogeochem. Cy., 29, 1830–1844, https://doi.org/10.1002/2015GB005164, 2015.
Tuerena, R. E., Hopkins, J., Buchanan, P. J., Ganeshram, R. S., Norman, L., von Appen, W. J., Tagliabue, A., Doncila, A., Graeve, M., Ludwichowski, K. U., Dodd, P. A., de la Vega, C., Salter, I., and Mahaffey, C.: An Arctic strait of two halves: The changing dynamics of nutrient uptake and limitation across the Fram Strait, Global Biogeochem. Cy., 35, e2021GB006961, https://doi.org/10.1029/2021GB006961, 2021a.
Tuerena, R. E., Hopkins, J., Ganeshram, R. S., Norman, L., De La Vega, C., Jeffreys, R., and Mahaffey, C.: Nitrate assimilation and regeneration in the Barents Sea: Insights from nitrate isotopes, Biogeosciences, 18, 637–653, https://doi.org/10.5194/bg-18-637-2021, 2021b.
Tverberg, V., Skogseth, R., Cottier, F., Sundfjord, A., Walczowski, W., Inall, M. E., Falck, E., Pavlova, O., and Nilsen, F.: The Kongsfjorden Transect: Seasonal and Inter-annual Variability in Hydrograph, in: The Ecosystem of Kongsfjorden, Svalbard, edited by: Hop, H. and Wiencke, C., Advances in Polar Ecology, Vol. 2, Springer, Cham, 49–104, https://doi.org/10.1007/978-3-319-46425-1_3, 2019.
Vega, C. P., Björkman, M. P., Pohjola, V. A., Isaksson, E., Pettersson, R., Martma, T., Marca, A., and Kaiser, J.: Nitrate stable isotopes and major ions in snow and ice samples from four Svalbard sites, Polar Res., 34, 23246, https://doi.org/10.3402/polar.v34.23246, 2015.
Vonk, J. E., Tank, S. E., Bowden, W. B., Laurion, I., Vincent, W. F., Alekseychik, P., Amyot, M., Billet, M. F., Canário, J., Cory, R. M., Deshpande, B. N., Helbig, M., Jammet, M., Karlsson, J., Larouche, J., Macmillan, G., Rautio, M., Walter Anthony, K. M., and Wickland, K. P.: Reviews and syntheses: Effects of permafrost thaw on Arctic aquatic ecosystems, Biogeosciences, 12, 7129–7167, https://doi.org/10.5194/bg-12-7129-2015, 2015.
Wallace, M. I., Cottier, F. R., Berge, J., Tarling, G. A., Griffiths, C., and Brierley, A. S.: Comparison of zooplankton vertical migration in an ice-free and a seasonally ice-covered Arctic fjord: An insight into the influence of sea ice cover on zooplankton behavior, Limnol. Oceanogr., 55, 831–845, https://doi.org/10.4319/LO.2010.55.2.0831, 2010.
Wang, C., Shi, L., Gerland, S., Granskog, M. A., Renner, A. H. H., Li, Z., Hansen, E., and Martma, T.: Spring sea-ice evolution in Rijpfjorden (80∘ N), Svalbard, from in situ measurements and ice mass-balance buoy (IMB) data, Ann. Glaciol., 54, 253–260, https://doi.org/10.3189/2013AOG62A135, 2013.
Wankel, S. D., Kendall, C., and Paytan, A.: Using nitrate dual isotopic composition (δ15N and δ18O) as a tool for exploring sources and cycling of nitrate in an estuarine system: Elkhorn Slough, California, J. Geophys. Res.-Biogeo., 114, 1011, https://doi.org/10.1029/2008JG000729, 2009.
Weigand, M. A., Foriel, J., Barnett, B., Oleynik, S., and Sigman, D. M.: Updates to instrumentation and protocols for isotopic analysis of nitrate by the denitrifier method, Rapid Commun. Mass Spectrom., 30, 1365–1383, https://doi.org/10.1002/rcm.7570, 2016.
Wynn, P. M., Hodson, A. J., Heaton, T. H. E., and Chenery, S. R.: Nitrate production beneath a High Arctic glacier, Svalbard, Chem. Geol., 244, 88–102, https://doi.org/10.1016/J.CHEMGEO.2007.06.008, 2007.
Yamamoto-Kawai, M., Carmack, E., and McLaughlin, F.: Nitrogen balance and Arctic throughflow, Nature, 443, p. 43, https://doi.org/10.1038/443043a, 2006.
Yang, Y., Ren, J., and Zhu, Z.: Distributions and Influencing Factors of Dissolved Manganese in Kongsfjorden and Ny-Ålesund, Svalbard, ACS Earth Sp. Chem., 6, 1259–1268, https://doi.org/10.1021/acsearthspacechem.1c00388, 2022.
Zehr, J. P. and Capone, D. G.: Changing perspectives in marine nitrogen fixation, Science, 368, 6492, https://doi.org/10.1126/science.aay9514, 2020.
Zhu, Z. Y., Wu, Y., Liu, S. M., Wenger, F., Hu, J., Zhang, J., and Zhang, R. F: Organic carbon flux and particulate organic matter composition in Arctic valley glaciers: examples from the Bayelva River and adjacent Kongsfjorden, Biogeosciences, 13, 975–987, https://doi.org/10.5194/bg-13-975-2016, 2016.
- Abstract
- Introduction
- Methodology
- Results
- Discussion
- Conclusions
- Appendix A: Tables and figures
- Appendix B: Statistical analyses
- Appendix C: Using stable isotope tools to determine N fluxes and cycling
- Appendix D: Calculations for the quantitative measure of the contribution of terrestrial inputs vs. marine inputs to the fjord nitrate pool
- Data availability
- Author contributions
- Competing interests
- Disclaimer
- Acknowledgements
- Financial support
- Review statement
- References