the Creative Commons Attribution 4.0 License.
the Creative Commons Attribution 4.0 License.
 | 04 Oct 2023
Low cobalt inventories in the Amundsen and Ross seas driven by high demand for labile cobalt uptake among native phytoplankton communities
Rebecca J. Chmiel
Riss M. Kell
Deepa Rao
Dawn M. Moran
Giacomo R. DiTullio
Cobalt (Co) is a scarce but essential micronutrient for marine plankton in the Southern Ocean and coastal Antarctic seas, where dissolved cobalt (dCo) concentrations can be extremely low. This study presents total dCo and labile dCo distributions measured via shipboard voltammetry in the Amundsen Sea, the Ross Sea and Terra Nova Bay during the CICLOPS (Cobalamin and Iron Co-Limitation of Phytoplankton Species) expedition. A significantly smaller dCo inventory was observed during the 2017/2018 CICLOPS expedition compared to two 2005/2006 expeditions to the Ross Sea conducted over a decade earlier. The dCo inventory loss (∼ 10–20 pM) was present in both the surface and deep ocean and was attributed to the loss of labile dCo, resulting in the near-complete complexation of dCo by strong ligands in the photic zone. A changing dCo inventory in Antarctic coastal seas could be driven by the alleviation of iron (Fe) limitation in coastal areas, where the flux of Fe-rich sediments from melting ice shelves and deep sediment resuspension may have shifted the region towards vitamin B12 and/or zinc (Zn) limitation, both of which are likely to increase the demand for Co among marine plankton. High demand for Zn by phytoplankton can result in increased Co and cadmium (Cd) uptake because these metals often share the same metal uptake transporters. This study compared the magnitudes and ratios of Zn, Cd and Co uptake (ρ) across upper-ocean profiles and the observed order-of-magnitude uptake trends (ρZn > ρCd > ρCo) that paralleled the trace metal concentrations in seawater. High rates of Co and Zn uptake were observed throughout the region, and the speciation of available Co and Zn appeared to influence trends in dissolved metal : phosphate stoichiometry and uptake rates over depth. Multi-year loss of the dCo inventory throughout the water column may be explained by an increase in Co uptake into particulate organic matter and subsequently an increased flux of Co into sediments via sinking and burial. This perturbation of the Southern Ocean Co biogeochemical cycle could signal changes in the nutrient limitation regimes, phytoplankton bloom composition and carbon sequestration sink of the Southern Ocean.
- Article
(15033 KB) - Full-text XML
- Companion paper
- BibTeX
- EndNote


-
A significantly smaller dissolved cobalt (dCo) inventory was observed in the Ross Sea during the 2017/2018 austral summer compared to two expeditions in 2005/2006.
-
The drawdown of the labile dCo fraction can be explained by higher rates of Co uptake by phytoplankton.
-
This change may be due to the alleviation of Fe limitation through inputs from increased glacial melting and subsequent development of intermittent vitamin B12 and/or Zn limitation, both of which would be expected to increase the demand for Co among plankton communities.
Coastal Antarctic seas are highly productive environments for phytoplankton blooms and are characterized by high-nutrient, low-chlorophyll (HNLC) surface waters that tend to be growth-limited by iron (Fe) and other trace metal micronutrients (Martin et al., 1990; Arrigo et al., 2008, 2012). During the spring and summer months, katabatic winds and fragmenting sea ice form open coastal polynyas in the Amundsen and Ross seas that host high phytoplankton productivity and act as significant global carbon sinks (Arrigo et al., 2012). In the winter, ice cover supports the turnover of deep waters that allow trace metals like Fe to be redistributed to the upper ocean (Sedwick and DiTullio, 1997; Sedwick et al., 2011). Phytoplankton blooms in coastal Antarctic polynyas are dominated by eukaryotes such as diatoms and the haptophyte Phaeocystis antarctica (Arrigo et al., 1999; DiTullio et al., 2003), while cyanobacteria like Prochlorococcus and Synechococcus, which are highly abundant in the adjacent South Pacific and South Atlantic gyres, are nearly absent from the phytoplankton community in the Southern Ocean (DiTullio et al., 2003; Bertrand et al., 2011; Chandler et al., 2016).
Cobalt (Co) is an essential trace metal nutrient for many marine plankton and is relatively scarce in the marine environment, often present in the dissolved phase (dCo) in picomolar concentrations (10−12 mol L−1). Co acts as a cofactor for metalloenzymes like carbonic anhydrase, a crucial enzyme in the carbon concentrating mechanism of photosynthetic phytoplankton (Sunda and Huntsman, 1995; Roberts et al., 1997; Kellogg et al., 2020) and vitamin B12 (cobalamin), which can be used for the biosynthesis of methionine but is only produced by some bacteria and archaea (Warren et al., 2002; Bertrand et al., 2013). In the Ross Sea, vitamin B12 availability has been observed to co-limit phytoplankton growth with iron (Fe) when bacterial abundance is low (Bertrand et al., 2007). Some phytoplankton exhibit flexible vitamin B12 metabolisms and can express a vitamin-B12-independent methionine synthase pathway (metE gene) instead of the vitamin-B12-dependent pathway (metH gene), allowing these organisms to thrive in vitamin-depleted environments (Rodionov et al., 2003; Bertrand et al., 2013; Helliwell, 2017). Recently, P. antarctica was discovered to contain both metH and a putative metE gene, displaying a metabolism that is flexible to vitamin B12 availability (Rao, 2020). Additionally, recent observations of Zn co-limitation with Fe have been documented in the Ross Sea (Kellogg, 2022), suggesting a complex landscape of trace metal and vitamin stress interactions in the otherwise macronutrient-rich waters of coastal Antarctica.
Dissolved Co is present as two primary species in the marine environment: a “free” labile Co(II) species with weakly bound ligands and a Co(III) species that is strongly bound to organic ligands (Ks>1016.8) (Saito et al., 2005). Labile dCo is considered to be more bioavailable to marine microbes than strongly bound dCo, although there is evidence that phytoplankton communities can access Co in strongly bound organic ligand complexes (Saito and Moffett, 2001) and that microbial communities may produce extracellular Co ligands that stabilize dCo and prevent its loss via scavenging to manganese (Mn) oxide particles (Saito et al., 2005; Bown et al., 2012). Previous dCo sampling expeditions to the Ross Sea, including two 2005/2006 Controls of Ross Sea Algal Community Structure (CORSACS) expeditions (Saito et al., 2010) and fieldwork in 2009 that sampled the water column below early spring sea ice in the McMurdo Sound (Noble et al., 2013), reported relatively high concentrations of labile dCo in the surface Ross Sea when compared to the tropical and subtropical global oceans, suggesting that labile dCo was fairly replete and bioavailable to phytoplankton at the time (Saito et al., 2010).
This study examines the biogeochemical cycle of Co in the Amundsen and Ross seas during the 2017/2018 austral summer as part of the Cobalamin and Iron Co-Limitation of Phytoplankton Species (CICLOPS) expedition. Here, we present profiles of dCo speciation that revealed a lower dCo inventory during the 2017/2018 summer bloom compared to that observed during the 2005/2006 CORSACS expeditions, as well as mostly undetectable concentrations of labile dCo in the surface ocean. Additional datasets of dissolved zinc (dZn) and cadmium (dCd), as well as profiles of Co, Zn and Cd uptake rates measured by isotope tracer incubation experiments, suggest that regions of vitamin B12 and Zn stress within phytoplankton blooms could be driving the high demand for bioavailable Co in the surface ocean. The results presented by this study reveal a substantial perturbation of the Co cycle, a shift towards vitamin B12 and/or Zn limitation, and possible but unconfirmed perturbations to the dissolved iron (dFe) cycle in coastal Antarctic waters impacted by high rates of glacial ice melt and a warming climate.
2.1 Study area and trace metal sampling
Samples were collected along the coastal Antarctic shelf from the Amundsen Sea, the Ross Sea and Terra Nova Bay (Fig. 1) during the CICLOPS expedition on the ice breaking research vessel (RVIB) Nathaniel B. Palmer (NBP-1801; 16 December 2017–3 March 2018). The expedition track first mapped a transect from the Amundsen Sea, through the Ross Sea and ending in Terra Nova Bay (stations 4–22) over 10 d from 31 December 2017 to 9 January 2018 and then sampled at stations between Terra Nova Bay and the western Ross Sea for the remainder of the expedition.

Figure 1Map of CICLOPS stations in coastal Antarctic waters, including insets of stations within the Ross Sea and Terra Nova Bay. Dissolved Co, dZn and dCd were analyzed at stations marked in yellow, and stations marked in green were analyzed for dZn and dCd, but electrochemical dCo measurements were not conducted. At stations marked with a star, Co, Zn and Cd uptake profiles are presented in this study. Stations marked in red are shown in more detail in an inset. Note that the gray coastline marks both terrestrial coastline and areas of consistent ice, including ice shelves and glaciers; this includes the Drygalski Ice Tongue, a glacier to the south of Terra Nova Bay.
Dissolved seawater was collected from full-depth station profiles using a trace-metal-clean sampling rosette deployed on a conducting synthetic line supplied by the U.S. Antarctic Program (USAP) and equipped with 12 X-Niskin bottles of 8 L capacity (Ocean Test Equipment) supplied by the Saito Laboratory (Woods Hole Oceanographic Institution; Woods Hole, MA, USA). Real-time trace metal rosette operations allowed for the careful collection of seawater from 10 and 20 m above the ocean floor to study sediment–water interactions within a potential nepheloid layer. After deployment, the X-Niskin bottles were transported to a trace metal clean-air van and pressurized with high-purity (99.999 %) N2 gas. Seawater samples for macronutrients, dCo and trace metal analysis were then filtered through acid-washed 0.2 µM Supor polyethersulfone membrane filters (Pall Corporation, 142 mm diameter) within 3 h of rosette recovery.
To minimize metal contamination of samples, all sample bottles were prepared using trace-metal-clean procedures prior to the expedition. The cleaning procedure for dCo sample bottles entailed soaking sample bottles for ∼ 1 week in CitraNOX, an acidic detergent; rinsing with Milli-Q water (Millipore); soaking the sample bottles for ∼ 2 weeks in 10 % trace-metal-grade HCl (Optima, Fisher Scientific); and rinsing with lightly acidic Milli-Q water (<0.1 % HCl). Macronutrient sample bottles were rinsed with Milli-Q water and soaked overnight in 10 % HCl. The procedure for total dissolved metal sample bottles (dZn and dCd) was identical to that used for dCo bottles, except the CitraNOX soak step was omitted.
Samples for dCo analysis were collected in 60 mL low-density polyethylene (LDPE) bottles and stored at 4 ∘C until analysis. Duplicate dCo samples were collected: one for at-sea analysis of labile dCo and total dCo and another for preservation and total dCo analysis in the laboratory after the expedition. Preserved total dCo samples were stored with oxygen-absorbing satchels (Mitsubishi Gas Chemical, model RP-3K), which preserve the sample for long-term storage and future analysis (Noble et al., 2017; Bundy et al., 2020). Preserved dCo samples were stored in groups of six within an open (unsealed) plastic bag, which was then placed into a gas-impermeable plastic bag (Ampac) with one oxygen-absorbing satchel per 60 mL dCo sample. The outer bag was then heat-sealed and stored at 4 ∘C until analysis. Total dCo concentrations for stations 57 and 60 were analyzed in the laboratory, while all other total dCo and labile dCo concentrations were analyzed at sea.
Samples for total dissolved metal analysis (dZn and dCd) were collected in 250 mL LDPE bottles and stored double-bagged at room temperature. After ∼ 7 months, the total dissolved metal samples were acidified to a pH of 1.7 with trace-metal-grade HCl (Optima, Fisher Scientific) and were stored acidified for more than 1 year before instrumental analysis.
2.2 Dissolved Co and labile dCo analysis
Total dCo – the combined fractions of labile and ligand-bound dCo, hereafter simply dCo – and labile dCo concentrations were analyzed via cathodic stripping voltammetry (CSV), as described by Saito and Moffett (2001) and modified by Saito et al. (2010) and Hawco et al. (2016). CSV analysis was conducted using a Metrohm 663 VA and μ Autolab III systems equipped with a hanging mercury drop working electrode. All reagents were prepared as described in Chmiel et al. (2022). Most samples were analyzed at sea within 3 weeks of sample collection. Stations 57 and 60 were analyzed for labile dCo at sea, and their duplicate preserved samples were analyzed for total dCo in November 2019 in the laboratory.
To measure total dCo concentrations, filtered seawater samples were first UV-irradiated in quartz tubes for 1 h in a Metrohm 705 UV Digester to destroy natural ligand-bound Co complexes. A total of 11 mL of sample was then added to a 15 mL trace-metal-clean polypropylene vial, and 100 µL of 0.1 M dimethylglyoxime (DMG; Sigma Aldrich) ligand and 130 µL of 0.5 M N-(2-hydroxyethyl)piperazine-N-(3-propanesulfonic acid) (EPPS, Sigma Aldrich) buffer were added to each sample vial. A Metrohm 858 Sample Processor then loaded 8.5 mL of each sample into the electrode's Teflon cup and added 1.5 mL of 1.5 M NaNO2 reagent (Merck). The mercury electrode performed a fast linear sweep from −1.4 to −0.6 V at a rate of 5 V s−1 and produced a cobalt reduction peak at −1.15 V, the voltage at which the Co(DMG)2 complex is reduced from Co(II) to Co(0) (Saito and Moffett, 2001). The height of the Co reduction peak is linearly proportional to the amount of total dCo present in the sample. Peak heights were determined by NOVA 1.10 software. A standard curve was created with four additions of 25 pM dCo to each sample, and a type-I linear regression of the standard addition curve performed by the LINEST function in Microsoft Excel allowed for the calculation of the initial amount of Co present in the sample.
When analyzing labile dCo concentrations, samples were not UV-irradiated so as to only quantify the free or weakly bound dCo not bound to strong organic ligands. A total of 11 mL of labile samples was instead allowed to equilibrate with the DMG ligand and EPPS reagent overnight (∼ 8 h) before analysis to allow time for the labile dCo present in the sample to bind to the DMG ligand via competitive ligand exchange (K>1016.8). Labile dCo samples were then loaded onto the sample processor and analyzed electrochemically using identical methods as described above for total dCo samples.
2.3 Dissolved Co standards and blanks
During the CICLOPS expedition, an internal standard consisting of filtered, UV-irradiated seawater was analyzed for dCo every few days while samples were being analyzed (39 ± 4 pM, n=9). While additional preserved dCo samples were analyzed in the laboratory in November 2019, triplicate GSC2 (GEOTRACES coastal surface seawater) community intercalibration standards were carefully neutralized to a pH of ∼ 8 using negligible volumes of ammonium hydroxide (NH4OH) and analyzed for dCo. This is the same intercalibration batch originally reported in Table 1 of Chmiel et al. (2022), as analyses for both expeditions overlapped temporally. The GSC2 standard was determined to have a dCo concentration of 80.2 ± 6.2 (n=3), a value that is very similar to the one reported by Hawco et al. (2016) (77.7 ± 2.4). Currently, no official community consensus for dCo in the GSC2 intercalibration standard exists.
Analytical blank measurements for each reagent batch (a unique combination of DMG, EPPS, and NaNO2 reagent batches) were measured to determine any Co contamination due to reagent impurities. Blanks were prepared in triplicate, with UV-irradiated surface seawater passed through a column with Chelex 100 resin beads (Bio-Rad) to remove metal contaminants, then UV-irradiated again. Chelex beads were prepared as described in Price et al. (2013) to remove organic impurities from leaching into the eluent. For the five batches of reagents used on this expedition, the analytical blanks were found to be 2.3, 4.0, 10.1, 15.6 and 8.6 pM dCo, with an average of 8.1 pM Co. The analytical blank detected for the laboratory-run total dCo samples was 1.0 pM. It should be noted that blank values above 10 pM are considered high for this method. Analytical blank values were subtracted from the measured Co values determined with the respective reagent batch. The average standard deviation within each triplicate batch of blanks (1.3 pM) was used to estimate the analytical limit of detection (3× blank standard deviation) of 4 pM. When detectable dCo concentrations were found below the 4 pM detection limit, their values were preserved in the dataset and flagged as below the detection limit (< DL). In cases where no dCo or labile dCo was detected (i.e., when no peak was measurable and/or the dCo value predicted was <0 pM), values of 0 pM were assigned for the purposes of plotting and selecting statistical analysis and were flagged as not detected (n.d.) as well as < DL in the dataset; although these concentrations were not detectable with our methodology, we believe the incredibly low concentrations of dCo and labile dCo observed on this expedition were meaningful and that removing these values from our analysis misrepresents the data and would skew the results to appear higher than was observed.
2.4 Dissolved Zn and Cd analyzed by ICP-MS
Total dissolved trace metal samples were analyzed for dZn and dCd using isotope dilution and inductively coupled plasma mass spectrometry (ICP-MS), as described in Kellogg (2022) based on methodology described in Cohen et al. (2021). Briefly, 15 mL of acidified filtered seawater samples was spiked with an acidified mixture of stable isotopes including 67Zn and 110Cd, among other metal stable isotopes, and pre-concentrated via a solid-phase extraction system seaFAST-Pico (Elemental Scientific) to an elution volume of 500 µL. The samples were then analyzed using an iCAP-Q ICP-MS (Thermo Scientific), and concentrations were determined using a multi-elemental standard curve (SPEX CertiPrep).
2.5 Co, Zn and Cd uptake rates via isotope incubations
Co, Zn and Cd uptake rates were quantified using incubations of collected marine microbial communities spiked with stable isotopes or radioisotopes to trace the conversion of dissolved trace metal into the particulate phase. Briefly, unfiltered seawater used for the incubation uptake experiments was collected from the trace metal rosette, and the Co, Zn and Cd uptake incubations were spiked with 0.1 pM 57CoCl2, 2 nM 67ZnO and 300 pM 110CdO, respectively. All incubation bottles were then sealed and placed in a flow-through shipboard incubator on the deck that exposed the incubations to a natural day/night cycle and surface-temperature seawater for 24 h. The incubator was shielded by black mesh screening to allow 20 % ambient light penetration. Incubation biomass was collected by vacuum filtration onto acid-rinsed 3 µm Versapor filters (Pall). The 57Co incubation filters were stored at room temperature in Petri dishes prior to radiochemical gamma-ray counting both at sea and in the laboratory, and the 67Zn and 110Cd incubation filters were stored at −80 ∘C in acid-rinsed cryovials until ICP-MS analysis in the laboratory. See Kellogg (2022) and Rao (2020) for full methodology and instrumental analysis.
2.6 Pigment and phosphate analysis
Phytoplankton pigment samples were collected from a non-trace metal rosette deployed separately from the trace metal rosette and were filtered and analyzed for select pigments by high-performance liquid chromatography (HPLC), as described in DiTullio and Geesey (2003). Macronutrient samples were collected from the trace metal rosette alongside dCo samples and were filtered using the same methodology as dCo and total metal samples (see above). Samples were collected in 60 mL high-density polyethylene (HDPE) bottles and were stored frozen until analysis. Dissolved PO4 concentrations were determined by Joe Jennings at Oregon State University via the molybdenum blue method (Bernhardt and Wilhelms, 1967) using a Technicon AutoAnalyzer II attached to an Alpkem autosampler.
2.7 Historical dCo and pigment data
In this study, dCo profiles from the CICLOPS expedition are compared to those from previous fieldwork in the Ross Sea, including the Controls of Ross Sea Algal Community Structure (CORSACS) expeditions CORSACS-1 (NBP-0601; 27 December 2005–23 January 2006) and CORSACS-2 (NBP-0608; 8 November–3 December 2006), reported in Saito et al. (2010), and fieldwork sampling the water column under the sea ice of the McMurdo Sound (9–23 November 2009), reported in Noble et al. (2013). The locations of the stations used in this study from the CORSACS-1 expedition, CORSACS-2 expedition and McMurdo Sound fieldwork are given with respect to the CICLOPS stations in Fig. A1 in Appendix A. Dissolved cobalt and pigment data from these three fieldwork expeditions were sampled and analyzed with comparable methodologies to those used on the CICLOPS expedition, and the CORSACS data are accessible online at https://www.bco-dmo.org/dataset/3367 (Version: 13 September 2010).
2.8 Statistical analysis
The linear regressions presented in this study are two-way (type-II) linear regressions, with the exception of the standard addition curves used to calculate dCo concentrations (Sect. 2.2). Two-way regressions are ideal for stoichiometric ratios because they allow for error in both the x and y parameters and do not assume dependence between the x and y axes. The two-way regression function used in this study was rewritten to Python from a MATLAB file (lsqfitma.m) originally written by Ed Pelzer circa 1995 (Chmiel et al., 2022) and is available at https://github.com/rebecca-chmiel/GP15 (last access: 22 April 2021).
Independent t tests were performed using the stats.ttest_ind function within the statistical function module of the SciPy Python library.
3.1 Dissolved Co distribution and speciation
During the CICLOPS expedition, full-depth profiles of dCo and labile dCo samples were analyzed from 13 stations in the Amundsen Sea (stations 4, 10, 11, 15), the Ross Sea (stations 20, 29, 32, 35) and Terra Nova Bay (stations 22, 27, 41, 57, 60; Fig. 1). The resulting dCo profiles (Fig. 2) show depletion in the surface ocean consistent with a nutrient-type profile; at 10 m depth, dCo concentrations were found to be 28 ± 7 pM in the Amundsen Sea (n=4), 28 ± 12 pM in the Ross Sea (n=4) and only 11 ± 7 pM in Terra Nova Bay (n=5; Table 1). Labile dCo distributions generally followed those of dCo and also showed strong depletion in the surface ocean. In the Amundsen and Ross seas, surface (∼ 10 m) labile dCo concentrations ranged between 12 pM at station 10 and undetected (n.d.) concentrations at stations 15, 20, 32 and 35. In Terra Nova Bay, no surface labile dCo concentrations were detected at any of the five stations sampled, indicating that the dCo inventory was dominated by the strongly ligand-bound dCo fraction.
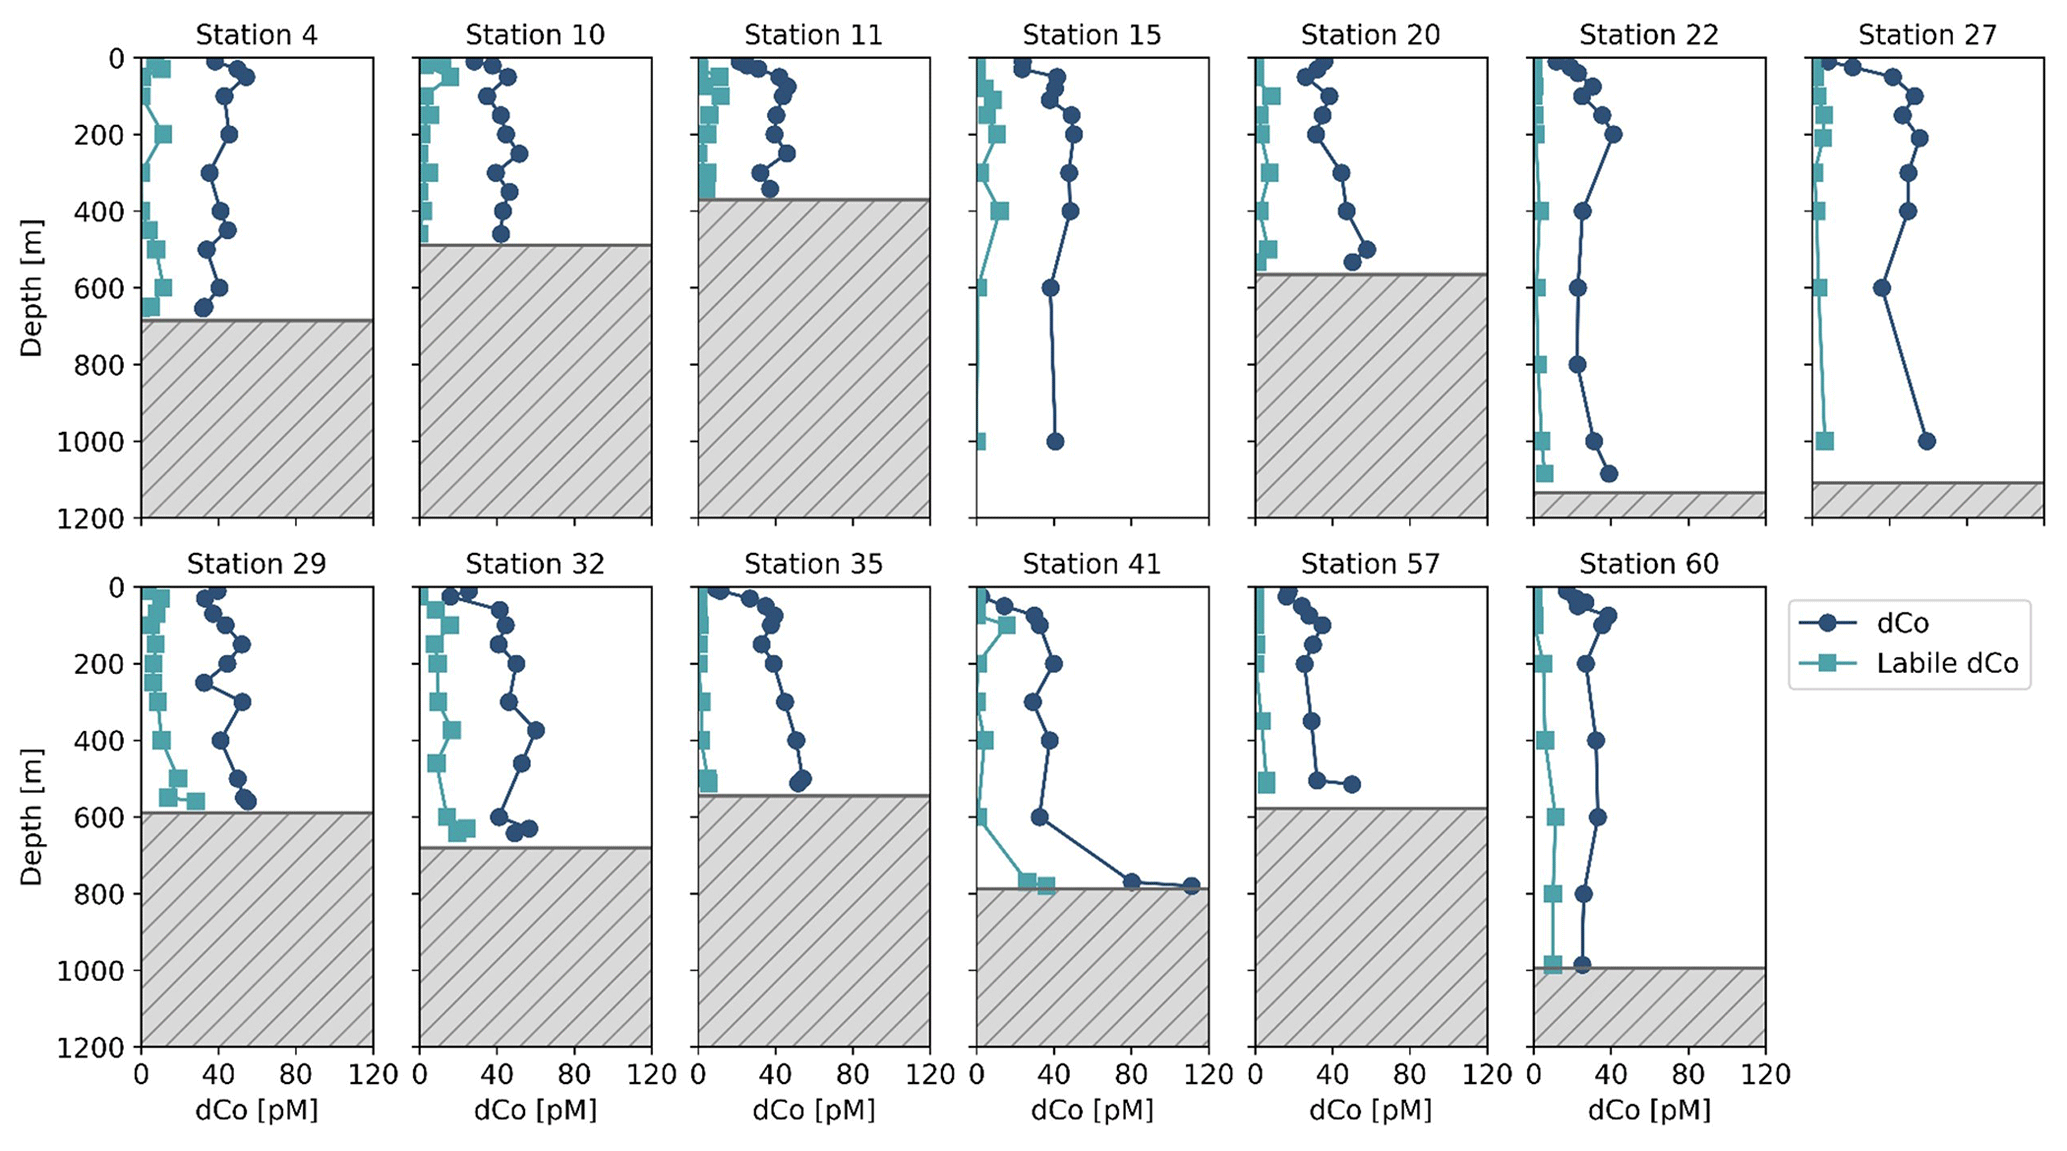
Figure 2Dissolved Co and labile dCo full-depth profiles from the CICLOPS expedition to the Amundsen Sea (stations 4, 10, 11, 15), the Ross Sea (stations 20, 29, 32, 35) and Terra Nova Bay (stations 22, 27, 41, 57, 60). The top of the gray box marks the location of the seafloor.
Table 1Mean dCo and labile dCo values measured in the surface ocean (10 m) and the deep ocean (>100 m) in the three regions sampled. One dCo sample and numerous labile dCo samples were determined to be below the analytical detection limit (< DL) of 4 pM. Only using the values measured above the detection limit would artificially inflate the calculation of the mean value; instead, samples measured between 0 and the DL were left unaltered, as their originally measured value and samples with no detected concentrations of dCo or labile dCo (n.d.) were adjusted to 0 pM. The number of samples included in the mean calculation that are < DL is indicated by n<DL.
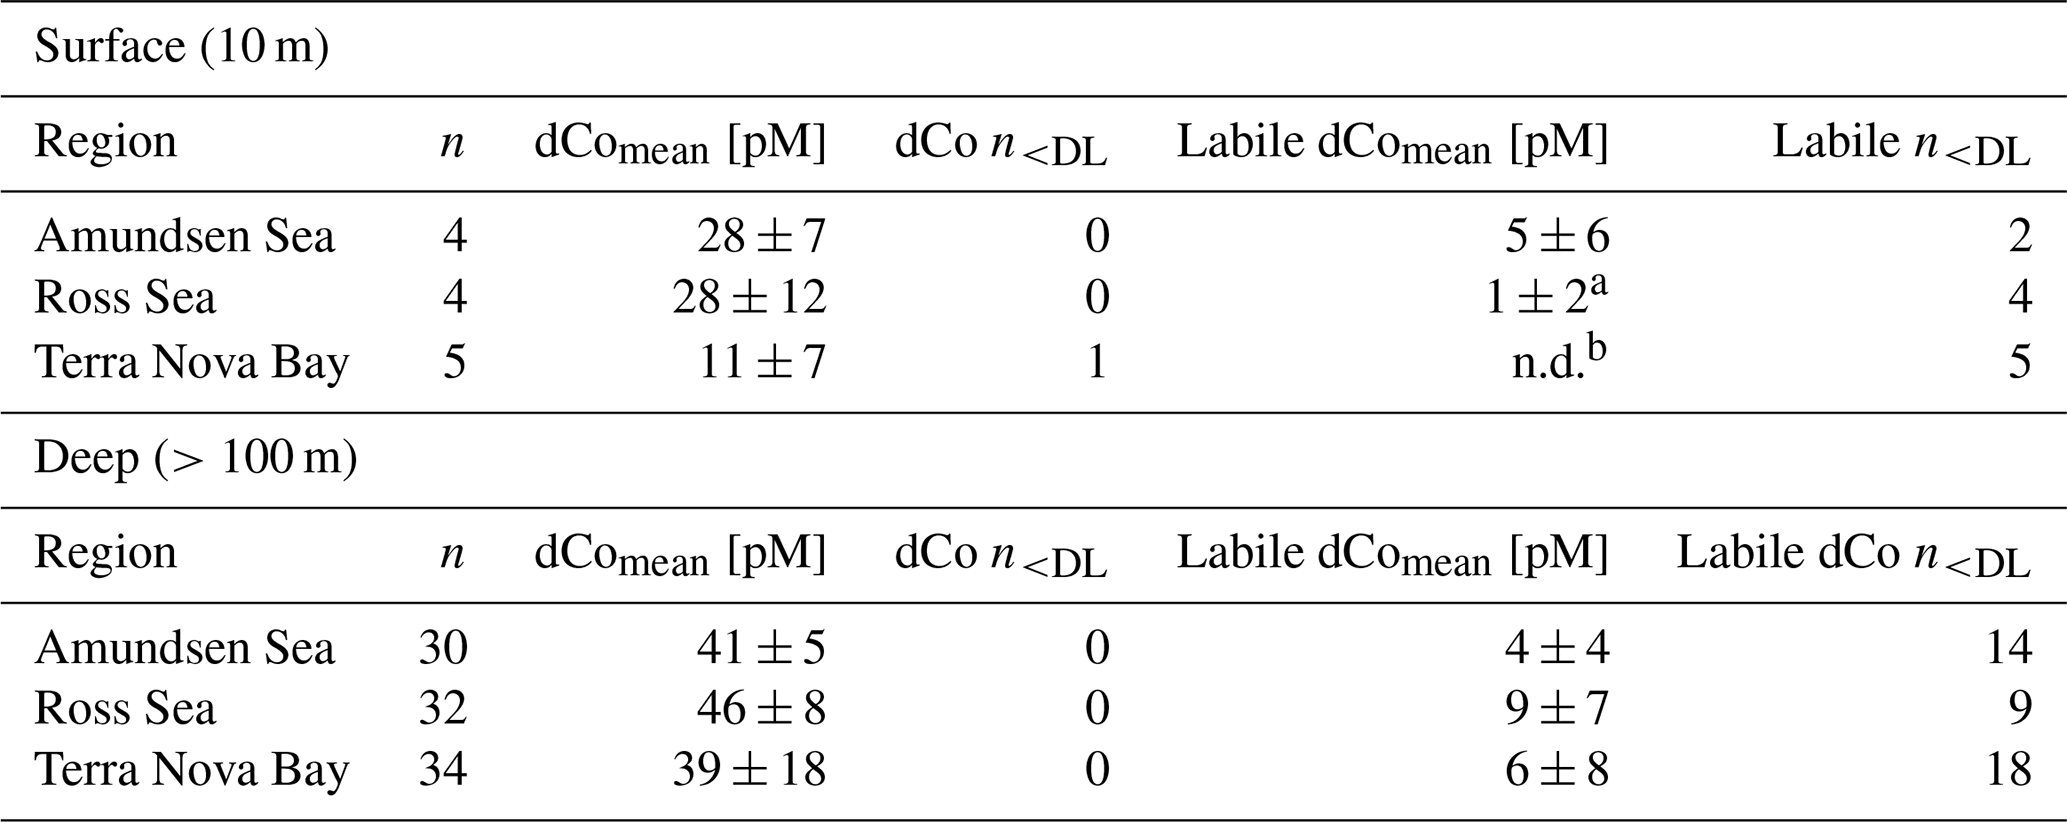
a Of the four surface samples analyzed for labile dCo in the Ross Sea, three were n.d. and the fourth contained 3.5 pM labile dCo. b All surface samples in Terra Nova Bay were n.d. for labile dCo.
In the deep ocean (≥100 m depth), dCo distributions were relatively consistent throughout the water column, with the exception of elevated concentrations of dCo at near-bottom depths. The Amundsen Sea, the Ross Sea and Terra Nova Bay all displayed similar deep dCo concentrations of 41 ± 5 pM (n=30), 46 ± 8 pM (n=32) and 39 ± 18 pM (n=34), respectively (Table 1). The high standard deviation of deep dCo in Terra Nova Bay is partially driven by the elevated near-seafloor signal at station 41 (770 and 780 m); when the two deepest points at station 41 are omitted, the average deep dCo in Terra Nova Bay was 36 ± 10 pM. The CICLOPS expedition included regular near-bottom sampling as allowed by the altimeter aboard the trace metal rosette. As a result, many of the deepest profile samples contained elevated concentrations of dCo and labile dCo along the seafloor, including stations 20, 22, 27, 29, 32, 41 and 57. This deep dCo signal was particularly observable in stations where two near-seafloor samples were taken: one ∼ 10 m above the seafloor and a second ∼ 20 m above the seafloor. At stations 41 and 57, the elevated near-seafloor dCo signal was pronounced (Fig. 2); the samples ∼ 10 m above the seafloor contained 111 and 50 pM dCo, respectively, which represents a 31 and 18 pM increase, respectively, from the samples collected ∼ 20 m above the seafloor. This finding indicates that dCo was elevated in a narrow band close to the seafloor, and it is likely that dCo concentrations continued to increase in the 10 m between the deepest samples and the seafloor.
3.2 Phytoplankton communities in the Amundsen Sea, the Ross Sea and Terra Nova Bay
Stations 11, 15, 22 and 27 exhibited high surface chlorophyll a (Chl a) fluorescence (17–42 mg m−3 at 10 m), characteristic of phytoplankton blooms. The Amundsen Sea stations displayed high concentrations of 19′-hexanoyloxyfucoxanthin (19′-Hex), a pigment commonly used as a proxy for haptophyte biomass. In the coastal Southern Ocean, 19′-Hex is often correlated with Phaeocystis antarctica (DiTullio and Smith, 1996; DiTullio et al., 2003), and it is typical to find concentrated blooms of P. antarctica in these regions, particularly during the highly productive spring blooms of the Antarctic polynyas (Arrigo et al., 1999; DiTullio et al., 2000). The pigment fucoxanthin (Fuco) is commonly used as a proxy for diatom biomass, although it can also be produced by haptophytes like P. antarctica growing under Fe-replete conditions (DiTullio et al., 2003, 2007); Fuco was observed at stations throughout the expedition and tended to be relatively consistent throughout the CICLOPS stations, particularly in comparison to 19′-Hex, which displayed very high concentrations at some stations and much lower concentrations at others. In general, higher concentrations of Fuco were observed within Terra Nova Bay as well as at stations sampled later in the summer season. This is consistent with past observations of summer diatom blooms, which tend to occur after the annual spring bloom where and when dFe is available (Sedwick et al., 2000; Peloquin and Smith, 2007; Saito et al., 2010).
The upper-ocean inventories of three pigments, 19′-Hex, Fuco and Chl a, a proxy for general phytoplankton biomass in the Southern Ocean, were estimated via trapezoidal integration of their profiles between 5 and 50 m depth and compared to the 2005/2006 summer bloom observed on the CORSACS-1 expedition (Fig. 3). In the Ross Sea and Terra Nova Bay, CICLOPS stations contained smaller inventories of Chl a and 19′-Hex compared to the Amundsen Sea, likely reflecting the end of the spring bloom and transition to a summer phytoplankton assemblage in these regions. One noticeable difference between the overlapping 2006 and 2018 January seasons is the larger Fuco inventory in 2006 in both the Ross Sea and Terra Nova Bay compared to the 2018 season, indicating a larger presence of diatom biomass during the CORSACS-1 expedition compared to the CICLOPS expedition despite relatively similar Chl a inventories.
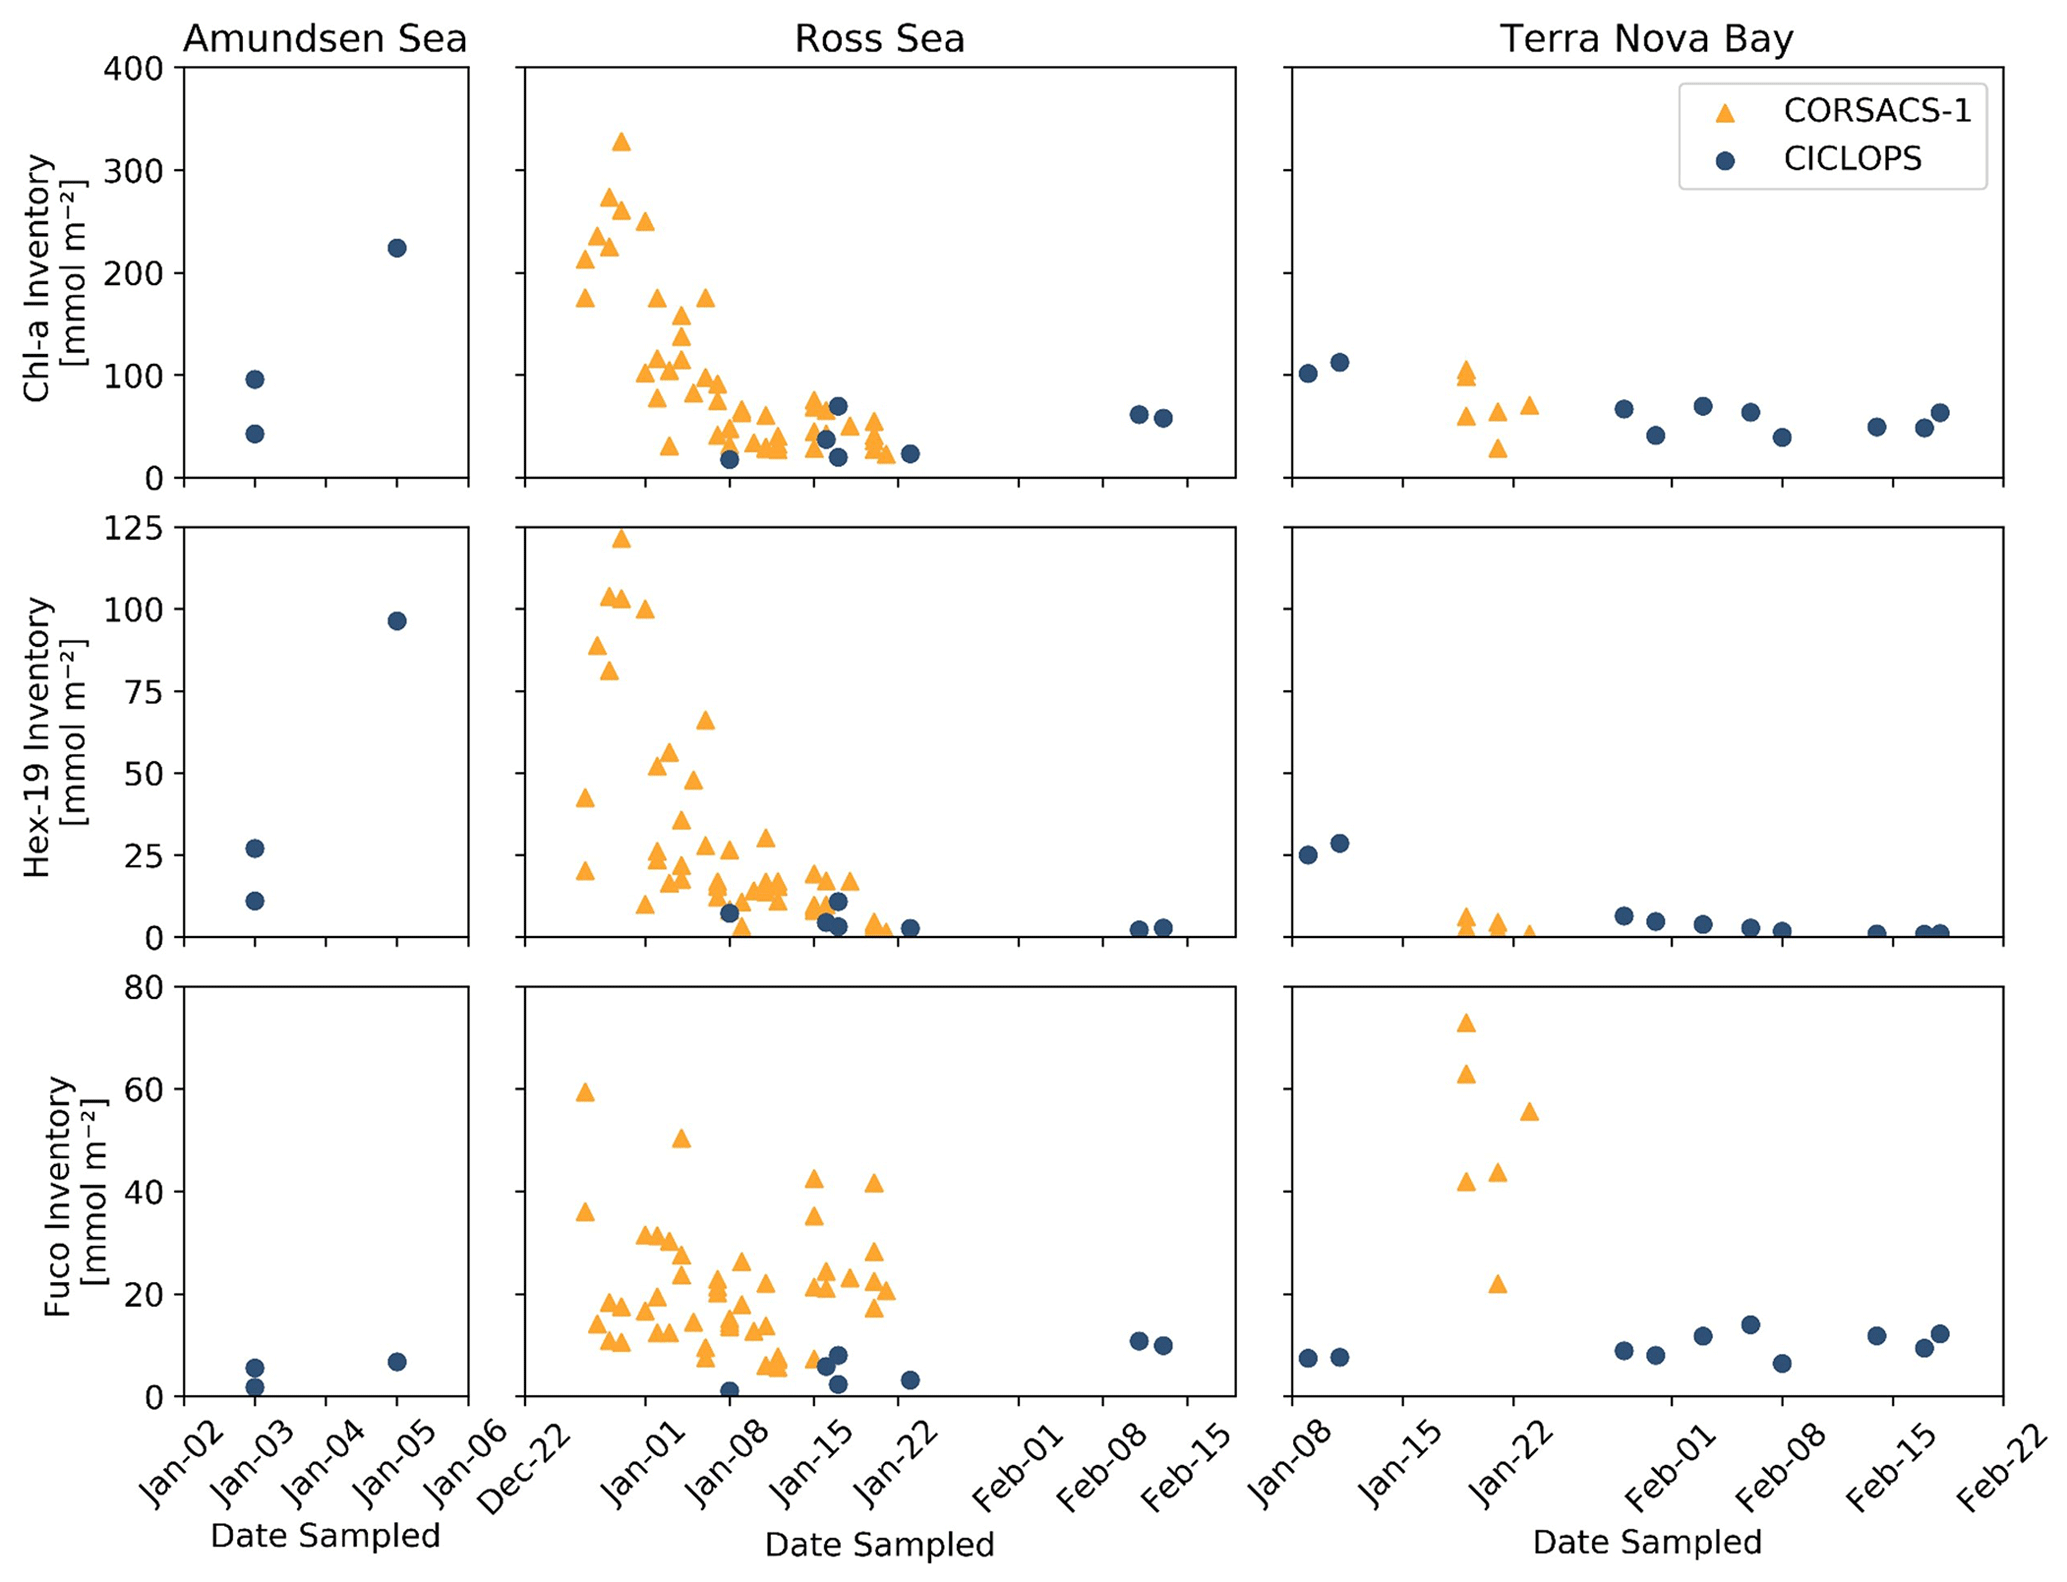
Figure 3Upper-ocean inventories of Chlorophyll a (Chl a), 19′-hexanoyloxyfucoxanthin (19′-Hex) and fucoxanthin (Fuco) plotted over the austral summer season for both the 2005/2006 CORSACS-1 and 2017/2018 CICLOPS expeditions. Inventories were estimated via trapezoidal integration of the pigment depth profiles between 5 and 50 m depth. Note that the dates along the x axis are not continuous between plots of each region, and the y-axis scales differ among the three pigments.
3.3 dZn, dCd and trace metal uptake rates
Dissolved Cd and Zn profiles, as well as trace metal uptake rate (ρM) profiles for Co, Zn and Cd from the CICLOPS expedition, were originally presented in Rao (2020) and Kellogg (2022). This study presents a comparison between dCo distribution and the distribution and uptake of dZn and dCd, two trace metals linked with Co biogeochemical cycling, since all three metals are known to share similar uptake transporter pathways and can be interchangeably utilized as cofactors within specific classes of the enzyme carbonic anhydrase (Sunda and Huntsman, 1995, 2000; Saito and Goepfert, 2008; Kellogg et al., 2020, 2022).
The dZn and dCd profiles observed on the CICLOPS expedition displayed nutrient-like structure, with depleted concentrations near the surface (Fig. 4). In the deep ocean (≥100 m), dZn and dCd concentrations were relatively uniform, displaying average deep concentrations of 4.6 ± 1.1 nM (n=182) and 700 ± 90 pM, respectively (Table 2). Average dissolved metal concentrations in the surface ocean (10 m depth) were higher in the Amundsen Sea (2.5 ± 1.2 nM dZn; 450 ± 170 pM Cd) compared to the Ross Sea (1.1 ± 1.2 nM dZn; 250 ± 170 pM dCd) and Terra Nova Bay (0.87 ± 0.42 nM dZn; 130 ± 170 pM dCd). This trend of decreasing surface dissolved metals from the Amundsen Sea to Terra Nova Bay was mirrored in the dCo distributions and could be explained by the seasonal drawdown of metal nutrients in the mixed layer over time, differences in the metal uptake of phytoplankton in the different regions or both phenomena occurring simultaneously.
Table 2Mean dZn and dCd values from the surface ocean (10 m) and the deep ocean (>100 m) in the three regions sampled.
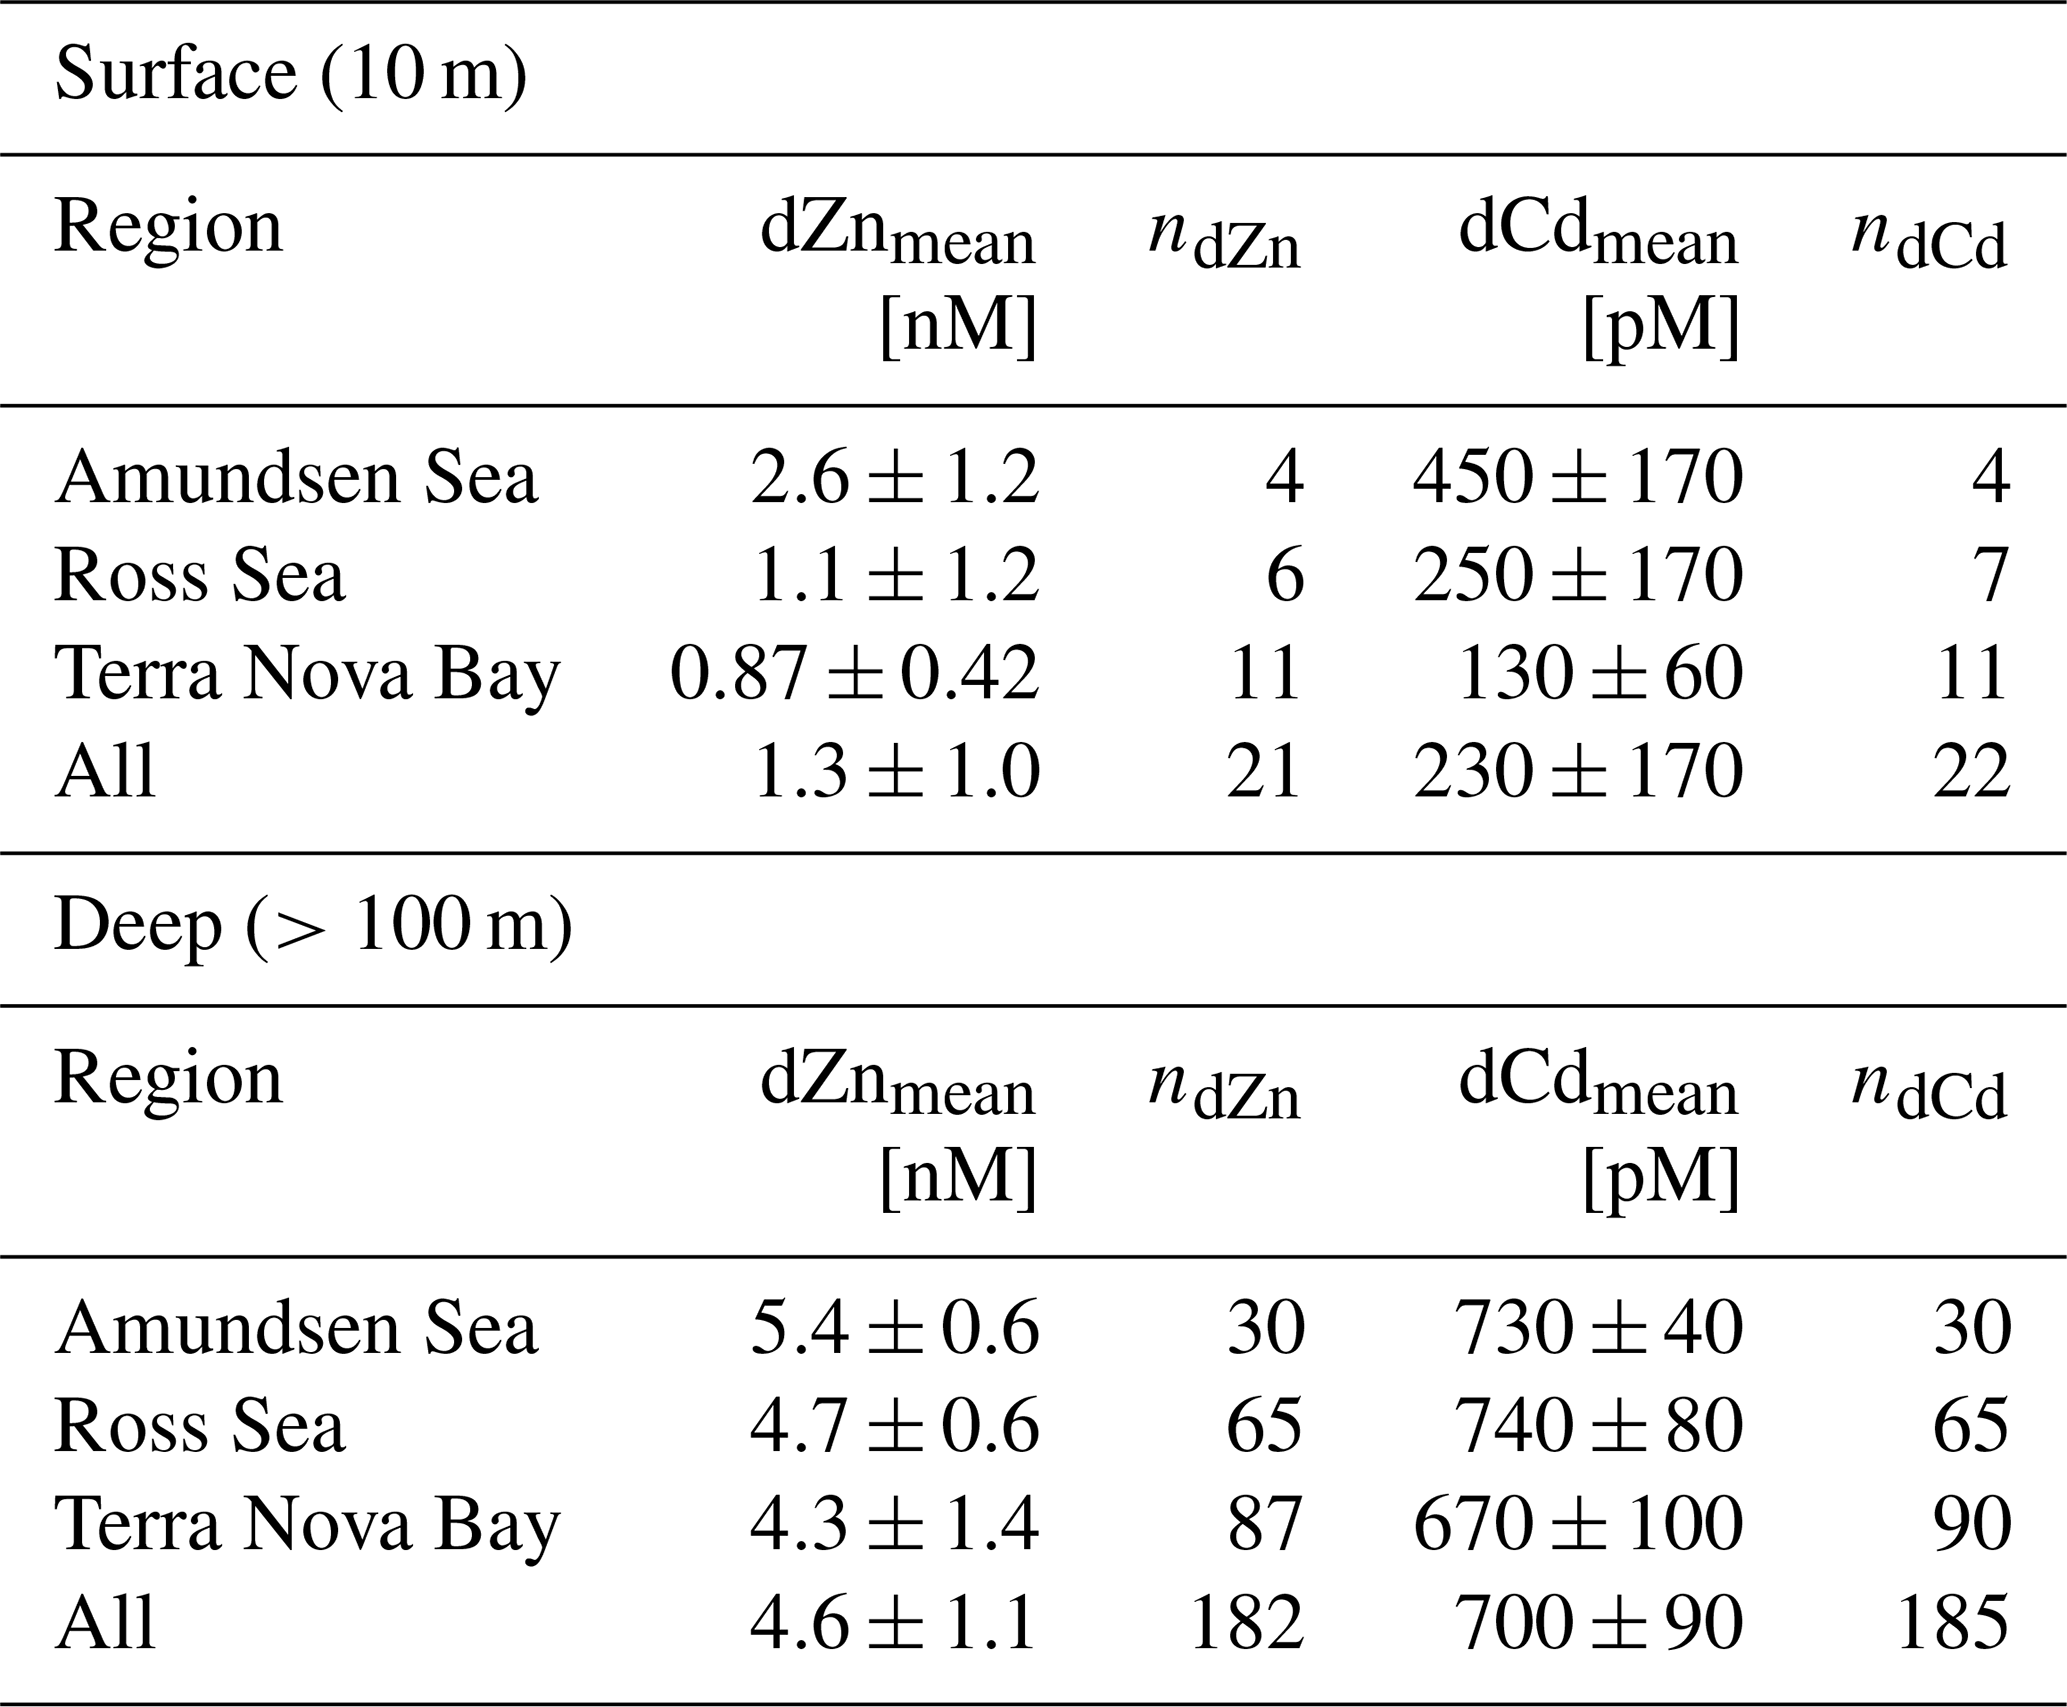
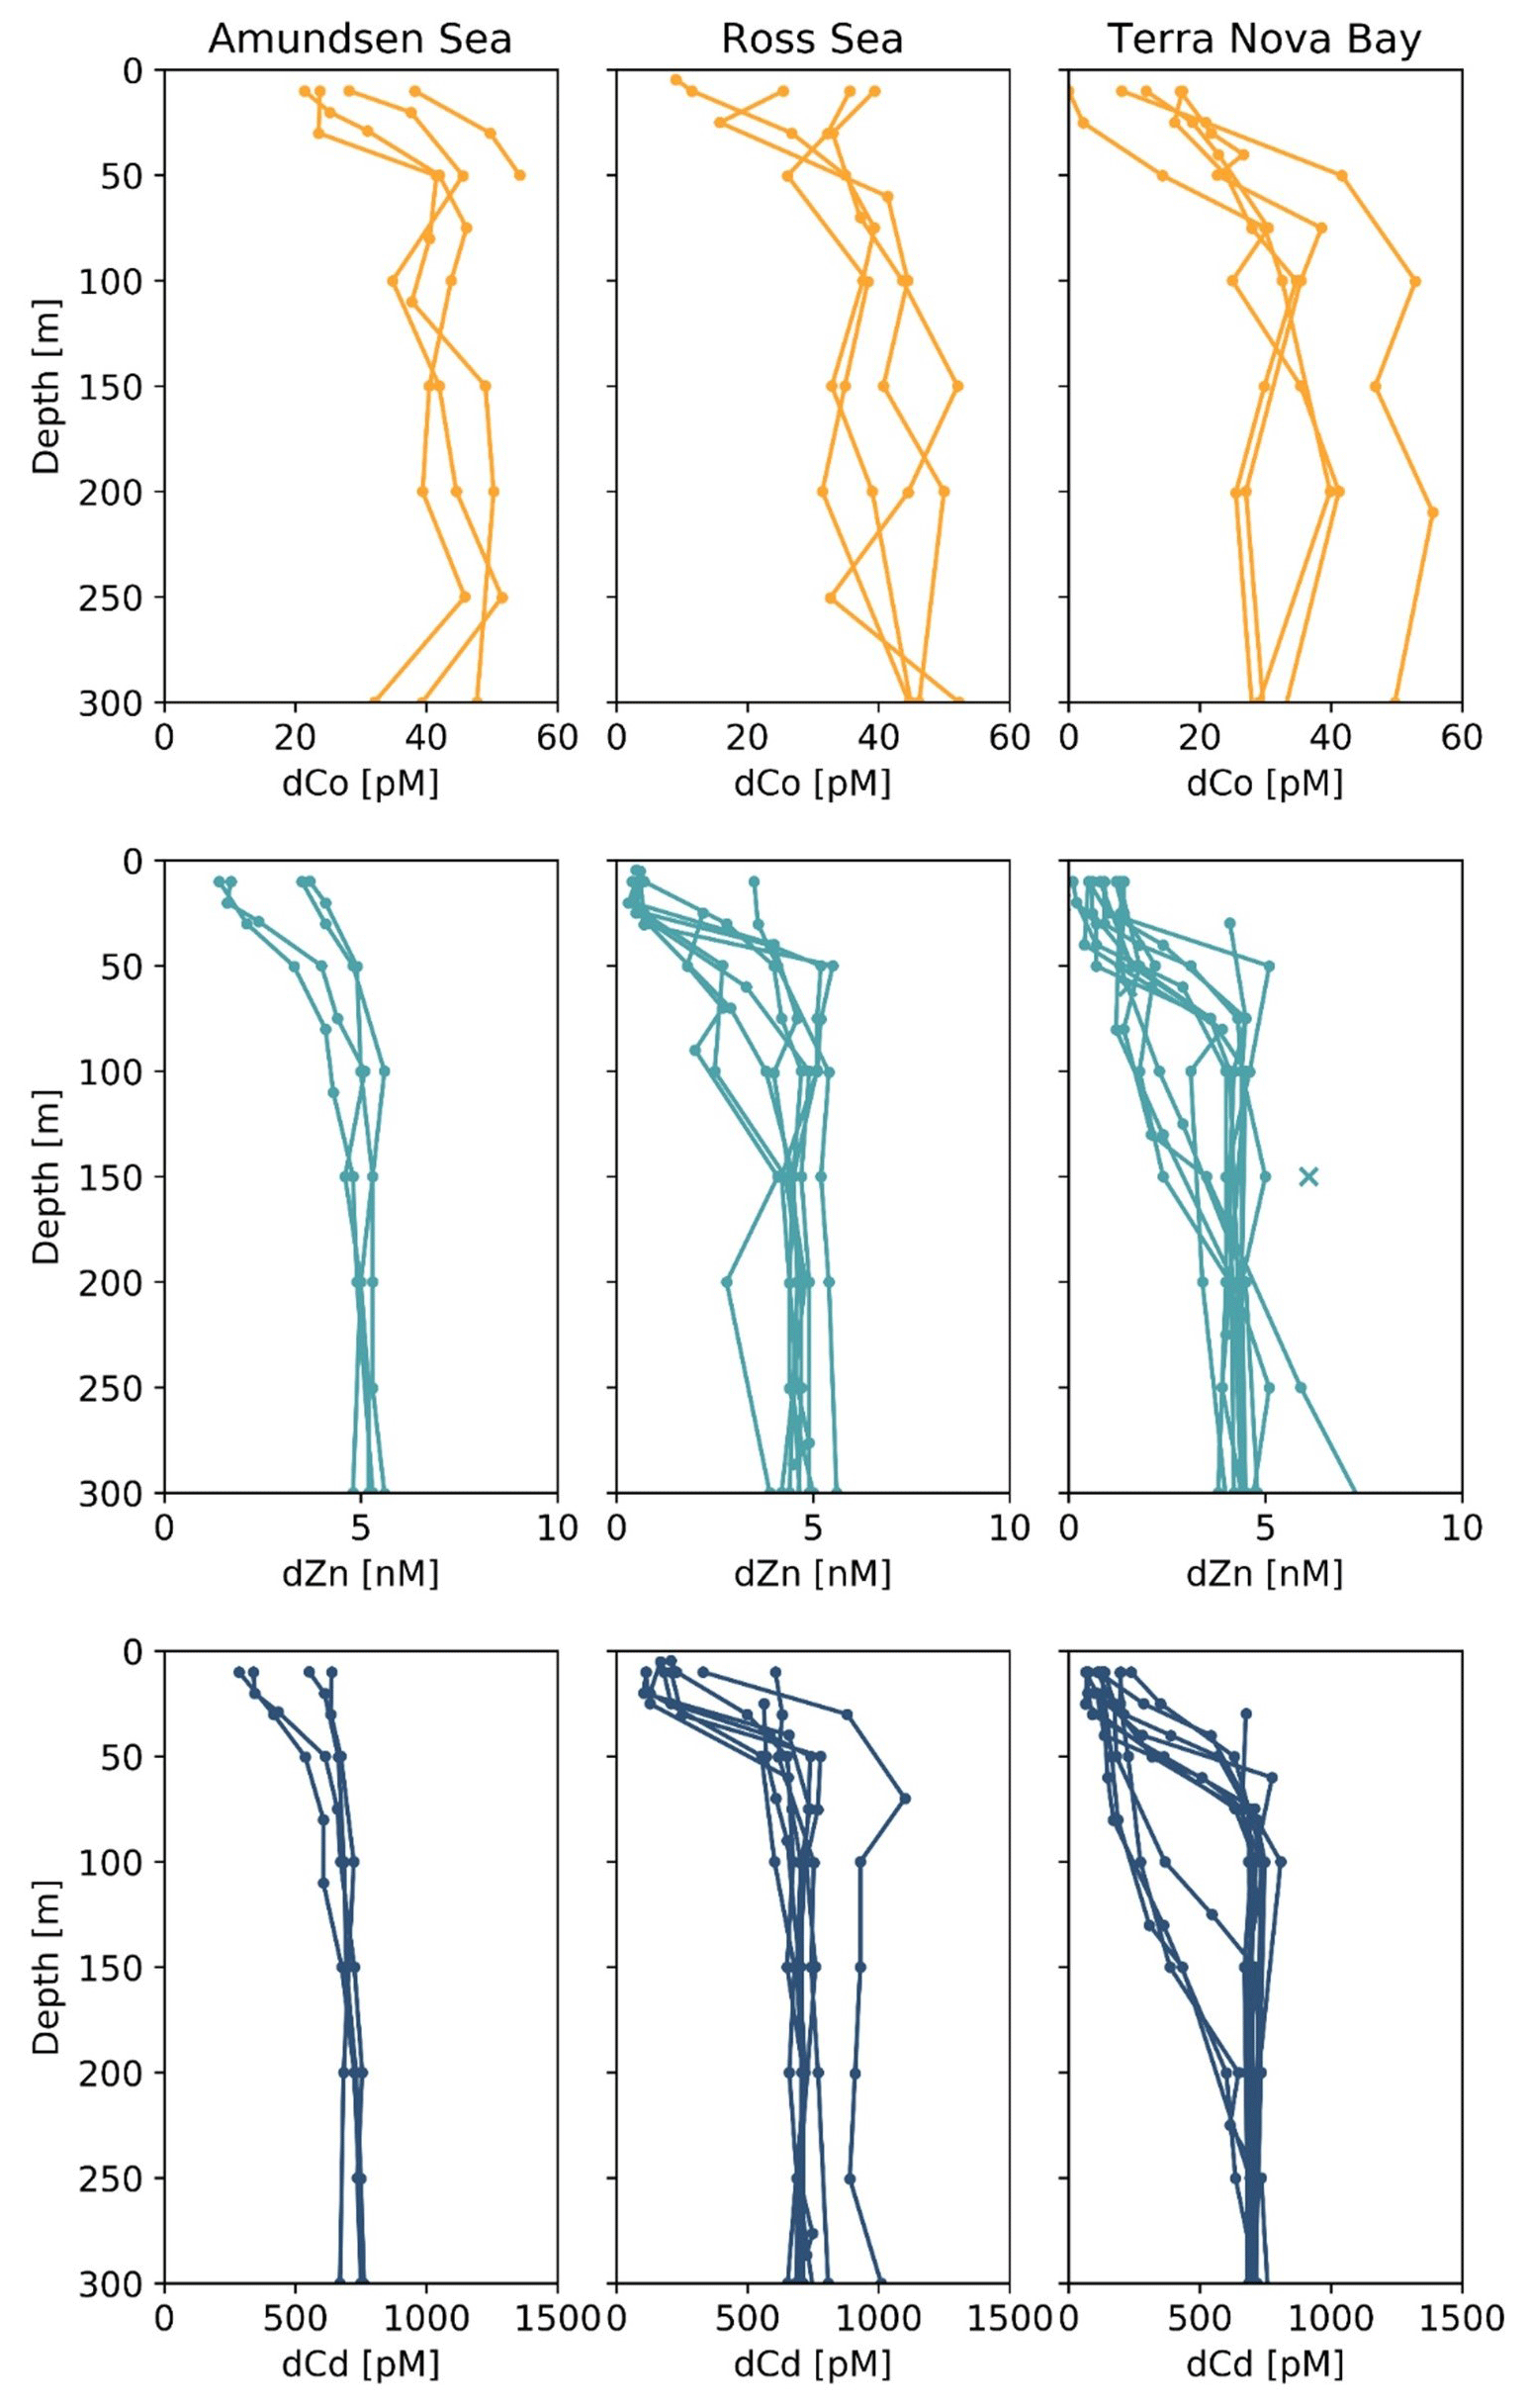
Figure 4Upper-ocean trace metal depth profiles of dCo, dZn and dCd by region (left panels, Amundsen Sea; middle panels, Ross Sea; right panels, Terra Nova Bay). Outliers are marked with an X. Dissolved Zn and Cd profile data are further described in Kellogg (2022).
At stations 4, 11, 20, 22 and 57, uptake rates of Co, Zn and Cd within seawater collected from 0–200 m were determined via spiked-isotope incubations (Rao, 2020; Kellogg, 2022). The relative ratios of the resulting uptake profiles from biomass collected onto 3 µm filters provide insight into the demand for Co, Zn and Cd of eukaryotic phytoplankton in coastal Antarctica (Fig. 5). Note that Co uptake within the bacterial size fraction (0.2–3 µm) was also analyzed and the results are presented in Rao (2020), but here we present the results of the eukaryotic size fraction (>3 µm) to best represent the present eukaryotic phytoplankton community and compare to the Zn and Cd uptake experiments. It should be noted that uptake rates measured via tracer addition and shipboard incubations represent potential uptake and may be overestimations of the environmental nutrient uptake rates because the isotope tracer addition was labile – not at equilibrium with the natural seawater ligands – and could have perturbed the natural micronutrient inventories. The 57CoCl2 addition (0.1 pM) was likely a small enough addition that the inventory was not significantly disturbed, but added concentrations of 67ZnO (2 nM) and 110CdO (300 pM) were not tracer-level additions and necessarily increased the existing trace metal inventories, possibly leading to the overestimation of total metal uptake rates (Rao, 2020; Kellogg, 2022).
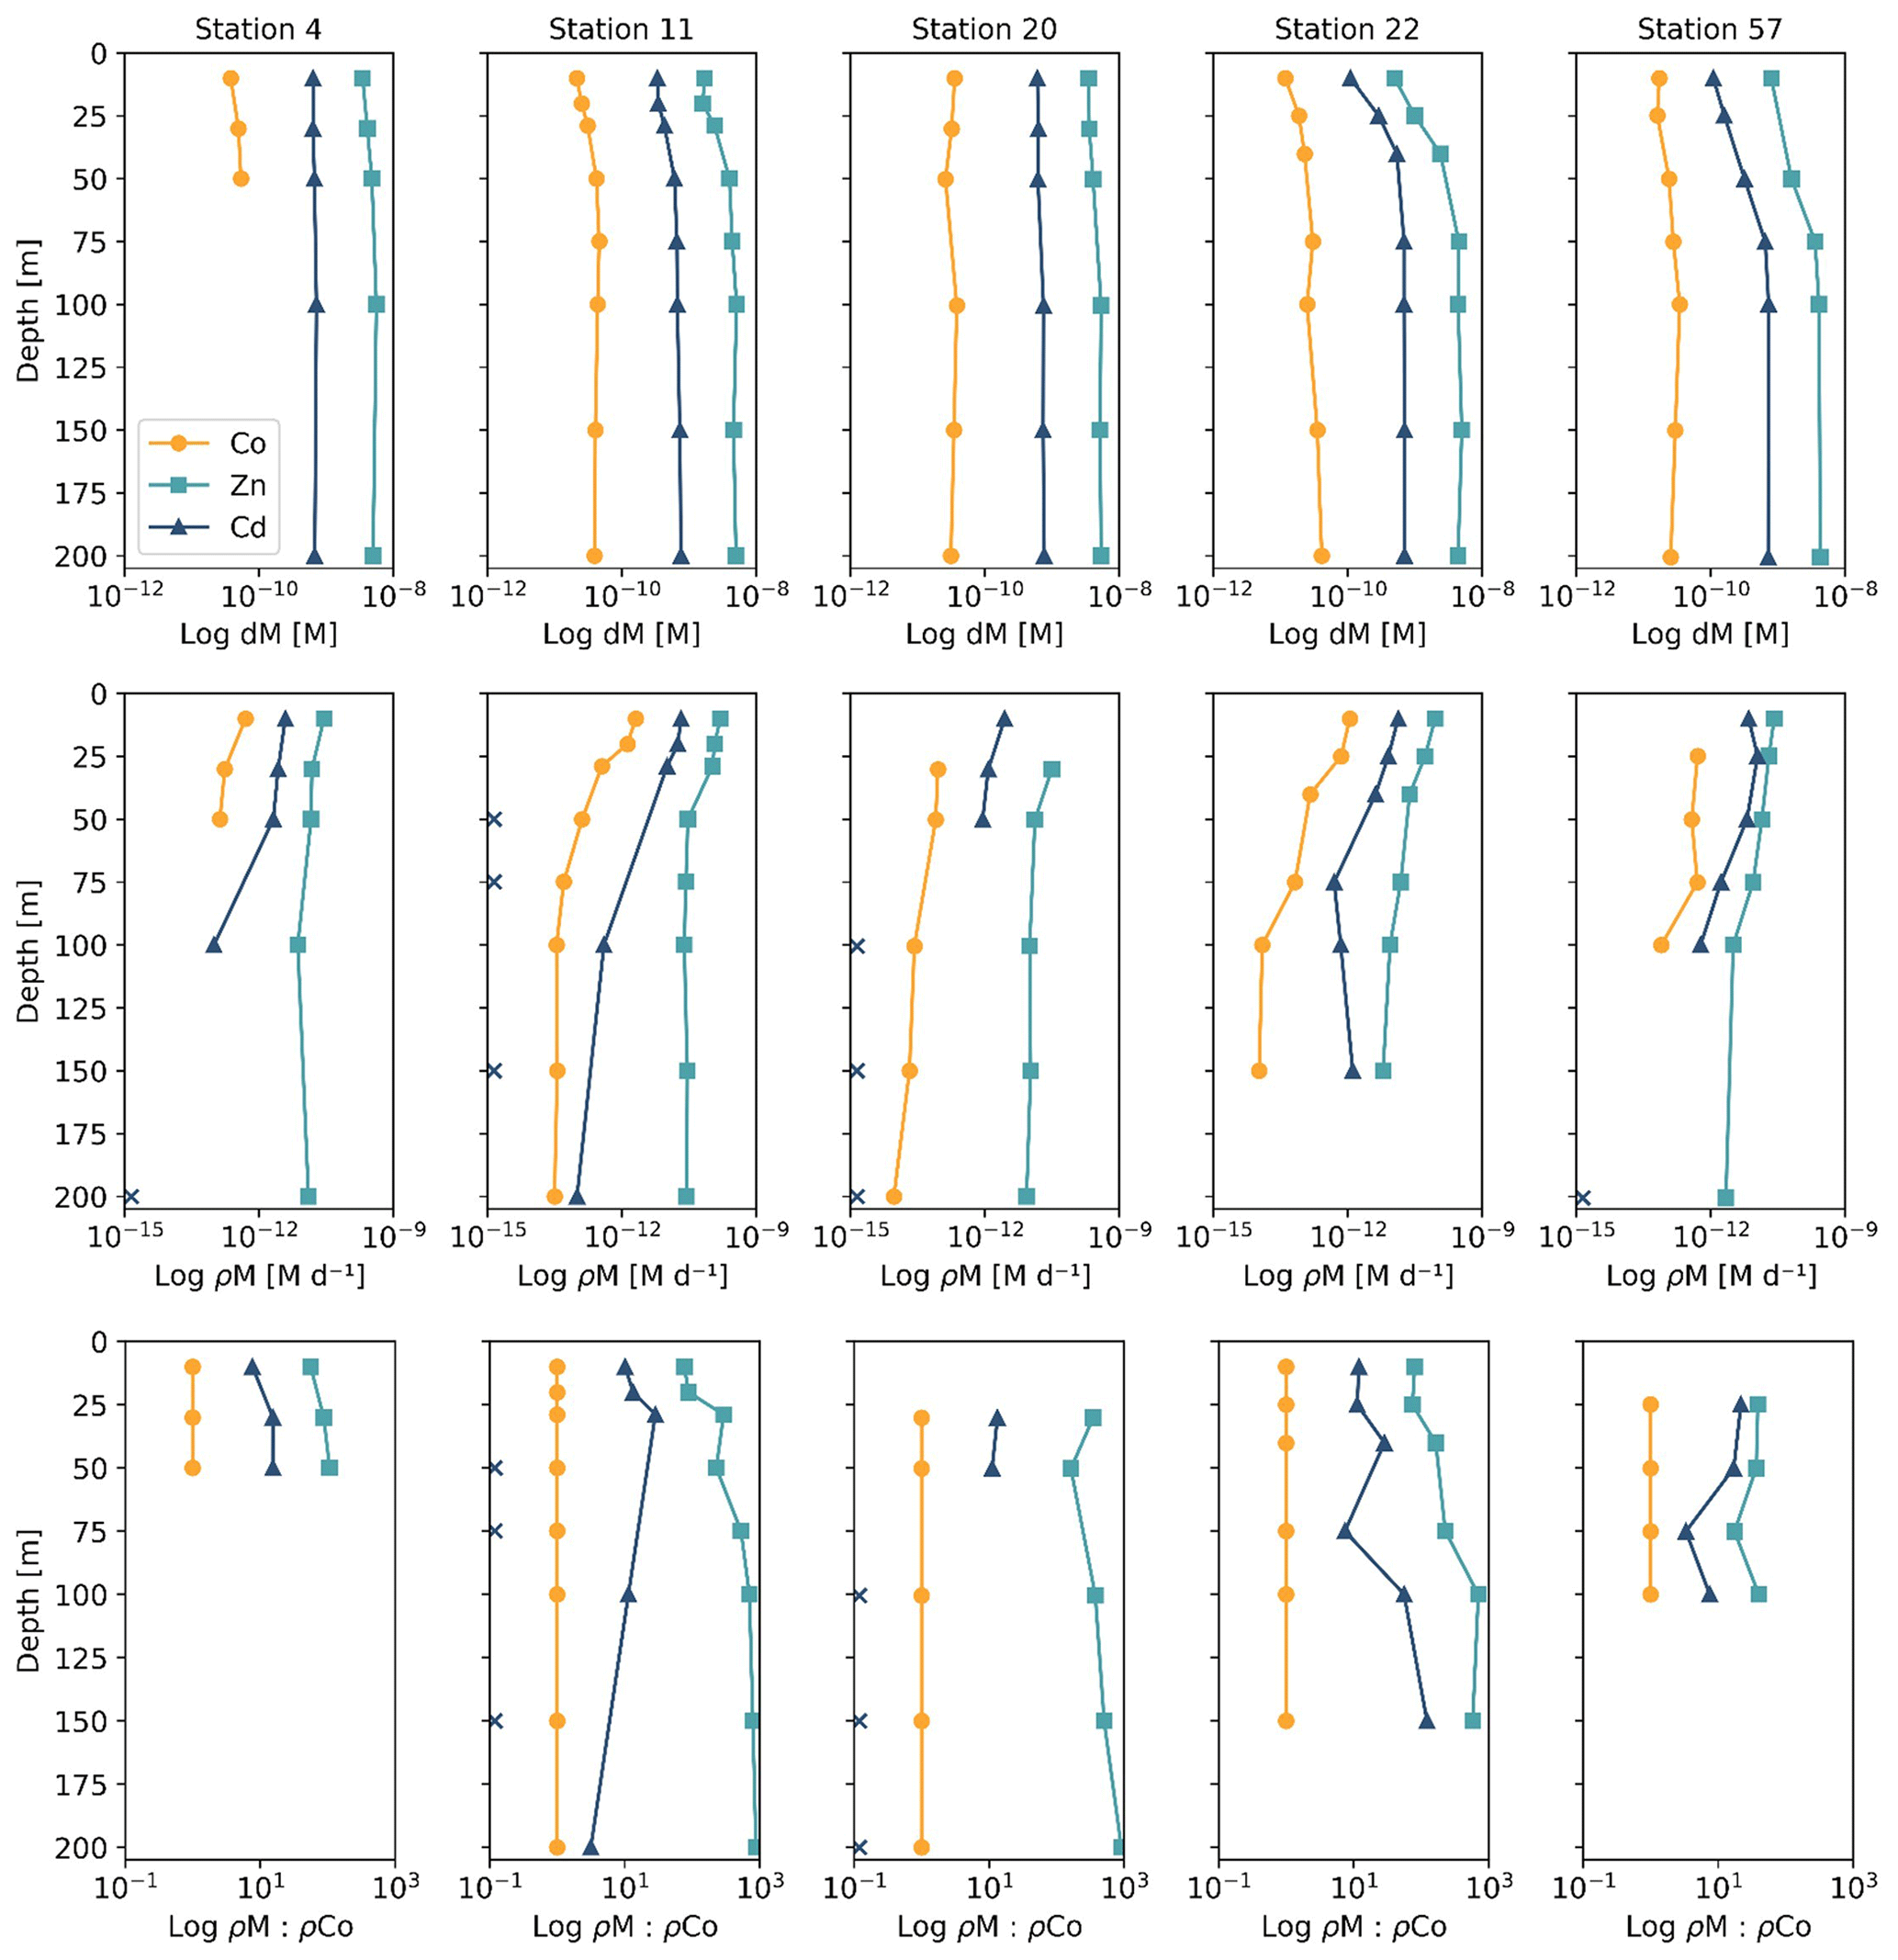
Figure 5Depth profiles of dissolved metals (dM; top), trace metal uptake rates (ρM; middle) and trace metal uptake rates normalized to the uptake rate of dCo (ρM : ρCo) plotted along a log scale. Stations 4 and 11 are from the Amundsen Sea, station 20 is from the Ross Sea, and stations 22 and 57 are from Terra Nova Bay. Depths at which an uptake rate is below detection (specifically for ρCd) are marked with an X along the y axis. Co trace metal uptake data are further described in Rao (2020), and Zn and Cd uptake data are further described in Kellogg (2022).
Of the five stations with uptake rate data from all three trace metals of interest, four (stations 4, 11, 20 and 22) were from a transect conducted from the Amundsen Sea to Terra Nova Bay and were sampled within a span of 10 d from 31 December 2017 to 9 January 2018, while the last station (station 57) was sampled later in the summer on 6 February 2018; this range of stations allows us to assess the uptake stoichiometry along both spatial (location) and time (bloom progression) dimensions. The ρM profiles displayed an increase in metal uptake of Co, Zn and Cd towards the surface, a shape which was mirrored in the lower dissolved trace metal concentrations of the surface ocean, suggesting the influence of phytoplankton uptake on the drawdown of micronutrients in the photic zone. The stoichiometry of ρM among Co, Zn and Cd tended to directly follow the metals' availability as dissolved species: Co, which is present at the lowest concentrations of ∼ 10−11 M, was taken up at rates ranging between 10−13 and 10−12 M d−1; Cd, at concentrations of ∼ 10−10 M, was taken up at rates of 10−12 to 10−11 M d−1; and Zn, present in the highest concentration of ∼ 10−9 M, was taken up at rates of 10−12 to 10−10 M d−1. This observation reveals order-of-magnitude differences in biological uptake between the three metals, matching patterns of metal availability in the water column.
4.1 Biogeochemical Co cycle processes observed via dCo profiles and dCo : phosphate stoichiometry
Low surface ocean dCo and labile dCo concentrations are attributable to uptake by phytoplankton and bacteria in the Southern Ocean, giving the dCo and labile dCo vertical profiles a distinct nutrient-like shape (Fig. 2). The labile dCo fraction was extremely low or below the limit of detection in surface waters, particularly within Terra Nova Bay, indicating strong drawdown of the labile fraction and nearly 100 % complexation of dCo in the water column. Labile dCo is considered to be more bioavailable than strongly bound dCo and thus is likely to be preferentially taken up by microbes when available. This labile dCo may then be rapidly cycled by phytoplankton in the mixed layer, and any labile dCo released via remineralization, cell lysis or grazing would be promptly taken up by other algae and microbes. A rapid turnover of labile dCo suggests a high demand for bioavailable Co from the surface phytoplankton community.
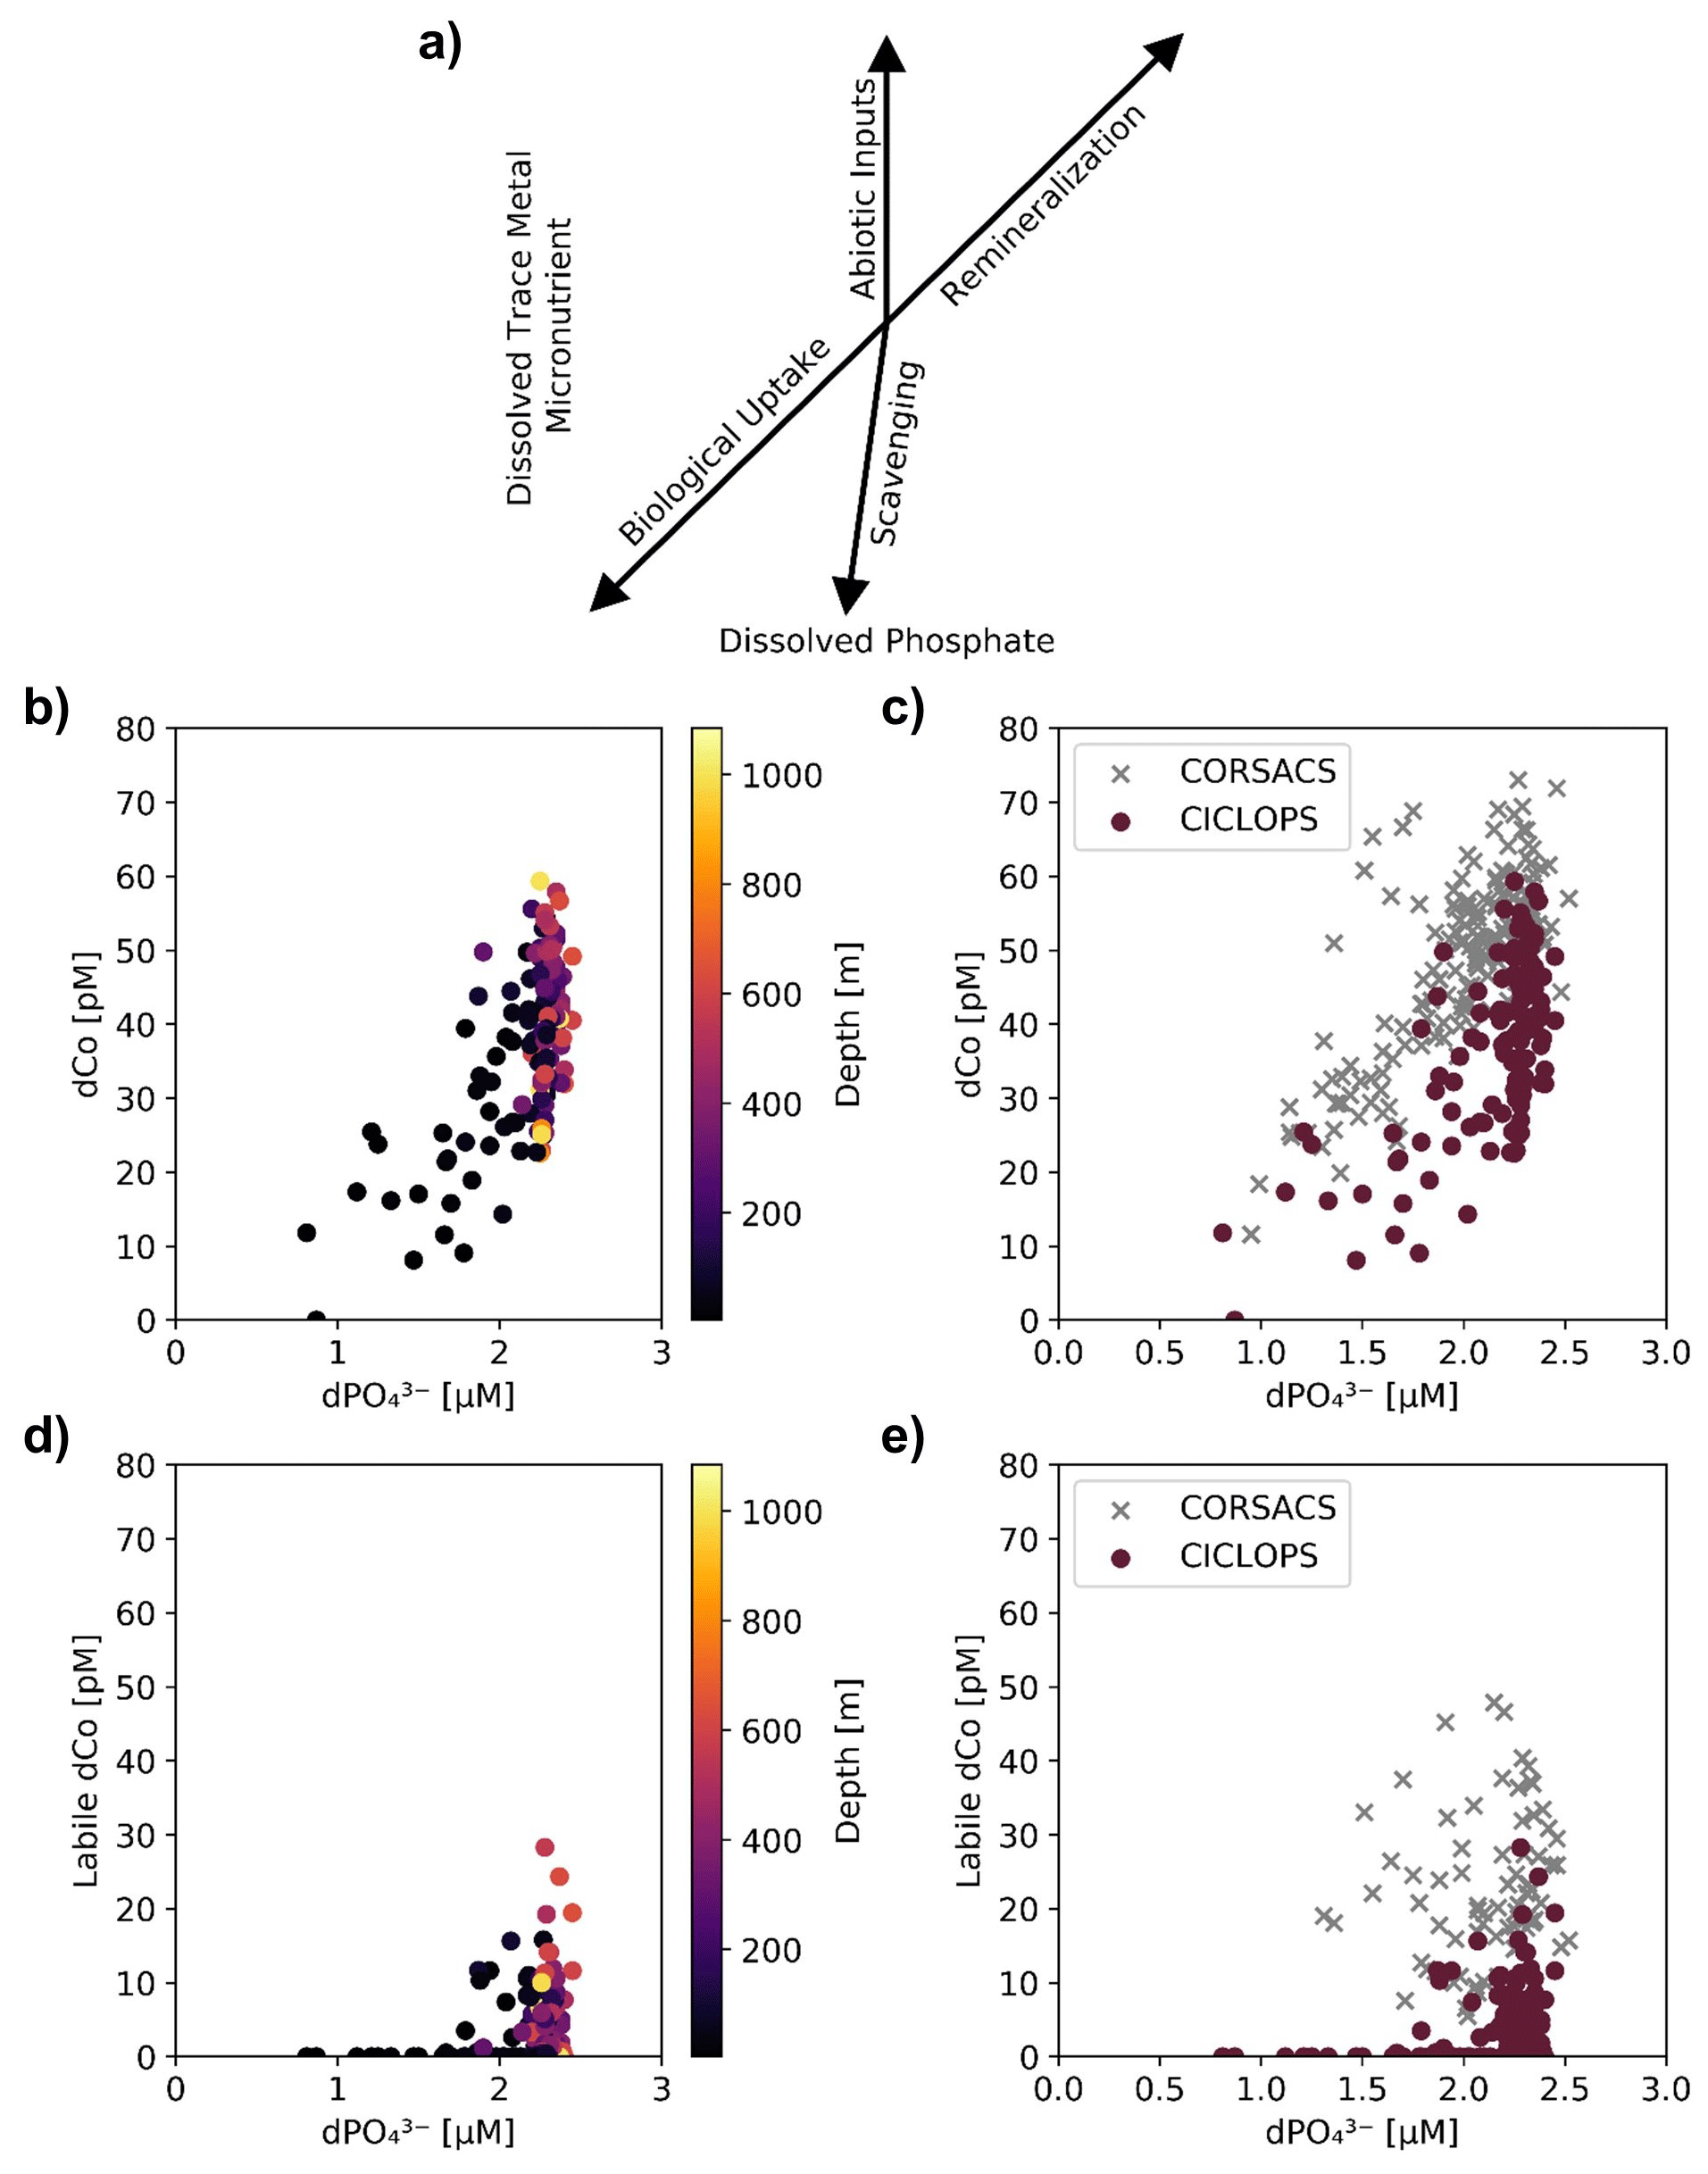
Figure 6(a) A vector schematic of the relationship between dPO and dissolved trace metals like dCo and how the various marine processes can affect their distribution and environmental stoichiometry, adapted from Noble et al. (2008). The CICLOPS (b) dCo vs. dPO relationship and (d) labile dCo vs. dPO relationship, plotted by depth. Also shown are the CICLOPS (red) (c) dCo vs. dPO and (e) labile dCo vs. dPO samples overlaid with CORSACS (gray) samples.
Dissolved Co and dissolved phosphate (dPO) displayed a generally positive relationship in the upper ocean, which is indicative of the co-cycling of both nutrients via phytoplankton uptake and remineralization (Fig. 6a). The processes of biological uptake and remineralization, when observed along dCo vs. dPO axes, can be represented by vectors with positive slopes and opposite directionality. Abiotic dCo inputs and Co scavenging processes can be represented by vertical or near-vertical vectors because they decouple the cycling of dCo and dPO. The positive dCo vs. dPO linear relationship that is often observed within the ocean's mixed layer can exhibit a variety of slopes that are dictated by the nutrient uptake and remineralization stoichiometry of the microbial community (Saito et al., 2017). On CICLOPS, the dCo vs. dPO relationship displayed a drawdown of both dCo and dPO in the upper ocean, and the labile dCo vs. dPO relationship revealed the stark lack of labile dCo throughout the upper ocean (Fig. 6b, d). The dCo vs. dPO slope in the upper ocean (0–100 m depth) was found to be distinct for each of the three regions sampled on the expedition; the Ross Sea displayed the highest slope (74 ± 18 µmol : mol), followed by the Amundsen Sea (47 ± 9 µmol : mol) and Terra Nova Bay, which displayed the lowest dCo vs. dPO slope (26 ± 4 µmol : mol; Fig. 7; Table 3). These slopes reflect a relatively wide range of dCo stoichiometries that vary by a factor of 2.8 between the lowest and highest slopes observed. For comparison, the 2005/2006 CORSACS-1 and CORSACS-2 Ross Sea data points were pooled, and the dCo vs. dPO slope was recalculated (originally reported as 37.6 µmol : mol between 5–500 m depth; Saito et al., 2010) to fall within the same depth window (0–100 m). The resulting slope fell within the range of slopes observed on CICLOPS (49 ± 4 µmol : mol; R2=0.57; n=106).
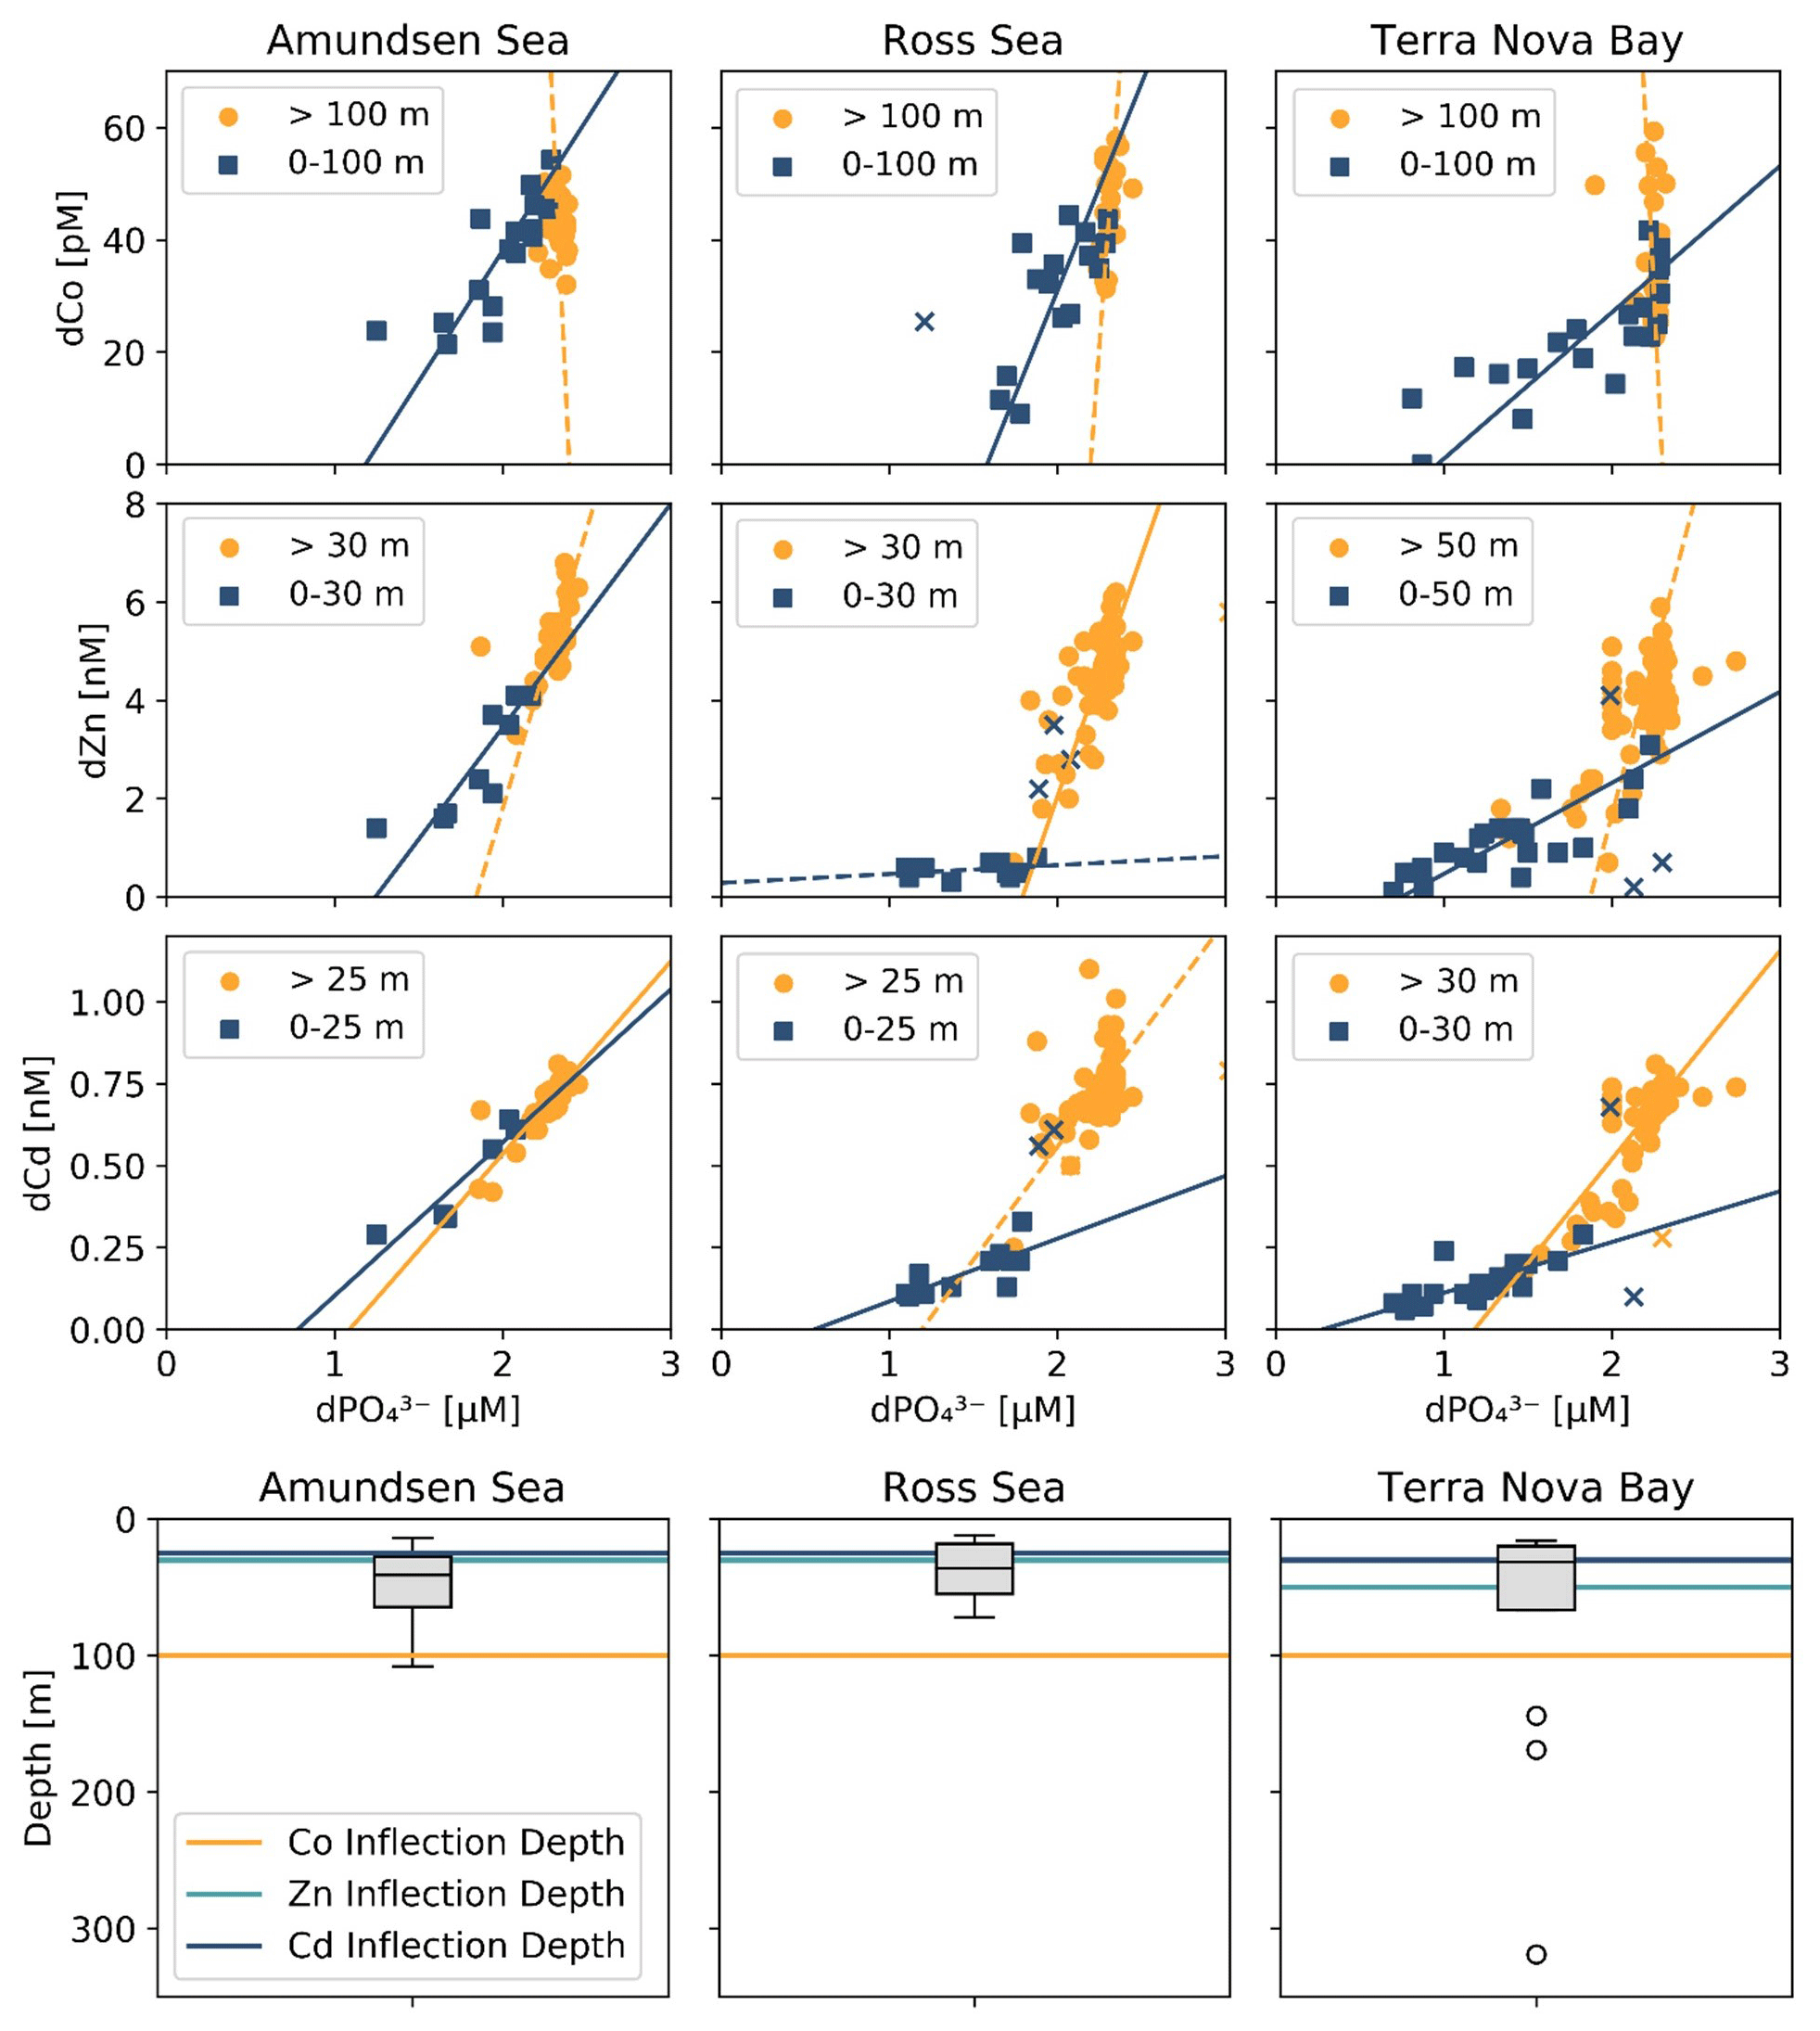
Figure 7Trace metal : dPO relationships from the three CICLOPS regions sampled, divided into upper-ocean (blue square) and deep-ocean (orange circle) bins with a manual depth threshold (or inflection point depth) selected to optimize the linear fit of the upper- and deep-ocean trends (top 3 rows). Regressions with an R2≥0.50 are shown as a solid line, and those with an R2<0.50 are shown as a dotted line. The results of the linear regressions are given in Table 3. Regression outliers were selected by hand when including them in the linear regression substantially decreased its R2 value; outliers are marked with an X. The inflection point depths assigned to the dCo, dZn and dCd relationships are shown compared to a box-and-whisker plot of the mixed layer depths, with mixed layer depth outliers marked with the symbol “∘” (bottom row).
Table 3Trace metal : dPO stoichiometric regressions for dCo, dZn and dCd in both the surface and deep ocean of the Amundsen Sea, the Ross Sea and Terra Nova Bay, as shown in Fig. 7. Linear regression slopes with R2<0.50 are not shown, as the slope values should not be considered meaningful stoichiometric values.
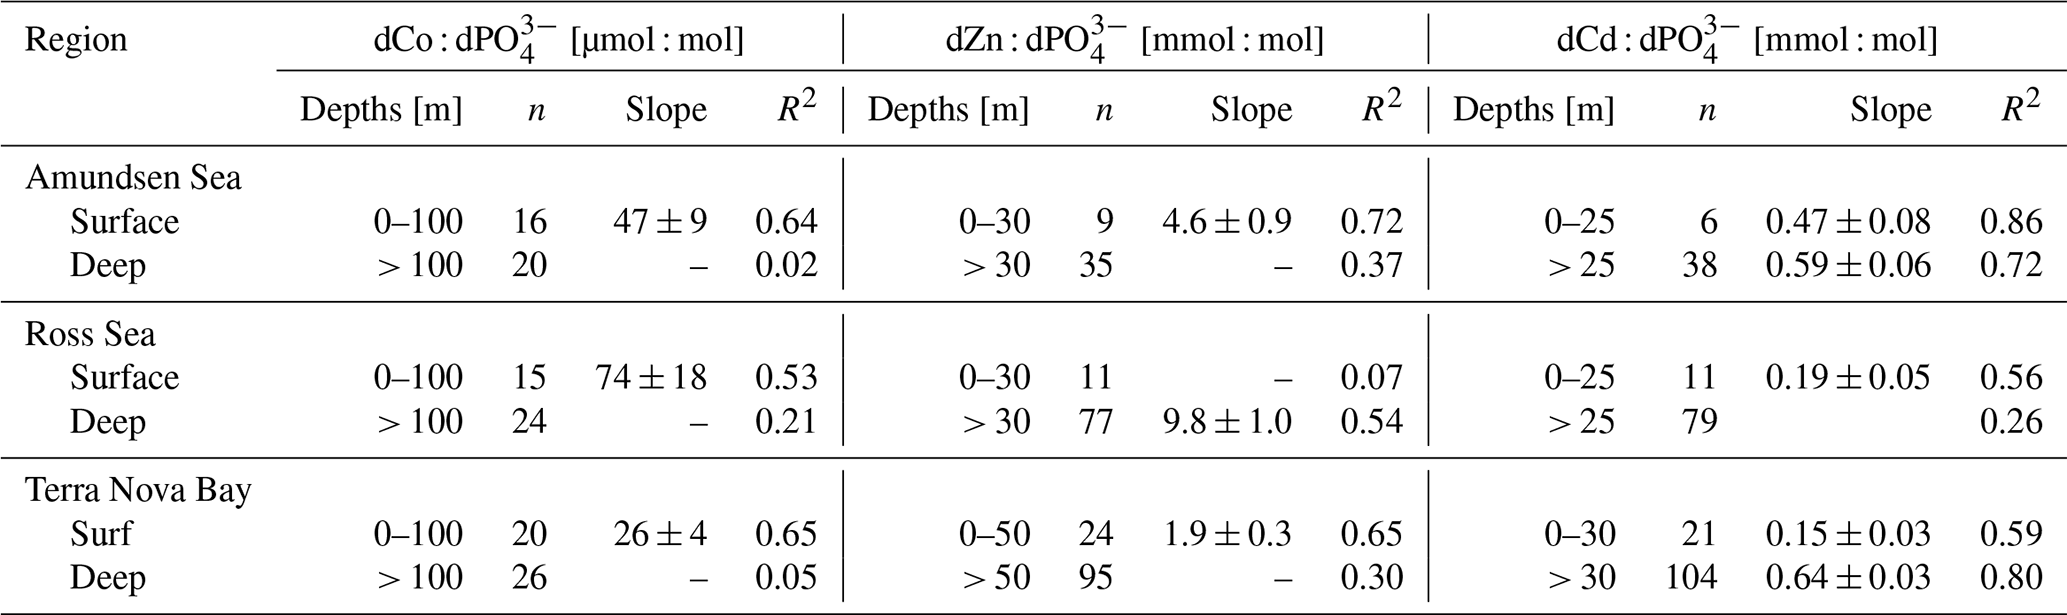
The range of dCo vs. dPO slopes reflects the elasticity of cobalt uptake stoichiometry in the upper ocean, which varies by microbial community and the availability of dCo and other nutrients. Due to the number of factors that can affect the environmental stoichiometry of trace metal nutrients, the dCo vs. dPO slope must be interpreted alongside other information about the marine environment, such as the available dCo inventory and the local nutrient limitation regime, making global comparisons of dCo : dPO stoichiometry complex. The lower stoichiometric slope observed in Terra Nova Bay compared to the Ross and Amundsen seas likely indicates not a lack of demand for Co by phytoplankton but the low availability of Co in the surface ocean despite high demand for the metal. Terra Nova Bay was found to have the lowest average surface dCo, dZn and dCd concentrations of the three regions studied, and both Terra Nova Bay stations where ρCo was measured (stations 22 and 57) displayed higher surface Co uptake rates (0.71 and 0.51 pM d−1, respectively, at 25 m depth) than station 20 in the Ross Sea (0.09 pM d−1 at 30 m depth). It is likely that the lower dCo stoichiometry in Terra Nova Bay was driven by nutrient drawdown and low availability of labile dCo in the region resulting from productive phytoplankton blooms. Remineralization would also have played a role in setting the dCo vs. dPO4 slope below the photic zone; a remineralization vector with a relatively low slope indicates that there was a lower dCo source from particulate Co biomass and a rapid turnover of recycled dCo back into biomass, suggesting a tight coupling of the dissolved and particulate phases.
Deviations from the linear uptake–remineralization line in the dCo vs. dPO relationship occur when dCo distributions become decoupled from dPO or vice versa, as with Co scavenging onto particles and lithogenic dCo sources. In other ocean regions, the dCo vs. dPO relationship displays a characteristic “curl” towards the high dPO, low dCo in deeper waters, resulting from the net vector sum of both remineralization, which increases both dPO and dCo, and scavenging to Mn oxides, which removes dCo in excess of dPO from the water column (Noble et al., 2008; Hawco et al., 2017; Saito et al., 2017). The dCo vs. dPO relationship observed on CICLOPS, however, displayed no such scavenging curl, indicating no clear signal of dCo loss due to scavenging, at least within timescales relevant to water column mixing. This finding is consistent with previous studies of the Ross Sea that have also observed little evidence of dCo loss via scavenging in the mesopelagic (Saito et al., 2010; Noble et al., 2013). The lack of a visible scavenging signal may be attributable to the deep winter mixed layers of coastal Antarctic seas that reach depths of up to 600 m and can extend to the seafloor (Smith and Jones, 2015). This deep vertical mixing allows the dCo : dPO ratio in the deep ocean to reset on an annual timescale, potentially erasing any signals of dCo scavenging, which would be expected to occur on a timescale of decades to centuries (Hawco et al., 2017). Additionally, Oldham et al. (2021) concluded that a suppressed Co scavenging flux might be the result of a unique Mn cycle in the Ross Sea, characterized by low to undetectable concentrations of Mn oxide particles, slow rates of Mn oxide formation and the stabilization of organic dissolved manganese (dMn) via Mn(III) ligands (Oldham et al., 2021).
4.2 Elevated dCo concentrations within a benthic nepheloid layer
The elevated dCo signal observed from several depths within 20 m of the seafloor was sourced from a benthic nepheloid layer: a near-seafloor region of the water column characterized by high particle abundance, turbulence and isopycnal movement of both dissolved and particulate material along the seafloor (Gardner et al., 2018). The Ross Sea has been observed to display strong nepheloid layers as cold, dense water flows northward along the Ross Sea shelf until it reaches the shelf break, carrying suspended sediments with it along the seafloor (Budillon et al., 2006). Nepheloid layers tend to be enriched in dissolved trace metals like dFe and can act as a source of micronutrients if upwelled to the surface ocean (Marsay et al., 2014; Noble et al., 2017). Elevated dCo concentrations within the Ross Sea nepheloid layer are a novel finding, as previous expeditions analyzing dCo concentrations in the Ross Sea did not sample as close to the seafloor as the CICLOPS trace metal rosette was able to (Fitzwater et al., 2000; Saito et al., 2010; Noble et al., 2013). This finding is evidence of a dCo source to the deep ocean that may be upwelled to intermediate- and upper-ocean waters via vertical mixing.
4.3 Decreased Ross Sea dCo and labile dCo inventories
The dCo and labile dCo profiles observed along the 2017/2018 CICLOPS expedition displayed similar vertical structures as those observed along the 2005/2006 CORSACS expeditions; however, the CICLOPS dCo and labile dCo concentrations were notably lower throughout the water column compared to the CORSACS datasets (Fig. 8). This trend was particularly clear in the Ross Sea, where the stations from both expeditions contained the greatest regional overlap (Fig. A1), and labile dCo distributions from the prior 2006 CORSACS-2 expedition exceeded those observed on the 2017/2018 CICLOPS expedition (Fig. 9a–c; Table 4). The CORSACS-1 and CORSACS-2 expeditions displayed average deep (≥100 m) dCo concentrations of 55 ± 4 and 56 ± 6 pM, respectively, and CORSACS-2 displayed average deep labile dCo concentrations of 21 ± 7 pM; on CICLOPS, in contrast, the Ross Sea displayed average deep dCo and labile dCo concentrations of 46 ± 8 and 9 ± 7 pM, respectively. Note that the CICLOPS expedition mean deep dCo inventory displayed a higher standard deviation (8 pM) compared to the CORSACS-1 (4 pM) and CORSACS-2 (6 pM) expeditions, indicating a higher variability of deep dCo concentration within the sites and depths sampled; no difference in standard deviation was observed within the deep labile dCo inventories of the CICLOPS and CORSACS-2 expeditions (both 7 pM). Independent t tests determined that CORSACS-1 and CORSACS-2 deep Ross Sea dCo values were statistically similar (p=0.27), while deep CICLOPS dCo values were statistically different from CORSACS-1 and CORSACS-2 deep dCo (p<0.0001; Table 4). This offset represents a mean dCo inventory loss of 8–10 pM dCo in the deep ocean, and approximately all of the difference can be accounted for by the loss of deep labile dCo (12 pM dCo; Fig. 9d–g), the more bioavailable form of dCo for biological uptake. Since a plot of temperature vs. salinity shows largely overlapping hydrography among the three expeditions in the Ross Sea (Fig. A2), the observed difference in dCo inventories is unlikely to be due to differences in the distributions of the water masses sampled.
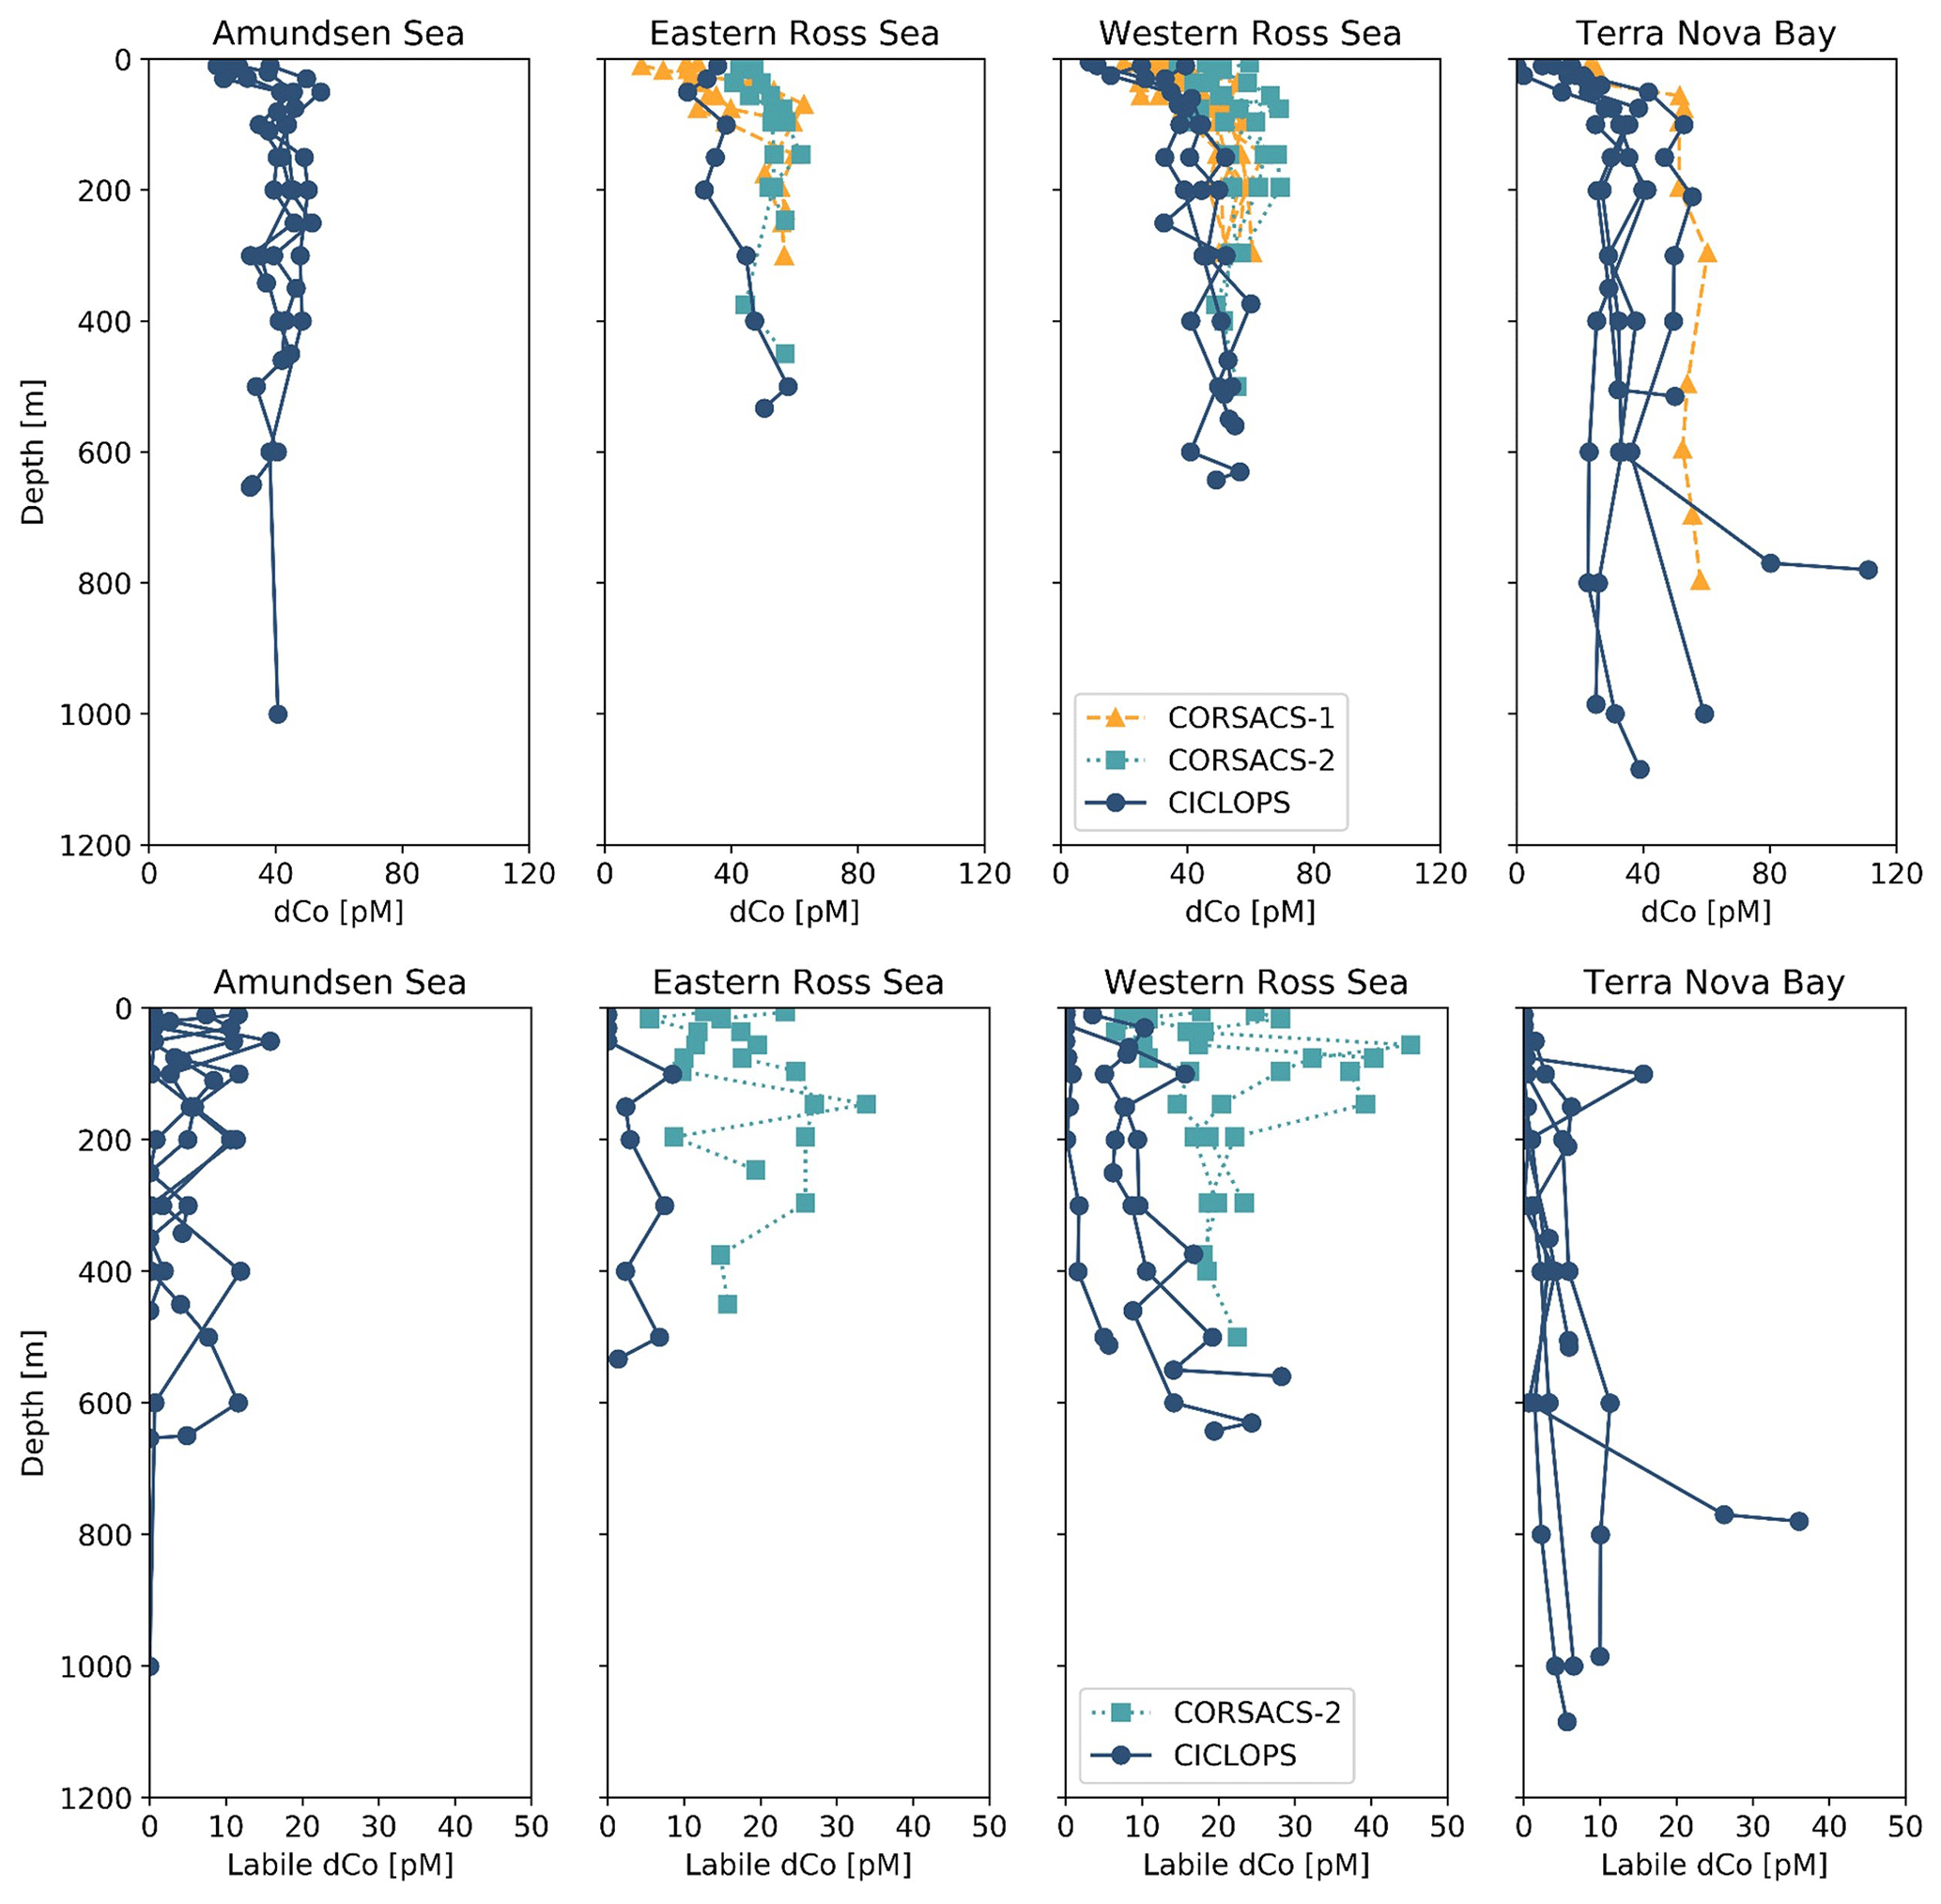
Figure 8Dissolved Co and labile dCo depth profiles from the CORSACS-1 (NBP0601; 27 December 2005–23 January 2006), CORSACS-2 (NBP0608; 8 November–3 December 2006) and CICLOPS (NBP-1801; 11 December 2017–3 March 2018) expeditions in the four regions sampled by the CICLOPS expedition: Terra Nova Bay, the western Ross Sea, the eastern Ross Sea and the Amundsen Sea. The eastern and western Ross Sea stations are defined by being either east or west of the 175∘ E longitudinal, respectively. The CORSACS expeditions did not extend to the Amundsen Sea, and no labile dCo was reported from the CORSACS-1 expedition. The dCo data from the CORSACS expeditions were reported in Saito et al. (2010) and are accessible at https://www.bco-dmo.org/dataset/3367 (Version: 13 September 2010).
Table 4The mean dCo and labile dCo observed in the deep (≥100 m) Ross Sea and the average deep dCo loss between three previous sampling expeditions (CORSACS-1 in summer 2005/2006, CORSACS-2 in spring 2006, under-ice sampling in McMurdo Sound in spring 2009) and the CICLOPS expedition (2017/2018). Dissolved Co and labile dCo loss values were calculated as the difference between mean deep concentrations observed on previous expeditions and those observed on the CICLOPS expedition. No labile dCo data (n.d.) are presented from the CORSACS-1 expedition. Independent t tests were performed to determine the significance of difference between the deep mean concentrations from previous expeditions compared to the CICLOPS expedition; * indicates a significant difference between CICLOPS and a previous expedition (p<0.005). The mean deep dCo concentrations from the CORSACS expeditions were not significantly different from each other (p=0.27).
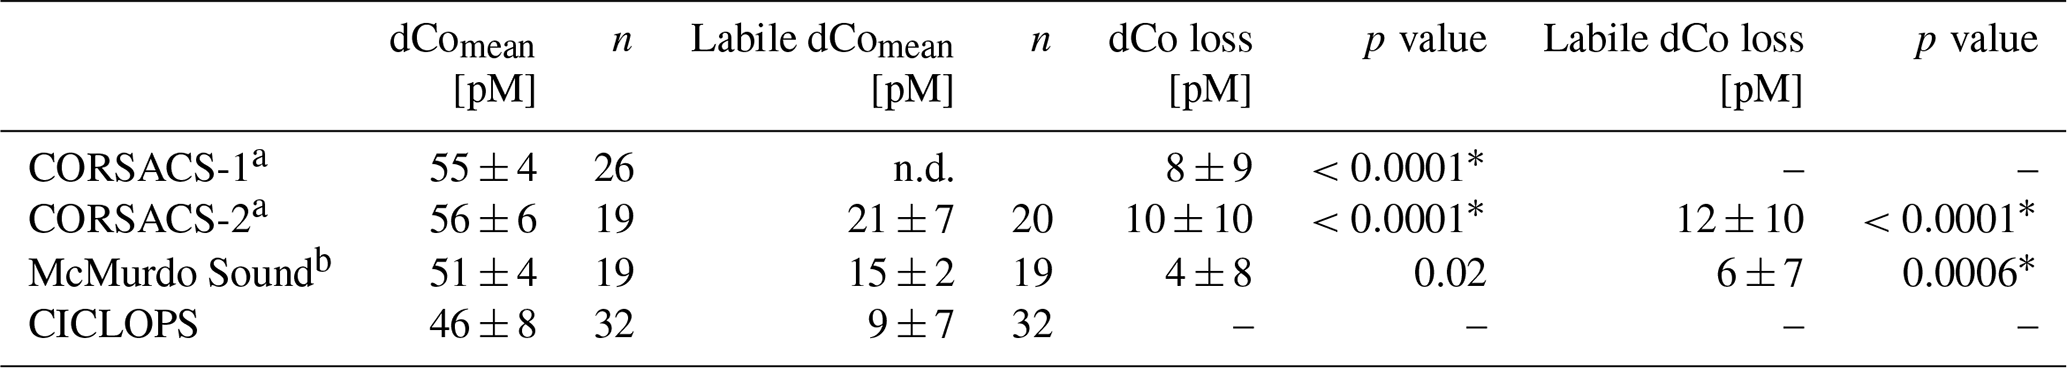
a Data originally published in Saito et al. (2010). b Data originally published in Noble et al. (2013).
In the near surface (10 m), labile dCo was undetectable at three of the four stations in the Ross Sea on CICLOPS, and the near-surface labile : total dCo ratio in the one station where labile dCo was detectable (station 29; 3.5 pM labile dCo) was only 0.09. In contrast, the 2006 CORSACS-2 expedition reported the presence of labile dCo at five stations with concentrations of 17 ± 7 pM at 6 m depth and 14 ± 9 pM at 16 m depth, with reported labile : total dCo ratios of 0.37 ± 0.13 and 0.28 ± 0.17, respectively. This trend can be at least partially explained by the seasonality differences between the spring CORSACS-2 expedition and the summer CICLOPS expedition; as the phytoplankton bloom progresses in the photic zone of the Ross Sea, labile dCo concentrations would be drawn down by community uptake and would exhibit lower concentrations later in the summer season. This seasonal trend was evident in the surface dCo inventory differences between the summer CORSACS-1 and spring CORSACS-2 expeditions (Fig. 9a, d, e). However, the low, often undetectable, labile dCo concentrations observed in the surface Ross Sea on the CICLOPS expedition illustrate the intensity of bloom-driven labile dCo depletion in the region, leaving 91 %–100 % strong ligand-bound dCo in the surface Ross Sea. These observations are consistent with the Co uptake rate measurements, which were found to be higher on CICLOPS (0.84 pM d−1, n=38) compared to CORSACS-1 and CORSACS-2 (0.67 and 0.25 pM d−1, respectively) (Saito et al., 2010; Rao, 2020).
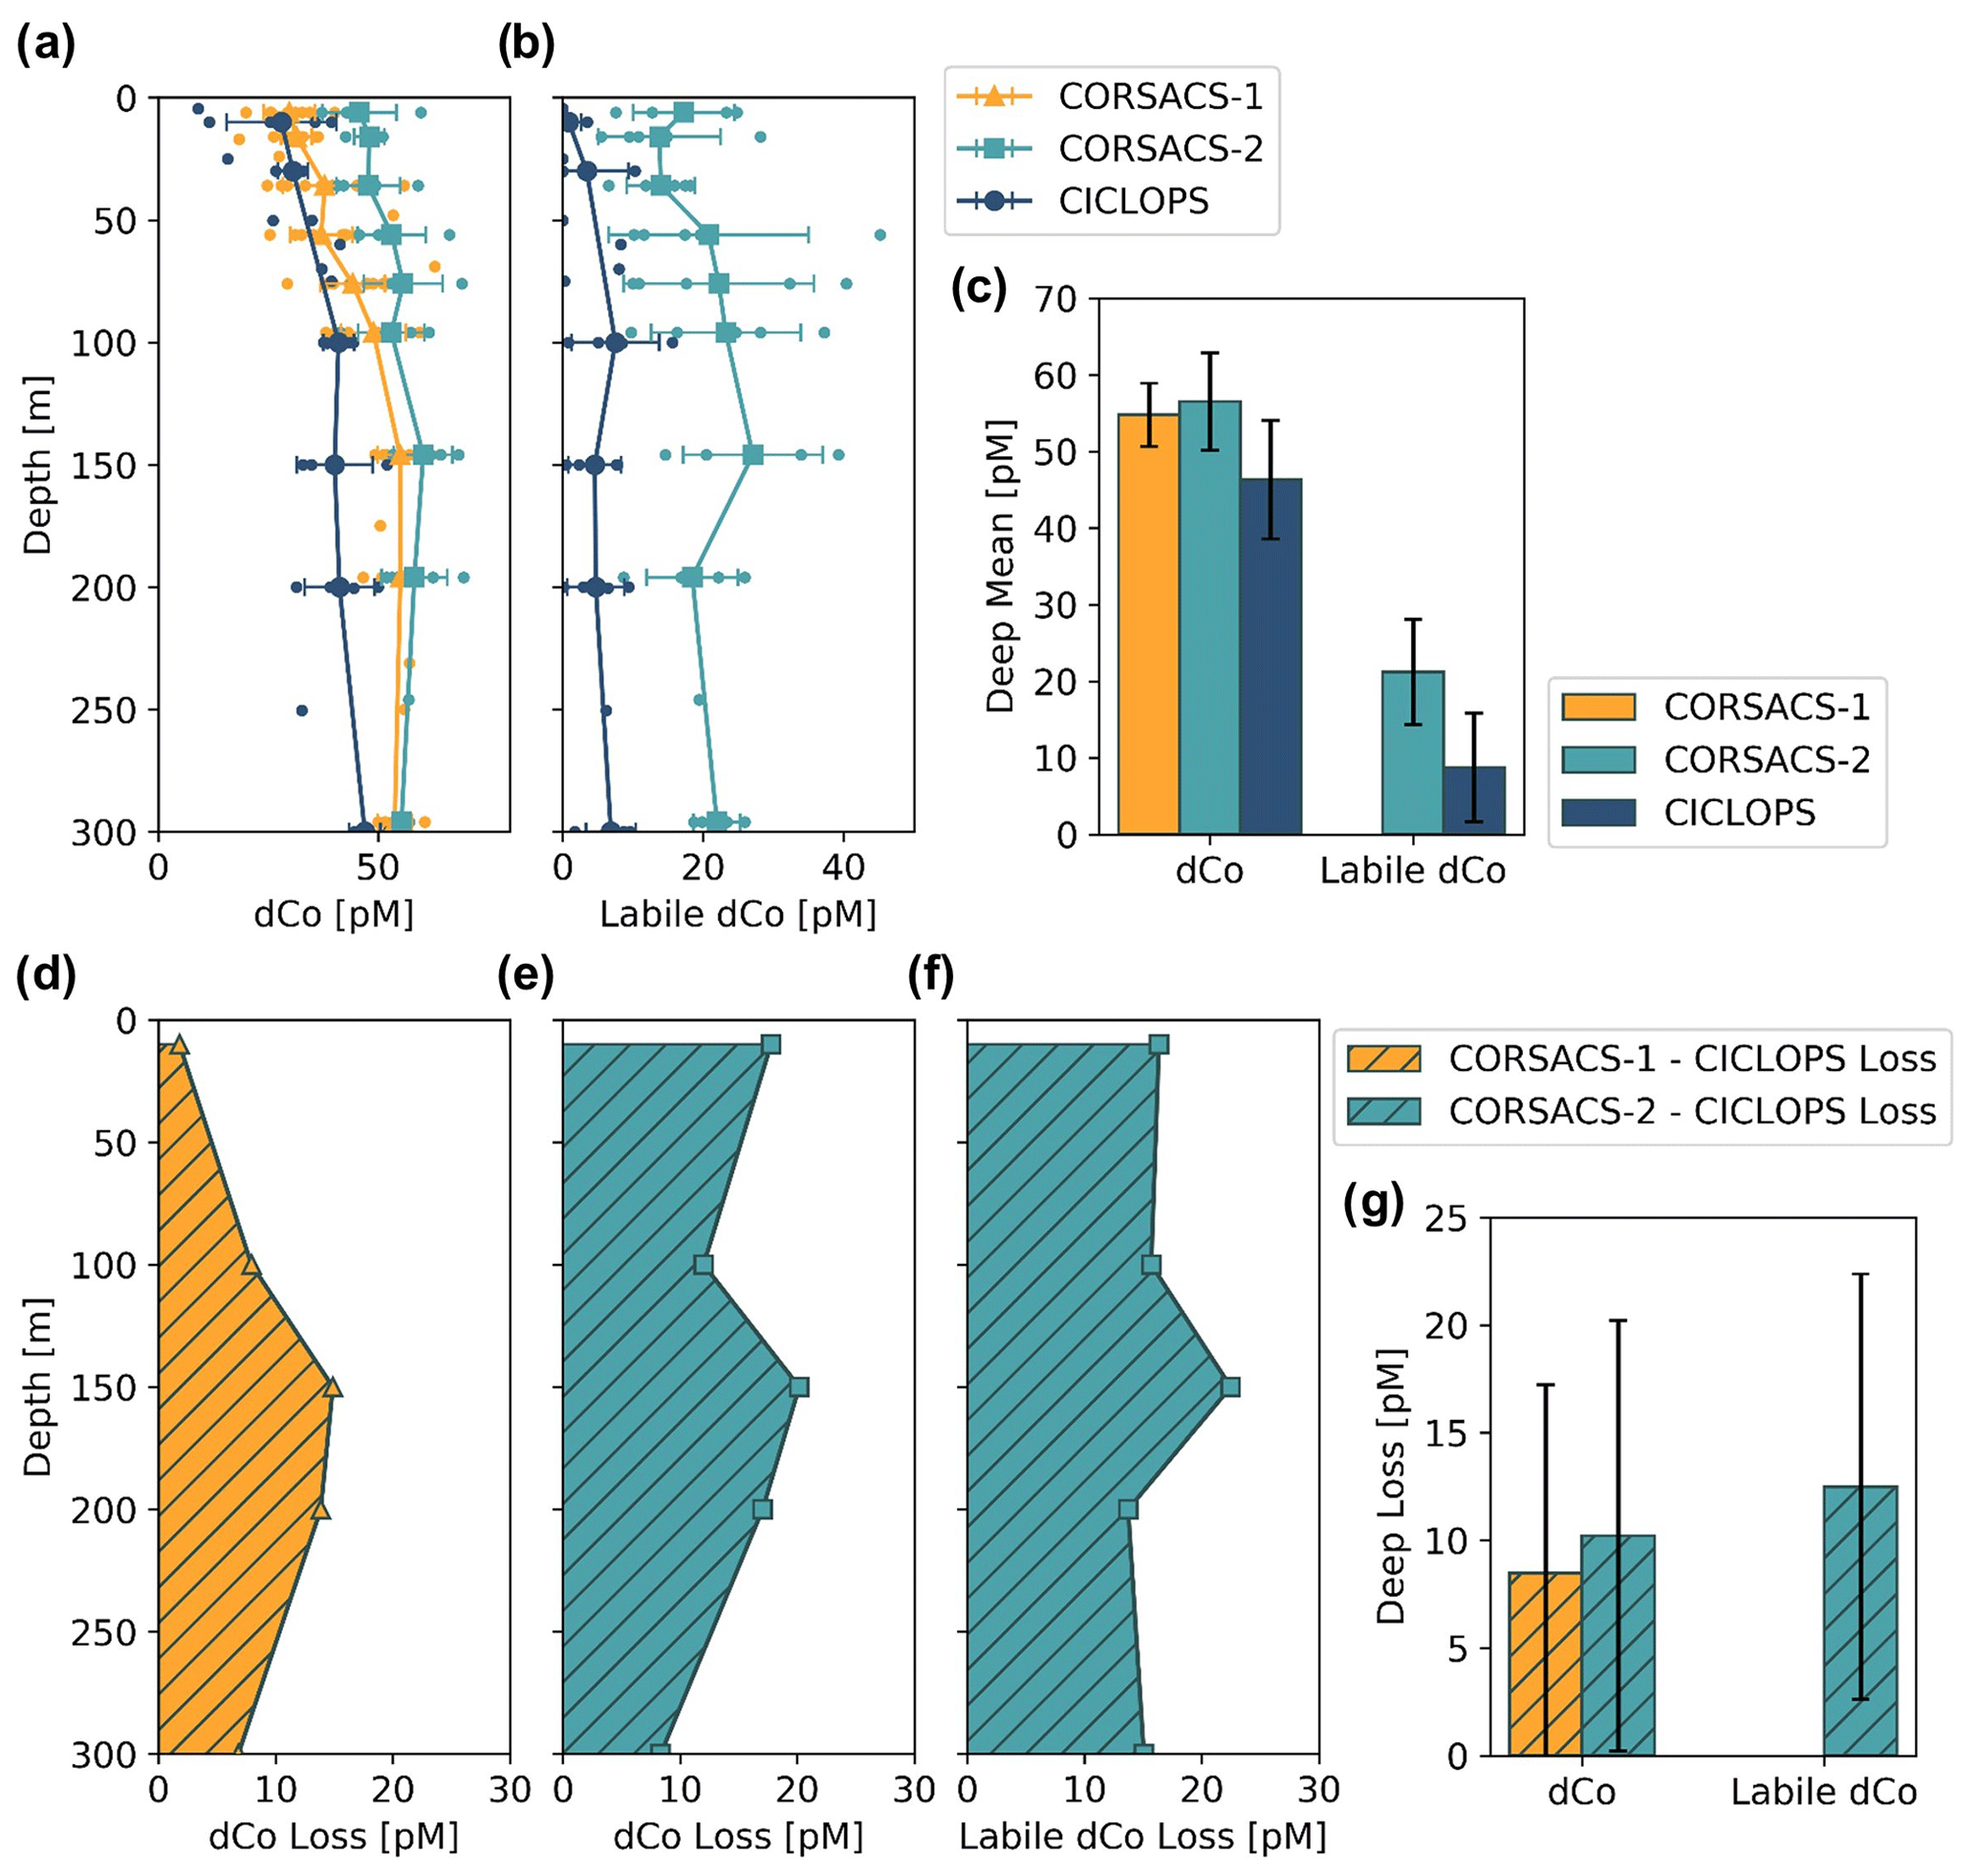
Figure 9Mean depth profiles of dCo (a) and labile dCo (b) from the Ross Sea from three sampling seasons, including the expeditions CORSACS-1 (Summer 2005/2006), CORSACS-2 (Spring 2006) and CICLOPS (Summer 2017/2018). Observed profile values are plotted as unconnected dots, and the mean profile is plotted for each depth at which at least three samples were analyzed. (c) The mean deep (≥100 m) dCo and labile dCo concentrations for stations in the Ross Sea on each expedition. The mean difference in the dCo (d, e) and labile dCo (f) profiles between the CORSACS and CICLOPS expeditions where sample depths were within 5 m of each other. (g) The mean deep (≥100 m) dCo and labile dCo concentration loss for stations in the Ross Sea. Error bars denote 1 standard deviation from the mean. No labile dCo data are available for the CORSACS-1 expedition. Mean values, loss values and the results of independent t tests to determine the significance of the deep dCo loss are given in Table 4.
Dissolved Co and labile dCo concentrations were also analyzed in the Ross Sea in 2009 by sampling the water column below the McMurdo Sound seasonal sea ice in the early spring (9–23 November) (Noble et al., 2013). Under the ice, the water column was well mixed, and the dCo and labile dCo profiles showed relative uniformity at all three stations measured (Fig. 2 of Noble et al., 2013). In the deep ocean (≥100 m), the mean dCo and labile dCo concentrations were 51±4 and 15±2 pM, respectively, which are lower than those observed on the 2005/2006 CORSACS expeditions and higher than those observed on the 2017/2018 CICLOPS expedition (Table 4). The mean deep labile dCo concentrations from the McMurdo Sound fieldwork were also significantly different from the mean deep labile dCo observed on CICLOPS (p=0.0006), displaying an average deep labile dCo difference of 6 pM. This dataset supports the possibility of a long-term trend towards a decreasing deep dCo inventory in the Ross Sea, although the more coastal location and difference in sea ice cover should be considered when comparing the McMurdo Sound dataset to the CORSACS and CICLOPS observations. Notably, the methodology and instrumentation used to measure both dCo and labile dCo on both CORSACS expeditions, the McMurdo Sound fieldwork and the CICLOPS expedition were functionally identical, with the exception of an autosampler (Metrohm 858 Sample Processor) used on the 2017/2018 CICLOPS expedition.
The low labile dCo inventory in the Ross Sea was a surprising discovery during CICLOPS, since relatively high concentrations of labile dCo were previously noted to be a distinctive feature of the Ross Sea and Southern Ocean when compared to the tropical and subtropical global oceans (Saito et al., 2010). In prior studies in this region, high labile : total dCo ratios were hypothesized to be due to the absence of ligand-producing – and vitamin-B12-producing – marine cyanobacteria like Synechococcus in the Ross Sea (Caron et al., 2000; DiTullio et al., 2003; Bertrand et al., 2007), since Synechococcus-dominated communities have been known to produce a substantial number of Co ligands (Saito et al., 2005). However, high Co ligand concentrations and low labile dCo concentrations have previously been observed at a more pelagic location in the Southern Ocean near New Zealand, where it was hypothesized that the decay of a eukaryotic phytoplankton bloom generated higher abundances of Co-binding ligands in the surface ocean (Ellwood et al., 2005).
The decrease in the dCo and labile dCo inventories was apparent when the CICLOPS and CORSACS dCo vs. dPO relationships across all expedition regions were compared (Fig. 6c, e). Over similar dPO ranges, the CICLOPS dCo concentrations are generally lower than those observed on CORSACS, and the CICLOPS labile dCo concentrations are considerably lower, with labile dCo essentially absent from upper-ocean samples with a dPO concentration < 1.75 µM. Despite the lack of observable scavenging, the CICLOPS dCo vs. dPO relationship appeared to be noticeably nonlinear throughout the water column (R2=0.42), while CORSACS samples displayed a more linear trend (R2=0.57). The CICLOPS dCo vs. dPO relationship creates a concave, “scooped” shape where dCo was depleted relative to dPO, displaying a lower slope in the upper ocean than was observed on the CORSACS expeditions (Fig. 6c). This scooped shape was particularly evident in Terra Nova Bay where the upper-ocean dCo : dPO stoichiometric slope was the lowest (26 ± 4 µmol : mol; R2=0.65). The depletion of dCo relative to dPO observed on CICLOPS appears driven by the shift in Co speciation as a result of near-total uptake of the upper-ocean labile dCo fraction and subsequent dominance of the remaining strong ligand-bound dCo fraction in the upper ocean. Similar to the deep dCo loss described above, the difference between the CORSACS and CICLOPS dCo vs. dPO relationship can be accounted for by the depletion of the labile dCo inventory. In the deep ocean where both dCo and dPO are more abundant, the large range in dCo concentrations relative to dPO concentrations may be evidence of deep inputs of dCo and labile dCo from the nepheloid layer, which was more attentively sampled on CICLOPS than either CORSACS expedition (Sect. 4.1).
4.4 Dissolved Co, Zn and Cd stoichiometry
Dissolved Zn concentrations observed on CICLOPS were low in the surface ocean, particularly in Terra Nova Bay, where dZn concentrations in the sub-nanomolar ranges were observed (average dZn = 0.87 ± 0.42 at 10 m depth, n=11). Marine microbes require Zn for a wide range of metabolic uses; for example, eukaryotic phytoplankton use Zn as a cofactor in carbonic anhydrase (Roberts et al., 1997; Morel et al., 2020) and bacteria such as Pseudoalteromonas use Zn in a range of proteases (Mazzotta et al., 2021). Prior culture studies have found that Zn scarcity can lead to co-limitation of both Zn and carbon in several eukaryotic phytoplankton strains (Morel et al., 1994; Sunda and Huntsman, 2000), and field incubation experiments have shown evidence for Zn co-limitation with Fe (Jakuba et al., 2012) and silicate (Chappell et al., 2016) in the Pacific Ocean. During the CICLOPS expedition, an incubation experiment performed at station 27 in Terra Nova Bay found compelling evidence for Zn and Fe co-limitation, which constrained Chl a production and dissolved inorganic carbon drawdown by phytoplankton in the region (Kellogg, 2022).
Many but not all phytoplankton are able to substitute Co and Cd for Zn as their carbonic anhydrase metallic cofactor (Lee and Morel, 1995; Sunda and Huntsman, 1995; Lane et al., 2005; Kellogg et al., 2022), which provides metabolic flexibility and a competitive edge in low-dZn environments (Kellogg et al., 2020). The Cd-containing carbonic anhydrase (CDCA) is currently the only known metabolic use of Cd, and the uptake of dCd and dCo in the photic zone, both of which metals are typically less abundant than dZn in the oceans, often increases under low-dZn conditions (Sunda and Huntsman, 1995, 1996; Jakuba et al., 2008; Kellogg et al., 2020; Morel et al., 2020). Cations like Zn, Cd and Co that possess similar charge and atomic radii often share the same transporter uptake systems, and the relative availability of different metal cofactors for use in an organism's metalloproteome is partially determined by the environmental metal concentrations and the affinity of the metals for ligands associated with a cell's metal transport proteins (Irving and Williams, 1948; Sunda and Huntsman, 1992, 1995). When dZn concentrations are low, more Cd and Co are able to bind to the transporter ligands despite the relative stability of their ligand-bound complexes, which tend to be lower for Co than for Zn. Through this mechanism, dZn concentrations and cycling can influence the distribution and uptake of Co and Cd, particularly in low-dZn environments like the Ross Sea and Terra Nova Bay.
The dZn vs. dPO and dCd vs. dPO relationships observed in the Amundsen Sea, the Ross Sea and Terra Nova Bay were compared relative to dCo vs. dPO (Fig. 7; Table 3). For this analysis, the depth threshold that separates the upper ocean from the deep ocean was selected manually in order to optimize the linear fit of the upper- and deep-ocean trends and to best capture the depth dependence of the observed trace metal stoichiometries. This depth threshold can best be conceptualized as an inflection point that represents the largest change in trace metal concentrations with respect to depth or, in this case, dPO concentration. The depth threshold used for dCo in both the Ross Sea and Terra Nova Bay (100 m) is deeper than those used for dZn and dCd (range of 25–50 m). Thus, the inflection points of the “scoops” in the trace metal stoichiometries are driven by the uptake stoichiometry of the region's phytoplankton community rather than the mixed layer depth of the upper ocean. The shapes observed in the dZn vs. dPO and dCd vs. dPO relationships were similar to that of dCo vs. dPO, exhibiting distinct differences in slope between surface and deep waters. The stark difference in trace metal stoichiometry slopes between the upper and deep ocean is likely driven by differences in metal speciation over depth. In the surface ocean, a shallower trace metal : dPO slope suggests a trace metal fraction that is largely bound to strong organic ligands, with a smaller excess labile fraction. The more bioavailable labile fraction of metals would have been drawn down by phytoplankton, whose uptake transport systems preferentially bind to labile metals. At deeper depths, the presence of labile metals in excess of strong organic ligands results in a higher metal : dPO slope.
A shallow dCo : dPO slope that extends below the photic zone could suggest Co uptake by heterotrophic bacteria, archaea and possibly sinking phytoplankton below the photic zone. Heterotrophic prokaryotic uptake of labile Co is largely driven by the bacteria and archaea that contain a vitamin B12 synthesis pathway that is absent in all eukaryotes (Warren et al., 2002; Osman et al., 2021); unlike carbonic anhydrase, the use of Co as a cofactor in the vitamin B12 corrin ring structure cannot be substituted for by other divalent cations like Zn and Cd. Many vitamin-B12-synthesizing bacteria possess genes for Co(II)-specific transporters in addition to more general metal ion transporters, and the Co-specific transporters are regulated by cellular concentrations of vitamin B12, illustrating the importance of vitamin B12 synthesis in driving bacterial Co uptake (Osman et al., 2021); however, this mechanism has not been observed within marine bacterial communities. Additionally, vitamin B12 uptake by both prokaryotes and eukaryotes has been found to be common in Antarctic coastal communities (Taylor and Sullivan, 2008; Rao, 2020) and likely contributes to the depletion of ligand-bound dCo in both the surface and mesopelagic ocean.
The shallower Zn apparent nutricline could also be explained by the higher stability of Zn metal–ligand complexes compared to Co complexes within phytoplankton metabolisms, allowing higher uptake rates of dZn when available (Irving and Williams, 1948; Sunda and Huntsman, 1995). The vertical dimension of trace metal loss captured by a comparison of these apparent nutriclines could be conceptualized as a time-dependent process driven by the phytoplankton community's preference for each trace metal, with preferred nutrients like Zn exhibiting a shallower stoichiometric inflection point arising from the rapid depletion of the metal within the photic zone, and nutrients like dCo, which is often taken up by eukaryotes when dZn is scarce (Sunda and Huntsman, 1995; Kellogg et al., 2020), exhibiting a deeper stoichiometric inflection point below the photic zone. This analysis suggests that substitution at the interface of the uptake mechanism for trace metal transporters at least partially controlled the stoichiometry of Zn/Cd/Co distributions and uptake in the upper ocean.
4.5 Zn/Cd/Co uptake using a shared trace metal membrane transport system
This study synthesized dissolved concentration and uptake datasets for Co, Zn and Cd (Table 5), three trace metal nutrients whose use by phytoplankton is collectively integral to surface ocean productivity and the biogeochemical cycling of Fe, vitamin B12 and carbon in the Southern Ocean. This combined dataset is ideal for interrogating questions of environmental competitive inhibition of Zn, Cd and Co transport in low-dZn environments. The observation of order-of-magnitude trends in trace metal uptake rates over depth profiles (ρZn > ρCd > ρCo) was novel and paralleled the order-of-magnitude trends of trace metal concentrations in seawater ([Zn] > [Cd] > [Co]; Fig. 5). This environmental observation reflected the findings of numerous culture experiments that quantify the uptake of trace metals as a function of the concentration of available labile metals and the affinity of the metal for a cell transporter's binding ligand (Irving and Williams, 1948; Sunda and Huntsman, 1992, 1995, 2000; Kellogg et al., 2020).
Table 5Dissolved stoichiometric ratios and uptake stoichiometric ratios of five station profiles for Co, Cd and Zn. The dCo : dCd : dZn : dPO ratio is the dissolved stoichiometry of metals present in the water column normalized to dPO, and the ρCo : ρCd : ρZn ratio is the uptake stoichiometry of microbial communities normalized to ρCo.
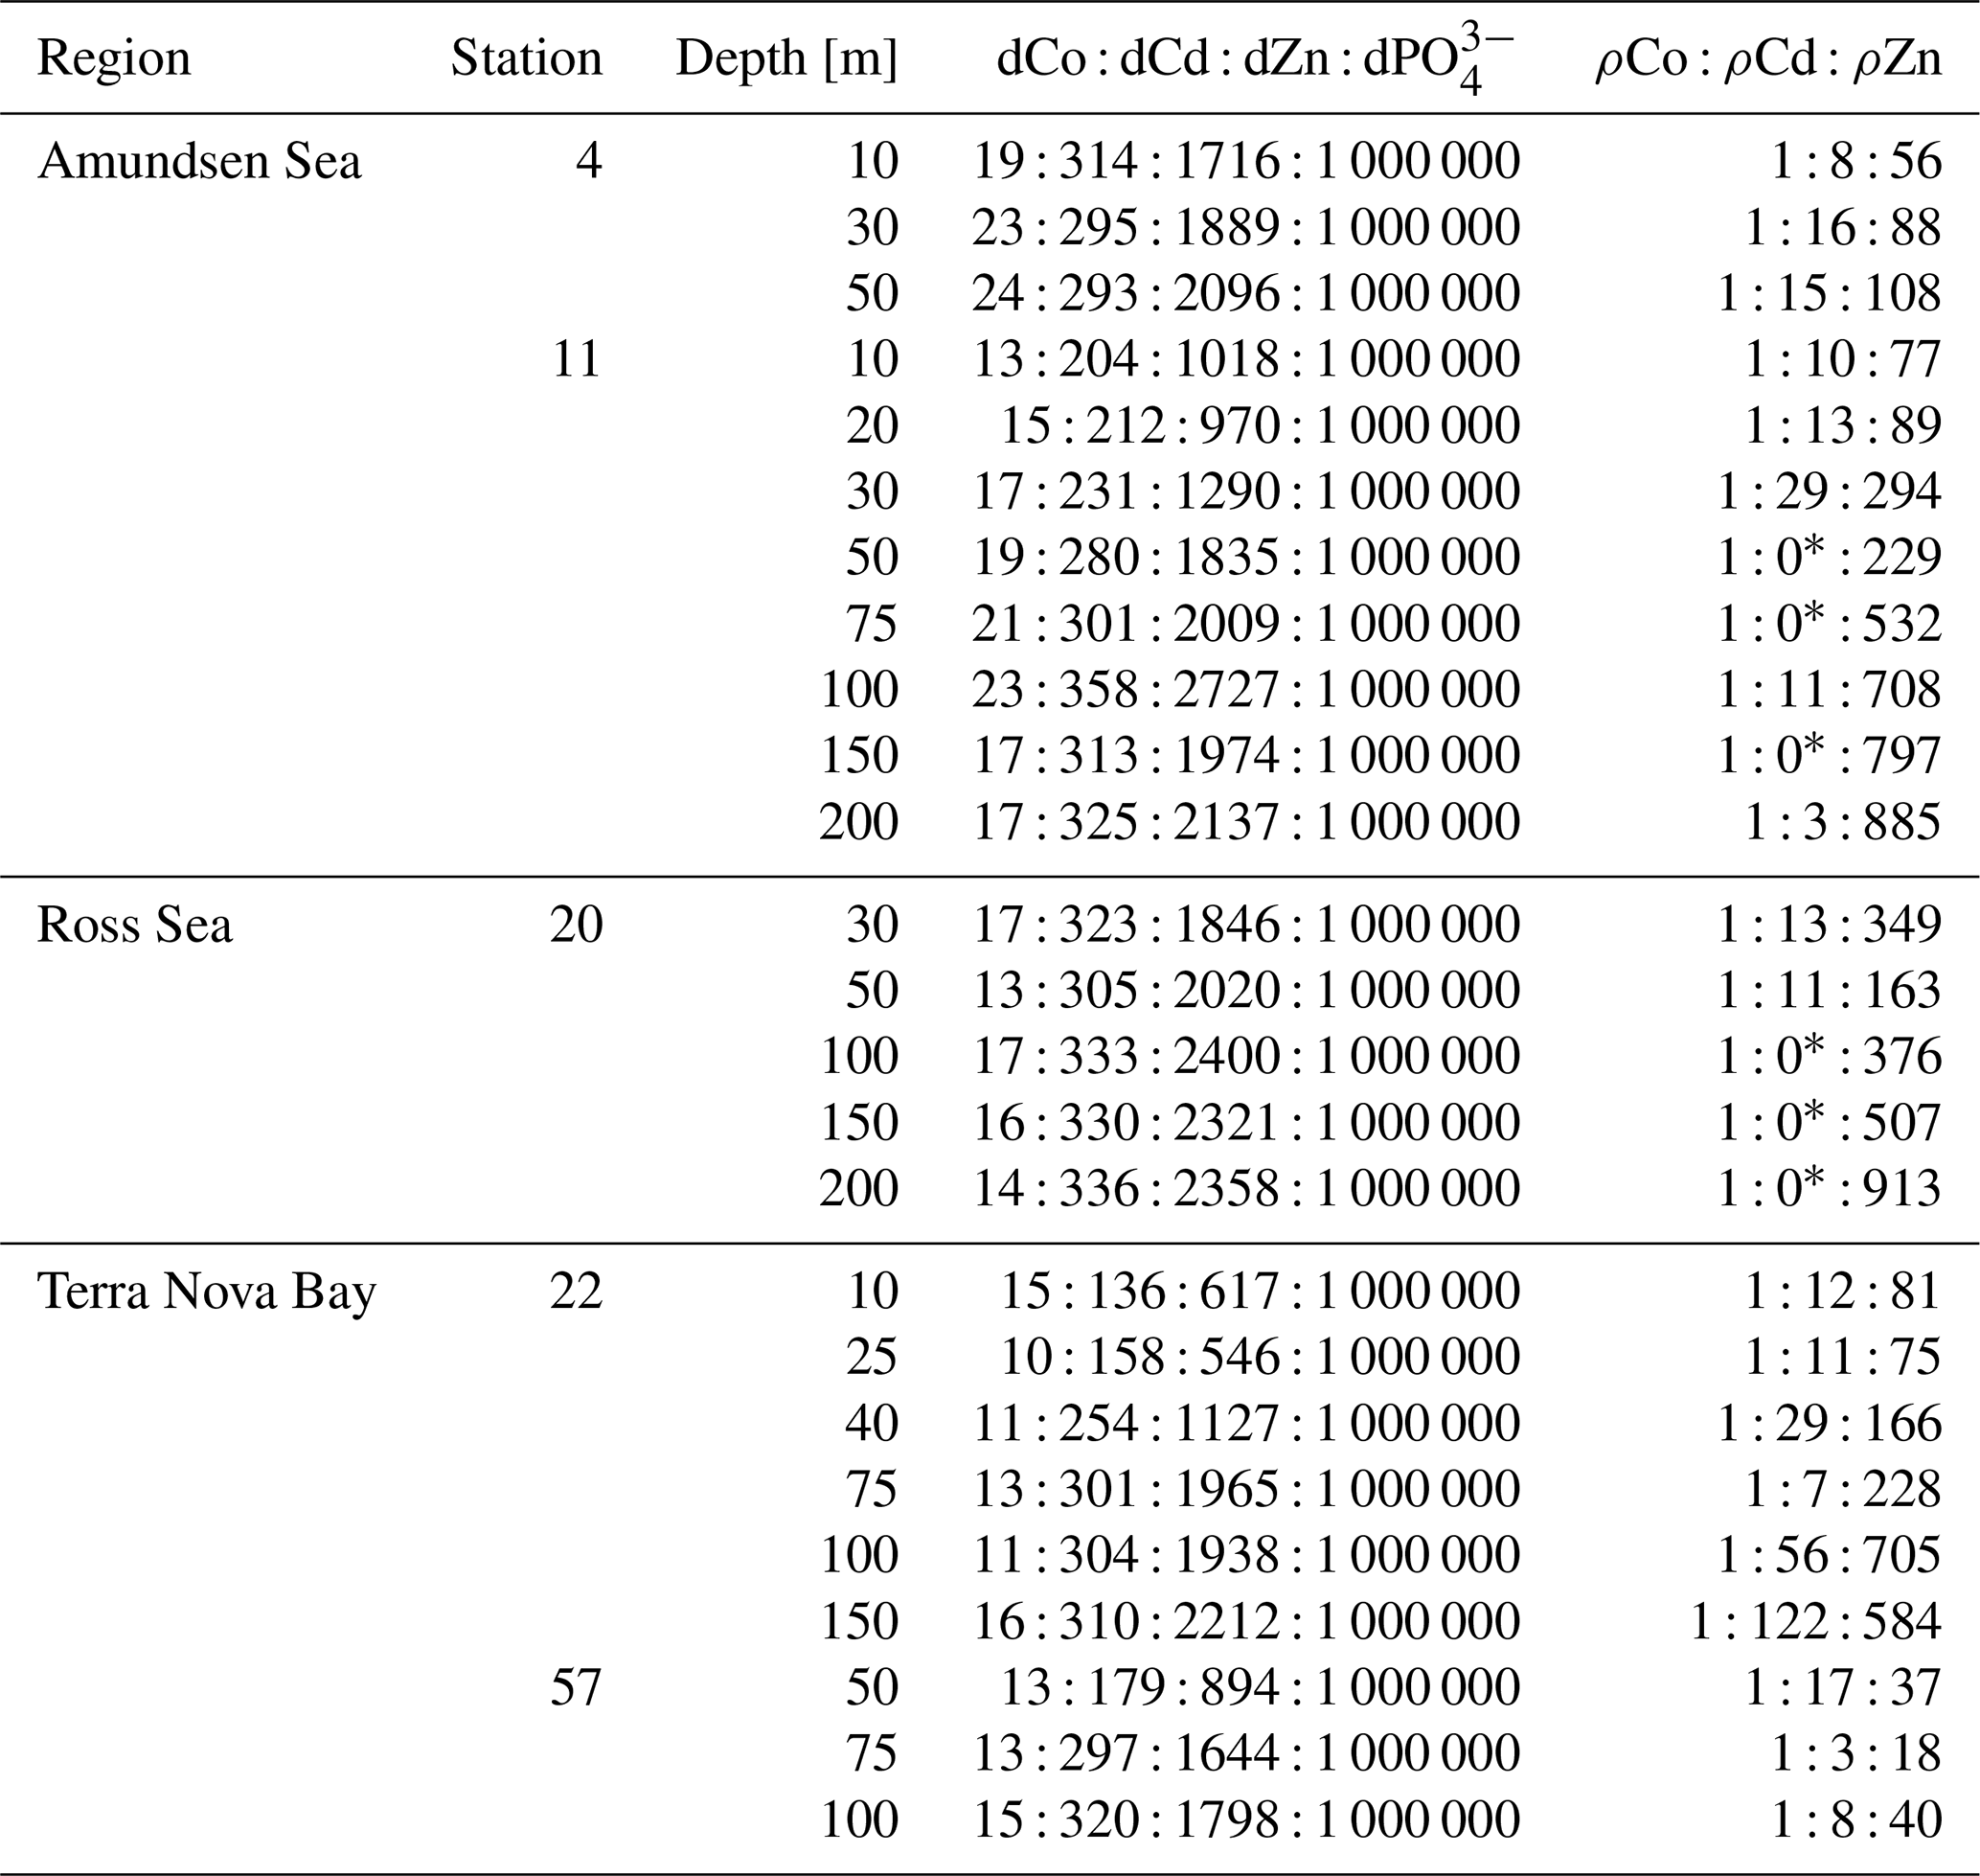
∗ denotes depths at which ρCd was under the methodological detection limit.
Evidence for elevated Co uptake in the low-dZn environments of the surface ocean was supported by the trace metal uptake rates. When ρZn and ρCd was normalized to ρCo (ρM : ρCo; Fig. 5), deviations from these order-of-magnitude trends were observed. In particular, at stations 4 and 11 in the Amundsen Sea and station 22 in Terra Nova Bay, ρZn and ρCd stoichiometry relative to ρCo tended to decrease towards the surface in the upper 50 m, while the opposite trend appeared to occur at station 57 in the late summer. The surface-most trends of stations 20 and 57 were undetermined due to a lack of a 10 m ρCo value. This increasing surface Co uptake stoichiometry relative to Zn and Cd at stations 4, 11 and 22 – stations that also displayed significant phytoplankton blooms – suggests that Co uptake increased in low-Zn environments, while later in the summer at station 57, ρCo lessened relative to ρZn, possibly due to the deepening of the mixed layer in February, bringing additional dZn to the upper ocean via vertical mixing (Fig. 4). The increase in the observed ρCo rate was likely due to the upregulation of the shared Zn and Co uptake transporter system. From laboratory culture experiments aimed at examining the microbial uptake of Zn and other trace metals, it is apparent that many diatoms and coccolithophores contain two distinct Zn uptake systems: a low-affinity system that operates at higher concentrations of dZn and a high-affinity system that functions at lower concentrations of dZn (Sunda and Huntsman, 1992; John et al., 2007). Both transport mechanisms are relatively unspecific as to the divalent metals transported into the cell; the low-affinity system is known to transport Zn, Cd and Mn, while the high-affinity system transports Zn, Cd and Co (Sunda and Huntsman, 1995, 1996). Thus, Co uptake is often inhibited at high dZn concentrations when the low-affinity system is active (Sunda and Huntsman, 1995; Sunda, 2012). In culture, diatoms have been observed to switch from the low-affinity to the high-affinity transport system between 10−10.5 and 10−9.5 M dZn2+ (Sunda and Huntsman, 1992; John et al., 2007), a relevant range for the lowest values of total dZn observed in the surface ocean on CICLOPS (dZn minimum = M at station 46, 10 m depth), and the dZn2+ pool would have been even smaller due to organic complexation.
To investigate the influence of transporter competitive inhibition on trace metal uptake via the high-affinity uptake system, we can estimate the predicted ρCo, ρCd and ρZn values given the observed trace metal concentrations with an equation adapted from Michaelis–Menten enzyme–substrate kinetics (Sunda and Huntsman, 1996, 2000):
where M is the trace metal (Co, Cd, Zn) whose uptake is being calculated; Vmax is the saturation uptake rate of the transporter system; and KCo, KCd and KZn are steady-state affinity constants for the metal–ligand complex associated with the membrane transporter. For this system, we assumed , where 109.6 is the value of KZn for the high-affinity uptake system determined by Sunda et al. (1992), and that 99 % of the dCo, dCd and dZn inventory was bound to strong organic ligands, leaving 1 % of the total metal concentration labile. Note that the assumption that K and the percent labile multipliers are equal for all metals results in their value being nullified by their presence in both the numerator and denominator of the predicted uptake equation, and so their assumed values have no numerical impact on the predicted uptake values. It was also assumed that Vmax values for each trace metal were equal, which is likely a reasonable assumption for metals that share an uptake system, although Vmax is known to vary with trace metal concentration, a function that we have assumed here to be negligible (Sunda and Huntsman, 1985, 1996; Sunda, 1989). Vmax is in units of µmol (mol C)−1 d−1, and the predicted trace metal uptake rates were converted to units of M d−1 using a C : Chl a ratio of 130 , derived from the Ross Sea phytoplankton community (DiTullio and Smith, 1996).
When the predicted metal uptake rates were calculated using a Vmax value of 262 µmol (mol C)−1 d−1 from previous Zn culturing experiments (Sunda and Huntsman, 1992), the resulting values recreated the trend of the observed trace metal uptake profiles, with higher uptake rates in the surface ocean and lower rates below the photic zone, but the predicted values were over an order of magnitude greater than the measured uptake rates (Fig. B1 in Appendix B). This offset may be due to several factors: (1) the assumed C : Chl a ratio to scale predicted uptake with observed biomass may be high, (2) the Vmax value calculated from laboratory experiments may be high or (3) the assumption that the speciation of the dissolved trace metals is 99 % strongly bound at all depths for all metals is incorrect. The final explanation may play a role in the offset between the predicted and observed uptake rates and illustrates the complexities of translating lab-based culture work to environmental measurements and in situ analyses. The Vmax value is also relatively unconstrained, and it is reasonable to assume it may be lower in the Ross Sea than observed in culture if the phytoplankton exhibit suppressed metal quotas to survive in a metal-depleted environment. With this in mind, the Vmax value was tuned to 4 µmol (mol C)−1 d−1 to fit the observed uptake rates, which is lower than any Co, Cd or Zn Vmax reported in the literature from culture studies (Fig. 10). Using the tuned Vmax value, the high-affinity uptake system equation properly predicts the order-of-magnitude trends inherent in the observed Co/Cd/Zn uptake rates. This analysis demonstrates that the measured uptake rates from the Ross Sea were likely driven by the concentration ratios of available metals throughout the water column, following a high-affinity transporter model of Co, Cd and Zn uptake.
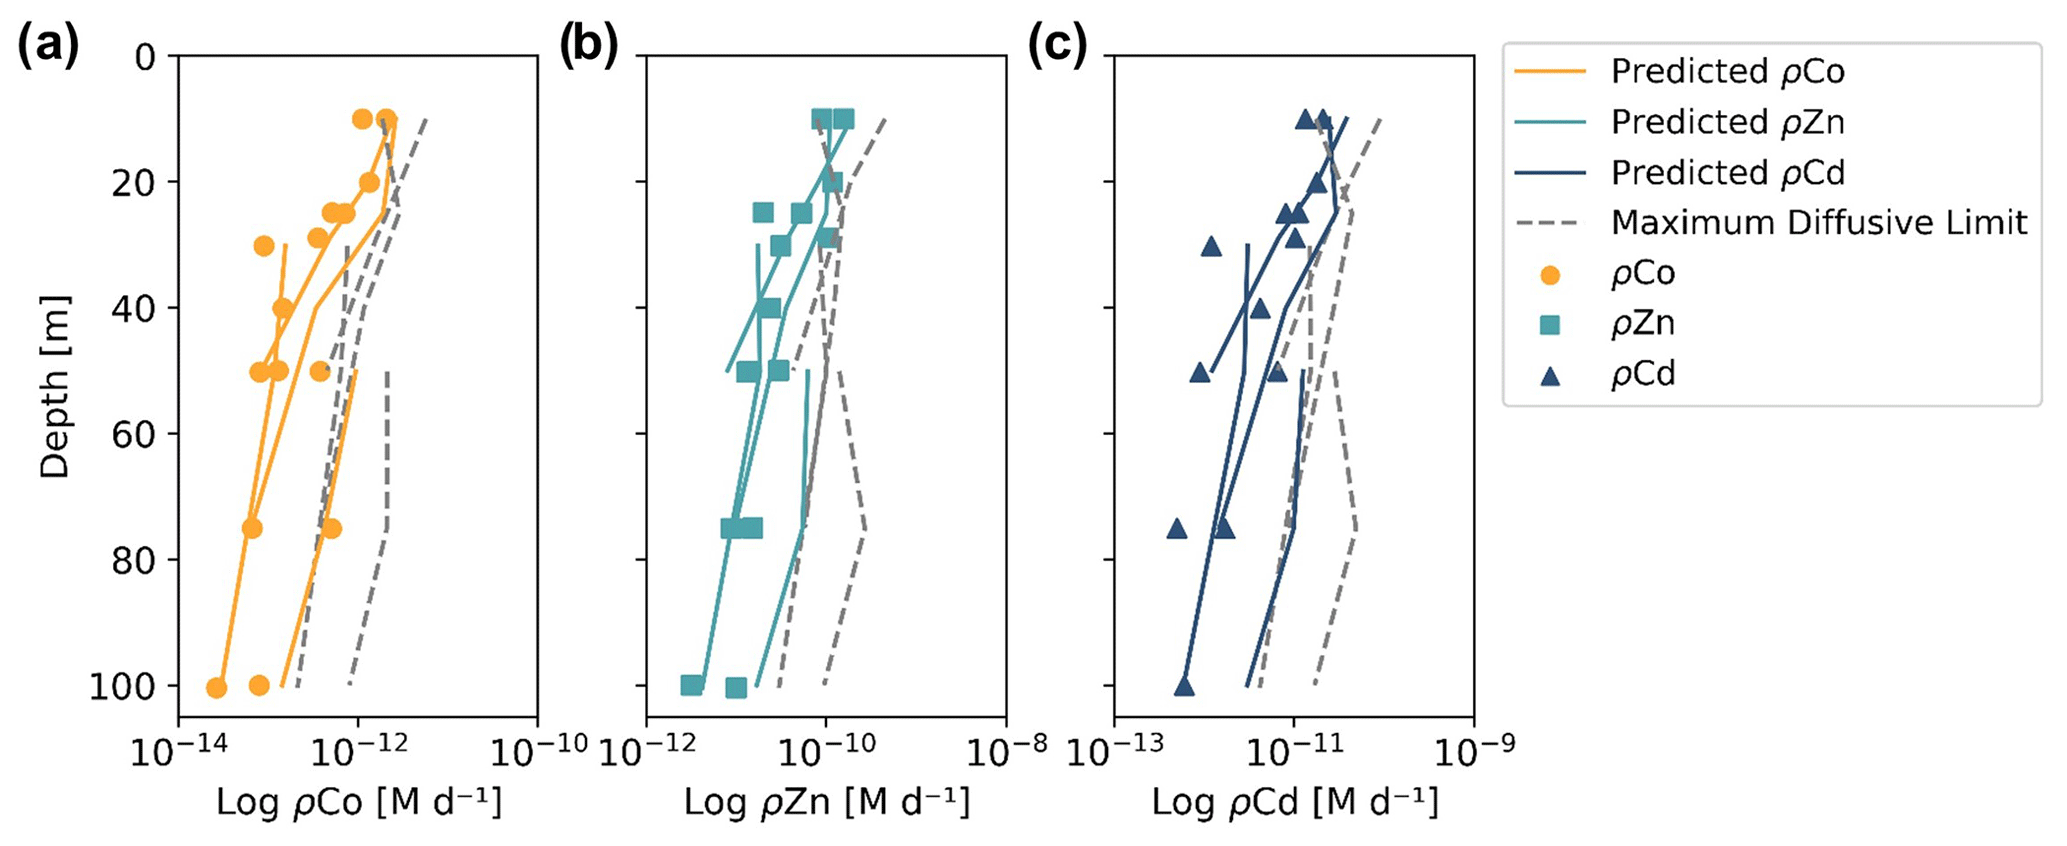
Figure 10Observed (markers) and predicted (solid lines) trace metal uptake rate (ρ) profiles for Co (a), Zn (b) and Cd (c) from stations 11, 20, 22 and 57. The maximum diffusive limit profiles (dashed lines) are shown as an estimate of the physical limits of metal diffusion through uptake transporters. The predicted uptake rates were tuned to best fit the observed uptake rate trends by using a Vmax value of 4 µmol (mol C−1) d−1, and the maximum diffusion limit estimation assumed a speciation of 1 % labile metals.
The maximum diffusive limit, a calculation of the phytoplankton community's maximum diffusion rate for the uptake of trace metal nutrients through their cell membranes, was also estimated and compared to the observed and predicted uptake rate profiles. The physical limits of uptake via diffusion were determined as a function of the surface area of phytoplankton membranes (Sunda and Huntsman, 1992):
where r is the equivalent spherical radius of a phytoplankton cell, assumed to be 3 µm, a reasonable value for diatom species, and D is a diffusion rate constant of cm2 s−1, calculated for Zn2+ at 20 ∘C (Sunda and Huntsman, 1992). The diffusive limit was converted to units of M d−1 using a C : cell volume ratio of 12.5 mol C L−1, which is the average of two diatom ratios reported in Sunda and Huntsman (1995) (11 and 14 mol C L−1), and the same C : Chl a ratio of 130 used for the predicted uptake rate estimate above (DiTullio and Smith, 1996). The resulting diffusive limit profiles are highly dependent on the assumed speciation of each trace metal; when the dCo, dCd and dZn inventories were assumed to be 99 % bound (Fig. 10), the maximum diffusive limit was slightly greater than the predicted and observed uptake rates, but when the inventories were assumed to be 100 % labile (Fig. B1), the diffusive limit greatly exceeded the uptake rates by several orders of magnitude. Since the metal inventories almost certainly vary in their speciation of dZn and dCd over depth, as was observed in the dCo inventory, an accurate maximum diffusive limit would exist between the two extremes of 0 % bound and 99 % bound and might be expected to be greater at deeper depths, where a higher fraction of the dissolved metal inventory is labile. For additional analysis of the predicted metal uptake ratios and the maximum diffusive limit, see Appendix B.
4.6 Vitamin B12 and Zn stress and their implications for increasing biological dCo demand
The near absence of labile dCo and low concentration of ligand-bound dCo in coastal Antarctic seas may indicate a larger shift in the region towards vitamin B12 limitation. Vitamin B12 has been shown to be co-limiting with Fe in the Ross Sea and elsewhere (Sañudo-Wilhelmy et al., 2006; Bertrand et al., 2007), and increased vitamin B12 uptake by both bacterioplankton and eukaryotic phytoplankton has been observed in incubation experiments following the alleviation of surface ocean Fe limitation (Bertrand et al., 2011). Two primary sources of Fe to the Antarctic seas are a flux of lithogenic Fe from melting ice shelves along the continent and sediment resuspension along the seafloor, both of which have been observed to be meaningful Fe sources to the Amundsen Sea (Planquette et al., 2013; St-Laurent et al., 2017). The source of particulate Fe from glacial meltwater to coastal Antarctic seas has been increasing over the past several decades and is expected to continue to increase as Antarctic ice shelves and glaciers melt and retreat due to global climate change (Monien et al., 2017). The source of particulate Co from glacial meltwater would also be expected to increase since Co, like Fe, has been observed to be transported from the Antarctic continent via ice melt (Westerlund and Öhman, 1991), and it is unclear what role this presumably increasing source of Co to the surface ocean plays in the reduced inventories of dCo in the surface ocean.
Although it is difficult to definitively conclude that the low dCo inventory observed on CICLOPS is representative of a decadal trend towards vitamin B12 limitation and not simply variation in micronutrient availability and community structure, the inventory and stoichiometric uptake trends documented in this study are compelling evidence for a changing biogeochemical Co cycle in the coastal Southern Ocean. Paired with the recent discovery of Zn/Fe co-limitation in Terra Nova Bay (Kellogg, 2022), these results suggest a complex landscape of micronutrient scarcity and limitation in coastal Antarctic seas, where plankton community structures and Fe additions from melting ice sheets can generate patches of vitamin B12 and Zn limitation within a broadly Fe-scarce HNLC region.
The bacterial community is essential to the development and alleviation of vitamin B12 limitation within a eukaryotic phytoplankton bloom, since only prokaryotes possess the metabolic pathway to synthesize the vitamin (Warren et al., 2002; Croft et al., 2005). In the Southern Ocean, near-zero counts of photosynthetic bacteria indicate that the heterotrophic bacterial communities are primarily responsible for vitamin B12 production in the region (Bertrand et al., 2011). Vitamin B12 can become limiting when the bacterial community is low in abundance and/or growth-limited by a different nutrient such as dissolved organic matter (DOM). In the Ross Sea, bacterioplankton have been found to be growth-limited by an inadequate supply of DOM (Church et al., 2000; Bertrand et al., 2011), and there can be up to a 1-month lag between the onset of the spring phytoplankton bloom and an associated bacterial bloom stimulated by phytoplankton DOM production (Ducklow et al., 2001). This offset suggests that vitamin B12 limitation among eukaryotes is most probable earlier in the season within the spring bloom. Additionally, low abundances of mesozooplankton and microzooplankton grazing rates in the Ross Sea create phytoplankton blooms with low grazing pressure (Caron et al., 2000; Ducklow et al., 2001), which may allow low DOM conditions to persist later into a bloom and exacerbate vitamin B12 stress among eukaryotes.
A shift towards vitamin B12 limitation would likely favor phytoplankton with flexible metabolisms that are able to reduce their demand for Co and vitamin B12 when necessary. Organisms that can express the vitamin B12-independent metE gene may out-compete those expressing the vitamin B12-dependent metH gene (Rao, 2020; Rodionov et al., 2003; Bertrand et al., 2013; Helliwell, 2017). P. antarctica, for example, may be well suited to periods of vitamin B12 limitation due to the symbiotic bacterial microbiomes that form within its colonies and produce B vitamins that allow the colonies to grow when B vitamins are otherwise unavailable (Brisbin et al., 2022). P. antarctica has also been found to express a novel metE fusion gene when vitamin-B12-limited and a metH gene while vitamin-replete, suggesting a highly flexible vitamin B12 metabolism (Rao, 2020).
There is compelling evidence for high rates of biological Co uptake in the Ross Sea during the 2017/2018 summer compared to the 2005/2006 summer driven by the uptake of dCo from vitamin B12 and Zn scarcity. Together, these two stressors increase the rate of Co uptake as well as the Co : C stoichiometry of phytoplankton biomass. The stoichiometry of Co uptake has been observed to be highly plastic in this study and others, responding to the availability of other micronutrients and the requirements of the microbial community (Sunda and Huntsman, 1995; Saito et al., 2017). An increase in ρCo could then result in a decrease of the Co inventory in coastal Antarctic seas, following the mechanism detailed below.
Biological uptake alone would not permanently remove Co from the water column; uptake only shifts Co from the dissolved phase to the particulate phase, where particulate organic matter (POM) remineralization restores Co back to the dissolved phase. The net removal pathways of Co include (1) burial as POM, (2) particle scavenging and (3) depletion of dCo into Circumpolar Deep Water (CDW) and Antarctic Bottom Water (ABW). We have already noted that Co scavenging to Mn oxides is particularly low in the Southern Ocean (Oldham et al., 2021). The advection of dCo into CDW may not be at a steady state throughout the year, since cycles of ice melt and formation affect the mixing of CDW and formation of dense Antarctic Bottom Water (ABW) and so may represent a removal pathway for dCo on an annual cycle. However, an increase in the burial flux of Co in POM is the most likely pathway for sustained loss of the Co inventory. When the ρCo rate increases, the stoichiometry of Co incorporation into biomass relative to P would also increase. Over the years, a strengthened demand for Co via vitamin B12 and Zn stress could result in a steady loss of Co if the Co : C and Co : PO stoichiometry of POM increases, but the remineralization of POM is unchanged, increasing the flux of particulate Co into the deep ocean and sediments. In the winter, sea ice covers the Antarctic seas and the water column mixes, a process that would propagate the low dCo concentrations from the photic zone into the deep ocean and result in a steady loss of the dCo inventory throughout the water column.
Additionally, warming surface ocean temperatures likely play a role in phytoplankton productivity and nutrient uptake. Increasing both dFe availability and temperature has been shown to significantly increase phytoplankton growth and phytoplankton abundance in the Ross Sea and impact community structure (Rose et al., 2009; Spackeen et al., 2018; Zhu et al., 2016). From a kinetic perspective, higher surface temperatures would be expected to increase the uptake rates of nutrients, including micronutrients like Fe, Co and Zn, by increasing the value of KM. However, the effects of temperature on productivity and community composition are more complex, since increasing ocean temperatures would also decrease the solubility of CO2, change the seasonality of ice cover and thus sunlight availability, and affect water column turnover and mixing regimes (Rose et al., 2009). The effect of warming temperatures on the intricate landscape of nutrient availability and limitation regimes described here is an open question in this study.
4.7 A two-box model that describes a mechanism for deep dCo inventory loss
To test the proposed mechanism that higher Co uptake rates and winter mixing can lead to a deep inventory loss of ∼ 10 pM Co over 12 years, a time-step two-box model of a 1 m2 water column was created in Microsoft Excel to simulate the Ross Sea dCo cycle. A schematic of the modeled dCo cycle is presented in Fig. 11, flux equations to describe the biogeochemical cycling of Co are presented in Appendix C, and the parameters used to simulate dCo loss over 12 years and a hypothetical steady-state condition are given in Table 6.
Table 6Parameters of the Co cycle two-box model, run as both a steady-state model with lower Co uptake rates (ρCo) and as a mechanism for deep dCo inventory loss driven by higher ρCo values. The calculated burial flux of particulate Co within each model variation is also given, but note that the burial flux values should be interpreted as a comparison of the Co sink via the biological pump when ρCo is varied and not as observed or meaningful Co flux magnitudes.
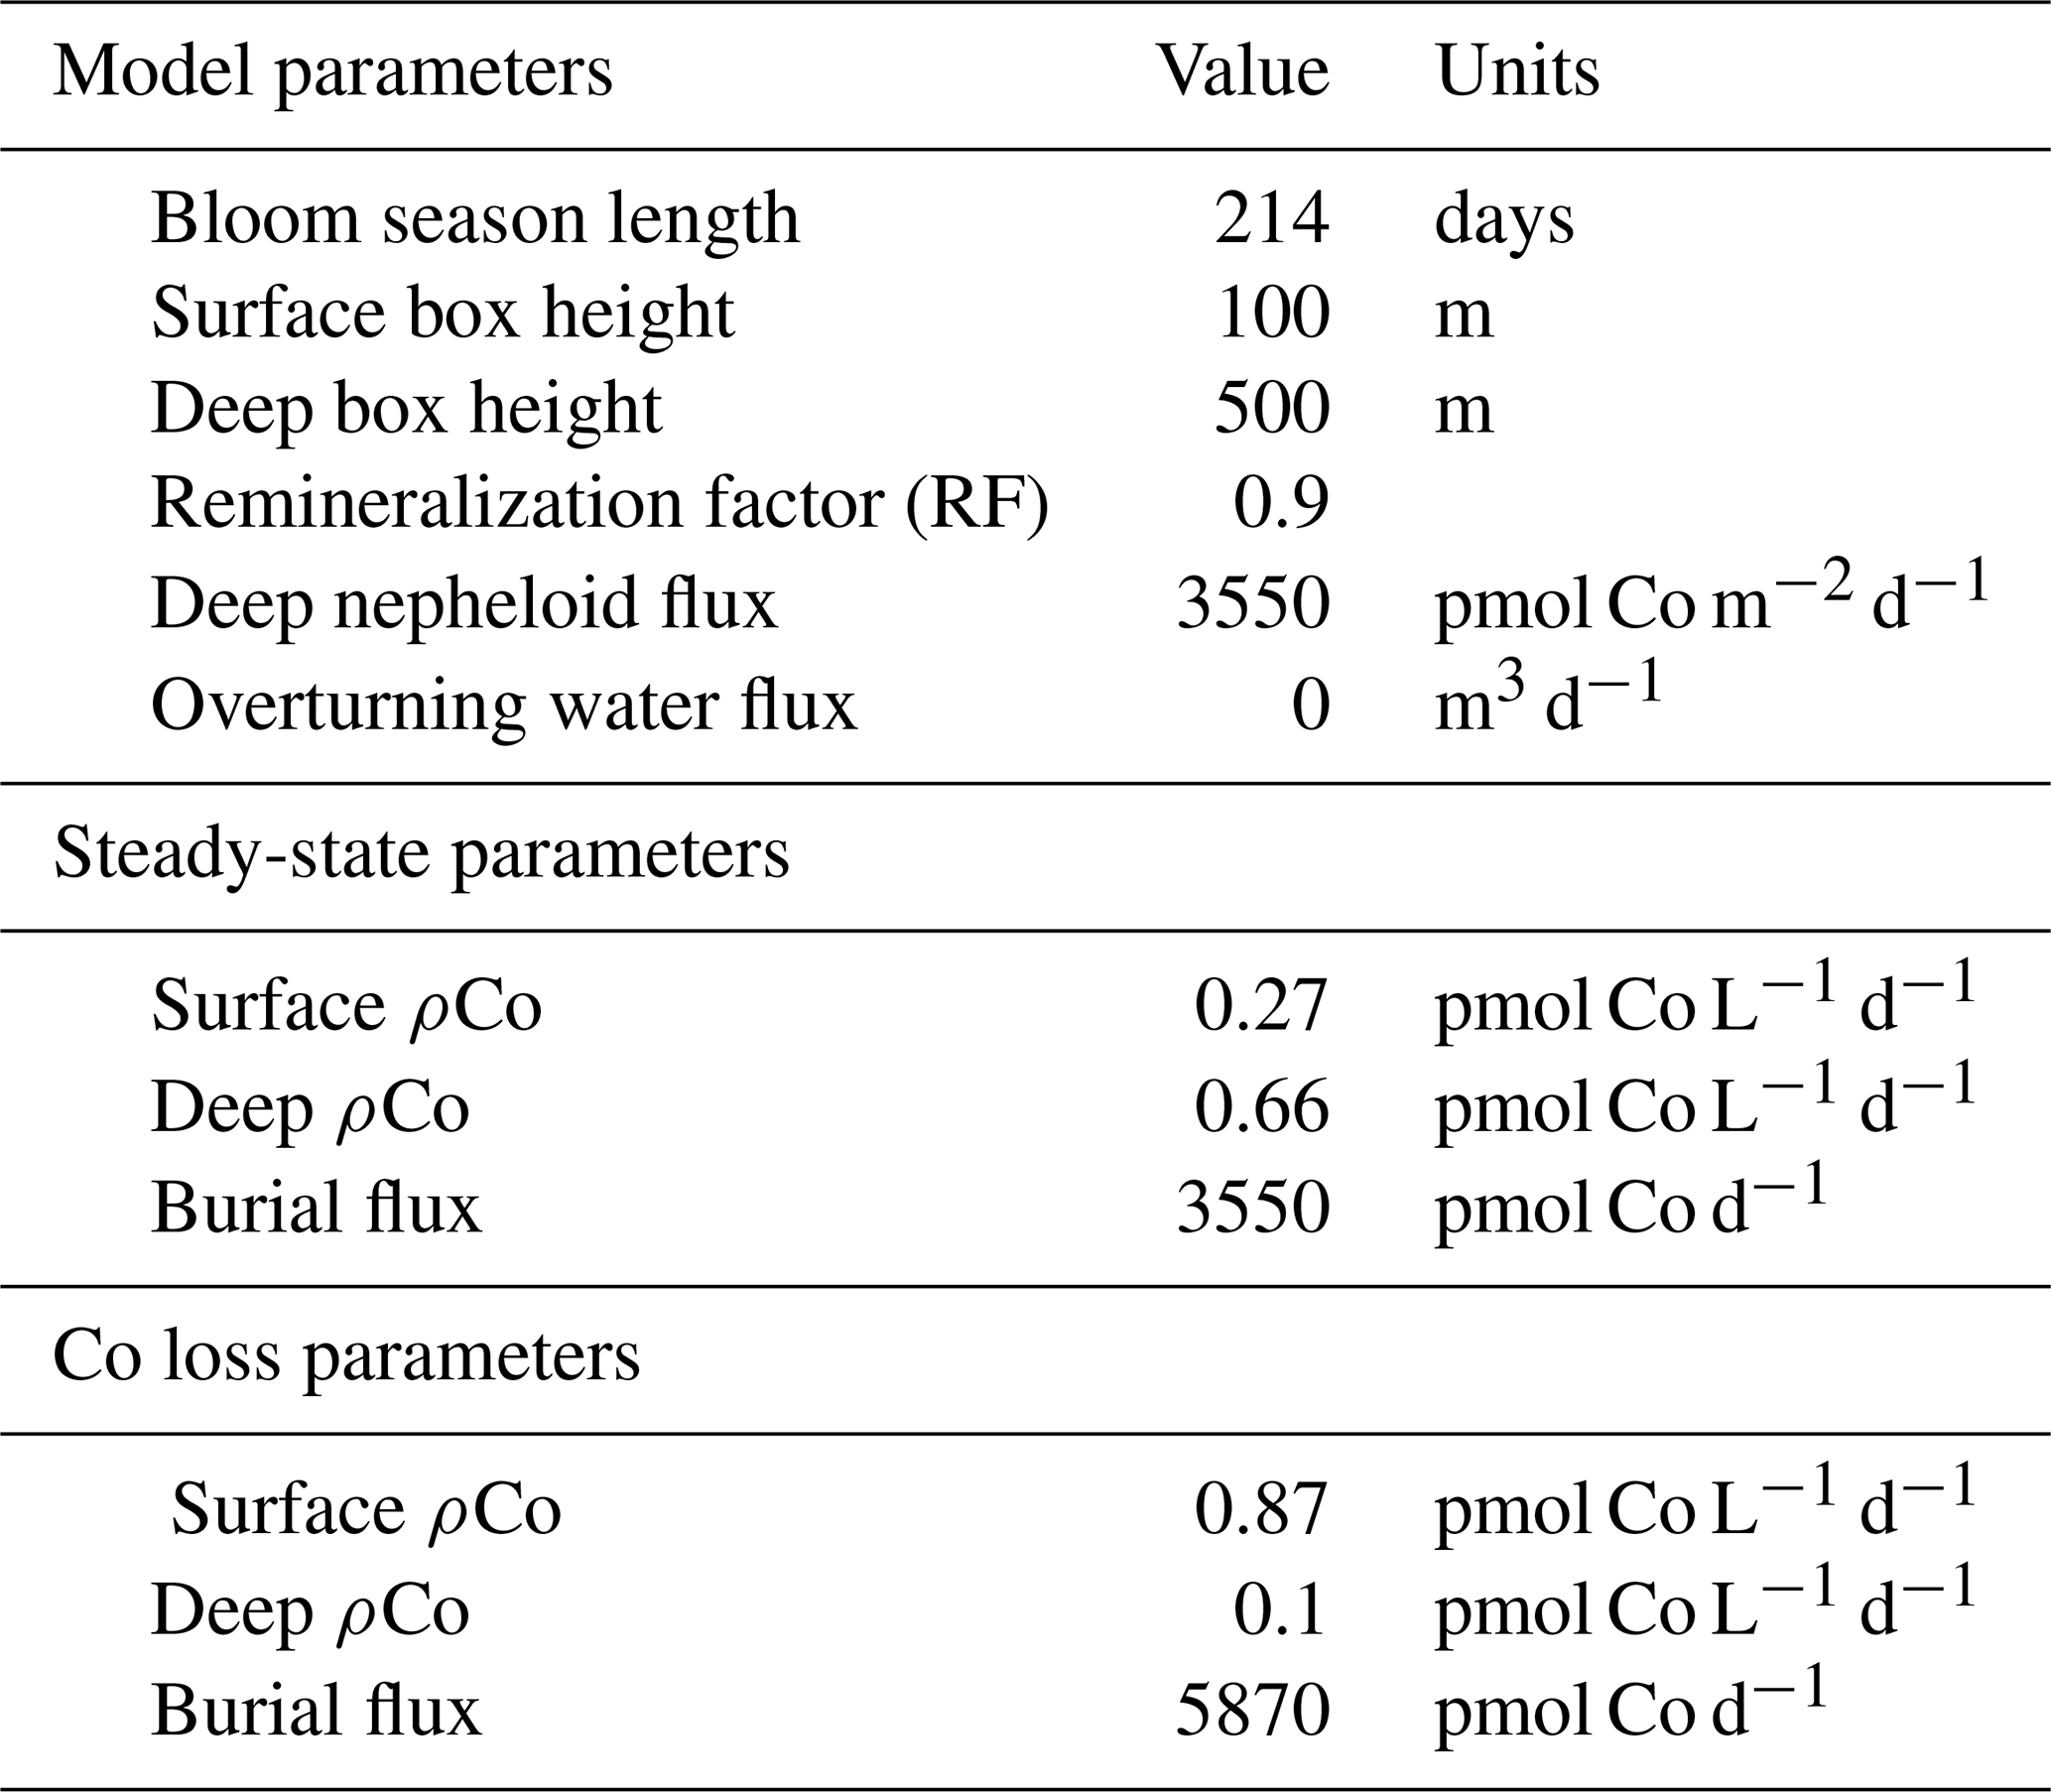
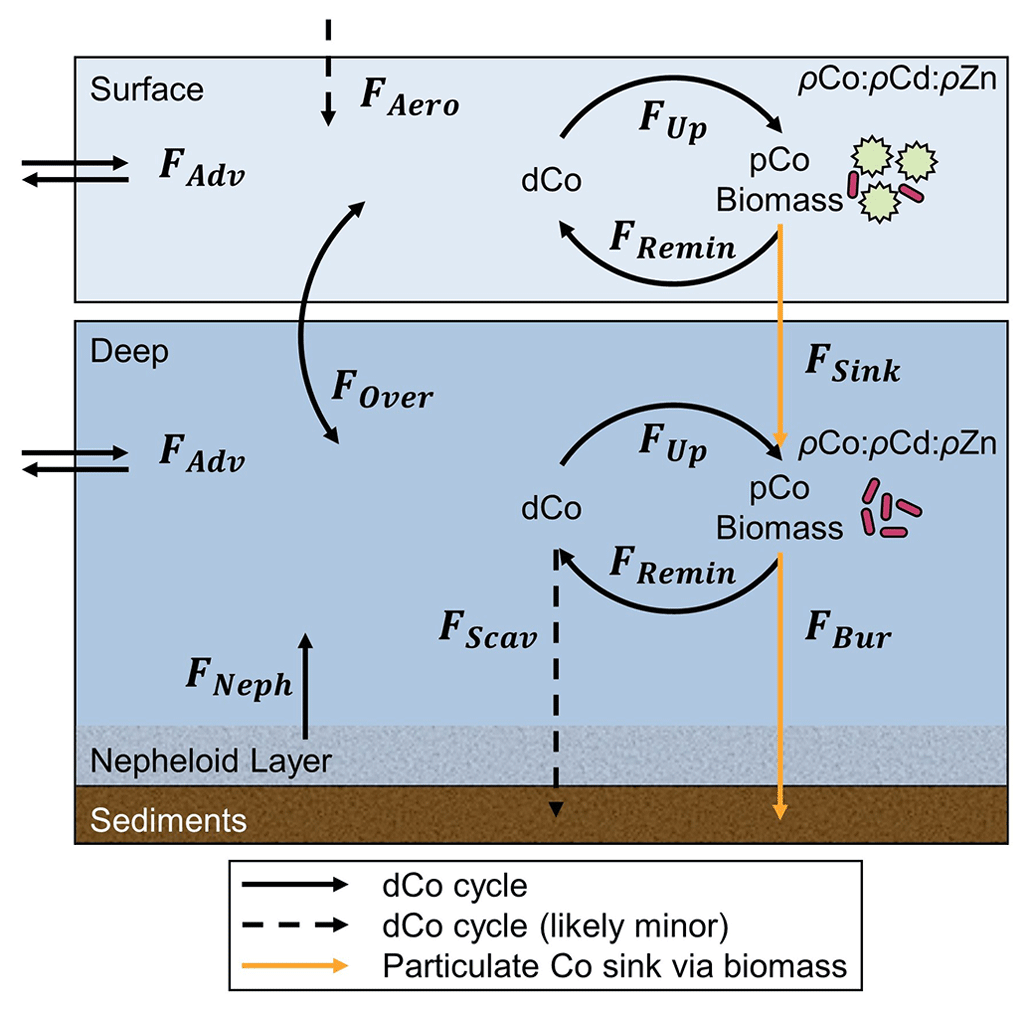
Figure 11A schematic of the dCo cycle (black arrows) and select processes of the particulate Co (pCo) cycle (orange arrows) presented as a simplified two-box model. Net fluxes of the dCo cycle include sources from aerosol deposition (FAero), bottom sediments and the nepheloid layer (FNeph), and scavenging to Mn oxide particles (FScav), which likely represents a minor flux in the coastal Antarctic seas. Internal cycling fluxes include horizontal advection (FAdv), water column overturning or mixing (FOver), biological uptake (FUp), and remineralization of pCo (FRemin). Fluxes of pCo shown here include sinking biomass from the surface into the deep ocean (FSink) and pCo burial into sediments along the seafloor (FBur). The biological uptake of dCo is influenced by the relative stoichiometric uptake of Co, Zn and Cd (ρCo : ρCd : ρZn) among the microbial community. Differential equations that describe and quantify these fluxes are presented in Appendix C.
The change in dCo concentration over time (d[dCo] dt) for a surface ocean (0–100 m) and deep ocean (100–500 m) was calculated as the sum of the dCo source fluxes minus the sum of the sink fluxes:
where FOver is the overturning flux between the two boxes, FRemin is the remineralization flux, FUp is the biological uptake flux, and FNeph is the flux of dCo from the nepheloid layer into the deep ocean (Table C1 in Appendix C). FUp was calculated using the measured ρCo uptake rates observed on the CORSACS and CICLOPS expeditions, and FRemin was calculated using an assumed surface and deep remineralization factor (RF) of 0.9, indicating that 90 % of the POM generated in the surface ocean is remineralized back to its inorganic dissolved components. In the Southern Ocean, the fluxes of scavenging and aerosol deposition would be relatively negligible, so these fluxes have been omitted from the model. The magnitude of FNeph in the Ross Sea remains unconstrained, and in this model the deep nepheloid dCo source was used as an adjustable parameter to tune the magnitude of deep dCo loss to be 10 pM over 12 years, which represents the approximate observed differences between the CORSACS and CICLOPS expeditions detailed in Sect. 4.3. A FNeph was calculated to be 3550 pmol dCo m−2 d−1 to the deep ocean, but this should not be considered a meaningful calculation of the observed nepheloid layer flux.
In the Ross Sea, the deep winter mixed layer can extend 600 m to the seafloor and turn over the whole water column in some locations (Smith and Jones, 2015), mixing the surface and deep ocean under the winter sea ice and resulting in near-vertical profiles of dCo in the early spring (Noble et al., 2013). Here, the winter mixing process was modeled by combining the surface and deep ocean boxes into one homogenized box during the winter season (151 d, ∼ 5 months). The dCo concentrations of the winter box were calculated using a volume-weighted average (see Appendix C).
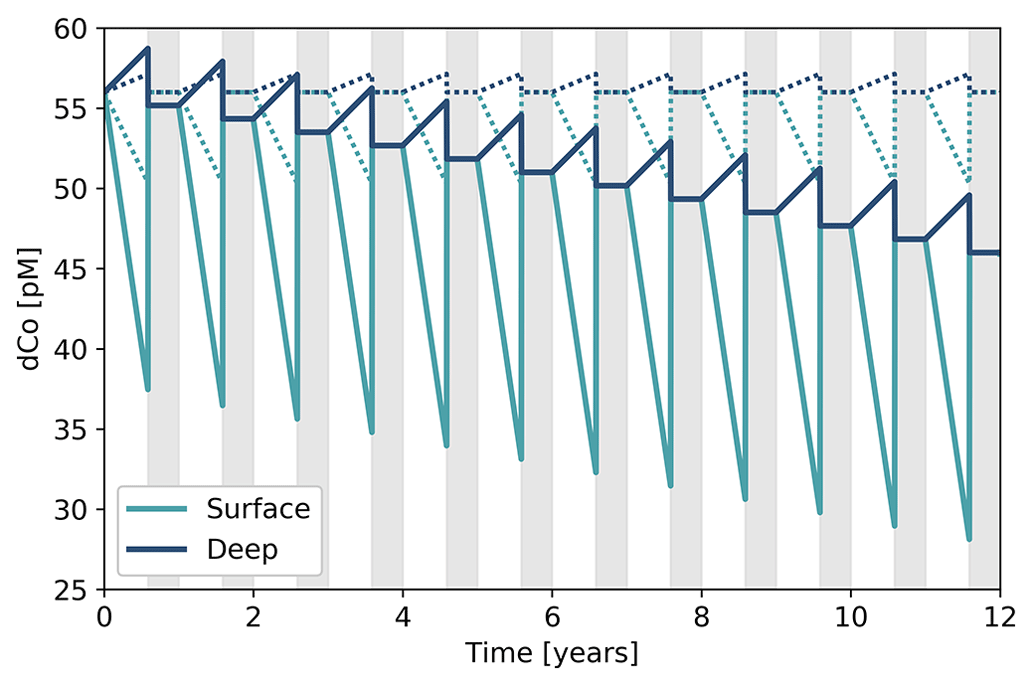
Figure 12Results of the two-box model illustrating a potential mechanism for the loss of the dCo inventory over time. Gray boxes represent the winter season when the surface and deep boxes mix. The dotted lines represent a system at a steady state, where the dCo inventory stays consistent annually. The solid lines represent a system exhibiting dCo loss, where increased Co uptake rates in both the surface and deep ocean result in an annually decreasing dCo inventory. The initial deep dCo concentration was 56 pM, which approximates the mean deep dCo concentrations observed on CORSACS-1 and CORSACS-2. Over 12 years, the dCo loss model depicts the loss of 0.83 pM yr−1 to end at a deep dCo inventory of 46 pM, the mean deep dCo concentration observed on CICLOPS.
This model provides a plausible mechanism by which increases in ρCo such as those observed along the CICLOPS expedition might increase the burial flux of particulate Co, resulting in a net loss to the deep dCo inventory. The uptake rate of Co both within and below the photic zone, as well as the fraction of POM that is remineralized, dictated the flux of particulate Co into the sediments via burial. The initial dCo concentration was set at 56 pM, which approximates the mean deep dCo concentrations observed on both CORSACS-1 and CORSACS-2. When the model was run for 12 years, the time period between the first CORSACS expedition and the CICLOPS expedition, it generated a sawtooth pattern; the surface and deep boxes diverged over the course of the summer bloom season as biological uptake removed dCo from the surface box and remineralization replenished dCo in the deep box (Fig. 12). Winter mixing then unified and reset the water column, replenishing the surface dCo inventory. The model was run at a steady state using the average surface ρCo rate observed on CORSACS-1 (0.27 pmol L−1 d−1; Table 6) (Saito et al., 2010) and deep ρCo values that were tuned to allow no change in the deep dCo inventory every winter. When the model was run using representative surface and deep ρCo values observed on the CICLOPS expedition (0.87 and 0.1 pmol Co L−1 d−1, respectively), the surface depletion of dCo was more pronounced by the end of the bloom season compared to the steady-state model, and winter mixing resulted in a steady annual decrease of the deep dCo inventory. The mechanism of dCo loss was driven by increasing ρCo, particularly in the surface ocean, and the propagation of dCo loss into the deep ocean via vertical mixing. The resulting burial flux when the model exhibited a deep dCo loss mechanism was higher than when the model was run at a steady state (Table 6), demonstrating how higher Co uptake rates among plankton paired with a deep winter mixed layer can result in a diminishing dCo inventory on a decadal timescale.
The purpose of this model was to illustrate a possible mechanism for a dCo inventory loss over the 12-year period between the CORSACS and CICLOPS expeditions using reasonable estimates of Co uptake and other Co cycle fluxes to achieve the observed 10 pM deep inventory loss. This box model successfully shows the directionality of the changes to the deep-ocean dCo inventory and deep burial flux when the ρCo values increase, but the magnitude of the estimated Co burial or the nepheloid Co source should not be considered to be meaningful flux values. The model represented a greatly simplified version of the carbon pump in the Southern Ocean, and it is likely that at least some of the unquantified Co cycle fluxes were not negligible, including horizontal advection, overturning water during the summer season, Co scavenging and a surface aerosol source. Additionally, it is a simplifying assumption that ρCo values would be consistent throughout a surface or deep depth region, as well as consistent over an entire summer season. Despite its simplicity, the box model presented a concise and reasonable mechanism for this study's observation of a shrinking dCo inventory in the Ross Sea.
The Ross Sea, the Amundsen Sea and Terra Nova Bay displayed lower dCo and labile dCo inventories during the 2017/2018 austral summer relative to prior observations in the region, which is consistent with observations of higher rates of Co use and uptake by phytoplankton and heterotrophic bacteria. The nearly 100 % complexation of the dCo inventory reveals that the dCo loss is primarily due to the uptake of labile dCo, the most bioavailable form of dCo to marine microbes. The decrease in dCo throughout the water column compared to prior observations is indicative of a multi-year mechanism, whereby the removal of dCo from the surface mixed layer via uptake over the summer has been propagated into the deep ocean via winter mixing, resulting in a decrease in dCo concentration throughout the water column. This mechanism is reliant upon increased dCo uptake into organic matter and an increase in the burial rate of Co as organic matter. The observed biogeochemical differences may be due to the alleviation of Fe limitation through inputs from increased glacial melting and subsequent development of intermittent vitamin B12 and/or Zn limitation, both of which would be expected to increase the demand for Co among plankton communities.
In coastal Antarctica and other regions impacted by global climate change, Co is a noteworthy trace metal nutrient to investigate because its small inventory and flexible phytoplankton stoichiometry make its biogeochemical cycle particularly vulnerable to perturbation. In the Arctic Ocean, for example, the dCo and labile dCo inventories have increased as melting ice and permafrost have increased the flux of Co-enriched riverine waters and sediments to the upper ocean (Bundy et al., 2020). Like many other trace nutrients, the Co cycle is integrally connected to that of other elements like Zn, Cd, Fe and carbon, and observations of perturbed Co inventories and changing nutrient limitation regimes would affect their biogeochemical cycles as well. In highly productive coastal Antarctic seas, shifts in micronutrient inventories and growth limitation could have implications for the composition of regional phytoplankton blooms and the magnitude of the Southern Ocean carbon sink.
Since the late 1980s, it has been hypothesized that the primary productivity and net carbon sequestration flux of the Southern Ocean is controlled by the supply of Fe to surface waters (Martin, 1990; Martin et al., 1990). This theory, called the “iron hypothesis”, posits that the addition of bioavailable Fe to an Fe-limited surface ocean stimulates productivity and, in turn, increases the regional and possibly global carbon sequestration flux from the atmosphere into deep-ocean sediments. When applied to potential carbon dioxide removal (CDR) geoengineering projects, the iron hypothesis provides a theoretical framework for ocean iron fertilization (OIF), where significant quantities of Fe are introduced to the surface Southern Ocean to enhance the net sequestration of CO2 and reduce global atmospheric CO2 concentrations (Emerson, 2019). Over the past 3 decades, several mesoscale Fe fertilization experiments have shown that large phytoplankton blooms can be stimulated by the addition of Fe to the surface Southern Ocean and that the impact on the CO2 sink is variable, modest and often difficult to assess (Coale et al., 1996; Boyd et al., 2000; de Baar et al., 2005; Smetacek et al., 2012). This study provides additional insights into the potential of OIF, suggesting that the alleviation of Fe limitation might shift the region towards the limitation of another trace nutrient such as vitamin B12, Zn and potentially Co. The nutrient limitation regimes of the Southern Ocean are complex, heterogeneous and possibly shifting on decadal timescales, and these intricacies must be examined when considering future OIF projects.
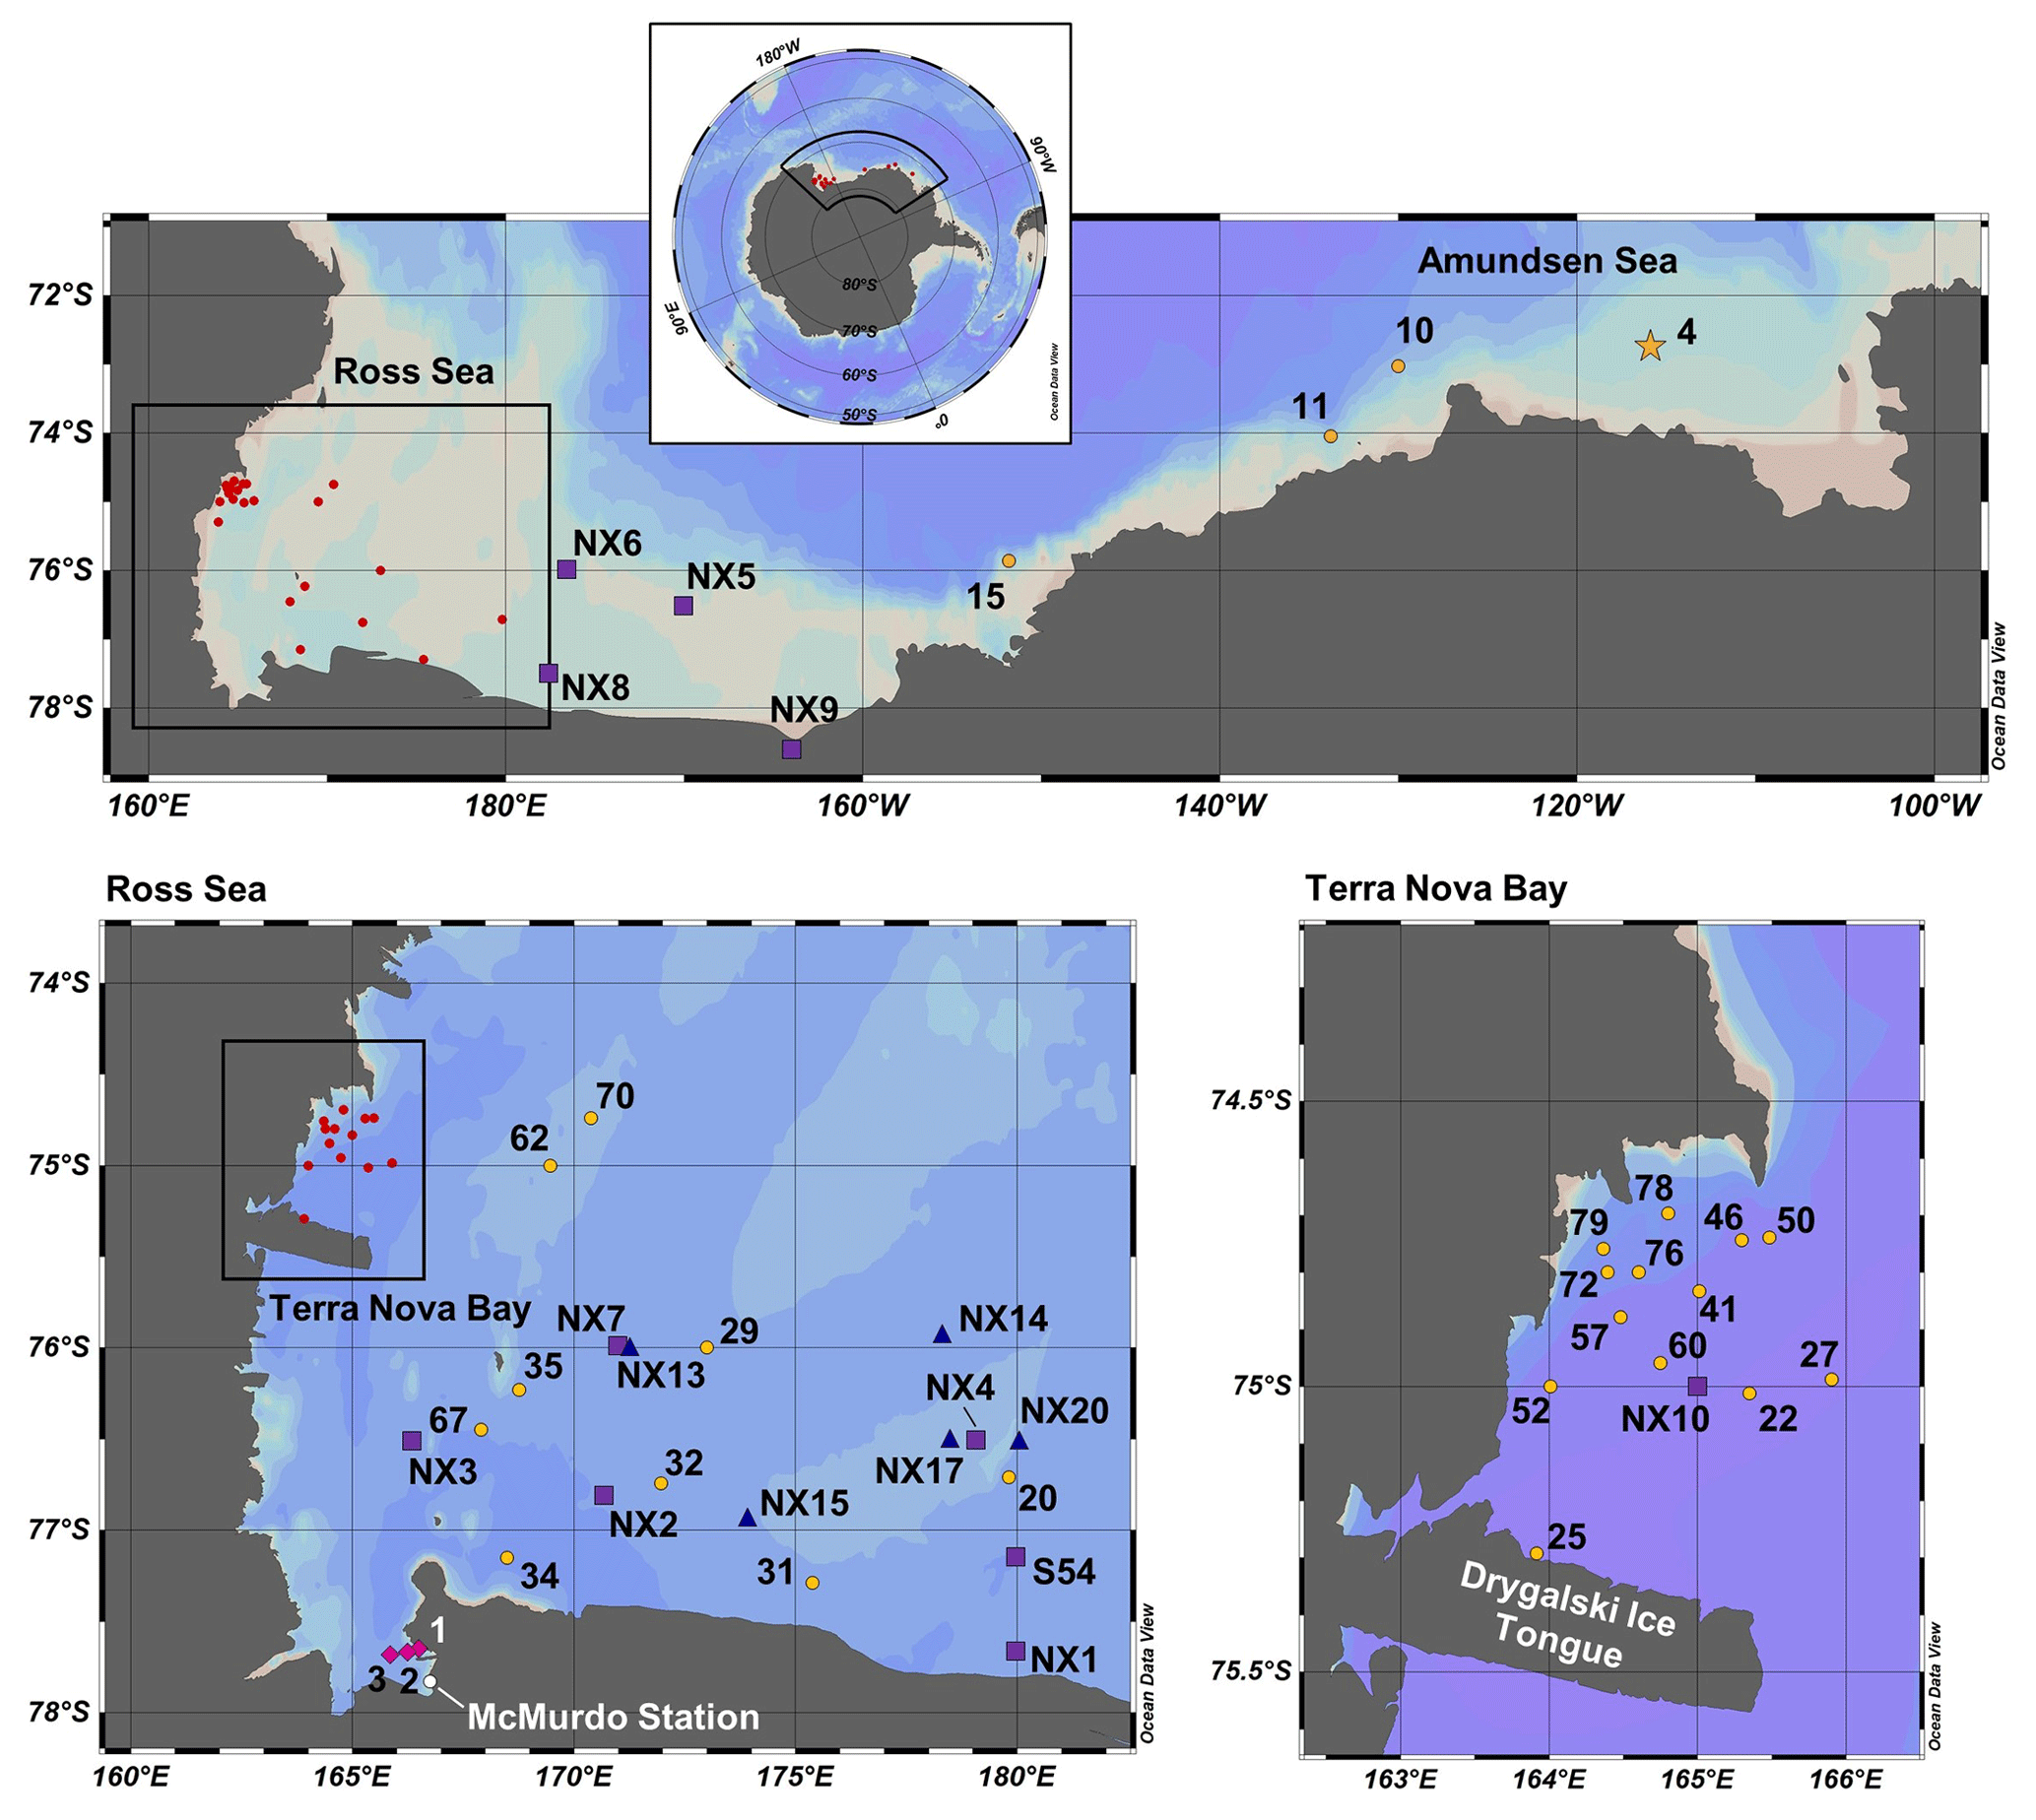
Figure A1Map of the CICLOPS (yellow circles), CORSACS-1 (purple squares), CORSACS-2 (blue triangles) and McMurdo Sound fieldwork (magenta diamonds) stations in coastal Antarctic waters, including insets of stations within the Ross Sea and Terra Nova Bay. Only stations from the CORSACS-1 and CORSACS-2 expeditions whose data are used in this study are shown. Stations marked in red are CICLOPS stations shown in more detail in an inset. Note that the gray coastline marks both the terrestrial coastline and areas of consistent ice, including ice shelves and glaciers; this includes the Drygalski Ice Tongue, a glacier to the south of Terra Nova Bay.
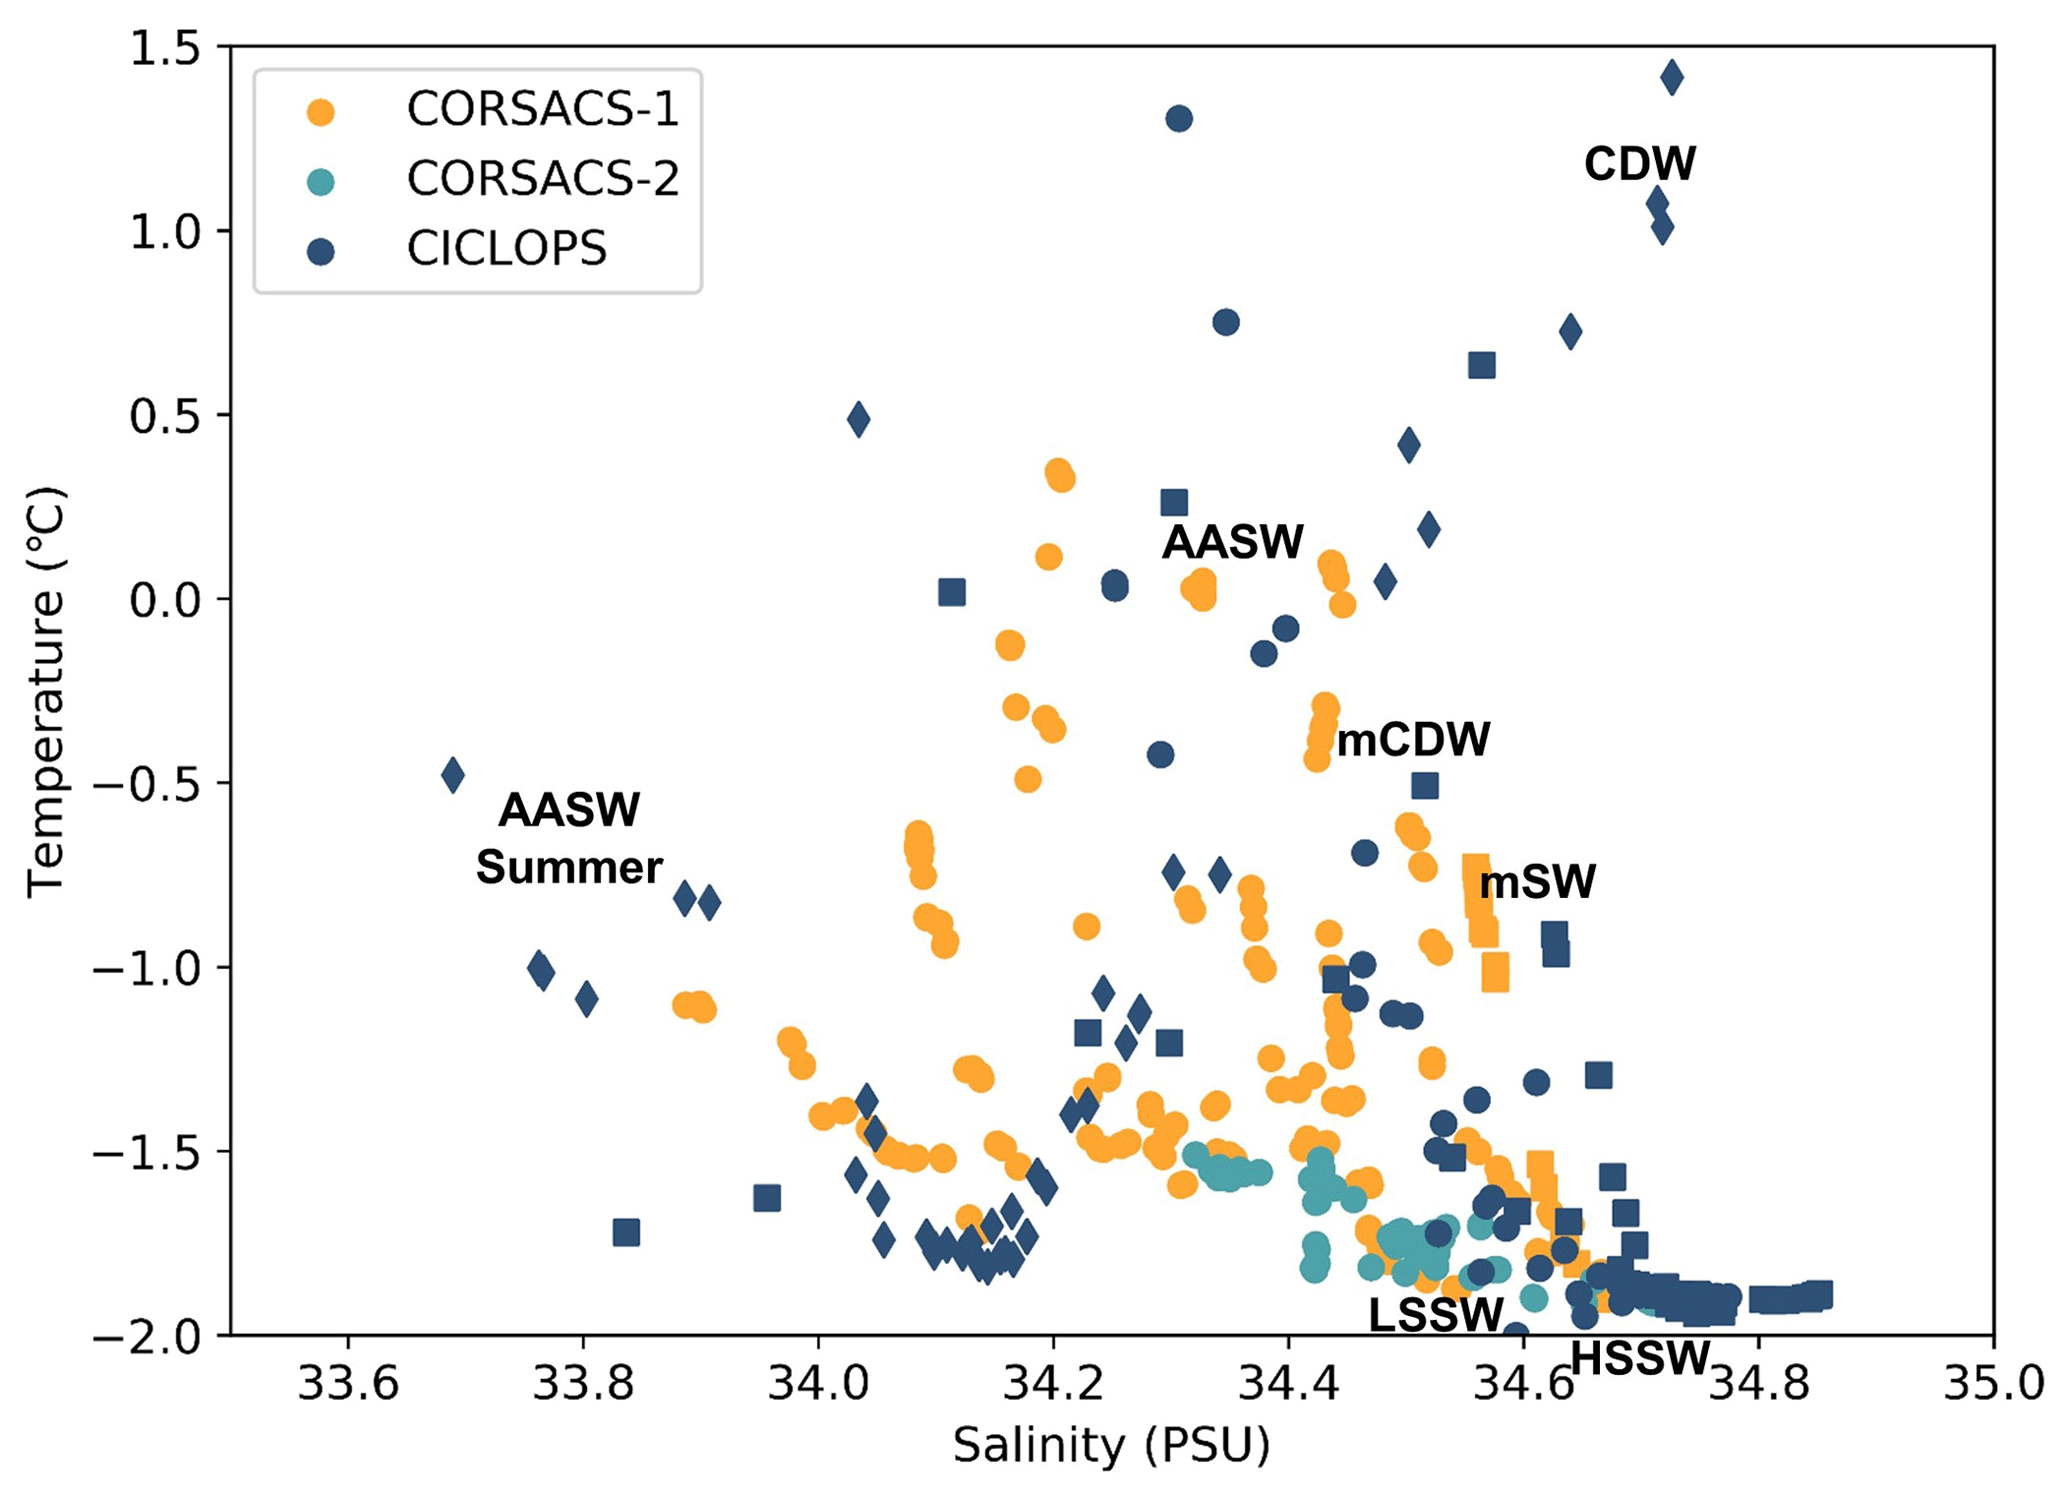
Figure A2The temperature–salinity relationship and water mass classification of samples from the Amundsen Sea (diamonds), the Ross Sea (circles) and Terra Nova Bay (squares). Sample data are shown only from samples used to compare dCo data from the CORSACS-1, CORSACS-2 and CICLOPS expeditions in Sect. 4.3. Labeled water masses include Circumpolar Deep Water (CDW), modified Circumpolar Deep Water (mCDW), modified shelf water (mSW), low-salinity shelf water (LSSW), high-salinity shelf water (HSSW), Antarctic surface water (AASW) and the fresher summertime AASW (AASW Summer). Classification of water mass samples from the CICLOPS expedition are taken from Rao (2020), Fig. 3-25 and references therein. Note that the CORSACS-1, CORSACS-2 and CICLOPS expeditions largely overlapped in their water mass distribution in the Ross Sea and Terra Nova Bay.
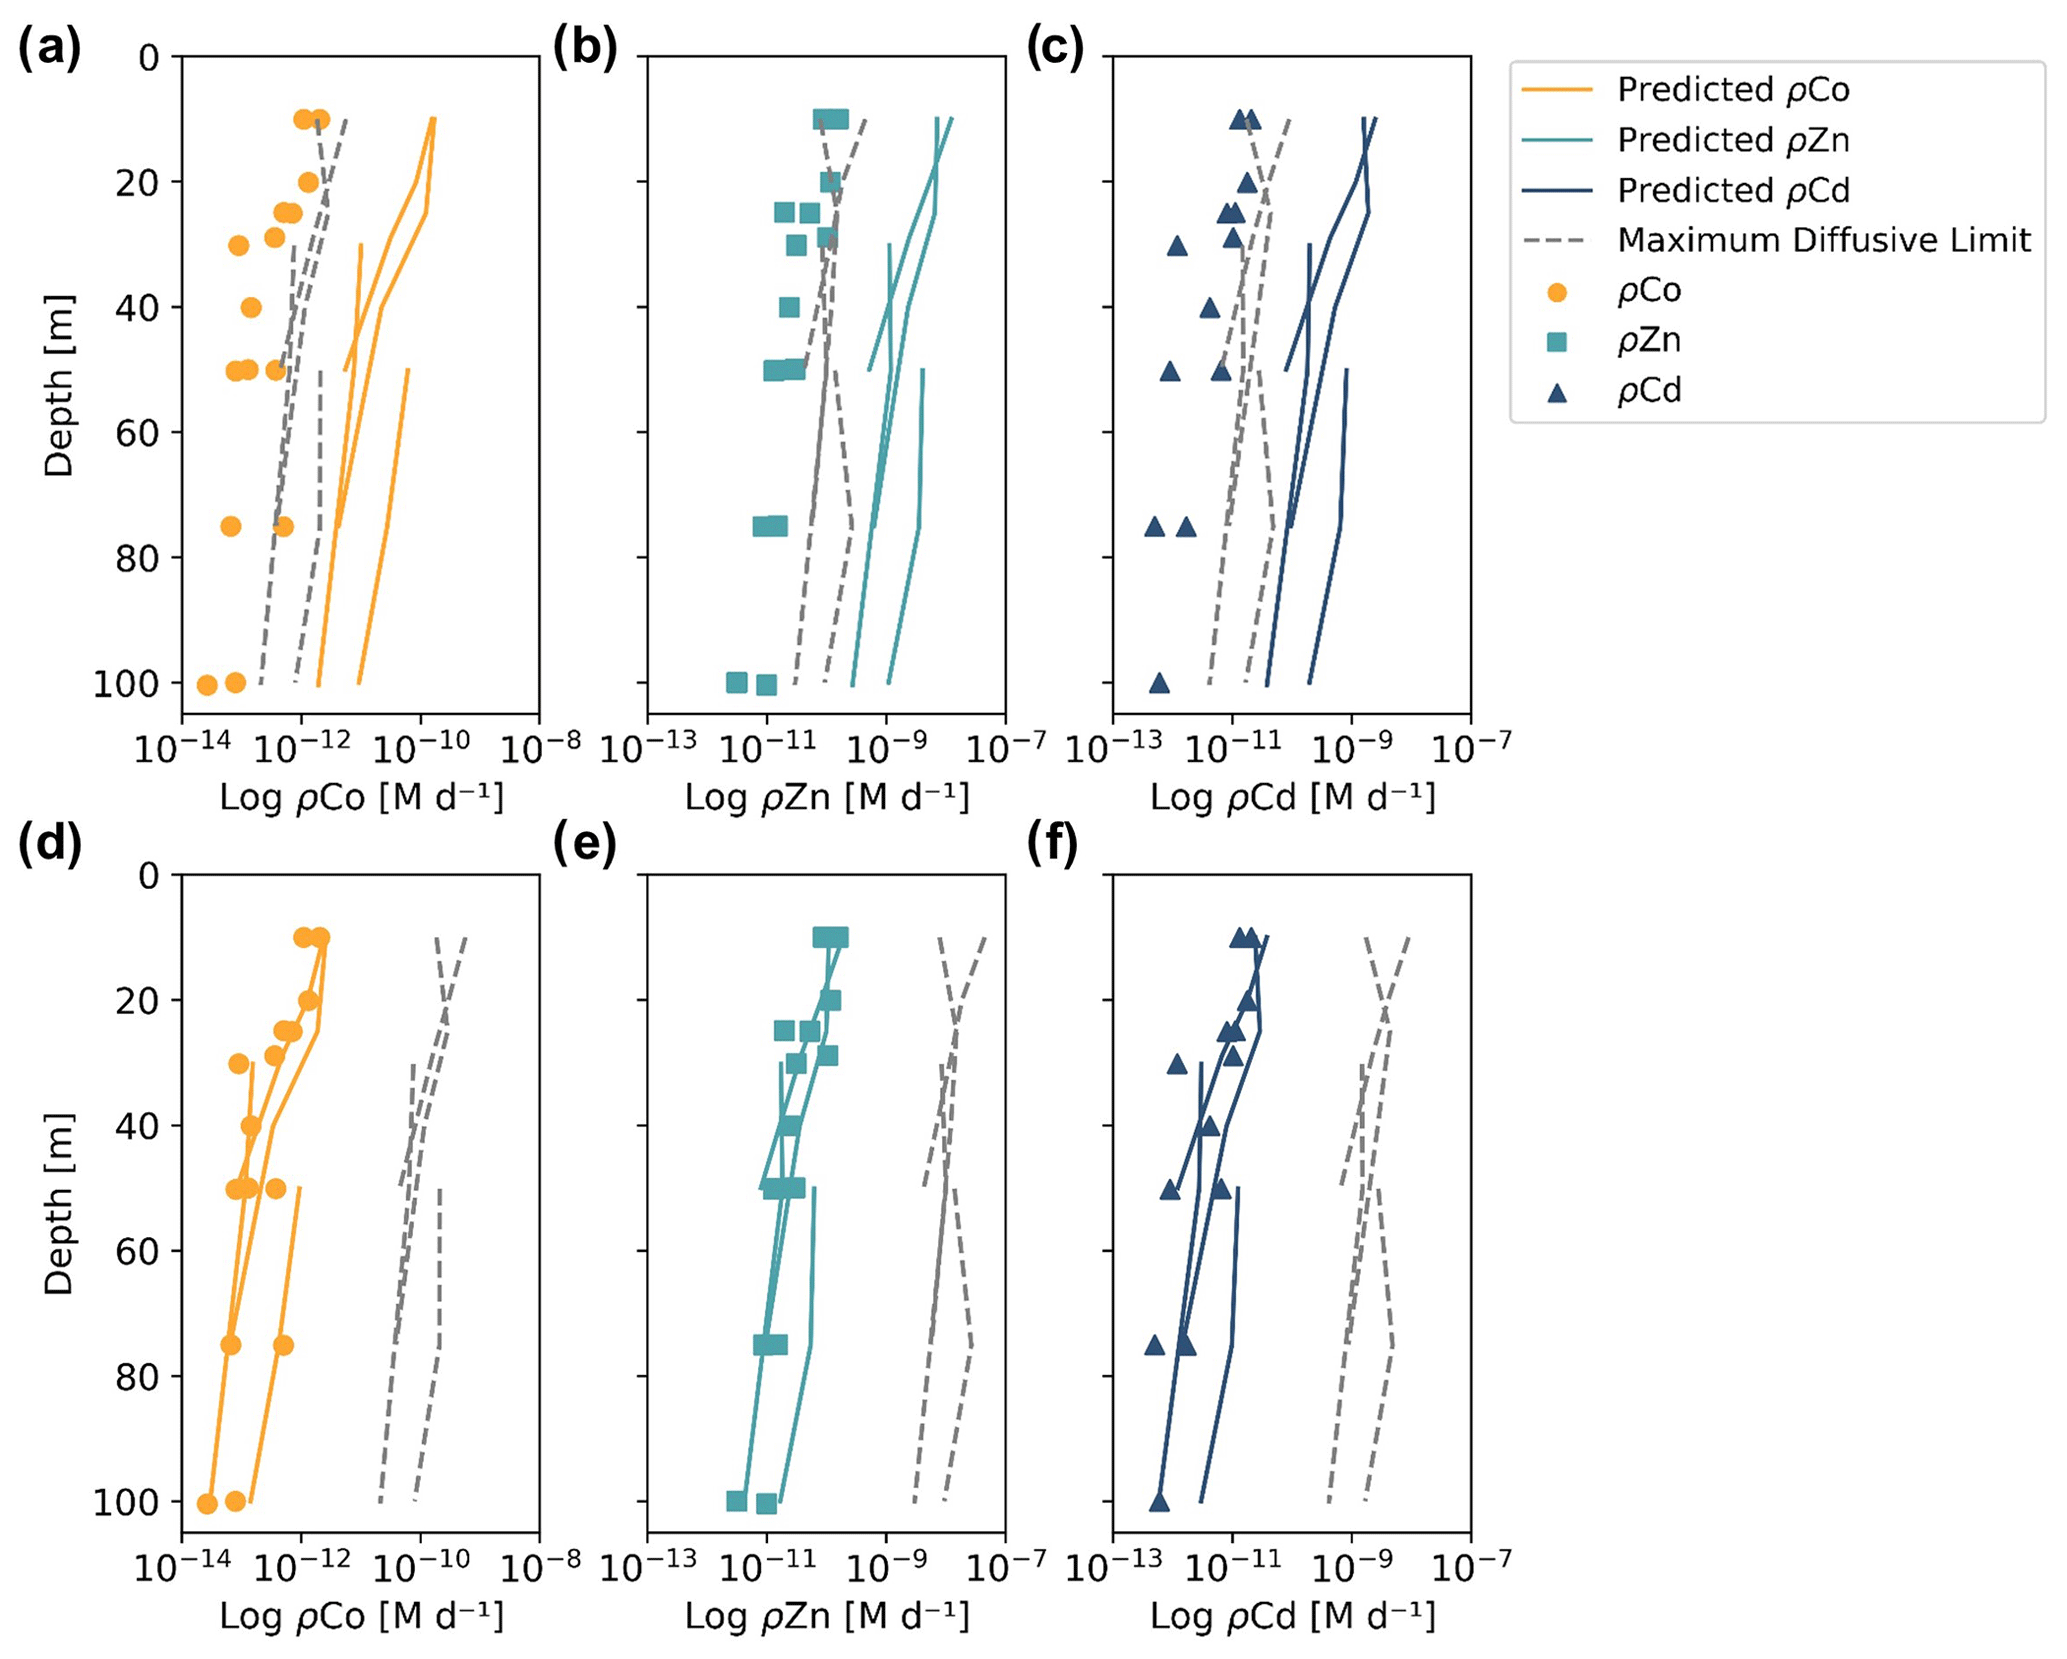
Figure B1Observed (markers) and predicted (solid lines) trace metal uptake rate (ρM) profiles and the estimated maximum diffusive limit profiles (dashed lines) for Co (a, d), Zn (b, e) and Cd (c, f) from stations 11, 20, 22 and 57, using different equation parameters than those used in Fig. 10. In panels (a)–(c), the predicted uptake rates used a literature Vmax value of 262 µmol (mol C−1) d−1 determined from Zn2+ uptake experiments in Emiliania huxleyi cultures (Sunda and Huntsman, 1992), resulting in predicted uptake rates that were orders of magnitude greater than the observed values. In panels (d)–(f), the estimated maximum diffusive limit profiles assumed that 100 % of the dCo, dZn and dCd inventories were labile and 0 % were bound to strong organic ligands, resulting in diffusive limits that were also orders of magnitude greater than the observed values. This analysis helps to show how parameter assumptions can greatly influence the predicted uptake rates and illustrates the difficulty of assigning kinetic parameters to environmental analyses.
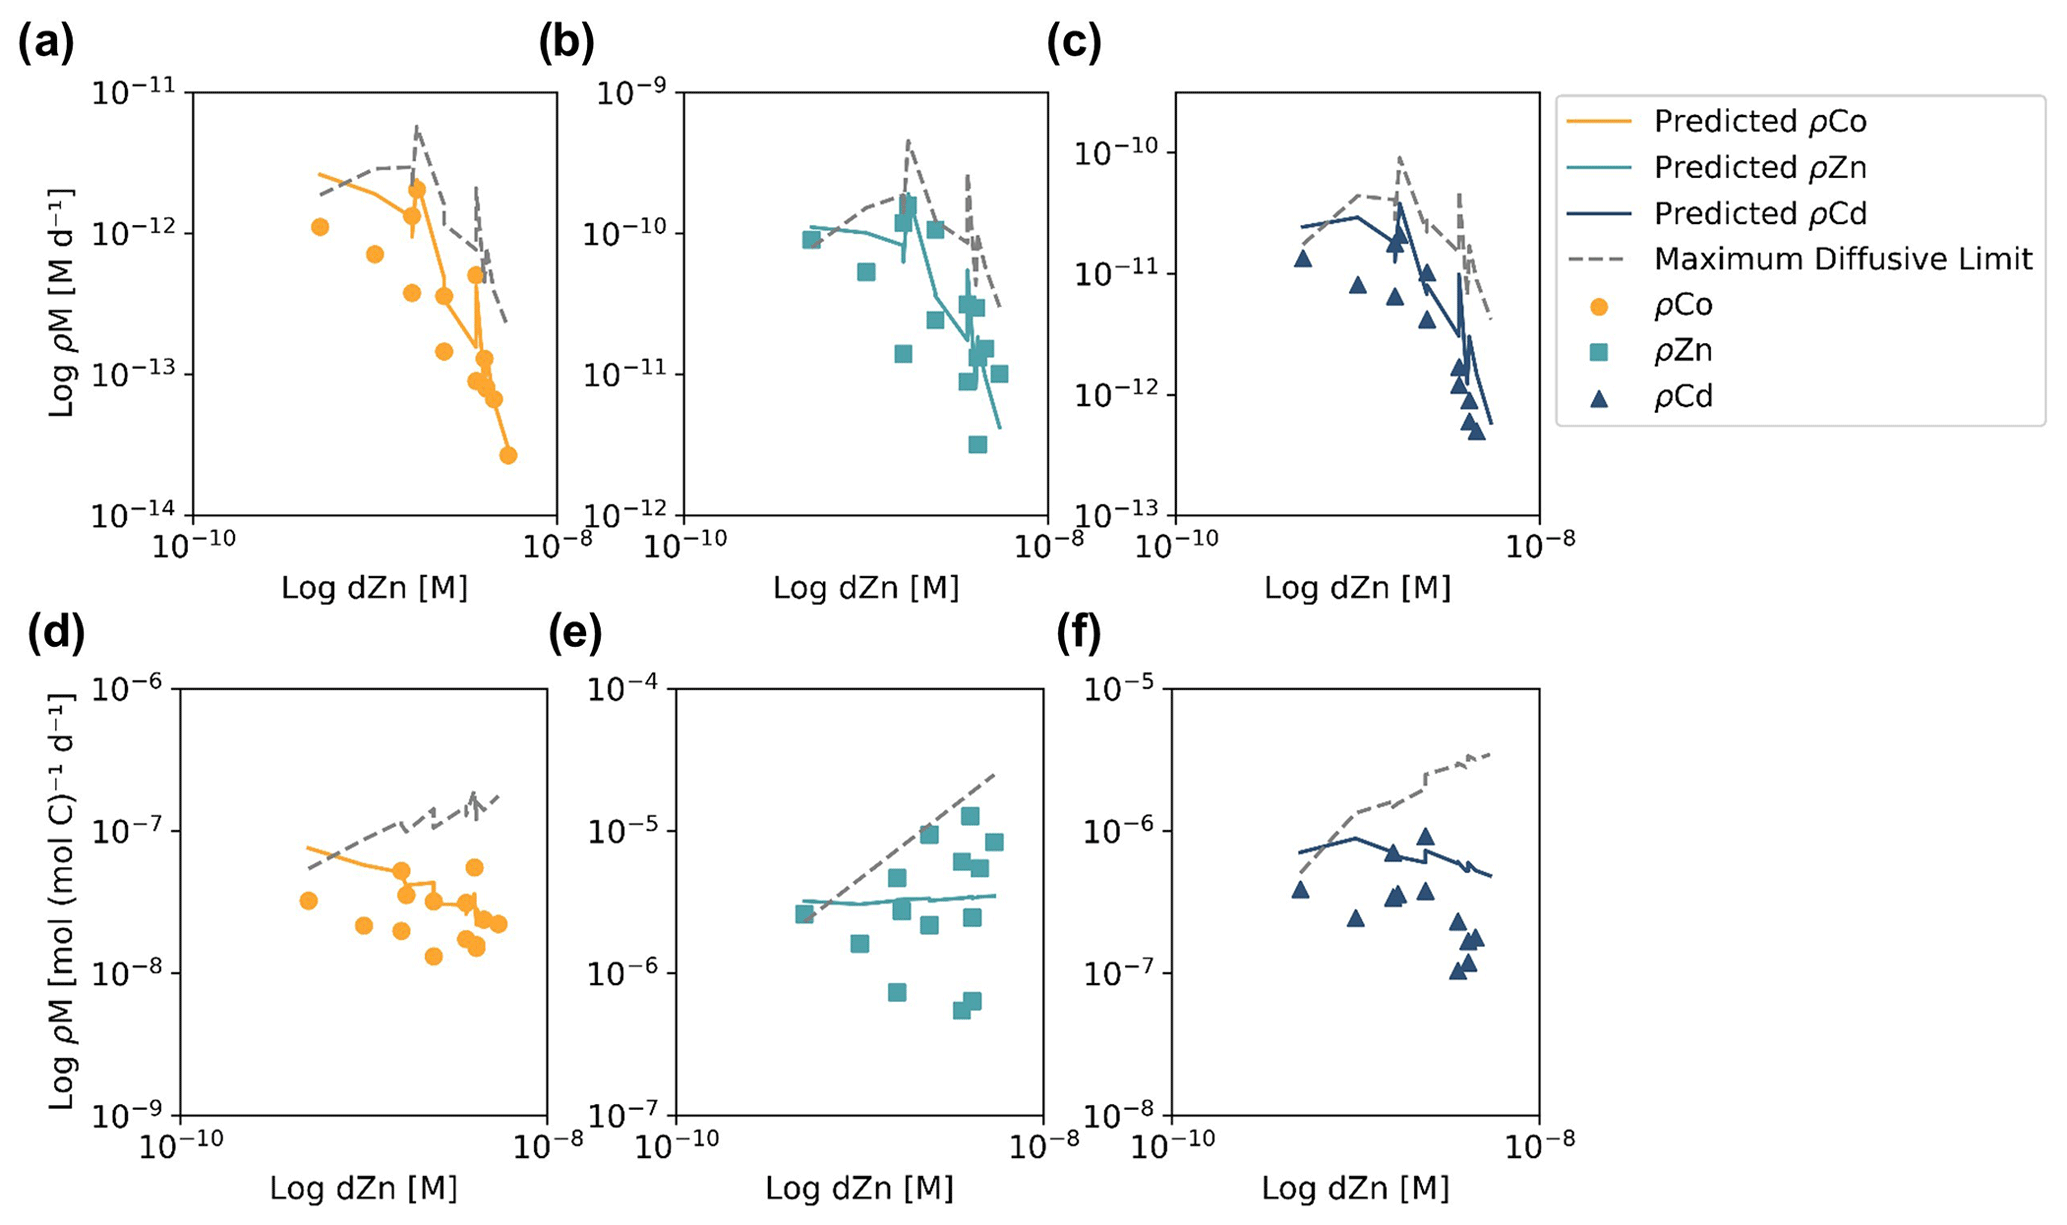
Figure B2Observed (markers) and predicted (solid lines) trace metal uptake rates (ρM) and the estimated maximum diffusive limit profiles (dashed lines) plotted against total dZn concentrations, assuming a Vmax of 4 µmol (mol C−1) d−1 and that 99 % of the trace metal inventory was bound to strong organic ligands. Panels (a)–(c) show ρM in units of M d−1, which tended to decrease at high dZn concentrations. This is attributable to higher dZn concentrations below the photic zone, where much lower rates of micronutrient uptake occur. Panels (d)–(f) show ρM when normalized to biomass using Chl a concentrations and a C : Chl a ratio of 130 (DiTullio and Smith, 1996). The normalized predicted ρZn values are relatively stable over the observed range of dZn concentrations, while the predicted ρCo and ρCd values decrease slightly as dZn increases, suggesting that competitive inhibition of ρCo and ρCd may have occurred at higher dZn concentrations due to the smaller inventories of dCo and dCd compared to dZn.
The two-box model described below was used to conceptualize the biogeochemical cycling of dCo in the surface and deep ocean. The model describes a 1 m2 column of water with a total depth of 600 m and a depth threshold between the surface and deep box of 100 m. Within each box, the net change of dCo over time is equivalent to the sum of the source fluxes minus the sum of the sink fluxes:
where fluxes (Fi) are in units of mol dCo d−1. A summary of the sources and sinks relevant to dCo in coastal Antarctic seas is shown below in Table C1. In the Southern Ocean, we would expect that the fluxes of scavenging (FScav) and aerosol deposition (FAero) would be relatively negligible, and so these fluxes have been omitted from the model. Additionally, we can assume that horizontal advection is at a steady state, and thus the net advection flux is ≈0 mol dCo d−1. This gives us the net equations for both boxes:
Table C1The source and sink fluxes of dCo in the surface and deep-ocean boxes. Fluxes are theoretically in units of mol dCo d−1.
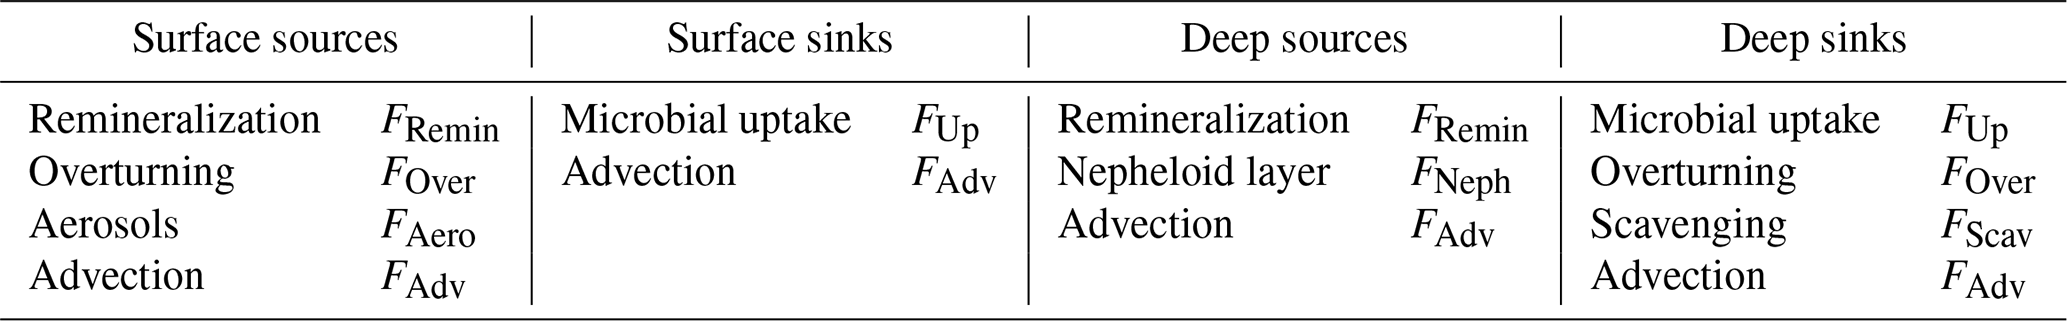
Uptake fluxes
The flux of dCo incorporation into microbial biomass via uptake by protein transporters can be described using the uptake rates (ρCo) measured by 57Co incubation experiments, where units of ρCo are in mol dCo L−1 d−1:
Remineralization fluxes
In this model, the remineralization flux of particulate Co in organic matter to dCo is quantified by a remineralization factor (RF), which can be applied to the amount of particulate matter present in each box. Typical RF values tend to be between 0.90 and 0.99 (Glover et al., 2011), meaning that between 90 % and 99 % of all microbial biomass produced tends to be remineralized before sinking out of its respective box. It is not clear that the RFs for the surface and deep box should be represented by the same value, and so we have defined both surface (RFSurface) and deep (RFdeep) variables here. In the surface ocean, excess Co in un-remineralized biomass will sink into the deep box (FSink), where it is further able to be remineralized in the deep ocean. In the deep ocean, excess Co in un-remineralized biomass is assumed to flux into the sediments via burial (FBur), representing a key sink of dCo biomass out of the two-box system. The surface box remineralization flux is represented with a relatively simple equation:
The deep-ocean remineralization flux can then be calculated as the sum of the remineralization flux from excess biomass that sinks as particulate Co and biomass generated in the deep ocean:
Overturning fluxes
An overturning dCo flux represents the flux of a volume of water from the deep-ocean box into the shallow-ocean box and a corresponding flux of the same volume from the shallow-ocean box into the deep-ocean box for mass conservation. In a dynamic coastal upwelling system like the Ross and Amundsen seas, the reality of this overturning flux is almost certainly much more complicated, as coastal upwelling processes overlap with meltwater processes and deep water mass formation processes. For the purposes of this two-box model, the flux of dCo via overturning can be estimated as a function of the overturning water flux (FWater) and the dCo concentrations of each box:
In the model presented in Sect. 4.7, the FWater and both FOver fluxes are assumed to be negligible for the sake of modeling simplicity, but the introduction of a nonzero overturning flux would help to make the seasonal change in the dCo inventory in both the surface and deep oceans nonlinear, as it is currently the only flux in this model that is calculated using the time step's dCo concentrations.
Flux from the nepheloid layer
At several CICLOPS stations, a distinct nepheloid layer was detected as dCo concentration increased sharply at depths immediately above (∼ 10 m) the ocean floor. The nepheloid layer tends to contain high levels of particles moving horizontally along the seafloor and is likely a significant source of dCo to the surrounding water column. The source of dCo from the nepheloid layer is somewhat unclear; it could be via dissolution of particles suspended within the nepheloid layer or from a porewater flux of dCo out of the sediments. In this model, the flux of deep dCo inputs into the deep ocean, assumed to be from the nepheloid layer, was derived using the Microsoft Excel solver tool, given the parameter that 10 pM of deep dCo was lost over 12 years. The deep source of dCo was calculated to be 3550 pmol dCo m−2 d−1. This value should be considered an adjustable parameter used to tune the model to our conceptual understanding of dCo inventory loss and not a meaningful calculation of observed Co flux from the deep nepheloid layer, which has yet to be constrained.
The cobalt burial sink
The loss of cobalt from the deep-ocean box into the sediments via burial can be quantified with the equation
where FSink is described by
This estimate of the loss of dCo due to burial assumes that all biogenic particulate Co that is not remineralized in the surface ocean sinks into the deep ocean, and all biogenic particulate Co that is not remineralized in the deep ocean is sequestered in sediments and “lost” to the model.
Modeling seasonality: the winter mixed layer
In the Ross and Amundsen seas, sea ice covers the surface ocean for a larger portion of the year (∼ 5 months). During this time, the water column mixes – a process that was modeled by combining the two-box model into one homogenized box after the 7-month bloom season to simulate the winter season. This process can be modeled by a volume-weighted average with the volume of each box.
The CICLOPS dCo dataset (https://doi.org/10.26008/1912/bco-dmo.893487.1; Saito, 2023), dissolved metal (dZn, dCd) dataset (https://doi.org/10.26008/1912/bco-dmo.877466.1; Kellogg and Saito, 2022a), Zn and Cd uptake rate dataset (https://doi.org/10.26008/1912/bco-dmo.877681.1; Kellogg and Saito, 2022b), and macronutrient dataset (https://doi.org/10.26008/1912/bco-dmo.874841.1; Saito and DiTullio, 2022) are publicly available on the Biological and Chemical Oceanography Data Management Office (BCO-DMO) website.
RJC collected and analyzed the dCo samples and wrote the paper. RMK collected and analyzed the dZn and dCd samples and measured Zn and Cd uptake rates. DR measured the Co uptake rates. GRD collected and analyzed the phytoplankton pigment samples. All authors assisted in the collection and processing of dissolved seawater samples and incubation experiment samples, and all authors helped write the paper.
The contact author has declared that none of the authors has any competing interests.
Publisher's note: Copernicus Publications remains neutral with regard to jurisdictional claims in published maps and institutional affiliations.
The authors thank the captain, crew and science party of the RVIB Nathaniel B. Palmer for their support during the CICLOPS expedition. We also thank Joe Jennings (OSU) for dissolved macronutrient analysis; Véronique Oldham for sampling assistance; and Matthew Charette, Stephanie Dutkiewicz and Alessandro Tagliabue for writing insights.
This research has been supported by the Office of Polar Programs (grant nos. OPP-1643684, OPP-1644073 and OPP-1643845).
This paper was edited by Koji Suzuki and reviewed by Randelle Bundy and Neil Wyatt.
Arrigo, K. R., Robinson, D. H., Worthen, D. L., Dunbar, R. B., DiTullio, G. R., Vanwoert, M., and Lizotte, M. P.: Phytoplankton community structure and the drawdown of nutrients and CO2 in the Southern Ocean, Science, 283, 365–367, 1999.
Arrigo, K. R., van Dijken, G. L., and Bushinsky, S.: Primary production in the Southern Ocean, 1997–2006, J. Geophys. Res., 113, C08004, https://doi.org/10.1029/2007JC004551, 2008.
Arrigo, K. R., Lowry, K. E., and van Dijken, G. L.: Annual changes in sea ice and phytoplankton in polynyas of the Amundsen Sea, Antarctica, Deep-Sea Res. Pt. II, 71–76, 5–15, https://doi.org/10.1016/j.dsr2.2012.03.006, 2012.
Bernhardt, H. and Wilhelms, A.: The continuous determination of low level iron, soluble phosphate and total phosphate with the AutoAnalyzer(TM), in: Technicon Symposium, edited by: Biddle, N., Mediad Incorporated, Vol. 1, p. 386, 1967.
Bertrand, E. M., Saito, M. A., Rose, J. M., Riesselman, C. R., Lohan, M. C., Noble, A. E., Lee, P. A., and DiTullio, G. R.: Vitamin B12 and iron colimitation of phytoplankton growth in the Ross Sea, Limnol. Oceanogr., 52, 1079–1093, https://doi.org/10.4319/lo.2007.52.3.1079, 2007.
Bertrand, E. M., Saito, M. A., Lee, P. A., Dunbar, R. B., Sedwick, P. N., and DiTullio, G. R.: Iron limitation of a springtime bacterial and phytoplankton community in the Ross Sea: implications for vitamin B12 nutrition, Front. Microbiol., 2, 160, https://doi.org/10.3389/fmicb.2011.00160, 2011.
Bertrand, E. M., Moran, D. M., McIlvin, M. R., Hoffman, J. M., Allen, A. E., and Saito, M. A.: Methionine synthase interreplacement in diatom cultures and communities: Implications for the persistence of B12 use by eukaryotic phytoplankton, Limnol. Oceanogr., 58, 1431–1450, https://doi.org/10.4319/lo.2013.58.4.1431, 2013.
Bown, J., Boye, M., and Nelson, D. M.: New insights on the role of organic speciation in the biogeochemical cycle of dissolved cobalt in the southeastern Atlantic and the Southern Ocean, Biogeosciences, 9, 2719–2736, https://doi.org/10.5194/bg-9-2719-2012, 2012.
Boyd, P. W., Watson, A. J., Law, C. S., Abraham, E. R., Trull, T., Murdoch, R., Bakker, D. C. E., Bowie, A. R., Buesseler, K. O., Chang, H., Charette, M., Croot, P., Downing, K., Frew, R., Gall, M., Hadfield, M., Hall, J., Harvey, M., Jameson, G., LaRoche, J., Liddicoat, M., Ling, R., Maldonado, M. T., McKay, R. M., Nodder, S., Pickmere, S., Pridmore, R., Rintoul, S., Safi, K., Sutton, P., Strzepek, R., Tanneberger, K., Turner, S., Waite, A., and Zeldis, J.: A mesoscale phytoplankton bloom in the polar Southern Ocean stimulated by iron fertilization, Nature, 407, 695–702, https://doi.org/10.1038/35037500, 2000.
Brisbin, M. M., Mitarai, S., Saito, M. A., and Alexander, H.: Microbiomes of bloom-forming Phaeocystis algae are stable and consistently recruited, with both symbiotic and opportunistic modes, ISME J., 16, 2255–2264, https://doi.org/10.1038/s41396-022-01263-2, 2022.
Budillon, G., Salusti, E., and Tucci, S.: The evolution of density currents and nepheloid bottom layers in the Ross Sea (Antarctica), J. Mar. Res., 64, 517–540, 2006.
Bundy, R. M., Tagliabue, A., Hawco, N. J., Morton, P. L., Twining, B. S., Hatta, M., Noble, A. E., Cape, M. R., John, S. G., Cullen, J. T., and Saito, M. A.: Elevated sources of cobalt in the Arctic Ocean, Biogeosciences, 17, 4745–4767, https://doi.org/10.5194/bg-17-4745-2020, 2020.
Caron, D. A., Dennett, M. R., Lonsdale, D. J., Moran, D. M., and Shalapyonok, L.: Microzooplankton herbivory in the Ross Sea, Antarctica, Deep-Sea Res. Pt. II, 47, 3249–3272, 2000.
Chandler, J. W., Lin, Y., Gainer, P. J., Post, A. F., Johnson, Z. I., and Zinser, E. R.: Variable but persistent coexistence of Prochlorococcus ecotypes along temperature gradients in the ocean's surface mixed layer, Env. Microbiol. Rep., 8, 272–284, https://doi.org/10.1111/1758-2229.12378, 2016.
Chappell, P. D., Vedmati, J., Selph, K. E., Cyr, H. A., Jenkins, B. D., Landry, M. R., and Moffett, J. W.: Preferential depletion of zinc within Costa Rica upwelling dome creates conditions for zinc co-limitation of primary production, J. Plankton Res., 38, 244–255, https://doi.org/10.1093/plankt/fbw018, 2016.
Chmiel, R., Lanning, N., Laubach, A., Lee, J.-M., Fitzsimmons, J., Hatta, M., Jenkins, W., Lam, P., McIlvin, M., Tagliabue, A., and Saito, M.: Major processes of the dissolved cobalt cycle in the North and equatorial Pacific Ocean, Biogeosciences, 19, 2365–2395, https://doi.org/10.5194/bg-19-2365-2022, 2022.
Church, M. J., Hutchins, D. A., and Ducklow, H. W.: Limitation of bacterial growth by dissolved organic matter and iron in the Southern Ocean, Appl. Environ. Microb., 66, 455–466, https://doi.org/10.1128/AEM.66.2.455-466.2000, 2000.
Coale, K. H., Johnson, K. S., Fitzwater, S. E., Gordon, R. M., Tanner, S., Chavez, F. P., Ferioli, L., Sakamoto, C., Rogers, P., Millero, F., Steinberg, Pa., Nightingale, P., Cooper, D., Cochlan, W. P., Landry, M. R., Constantinou, J., Rollwagen, G., Trasvina, A., and Kudela, R.: A massive phytoplankton bloom induced by an ecosystem-scale iron fertilization experiment in the equatorial Pacific Ocean, Nature, 383, 495–501, 1996.
Cohen, N. R., McIlvin, M. R., Moran, D. M., Held, N. A., Saunders, J. K., Hawco, N. J., Brosnahan, M., DiTullio, G. R., Lamborg, C., McCrow, J. P., Dupont, C. L., Allen, A. E., and Saito, M. A.: Dinoflagellates alter their carbon and nutrient metabolic strategies across environmental gradients in the central Pacific Ocean, Nat. Microbiol., 6, 173–186, https://doi.org/10.1038/s41564-020-00814-7, 2021.
Croft, M. T., Lawrence, A. D., Raux-deery, E., Warren, M. J., and Smith, A. G.: Algae acquire vitamin B12 through a symbiotic relationship with bacteria, Nature, 438, 90–93, https://doi.org/10.1038/nature04056, 2005.
de Baar, H. J. W., Boyd, P. W., Coale, K. H., Landry, M. R., Tsuda, A., Assmy, P., Bakker, D. C. E., Bozec, Y., Barber, R. T., Brzezinski, M. A., Buesseler, K. O., Boyé, M., Croot, P. L., Gervais, F., Gorbunov, M. Y., Harrison, P. J., Hiscock, W. T., Laan, P., Lancelot, C., Law, C. S., Levasseur, M., Marchetti, A., Millero, F. J., Nishioka, J., Nojiri, Y., van Oijen, T., Riebesell, U., Rijkenberg, M. J. A., Saito, H., Takeda, S., Timmermans, K. R., Veldhuis, M. J. W., Waite, A. M., and Wong, C. S.: Synthesis of iron fertilization experiments: From the iron age in the age of enlightenment, J. Geophys. Res.-Oceans, 110, 1–24, https://doi.org/10.1029/2004JC002601, 2005.
DiTullio, G. and Geesey, M. E.: Photosynthetic Pigments in Marine Algae and Bacteria, in: Encyclopedia of Environmental Microbiology, edited by: Bitton, G., 2453–2470, John Wiley & Sons, Inc., New York, NY, https://doi.org/10.1002/0471263397.env185, 2003.
DiTullio, G. R. and Smith, W. O. J.: Spatial patterns in phytoplankton biomass and pigment distributions in the Ross Sea, J. Geophys. Res., 101, 18467–18477, 1996.
DiTullio, G. R., Grebmeier, J. M., Arrigo, K. R., and Lizotte, M. P.: Rapid and early export of Phaeocystis antarctica blooms in the Ross Sea, Antarctica, Nature, 404, 595–598, 2000.
DiTullio, G. R., Geesey, M. E., Jones, D. R., Daly, K. L., Campbell, L., and Smith, W. O. J.: Phytoplankton assemblage structure and primary productivity along 170∘ W in the South Pacific Ocean, Mar. Ecol.-Prog. Ser., 255, 55–80, 2003.
DiTullio, G. R., Garcia, N., Riseman, S. F., and Sedwick, P. N.: Effects of iron concentration on pigment composition in Phaeocystis antarctica grown at low irradiance, Biogeochemistry, 83, 71–81, https://doi.org/10.1007/s10533-007-9080-8, 2007.
Ducklow, H., Carlson, C., Church, M., Kirchman, D., Smith, D., and Steward, G.: The seasonal development of the bacterioplankton bloom in the Ross Sea, Antarctica, 1994–1997, Deep-Sea Res. Pt. II, 48, 4199–4221, 2001.
Ellwood, M. J., Van Den Berg, C. M. G., Boye, M., Veldhuis, M., de Jong, J. T. M., de Baar, H. J. W., Croot, P. L., and Kattner, G.: Organic complexation of cobalt across the Antarctic Polar Front in the Southern Ocean, Mar. Freshwater Res., 56, 1069–1075, https://doi.org/10.1071/MF05097, 2005.
Emerson, D.: Biogenic iron dust: A novel approach to ocean iron fertilization as a means of large scale removal of carbon dioxide from the atmosphere, Front. Mar. Sci., 6, 22, https://doi.org/10.3389/fmars.2019.00022, 2019.
Fitzwater, S. E., Johnson, K. S., Gordon, R. M., Coale, K. H., and Smith, W. O.: Trace metal concentrations in the Ross Sea and their relationship with nutrients and phytoplankton growth, Deep-Sea Res. Pt. II, 47, 3159–3179, 2000.
Gardner, W. D., Richardson, M. J., and Mishonov, A. V.: Global assessment of benthic nepheloid layers and linkage with upper ocean dynamics, Earth Planet. Sc. Lett., 482, 126–134, https://doi.org/10.1016/j.epsl.2017.11.008, 2018.
Glover, D., Jenkins, W., and Doney, S.: Modeling Methods for Marine Science, Cambridge University Press, New York, ISBN 978-0521867832, 2011.
Hawco, N. J., Ohnemus, D. C., Resing, J. A., Twining, B. S., and Saito, M. A.: A dissolved cobalt plume in the oxygen minimum zone of the eastern tropical South Pacific, Biogeosciences, 13, 5697–5717, https://doi.org/10.5194/bg-13-5697-2016, 2016.
Hawco, N. J., Lam, P. J., Lee, J., Ohnemus, D. C., Noble, A. E., Wyatt, N. J., Lohan, M. C., and Saito, M. A.: Cobalt scavenging in the mesopelagic ocean and its influence on global mass balance: Synthesizing water column and sedimentary fluxes, Mar. Chem., 201, 151–166, https://doi.org/10.1016/j.marchem.2017.09.001, 2017.
Helliwell, K. E.: The roles of B vitamins in phytoplankton nutrition: new perspectives and prospects, New Phytol., 216, 62–68, https://doi.org/10.1111/nph.14669, 2017.
Irving, H. and Williams, R. J. P.: Order of stability of metal complexes, Nature, 162, 746–747, 1948.
Jakuba, R. W., Moffett, J. W., and Dyhrman, S. T.: Evidence for the linked biogeochemical cycling of zinc, cobalt, and phosphorus in the western North Atltic Ocean, Global Biogeochem. Cy., 22, GB4012, https://doi.org/10.1029/2007GB003119, 2008.
Jakuba, R. W., Saito, M. A., Moffett, J. W., and Xu, Y.: Dissolved zinc in the subarctic North Pacific and Bering Sea: Its distribution, speciation, and importance to primary producers, Global Biogeochem. Cy., 26, GB2015, https://doi.org/10.1029/2010GB004004, 2012.
John, S. G., Geis, R. W., Saito, M. A., and Boyle, E. A.: Zinc isotope fractionation during high-affinity and low-affinity zinc transport by the marine diatom Thalassiosira oceanica, Limnol. Oceanogr., 52, 2710–2714, https://doi.org/10.4319/lo.2007.52.6.2710, 2007.
Kellogg, R. M.: Assessing the potential for Zn limitation of marine primary production: proteomic characterization of the low Zn stress response in marine diatoms, Ph.D. thesis, Massachusetts Institute of Technology; the Woods Hole Oceanographic Institution, https://hdl.handle.net/1721.1/144738 (last access: 24 September 2023), 2022.
Kellogg, R. and Saito, M. A.: Total dissolved metal concentrations measured during the 2017–2018 CICLOPS expedition, Biological and Chemical Oceanography Data Management Office (BCO-DMO) [data set], https://doi.org/10.26008/1912/bco-dmo.877466.1, 2022a.
Kellogg, R. and Saito, M. A.: Total Zn and Cd uptake rates of natural phytoplankton assemblages measured during the 2017-2018 CICLOPS expedition, Biological and Chemical Oceanography Data Management Office (BCO-DMO) [data set], https://doi.org/10.26008/1912/bco-dmo.877681.1, 2022b.
Kellogg, R. M., McIlvin, M. R., Vedamati, J., Twining, B. S., Moffett, J. W., Marchetti, A., Moran, D. M., and Saito, M. A.: Efficient zinc/cobalt interreplacement in northeast Pacific diatoms and relationship to high surface dissolved Co : Zn ratios, Limnol. Oceanogr., 65, 2557–2582, https://doi.org/10.1002/lno.11471, 2020.
Kellogg, R. M., Moosburner, M. A., Cohen, N. R., Hawco, N. J., McIlvin, M. R., Moran, D. M., DiTullio, G. R., Subhas, A. V., Allen, A. E., and Saito, M. A.: Adaptive responses of marine diatoms to zinc scarcity and ecological implications, Nat. Commun., 13, 1995, https://doi.org/10.1038/s41467-022-29603-y, 2022.
Lane, T. W., Saito, M. A., George, G. N., Pickering, I. J., Prince, R. C., and Morel, F. M. M.: A cadmium enzyme from a marine diatom, Nature, 435, 42–42, https://doi.org/10.1038/435042a, 2005.
Lee, J. G. and Morel, F. M. M.: Replacement of zinc by cadmium in marine phytoplankton, Mar. Ecol.-Prog. Ser., 127, 305–309, https://doi.org/10.3354/meps127305, 1995.
Marsay, C. M., Sedwick, P. N., Dinniman, M. S., Barrett, P. M., Mack, S. L., and McGillicuddy, D. J.: Estimating the benthic efflux of dissolved iron on the Ross Sea continental shelf, Geophys. Res. Lett., 41, 7576–7583, https://doi.org/10.1002/2014GL061684, 2014.
Martin, J. H.: Glacial-interglacial CO2 change: the iron hypothesis, Paleoceanography, 5, 1–13, https://doi.org/10.1029/PA005i001p00001, 1990.
Martin, J. H., Fitzwater, S. E., and Gordon, R. M.: Iron deficiency limits phytoplankton growth in Antarctic waters, Global Biogeochem. Cy., 4, 5–12, 1990.
Mazzotta, M. G., McIlvin, M. R., Moran, D. M., Wang, D. T., Bidle, K. D., Lamborg, C. H., and Saito, M. A.: Characterization of the metalloproteome of Pseudoalteromonas (BB2-AT2): biogeochemical underpinnings for zinc, manganese, cobalt, and nickel cycling in a ubiquitous marine heterotroph, Metallomics, 13, mfab060, https://doi.org/10.1093/mtomcs/mfab060, 2021.
Monien, D., Monien, P., Brünjes, R., Widmer, T., Kappenberg, A., Silva Busso, A. A., Schnetger, B., and Brumsack, H.-J.: Meltwater as a source of potentially bioavailable iron to Antarctica waters, Antarct. Sci., 29, 277–291, https://doi.org/10.1017/S095410201600064X, 2017.
Morel, F. M. M., Reinfelder, J. R., Roberts, S. B., Chamberlain, C. P., Lee, J. G., and Yee, D.: Zinc and carbon co-limitation of marine phytoplankton, Nature, 369, 740–742, https://doi.org/10.1038/369740a0, 1994.
Morel, F. M. M., Lam, P. J., and Saito, M. A.: Trace Metal Substitution in Marine Phytoplankton, Annu. Rev. Earth Pl. Sc., 48, 491–517, https://doi.org/10.1146/annurev-earth-053018-060108, 2020.
Noble, A. E., Saito, M. A., Maiti, K., and Benitez-Nelson, C. R.: Cobalt, manganese, and iron near the Hawaiian Islands: A potential concentrating mechanism for cobalt within a cyclonic eddy and implications for the hybrid-type trace metals, Deep-Sea Res. Pt. II, 55, 1473–1490, https://doi.org/10.1016/j.dsr2.2008.02.010, 2008.
Noble, A. E., Moran, D. M., Allen, A. E., and Saito, M. A.: Dissolved and particulate trace metal micronutrients under the McMurdo Sound seasonal sea ice: basal sea ice communities as a capacitor for iron, Front. Chem., 1, 25, https://doi.org/10.3389/fchem.2013.00025, 2013.
Noble, A. E., Ohnemus, D. C., Hawco, N. J., Lam, P. J., and Saito, M. A.: Coastal sources, sinks and strong organic complexation of dissolved cobalt within the US North Atlantic GEOTRACES transect GA03, Biogeosciences, 14, 2715–2739, https://doi.org/10.5194/bg-14-2715-2017, 2017.
Oldham, V. E., Chmiel, R., Hansel, C. M., DiTullio, G. R., Rao, D., and Saito, M.: Inhibited manganese oxide formation hinders cobalt scavenging in the Ross Sea, Global Biogeochem. Cy., 35, e2020GB006706, https://doi.org/10.1029/2020GB006706, 2021.
Osman, D., Cooke, A., Young, T. R., Deery, E., Robinson, N. J., and Warren, M. J.: The requirement for cobalt in vitamin B12: A paradigm for protein metalation, Biochim. Biophys. Acta, 1868, 118896, https://doi.org/10.1016/j.bbamcr.2020.118896, 2021.
Peloquin, J. A. and Smith, W. O. J.: Phytoplankton blooms in the Ross Sea, Antarctica: Interannual variability in magnitude, temporal patterns, and composition, J. Geophys. Res., 112, C08013, https://doi.org/10.1029/2006JC003816, 2007.
Planquette, H., Sherrell, R. M., Stammerjohn, S., and Field, M. P.: Particulate iron delivery to the water column of the Amundsen Sea, Antarctica, Mar. Chem., 153, 15–30, https://doi.org/10.1016/j.marchem.2013.04.006, 2013.
Price, N. M., Harrison, G. I., Hering, J. G., Hudson, R. J., Pascale, M., Nirel, V., Palenik, B., and Morel, F. M. M.: Preparation and Chemistry of the Artificial Algal Culture Medium Aquil, Biol. Oceanogr., 6, 443–461, 2013.
Rao, D.: Characterizing cobalamin cycling by Antarctic marine microbes across multiple scales, Ph.D. thesis, Massachusetts Institute of Technology; the Woods Hole Oceanographic Institution, https://hdl.handle.net/1721.1/127908 (last access: 24 September 2023), 2020.
Roberts, S. B., Lane, T. W., and Morel, F. M. M.: Carbonic Anhydrase in the Marine Diatom Thalassiosira Weissflogii (Bacillariophyceae), J. Phycol., 33, 845–850, https://doi.org/10.1111/j.0022-3646.1997.00845.x, 1997.
Rodionov, D. A., Vitreschak, A. G., Mironov, A. A., and Gelfand, M. S.: Comparative genomics of the vitamin B12 metabolism and regulation in prokaryotes, J. Biol. Chem., 278, 41148–41159, https://doi.org/10.1074/jbc.M305837200, 2003.
Rose, J. M., Feng, Y., DiTullio, G. R., Dunbar, R. B., Hare, C. E., Lee, P. A., Lohan, M., Long, M., W. O. Smith Jr., Sohst, B., Tozzi, S., Zhang, Y., and Hutchins, D. A.: Synergistic effects of iron and temperature on Antarctic phytoplankton and microzooplankton assemblages, Biogeosciences, 6, 3131–3147, https://doi.org/10.5194/bg-6-3131-2009, 2009.
Saito, M. A.: Total dissolved cobalt and labile dissolved cobalt distributions measured by shipboard voltammetry in the Amundsen Sea, Ross Sea, and Terra Nova Bay during the CICLOPS expedition on RVIB Nathaniel B. Palmer (NBP1801) from Dec 2017 to Feb 2018, Biological and Chemical Oceanography Data Management Office (BCO-DMO) [data set], https://doi.org/10.26008/1912/bco-dmo.893487.1, 2023.
Saito, M. A. and DiTullio, G.: Dissolved nutrient data from RVIB Nathaniel B Palmer cruise (NBP18-01) in the Amundsen and Ross Seas from December 2017 to March 2018, Biological and Chemical Oceanography Data Management Office (BCO-DMO) [data set], https://doi.org/10.26008/1912/bco-dmo.874841.1, 2022.
Saito, M. A. and Goepfert, T. J.: Zinc-cobalt colimitation of Phaeocystis antarctica, Limnol. Oceanogr., 53, 266–275, 2008.
Saito, M. A. and Moffett, J. W.: Complexation of cobalt by natural organic ligands in the Sargasso Sea as determined by a new high-sensitivity electrochemical cobalt speciation method suitable for open ocean work, Mar. Chem., 75, 49–68, https://doi.org/10.1016/S0304-4203(01)00025-1, 2001.
Saito, M. A., Rocap, G., and Moffett, J. W.: Production of cobalt binding ligands in a Synechococcus feature at the Costa Rica upwelling dome, Limnol. Oceanogr., 50, 279–290, 2005.
Saito, M. A., Goepfert, T. J., Noble, A. E., Bertrand, E. M., Sedwick, P. N., and DiTullio, G. R.: A seasonal study of dissolved cobalt in the Ross Sea, Antarctica: micronutrient behavior, absence of scavenging, and relationships with Zn, Cd, and P, Biogeosciences, 7, 4059–4082, https://doi.org/10.5194/bg-7-4059-2010, 2010.
Saito, M. A., Noble, A. E., Hawco, N., Twining, B. S., Ohnemus, D. C., John, S. G., Lam, P., Conway, T. M., Johnson, R., Moran, D., and McIlvin, M.: The acceleration of dissolved cobalt's ecological stoichiometry due to biological uptake, remineralization, and scavenging in the Atlantic Ocean, Biogeosciences, 14, 4637–4662, https://doi.org/10.5194/bg-14-4637-2017, 2017.
Sañudo-Wilhelmy, S. A., Gobler, C. J., Okbamichael, M., and Taylor, G. T.: Regulation of phytoplankton dynamics by vitamin B12, Geophys. Res. Lett., 33, 10–13, https://doi.org/10.1029/2005GL025046, 2006.
Sedwick, P. N. and DiTullio, G. R.: Regulation of algal blooms in Antarctic shelf waters by the release of iron from melting sea ice, Geophys. Res. Lett., 24, 2515–2518, 1997.
Sedwick, P. N., DiTullio, G. R., and Mackey, D. J.: Iron and manganese in the Ross Sea, Antarctica: Seasonal iron limitation in Antarctic shelf waters, J. Geophys. Res., 105, 11321–11336, 2000.
Sedwick, P. N., Marsay, C. M., Sohst, B. M., Aguilar-Islas, A. M., Lohan, M. C., Long, M. C., Arrigo, K. R., Dunbar, R. B., Saito, M. A., Smith, W. O., and DiTullio, G. R.: Early season depletion of dissolved iron in the Ross Sea polynya: Implications for iron dynamics on the Antarctic continental shelf, J. Geophys. Res., 116, C12019, https://doi.org/10.1029/2010JC006553, 2011.
Smetacek, V., Klaas, C., Strass, V. H., Assmy, P., Montresor, M., Cisewski, B., Savoye, N., Webb, A., D'Ovidio, F., Arrieta, J. M., Bathmann, U., Bellerby, R., Berg, G. M., Croot, P., Gonzalez, S., Henjes, J., Herndl, G. J., Hoffmann, L. J., Leach, H., Losch, M., Mills, M. M., Neill, C., Peeken, I., Röttgers, R., Sachs, O., Sauter, E., Schmidt, M. M., Schwarz, J., Terbrüggen, A., and Wolf-Gladrow, D.: Deep carbon export from a Southern Ocean iron-fertilized diatom bloom, Nature, 487, 313–319, https://doi.org/10.1038/nature11229, 2012.
Smith, W. O. J. and Jones, R. M.: Vertical mixing, critical depths, and phytoplankton growth in the Ross Sea, ICES J. Mar. Sci., 72, 1952–1960, 2015.
Spackeen, J. L., Sipler, R. E., Bertrand, E. M., Xu, K., McQuaid, J. B., Walworth, N. G., Hutchins, D. A., Allen, A. E., and Bronk, D. A.: Impact of temperature, CO2, and iron on nutrient uptake by a late-season microbial community from the Ross Sea, Antarctica, Aquat. Microb. Ecol., 82, 145–159, https://doi.org/10.3354/ame01886, 2018.
St-Laurent, P., Yager, P. L., Sherrell, R. M., Stammerjohn, S. E., and Dinniman, M. S.: Pathways and supply of dissolved iron in the Amundsen Sea (Antarctica), J. Geophys. Res.-Oceans, 122, 7135–7162, https://doi.org/10.1002/2017JC013162, 2017.
Sunda, W. G.: Trace metal interactions with marine phytoplankton, Biol. Oceanogr., 6, 411–442, 1989.
Sunda, W. G.: Feedback interactions between trace metal nutrients and phytoplankton in the ocean, Front. Microbiol., 3, 204, https://doi.org/10.3389/fmicb.2012.00204, 2012.
Sunda, W. G. and Huntsman, S. A.: Regulation of cellular manganese and manganese transport in the unicellular rates alga Chlamydomonas, Limnol. Oceanogr., 30, 71–80, https://doi.org/10.4319/lo.1985.30.1.0071, 1985.
Sunda, W. G. and Huntsman, S. A.: Feedback interactions between zinc and phytoplankton in seawater, Limnol. Oceanogr., 37, 25–40, https://doi.org/10.4319/lo.1992.37.1.0025, 1992.
Sunda, W. G. and Huntsman, S. A.: Cobalt and zinc interreplacement in marine phytoplankton: Biological and geochemical implications, Limnol. Oceanogr., 40, 1404–1417, https://doi.org/10.4319/lo.1995.40.8.1404, 1995.
Sunda, W. G. and Huntsman, S. A.: Antagonisms between cadmium and zinc toxicity and manganese limitation in a coastal diatom, Limnol. Oceanogr., 41, 373–387, 1996.
Sunda, W. G. and Huntsman, S. A.: Effect of Zn, Mn, and Fe on Cd accumulation in phytoplankton: Implications for oceanic Cd cycling, Limnol. Oceanogr., 45, 1501–1516, 2000.
Taylor, G. T. and Sullivan, C. W.: Vitamin B12 and cobalt cycling among diatoms and bacteria in Antarctic sea ice microbial communities, Limnol. Oceanogr., 53, 1862–1877, 2008.
Warren, M. J., Raux, E., Schubert, H. L., and Escalante-Semerena, J. C.: The biosynthesis of adenosylcobalamin (vitamin B12), Nat. Prod. Rep., 19, 390–412, https://doi.org/10.1039/B108967F, 2002.
Westerlund, S. and Öhman, P.: Cadmium, copper, cobalt, nickel, lead, and zinc in the water column of the Weddell Sea, Antarctica, Geochim. Cosmochim. Ac., 55, 2127–2146, https://doi.org/10.1016/0016-7037(91)90092-J, 1991.
Zhu, Z., Xu, K., Fu, F., Spackeen, J. L., Bronk, D. A., and Hutchins, D. A.: A comparative study of iron and temperature interactive effects on diatoms and Phaeocystis antarctica from the Ross Sea, Antarctica, Mar. Ecol.-Prog. Ser., 550, 39–51, https://doi.org/10.3354/meps11732, 2016.
- Abstract
- Highlights
- Introduction
- Methods
- Results
- Discussion
- Conclusion
- Appendix A: Locations and hydrography of the historical Ross Sea and Terra Nova Bay stations
- Appendix B: Estimating trace metal uptake and maximum rate of dissolution profiles from classic competitive inhibition equations
- Appendix C: Description of a two-box model of the dCo cycle in coastal Antarctic seas and a potential mechanism for deep dCo loss with changing microbial uptake stoichiometry
- Data availability
- Author contributions
- Competing interests
- Disclaimer
- Acknowledgements
- Financial support
- Review statement
- References