the Creative Commons Attribution 4.0 License.
the Creative Commons Attribution 4.0 License.
 | 05 Mar 2024
Kilometre-scale simulations over Fennoscandia reveal a large loss of tundra due to climate warming
Fredrik Lagergren
Robert G. Björk
Camilla Andersson
Danijel Belušić
Mats P. Björkman
Erik Kjellström
Petter Lind
David Lindstedt
Tinja Olenius
Håkan Pleijel
Gunhild Rosqvist
Paul A. Miller
The Fennoscandian boreal and mountain regions harbour a wide range of vegetation types, from boreal forest to high alpine tundra and barren soils. The area is facing a rise in air temperature above the global average and changes in temperature and precipitation patterns. This is expected to alter the Fennoscandian vegetation composition and change the conditions for areal land use such as forestry, tourism and reindeer husbandry. In this study we used a unique high-resolution (3 km) climate scenario with considerable warming resulting from strongly increasing carbon dioxide emissions to investigate how climate change can alter the vegetation composition, biodiversity and availability of suitable reindeer forage. Using a dynamical vegetation model, including a new implementation of potential reindeer grazing, resulted in simulated vegetation maps of unprecedented high resolution for such a long time period and spatial extent. The results were evaluated at the local scale using vegetation inventories and for the whole area against satellite-based vegetation maps. A deeper analysis of vegetation shifts related to statistics of threatened species was performed in six “hotspot” areas containing records of rare and threatened species. In this high-emission scenario, the simulations show dramatic shifts in the vegetation composition, accelerating at the end of the century. Alarmingly, the results suggest the southern mountain alpine region in Sweden will be completely covered by forests at the end of the 21st century, making preservation of many rare and threatened species impossible. In the northern alpine regions, most vegetation types will persist but shift to higher elevations with reduced areal extent, endangering vulnerable species. Simulated potential for reindeer grazing indicates latitudinal differences, with higher potential in the south in the current climate. In the future these differences will diminish, as the potentials will increase in the north, especially for the summer grazing grounds. These combined results suggest significant shifts in vegetation composition over the present century for this scenario, with large implications for nature conservation, reindeer husbandry and forestry.
- Article
(12004 KB) - Full-text XML
-
Supplement
(4058 KB) - BibTeX
- EndNote


High-latitude regions harbour vast areas of relatively intact ecosystems, harbouring species of great ecological and societal significance (Dobrowski et al., 2021). These northern ecosystems are predicted to be more vulnerable to climate change than most other terrestrial biomes (Hickler et al., 2012; IPCC, 2014). For each degree of global average temperature increase, the observed increase in Fennoscandia has been estimated to be 2–3° (Rantanen et al., 2022), and this relationship persists in future predictions (Ono et al., 2022). This temperature increase has strongly affected northern ecosystems, resulting in changing vegetation patterns in the Arctic (Elmendorf et al., 2012; Pearson et al., 2013), an overall taller plant community (Bjorkman et al., 2018) and increases in biomass (Hudson and Henry, 2009). The occurrence and distribution of shrubs have also been observed to increase, both in high-latitude and high-altitude regions, as a result of the warmer climate (Elmendorf et al., 2012; Myers-Smith et al., 2011; Sturm et al., 2001). The distance species have to migrate to keep up with climate change is, however, shorter in alpine and oroarctic regions than in flat boreal and arctic landscapes (Feeley et al., 2011). As the boreal forest covers a wide area, its species composition and ability to provide ecosystem services could undergo large shifts, e.g. as a response to different disturbance patterns and hydrology changes (Venäläinen et al., 2020), even if its geographical extent is not changed. Consequences of future shifts in areal extent of vegetation zones, which may not be proportional to their current distributions, include reduced space of many habitats (Pauli and Halloy, 2019) and increased pressure on many species (Kuuluvainen and Gauthier, 2018).
In Fennoscandia, the herding of semi-domesticated reindeer is important for shaping this landscape, a practice which utilizes the land from the coastal areas and the boreal forest in winter up to the tundra in summer (Käyhkö and Horstkotte, 2017). Reindeer grazing directly affects the vegetation composition and diversity, both in the mountains (Olofsson et al., 2001; Sundqvist et al., 2019; Vowles et al., 2017) and forested regions (Kumpula et al., 2014). In summer, reindeer have a mixed diet of shrub leaves, forbs, herbs, sedges, grass and fungal fruit bodies, and reindeer forage has been shown to reduce deciduous shrub expansion (e.g. Olofsson et al., 2001, 2009; Sundqvist et al., 2019; Vowles et al., 2017). In winter, reindeer mainly eat ground and tree lichens, which decreases ground lichen cover (Kumpula et al., 2014). However, reindeer husbandry is currently experiencing increased pressure from human activities, such as forestry practices and tourism (Fohringer et al., 2021; Kumpula et al., 2014; Sandström et al., 2016), affecting 85 % of the herding area (Stoessel et al., 2022). In addition, there are implications resulting from climate change, such as difficult snow conditions making winter forage hard (Rasmus et al., 2022; Rosqvist et al., 2021) and hot dry summers increasing heat stress (Käyhkö and Horstkotte, 2017). Climate change is increasing the pressure on both ecosystems and societies in these areas, a pressure that will increase in coming decades (Constable et al., 2022). Reindeer grazing and browsing can to some degree hold back the rate of treeline advancement and tundra shrubification (Stark et al., 2023) but will not completely stop it. A future less open landscape will have a large impact on how reindeer graze and dwell in the landscape and on the Sami culture (Stark et al., 2023), but how that might affect the size of a sustainable reindeer population is hard to predict.
Projections of future impacts of climate change in high-latitude ecosystems can be made upon the implementation of understanding arising from empirical studies (e.g. Bjorkman et al., 2020; Myers-Smith et al., 2011) and remote sensing (e.g. Callaghan et al., 2022) into models such as dynamical vegetation models (DVMs) using climate model data as input. The typical cell size of a regional climate model (of the order of 10–50 km) often contains land surface types ranging from forest to bare rock or glaciers in mountainous areas. This information does not capture all local variation, especially in areas of complex terrain where altitudinal differences can be strongly underestimated (Lind et al., 2020). Also, while representing most meteorological processes, some are only crudely implemented at such relatively coarse resolution in modelling studies (Lind et al., 2020). In recent years, one of these DVMs, LPJ-GUESS, has been adapted to the boreal and arctic regions (Miller and Smith, 2012; Wolf et al., 2008; Yu et al., 2017) and used with very highly resolved climate data (e.g. 50 × 50 m) at a local scale in sub-arctic Scandinavia (Gustafson et al., 2021; Tang et al., 2015). So far, however, no high-resolution (<10 km) study of environmental change and its impact on vegetation covering the entire Fennoscandian boreal and oroarctic region has been conducted.
Recently the first ever climate model projections at 3 km grid spacing were completed for the entire Fennoscandian region (Lind et al., 2020, 2023). Results from such kilometre-scale simulations (1–4 km compared to previous coarser resolution >10 km) offer an unprecedented insight into weather and climate processes at high resolution, which is particularly important in complex terrain. In addition, it is important to understand how this improved weather and climate insights might affect vegetation dynamics and for that a DVM is needed. Thus, we here use these unique kilometre-scale climate model projections for the high-emission RCP8.5 scenario (Lind et al., 2023) and the state-of-the-art DVM, LPJ-GUESS (Lindeskog et al., 2021; Smith et al., 2001, 2014), including a new module of reindeer grazing, to investigate the vegetation response to climate and environmental change in the Fennoscandian boreal and mountain regions used for reindeer herding. The results are validated against satellite products and field data gathered in the study region. Furthermore, we use consistent, high-resolution climate and nitrogen deposition scenarios to evaluate potential future vegetation changes in the region, with a special emphasis on reindeer food supply and vegetation trends in “hotspot” areas with high biodiversity and conservation values. Since the only available climate projection at this resolution is a high-emission scenario, the simulated state at the end of the century will provide a message to society of what to expect and plan for if emissions continue to increase. We hypothesize that this state will show extensive changes that will present challenges for forestry, reindeer herding, tourism and nature conservation, as the temperature increase is high in such a scenario.
2.1 Study area
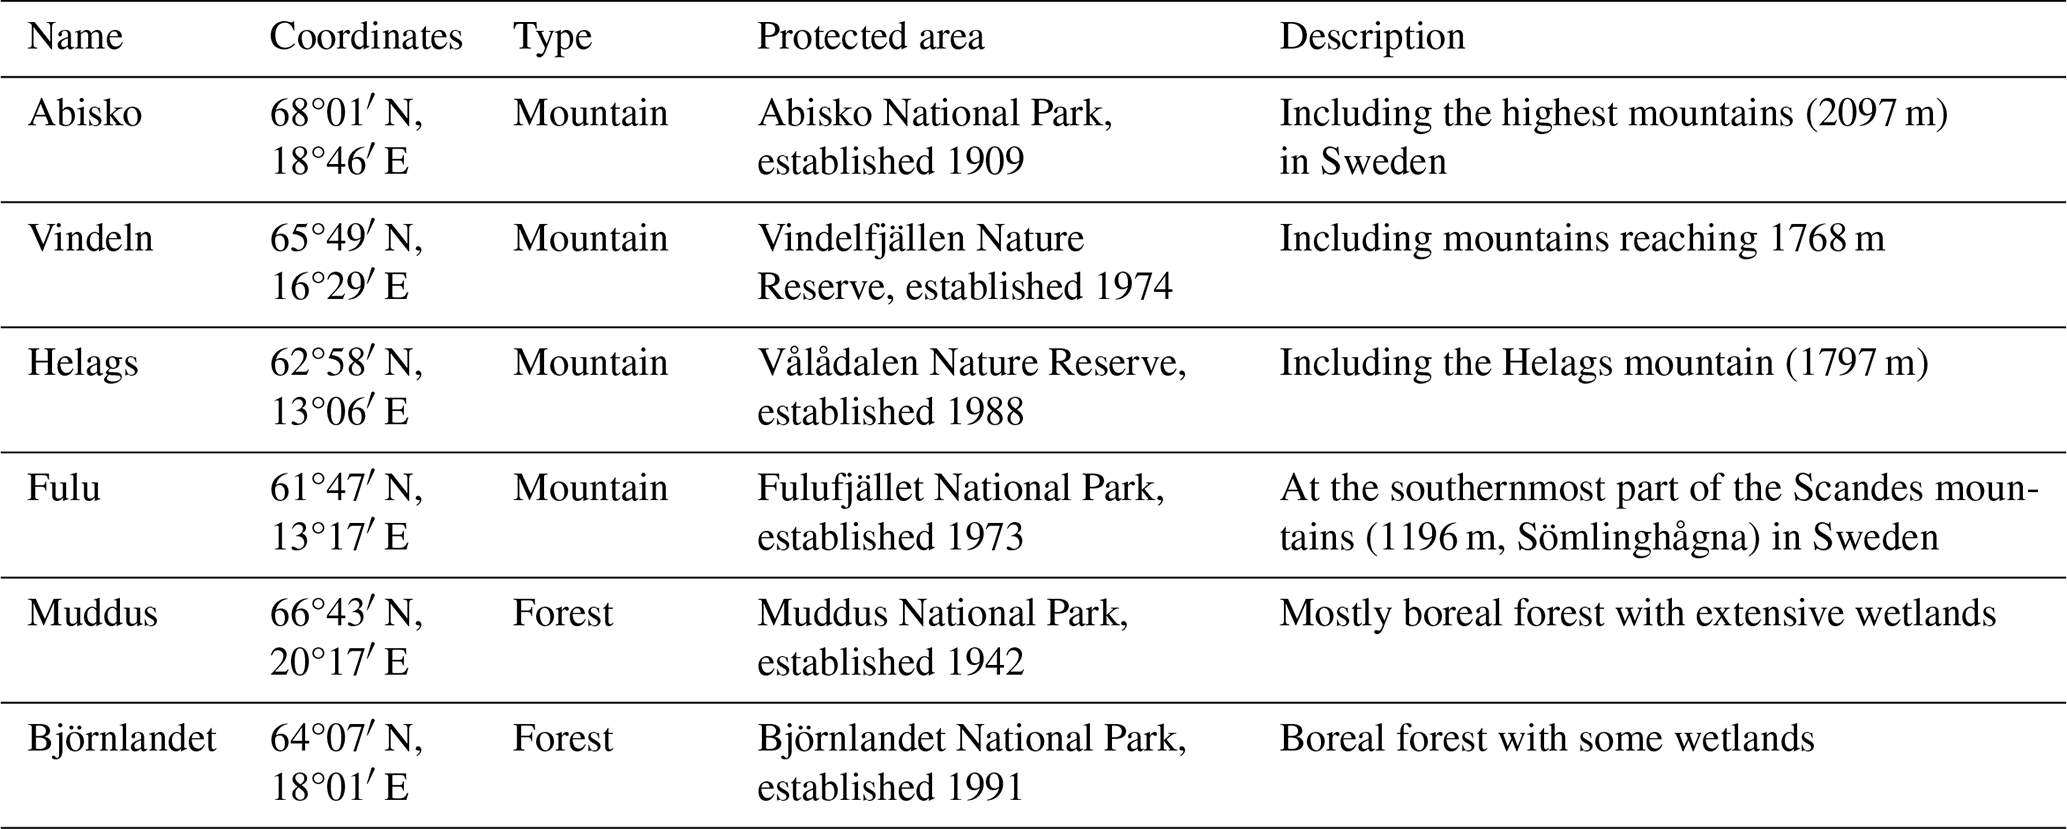
The study was restricted to the Fennoscandian mountain range and the adjacent boreal areas used for reindeer herding (Fig. 1), with a focus on ecosystems in Sweden. This region is located between 58 and 71° N, spanning altitudes from sea level to 2469 m a.s.l. (Galdhøpiggen, Norway), and is characterized by continental to sub-oceanic climate (Oksanen and Virtanen, 1995). Boreal forest dominates from the coast towards the mountains up to latitude 68–69° N. Above the boreal forest there is a zone of mountain birch forest which normally has a vertical distribution of ca. 200 m. The treeline, formed by mountain birch, is in Sweden at an altitude of more than 1100 m in the south and decreases with latitude to 600 m in the north (Kullman, 2016). Above the treeline follows tundra with decreasing levels of vegetation height and coverage (from shrub to barren tundra) and finally bare rocks and snowfields. For a more detailed assessment of simulated changes, six hotspot areas (90 × 90 km) in the larger domain were selected to represent different vegetation zones with a high species richness and large conservation values, from the boreal forest to the high alpine tundra, and covering the entire Swedish mountain range (Table 1, Fig. 1, Fig. S1 in the Supplement).
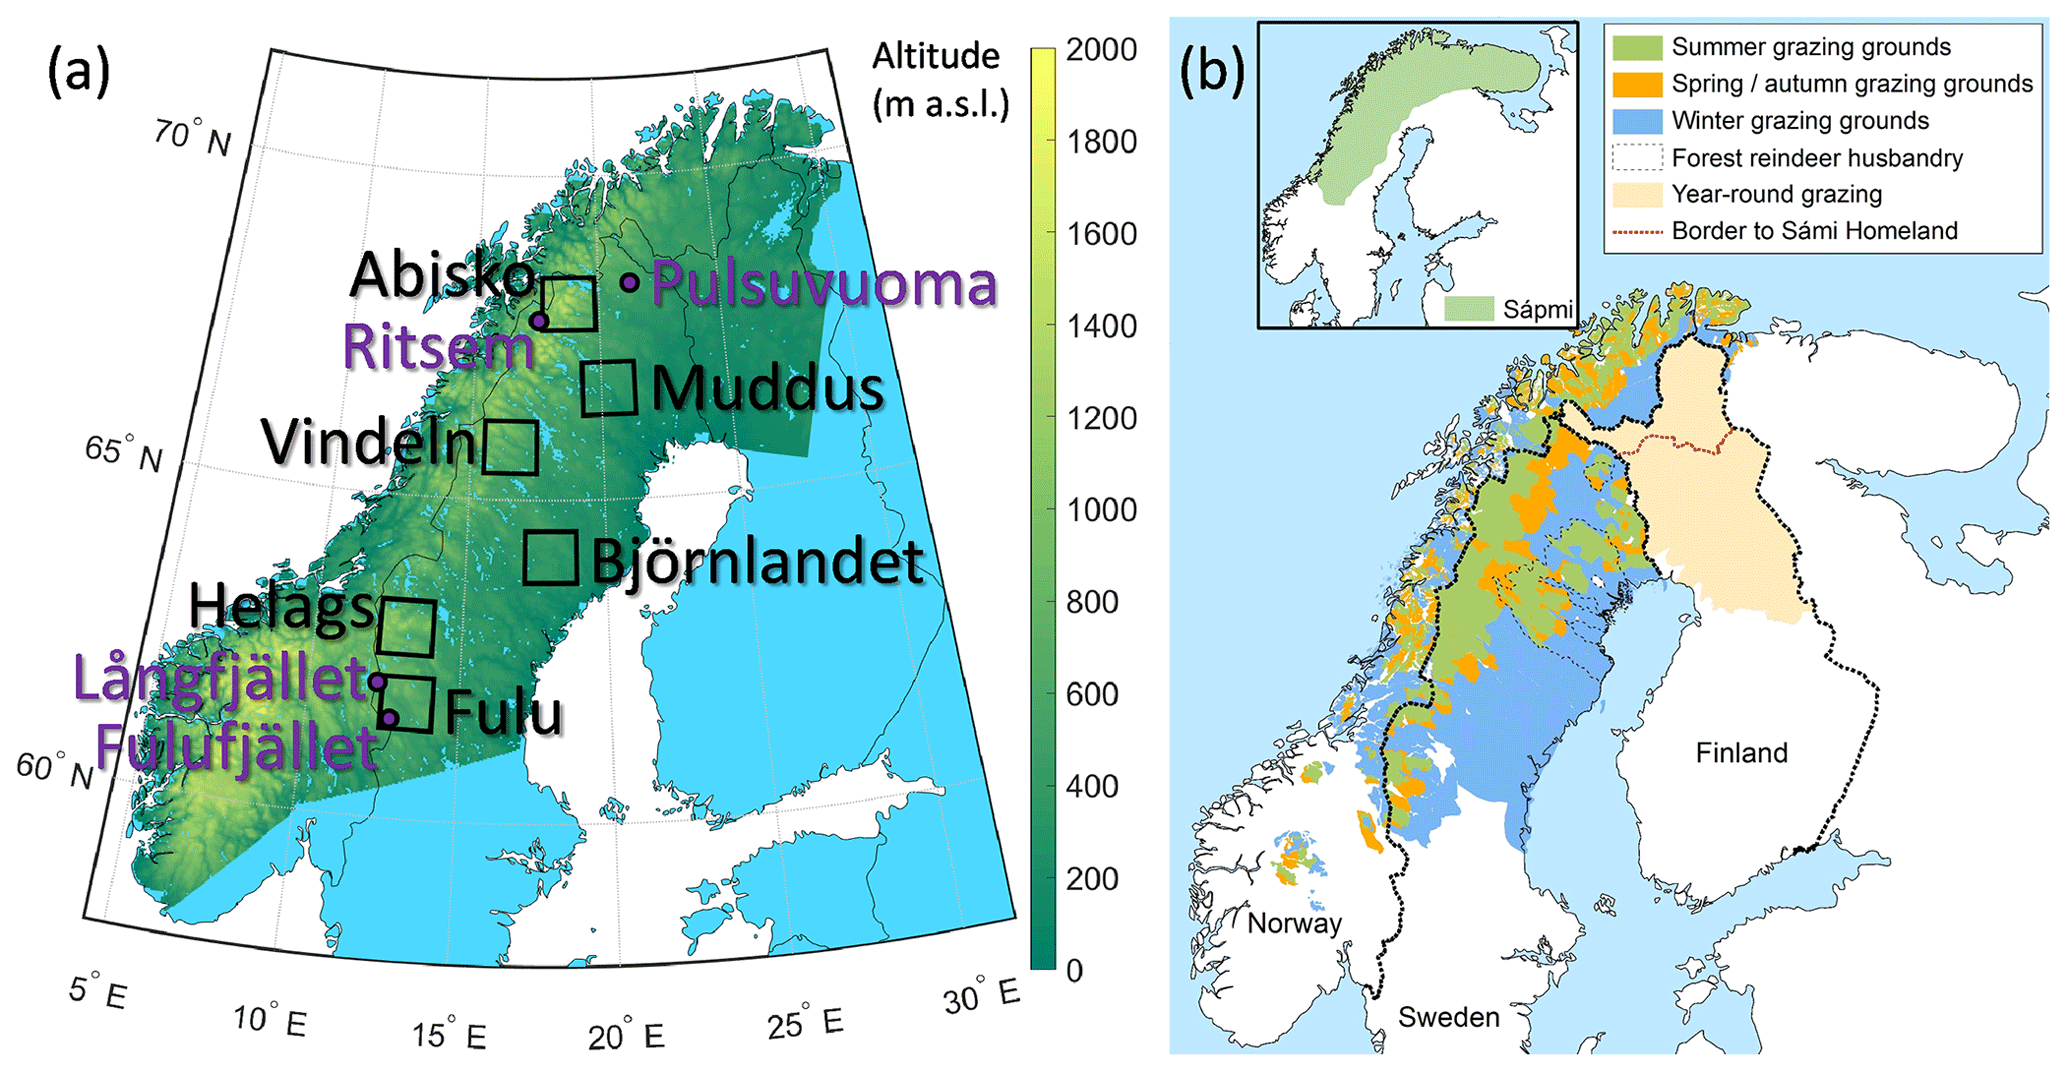
Figure 1(a) The study area (shown as altitude), the six focus hotspot areas (squares and black text; see Fig. S1 for detailed maps) and the four grazing exclosure sites (purple dots and text). (b) Map of grazing areas used for the semi-domesticated reindeer during different seasons in Norway, Sweden and Finland (from Käyhkö and Horstkotte, 2017, used with permission).
Table 1Description of the six hotspots. Maps of the areas are shown in Fig. S1.
2.2 Dynamical vegetation and ecosystem model
The dynamical vegetation and ecosystem model LPJ-GUESS (v4.1, Nord et al., 2021) was used to simulate vegetation change in the region. Detailed descriptions of the development stages involve the first version (Smith et al., 2001), arctic development (Miller and Smith, 2012; Wolf et al., 2008), N cycle (Smith et al., 2014), land cover (Lindeskog et al., 2021) and further arctic implementations (Gustafson et al., 2021). The model simulates the development of cohorts, belonging to different plant functional types (PFTs), when competing for light, nitrogen and water in replicate patches (here set to 15 patches per simulated climate grid cell). Each patch represents an area of ca. 1000 m2. The model includes detailed process descriptions related to the cycling of water (e.g. transpiration, evaporation, and snow and soil water dynamics), carbon (e.g. photosynthesis, respiration, fire and allocation of biomass) and nitrogen (e.g. nitrification and restriction of photosynthesis) and is driven by temperature, radiation, relative humidity, wind speed, CO2 concentration and nitrogen deposition data. The processes are calculated at the cohort level except for those that take place in the soil. The PFTs are described by parameters related to growth form (tree, shrub or herbaceous), allocation, allometry, phenology, life history, shade tolerance, and response to environmental and bioclimatic conditions. Patch-destroying disturbances representing e.g. devastating pests or wind storms occur randomly in each patch (the default v4.1 return time of 150 years was used in the presented simulations). Separately, fire disturbance simulated with the BLAZE module (Molinari et al., 2021) was applied. A simulation starts after a spin-up period (set to 600 years) over which a detrended dataset comprising the first 30 years of historical climate data is repeated to attain a balance between the vegetation and the climate.
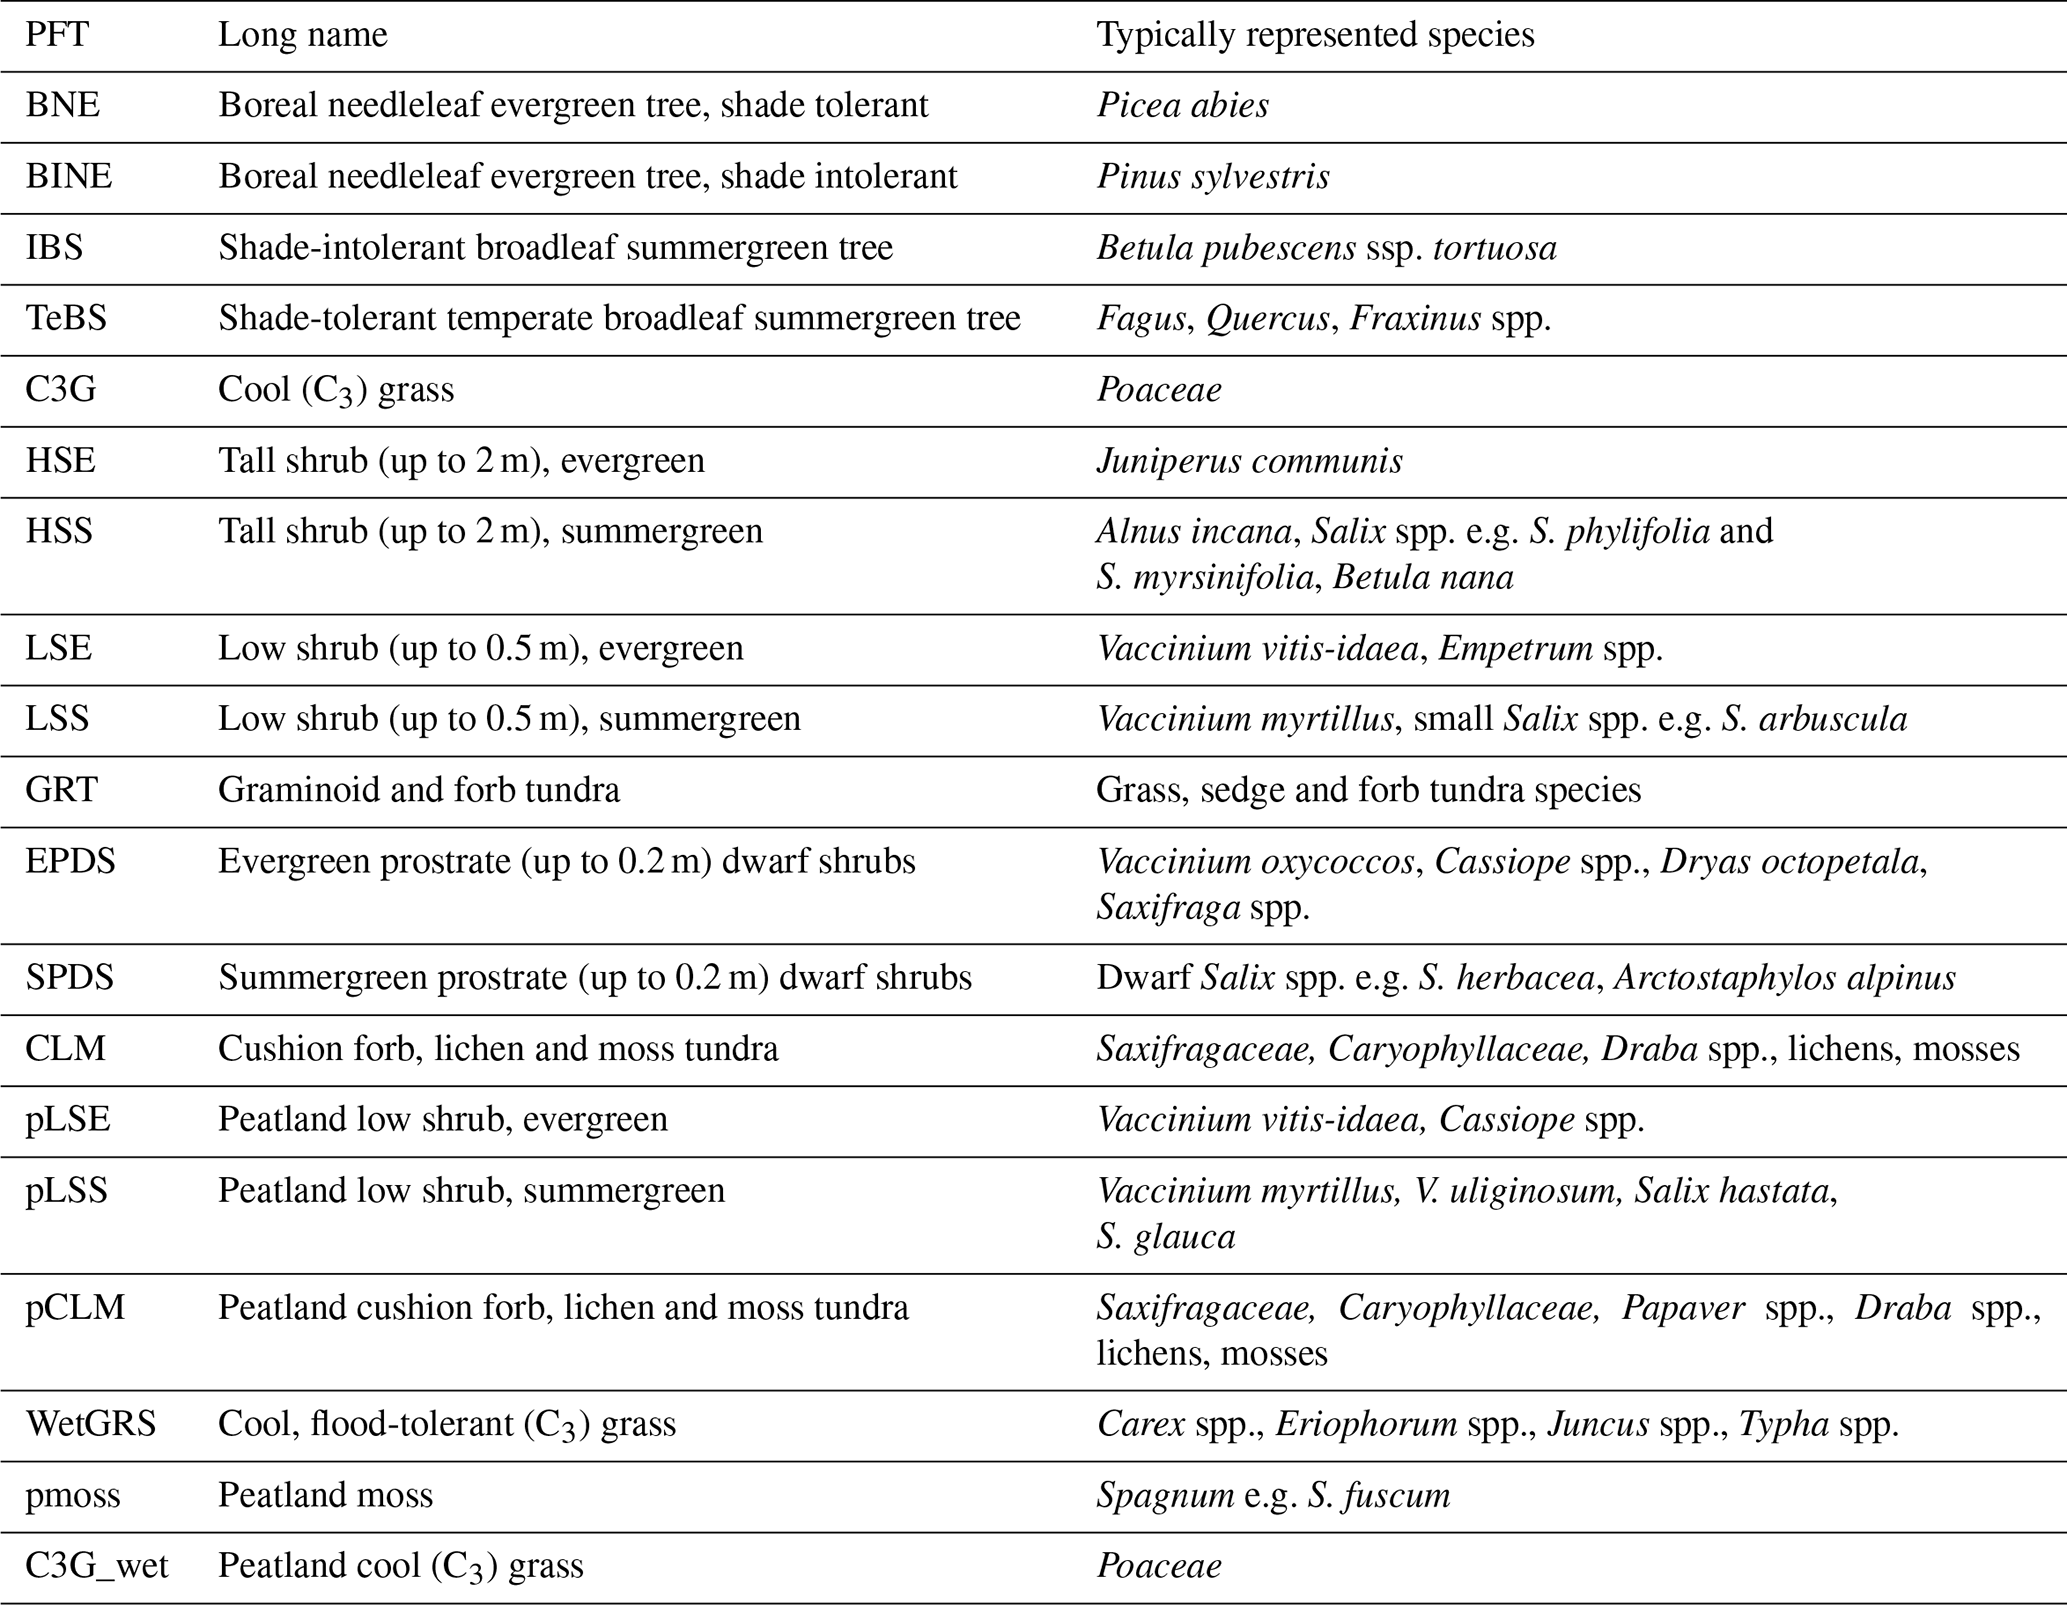
2.2.1 Plant functional types
In the present study, an expanded set of PFTs were used, which includes high-latitude PFTs such as shrubs, with separate sets for mineral and wetland soils (Table 2). In each grid cell, the simulations on mineral and wetland soils are independent of each other. For fractions of land classified as peatland, we use a version of the model with peatland integration (Wania et al., 2009a, b), which includes a wetland hydrology module and wetland PFTs (Miller and Smith, 2012; Wolf et al., 2008; Zhang et al., 2013). The fractions of mineral soil and wetland were prescribed and constant over the simulation period based on the PEATMAP product at a 0.125° (14 km in S–N direction and 5–7 km in W–E direction depending on latitude within the assessed area) resolution (Xu et al., 2018). Weighted averages of model results were calculated based on these fractions. For the shade-intolerant broadleaf summergreen tree (IBS) PFT, some parameters were changed according to Gustafson et al. (2021) in an application for Abisko, Sweden. Their revision was made to reflect the fact that this global PFT in Fennoscandia mainly represents mountain birch (Betula pubescens ssp. tortuosa). Details of the IBS parameterization can be found in Sect. S2 in the Supplement.
Table 2Plant functional types in the LPJ-GUESS simulations. The last six PFTs were used for the wetland simulation and the rest for mineral soils.
2.2.2 Reindeer grazing, browsing and trampling
To simulate the effect of reindeer grazing, browsing and trampling, a new module was added to the model. Grazing/browsing was simulated by removing a fraction of leaf biomass. The model only includes stem and leaf as above-ground compartments. We note however that browsing reindeer also consume tops, twigs and branch biomass, which means that we may underestimate the effect on vegetation, but to keep the model uncomplicated this simplification was applied. Trampling was simulated by killing a fraction of the individuals in a cohort or, in the case of herbaceous PFTs, a fraction of total biomass. The grazing/browsing and trampling levels were based on a constant intensity of herbivory. For a specific PFT, the grazing/browsing was determined by a preference value obtained from extensive observations of the feeding preferences of semi-domesticated reindeer in Canada (Denryter et al., 2017) and if the cohort's canopy height was within reach of reindeer. The sensitivity to trampling was based on the vegetation response in an artificial trampling experiment (Egelkraut et al., 2020). All the consumed carbon in the leaves was treated as harvested but only a fraction of the leaf nitrogen was. The other fraction of the consumed N was added to the cohort's leaf N pool, which reflects the assumption that N leaving the herbivore as urine is rapidly taken up by the plants (Barthelemy et al., 2018). A detailed description of the module and its parameter values is given in Sect. S3. From this module, the resulting output of consumed C biomass was used as an indicator of potential reindeer food consumption. In the presented simulations, the simulated grazing, browsing and trampling in a patch were set to have a return time of 3 years (see Sect. S3 for a motivation), a grazing intensity of 0.1 (fraction per year), a max height of 2.5 m and 35 % of browsed nitrogen (Ferraro et al., 2022; McEwan and Whitehead, 1970) removed from the harvest pool.
2.3 Model input data: climate
The regional climate modelling system HCLIM38 (Belušiæ et al., 2020) was used for downscaling the RCP8.5 scenario simulation from the global climate model EC-Earth (Hazeleger et al., 2010, 2012). The climate scenario was first downscaled to 12 km with HCLIM38–ALADIN (Belušiæ et al., 2020) for the 1985–2100 period and then further to 3 km with HCLIM38–AROME (Belušiæ et al., 2020) for the 1985–2005, 2040–2060 and 2080–2100 periods (Lind et al., 2020, 2023). For computational reasons we wanted to restrict the size of the complete 1985–2100 NetCDF climate files to less than 32 GB per climate variable. Therefore, we made adjustments to the original data, reducing it at the southern, northern and western limits of mainland Norway as well as at an eastern border through the north of Finland (Fig. 1a).
The year 1985 in the ALADIN 12 km data and the years 1985, 2040 and 2080 in the AROME 3 km data were spin-up years. To test the robustness of the results, all climate variables used by the vegetation model were also compiled without using the HCLIM spin-up years and tested on a subset of 200 random grid cells. As there were no significant differences in the results, we present results based on climate data, including the HCLIM spin-up years.
To fill the periods when only ALADIN data were available, we first produced datasets such that the four AROME grid cells coinciding with a certain ALADIN grid cell were filled with data from that ALADIN grid cell (termed ALAatARO, 1985–2100). The periods with missing 3 km AROME data were filled with the ALAatARO data using two methods.
For precipitation, global radiation, relative humidity and wind speed, linear regressions through the origin for the overlapping periods between AROME and ALAatARO data were used. The relations were fitted separately by month, and, specifically, data from 1985–2005 and 2040–2060 were used to establish the relationships for the 2006–2039 period and 2040–2060 and 2080–2100 for the 2061–2079 period. The relationships were then used to obtain 3 km data for the missing periods from ALAatARO data.
For daily, minimum and maximum temperatures a non-parametric empirical quantile mapping (QUANT) bias correction method (e.g. Osuch et al., 2017) was applied by month using daily temperature data for 21-year periods. Two reference periods were used with observed 1 × 1 km data from the Nordic Gridded Climate Dataset (NGCD; https://surfobs.climate.copernicus.eu/dataaccess/access_ngcd.php, last access: 26 February 2024) that were aggregated to the AROME grid, 1985–2005 (used for AROME grid data) and 1998–2018 (used for ALAatARO grid data). In the quantile mapping, intervals of 1 % were applied and a smoothing was done using a running mean over five intervals. Modelled and matching observed values were linearly interpolated between the intervals. For consistency, all calculations of quantiles were done for 21-year periods, resulting in an overlapping period (1998–2005) for which the AROME data were used. For the future, the difference between the observed and scenario quantiles during the reference period was added to the matching quantile of future 21-year periods. The future periods were 2040–2060 and 2080–2100 for the AROME data and 2019–2039 and 2060–2080 (2060 and 2080 were not used) for the ALAatARO data.
The RCP8.5 scenario used was the first dataset produced at this high resolution for the entire region. It is a scenario with strongly increasing emissions of greenhouse gases, but the projection up to the mid-century is similar to lower-emission scenarios (Meinshausen et al., 2011). In the resultant daily air temperature data, the climate-change signal was a 1.0–2.3 K increase in mean annual temperature from the 1991–2020 to the 2031–2060 periods of 30 years and a 2.5–5.2 K increase from 1991–2020 to 2071–2100 (Fig. S4a–b). For annual precipitation the relative change was −2.3 % to 23.1 % for 2031–2060 and −0.9 % to 50.1 % for 2071–2100 (Fig. S4c–d).
2.4 Model input data: soil texture, atmospheric nitrogen deposition and CO2
Soil texture data (clay and sand fraction) at 3 km resolution were taken from SURFEX (Masson et al., 2013), the land surface model of AROME, ensuring consistency with LPJ-GUESS. These data originate from FAO soil texture data at 0.0833° (9 km in the S–N direction and 3–5 km in W–E) resolution (https://data.apps.fao.org/map/catalog/static/search?keyword=DSMW, last access: 26 February 2024).
Nitrogen deposition at monthly temporal resolution was used as input to LPJ-GUESS. The input was based on two model simulations (MATCH-BIODIV and MATCH-ECLAIRE) with the Multi-scale Atmospheric Transport and Chemistry (MATCH; Andersson et al., 2015, 2007; Robertson et al., 1999) model. MATCH-BIODIV (Andersson et al., 2024; Eichler et al., 2023) was forced by the climate simulation ALADIN at 12 km and anthropogenic air pollution emissions from ECLIPSE V6b (Höglund-Isaksson et al., 2020). This dataset (https://previous.iiasa.ac.at/web/home/research/researchPrograms/air/ECLIPSEv6b.html, last access: February 2020) has a resolution of 12 km and covers the 1987–2051 period. MATCH-ECLAIRE (Engardt et al., 2017) was constructed at 50 km resolution for 1900–2050, based on current climate and varying anthropogenic air pollutant emissions (ECLIPSE V4a, Lamarque et al., 2010).
MATCH-ECLAIRE was used to obtain 12 km resolution nitrogen deposition fields for the 1900–1986 time period. This was done by establishing a linear relationship through zero for the overlapping period for each MATCH-BIODIV and MATCH-ECLAIRE grid cell and subsequently applying it to downscale the 50 km data for the 1900–1986 period. After 2051, the 0.5° (56 km in S–N and 18–29 km in W–E) resolution Lamarque et al. (2011) dataset was used, which is standard for LPJ-GUESS. A sensitivity test for a selection of grid cells showed very minor differences when comparing modelling results for simulations using the different resolution of N deposition data (results not shown), from which we concluded that this simplification was justified.
The future trend in nitrogen deposition is similar for MATCH-BIODIV and MATCH-ECLAIRE, i.e. declining until mid-century. The modelled total deposition in the Scandinavian mountain area is dominated by oxidized nitrogen, which exhibits a clear decline, while reduced nitrogen deposition levels off at around 2020 and after that even increases slightly for MATCH-BIODIV. These datasets have been evaluated against reanalysis data consisting of fused observations and modelled estimates (Andersson et al., 2024) for years where all datasets were overlapping (1987–2013) for high-altitude areas of the Scandinavian mountains. The comparison shows a positive bias in the quantitative modelled total nitrogen deposition of 18 % and 23 % for the 1987–2013 period, with a stronger positive bias in oxidized nitrogen deposition and a partly balancing negative bias in reduced nitrogen. The trend is similar between the modelled and the reanalysed datasets over the period.
Historical and RCP8.5 CO2 concentration data were the same as those used by EC-Earth and HCLIM38, reaching atmospheric concentrations of 540.5 and 935.9 ppm in 2050 and 2100, respectively (IPCC, 2013).
2.5 Model output validation and analysis
The output data from LPJ-GUESS are given as yearly states or sums of fluxes averaged over the 15 simulated patches. The data were further averaged over 10-year periods to reduce fluctuations arising from interannual weather variability and random disturbances.
2.5.1 Validation
The simulated total leaf-area index (LAI) was compared to the yearly maximum of the monthly SURFEX LAI product (Masson et al., 2013), taken from ECOCLIMAP2.2 based on MODIS at 1 km resolution in 2000 (Faroux et al., 2013). Further, modelled LAIs for the specific PFTs within a grid cell were used to determine vegetation class for comparison to two remote-sensing-based vegetation products: the land cover of northern Eurasia (GLCE) based on SPOT 4 at 1 km resolution (Bartalev et al., 2003) and the CLC2018 land cover dataset (Corine) based on Sentinel 2 at 100 m resolution (https://doi.org/10.2909/960998c1-1870-4e82-8051-6485205ebbac, Copernicus, 2019). The conversions (described in detail in Sect. S5) were based on Bartalev et al. (2003) and Kosztra et al. (2019) for GLCE and Corine, respectively. The satellite-based products were aggregated to the 3 km AROME grid cells, based on the dominant class, to enable a statistical analysis of the agreement by means of confusion matrixes (e.g. Congalton, 1991), with the satellite products used as ground truth. Three measures of accuracy were calculated. Producer accuracy (PA; the probability that a value in a given class was classified correctly, i.e. correctly predicted grid cells of a class total number of ground truth grid cells in that class) and user accuracy (UA; the probability that a value predicted to be in a certain class really is in that class, i.e. correctly predicted grid cells of a class total number of grid cells predicted to be in the class) were calculated for each vegetation class, as well as the overall accuracy (sum of all correctly classified grid cells for all classes total number of grid cells).
The model output was also evaluated against ground-based data for biomass (trees and shrubs) and vegetation coverage (field layer) using data collected in 2011–2012 from four long-term exclosure experiments in Pulsuvuoma, Ritsem, Långfjället and Fulufjället (for Ritsem only field-layer coverage), all established in 1995 (Fig. 1a) (Eriksson et al., 2007; Vowles et al., 2017). At each site and for each vegetation type (birch forest or shrub heath) there were three fenced exclosure plots and three ambient plots of a 25 × 25 m dimension. For the grid cells corresponding to these experiments, the model was run both with (a) continuous grazing and (b) grazing stopped after 1995. To convert model-simulated total biomass C to dry mass, a factor of 2.0 was used (Thomas and Martin, 2012), and to convert modelled total biomass to above-ground biomass, we assumed a factor of 0.85 based on earlier estimates for Swedish birch forest (between 0.79 and 0.92, Johansson, 2007). For seedlings, Huttunen et al. (2013) reported values of about 0.6 increasing to 0.7 with fertilization and elevated temperature, but seedlings in general have a lower above-ground fraction (Qi et al., 2019). The vegetation cover data of the shrub and field layer, visually estimated at species level, were aggregated to the LPJ-GUESS PFTs and compared to simulated LAI for two to three close grid cells with similar altitude. Although the comparison of fractional plant cover and LAI is not strictly direct, the two measures are closely related (George et al., 2021).
2.5.2 Analysis
Due to the more detailed adapted vegetation zones for boreal and arctic conditions in the GLCE classification, compared to Corine, the future trends presented in the results below focus only on the GLCE data.
To assess the simulated vegetation diversity, the Shannon (1948) diversity index (D) was calculated for each of the six hotspots (Fig. 1), letting the number of grid cells of different vegetation classes represent diversity:
where p is the fraction of the total number of classified grid cells in the hotspot (excluding prescribed water and wetland cells) belonging to class i. Only one vegetation class present would give a D of 0, and 10 classes with the same p would give a value of 2.3.
The simulated potential reindeer consumption of leaf carbon was aggregated to reindeer-herding communities in Sweden for traditional seasonal grazing grounds (Fig. 1b), with the help of GIS data obtained from the Swedish Sami Parliament (http://www.sametinget.se, last access: 26 February 2024).
2.6 Biodiversity data
To investigate the sensitivity of the hotspot sites to change, species observations of all available species groups, together with threatened and red-listed species, were extracted for each hotspot area using a GeoJSON file in the Artdatabanken Species Observation System (https://artportalen.se/, data retrieved: 29 October 2021). Further, to identify species being classified as alpine, the database artfakta (https://artfakta.se/artinformation/lists, last access: 26 February 2024) was used with the selection criterion “landscape type” set to “mountainous”.
3.1 Validation
3.1.1 Validation of simulated vegetation against satellite-based products
Simulated LAI was substantially lower than in the satellite-based SURFEX product but had a reasonable agreement (Fig. 2a–b, LAISimulated = 0.78 × LAISURFEX − 1.99, r2=0.59). A reason for the low simulated values compared to the reference could be that the yearly maximum of the SURFEX data was used, which can cause an overestimation if there are errors in the monthly data. Another aspect is that LAI is defined as one sided for SURFEX and projected in LPJ-GUESS, which corresponds to a factor of about 1.35 for needleleaf canopies (Flower-Ellis and Olsson, 1993).
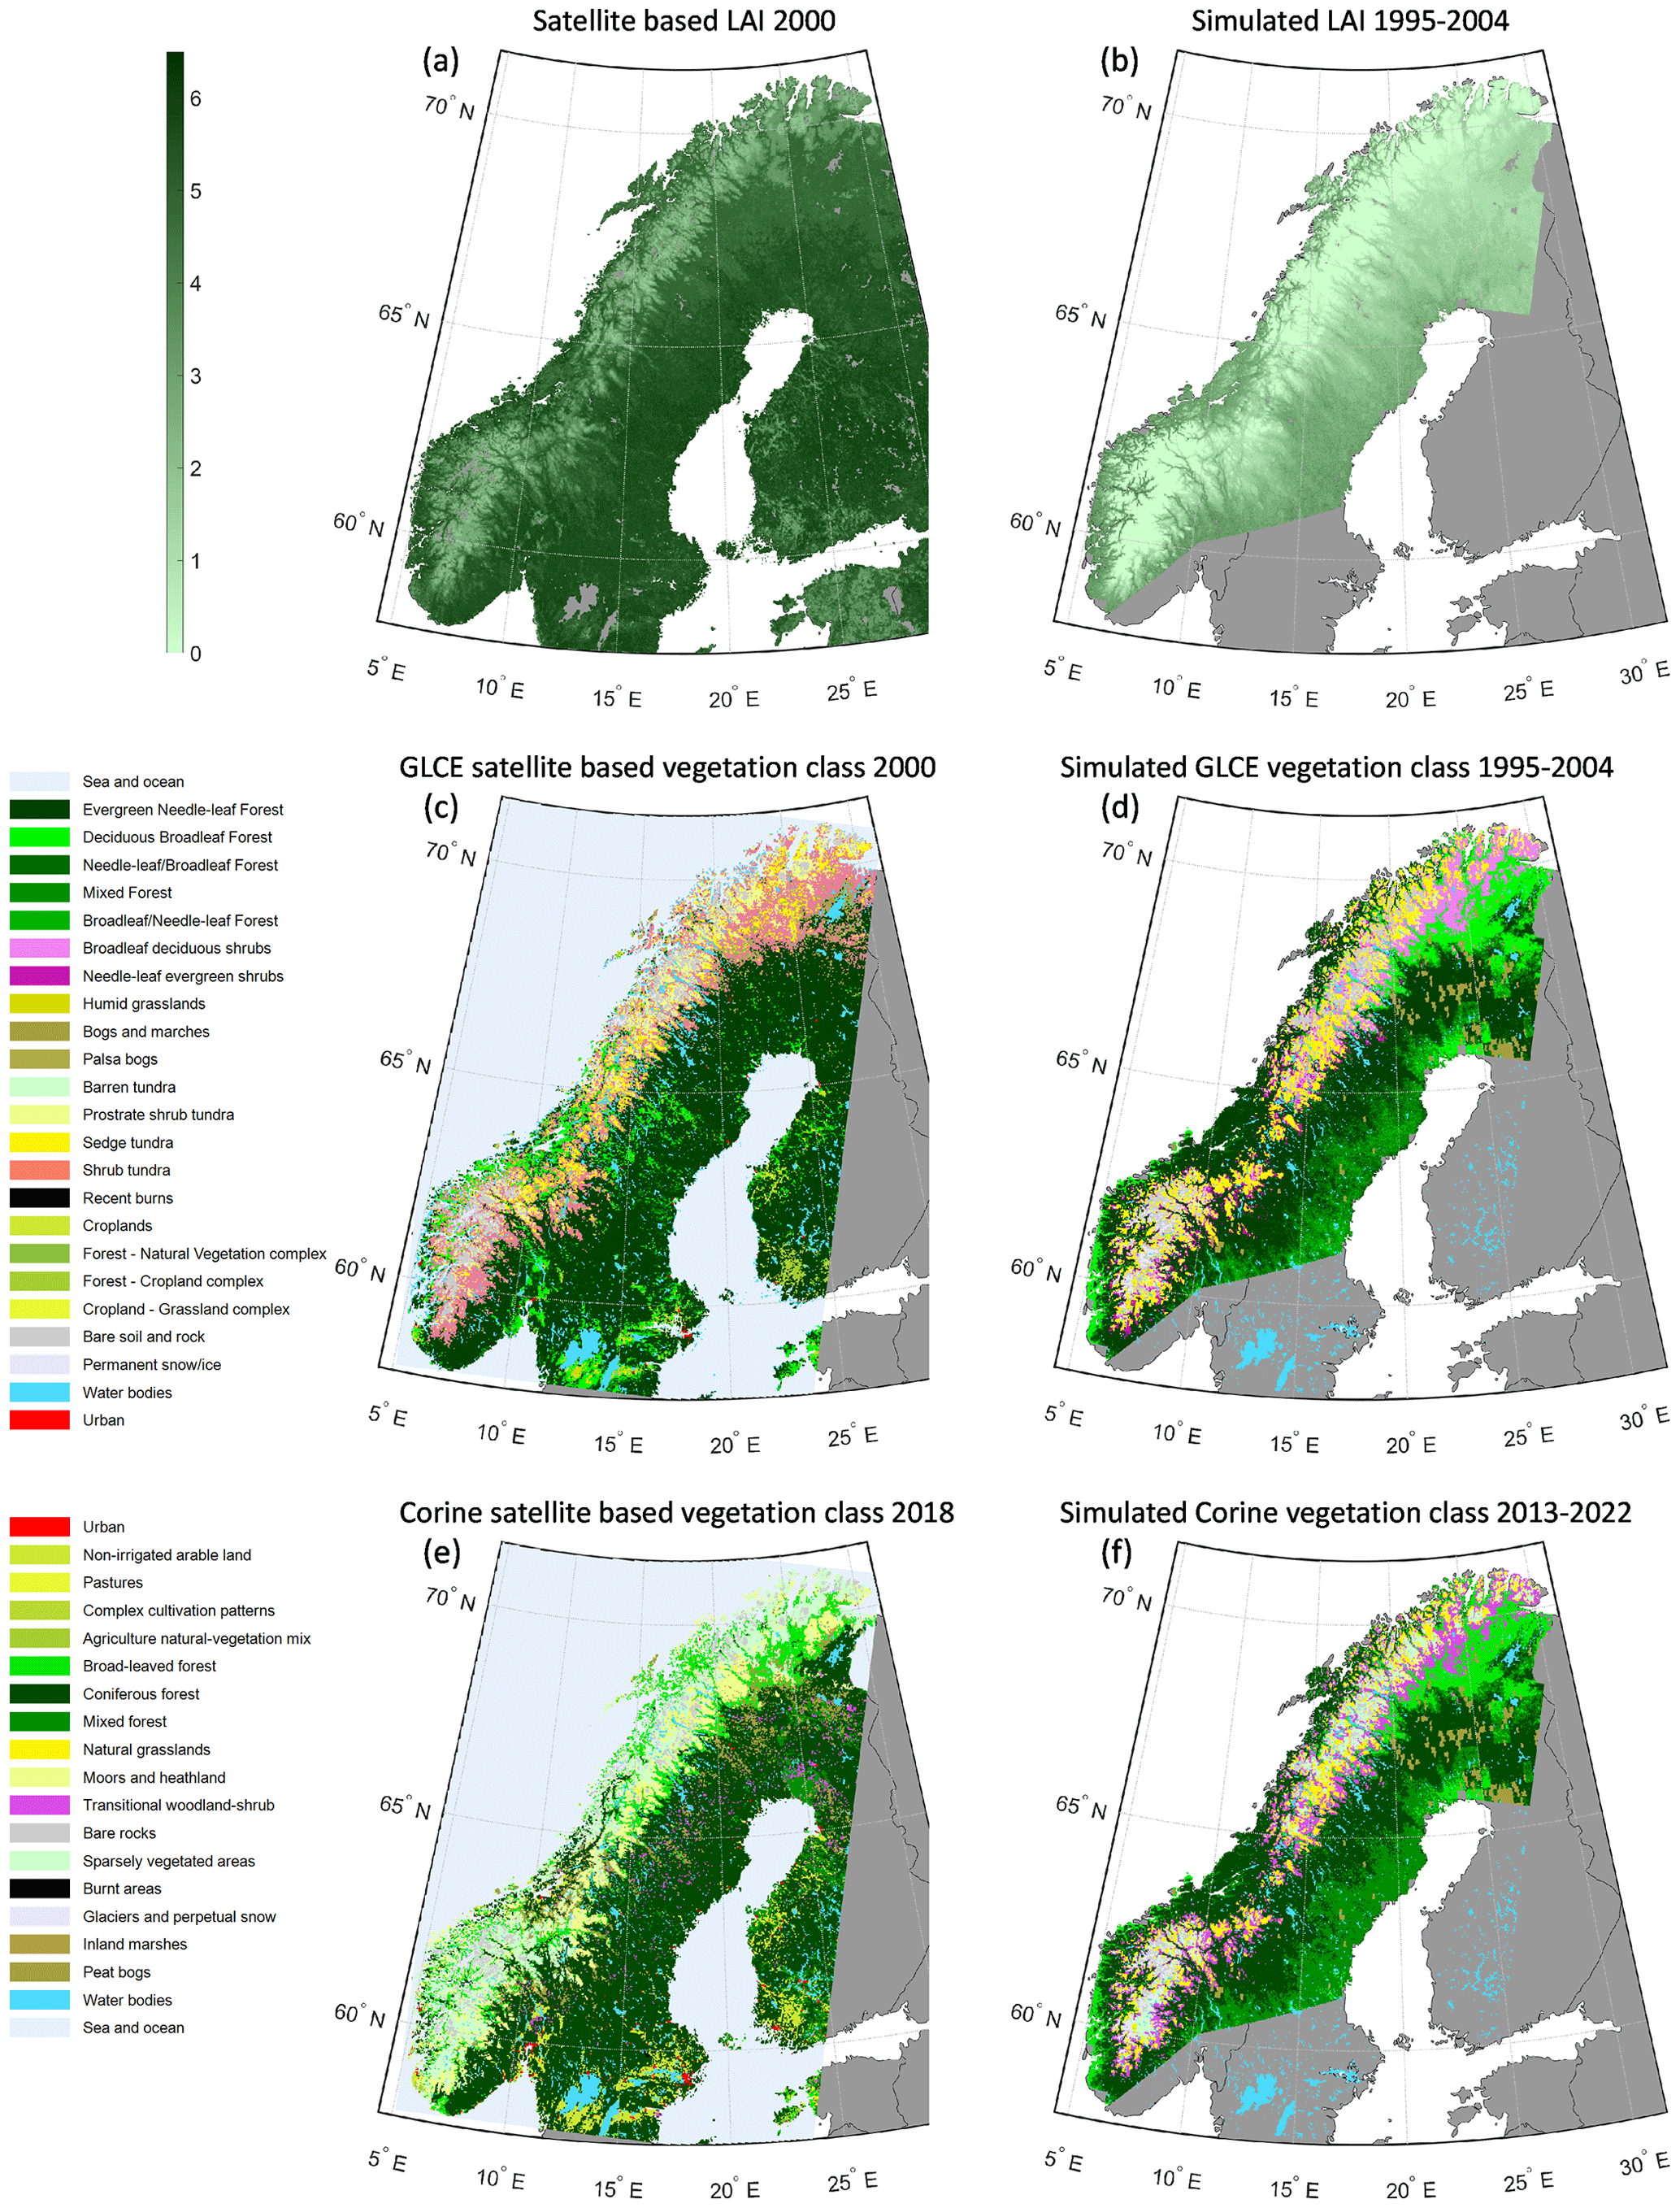
Figure 2Satellite-based products of LAI (a), GLCE vegetation classes (c) and Corine vegetation classes (e) compared to simulated total LAI (b) and vegetation classes based on LAI averaged over 10-year periods for different PFTs according to the GLC northern Eurasia classification (d) and Corine (f) (see Fig. S5a–b).
The simulations capture most of the broad patterns seen in the vegetation distribution from forest to non-vegetated areas when compared to the satellite-based products in 2000 and 2018 (Fig. 2c–f). For the detailed classes of the GLCE map, the overall accuracy is however only 32 % of the grid cells (Table S6a) and for the somewhat wider classes of Corine 37 % (Table S6b). Classifying in broader classes, the extent of forest agreed for 84 % of grid cells simulated to be forest for both GLCE and Corine (user accuracy, UA) and for 90 % and 94 % of the satellite-based forest grid cells (producer accuracy, PA) for GLCE and Corine, respectively. The most common class of the boreal forest, the needleleaf evergreen forest class, is mixed more with broadleaf trees in the simulation, and the distribution west of the mountains is overestimated compared to the satellite-based products. With the new parametrization of the IBS PFT (Table S2), the deciduous broadleaf forest expands too much in the north on the east side of the mountain ranges. Many (30 %) of the grid cells that have shrub tundra according to the satellite data were classified as shrub vegetation, resulting in poor UA for broadleaf deciduous shrubs (0.5 %) and needleleaf evergreen shrubs (0.0 %) and poor PA for shrub tundra (0.2 %), in the GLCE comparison. The classes are distinguished based on if the LAI of trees and tall shrubs is more than 20 % of the total LAI (Fig. S5b). Similarly, for Corine the simulated transitional woodland–shrub class mainly coincides with grid cells classified as broadleaf forest, moors and heathland and sparsely vegetated by the satellite product (Fig. S5a).
Aggregating the tundra classes for GLCE gave a UA of 83 % and PA of 36 %, where the low PA is the result of many grid cells classified as shrub tundra by the satellite data being simulated to be forest or shrub vegetation. The moors and heathland class is the third largest in the Corine satellite data and was often classified as forest, natural grassland or transitional woodland–shrub by the simulation (UA 18 %, PA 4 %). The LAI limits for the definition of the bare rock and glacier classes from the simulation were the same for GLCE and Corine classification, and both classes were reduced in abundance from 1995–2004 to 2013–2022. The UA and PA for these classes were in the range of 11 %–57 %.
3.1.2 Validation of the effect of the new reindeer module against vegetation inventories and reindeer exclosures
Comparing model data and the in-situ-estimated biomass for the northernmost Pulsuvuoma site showed that simulated tree and shrub biomass was underestimated by ca. 35 % but was within the inventoried uncertainty range of the exclosure site (Fig. 3). For the southern sites, biomass was overestimated by ca. 50 % in Långfjället and by 200 % in Fulufjället. A reason for the substantial overestimation for Fulufjället is that it was dominated by needleleaf trees in the simulation. This was confirmed by test simulations; excluding pine and spruce PFTs (BINE and BNE) reduced biomass with 14 %, and also excluding the birch PFT (IBS) reduced biomass with 78 %.
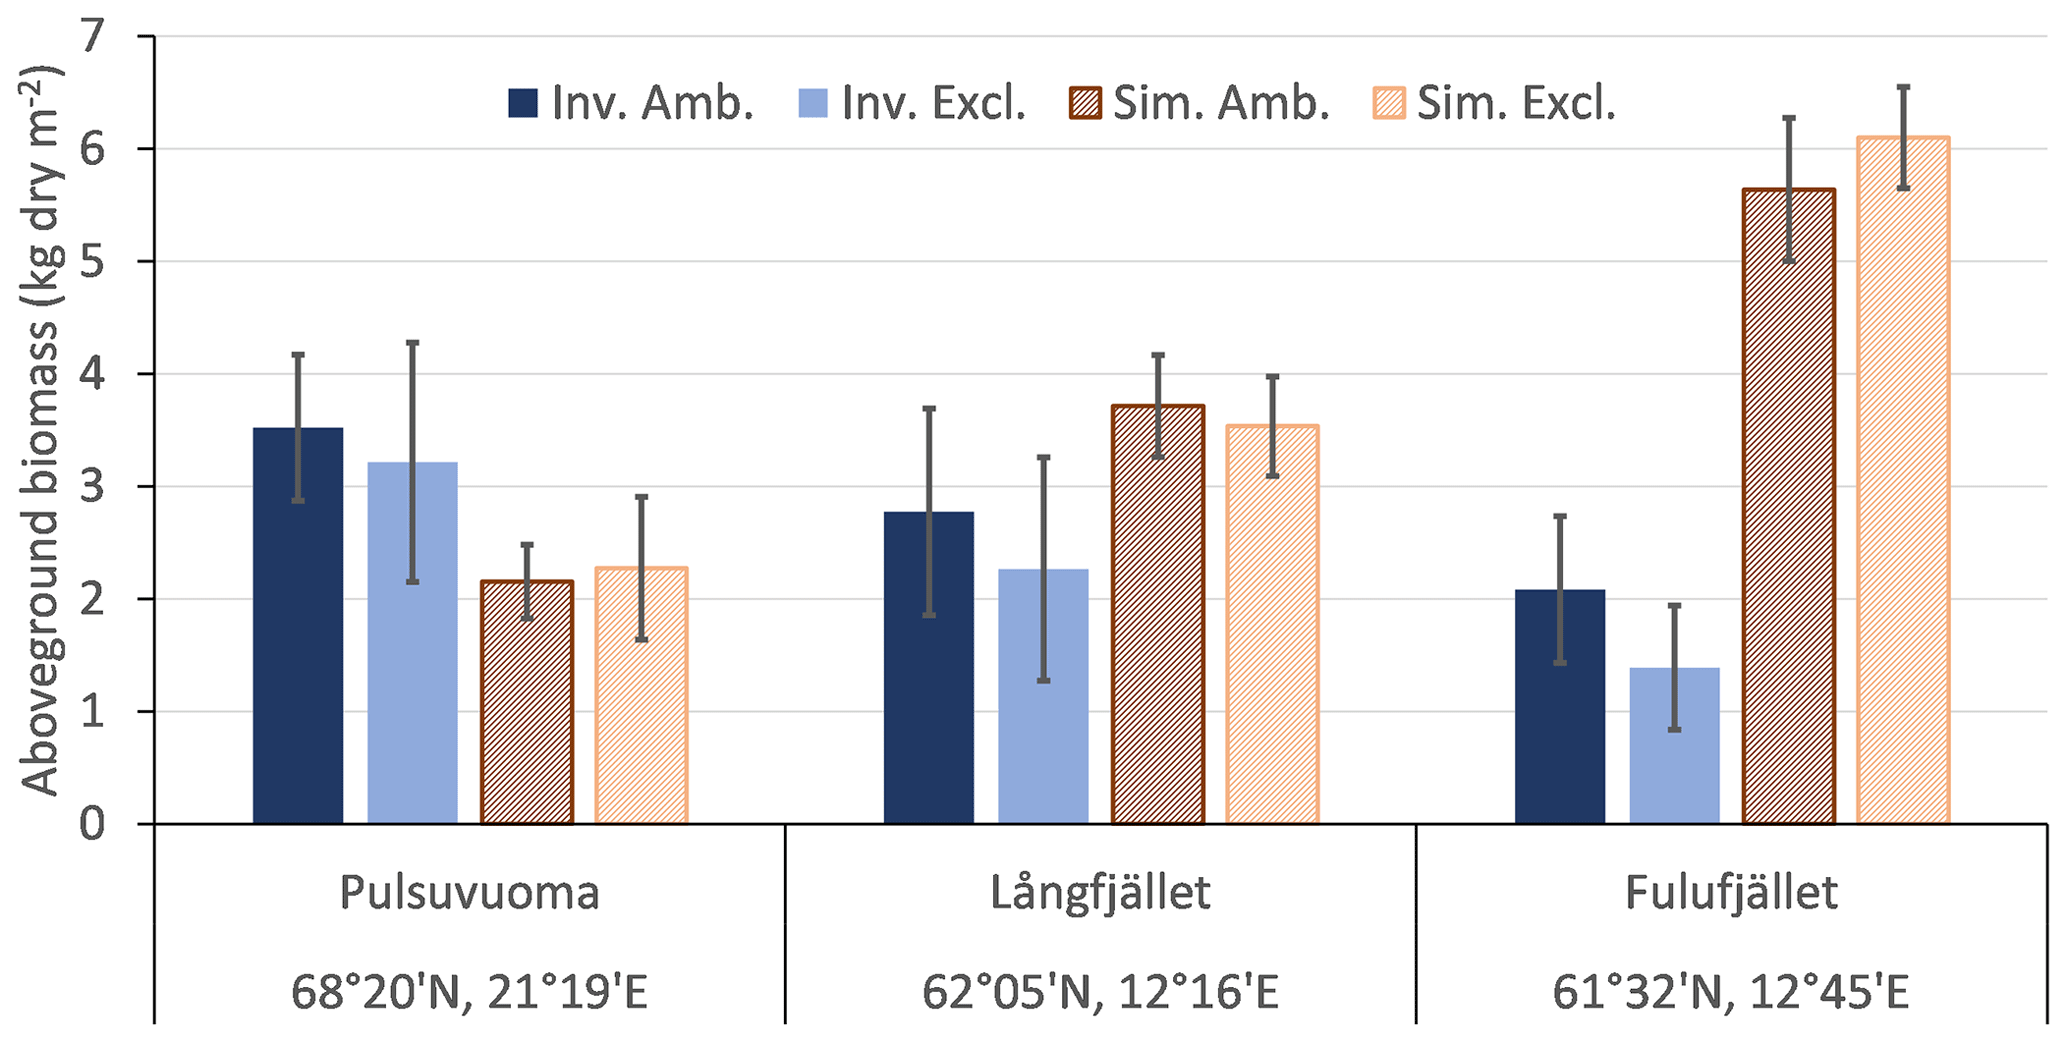
Figure 3Simulated (sim.; mean over the years 2009–2013, striped bars) above-ground tree and shrub biomass compared to inventoried data (inv.; 2011 or 2012, solid bars, no biomass data were available for the Ritsem exclosure site) from experiments with ambient plots and simulations with reindeer presence (amb.; dark bars) and plots with exclosure from 1995 and simulations without reindeer (excl.; bright bars). Average and standard deviation over three inventoried plots or the two to three closest simulated grid cells.
The in-situ-observed coverage of the shrub and field layers from the four exclosure sites was dominated by low evergreen shrubs, mainly Calluna vulgaris, Empetrum nigrum and Vaccinium vitis-idaea, except for the Ritsem shrub heath, which was dominated by graminoids and herbs (Fig. S6). The total simulated LAI of the shrub and field layers was low for the two northern sites (0.08 to 0.26 compared to inventoried coverage of 59 %–75 %) and was dominated by graminoids and herbs in the Ritsem shrub heath and high summergreen shrubs below the Pulsuvuoma birch forest. There was a trend that exclosure from reindeer grazing decreased the abundance of graminoids and herbs in both observations and simulations. For the two southern sites, the inventoried coverage and simulated LAI were similar except for Fulufjället, which had a simulated overstorey of denser evergreen conifers instead of birch. The trends after exclosure are less clear for the southern sites, and the short shrub classes that dominate in the inventories are almost totally absent in the simulations, which are dominated by high shrubs (up to 2 m tall), graminoids and herbs. It should be noted that Fulufjället is located outside the area used for reindeer herding, though it is occasionally visited by reindeers from Norway and moose, and the modelling case is hypothetical.
3.2 Simulations and analysis of trends in vegetation (2000–2100)
3.2.1 Trends in simulated vegetation classes over the whole simulated area
In the RCP8.5 scenario a dramatic shift in simulated vegetation composition was found, especially after 2050 (Fig. 4). By 2041–2050 the shrub vegetation classes are already seen to expand to higher elevations in the mountains, and the broadleaf forests in the north start to be mixed with conifers. At the end of the century, the simulated area coverage of open-vegetation classes and the bare soil and rock classes was found to be negligible. For instance, the Fennoscandian low arctic tundra, which stretches like a wedge from the Kola Peninsula to the northernmost Swedish Lapland, in the lee of the mountain chain, would be completely lost by 2100 (Fig. 4c). Along the southern part of the Norwegian coast and the south-eastern part of the Swedish boreal forest, temperate broadleaf trees (TeBS PFTs) start to become dominant in the 2091–2100 period, shown by increasing areas of the deciduous broadleaf class.
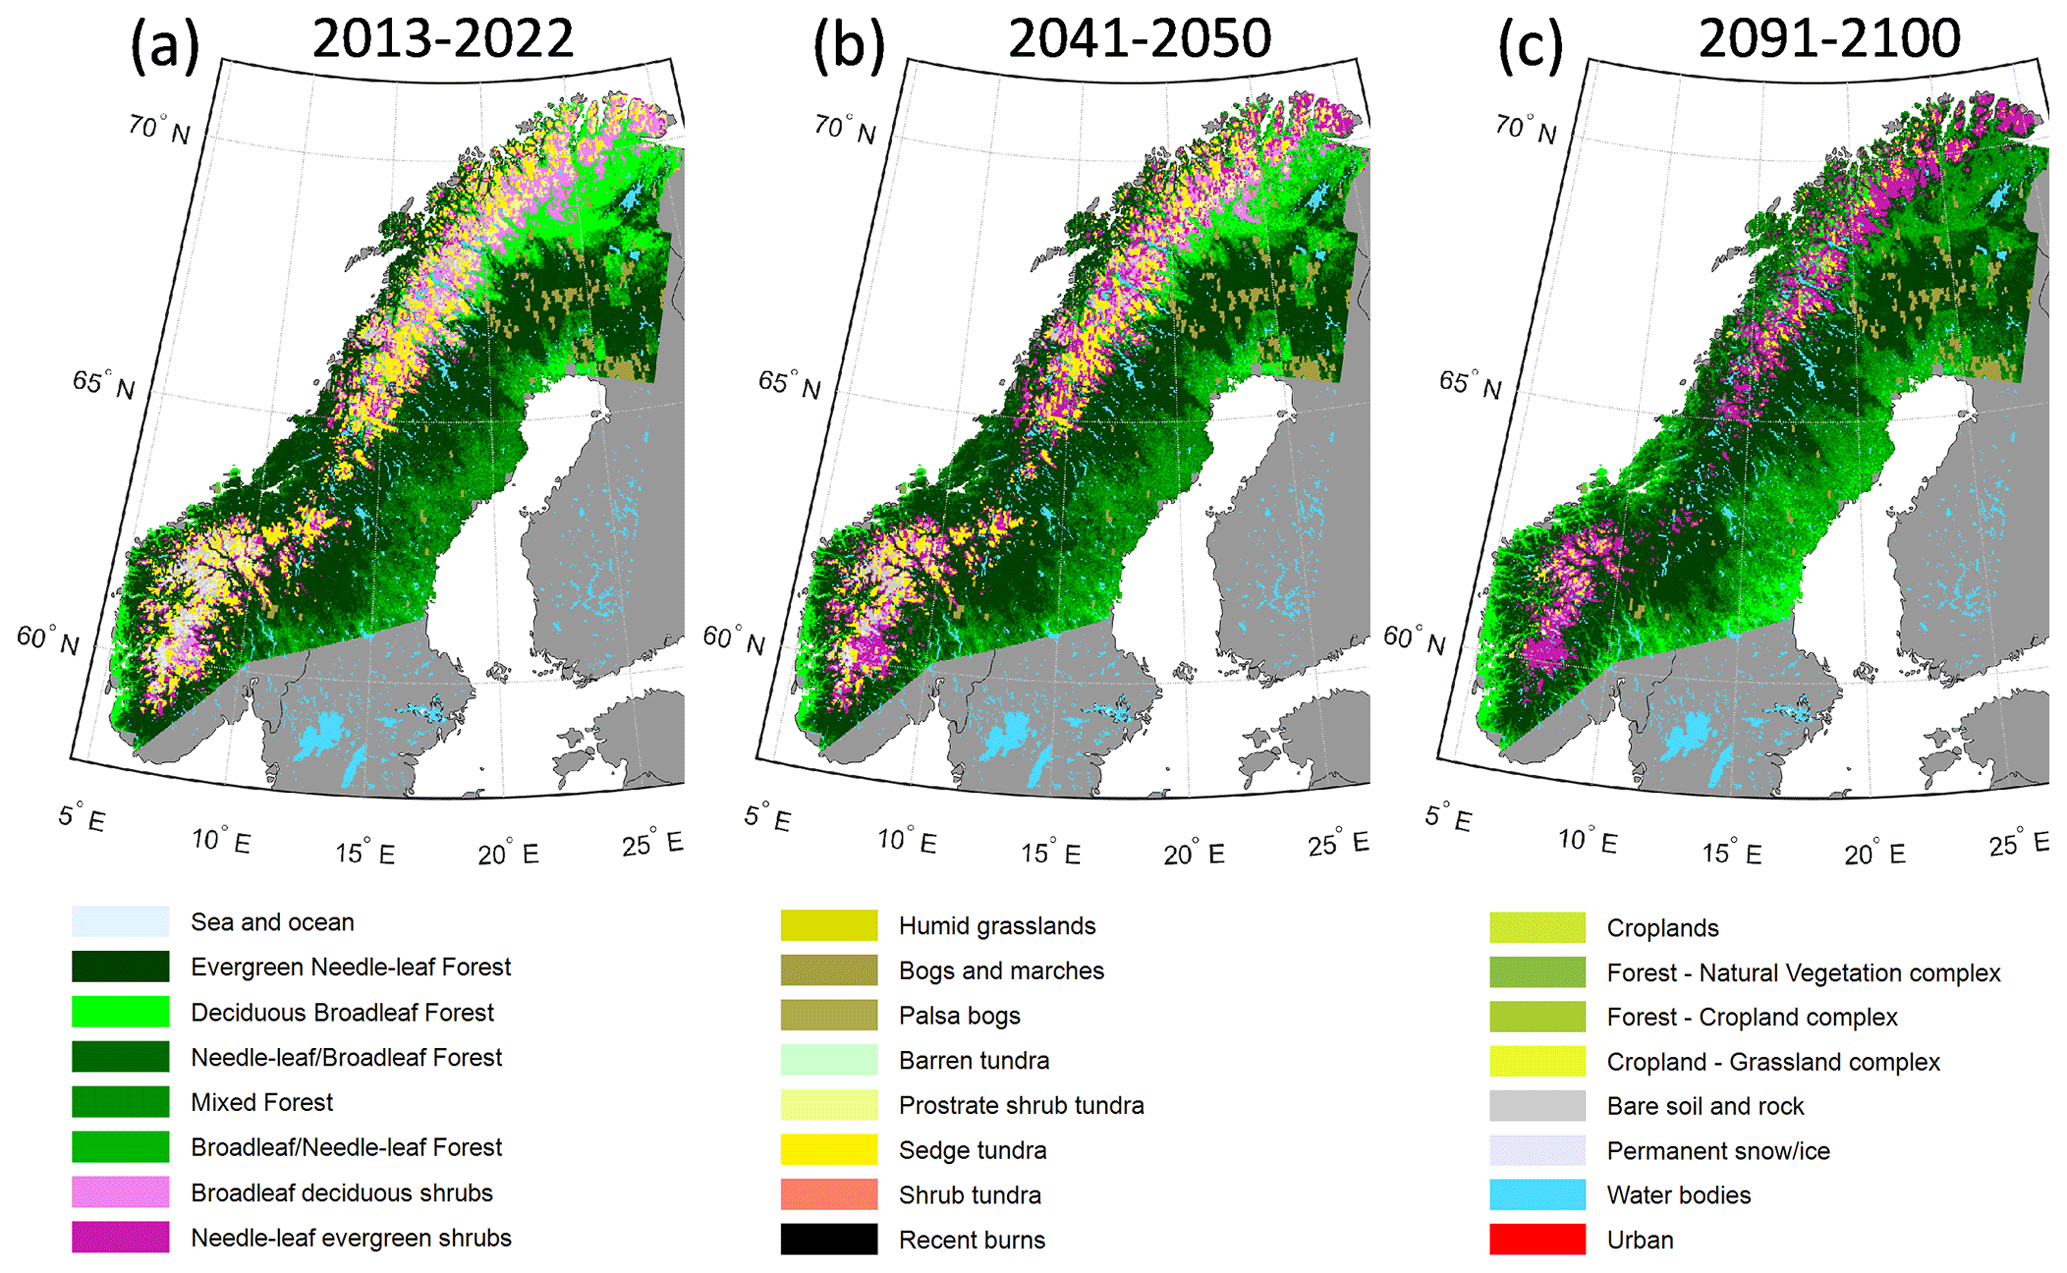
Figure 4Simulated vegetation classes according to the GLC northern Eurasia classification based on average LAI for different PFTs over 10 years, for three periods (a–c) in the RCP8.5 scenario.
In the western part of the mountains at latitude 68° N, deciduous and mixed forests advance from a simulated current maximum altitude of ca. 500 m a.s.l. to more than 1200 m in 2090–2100 (Fig. 5a–c). On the east side there is no altitudinal advancement of the forest but a shift from deciduous broadleaf trees to conifers. Shrub vegetation classes, especially needleleaf shrubs, become dominant at middle to high altitudes, for 66° N (Fig. 5d–f) and 68° N at about 700 to 1200 m and for 61.5° N less distinctly at 1000 to 1700 m (Fig. 5g–i). At latitude 61.5° N, the lower mountains east of the mountain range become almost completely covered by evergreen needleleaf forest. The changes seen in the 2041–2050 period are less distinct, but the increase in needleleaf shrubs has started by then, and in the highest elevations a shift in grid cell classification from permanent snow/ice to bare rock can be seen, indicating continued melt of glaciers and snowfields. As the classification is based on LAI, see Sect. S5, it indicates that plants have the potential to grow there.
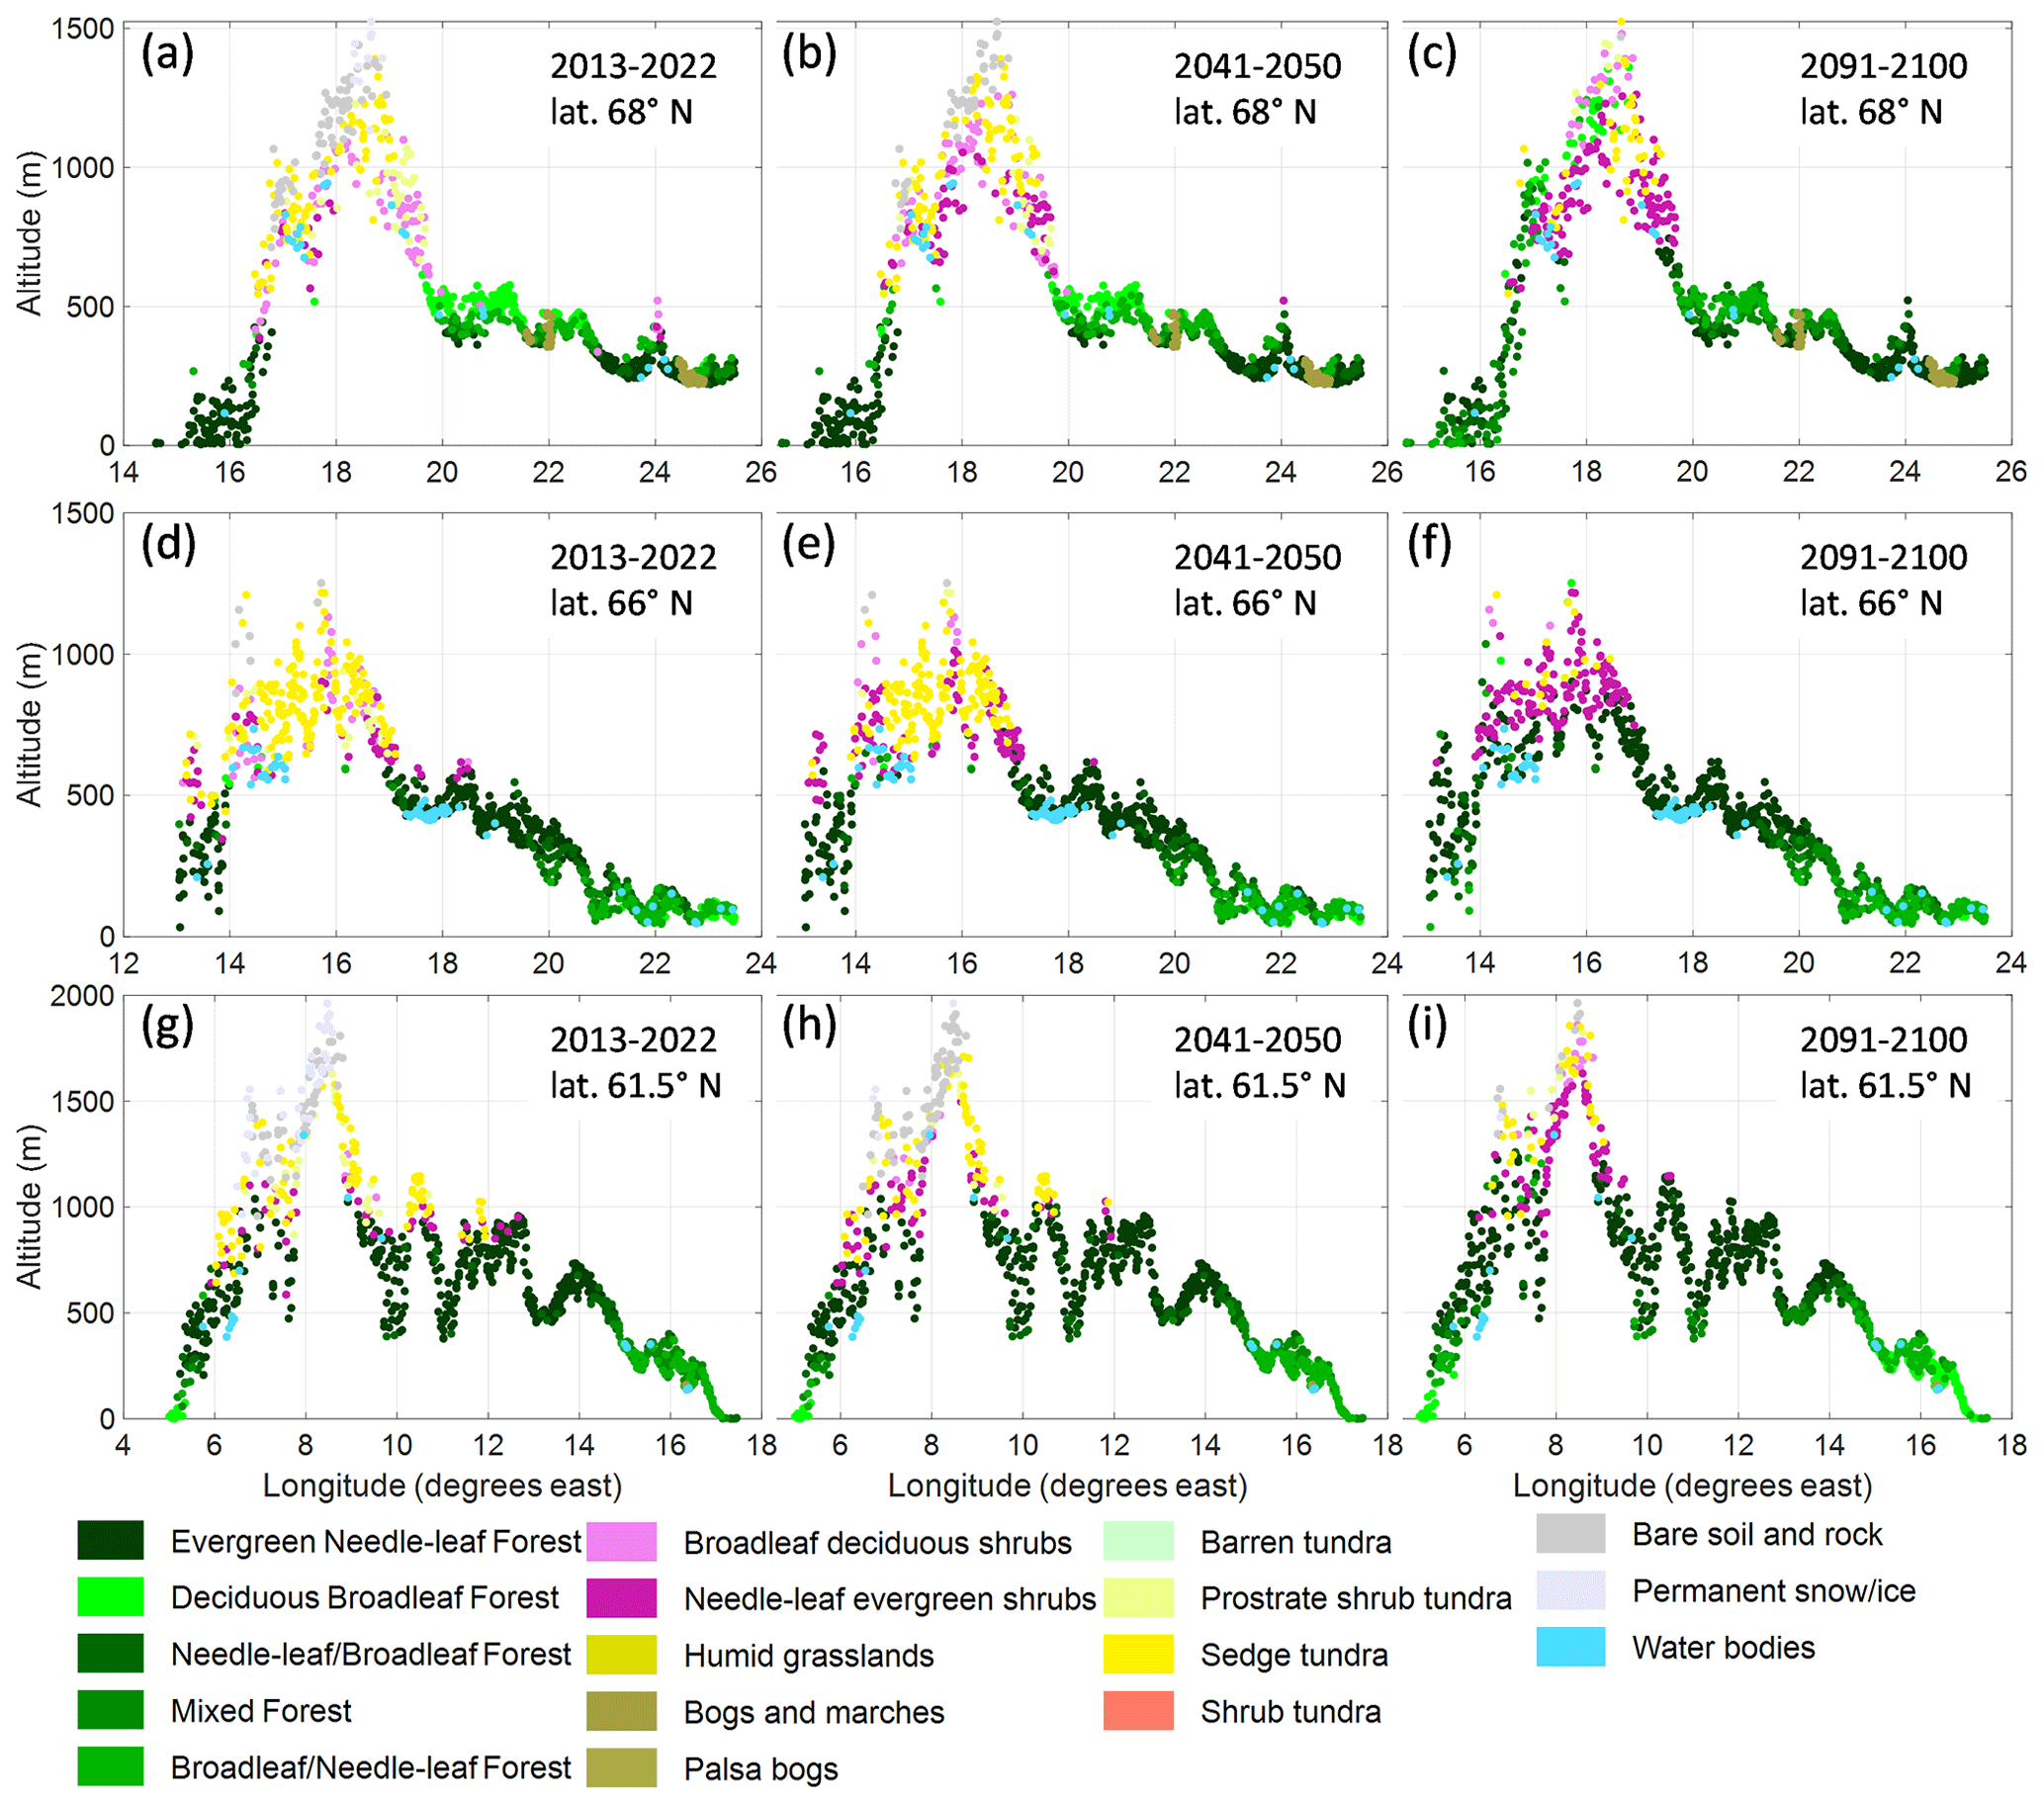
Figure 5Profiles of simulated vegetation class according to GLCE for the 2013–2022 and RCP8.5 2041–2050 and 2091–2100 time periods, shown at the grid cells' longitude and altitude for three latitude bands at 68.0° N (a–c), 66.0° N (d–f) and 61.5° N. The width of the bands (13.6–19.7 km) was set so that the area of each band was 9000 km2 and contained about 1000 grid cells.
3.2.2 Analysis of vegetation composition in hotspots with the help of statistics of threatened species
According to the GLCE satellite-based product, the shrub tundra class forms a large fraction of the vegetation next to the boreal needleleaf forest (Fig. 6, Table S7a–d). The official maps from Sweden show forest for parts of this area, e.g. in the valleys of the Abisko area. For the Vindeln and Helags hotspots, the simulated distribution of forest is close to the satellite-based reference, but for the Fulu hotspot there are just a few grid cells simulated as vegetation other than boreal forest. For Björnlandet the mixture of broadleaf trees in the forest is of a similar magnitude but with a different pattern. The extent of sedge tundra was larger in the simulations than for the GLCE reference for the three northern mountain sites.
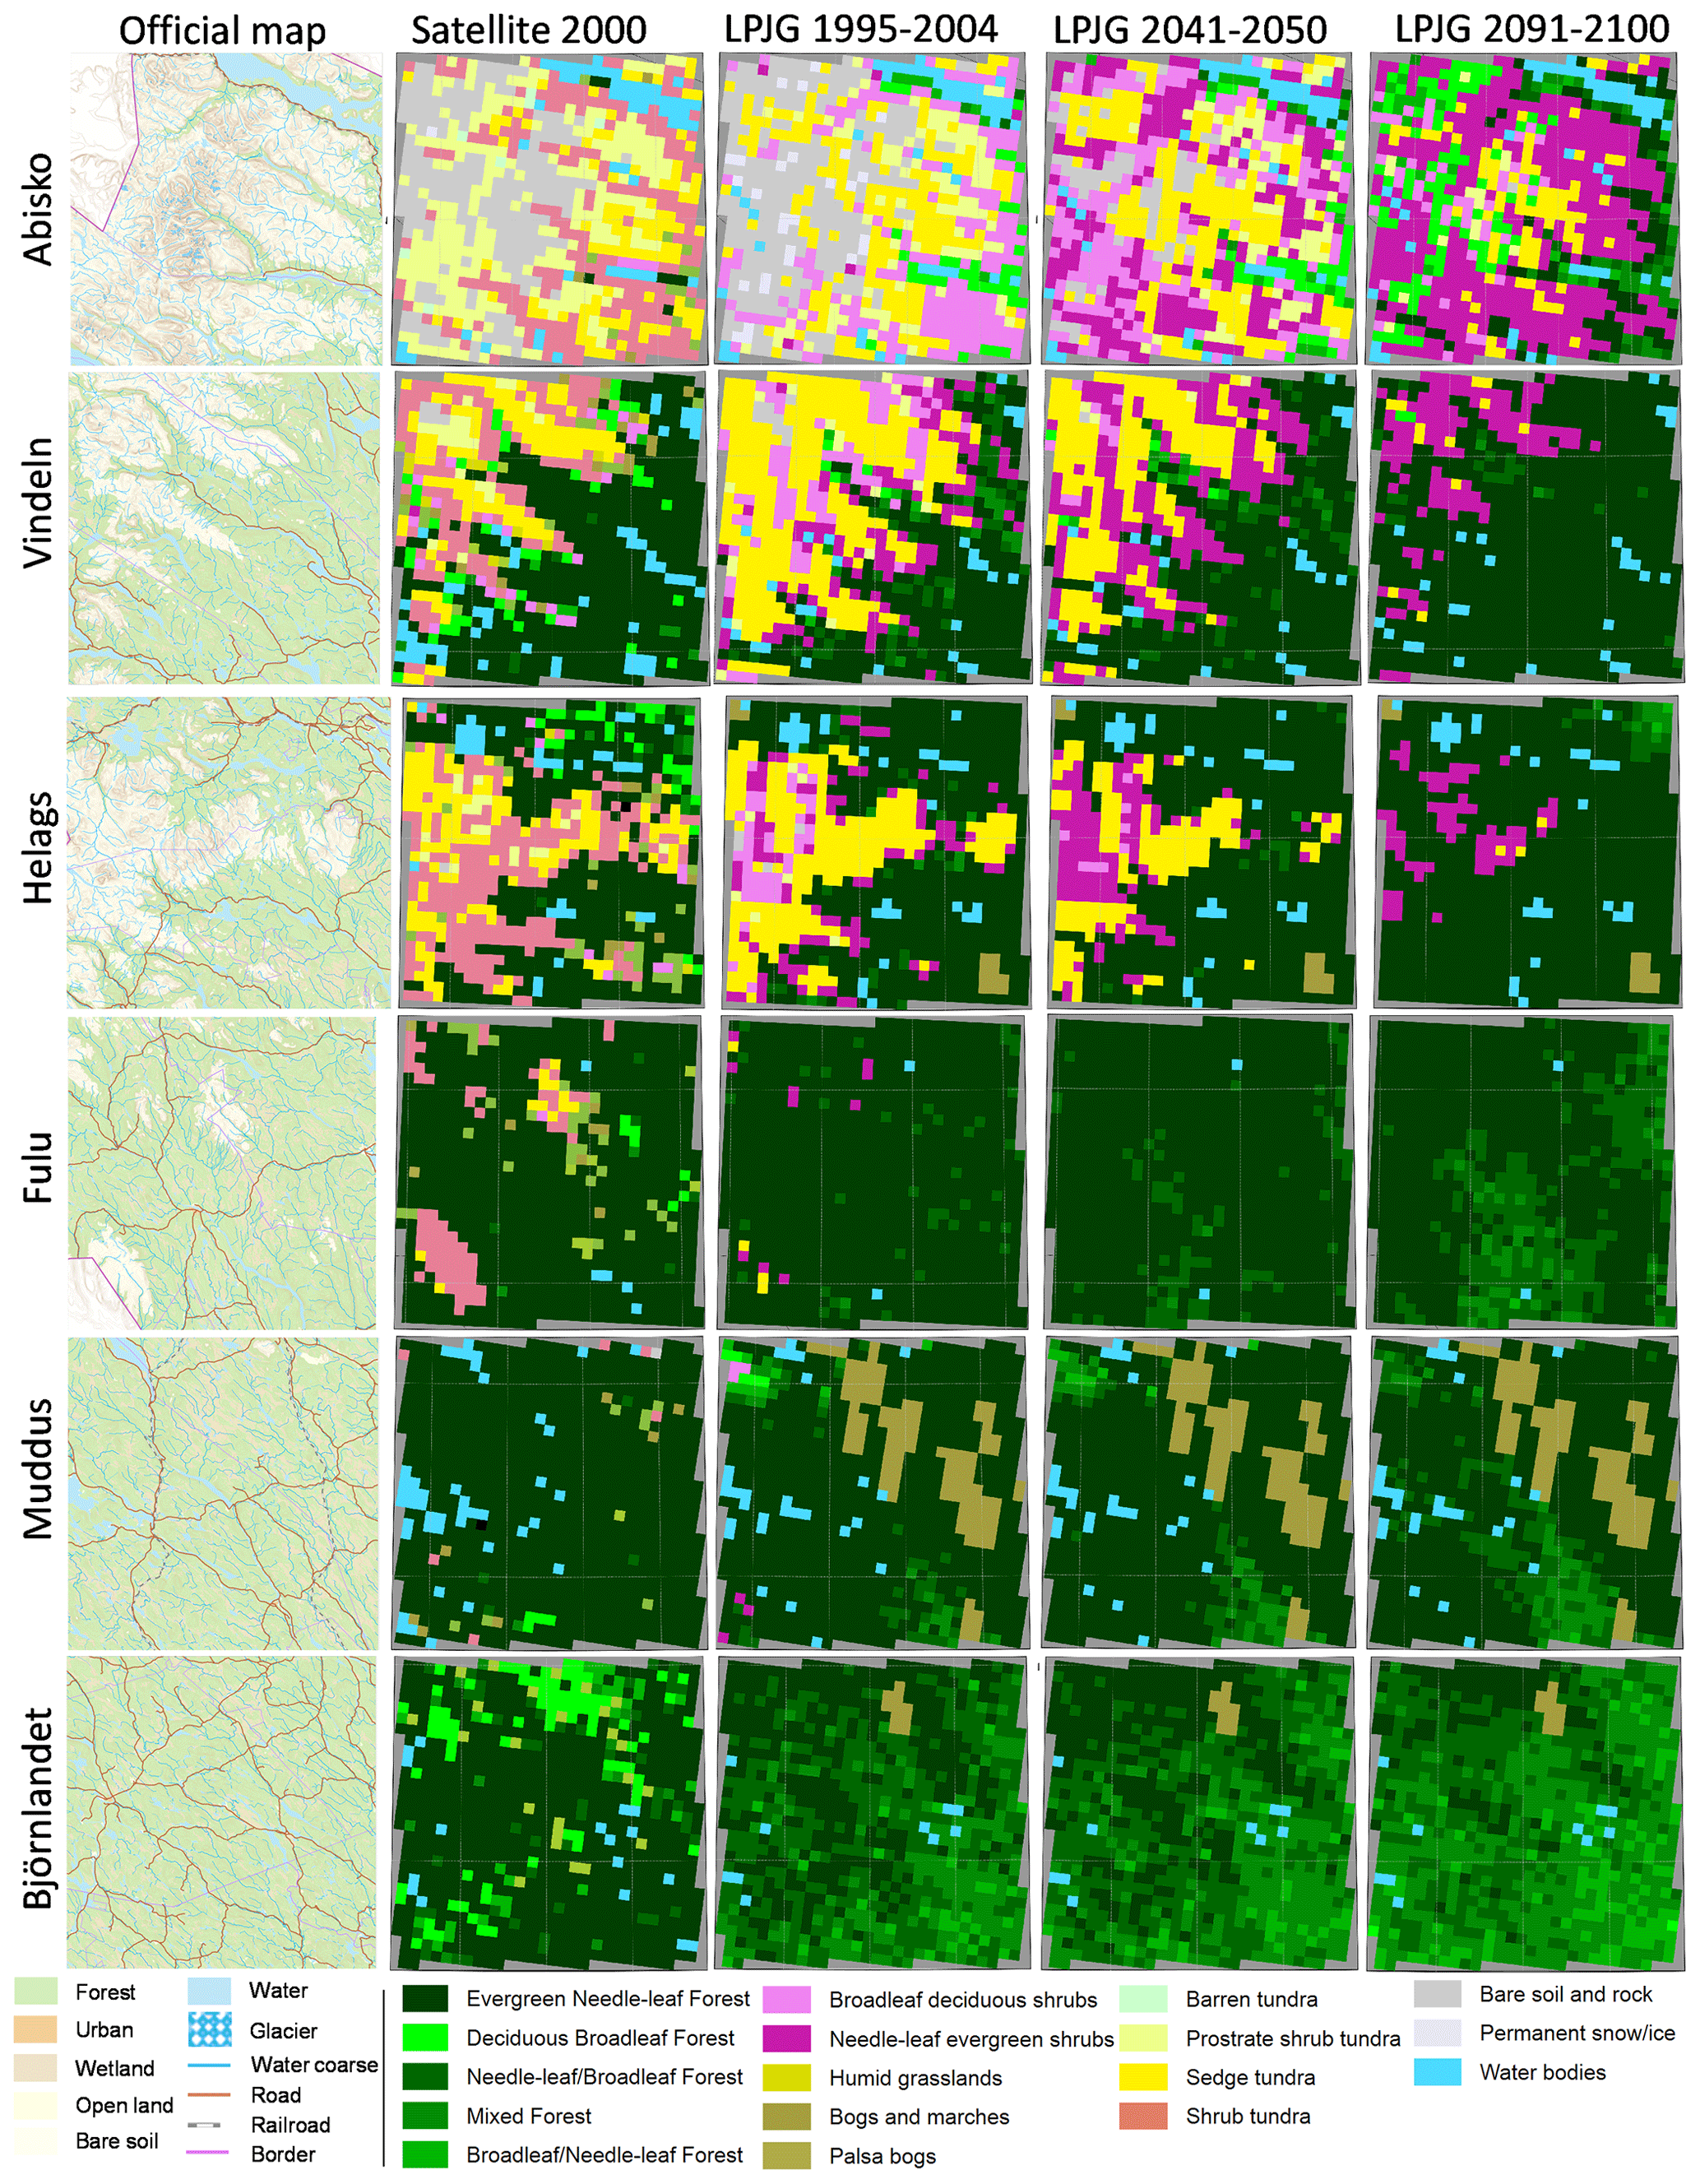
Figure 6Satellite-based (GLCE, second column) and simulated (columns 3–5) vegetation composition in hotspots within four mountain areas (rows 1–4) and two forest areas (rows 5–6) (see Fig. 1a for location), for 1995–2004 and for two future periods following RCP8.5. Each area is 90 × 90 km (30 × 30 grid cells). The first column shows the official vector-based map from Lantmäteriet (the overview map, open data Creative Commons license (CC0), https://www.lantmateriet.se/en/, last access: 9 September 2021).
By 2041–2050 a significant shrubification occurs in Abisko, Vindeln and Helags (Fig. 6), and forests start to establish at the edges of the current shrub and tundra vegetation, an advancement that accelerates until the 2091–2100 period. In Abisko the needleleaf shrub class reached a coverage of approx. 45 % of the land area at the end of the century, expanding mainly over former broadleaf shrub, tundra and bare soil classes (Table S7a). In Vindeln and Helags the evergreen needleleaf forest reaches approx. 80 % coverage of the assessed area in 2091–2100 (Table S7b–c). In the boreal forest below the Fulu mountain and in the Muddus and Björnlandet areas, we see that the needleleaf forest becomes more mixed with broadleaf trees (Fig. 6, Table S7d–f), which is also shown by the higher Shannon diversity index (D; Table 3). It should be noted that the bog class, which is well represented in Muddus, is excluded from the calculation of D as it is prescribed and not dynamic. Including this class would increase D, but we would not be able to correctly assess the change over time.
Table 3The Shannon diversity index (D) calculated from the fractional cover of GLCE vegetation classes (see Sect. S7) of the hotspots. Classes with non-dynamical vegetation like water and bogs were not included in the calculation.
For the northernmost hotspot studied, Abisko, the bare soil and rock class will almost disappear in the RCP8.5 scenario, but most other classes will remain in similar proportions of the grid cells, though with a shift within the hotspot area (Table S7a). This is reflected in a minor increase in D (Table 3) from 1.69 to 1.75 for this hotspot. Vindeln and Helags will see a clear decrease in diversity as needleleaf forest and shrubs will come to dominate (Table 3). For Fulu and the forest hotspots an increase in diversity is projected as the forests will be more mixed.
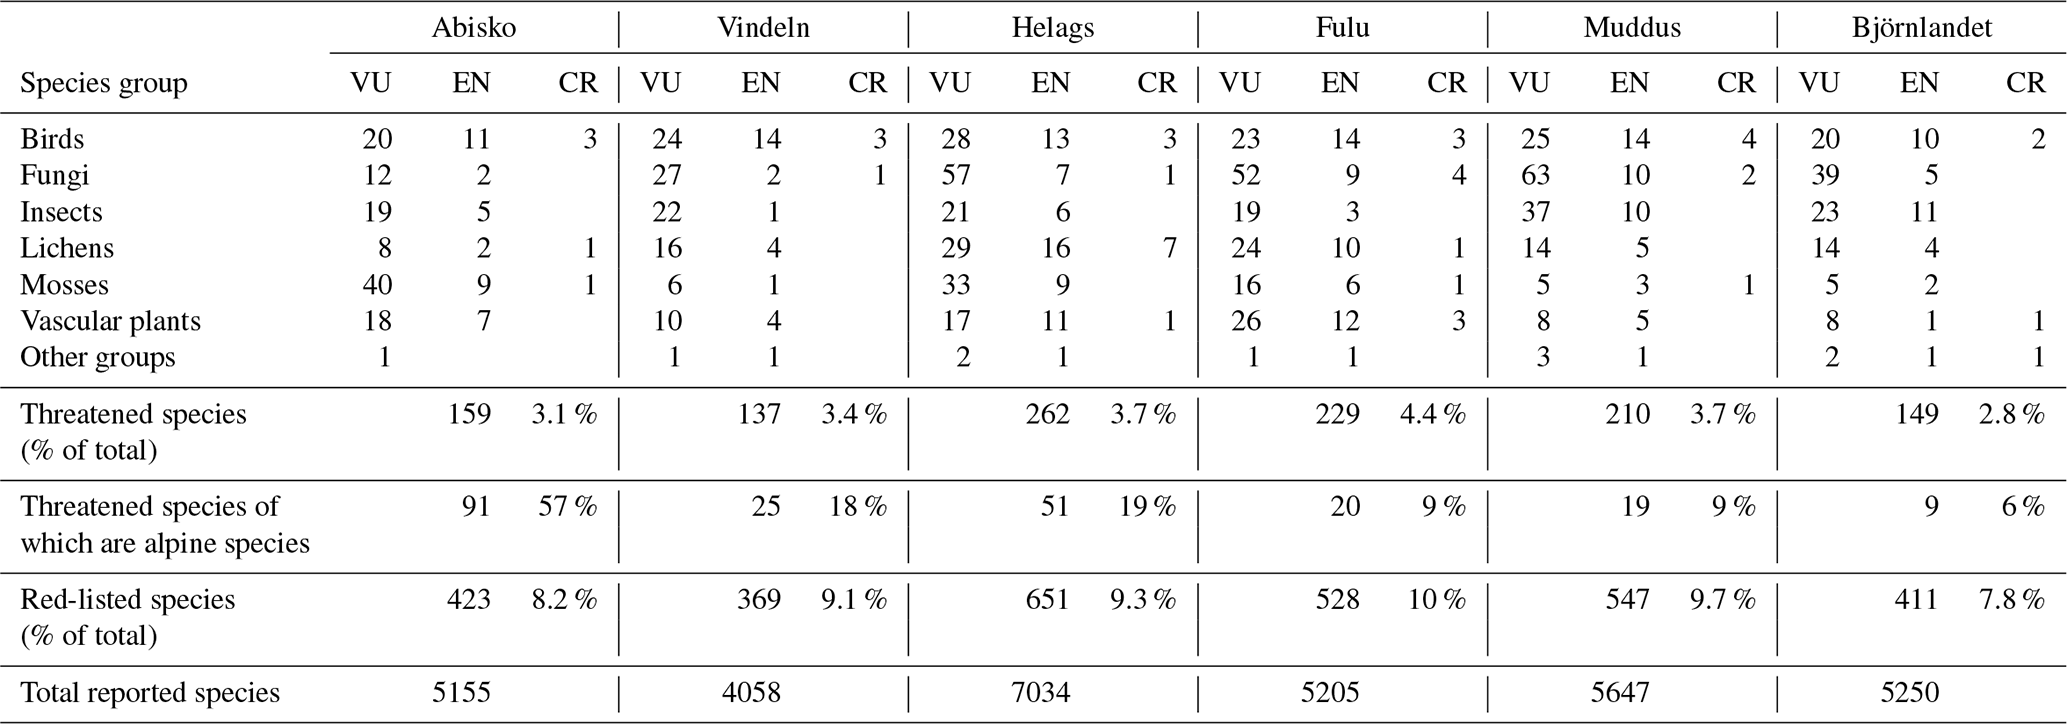
Vindeln was the area with the lowest number of reported species, whereas Helags was the most diverse area with over 70 % more species reported than for Vindeln (Table 4). The four other sites all had fairly equal numbers of reported species, in the range of 5155–5647 species. However, all hotspots had a similar share of red-listed species and threatened species, approximately 8 %–10 % and 3 %–4 %, respectively (Table 4). Of all threatened species in Sweden (2764 species), only 5.2 % (144 species) are classified as alpine, and almost of these threatened alpine species are found in Abisko, comprising more than half of all the threatened species in Abisko. For Vindeln and Helags, the number of threatened alpine species is just below 20 %, whereas the southernmost mountain hotspot Fulu and the forest hotspots Muddus and Björnlandet have less than 10 % of their threatened species classified as alpine. With respect to the species groups to which most of the threatened species belong, it can be noted that mosses contribute the largest number of species in Abisko (Table 4). Except Vindeln, where birds consist of the group with the most threatened species, fungi represent the largest number of threatened species for the other four hotspot areas.
Table 4Threatened species (VU – vulnerable, EN – endangered, CR – critically endangered) reported across species groups as well as total number of species and red-listed species reported for the six biodiversity hotspot areas.
3.3 Simulations of reindeer presence
3.3.1 Simulated effect on vegetation at reindeer exclosure sites (1985–2100)
Three grid cells within the exclosure experiments with a wide range of conditions were selected to exemplify the simulated development of the vegetation composition until 2100 (Fig. 7). Simulated LAI for the Ritsem shrub heath indicates a steep increase in the year 2003, corresponding to an establishment of C3 grass, after which this PFT has a rather constant LAI over the simulation period (Fig. 7a–b). Shrub vegetation (PFT LSS, LSE (both low shrubs), HSS and HSE (tall shrubs)) increases gradually in Ritsem. At all sites, deciduous shrubs would have a higher fraction without simulated reindeer grazing and trampling, but the difference is minor. The mountain birch PFT (IBS) dominates simulations for the Pulsuvuoma birch forest over the simulation period (Fig. 7c–d), but for the heath grid cells there is no period with a high fraction of mountain birch forests (Fig. 7a–b, e–f). Instead PFTs that represent the needleleaf coniferous forest (BNE and BINE) start to establish at the Ritsem and Pulsuvuoma grid cells around 2035, and these PFTs are already present in the simulations for Långfjället, and at the end of the simulation they are dominant at both shrub heath sites. The summergreen prostrate dwarf shrub PFT (SPDS) has a maximum fraction of ca. 50 % of LAI in Ritsem, though with a very sparse coverage, before C3 grass takes over, but apart from that, short shrubs (LSS and LSE), prostrate dwarf shrubs (SPDS and EPDS), and the graminoid and forb tundra (GRT) PFTs only have a minor presence in the simulations.
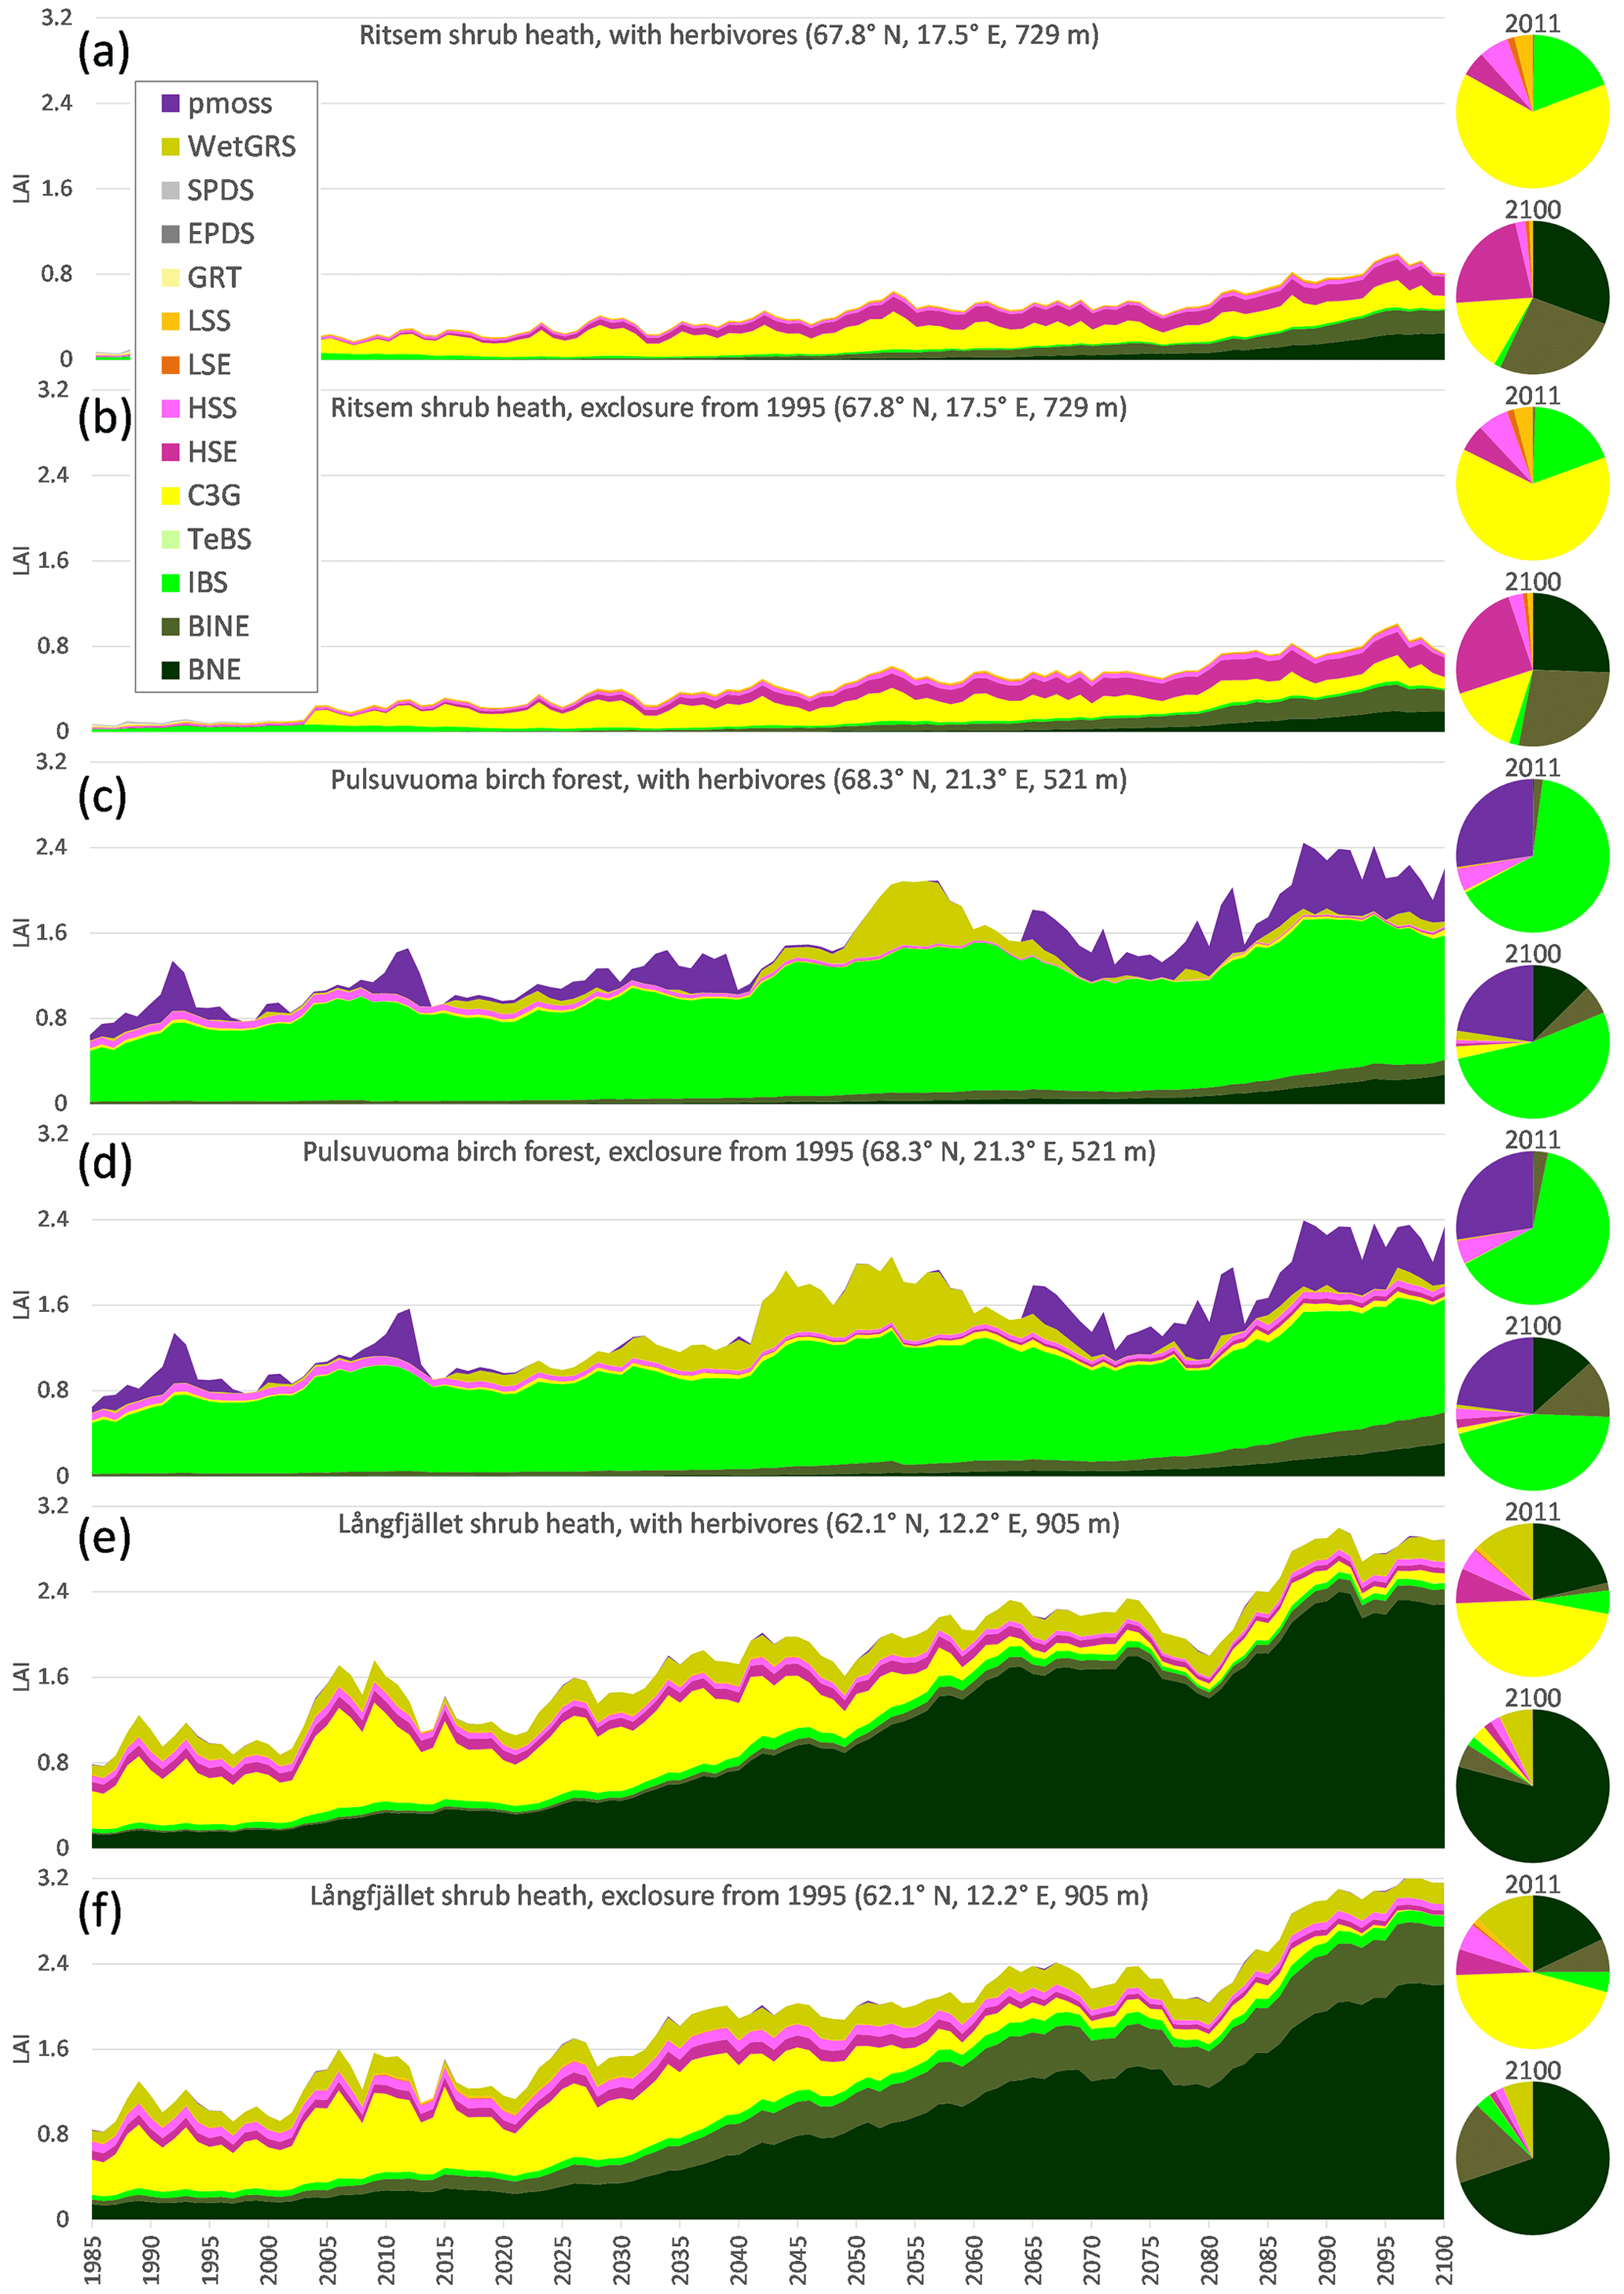
Figure 7Simulated development of the vegetation composition (based on LAI for different PFTs; see Table 2 for description) at selected grid cells in the exclosure experiments from 1985–2100, for RCP8.5.
3.3.2 Trends in simulated potential reindeer leaf consumption (2000–2100)
With a constant grazing pressure, simulated reindeer leaf consumption of a PFT depends on available leaf mass, accessibility of the leaves (height less than 2.5 m) and how appetizing it is (preference value – see Table S3). In the current climate the highest consumption was found east of the mountain range with an increasing gradient from north to south (Fig. 8a). In the boreal forest zone, the grazing level is quite evenly distributed, although there is a tendency for lower values in areas with a higher fraction of needleleaf PFTs (Fig. 4). By the 2041–2050 period, the change is small, although some increased potential in the least vegetated areas can be seen (Fig. 8b). By the end of the century there is a substantial increase in potential consumption in the higher-altitude areas as well as in the inland boreal forest (Fig. 8c). In the south and towards the east there is a trend towards reduced potential reindeer consumption in the forested cells.
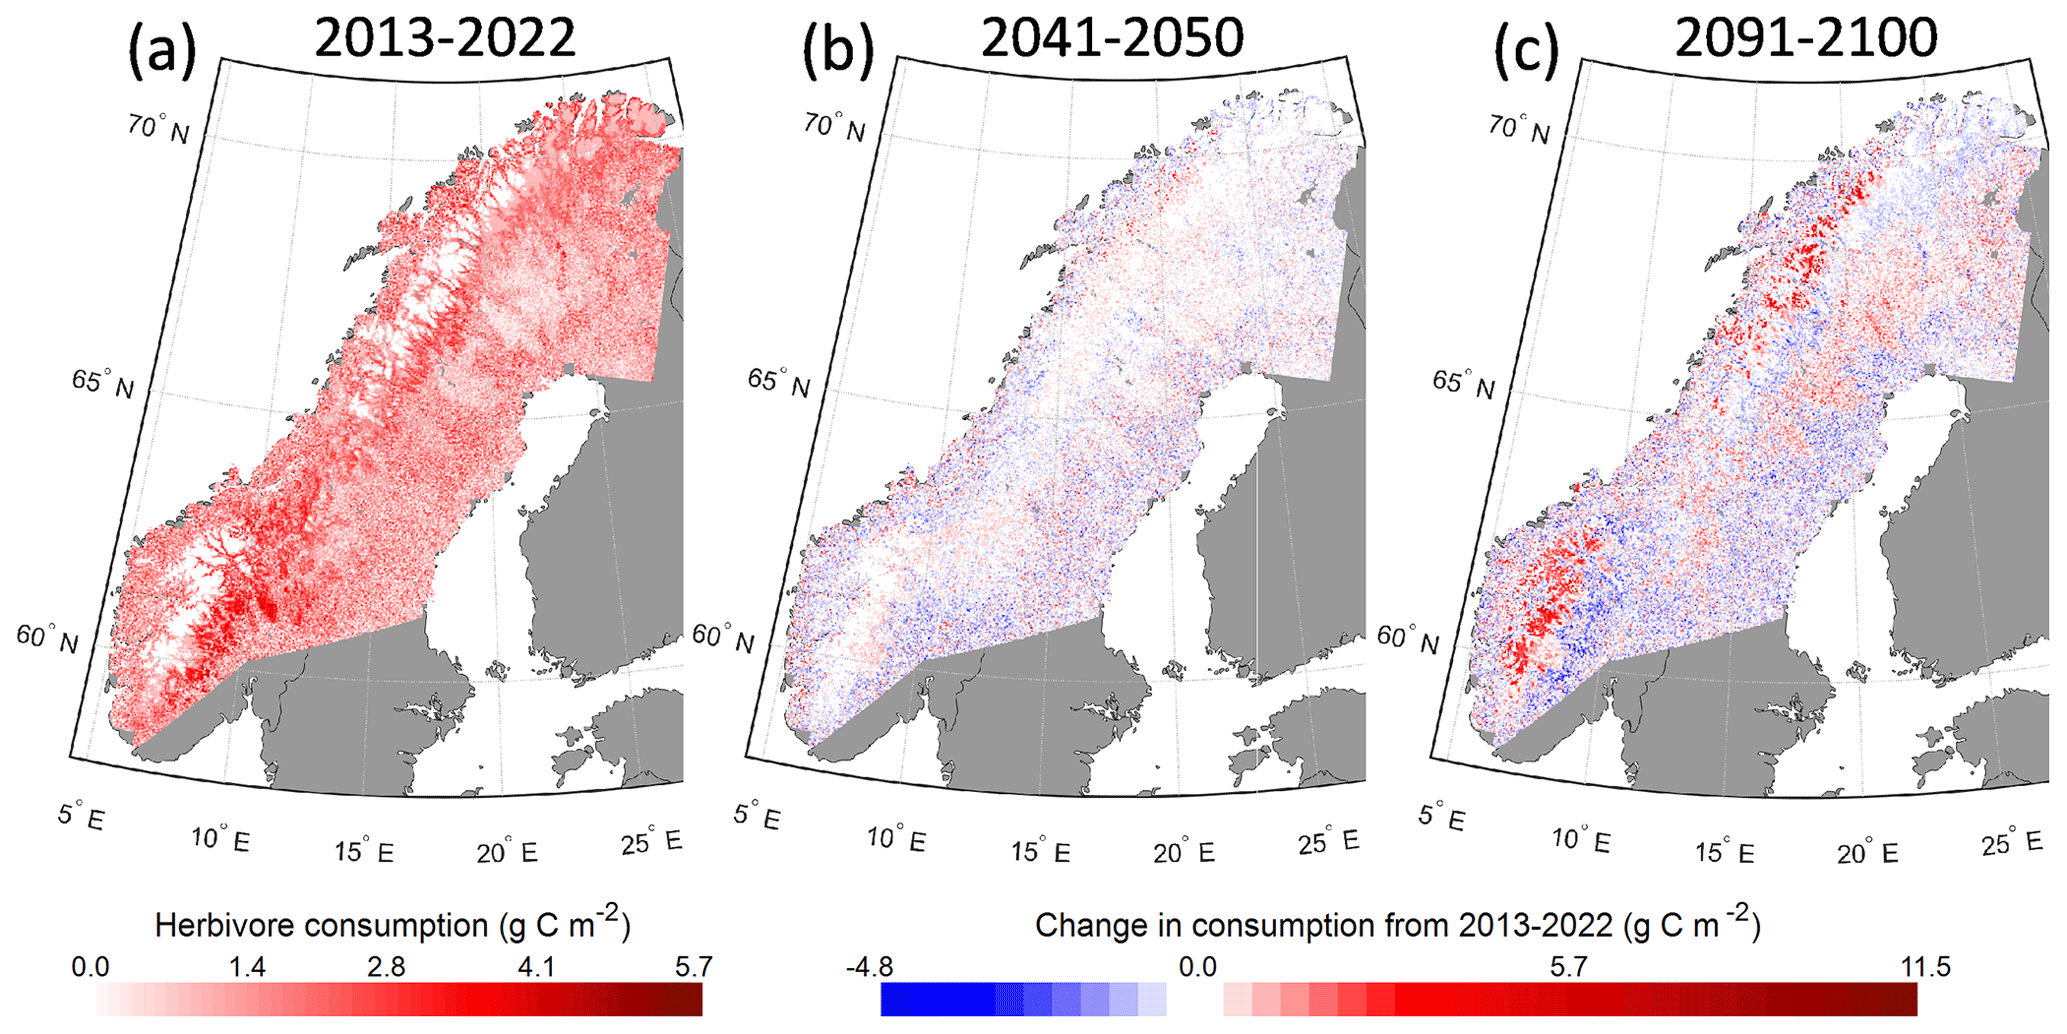
Figure 8Simulated potential reindeer consumption (g C m−2 yr−1) from 2013–2022 (a) and the change in 2041–2050 (b) and 2091–2100 (c) in RCP8.5.
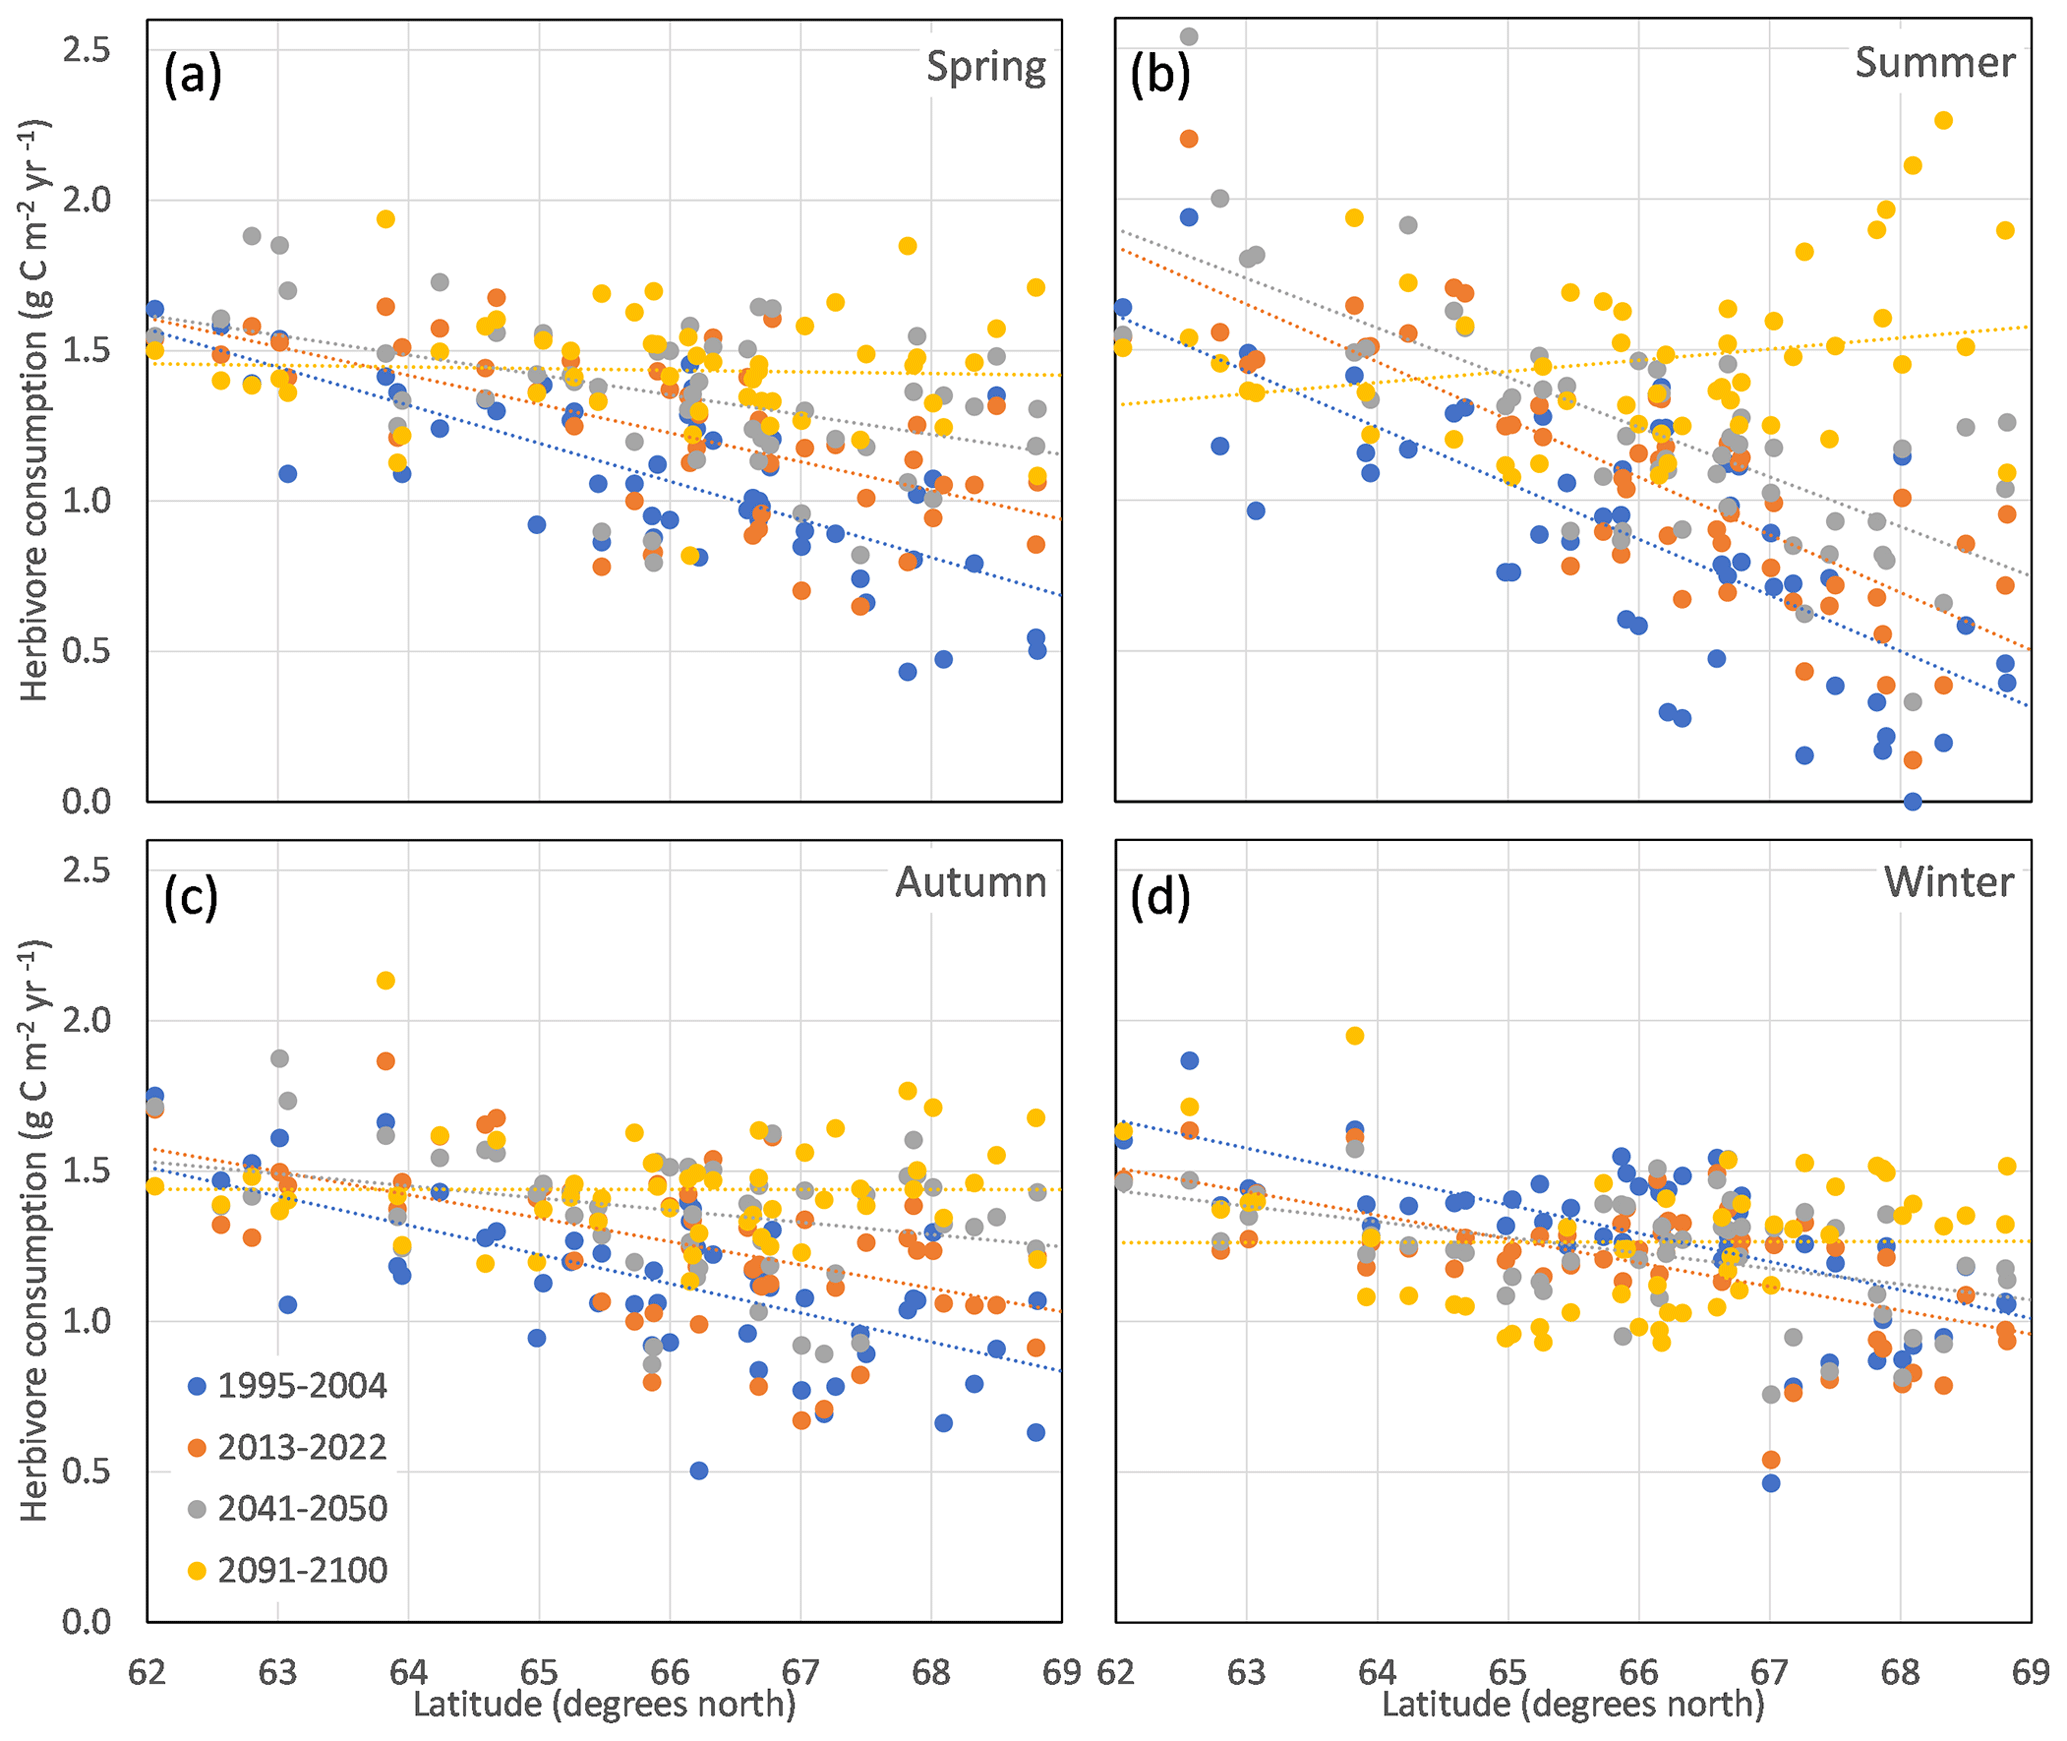
Figure 9Simulated average potential reindeer consumption of leaf biomass in the 51 reindeer-herding communities in Sweden for the different seasonal grazing grounds (a–d) and four time periods (colour) in RCP8.5.
The traditional spring and autumn grazing grounds of the Swedish reindeer-herding communities overlap to a high degree (Fig. 1b), and both have a latitudinal dependency on potential reindeer consumption that is gradually reduced and eventually disappears by the end of the century (Fig. 9a, c). For the summer grazing grounds there is a clear latitudinal dependency that is shifted in parallel (i.e. potential consumption increases uniformly) until the 2041–2050 period, but by the end of the century the latitudinal trend is gone or becomes negative, with higher potential consumption in the northern part of the study region (Fig. 9b). For the winter grazing grounds, the latitudinal dependencies are weak, and the southern communities have a trend of reduced potential grazing over time (Fig. 9d). A more detailed compilation of the changes in the individual communities is given in Sect. S8.
The simulated changes in vegetation composition at the end of the century are extensive in our high-emission RCP8.5 scenario. For instance, we see a successive change in forest composition, from a cover of almost purely evergreen trees to a cover containing a larger fraction of broadleaf and mixed forest by the end of the century at the alpine Fulu and low-elevation Muddus and Björnlandet hotspots. In Sweden, conifers are highly favoured by forestry for traditional and economic reasons, although pine forest regenerations are already encountering large problems (e.g. from moose grazing and diseases), which can further contribute to an increase in broadleaf forests in the future (Ara et al., 2022). Our results show that a profound vegetation change will occur at the southern alpine hotspots Vindeln, Helags and Fulu, with the most dramatic changes projected for Helags and Vindeln. Here, rapid tree growth and expansion are observed in this scenario, with only a few tundra-denoted grids remaining by 2091–2100. This change is also associated with a strong reduction in landscape diversity, as indicated by a decrease in the vegetation-class-based Shannon diversity index. Today, the largest continuous Fennoscandian low arctic tundra areas are found between the Swedish high mountains and the border between Finland and Sweden at latitudes around 68.5° N and in the northern and western parts of the Finnmarksvidda plateau in the north of Norway. In a changed climate, the edges of the tundra area have probably become “Scandinavianized” (Vuorinen et al., 2017); i.e. the coverage of dwarf birches and lichens has decreased, while the Ericaceae species have increased. In the simulations, the tundra remaining in Helags and Vindeln will be dominated by needleleaf evergreen shrubs with just a few scattered sedge tundra areas (e.g. wet tundra areas). These results are similar to the results from long-term warming experiments and monitoring plots in the northern Scandes, where most communities showed a “heathification” with time, both in the experimental warming and under ambient conditions subjected to the ongoing temperature increase (Scharn et al., 2021). In Fulu, the relatively extensive alpine tundra areas are situated just above the treeline today, and here the tundra will be completely lost following RCP8.5. Thus, with a continued warming of up to 5 K to the end of the century in our model domain, which is not totally unlikely as the world is currently on track to reach a global warming of 2.9 K (United Nations Environment Programme, 2023) and given the Arctic warming amplification (Rantanen et al., 2022), the Fennoscandian vegetation is likely to undergo rapid shifts.
The simulated change in the extent of vegetation zones is driven by establishment of PFTs, but the richness of newly established vegetation depends on the migration of all associated types of organisms. The distance species need to spread to keep up with the shifts in climate is much shorter in mountainous regions than in flat regions, and since the ability to spread and inhabit new regions varies among species, a loss in species richness only occurs if new immigrants are stronger competitors than the intrinsic species (Pauli and Halloy, 2019). Although total reported species richness is the largest in the Helags biodiversity hotspot area and the lowest in Vindeln, both have equal fractions of alpine species. Despite the fact that the analysis portal is the best available database, it should be kept in mind that the data obtained from the analysis portal rely on what has been reported by a large community of public and professional naturalists, which means that biases can exist, e.g. depending on the specific biological interests of rapporteurs visiting the different areas. As they share the same trajectories, it seems likely that the homogenization of the vegetation composition in the Helags and Vindeln areas will lead to profound shifts in the conditions for many species, especially for the alpine species occurring here. In contrast to the southern alpine hotspots, our modelling results indicate that the northernmost hotspot area Abisko likely will retain large areas of alpine vegetation at higher elevations, and its landscape diversity could even increase slightly. A substantial transformation of the vegetation cover is however also expected for Abisko. This includes shrubification, a process that has already been observed in this region (Hedenås et al., 2011; Rundqvist et al., 2011; Scharn et al., 2022, 2021), and the broadleaf forest moving up well above 1000 m a.s.l. from the current level of about 600–800 m (Callaghan et al., 2013), a treeline advance that has also been noted in local high-resolution simulations of Abisko (Gustafson et al., 2021). Abisko is the hotspot with the largest fraction of threatened alpine species in our study, and, given the large elevation span in the region, there are possibilities that some species may survive in microrefugia (Mee and Moore, 2014). Our results imply that a revision of the red-list and threatened species categories is urgent. This is because many of the alpine species in the hotspot areas that are not listed today will be threatened as warming continues (Schwager and Berg, 2019).
The simulated potential reindeer consumption shows a striking increase in the summer grazing ground north of ca. 65.5° N. Although the simulated potential reindeer consumption is high, it is in the range of what can be estimated from the current reindeer population in Sweden. Today, reindeer husbandry is practised in about 50 % of the Swedish land area (i.e. 225 000 km2, https://www.sametinget.se/rennaring_sverige, last access: 26 February 2024), and the population is 225 000–280 000 animals in winter (https://www.sametinget.se/rennaring_sverige, last access: 26 February 2024). With a consumption of 3–5 kg biomass per reindeer per day (Yu et al., 2017), this equals to an average total consumption over the area of about 0.8 g C m−2 yr−1, a number likely underestimated as the livestock is larger in summer before autumn slaughter. However, in our simulations of potential reindeer winter consumption, the trends were weak both in latitude and in time. Using a constant herbivory intensity in the simulations means that the potential reindeer consumption shown represents a hypothetical case in which we investigate how much would be consumed of the amount that is actually present if the same number of reindeers and the same amount of food of the same quality are present in all grid cells. This means that we have not considered mitigation and adaptation factors that may be of great importance, such as climate feedbacks on the population size and changes in what land areas the reindeer feed (Bråthen et al., 2017; Speed et al., 2019). Reindeer grazing, browsing and trampling may also cause indirect feedback to the climate by affecting the vegetation and ground properties, which in turn affects snow cover, albedo, carbon cycling and biogenic volatile organic compound emissions (Brachmann et al., 2023; Holmgren et al., 2023). The representation of available reindeer food in the forested winter grazing grounds is challenging. In our simulations, the potential reindeer consumption mainly consists of grasses that occur for a period after the random disturbances (with an average 150-year interval), but grasses are not the preferred reindeer food during winter. Instead, reindeer eat lichens in winter, which naturally can form dense layers under forests in the region. Current forest management, creating a dense and uniform tree cover, disturbs the growth of lichens (Kumpula et al., 2014). Furthermore, our weak trends during winter also depend on a delicate balance between a general increased productivity and higher density of the tree canopies. This balance is also important for the implementation of ground lichen PFTs, since there is a negative relationship between forest density and lichen abundance (Sandström et al., 2016). Thus, future improvements to simulations considering reindeer grazing would need the following: a better representation of winter forage by developing a new lichen PFT (e.g. Porada et al., 2016), an improved light-interception scheme, forest management functionality and scenarios (e.g. Lindeskog et al., 2021), and a representation of restricted access to the field and bottom-layer vegetation during periods of difficult snow conditions. Although the simulated potential reindeer consumption does not show dramatic shifts over the simulated period, reindeer herding will nevertheless experience climate- and weather-related challenges in the future with e.g. concerns about hot and dry summers, more frequent freeze–thaw cycles and rain-on-snow events during winters, and expanding and denser forests (Käyhkö and Horstkotte, 2017; Rosqvist et al., 2021). Thus, to be able to tackle and understand future challenges for reindeer herding this not only suggests a need to include trophic interactions in models, but it also suggests that it is crucial to evaluate the impact of extreme events on other important aspects of the environment for reindeer herding other than vegetation state alone.
We show the benefit of using high-resolution climate data to drive our DVM, enabling the simulation of a diverse landscape, exemplified by our hotspot analysis (which would have less than four grid cells at a typical RCM resolution of 50 × 50 km). Climate representation has also improved. In particular, the simulated precipitation patterns in coastal and mountain areas as well as the ratio between snow and rainfall at high altitude show significantly better agreement with observations at higher resolutions (Lind et al., 2020). Thus, highly resolved climate data in combination with a state-of-the-art dynamical vegetation model clearly contribute to a better understanding of climate–vegetation interactions in mountainous regions.
Using the detailed classification from GLCE, the accuracy scores for the simulated vegetation classes compared to the satellite product are low. For such a large area and high resolution as in the present study, an evaluation against satellite products is the only alternative with a complete coverage, but the satellite classes cannot be considered a real “ground truth”. An example of possible misclassification of the GLCE data is clear from the fact that the mountain birch forest in some of the valleys is classified as shrub vegetation, most clearly seen for Abisko and Vindeln when compared to the official vector-based maps. The shrub and tundra ecosystems have many subclasses, and the model has some difficulty in reproducing the satellite-based pattern for these. Furthermore, the parameterization of the PFTs representing these systems is based on global or regional implementations driven by monthly climate data at coarse spatial scale (Wolf et al., 2008; Zhang et al., 2013), and it is not surprising that the results call for some model adjustment. The comparisons of results from the simulations with and without reindeer presence against exclosure site data do not show conclusive results. By only removing leaf biomass, we may have underestimated the effect of browsing, which particularly affects the height development of deciduous shrubs (Vowles et al., 2017). To study the effect of reindeer exclosures in situ also has some experimental constraints and uncertainty (Stark et al., 2023), e.g. as other grazers like the hare or the lemming can also have a significant impact on the vegetation (Olofsson et al., 2012; Vowles et al., 2016). A further limitation of the vegetation simulations is that a soil layer is always present. The strong expansion of shrubs on former bare soil and rock and permanent snow/ice classes, e.g. as predicted for the Abisko area, is, therefore, probably overestimated, and instead parts of this area would become some type of tundra associated with shallow soils. Dispersal capacity and fire disturbance are also factors that may restrict vegetation expansion, as integration of these processes into an extrapolation of current trends in Alaska and western Canada reduced the predicted shrub expansion on non-shrub tundra from 39 % to 25 % by 2100 (Liu et al., 2022). In LPJ-GUESS, new PFTs can establish when climatic conditions are met, as we assume seeds are always present. Taking seed dispersal into account will in general slow down migration rates (Epstein et al., 2007; Zani et al., 2022). In mountainous terrain the distances will, however, be shorter and less dependent on dispersal capacity, e.g. reflected in abounded observations of tree seedlings more than 100 m above the treeline in Scandinavian mountains (Hofgaard et al., 2009). The disturbance return interval is an important and uncertain parameter that varies in time and space, which affects carbon stocks, the balance between shade-tolerant and shade-intolerant species, and plant establishment (Pugh et al., 2019). Recent studies have suggested longer intervals (Pugh et al., 2019), but there are also studies that show fire return intervals of 50–90 years in boreal forest in Sweden (Dubber et al., 2017). There are also a lot of other activities that may prevent the establishment of new plants, like soil processes, seed predation, plant browsing and mortality caused by smaller animals like rodents and hares, pests, pathogens, snow damage, moose, et cetera, which could be of potential importance. There is also a positive bias in the nitrogen deposition scenario (Andersson et al., 2024) that could have further enhanced the simulated rate at which higher vegetation types expand (Gustafson et al., 2021). In the boreal forest region, the simulations have a higher fraction of broadleaf trees than the reference. A reason for this is that more than 90 % of these forests are managed, and needleleaf trees are favoured in planting and thinning (Hannerz and Ekström, 2021), whereas the simulations represent natural, unmanaged vegetation where broadleaf trees are common during the regeneration phase after disturbances in boreal forest (Angelstam and Kuuluvainen, 2004). However, notwithstanding these limitations, our simulations clearly show that for Fennoscandia, the RCP8.5 pathway results in more prominent temperate features in the boreal forest and that these will expand northwards and to higher altitudes, resulting in a significant loss in tundra.
Our application of highly resolved climate data greatly improved both the representation of climate conditions and the variation in simulated vegetation in mountainous landscapes. Climate and environmental change consistent with the high-emission RCP8.5 scenario could cause dramatic shifts in the vegetation composition of the Fennoscandian boreal and mountain regions, with consequences for reindeer herding, forestry and tourism sectors, how we should practise conservation, and how we should manage our northern ecosystems. Indeed, these changes have already started and been observed, but they will accelerate during the 21st century. Following a climate trajectory in line with RCP8.5, the southern and lower-elevation parts of the Fennoscandian mountain range that today have tundra vegetation will be covered by forests in the coming century, while high-elevation regions will undergo intense shrubification. In the northern tundra regions, most vegetation types will still be present at the end of the century but will shift in altitude and be compressed to smaller regions. This will threaten already-vulnerable species, especially those with slow dispersal rates and low competitive ability. In the southern part of the study area a massive loss of alpine habitats and species is expected. The question is rather what new vegetation types and species could occupy this area under continued climate change. There is, however, uncertainty at many levels in this type of study: what emission scenario will the future hold, and is it adequately interpreted by the global and regional climate models? Is the vegetation's direct response to climate, CO2 concentration and nitrogen deposition adequately described in the DVM? How will secondary effects of climate change alter disturbance patterns and land use? Due to computational limitations in this high-resolution application, it has not been possible to quantify these uncertainties (e.g. we only have one climate scenario), but it is clear from our results and those from previous studies that all these aspects are important. The direction in which the results point is, however, clear in most aspects. The rate of actual vegetation changes will also depend on factors such as forest management, reindeer husbandry, other disturbances (such as fire) and the dispersal rate of different species. Our results indicate trends towards increasing amounts of suitable reindeer forage, at least in northern Sweden, but other changes resulting from climate change, such as the extent of open landscapes, heat stress and altered snow conditions, are likely to impact reindeer-herding practises more than forage availability. The expected and potentially additive pressures of environmental changes call for scenario-based research where the main drivers of the development, including climate change, air pollution, land use and ecological processes, are considered in a consistent framework.
The LPJ-GUESS code used and developed in this study is archived in the LPJ-GUESS community repository on Zenodo: https://doi.org/10.5281/zenodo.8262590 (Lagergren et al., 2023). More information about the model can be found at https://web.nateko.lu.se/lpj-guess (last access: 26 February 2024).
A selection of the MATCH-BIODIV dataset and the MATCH-ECLAIRE (Engardt et al., 2017) datasets is archived in Zenodo (MATCH-BIODIV: https://zenodo.org/record/7573171, Andersson et al., 2023, and MATCH-ECLAIRE: https://doi.org/10.5281/zenodo.4501636, Engardt and Simpson, 2021). The ALADIN and AROME HCLIM climate datasets (Lind et al., 2023) and the complete MATCH-BIODIV nitrogen deposition dataset (Andersson et al., 2024) were generously shared with the authors but are not publicly accessible; the data can be accessed upon inquiry to the authors. The ECLIPSE V6b nitrogen deposition data are available from IIASA (https://previous.iiasa.ac.at/web/home/research/researchPrograms/air/ECLIPSEv6b.html, Klimont and Heyes, 2024), and the NGCD data used for bias correction of temperature can be accessed from the MET Norway Thredds Service (https://thredds.met.no/thredds/catalog/ngcd/catalog.html, Norwegian Meteorological Institute, 2024). The FAO soil texture data are available on the SURFEX site (https://www.umr-cnrm.fr/surfex/spip.php?article135, SURFEX, 2024). The Corine land cover data (https://doi.org/10.2909/960998c1-1870-4e82-8051-6485205ebbac, Copernicus, 2019) and the GLCE product for northern Eurasia (https://forobs.jrc.ec.europa.eu/glc2000/data, Bartalev, 2024) are freely available. The GIS data of reindeer-herding communities were obtained after personal contact with Peter Benson from the Swedish Sami Parliament (https://www.sametinget.se, last access: 26 February 2024) but are not freely available. Vegetation cover data (Vowles et al., 2017) can be accessed through Environment Climate Data Sweden (https://doi.org/10.5879/ECDS/2017-01-29.1/0, Vowles, 2018). The biomass data from the exclosure sites are not available to the public but can be accessed by personal contact with the authors (Robert G. Björk). Species observations for the hotspots are available on the Artdatabanken Species Observation System (https://artportalen.se/, Artdatabanken, 2021). Model simulation results with LPJ-GUESS for this paper are stored on DataGURU: https://doi.org/10.18161/j395-1j66 (Lagergren and Miller, 2023).
The supplement related to this article is available online at: https://doi.org/10.5194/bg-21-1093-2024-supplement.
FL and PAM designed the study with contributions from RGB, CA, MPB, EK, HP and GR. FL carried out the vegetation model development, setup, runs and data analysis with support from PAM. RGB extracted and analysed the biodiversity data with help from MPB and HP. DB, PL and DL provided the climate scenario and associated soil and vegetation attributes. CA and TO provided high-resolution nitrogen deposition data. FL carried out bias correction and filling of continuous climate and nitrogen deposition data with advice from DB, EK and CA. RGB, MPB and GR contributed with expertise in reindeer husbandry and its interaction with the vegetation. FL prepared the paper with input from all co-authors.
The contact author has declared that none of the authors has any competing interests.
Publisher’s note: Copernicus Publications remains neutral with regard to jurisdictional claims made in the text, published maps, institutional affiliations, or any other geographical representation in this paper. While Copernicus Publications makes every effort to include appropriate place names, the final responsibility lies with the authors.
The work is a contribution to the strategic research areas MERGE and BECC, and the nature-based future solutions profile area hosted by Lund University. We thank Peter Benson at Sametinget for providing data of the reindeer husbandry districts in Sweden and Mora Aronsson, Debora Arlt and Johan Nilsson for advice regarding the extraction of data from the Analysis Portal for Biodiversity Data. We also thank Leanne van der Kuijl for a valuable review as part of a graduate course at Wageningen University & Research.
This work was supported by the BioDiv-Support project funded through the 2017–2018 Belmont Forum and BiodivERsA joint call for research proposals, under the BiodivScen ERA-Net COFUND programme, the Svenska Forskningsrådet Formas (grant nos. 2018-02434, 2018-02436, 2018-02437 and 2018-02438), the Academy of Finland (grant no. 326328), the Agence Nationale de la Recherche (grant no. ANR-18-EBI4-0007), the Bundesministerium für Bildung und Forschung (KFZ, grant no. 01LC1810A), and the Ministerio de Ciencia e Innovación (APCIN, grant no. PCI2018-093149).
This paper was edited by Bertrand Guenet and reviewed by two anonymous referees.
Andersson, C., Langner, J., and Bergström, R.: Interannual variation and trends in air pollution over Europe due to climate variability during 1958–2001 simulated with a regional CTM coupled to the ERA40 reanalysis, Tellus B, 59, 77–98, https://doi.org/10.1111/j.1600-0889.2006.00231.x, 2007.
Andersson, C., Bergström, R., Bennet, C., Robertson, L., Thomas, M., Korhonen, H., Lehtinen, K. E. J., and Kokkola, H.: MATCH-SALSA – Multi-scale Atmospheric Transport and CHemistry model coupled to the SALSA aerosol microphysics model – Part 1: Model description and evaluation, Geosci. Model Dev., 8, 171–189, https://doi.org/10.5194/gmd-8-171-2015, 2015.
Andersson, C., Belusic, D., Kjellström, E., Lagergren, F., Lind, P., Lindstedt, D., Miller, P., and Olenius, T.: BioDiv-Support: Webtool dataset v1.0 (v1.0), Zenodo [data set], https://doi.org/10.5281/zenodo.7573171, 2023.
Andersson, C., Olenius, T., Alpfjord Wylde, H., Almroth Rosell, E., Björk, R. G., Björkman, M. P., Moldan, F., and Engardt, M.: Long-term reanalysis, future scenarios and impacts of nitrogen deposition on northern European ecosystems including the Baltic Sea and the Scandinavian Mountains, in preparation, 2024.
Angelstam, P. and Kuuluvainen, T.: Boreal forest disturbance regimes, successional dynamics and landscape structures – a European perspective, Ecol. Bull., 51, 117–136, https://www.jstor.org/stable/20113303 (last access: 26 February 2024), 2004.
Ara, M., Barbeito, I., Kalén, C., and Nilsson, U.: Regeneration failure of Scots pine changes the species composition of young forests, Scandinavian J. Forest Res., 37, 14–22, https://doi.org/10.1080/02827581.2021.2005133, 2022.
Artdatabanken (Swedish University of Agricultural Sciences): Species Observation System, Artdatabanken [data set], https://artportalen.se/, data retrieved: 29 October 2021.
Bartalev, S.: Global Land Cover 2000 – Download, Northern Eurasia v4.0, European Commission [data set], https://forobs.jrc.ec.europa.eu/glc2000/data, last access: 26 February 2024.
Bartalev, S. A., Belward, A. S., Erchov, D. V., and Isaev, A. S.: A new SPOT4-VEGETATION derived land cover map of Northern Eurasia, Int. J. Remote Sens., 24, 1977–1982, https://doi.org/10.1080/0143116031000066297, 2003.
Barthelemy, H., Stark, S., Michelsen, A., and Olofsson, J.: Urine is an important nitrogen source for plants irrespective of vegetation composition in an Arctic tundra: Insights from a N-15-enriched urea tracer experiment, J. Ecol., 106, 367–378, https://doi.org/10.1111/1365-2745.12820, 2018.
Belušić, D., de Vries, H., Dobler, A., Landgren, O., Lind, P., Lindstedt, D., Pedersen, R. A., Sánchez-Perrino, J. C., Toivonen, E., van Ulft, B., Wang, F., Andrae, U., Batrak, Y., Kjellström, E., Lenderink, G., Nikulin, G., Pietikäinen, J.-P., Rodríguez-Camino, E., Samuelsson, P., van Meijgaard, E., and Wu, M.: HCLIM38: a flexible regional climate model applicable for different climate zones from coarse to convection-permitting scales, Geosci. Model Dev., 13, 1311–1333, https://doi.org/10.5194/gmd-13-1311-2020, 2020.
Bjorkman, A. D., Myers-Smith, I. H., Elmendorf, S. C., Normand, S., Rueger, N., Beck, P. S. A., Blach-Overgaard, A., Blok, D., Cornelissen, J. H. C., Forbes, B. C., Georges, D., Goetz, S. J., Guay, K. C., Henry, G. H. R., HilleRisLambers, J., Hollister, R. D., Karger, D. N., Kattge, J., Manning, P., Prevey, J. S., Rixen, C., Schaepman-Strub, G., Thomas, H. J. D., Vellend, M., Wilmking, M., Wipf, S., Carbognani, M., Hermanutz, L., Levesque, E., Molau, U., Petraglia, A., Soudzilovskaia, N. A., Spasojevic, M. J., Tomaselli, M., Vowles, T., Alatalo, J. M., Alexander, H. D., Anadon-Rosell, A., Angers-Blondin, S., te Beest, M., Berner, L., Bjork, R. G., Buchwal, A., Buras, A., Christie, K., Cooper, E. J., Dullinger, S., Elberling, B., Eskelinen, A., Frei, E. R., Grau, O., Grogan, P., Hallinger, M., Harper, K. A., Heijmans, M. M. P. D., Hudson, J., Huelber, K., Iturrate-Garcia, M., Iversen, C. M., Jaroszynska, F., Johnstone, J. F., Jorgensen, R. H., Kaarlejarvi, E., Klady, R., Kuleza, S., Kulonen, A., Lamarque, L. J., Lantz, T., Little, C. J., Speed, J. D. M., Michelsen, A., Milbau, A., Nabe-Nielsen, J., Nielsen, S. S., Ninot, J. M., Oberbauer, S. F., Olofsson, J., Onipchenko, V. G., Rumpf, S. B., Semenchuk, P., Shetti, R., Collier, L. S., Street, L. E., Suding, K. N., Tape, K. D., Trant, A., Treier, U. A., Tremblay, J.-P., Tremblay, M., Venn, S., Weijers, S., Zamin, T., Boulanger-Lapointe, N., Gould, W. A., Hik, D. S., Hofgaard, A., Jonsdottir, I. S., Jorgenson, J., Klein, J., Magnusson, B., Tweedie, C., Wookey, P. A., Bahn, M., Blonder, B., van Bodegom, P. M., Bond-Lamberty, B., Campetella, G., Cerabolini, B. E. L., Chapin III, F. S., Cornwell, W. K., Craine, J., Dainese, M., de Vries, F. T., Diaz, S., Enquist, B. J., Green, W., Milla, R., Niinemets, U., Onoda, Y., Ordonez, J. C., Ozinga, W. A., Penuelas, J., Poorter, H., Poschlod, P., Reich, P. B., Sande, B., Schamp, B., Sheremetev, S., and Weiher, E.: Plant functional trait change across a warming tundra biome, Nature, 562, 57–62, https://doi.org/10.1038/s41586-018-0563-7, 2018.
Bjorkman, A. D., García, C. M., Myers-Smith, I. H., Ravolainen, V., Svala Jónsdóttir, I., Westergaard, K. B., Lawler, J. P., Aronsson, M., Bennett, B., Gardfjell, H., Heiðmarsson, S., Stewart, L., and Normand, S.: Status and trends in Arctic vegetation: Evidence from experimental warming and long-term monitoring, Ambio, 49, 678–692, https://doi.org/10.1007/s13280-019-01161-6, 2020.
Brachmann, C. G., Vowles, T., Rinnan, R., Björkman, M. P., Ekberg, A., and Björk, R. G.: Herbivore–shrub interactions influence ecosystem respiration and biogenic volatile organic compound composition in the subarctic, Biogeosciences, 20, 4069–4086, https://doi.org/10.5194/bg-20-4069-2023, 2023.
Bråthen, K. A., Ravolainen, V. T., Stien, A., Tveraa, T., and Ims, R. A.: Rangifer management controls a climate-sensitive tundra state transition, Ecol. Appl., 27, 2416–2427, https://doi.org/10.1002/eap.1618, 2017.
Callaghan, T. V., Jonasson, C., Thierfelder, T., Yang, Z., Hedenås, H., Johansson, M., Molau, U., Van Bogaert, R., Michelsen, A., Olofsson, J., Gwynn-Jones, D., Bokhorst, S., Phoenix, G., Bjerke, J. W., Tømmervik, H., Christensen, T. R., Hanna, E., Koller, E. K., and Sloan, V. L.: Ecosystem change and stability over multiple decades in the Swedish subarctic: complex processes and multiple drivers, Philos. T. R. Soc. B, 368, 20120488, https://doi.org/10.1098/rstb.2012.0488, 2013.
Callaghan, T. V., Gatti, R. C., and Phoenix, G.: The need to understand the stability of arctic vegetation during rapid climate change: An assessment of imbalance in the literature, Ambio, 51, 1034–1044, https://doi.org/10.1007/s13280-021-01607-w, 2022.
Congalton, R. G.: A review of assessing the accuracy of classifications of remotely sensed data, Remote Sens. Environ., 37, 35–46, https://doi.org/10.1016/0034-4257(91)90048-b, 1991.
Constable, A. J., Harper, S., Dawson, J., Holsman, K., Mustonen, T., Piepenburg, D., and Rost, B.: Cross-Chapter Paper 6: Polar Regions, in: Climate Change 2022: Impacts, Adaptation and Vulnerability. Contribution of Working Group II to the Sixth Assessment Report of the Intergovernmental Panel on Climate Change, edited by: Pörtner, H.-O., Roberts, D. C., Tignor, M., Poloczanska, E. S., Mintenbeck, K., Alegría, A., Craig, M., Langsdorf, S., Löschke, S., Möller, V., Okem, A., and Rama, B., Cambridge University Press, Cambridge, UK and New York, NY, USA, 2319–2368, https://doi.org/10.1017/9781009325844.023, 2022.
Copernicus: CORINE Land Cover 2018 (raster 100 m), Europe, 6-yearly, Copernicus [data set], https://doi.org/10.2909/960998c1-1870-4e82-8051-6485205ebbac, 2019.
Denryter, K. A., Cook, R. C., Cook, J. G., and Parker, K. L.: Straight from the caribou's (Rangifer tarandus) mouth: detailed observations of tame caribou reveal new insights into summer-autumn diets, Can. J. Zool., 95, 81–94, https://doi.org/10.1139/cjz-2016-0114, 2017.
Dobrowski, S. Z., Littlefield, C. E., Lyons, D. S., Hollenberg, C., Carroll, C., Parks, S. A., Abatzoglou, J. T., Hegewisch, K., and Gage, J.: Protected-area targets could be undermined by climate change-driven shifts in ecoregions and biomes, Commun. Earth Environ., 2, 198, https://doi.org/10.1038/s43247-021-00270-z, 2021.
Dubber, W., Eklundh, L., and Lagergren, F.: Comparing field inventory with mechanistic modelling and light-use efficiency modelling based approaches for estimating forest net primary productivity at a regional level, Boreal Environ. Res., 22, 337–352, 2017.
Egelkraut, D., Barthelemy, H., and Olofsson, J.: Reindeer trampling promotes vegetation changes in tundra heathlands: Results from a simulation experiment, J. Veg. Sci., 31, 476–486, https://doi.org/10.1111/jvs.12871, 2020.
Eichler, A., Legrand, M., Jenk, T. M., Preunkert, S., Andersson, C., Eckhardt, S., Engardt, M., Plach, A., and Schwikowski, M.: Consistent histories of anthropogenic western European air pollution preserved in different Alpine ice cores, The Cryosphere, 17, 2119–2137, https://doi.org/10.5194/tc-17-2119-2023, 2023.
Elmendorf, S. C., Henry, G. H. R., Hollister, R. D., Björk, R. G., Boulanger-Lapointe, N., Cooper, E. J., Cornelissen, J. H. C., Day, T. A., Dorrepaal, E., Elumeeva, T. G., Gill, M., Gould, W. A., Harte, J., Hik, D. S., Hofgaard, A., Johnson, D. R., Johnstone, J. F., Jonsdottir, I. S., Jorgenson, J. C., Klanderud, K., Klein, J. A., Koh, S., Kudo, G., Lara, M., Levesque, E., Magnusson, B., May, J. L., Mercado-Diaz, J. A., Michelsen, A., Molau, U., Myers-Smith, I. H., Oberbauer, S. F., Onipchenko, V. G., Rixen, C., Schmidt, N. M., Shaver, G. R., Spasojevic, M. J., Porhallsdottir, P. E., Tolvanen, A., Troxler, T., Tweedie, C. E., Villareal, S., Wahren, C.-H., Walker, X., Webber, P. J., Welker, J. M., and Wipf, S.: Plot-scale evidence of tundra vegetation change and links to recent summer warming, Nat. Clim. Change, 2, 453–457, https://doi.org/10.1038/nclimate1465, 2012.
Engardt, M. and Simpson, D.: Deposition of sulphur and nitrogen in Europe 1900–2050. Model calculations with EMEP and MATCH models, Zenodo [data set], https://doi.org/10.5281/zenodo.4501636, 2021.
Engardt, M., Simpson, D., Schwikowski, M., and Granat, L.: Deposition of sulphur and nitrogen in Europe 1900–2050. Model calculations and comparison to historical observations, Tellus B, 69, 1328945, https://doi.org/10.1080/16000889.2017.1328945, 2017.
Epstein, H. E., Yu, Q., Kaplan, J. O., and Lischke, H.: Simulating future changes in Arctic and subarctic vegetation, Comput. Sci. Eng., 9, 12–23, https://doi.org/10.1109/mcse.2007.84, 2007.
Eriksson, O., Niva, M., and Caruso, A.: Use and abuse of reindeer range, Acta Phytogeographica Suecica, 87, 1–110, 2007.
Faroux, S., Kaptué Tchuenté, A. T., Roujean, J.-L., Masson, V., Martin, E., and Le Moigne, P.: ECOCLIMAP-II/Europe: a twofold database of ecosystems and surface parameters at 1 km resolution based on satellite information for use in land surface, meteorological and climate models, Geosci. Model Dev., 6, 563–582, https://doi.org/10.5194/gmd-6-563-2013, 2013.
Feeley, K. J., Silman, M. R., Bush, M. B., Farfan, W., Cabrera, K. G., Malhi, Y., Meir, P., Revilla, N. S., Quisiyupanqui, M. N. R., and Saatchi, S.: Upslope migration of Andean trees, J. Biogeogr., 38, 783–791, https://doi.org/10.1111/j.1365-2699.2010.02444.x, 2011.
Ferraro, K. M., Schmitz, O. J., and McCary, M. A.: Effects of ungulate density and sociality on landscape heterogeneity: a mechanistic modeling approach, Ecography, 2022, e06039, https://doi.org/10.1111/ecog.06039, 2022.
Flower-Ellis, J. G. K. and Olsson, L.: Estimation of volume, total and projected area of Scots pine needles from their regression on length, Studia Forestalia Suecica, 190, 1–19, 1993.
Fohringer, C., Rosqvist, G., Inga, N., and Singh, N. J.: Reindeer husbandry in peril?–How extractive industries exert multiple pressures on an Arctic pastoral ecosystem, People and Nature, 3, 872–886, https://doi.org/10.1002/pan3.10234, 2021.
George, J.-P., Yang, W., Kobayashi, H., Biermann, T., Carrara, A., Cremonese, E., Cuntz, M., Fares, S., Gerosa, G., Grünwald, T., Hase, N., Heliasz, M., Ibrom, A., Knohl, A., Kruijt, B., Lange, H., Limousin, J.-M., Loustau, D., Lukeš, P., Marzuoli, R., Mölder, M., Montagnani, L., Neirynck, J., Peichl, M., Rebmann, C., Schmidt, M., Serrano, F. R. L., Soudani, K., Vincke, C., and Pisek, J.: Method comparison of indirect assessments of understory leaf area index (LAI(u)): A case study across the extended network of ICOS forest ecosystem sites in Europe, Ecol. Indic., 128, 107841, https://doi.org/10.1016/j.ecolind.2021.107841, 2021.
Gustafson, A., Miller, P. A., Björk, R. G., Olin, S., and Smith, B.: Nitrogen restricts future sub-arctic treeline advance in an individual-based dynamic vegetation model, Biogeosciences, 18, 6329–6347, https://doi.org/10.5194/bg-18-6329-2021, 2021.
Hannerz, M. and Ekström, H.: Nordic Forest Statistics 2020 – Resources, Industry, Trade, Conservation, and Climate, Nordic Forest Research, 32 pp., https://nordicforestresearch.org/wp-content/uploads/2021/03/Nordisk-skogsstatistik-3.pdf (last access: 26 February 2024), 2021.
Hazeleger, W., Severijns, C., Semmler, T., Þtefanescu, S., Yang, S., Wang, X., Wyser, K., Dutra, E., Baldasano, J. M., Bintanja, R., Bougeault, P., Caballero, R., Ekman, A. M. L., Christensen, J. H., van den Hurk, B., Jimenez, P., Jones, C., Kållberg, P., Koenigk, T., McGrath, R., Miranda, P., Van Noije, T., Palmer, T., Parodi, J. A., Schmith, T., Selten, F., Storelvmo, T., Sterl, A., Tapamo, H., Vancoppenolle, M., Viterbo, P., and Willén, U.: EC-Earth A Seamless Earth-System Prediction Approach in Action, B. Am. Meteorol. Soc., 91, 1357–1363, https://doi.org/10.1175/2010bams2877.1, 2010.
Hazeleger, W., Wang, X., Severijns, C., Þtefanescu, S., Bintanja, R., Sterl, A., Wyser, K., Semmler, T., Yang, S., van den Hurk, B., van Noije, T., van der Linden, E., and van der Wiel, K.: EC-Earth V2.2: description and validation of a new seamless earth system prediction model, Clim. Dynam., 39, 2611–2629, https://doi.org/10.1007/s00382-011-1228-5, 2012.
Hedenås, H., Olsson, H., Jonasson, C., Bergstedt, J., Dahlberg, U., and Callaghan, T. V.: Changes in Tree Growth, Biomass and Vegetation Over a 13-Year Period in the Swedish Sub-Arctic, Ambio, 40, 672–682, https://doi.org/10.1007/s13280-011-0173-1, 2011.
Hickler, T., Vohland, K., Feehan, J., Miller, P. A., Smith, B., Costa, L., Giesecke, T., Fronzek, S., Carter, T. R., Cramer, W., Kühn, I., and Sykes, M. T.: Projecting the future distribution of European potential natural vegetation zones with a generalized, tree species-based dynamic vegetation model, Global Ecol. Biogeogr., 21, 50–63, https://doi.org/10.1111/j.1466-8238.2010.00613.x, 2012.
Hofgaard, A., Dalen, L., and Hytteborn, H.: Tree recruitment above the treeline and potential for climate-driven treeline change, J. Veg. Sci., 20, 1133–1144, https://doi.org/10.1111/j.1654-1103.2009.01114.x, 2009.
Höglund-Isaksson, L., Gómez-Sanabria, A., Klimont, Z., Rafaj, P., and Schöpp, W.: Technical potentials and costs for reducing global anthropogenic methane emissions in the 2050 timeframe – results from the GAINS model, Environmental Research Communications, 2, 025004, https://doi.org/10.1088/2515-7620/ab7457, 2020.
Holmgren, M., Groten, F., Carracedo, M. R., Vink, S., and Limpens, J.: Rewilding Risks for Peatland Permafrost, Ecosystems, 26, 1806–1818, https://doi.org/10.1007/s10021-023-00865-x, 2023.
Hudson, J. M. G. and Henry, G. H. R.: Increased plant biomass in a High Arctic heath community from 1981 to 2008, Ecology, 90, 2657–2663, https://doi.org/10.1890/09-0102.1, 2009.
Huttunen, L., Ayres, M. P., Niemelä, P., Heiska, S., Tegelberg, R., Rousi, M., and Kellomäki, S.: Interactive effects of defoliation and climate change on compensatory growth of silver birch seedlings, Silva Fennica, 47, 964, https://doi.org/10.14214/sf.964, 2013.
IPCC: Annex II: Climate System Scenario Tables, in: Climate Change 2013: The Physical Science Basis. Contribution of Working Group I to the Fifth Assessment Report of the Intergovernmental Panel on Climate Change, edited by: Prather, M., Flato, G., Friedlingstein, P., Jones, C., Lamarque, J.-F., Liao, H., and Rasch, P., Cambridge University Press, Cambridge, United Kingdom and New York, NY, USA, https://doi.org/10.1017/CBO9781107415324, 2013.
IPCC: Climate Change 2014: Synthesis Report. Contribution of Working Groups I, II and III to the Fifth Assessment Report of the Intergovernmental Panel on Climate Change, edited by: Core Writing Team, Pachauri, R. K., and Meyer, L. A., IPCC, Geneve, 151 pp., http://hdl.handle.net/10013/epic.45156.d001 (last access: 26 February 2024), 2014.
Johansson, T.: Biomass production and allometric above- and below-ground relations for young birch stands planted at four spacings on abandoned farmland, Forestry, 80, 41–52, https://doi.org/10.1093/forestry/cpl049, 2007.
Käyhkö, J. and Horstkotte, T.: Reindeer husbandry under global change in the tundra region of Northern Fennoscandia, Publications from the Department of Geography and Geology, University of Turku, 72 pp., https://doi.org/10.13140/RG.2.2.22151.39841, 2017.
Klimont, Z. and Heyes, C.: ECLIPSE V6b global emission fields, IIASA [data set], https://previous.iiasa.ac.at/web/home/research/researchPrograms/air/ECLIPSEv6b.html, last access: 26 February 2024.
Kosztra, B., Büttner, G., Hazeu, G., and Arnold, S.: Updated CLC illustrated nomenclature guidelines, European Topic Centre on Urban, land and soil systems, Environment Agency Austria, 126 pp., https://land.copernicus.eu/content/corine-land-cover-nomenclature-guidelines/docs/pdf/CLC2018_Nomenclature_illustrated_guide_20190510.pdf (last access: 26 February 2024), 2019.
Kullman, L.: Ecological overview of past and recent history of the alpine tree line ecotone and plant cover in the Swedish Scandes, Svensk Botanisk Tidsskrift, 110, 132–272, 2016 (in Swedish with English summary).
Kumpula, J., Kurkilahti, M., Helle, T., and Colpaert, A.: Both reindeer management and several other land use factors explain the reduction in ground lichens (Cladonia spp.) in pastures grazed by semi-domesticated reindeer in Finland, Reg. Environ. Change, 14, 541–559, https://doi.org/10.1007/s10113-013-0508-5, 2014.
Kuuluvainen, T. and Gauthier, S.: Young and old forest in the boreal: critical stages of ecosystem dynamics and management under global change, Forest Ecosystems, 5, 26, https://doi.org/10.1186/s40663-018-0142-2, 2018.
Lagergren, F. and Miller, P. A.: LPJ-GUESS model results with arctic plant functional types (PFTs) for Fennoscandia from the BioDiv-Support project at RCP 8.5, DataGURU [data set], https://doi.org/10.18161/j395-1j66, 2023.
Lagergren, F., Olin, S., and Miller, P. A.: Incorporating reindeer grazing and damage by ozone in LPJ-GUESS for the BioDiv-Support project, Zenodo [code], https://doi.org/10.5281/zenodo.8262590, 2023.
Lamarque, J.-F., Bond, T. C., Eyring, V., Granier, C., Heil, A., Klimont, Z., Lee, D., Liousse, C., Mieville, A., Owen, B., Schultz, M. G., Shindell, D., Smith, S. J., Stehfest, E., Van Aardenne, J., Cooper, O. R., Kainuma, M., Mahowald, N., McConnell, J. R., Naik, V., Riahi, K., and van Vuuren, D. P.: Historical (1850–2000) gridded anthropogenic and biomass burning emissions of reactive gases and aerosols: methodology and application, Atmos. Chem. Phys., 10, 7017–7039, https://doi.org/10.5194/acp-10-7017-2010, 2010.
Lamarque, J. F., Kyle, G. P., Meinshausen, M., Riahi, K., Smith, S. J., van Vuuren, D. P., Conley, A. J., and Vitt, F.: Global and regional evolution of short-lived radiatively-active gases and aerosols in the Representative Concentration Pathways, Climatic Change, 109, 191–212, https://doi.org/10.1007/s10584-011-0155-0, 2011.
Lind, P., Belušiæ, D., Christensen, O. B., Dobler, A., Kjellström, E., Landgren, O., Lindstedt, D., Matte, D., Pedersen, R. A., Toivonen, E., and Wang, F. X.: Benefits and added value of convection-permitting climate modeling over Fenno-Scandinavia, Clim. Dynam., 55, 1893–1912, https://doi.org/10.1007/s00382-020-05359-3, 2020.
Lind, P., Pedersen, R. A., Kjellström, E., Landgren, O., Matte, D., Dobler, A., Belušiæ, D., Médus, E., Wang, F., Christensen, O. B., Christensen, J. H., and Verpe Dyrdal, A.: Climate change information over Fenno-Scandinavia produced with a convection-permitting climate model, Clim. Dynam., 61, 519–541, https://doi.org/10.1007/s00382-022-06589-3, 2023.
Lindeskog, M., Smith, B., Lagergren, F., Sycheva, E., Ficko, A., Pretzsch, H., and Rammig, A.: Accounting for forest management in the estimation of forest carbon balance using the dynamic vegetation model LPJ-GUESS (v4.0, r9710): implementation and evaluation of simulations for Europe, Geosci. Model Dev., 14, 6071–6112, https://doi.org/10.5194/gmd-14-6071-2021, 2021.
Liu, Y., Riley, W. J., Keenan, T. F., Mekonnen, Z. A., Holm, J. A., Zhu, Q., and Torn, M. S.: Dispersal and fire limit Arctic shrub expansion, Nat. Commun., 13, 3843, https://doi.org/10.1038/s41467-022-31597-6, 2022.
Masson, V., Le Moigne, P., Martin, E., Faroux, S., Alias, A., Alkama, R., Belamari, S., Barbu, A., Boone, A., Bouyssel, F., Brousseau, P., Brun, E., Calvet, J.-C., Carrer, D., Decharme, B., Delire, C., Donier, S., Essaouini, K., Gibelin, A.-L., Giordani, H., Habets, F., Jidane, M., Kerdraon, G., Kourzeneva, E., Lafaysse, M., Lafont, S., Lebeaupin Brossier, C., Lemonsu, A., Mahfouf, J.-F., Marguinaud, P., Mokhtari, M., Morin, S., Pigeon, G., Salgado, R., Seity, Y., Taillefer, F., Tanguy, G., Tulet, P., Vincendon, B., Vionnet, V., and Voldoire, A.: The SURFEXv7.2 land and ocean surface platform for coupled or offline simulation of earth surface variables and fluxes, Geosci. Model Dev., 6, 929–960, https://doi.org/10.5194/gmd-6-929-2013, 2013.
McEwan, E. H. and Whitehead, P. E.: Seasonal changes in the energy and nitrogen intake in reindeer and caribou, Can. J. Zool., 48, 905–913, https://doi.org/10.1139/z70-164, 1970.
Mee, J. A. and Moore, J.-S.: The ecological and evolutionary implications of microrefugia, J. Biogeogr., 41, 837–841, https://doi.org/10.1111/jbi.12254, 2014.
Meinshausen, M., Smith, S. J., Calvin, K., Daniel, J. S., Kainuma, M. L. T., Lamarque, J. F., Matsumoto, K., Montzka, S. A., Raper, S. C. B., Riahi, K., Thomson, A., Velders, G. J. M., and van Vuuren, D. P. P.: The RCP greenhouse gas concentrations and their extensions from 1765 to 2300, Climatic Change, 109, 213–241, https://doi.org/10.1007/s10584-011-0156-z, 2011.
Miller, P. A. and Smith, B.: Modelling Tundra Vegetation Response to Recent Arctic Warming, Ambio, 41, 281–291, https://doi.org/10.1007/s13280-012-0306-1, 2012.
Molinari, C., Hantson, S., and Nieradzik, L. P.: Fire Dynamics in Boreal Forests Over the 20th Century: A Data-Model Comparison, Fron. Ecol. Evol., 9, 728958, https://doi.org/10.3389/fevo.2021.728958, 2021.
Myers-Smith, I. H., Forbes, B. C., Wilmking, M., Hallinger, M., Lantz, T., Blok, D., Tape, K. D., Macias-Fauria, M., Sass-Klaassen, U., Lévesque, E., Boudreau, S., Ropars, P., Hermanutz, L., Trant, A., Siegwart Collier, L., Weijers, S., Rozema, J., Rayback, S. A., Schmidt, N. M., Schaepman-Strub, G., Wipf, S., Rixen, C., Ménard, C. B., Venn, S., Goetz, S., Andreu-Hayles, L., Elmendorf, S., Ravolainen, V., Welker, J., Grogan, P., Epstein, H. E., and Hik, D. S.: Shrub expansion in tundra ecosystems: dynamics, impacts and research priorities, Environ. Res. Lett., 6, 045509, https://doi.org/10.1088/1748-9326/6/4/045509, 2011.
Nord, J., Anthoni, P., Gregor, K., Gustafson, A., Hantson, S., Lindeskog, M., Meyer, B., Miller, P., Nieradzik, L., Olin, S., Papastefanou, P., Smith, B., Tang, J., and Wårlind, D.: LPJ-GUESS Release v4.1.1 model code, Zenodo [code], https://doi.org/10.5281/zenodo.8065737, 2021.
Norwegian Meteorological Institute: NGCD – Nordic Gridded Climate Dataset, Norwegian Meteorological Institute [data set], https://thredds.met.no/thredds/catalog/ngcd/catalog.html, last access: 26 February 2024.
Oksanen, L. and Virtanen, R.: Topographic, altitudinal and regional patterns in continental and suboceanic heath vegetation of northern Fennoscandia, Acta Botanica Fennica, 153, 1–80, 1995.
Olofsson, J., Kitti, H., Rautiainen, P., Stark, S., and Oksanen, L.: Effects of summer grazing by reindeer on composition of vegetation, productivity and nitrogen cycling, Ecography, 24, 13–24, https://doi.org/10.1034/j.1600-0587.2001.240103.x, 2001.
Olofsson, J., Oksanen, L., Callaghan, T., Hulme, P. E., Oksanen, T., and Suominen, O.: Herbivores inhibit climate-driven shrub expansion on the tundra, Glob. Change Biol., 15, 2681–2693, https://doi.org/10.1111/j.1365-2486.2009.01935.x, 2009.
Olofsson, J., Tømmervik, H., and Callaghan, T. V.: Vole and lemming activity observed from space, Nat. Clim. Change, 2, 880–883, https://doi.org/10.1038/nclimate1537, 2012.
Ono, J., Watanabe, M., Komuro, Y., Tatebe, H., and Abe, M.: Enhanced Arctic warming amplification revealed in a low-emission scenario, Commun. Earth Environ., 3, 27, https://doi.org/10.1038/s43247-022-00354-4, 2022.
Osuch, M., Lawrence, D., Meresa, H. K., Napiorkowski, J. J., and Romanowicz, R. J.: Projected changes in flood indices in selected catchments in Poland in the 21st century, Stoch. Env. Res. Risk A., 31, 2435–2457, https://doi.org/10.1007/s00477-016-1296-5, 2017.
Pauli, H. and Halloy, S. R. P.: High Mountain Ecosystems Under Climate Change, in: Oxford Research Encyclopedia of Climate Science, edited by: Pauli, H. and Halloy, S. R. P., Oxford University Press, 1–56, https://doi.org/10.1093/acrefore/9780190228620.013.764, 2019.
Pearson, R. G., Phillips, S. J., Loranty, M. M., Beck, P. S. A., Damoulas, T., Knight, S. J., and Goetz, S. J.: Shifts in Arctic vegetation and associated feedbacks under climate change, Nat. Clim. Change, 3, 673–677, https://doi.org/10.1038/nclimate1858, 2013.
Porada, P., Ekici, A., and Beer, C.: Effects of bryophyte and lichen cover on permafrost soil temperature at large scale, The Cryosphere, 10, 2291–2315, https://doi.org/10.5194/tc-10-2291-2016, 2016.
Pugh, T. A. M., Arneth, A., Kautz, M., Poulter, B., and Smith, B.: Important role of forest disturbances in the global biomass turnover and carbon sinks, Nat. Geosci., 12, 730–735, https://doi.org/10.1038/s41561-019-0427-2, 2019.
Qi, Y. L., Wei, W., Chen, C. G., and Chen, L. D.: Plant root-shoot biomass allocation over diverse biomes: A global synthesis, Global Ecology and Conservation, 18, e00606, https://doi.org/10.1016/j.gecco.2019.e00606, 2019.
Rantanen, M., Karpechko, A. Y., Lipponen, A., Nordling, K., Hyvärinen, O., Ruosteenoja, K., Vihma, T., and Laaksonen, A.: The Arctic has warmed nearly four times faster than the globe since 1979, Commun. Earth Environ., 3, 168, https://doi.org/10.1038/s43247-022-00498-3, 2022.
Rasmus, S., Horstkotte, T., Turunen, M., Landauer, M., Löf, A., Lehtonen, I., Rosqvist, G., and Holand, Ø.: Reindeer husbandry and climate change – Challenges for adaptation, in: Reindeer Husbandry and Global Environmental Change – Pastoralism in Fennoscandia, edited by: Horstkotte, T., Holand, Ø., Kumpula, J., and Moen, J., Routledge, London, 99–117, https://doi.org/10.4324/9781003118565-8, 2022.
Robertson, L., Langner, J., and Engardt, M.: An Eulerian limited-area atmospheric transport model, J. Appl. Meteorol., 38, 190–210, https://doi.org/10.1175/1520-0450(1999)038<0190:Aelaat>2.0.Co;2, 1999.
Rosqvist, G. C., Inga, N., and Eriksson, P.: Impacts of climate warming on reindeer herding require new land-use strategies, Ambio, 51, 1247–1262, https://doi.org/10.1007/s13280-021-01655-2, 2021.
Rundqvist, S., Hedenås, H., Sandström, A., Emanuelsson, U., Eriksson, H., Jonasson, C., and Callaghan, T. V.: Tree and Shrub Expansion Over the Past 34 Years at the Tree-Line Near Abisko, Sweden, Ambio, 40, 683–692, https://doi.org/10.1007/s13280-011-0174-0, 2011.
Sandström, P., Cory, N., Svensson, J., Hedenås, H., Jougda, L., and Borchert, N.: On the decline of ground lichen forests in the Swedish boreal landscape: Implications for reindeer husbandry and sustainable forest management, Ambio, 45, 415–429, https://doi.org/10.1007/s13280-015-0759-0, 2016.
Scharn, R., Little, C. J., Bacon, C. D., Alatalo, J. M., Antonelli, A., Björkman, M. P., Molau, U., Nilsson, R. H., and Björk, R. G.: Decreased soil moisture due to warming drives phylogenetic diversity and community transitions in the tundra, Environ. Res. Lett., 16, 064031, https://doi.org/10.1088/1748-9326/abfe8a, 2021.
Scharn, R., Brachmann, C. G., Patchett, A., Reese, H., Bjorkman, A. D., Alatalo, J. M., Björk, R. G., Jägerbrand, A. K., Molau, U., and Björkman, M. P.: Vegetation responses to 26 years of warming at Latnjajaure Field Station, northern Sweden, Arctic Science, 8, 858–877, https://doi.org/10.1139/as-2020-0042, 2022.
Schwager, P. and Berg, C.: Global warming threatens conservation status of alpine EU habitat types in the European Eastern Alps, Reg. Environ. Change, 19, 2411–2421, https://doi.org/10.1007/s10113-019-01554-z, 2019.
Shannon, C. E.: A mathematical theory of communication, Bell Syst. Tech. J., 27, 379–423, 1948.
Smith, B., Prentice, I. C., and Sykes, M. T.: Representation of vegetation dynamics in the modelling of terrestrial ecosystems: comparing two contrasting approaches within European climate space, Global Ecol. Biogeogr., 10, 621–637, https://doi.org/10.1046/j.1466-822X.2001.t01-1-00256.x, 2001.
Smith, B., Wårlind, D., Arneth, A., Hickler, T., Leadley, P., Siltberg, J., and Zaehle, S.: Implications of incorporating N cycling and N limitations on primary production in an individual-based dynamic vegetation model, Biogeosciences, 11, 2027–2054, https://doi.org/10.5194/bg-11-2027-2014, 2014.
Speed, J. D. M., Austrheim, G., Kolstad, A. L., and Solberg, E. J.: Long-term changes in northern large-herbivore communities reveal differential rewilding rates in space and time, Plos One, 14, e0217166, https://doi.org/10.1371/journal.pone.0217166, 2019.
Stark, S., Horstkotte, T., Kumpula, J., Olofsson, J., Tømmervik, H., and Turunen, M.: The ecosystem effects of reindeer (Rangifer tarandus) in northern Fennoscandia: Past, present and future, Perspect. Plant Ecol., 58, 125716, https://doi.org/10.1016/j.ppees.2022.125716, 2023.
Stoessel, M., Moen, J., and Lindborg, R.: Mapping cumulative pressures on the grazing lands of northern Fennoscandia, Sci. Rep., 12, 16044, https://doi.org/10.1038/s41598-022-20095-w, 2022.
Sturm, M., Racine, C., and Tape, K.: Climate change – Increasing shrub abundance in the Arctic, Nature, 411, 546–547, https://doi.org/10.1038/35079180, 2001.
Sundqvist, M. K., Moen, J., Björk, R. G., Vowles, T., Kytöviita, M.-M., Parsons, M. A., and Olofsson, J.: Experimental evidence of the long-term effects of reindeer on Arctic vegetation greenness and species richness at a larger landscape scale, J. Ecol., 107, 2724–2736, https://doi.org/10.1111/1365-2745.13201, 2019.
SURFEX: Soil texture – FAO at 10 km (global), SURFEX [data set], https://www.umr-cnrm.fr/surfex/spip.php?article135, last access: 26 February 2024.
Tang, J., Miller, P. A., Persson, A., Olefeldt, D., Pilesjö, P., Heliasz, M., Jackowicz-Korczynski, M., Yang, Z., Smith, B., Callaghan, T. V., and Christensen, T. R.: Carbon budget estimation of a subarctic catchment using a dynamic ecosystem model at high spatial resolution, Biogeosciences, 12, 2791–2808, https://doi.org/10.5194/bg-12-2791-2015, 2015.
Thomas, S. C. and Martin, A. R.: Carbon Content of Tree Tissues: A Synthesis, Forests, 3, 332–352, https://doi.org/10.3390/f3020332, 2012.
United-Nations-Environment-Programme: Emissions Gap Report 2023: Broken Record – Temperatures hit new highs, yet world fails to cut emissions (again), Nairobi, United Nations Environment Programme, https://doi.org/10.59117/20.500.11822/43922, 2023.
Venäläinen, A., Lehtonen, I., Laapas, M., Ruosteenoja, K., Tikkanen, O.-P., Viiri, H., Ikonen, V.-P., and Peltola, H.: Climate change induces multiple risks to boreal forests and forestry in Finland: A literature review, Glob. Change Biol., 26, 4178–4196, https://doi.org/10.1111/gcb.15183, 2020.
Vowles, T.: Vegetation inventories from the study: Expansion of deciduous shrubs but not evergreen dwarf shrubs inhibited by reindeer in Scandes mountain range (1.0), Göteborgs universitet [data set], https://doi.org/10.5879/ecds/2017-01-29.1/0, 2018.
Vowles, T., Molau, U., Lindstein, L., Molau, M., and Björk, R. G.: The impact of shrub browsing by mountain hare and reindeer in subarctic Sweden, Plant Ecol. Divers., 9, 421–428, https://doi.org/10.1080/17550874.2016.1264017, 2016.
Vowles, T., Gunnarsson, B., Molau, U., Hickler, T., Klemedtsson, L., and Björk, R. G.: Expansion of deciduous tall shrubs but not evergreen dwarf shrubs inhibited by reindeer in Scandes mountain range, J. Ecol., 105, 1547–1561, https://doi.org/10.1111/1365-2745.12753, 2017.
Vuorinen, K. E. M., Oksanen, L., Oksanen, T., Pyykönen, A., Olofsson, J., and Virtanen, R.: Open tundra persist, but arctic features decline-Vegetation changes in the warming Fennoscandian tundra, Glob. Change Biol., 23, 3794–3807, https://doi.org/10.1111/gcb.13710, 2017.
Wania, R., Ross, I., and Prentice, I. C.: Integrating peatlands and permafrost into a dynamic global vegetation model: 2. Evaluation and sensitivity of vegetation and carbon cycle processes, Global Biogeochem. Cy., 23, GB3015, https://doi.org/10.1029/2008gb003413, 2009a.
Wania, R., Ross, I., and Prentice, I. C.: Integrating peatlands and permafrost into a dynamic global vegetation model: 1. Evaluation and sensitivity of physical land surface processes, Global Biogeochem. Cy., 23, GB3014, https://doi.org/10.1029/2008gb003412, 2009b.
Wolf, A., Callaghan, T. V., and Larson, K.: Future changes in vegetation and ecosystem function of the Barents Region, Climatic Change, 87, 51–73, https://doi.org/10.1007/s10584-007-9342-4, 2008.
Xu, J., Morris, P. J., Liu, J., and Holden, J.: PEATMAP: Refining estimates of global peatland distribution based on a meta-analysis, Catena, 160, 134–140, https://doi.org/10.1016/j.catena.2017.09.010, 2018.
Yu, Q., Epstein, H., Engstrom, R., and Walker, D.: Circumpolar arctic tundra biomass and productivity dynamics in response to projected climate change and herbivory, Glob. Change Biol., 23, 3895–3907, https://doi.org/10.1111/gcb.13632, 2017.
Zani, D., Lehsten, V., and Lischke, H.: Tree migration in the dynamic, global vegetation model LPJ-GM 1.1: efficient uncertainty assessment and improved dispersal kernels of European trees, Geosci. Model Dev., 15, 4913–4940, https://doi.org/10.5194/gmd-15-4913-2022, 2022.
Zhang, W. X., Miller, P. A., Smith, B., Wania, R., Koenigk, T., and Döscher, R.: Tundra shrubification and tree-line advance amplify arctic climate warming: results from an individual-based dynamic vegetation model, Environ. Res. Lett., 8, 034023, https://doi.org/10.1088/1748-9326/8/3/034023, 2013.