the Creative Commons Attribution 4.0 License.
the Creative Commons Attribution 4.0 License.
 | 30 Sep 2025
Terrestrial and marine plastic pollution outlook in the Mediterranean region: a box-model approach based on OECD policy scenarios
Jeroen E. Sonke
Plastic pollution in the Mediterranean Sea and catchment raises serious concerns for ecosystem and human health. Plastic dispersal from Mediterranean watersheds in southern Europe, northern Africa, the Middle East and the Nile basin is complex due to the different (mis)managed waste streams, population dynamics, and climates. In this study, an environmental macroplastics and microplastics (hereafter “plastics”) mass budget and box model is proposed for the Mediterranean region based on recent observations. We use this model to explore the dispersal of plastics under different plastic production and waste management policy scenarios of the Organisation for Economic Co-operation and Development (OECD) toward the end of the 21st century. We find that the current Mediterranean marine plastic stock (sea surface, water column, sandy beach, and sediments) of 7×10⁶ metric tonnes (megatonne, Mt; median, IQR 3–15 Mt) in 2015 constrains continental plastic input to sea to 0.31 Mt yr−1 (median, IQR 0.14–0.57 Mt yr−1). The total marine plastics stock would increase 4-fold by 2060 under a business-as-usual scenario, reaching 26 Mt (median, IQR 13–48 Mt). The implementation of the OECD Global Ambition policy scenario, which targets near-zero new plastics waste leakage, would not significantly lower this stock (25 Mt, median, IQR 12–44 Mt) by 2060. This is because remote sensing observations of marine litter attribute most, 0.27 Mt yr−1 (88 %), of recent plastic input from land to sea to southern Europe, where high rainfall will continue to mobilize legacy plastic waste from land to sea, regardless of low leakage targets. About 1.5 % of all Mediterranean legacy plastic waste reached the marine environment, meaning that most plastic waste still resides on land (361 Mt, 76 %). Moreover, in the marine environment, 83 % of the plastic mass resides in shelf sediments (median 6 Mt, IQR 2–14 Mt), which are fragile ecosystems that host most of the Mediterranean Sea's biodiversity and are not easy to clean up. This underlines the necessity of addressing upstream legacy plastic waste on land. Land-based remediation scenarios modeled here show that total plastic input from land to sea can be reduced 2-fold (0.22 Mt yr−1, IQR 0.16–0.27 Mt yr−1) compared to the business-as-usual scenario in 2060 and can significantly reduce the total plastic stock in the marine environment.
- Article
(6135 KB) - Full-text XML
-
Supplement
(1961 KB) - BibTeX
- EndNote


Plastic pollution is emerging as a global concern for the environment and human health (IUCN, 2023). Global primary plastic production has reached more than 400 Mt (1012 g or millions of metric tonnes) per year in 2016 (Geyer et al., 2017) and has continued to grow by more than 4 % every year since. For the year 2015, it was estimated that 8300 Mt of primary plastic had been produced since 1950, of which 2500 Mt is still in use and 5800 Mt was discarded (Geyer et al., 2017). Around 9 % of this discarded waste has been recycled and 12 % has been incinerated; the remaining 79 % has been disposed of in landfills, dumpsites, or littered in nature (Geyer et al., 2017). Due to their slow biodegradability, disposed plastics have a long persistence in the environment (Chamas et al., 2020), creating important “legacy” plastic waste stocks estimated at around 4900 Mt globally in 2015 (Geyer et al., 2017; Sonke et al., 2025). Plastic objects in the environment fragment from macroplastics (>5 mm) to microplastics (1 µm–5 mm) to nanoplastics (<1 µm) under the combined effects of (photo-)oxidation, structural fragilization, and mechanical abrasion at a rate of approximately 3 % yr−1 (Chamas et al., 2020; Lebreton et al., 2017; Sonke et al., 2025). Plastic particles are very mobile due to their relatively low density and buoyancy and can travel long distances by rivers and ocean currents. It is estimated that rivers carry from 1 to 6 Mt of plastic each year globally (González-Fernández et al., 2023). Some studies propose an even higher plastic flux, up to 14 Mt yr−1 (Jambeck et al., 2015; Sonke et al., 2025). Another vector of the large-scale dispersion of small microplastics (<0.3 mm) is the atmosphere, where plastic particles are emitted from land (as agricultural dust, tire and brake wear particles, and urban-industrial dust) (Brahney et al., 2021) and from the sea (Allen et al., 2020, 2022), and these undergo long-range transport (Allen et al., 2021b; Tatsii et al., 2024; Xiao et al., 2023) before deposition to remote land surfaces. As a consequence, plastics are now an ubiquitous material in the environment, whose presence has been reported in freshwater systems and oceans (Schwarz et al., 2019), marine sediments (Barrett et al., 2020), and the atmosphere (Wang et al., 2023), as well as polar regions (Bergmann et al., 2022), mountains, and remote soils (Allen et al., 2021a).
Plastics exert various pressures on the environment, varying, among other factors, with their size. Macroplastics (items greater than 5 mm) have been shown to entangle various marine animals or to block their digestive tracts (Browne et al., 2015; Gregory, 2009). Macroplastics floating at the ocean surface can also serve as a refuge for invasive or non-indigenous species and contaminate new regions through drifting and beaching (Aliani and Molcard, 2003; Miralles et al., 2018; Rech et al., 2018). Microplastics (<5 mm) can have a wide range of potentially adverse effects on biota, from genetic expression to physiological or behavioral changes (Tuuri and Leterme, 2023). Microplastics can release toxic additives (e.g., endocrine disruptors, Bisphenol A) or serve as vectors for toxic chemicals such as hydrophobic organic compounds (polychlorinated biphenyls, polyaromatic hydrocarbons, etc.), organochlorine pesticides, and trace metals (Verla et al., 2019).
The Mediterranean Sea is considered to be a hotspot for biodiversity, with more than 17 000 species identified, among which 20 % are endemic (Coll et al., 2010). This biodiversity is linked to an important diversity of habitats and ecosystems. These ecosystems are threatened by the intense human activity occurring near the coast. Around 190 million people were living less than 50 km from the Mediterranean coastline in 2020 (UN, 2022), to which must be added the 360 million tourists per year (in 2017), accounting for 27 % of international tourism (UNEP/MAP, 2020). Furthermore, the Mediterranean Sea is crossed by 30 % of the international shipping traffic (Bolo and Préville, 2020) and presents highly urbanized and industrialized zones near its coast (Poulos, 2020; UNEP/MAP, 2020). As a consequence of this intense human activity, the Mediterranean Sea is considered to be one of the environments most affected by marine litter, which includes macro- and microplastics (Fossi et al., 2020; UNEP, 2021). Numerous studies have tried to estimate the quantity of plastic floating at the Mediterranean Sea surface. Pedrotti et al. (2022) estimated 660 metric tonnes of floating plastics, while Cózar et al. (2015) estimated between 1000 and 3000 metric tonnes. Simon-Sánchez et al. (2022) reviewed and reported on concentrations in sediments (300 items kg−1) and beaches (60 items kg−1), highlighting the high uncertainties and variability between studies.
Demographic trends (UN, 2022), plastic usage (OECD, 2022), and mismanaged plastic waste (MMPW) generation (Lebreton et al., 2019; OECD, 2022) are widely different between Mediterranean Sea subregions, such as southern Europe, northern Africa and the Middle East and the Nile basin region. Several studies have used these indicators to estimate the global plastic input from land to sea (Lebreton et al., 2017; Meijer et al., 2021; Nyberg et al., 2023) and show a similar geographical distribution of plastic input from land to sea in the Mediterranean region (dominated by northern Africa and the Middle East). However, a recent satellite remote sensing study of Mediterranean Sea litter by Cózar et al. (2024) highlighted the close relationship between marine litter occurrence and heavy rainfall events, pointing at southern Europe as the largest macroplastic source of the Mediterranean Sea. Weiss et al. (2025) also found a similar geographical pattern for large microplastics input to the Mediterranean Sea (inputs dominated by southern Europe), using a top-down model based on population density and precipitation.
Several modeling studies have focused on the plastic issue in the Mediterranean region (Boucher and Billard, 2020; Kaandorp et al., 2020; Liubartseva et al., 2018; Pedrotti et al., 2022; Tsiaras et al., 2021). Kaandorp et al. (2020) used a 2D Lagrangian model to fit plastic inputs from land to sea, based on observed floating plastic concentrations in the Mediterranean Sea. In their box model, Boucher and Billard (2020) created one of the first multi-compartmental studies assessing plastic distribution in the Mediterranean Sea and explored scenarios toward plastic pollution reduction by 2040. However, no plastic budget or modeling studies have integrated the Mediterranean marine, terrestrial, and atmospheric compartments together and explored future plastic policy scenarios toward the end of the century based on international agencies' recommendations.
This study investigates the fate of plastic waste in the Mediterranean Sea catchment across various environmental compartments (terrestrial, sea surface and water column, shelf and deep sediments, beaches, and the atmosphere). We first propose a Mediterranean macroplastic and microplastic (hereafter “plastic”) mass budget for the year 2015, allowing us to calibrate a mass balance box model and to propose a top-down estimation of plastic input from land to sea. The Mediterranean Sea catchment is subdivided into three regions (southern Europe, northern Africa and the Middle East, and the Nile River basin), each having its own plastic waste forcing curve derived from region-specific demography, plastic waste generation, and mismanaged fraction. The box model is then used to estimate the evolution of historical plastic stocks in the Mediterranean basin between 1950 and 2015, exploring several future plastic policy scenarios based on the Organisation for Economic Co-operation and Development (OECD) outlook toward 2060 (OECD, 2022). The aim of this exploratory study is to investigate the relevance of the OECD's scenarios regarding plastic pollution in the Mediterranean catchment, while taking into account a wide plastic size range (from microplastics to macroplastics) in a maximum of environmental compartments. This prospective assessment is a necessary step to guide public policies and decision-makers while UN negotiations for an international legally binding treaty to end plastic pollution are under way.
2.1 Study area
This study focuses on plastic contamination in different marine, terrestrial, and atmospheric compartments in the Mediterranean region. The Mediterranean Sea catchment is subdivided into three regions, as shown in Fig. 1: southern Europe (S. Europe), regrouping EU and non-EU countries; northern Africa and the Middle East (N. Africa and M. East); and the Nile River catchment (Nile basin). The boundaries between regions follow river catchment delimitations, provided by the HydroSHEDS database (Lehner and Grill, 2013).
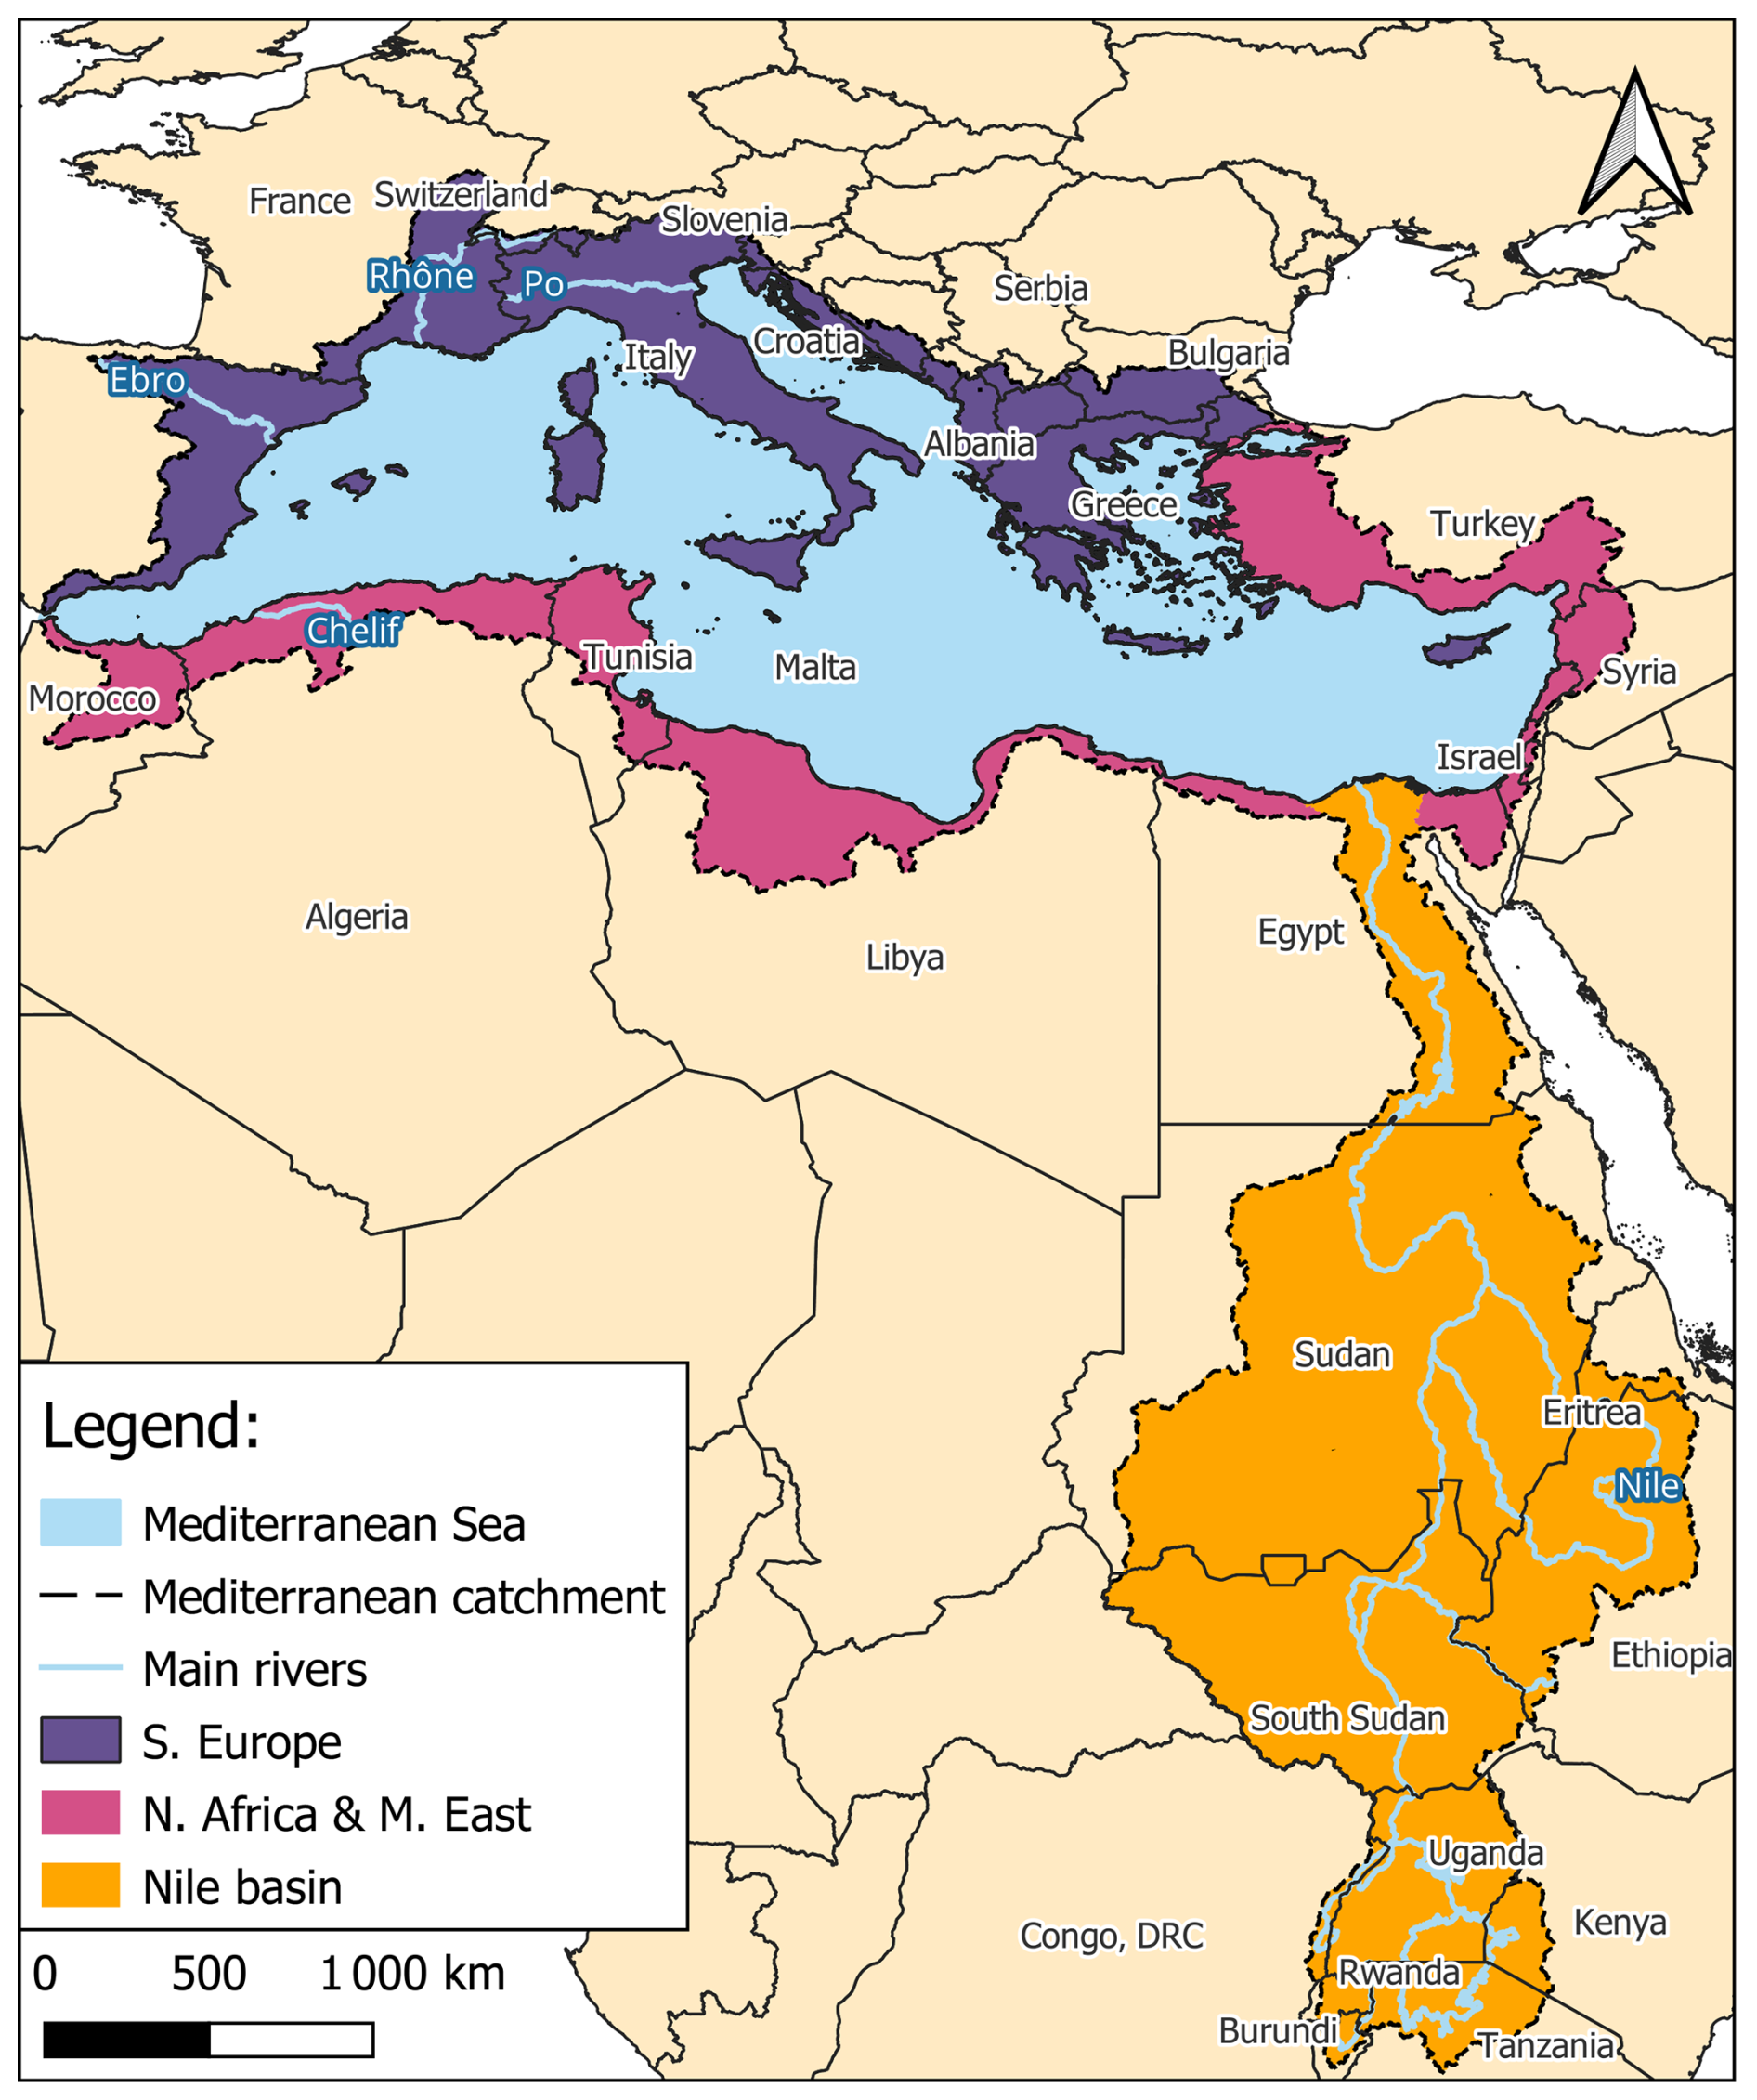
Figure 1Map of the study area and the three geographical plastic source regions considered. The Mediterranean Sea catchment outline is provided by the HydroSHEDS database (Lehner and Grill, 2013). Region boundaries follow river catchment delimitation.
2.1.1 Model structure and parametrization
In order to assess the plastic contamination in different environmental compartments, a first-order 1D mass transfer model is developed based on the previously published work by Sonke et al. (2022, 2025). This box model, presented in Fig. 2, is the representation of the plastic stock in nine environmental compartments (sanitary landfills, mismanaged terrestrial pools (MMPW), remote soils, sea surface, water column, shelf sediments, deep sediments, beaches, and the atmosphere), expressed in millions of metric tonnes (Mt). Compartments are subdivided into boxes according to plastic size category and are expected to contain macroplastics (P) with a characteristic length L that is greater than 5 mm. Large microplastics (LMP) are defined as , and small microplastics (SMP) are defined as . The upper size limit of SMP corresponds to the usual plankton/neuston net mesh size used to sample LMP in the surface ocean. It is also a good estimate of the upper bound of airborne microplastics. We will use the general term “plastic” (Ptot) to refer to the total amount of plastic (P + LMP + SMP) and microplastics (MP) for fragments less than 5 mm in size (LMP + SMP). In total, 35 boxes are considered in this model (Fig. 2). Boxes are linked together by the mass transport of plastic of two types: (1) fluxes that represent movement of mass between compartments through runoff, gravity, or wind (thin arrows in Fig. 2) and (2) plastic fragmentation that transfers mass from a larger plastic size category to a smaller size category (P to LMP to SMP) within the same compartment (bold arrows in Fig. 2). The fragmentation rate was set to 3 % yr−1 following Chamas et al. (2020), Lebreton et al. (2019), and Sonke et al. (2022, 2025). This rate is applied in the MMPW terrestrial pool, sea surface, and sandy beach compartments.
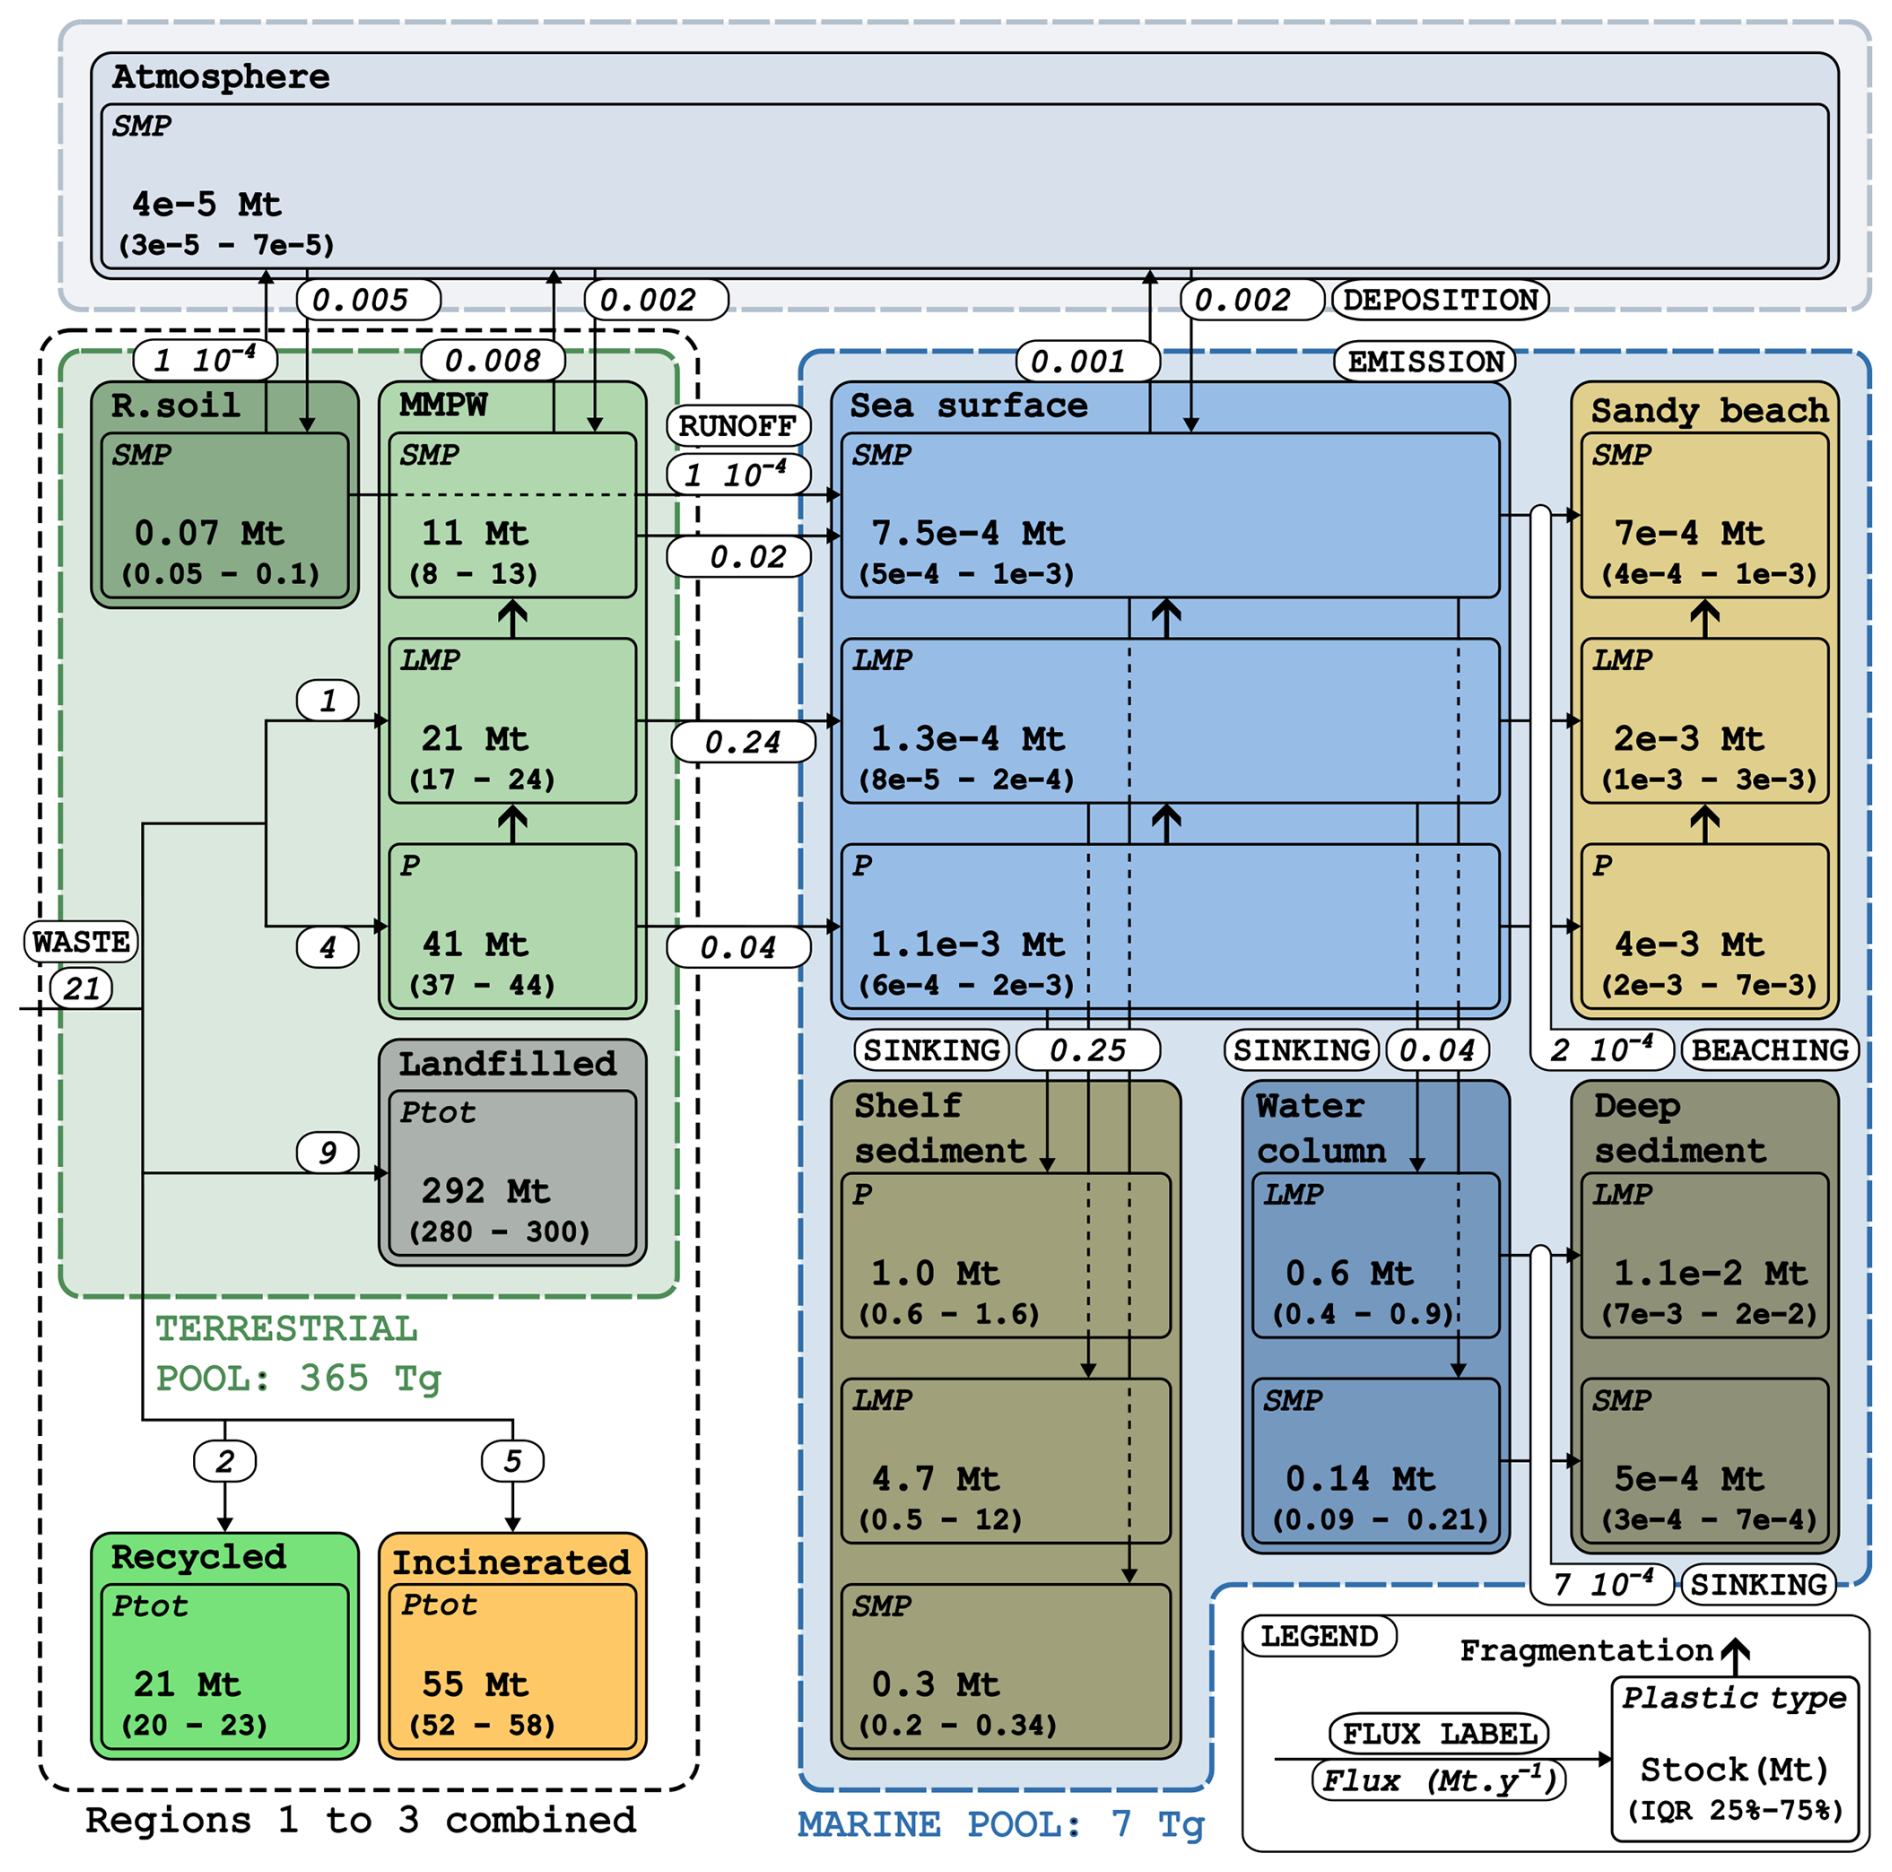
Figure 2Structure of the box model and model estimation of plastic stocks and fluxes for the reference year 2015. Each box is associated with a plastic size category (P≥5 mm, , and ) and its corresponding modeled median stock in millions of metric tonnes (Mt) for the year 2015 under all scenarios. The uncertainties provided are the interquartile range (Q25–Q75). Numbers in white labels are the annual plastic flux between boxes (in Mt yr−1). When the label stretches across multiple arrows, it indicates the combined flux of these arrows. Bold arrows represent the degradation of plastic items to smaller size categories (P to LMP to SMP) under UV and mechanical abrasion. Note that the three modeled terrestrial regions are combined in the figure on the left. “R. soil” stands for “remote soil surfaces” and “MMPW” for “terrestrial mismanaged plastic waste”.
Plastic waste enters the model via the three terrestrial regions. Each waste flux is immediately divided between recycled, incinerated, discarded to sanitary landfills, and mismanaged. In this study, sanitary landfills are considered to be “plastic-tight”, meaning no leakage of plastic to the environment from this compartment is assumed over the timescale studied (1950–2100). The MMPW compartment corresponds to the terrestrial environment directly polluted by human activities, including non-sanitary dumps, urban-industrial areas, agricultural soils, freshwater lakes, and wetlands. From there, the smaller plastic fraction (SMP here) can be transported through wind erosion to the atmosphere (Brahney et al., 2021) or through continental runoff of P, LMP, and SMP to the Mediterranean Sea surface pool (van Emmerik and Schwarz, 2020; Jambeck et al., 2015; Lebreton et al., 2017; Meijer et al., 2021). Atmospheric SMP can be deposited on the sea surface or on land (Allen et al., 2022; Brahney et al., 2021), both to the terrestrial MMPW pool (urban area and agricultural land), or to remote soils (mountains, deserts, remote land surfaces, etc.). From the sea surface, plastic items can be deposited on beaches (Hinata et al., 2017), and SMP can be emitted to the atmosphere through sea spray (Allen et al., 2020; Brahney et al., 2021; Shaw et al., 2023; Wu et al., 2021). MP can also sink to the shelf sediments and to the deep-water column due to biofouling and/or gravity. Additionally, we consider that P is able to sink to the shelf sediments near the shore. Finally, MP can sink further from the deep-water column to the deep sediments (see Fig. 2).
Plastic mass transport between boxes is approximated to be first order, where the plastic flux FA→B [Mt yr−1] from box A to box B is proportional to the plastic mass MA [Mt] in box A:
where kA→B [yr−1] is the proportionality coefficient defining the plastic mass flux from box A to box B. Without broad evidence for higher-order non-linear plastic dispersion dynamics, we consider Eq. (1) to be a reasonable assumption that is based on similar behavior during chemical kinetics, radioactivity, and biogeochemical cycling. The set of all k values are the parameters of the model and are kept constant for the full integration period. The variation of plastic stock in box A at time t is the sum of all incoming fluxes minus the sum of all exiting fluxes from box A at time t:
where I is the set of boxes upstream of box A, and J is the set of boxes downstream of box A. The solution to this system of ordinary differential equations gives the plastic stock of each box at any time in the integration interval. Solutions were computed using an implicit Runge–Kutta method (Radau IIA family of order 5), compiled in a Python script (Python 3.11.5) and available in the Supplement (see also Segur and Sonke, 2025). To evaluate uncertainties, a Monte Carlo approach is implemented, where model coefficients k are randomly drawn from their assigned probability (uncertainty) distribution across 1000 model runs. The probability distribution of all k values is available in Tables S1 and S2 in the Supplement.
2.2 Model forcing
Plastic enters the model circulation through waste generation in the three terrestrial regions. To estimate the quantity of plastic waste generated at time t for each region R, forcing curves PW(R,t) [Mt yr−1] were computed using Eq. (3):
PCPW(R,t) [Mt per capita per year] is the per capita plastic waste generation rate derived from OECD (Figs. 3b and S1 in the Supplement) for the three regions (OECD, 2022). Pop(c,t) [capita] is the total population of country c, obtained from UN demographic data (UN, 2022). Historical estimates are used from 1950 to 2022 and medium-fertility variant estimates from 2023 to 2060. fcatch(c) [–] is the fraction of the population in country c that lived in the Mediterranean catchment in 2015. fcatch is computed using georeferenced population data provided by the WorldPop database (WorldPop, 2020), adjusted to match the corresponding UN data (UN, 2022). Using GIS software QGIS (version 3.28.4), the population living inside the Mediterranean catchment is computed for each country and divided by the total population of the country for the year 2015 to obtain fcatch(c). Further testing showed that this fraction can be considered constant from 2000 to 2020 and therefore is assumed to be constant for the whole time frame studied as a first approximation (see Fig. S2 in the Supplement for details). A 5 % uncertainty is introduced to these forcings, following estimations from Geyer et al. (2017).
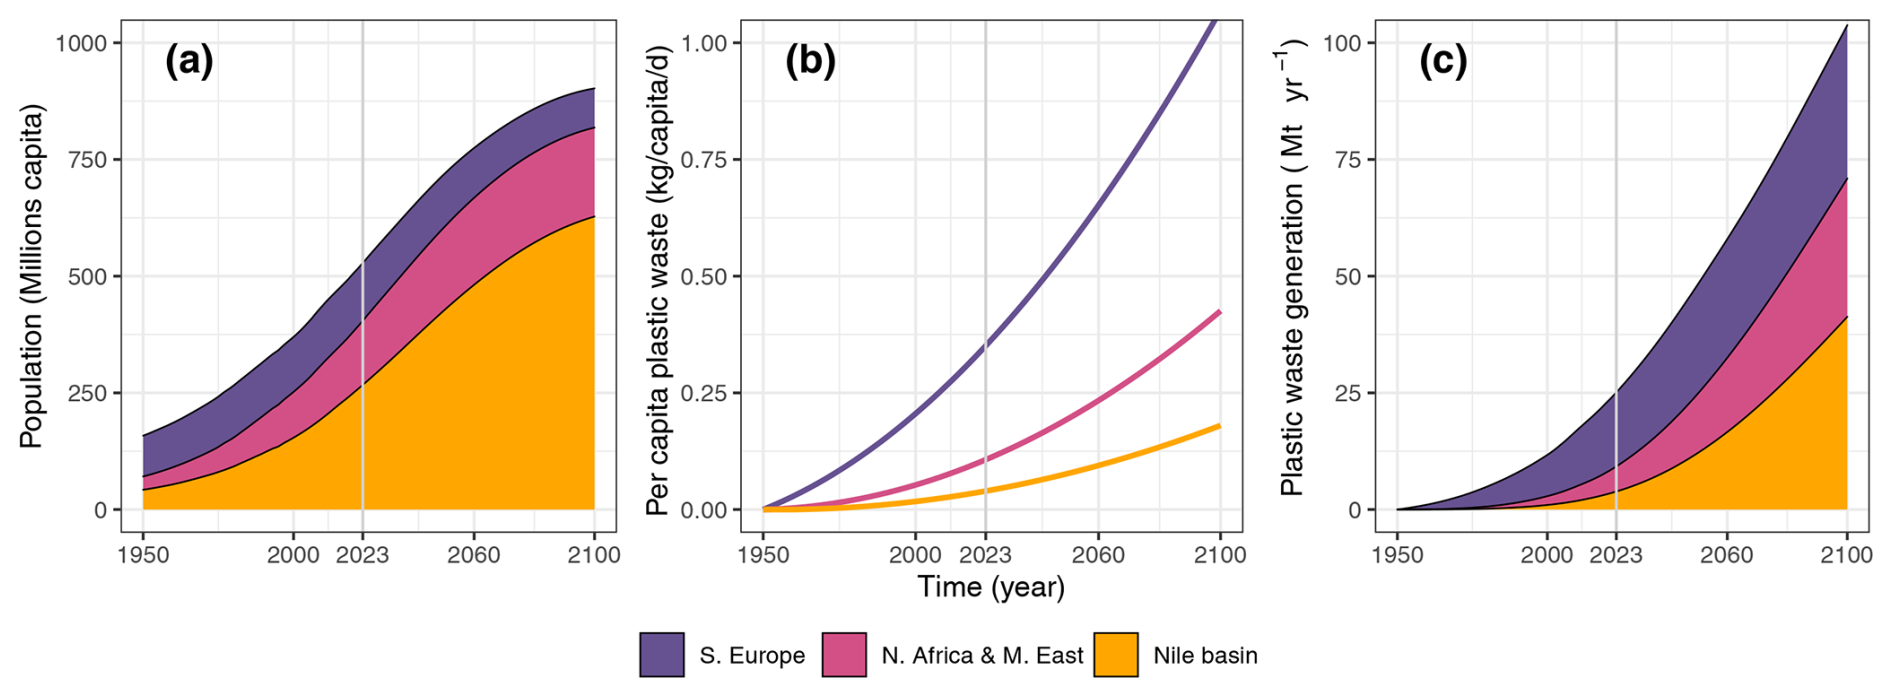
Figure 3Population, per capita plastic waste, and total plastic waste generation projections by region. Colors correspond to the terrestrial regions. (a) Stacked regional population derived from UN statistics (historical estimates from 1950 to 2022 and medium-fertility variant estimates from 2023 to 2060) and georeferenced population data (WorldPop, 2020). (b) Per capita plastic waste generation rates under a business-as-usual (BAU) scenario, derived from OECD estimations (OECD, 2022) (see Fig. S1 for details). (c) Stacked annual plastic waste generation per region under a BAU scenario, corresponding to the combination of graphs A and B according to Eq. (3).
2.3 Mediterranean plastic observations
In order to calibrate the model, plastic stocks and fluxes in the Mediterranean study region were assessed based on an extended literature review of recently (2015–2024) published articles. The year 2015 is chosen as a reference for calibration as it is the average sampling year of all studies reviewed here. When reported in terms of the number of plastic items per size category, the numeric concentrations were converted into mass concentrations, assuming an average ellipsoid particle volume of (L is the reported average length of the size category) and an average plastic item density of (Kooi and Koelmans, 2019).
2.3.1 Sea surface
The Mediterranean Sea surface is the most documented compartment studied. Two studies directly provided an estimation of the total surface plastic stock (Boucher and Billard, 2020; Pedrotti et al., 2022). Other studies (Baini et al., 2018; Cincinelli et al., 2019; Cózar et al., 2015; Simon-Sánchez et al., 2022) provided average plastic mass concentrations [g km−2] that were multiplied by the Mediterranean Sea surface area (2.5×10⁶km2) to obtain an estimation of the plastic stock in the sea surface. Among these studies, one review (Cincinelli et al., 2019) provided a numeric concentration [item km−2] that was converted to mass concentration [g km−2] using the item-to-mass conversion formula elaborated on by Cózar et al. (2015) for floating plastics:
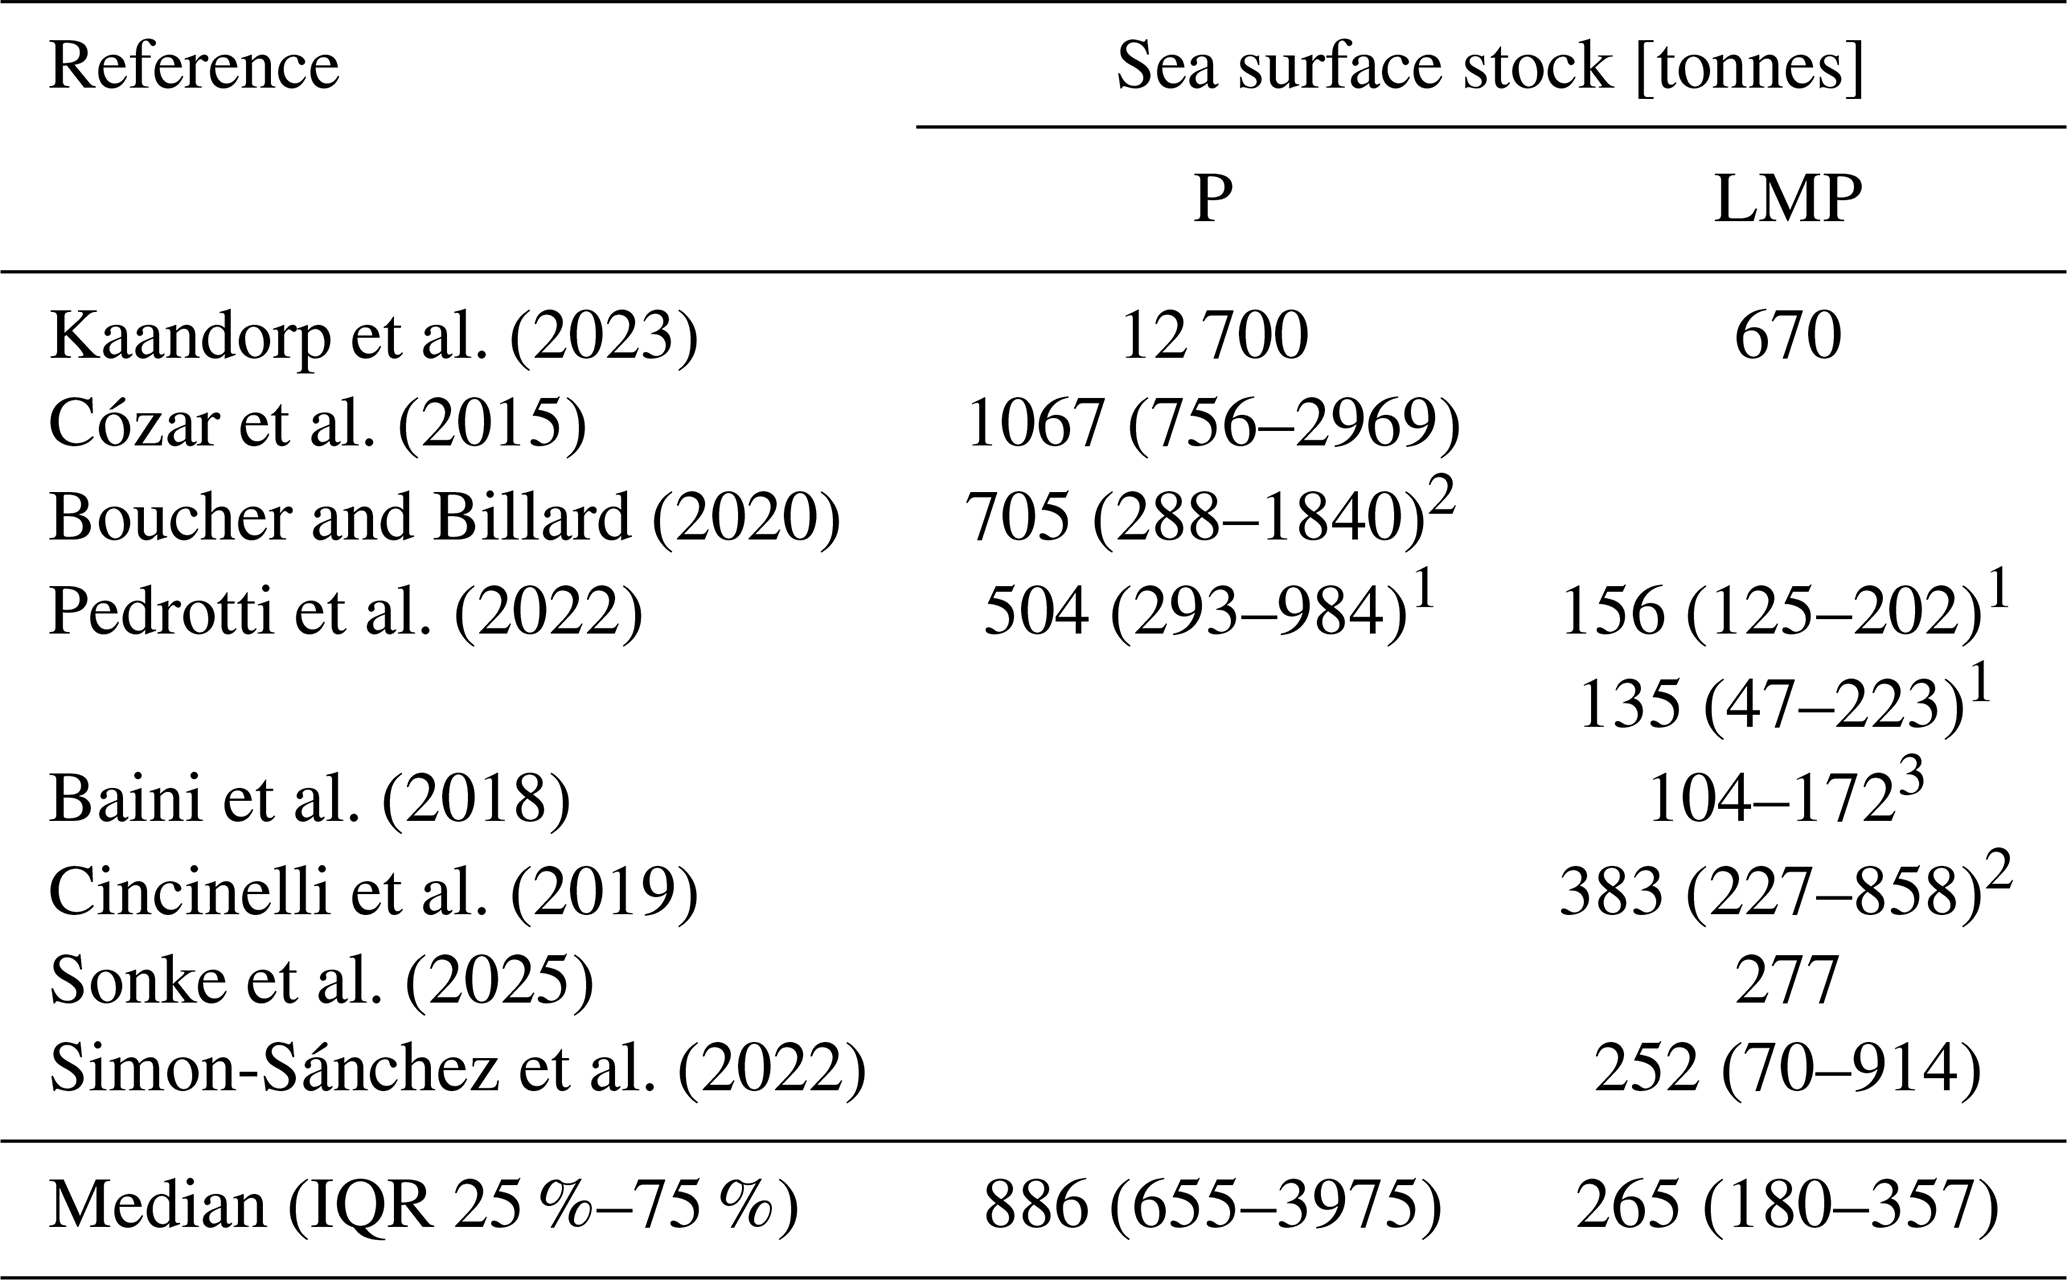
The estimations of Kaandorp et al. (2020) of global floating P and LMP and the estimation of Sonke et al. (2025) of global LMP were downscaled to the Mediterranean Sea surface in order to account for the new higher macroplastic quantification. A summary of the plastic stock at the Mediterranean Sea surface is presented in Table 1 and amounts to Mt (median, IQR – Mt) of floating P and Mt (median, IQR – Mt) of floating LMP. Note that no reliable SMP data were found for the Mediterranean region (see Sect. 2.4.5).
Kaandorp et al. (2023)Cózar et al. (2015)Boucher and Billard (2020)Pedrotti et al. (2022)Baini et al. (2018)Cincinelli et al. (2019)Sonke et al. (2025)Simon-Sánchez et al. (2022)Table 1Literature review of plastic stock at the Mediterranean Sea surface P≥5 mm, , and . If available, the uncertainties are given with the following methodology: 1 95 % confidence interval, 2 interquartile range, 3 mean ± 1σ.
2.3.2 Sandy beaches
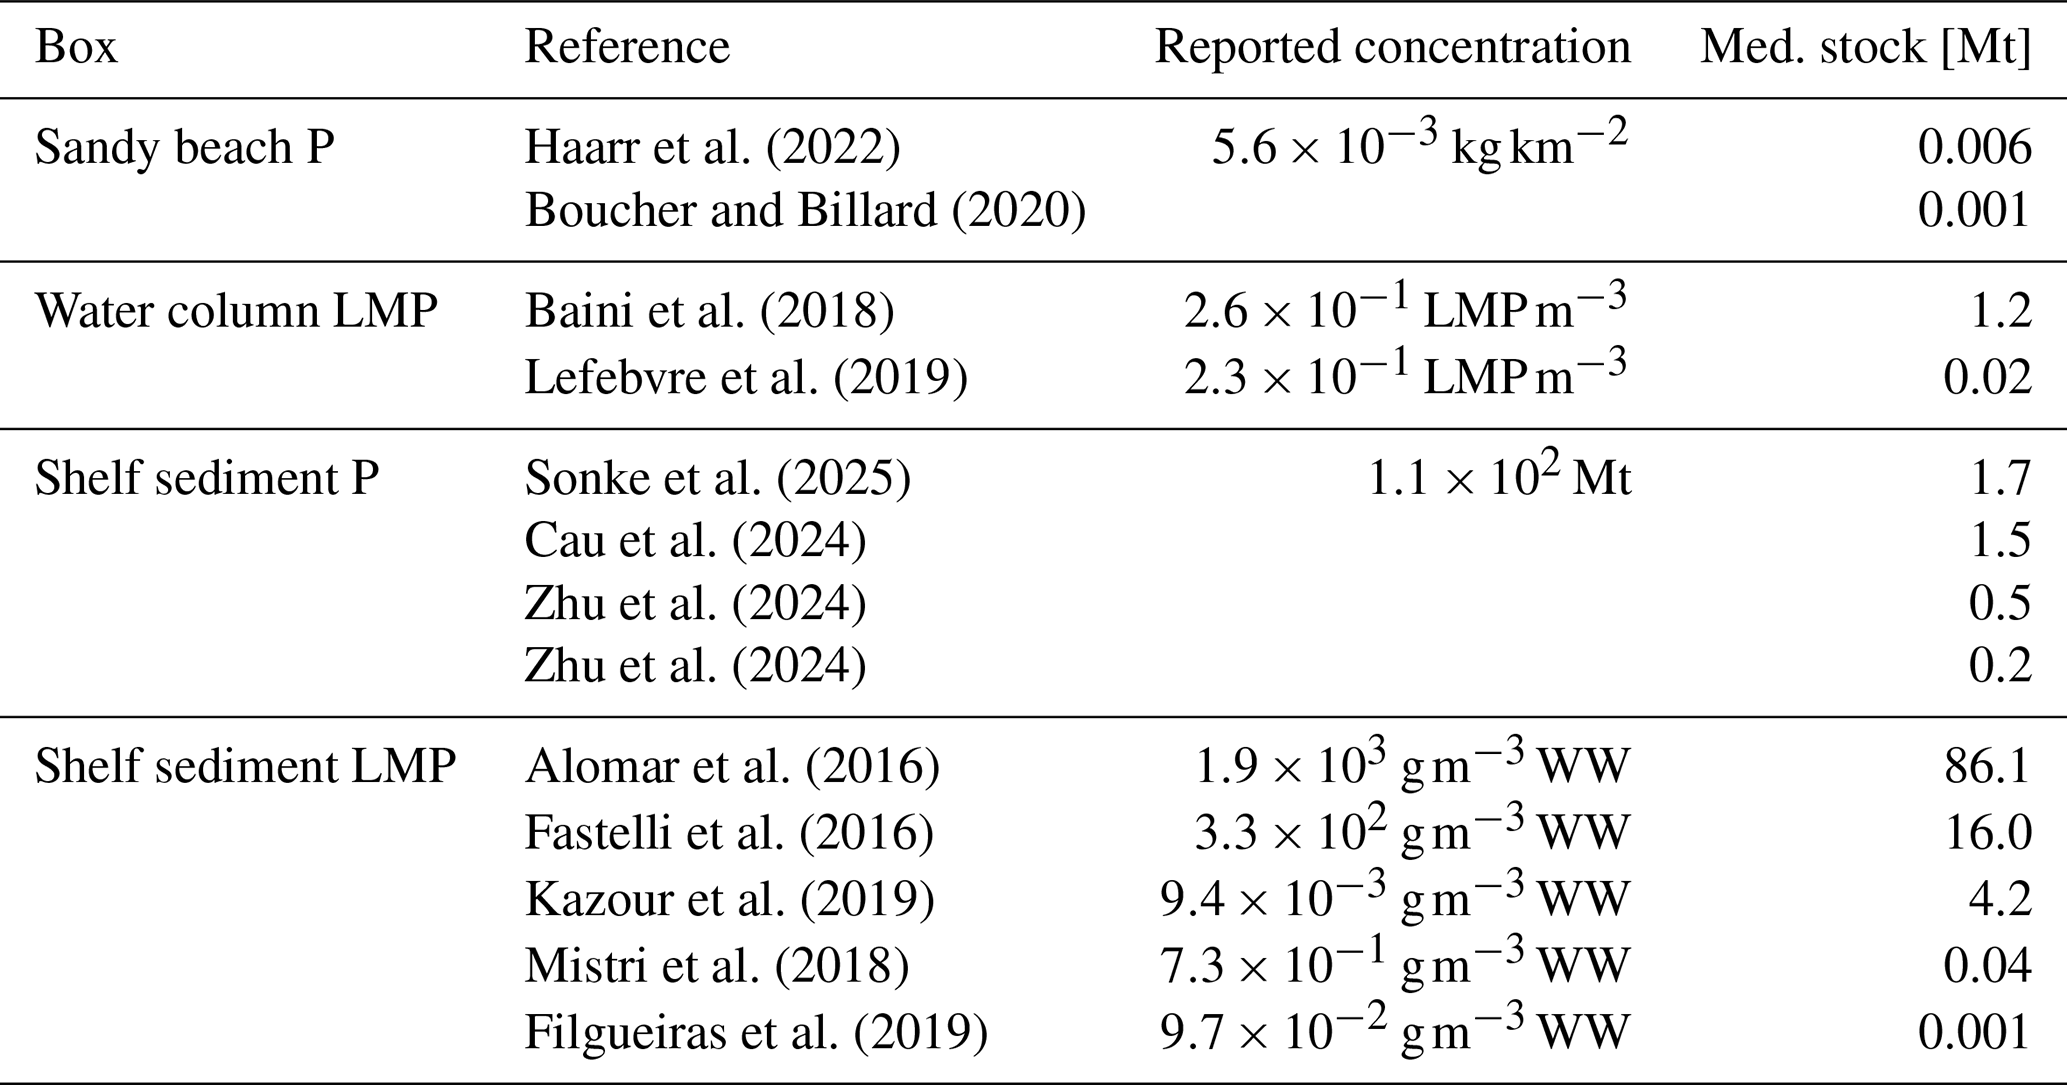
In their study, Boucher and Billard (2020) reviewed beach litter collection data and directly estimated the stock of plastic in Mediterranean sandy beaches (0.001 Mt, Table 2.). In their review, Haarr et al. (2022) reported beached P densities of 5650 kg km−2 (median, IQR 1500–17 700 kg km−2) for the Mediterranean coastline. We multiplied the reported P density by the estimated sandy beach area in the Mediterranean basin, assuming a coast length of 47 200 km (among which 46 % is sandy beaches (Poulos, 2020)) and an average beach width of 50 m, to obtain an estimate of 0.006 Mt (Table 2).
Haarr et al. (2022)Boucher and Billard (2020)Baini et al. (2018)Lefebvre et al. (2019)Sonke et al. (2025)Cau et al. (2024)Zhu et al. (2024)Zhu et al. (2024)Alomar et al. (2016)Fastelli et al. (2016)Kazour et al. (2019)Mistri et al. (2018)Filgueiras et al. (2019)Table 2Literature review of plastic stock in the Mediterranean sandy beaches, water column, and shelf sediments. The reported concentration, if provided, was transposed to Mediterranean Sea stock (Med. stock) using item-to-mass conversion () and/or surface extrapolation.
2.3.3 Water column
Two sampling studies were reviewed to estimate the water column plastic stock (Baini et al., 2018; Lefebvre et al., 2019). Both of them only sampled down to 100 m depth, which is not representative of the deep Mediterranean water column, whose average depth is 1547 m (Poulos, 2020). The concentrations found by these studies were therefore corrected using model results by Tsiaras et al. (2021) that investigated the vertical mixing of MP in the Mediterranean Sea. According to their results, 70 % of the MP mass sunk under 100 m depth, which allowed us to convert the 0–100 m plastic stock to 100–1547 m (1.2 and 0.02 Mt for Baini et al., 2018, and Lefebvre et al., 2019, respectively; see Table 2).
2.3.4 Shelf and deep sediments
We reviewed eight studies on plastics in shelf sediments (depth<100 m) (Alomar et al., 2016; Cau et al., 2024; Fastelli et al., 2016; Filgueiras et al., 2019; Kazour et al., 2019; Mistri et al., 2018; Sonke et al., 2025; Zhu et al., 2024). The Mediterranean Sea portion of the georeferenced global model estimations for shelf P by Cau et al. (2024) and Zhu et al. (2024) were isolated using QGIS. The rest of the literature concentrations for plastics in sediments are expressed in terms of the number of plastic items per g of dry sediment (n [item g−1 DW]). These reported concentrations were converted into plastic mass per volume of wet sediment (q [g m−3 WW]) using Eq. (5):
where L [cm] is the characteristic length of the plastic particles; δP = 1 g cm−3 and δS = 1.70 g cm−3 are the average density of plastic particles (Kooi and Koelmans, 2019) and marine sediment (Tenzer and Gladkikh, 2014), respectively; and τS=2.97 [–] is the wet-to-dry sediment density ratio (Barrett et al., 2020). This volumic concentration q is then converted into a seafloor surface concentration [g m−2] by estimating the mass of sediments deposited since 1950, based on sedimentation rates (see Eq. S1 in the Supplement for details). This method accounts for the variation in the plastic sedimentation rate since 1950 and for different core sampling depths. The corrected concentrations are then multiplied by the seafloor surface (4.50×10⁵ km2 for shelf sediment, 2.05×10⁶ km2 for deep sediment (Poulos, 2020)) to obtain the total stock for the compartment. A single study by Cutroneo et al. (2022) observed LMP concentration in the deep Mediterranean sediments. However, this study is judged not to have been representative of the whole Mediterranean deep-sediment pool as it was conducted in a marine canyon located 10 km from the city of Toulon (France) and was therefore significantly impacted by coastal human activities. A summary of the literature data on shelf sediments is presented in Table 2. Estimated stocks are 1.0 ± 0.7 Mt and 21.3 ± 36.8 Mt for shelf-sedimented P and LMP, respectively.
2.3.5 SMP extrapolation from global data
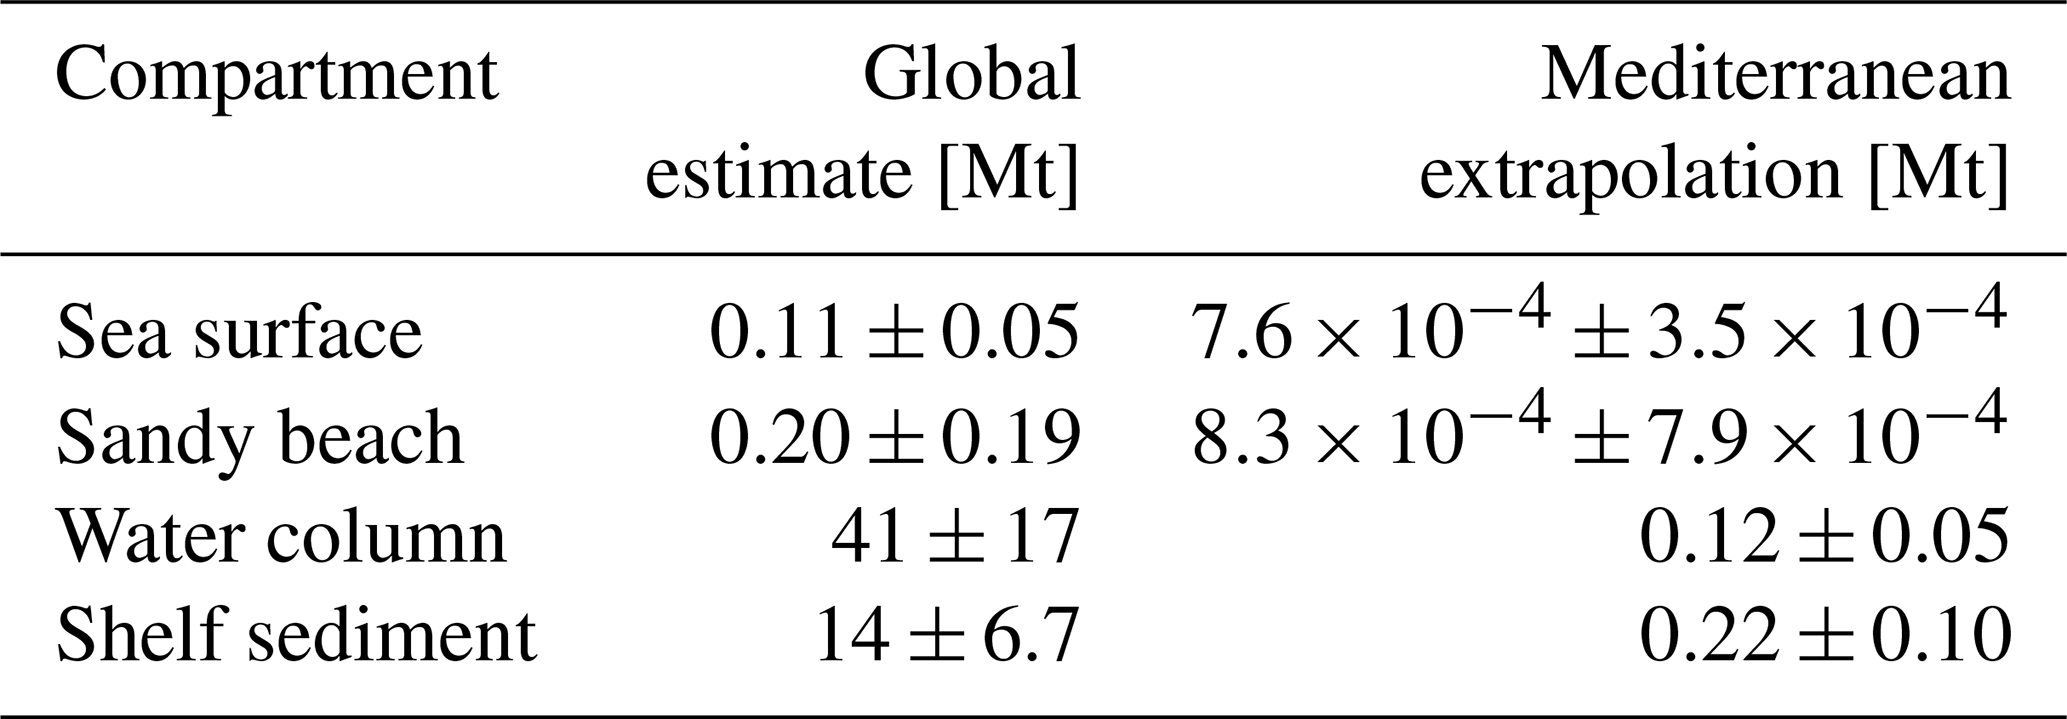
Since no reliable data on SMP stocks were available at the time of this study for the Mediterranean Sea, we use a first approximation based on a similar global modeling study by Sonke et al. (2025). The extrapolation was done by surface (sea surface, sandy beach, shelf sediment) or by volume (water column), and the results are presented in Table 3 (see Table S3 in the Supplement for details). Results on the atmospheric SMP cycle are not presented in this study, as they are not yet constrained enough in the Mediterranean region to provide reasonable levels of uncertainty.
Table 3SMP extrapolation from the Sonke et al. (2025) global study. Values are taken for the year 2015. Uncertainties are mean ± 1σ.
2.3.6 Plastic input from land to sea
Plastics enter the marine environment through several processes, the most documented being rivers. Rivers play an essential role in the large-scale transport of plastics from terrestrial compartments to the ocean (Meijer et al., 2021). Despite being studied extensively through field and modeling work, the uncertainties around the magnitude of the river leakage pathway remain several orders of magnitude (González-Fernández et al., 2023). But rivers are not the only vector of plastic pollution in the marine environment. Coastal areas, and particularly urban coastal areas, are thought to be major sources of plastic pollution in the Mediterranean Sea (Kaandorp et al., 2020) and globally (Lebreton et al., 2019). Inputs from fishing, aquaculture, and shipping are also considered. Hereafter, we refer to all of the processes mentioned above as “plastic input from land to sea”.
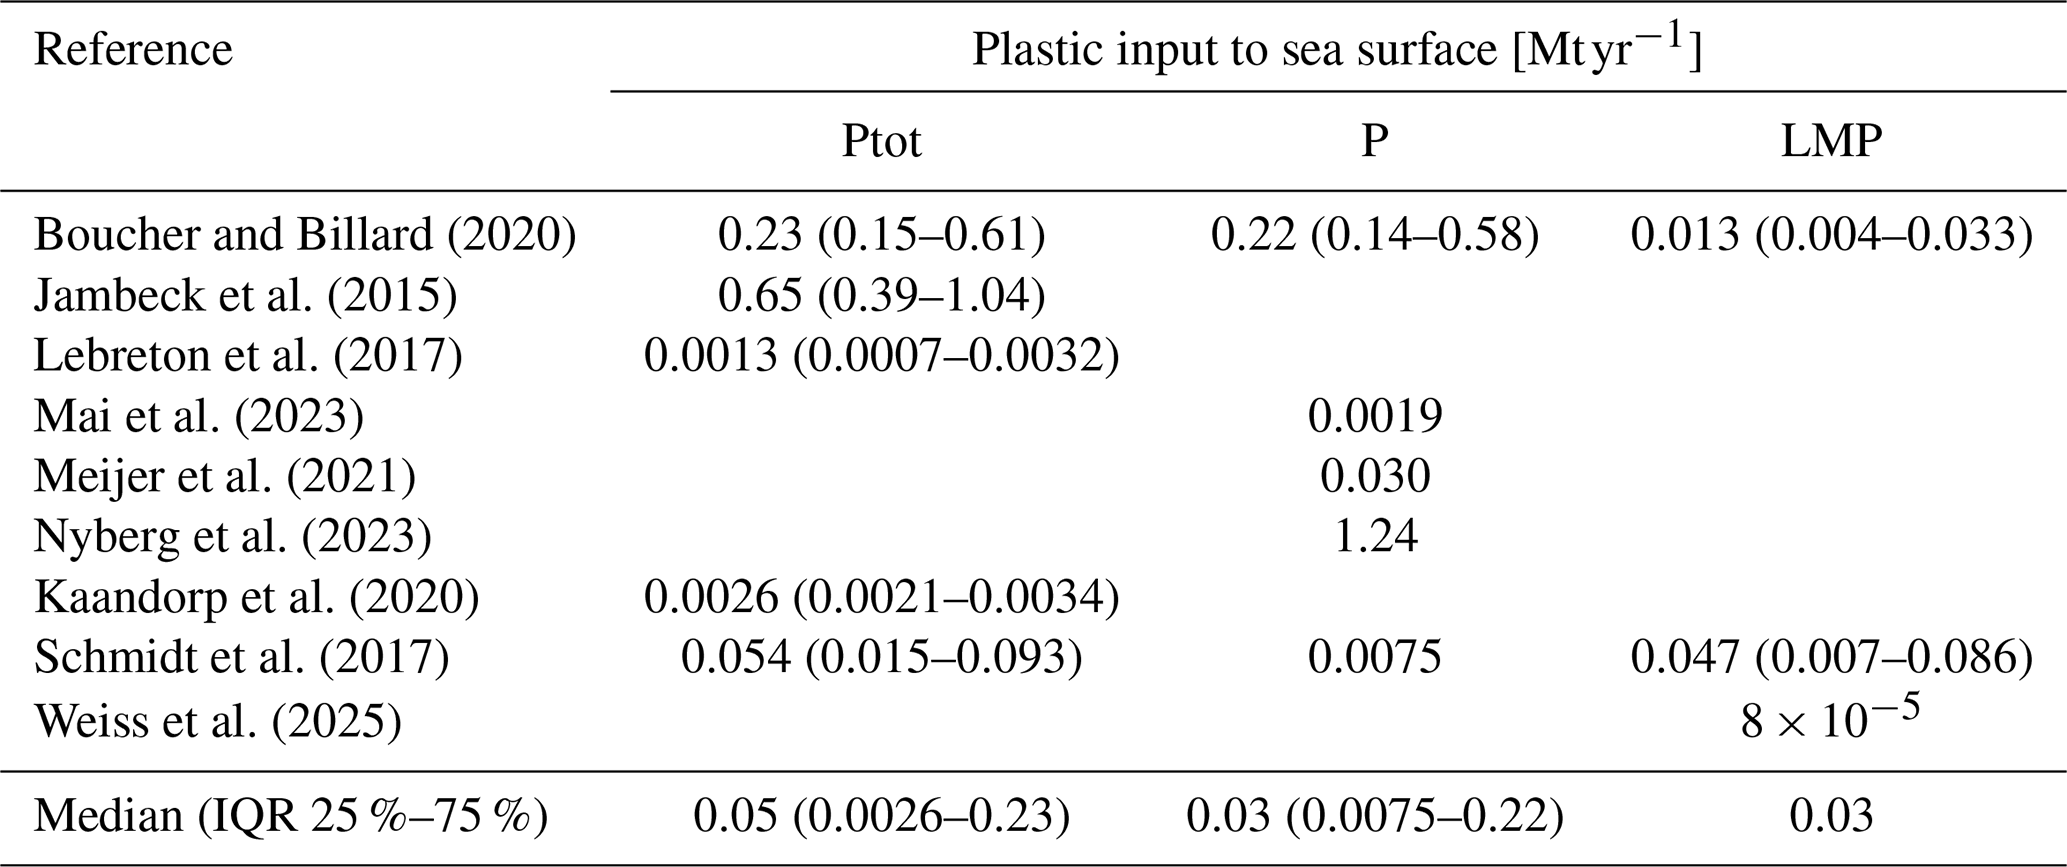
We reviewed nine modeling studies on plastic input from land to sea, six of them calibrated with observed plastic fluxes (Boucher and Billard, 2020; Kaandorp et al., 2020; Lebreton et al., 2017; Mai et al., 2023; Meijer et al., 2021; Schmidt et al., 2017; Weiss et al., 2025) and the remaining two using only human activity and hydrology data (coastal population, MMPW data, river flow) (Jambeck et al., 2015; Nyberg et al., 2023). Among the nine studies reviewed, only three focused exclusively on the Mediterranean region (Boucher and Billard, 2020; Kaandorp et al., 2020; Weiss et al., 2025), while the other studies were calibrated globally and their results isolated for the Mediterranean region. The results of this review are presented in Table 4.
Boucher and Billard (2020)Jambeck et al. (2015)Lebreton et al. (2017)Mai et al. (2023)Meijer et al. (2021)Nyberg et al. (2023)Kaandorp et al. (2020)Schmidt et al. (2017)Weiss et al. (2025)Table 4Literature review of plastic input to the Mediterranean Sea surface. , P≥5 mm, , and .
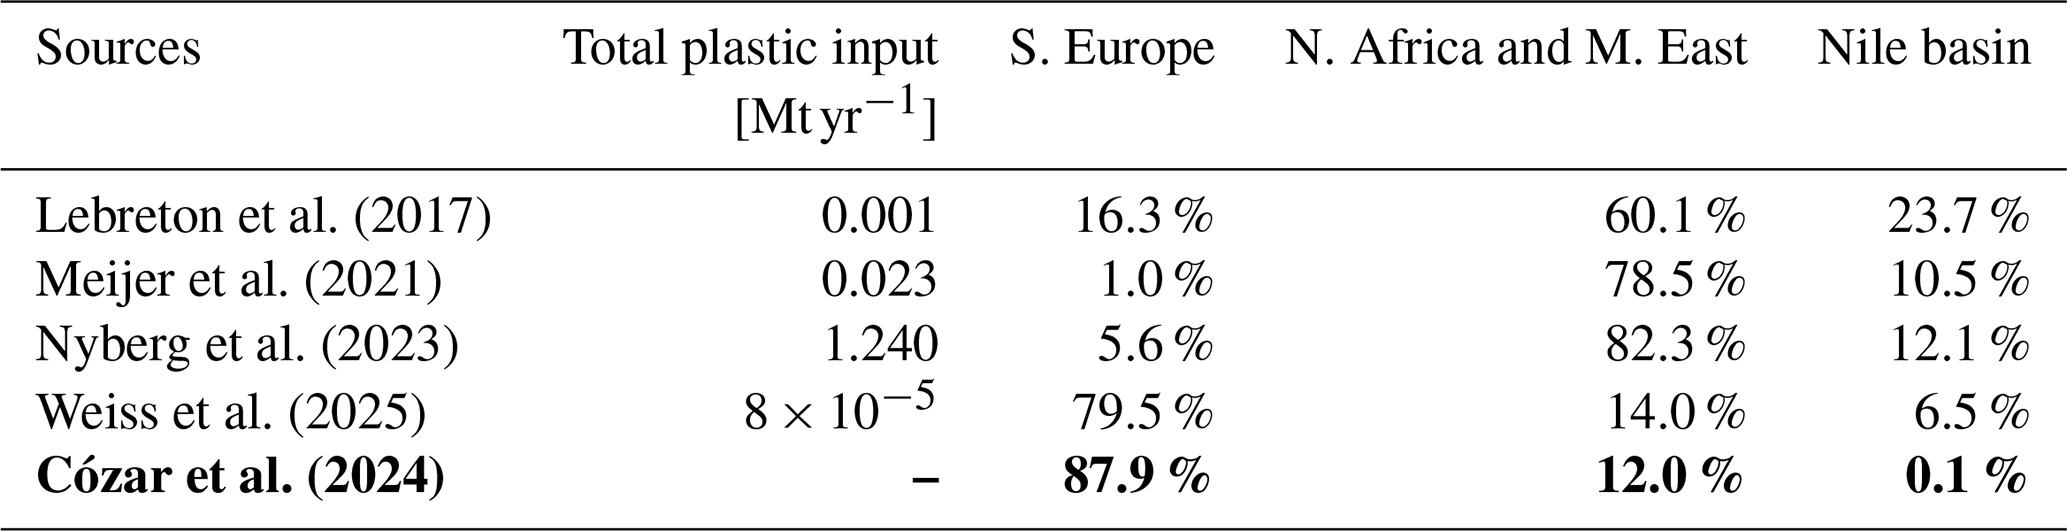
To estimate the relative contribution of each region to the total plastic input from land to sea, the observations of Cózar et al. (2024) were used. This study links floating marine litter (mostly macroplastic) aggregates at the Mediterranean Sea surface, visible through satellite imaging, to land-based sources. Cózar et al. (2024) found that the geographical distribution of plastic inputs is dominated by S. Europe (87.9 %), followed by N. Africa and M. East (12.0 %) and then the Nile basin (0.1 %). These results differ from several earlier studies that estimated the geographical distribution of plastic input from land to sea globally (Lebreton et al., 2017; Meijer et al., 2021; Nyberg et al., 2023). For each of these three studies, we extracted the Mediterranean data from the global dataset and the relative contribution of each region, computed in QGIS (version 3.28.4). Table 5 summarizes the different results. The studies of Lebreton et al. (2017), Meijer et al. (2021), and Weiss et al. (2025) are calibrated on a global dataset, which includes limited observations from Mediterranean rivers and does not include any African rivers. The model from Nyberg et al. (2023) is not calibrated against observed data. For these reasons, we consider that these three earlier studies are less robust in representing the geographical repartition of plastic inputs at the Mediterranean scale. We therefore decided to adopt the Cózar et al. (2024) results on macroplastic distribution, as they are specifically based on Mediterranean Sea observations. A detailed decision table supporting this choice is presented in Table S4 in the Supplement. In the absence of other reliable estimations on LMP and SMP input distribution, the Cózar et al. (2024) percentages (Table 5) were applied to LMP and SMP for computing plastic input to sea in Eq. (6).
Lebreton et al. (2017)Meijer et al. (2021)Nyberg et al. (2023)Weiss et al. (2025)Cózar et al. (2024)Table 5Estimation of the relative contribution of Mediterranean regions to the total plastic input to the sea.
2.4 Model calibration
To calibrate the model, the mass transfer coefficients (set of all k values) have to be determined. In this study, most of the k values were fitted so that the model output aligns with the median of the observations (see Fig. 4). The uncertainties of the k values were optimized to match the uncertainty of the literature observations in the corresponding downstream boxes. All the SMP k values (except for continental inputs) were imported from the Sonke et al. (2025) global box model. We acknowledge that the behavior of SMP might be significantly different between the global and regional scale, and therefore we consider this study to be a first approximation. We recall that SMP is an important size category to incorporate into our outlook, despite the uncertainties, since their potential toxicity is a major concern for the environment.
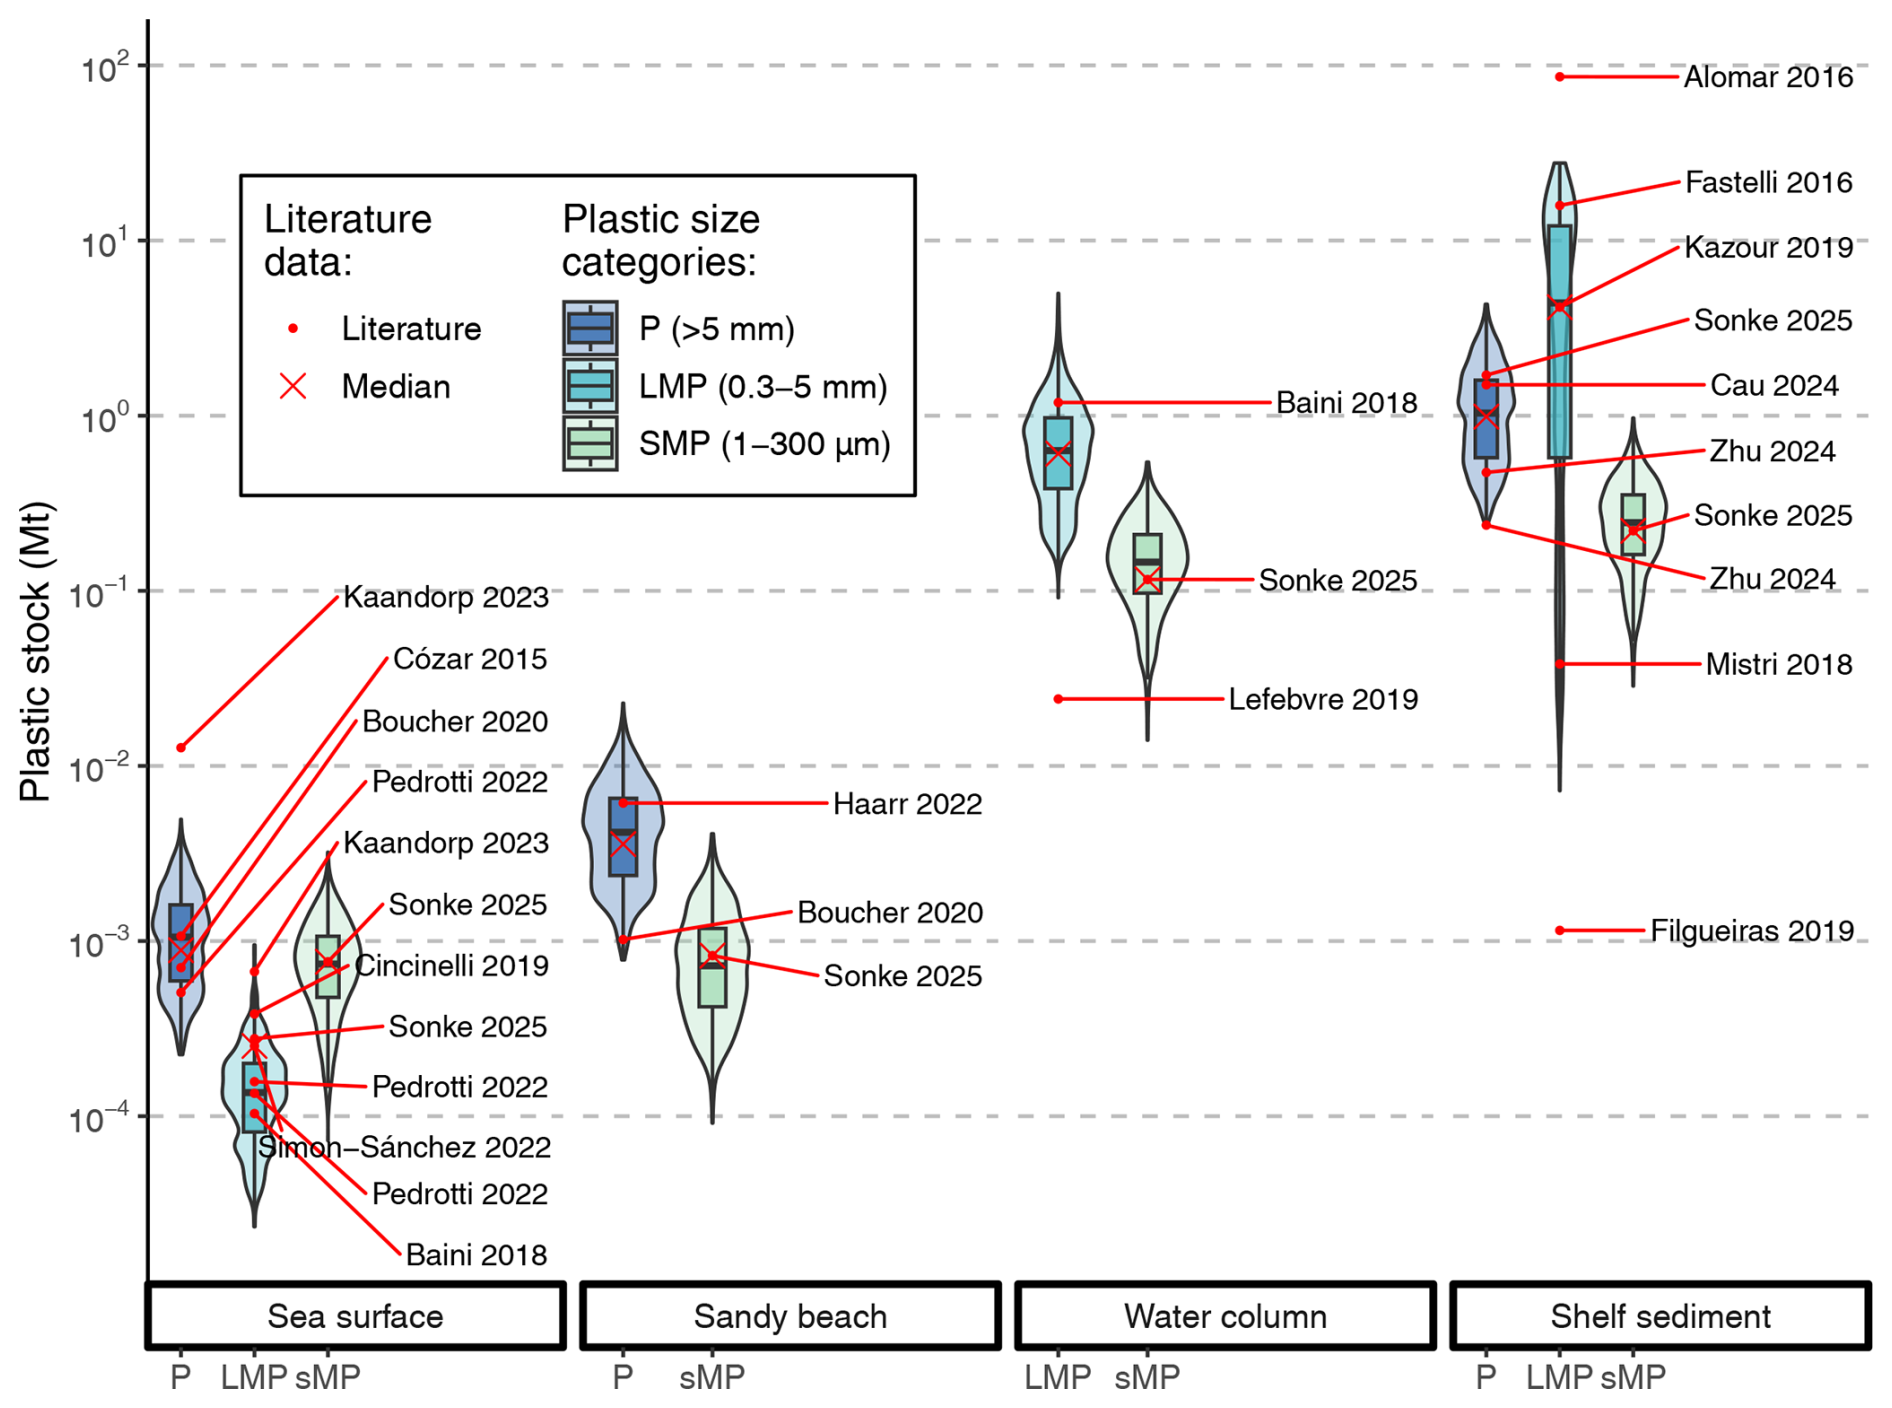
Figure 4Model calibration for the year 2015. The Monte Carlo model output distribution (N=1000 iterations) for the year 2015 is represented by violins and boxplots and compared with the literature data (red dots). The median of the literature data points is represented by a red cross. Only boxes with corresponding literature data are plotted. Note that the y axis is log-scaled and common to all the compartments.
The coefficients for terrestrial input from the MMPW pool to the Mediterranean Sea surface are computed using Eq. (6):
MMMPW [Mt] is the estimated terrestrial MMPW stock in the region R in 2015 (estimated after a single model iteration), and finput [–] is the relative contribution of each region to the total plastic runoff (see Table 5). The total plastic input for each size category Finput [Mt yr−1] is fitted to match the corresponding plastic stock in the marine environment. Uncertainties for plastic input were simulated based on the IQR of the most uncertain box (LMP in the shelf sediment). To avoid unreasonably large uncertainties for well-documented compartments such as P and LMP at the sea surface, the sinking k value from the sea surface to the shelf sediment is set to be proportional to the total LMP input from the MMPW terrestrial pool. As a result, extreme runoff of LMP to the sea surface would be compensated for by a corresponding change in LMP sinking.
2.5 Model scenarios
Following model calibration, we explore different plastic production and waste management scenarios to estimate the evolution of environmental plastic stocks and fluxes. Three OECD and one remediation scenario were simulated from 1950 to 2060 (and beyond to 2100, keeping OECD statistics fixed after 2060), from low to high ambition (OECD, 2022):
-
Business-as-usual (BAU). The BAU scenario is a simple projection of the historical plastic waste generation toward 2060. This scenario assumes that no further policies restricting plastic usage will be adopted and accounts for the increase in population and income. BAU predicts that plastic production and waste generation will roughly triple by 2060. Note that this scenario accounts for improvements in recycling fraction (from 11 % in 2015 to 27 % in 2060 for S. Europe and from 5 % in 2015 to 10 % in 2060 for N. Africa, M. East, and the Nile basin) and the lowering of mismanaged fractions in all regions (from 7 % in 2015 to >1 % in 2060 for S. Europe and from 53 % in 2015 to 34 % in 2060 for N. Africa, M. East, and the Nile basin, see Fig. 5).
-
Regional action (OECD-RA). This scenario consists of a global reduction of 18 % of plastic waste generation compared to the 2060 BAU projection, linearly increasing from 2025. The OECD-RA also sets recycling goals toward 2060 for different economic regions: a 40 % recycling rate for EU countries (assimilated to S. Europe) and 20 % for other countries (assimilated to N. Africa, M. East, and the Nile basin) by 2060, linearly increasing from 2025. Similarly, OECD-RA aims to reduce the fraction of MMPW by 2060 to <1 % in S. Europe and 7 % for N. Africa, M. East, and the Nile basin (see Fig. 5).
-
Global Ambition (OECD-GA). More ambitious than the OECD-RA scenario, it aims to enhance the recycling rate to 80 % by 2060 for EU countries (assimilated to S. Europe) and 60 % for N. Africa, M. East, and the Nile basin. Additionally, OECD-RA aims to reduce the fraction of MMPW by 2060 to <1 % for all regions (see Fig. 5). This scenario also aims to reduce plastic waste generation by 33 % globally compared to the 2060 BAU projection.
-
Remediation. Alongside the OECD-GA measures, we propose a remediation scenario where macroplastics, P, from the MMPW terrestrial pool is removed and stored in sanitary landfills where we suppose no leakage to the rest of the environment. This can be achieved by dedicated waste management, remediation efforts and cleaning campaigns and by increasing education and awareness of populations. Several options for this remediation are possible, but we arbitrarily choose to set an objective of 25 % remediation of the MMPW P pool per year by 2060, linearly increasing from 2023 for all three regions.
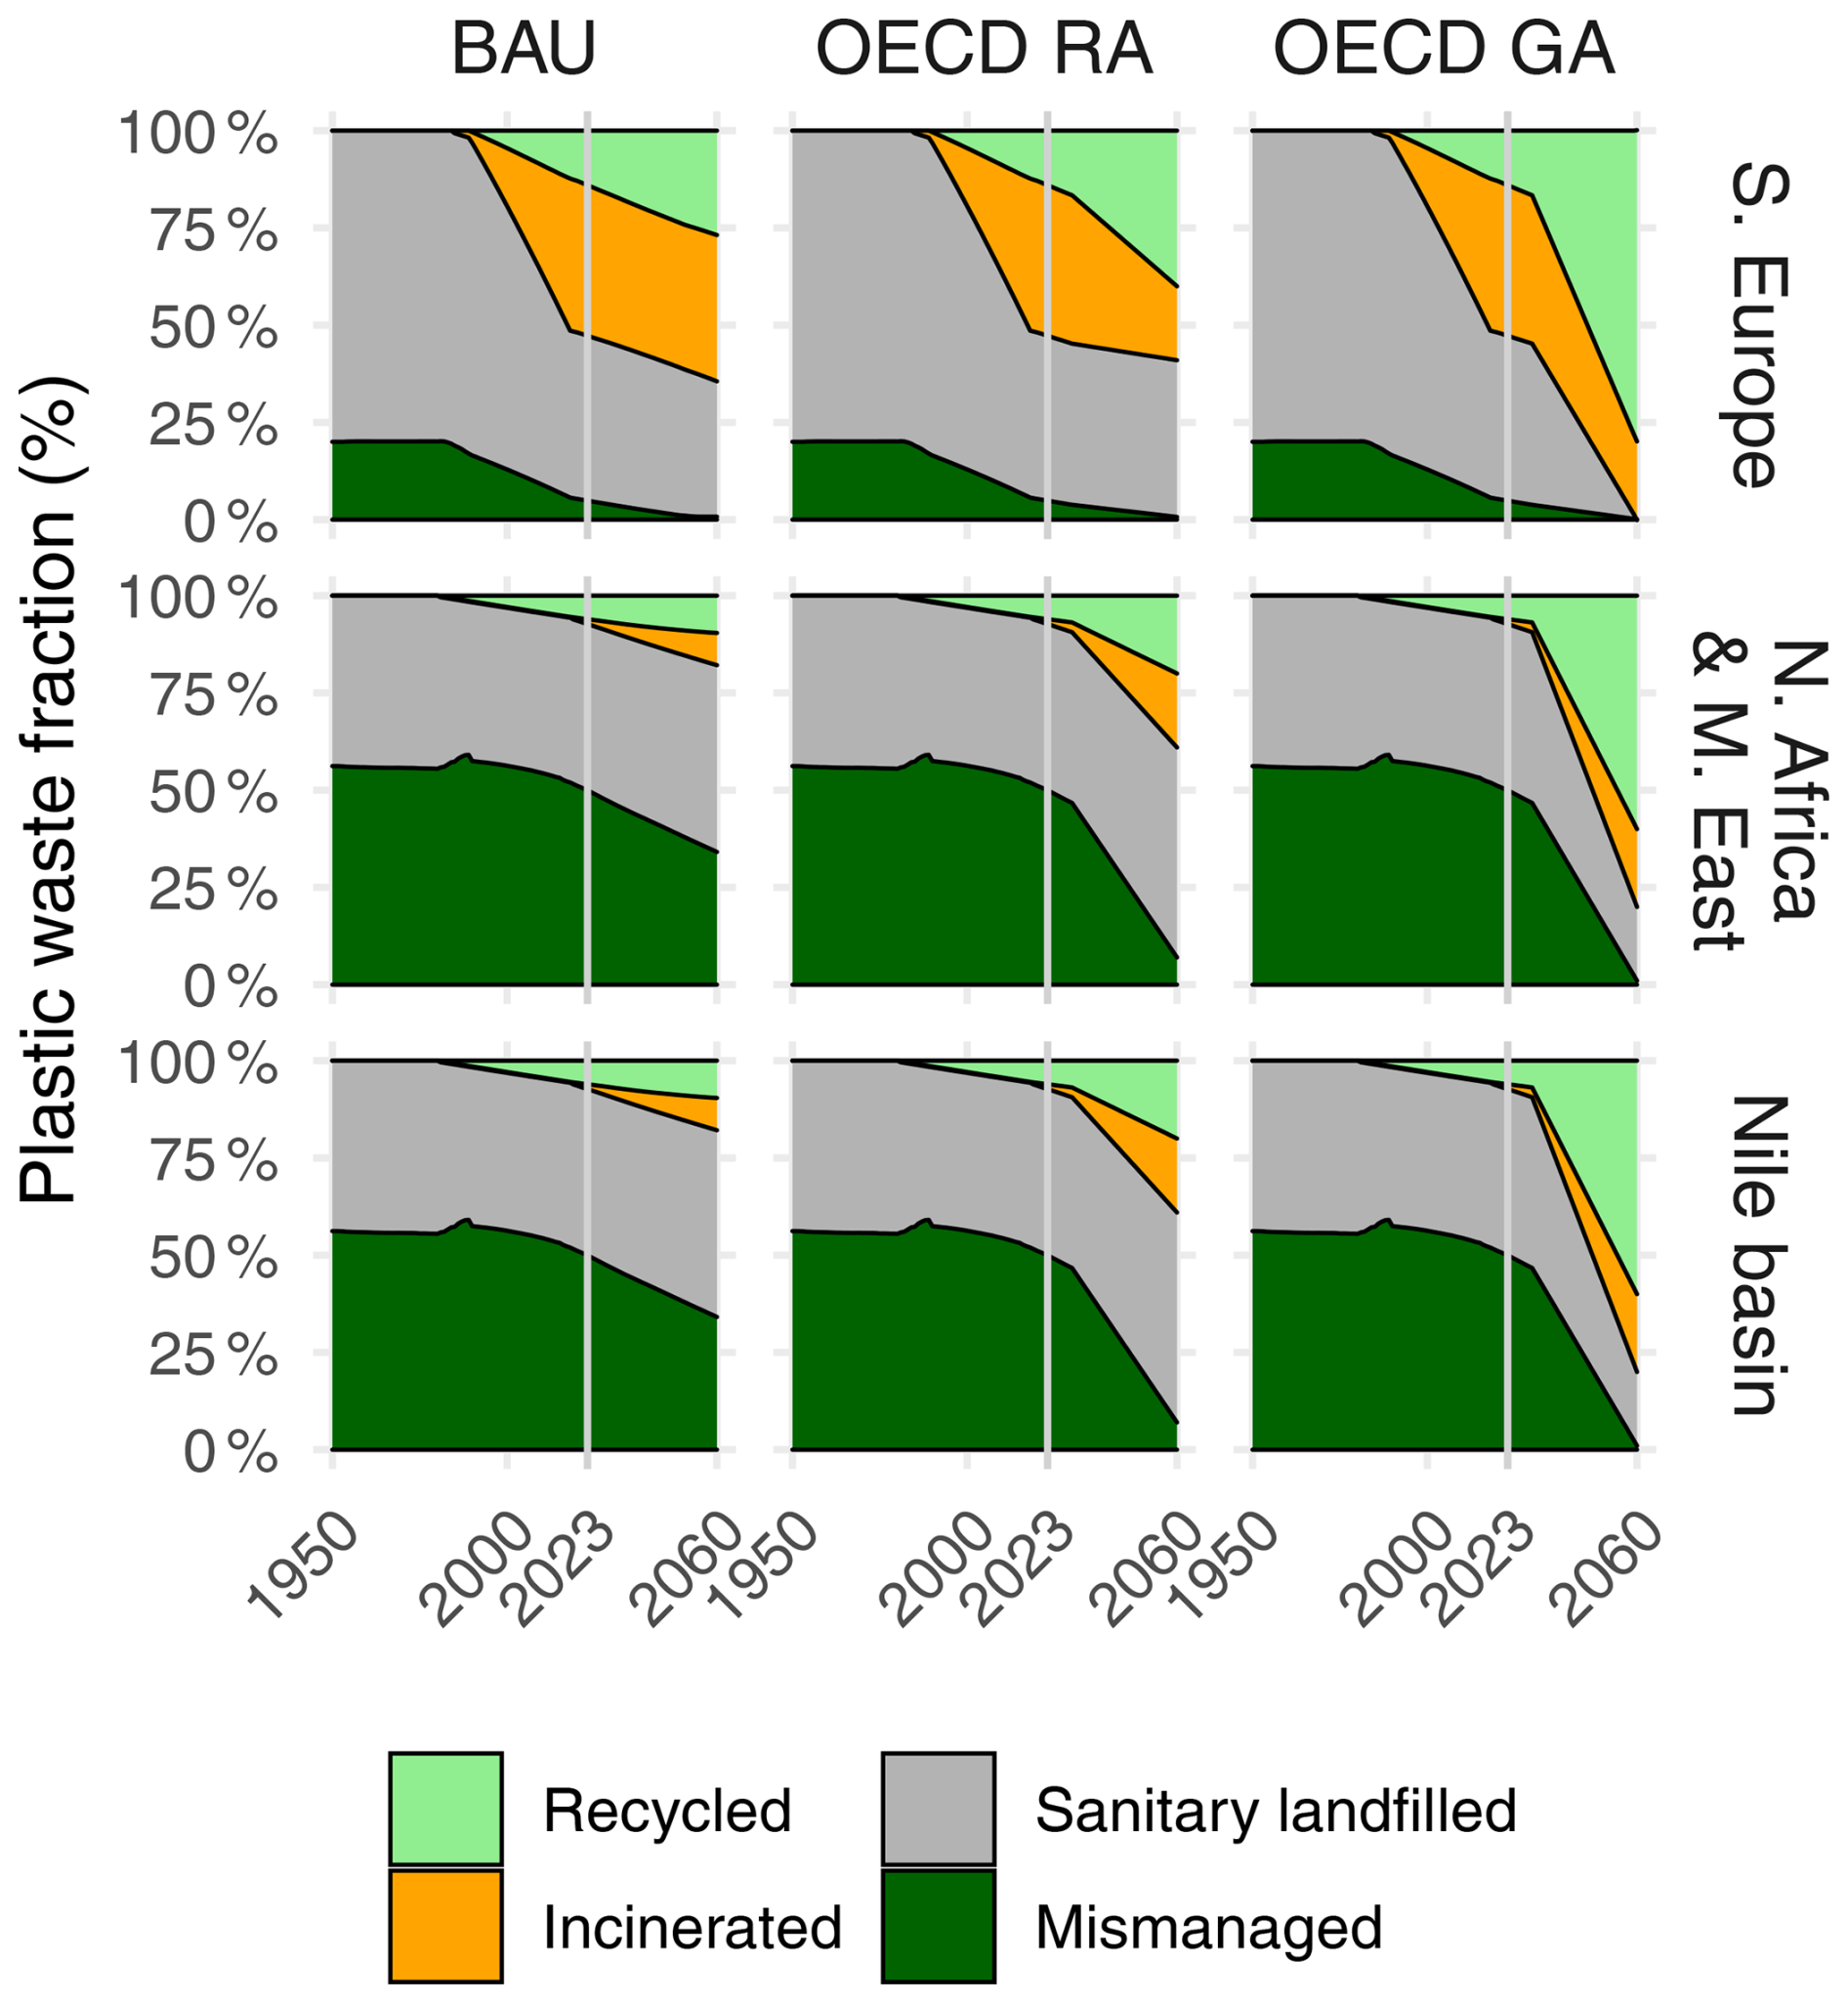
Figure 5Fate of plastic waste for each scenario modeled. Data from OECD report (OECD, 2022). BAU: business-as-usual scenario, OECD-RA: regional action scenario, OECD-GA: Global Ambition scenario. The remediation scenario uses the same plastic waste fate parameters as OECD-GA and is therefore not represented here.
We first present and discuss the modern Mediterranean plastic budget for 2015, with key metrics based on production and waste statistics, environmental plastic observations, and model estimates (Fig. 2). We recall that model fluxes are optimized to fit median plastic stock observations (Fig. 4).
Based on OECD statistics, 476 ± 24×106 metric tonnes (Mt) of plastic waste was generated in the Mediterranean Sea basin between 1950 and 2015, of which 21 ± 1 Mt was recycled (4 %), 55 ± 4 Mt was incinerated (12 %), 290 ± 16 Mt was buried in sanitary landfills (61 %), and 110 ± 17 Mt was mismanaged (23 %). Based on OECD statistics, we estimate that the region which generates the most plastic waste yearly is S. Europe with 67 % (14 Mt yr−1) of the total plastic waste generation (21 Mt yr−1), followed by N. Africa and M. East with 19 % (4 Mt yr−1) and then the Nile basin with 14 % (3 Mt yr−1). We estimate that 7 Mt (median, IQR 3–15 Mt) of plastic is present in the marine environment (sea surface, water column, sandy beaches, and shelf and deep sediments), which represents 1.5 % of the total plastic waste generated in the Mediterranean Sea basin since 1950. This corresponds to a total plastic input from land to sea of 0.31 Mt yr−1 (median, IQR 0.14–0.57 Mt yr−1) in 2015. Following Cozar et al. (2024), the region contributing the most to plastic input to sea is S. Europe with 88 % (0.27 Mt yr−1), followed by N. Africa and M. East with 12 % (0.04 Mt yr−1) and finally the Nile basin with 0.1 % (0.0003 Mt yr−1). Based on our observation-calibrated model, we estimate that 83 % of the plastic mass in the Mediterranean marine environment is concentrated in the shelf sediments (median 6 Mt, IQR 2–14 Mt). The Mediterranean Sea surface contains only 0.03 % (median Mt, IQR –) of the total mass of marine plastic.
3.1 Demographic trends toward 2060
Before discussing modeled plastic dispersal from the present day to 2060, we first summarize important demographic trends in the Mediterranean basin that will influence MMPW generation and input to the sea. The population in the Mediterranean catchment is expected to increase by 44 % by 2060 compared to present values (540 M people in 2023 to 775 M people in 2060; UN, 2022; WorldPop, 2020). This increase is mainly attributed to countries in the Nile basin (see Figs. 3 and S3 in the Supplement), with an additional 200 million people in less than 40 years. Combining population statistics (UN, 2022; WorldPop, 2020) and OECD MMPW per capita data (OECD, 2022), we calculate that the average Mediterranean catchment population generates around 10 kg of MMPW per year per person (7 kg yr−1 per capita for S. Europe and the Nile basin, and 20 kg yr−1 per capita for N. Africa and M. East; OECD, 2022), which is similar to our estimated global average (9 kg yr−1 per capita). The average plastic input to the Mediterranean Sea is 0.7 kg yr−1 per capita (S. Europe: 2.4 kg yr−1 per capita; N. Africa and M. East: 0.4 kg yr−1 per capita; Nile basin: 0.002 kg yr−1 per capita; global: 2.2 kg yr−1 per capita). The S. Europe population has a low MMPW generation per capita but a high plastic input to sea per capita. On the contrary, N. Africa and M. East have a high MMPW generation per capita and a low plastic input to sea per capita. S. Europe, N. Africa, and M. East have a similar population density and similar distance from the coast; this suggests that the difference in per capita contribution to the plastic input to sea is mainly due to other factors, in particular higher rainfall and associated flood events in S. Europe (Cózar et al., 2024). Despite hosting the largest population in the whole Mediterranean catchment (51 % in 2023) and having high MMPW generation rates (about half of all plastic waste generated are mismanaged in 2023), the Nile basin has low contributions to both MMPW generation per capita (0.7 kg yr−1 per capita, similar to S. Europe) and per capita plastic input to sea (0.002 kg yr−1 per capita, 1000 time less than S. Europe). This is probably due to the great length of the Nile River (6700 km) and the numerous dams, known to trap MP (Watkins et al., 2019) and likely macroplastics, that have been constructed along its course. All per capita data for the years 2023 and 2060 under BAU are available in Table S5 in the Supplement.
3.2 Total plastic waste generation and terrestrial MMPW
Figure 7a shows the amount and fate of total plastic waste generated in the Mediterranean basin based on OECD statistics (OECD, 2022). Under the BAU scenario, plastic waste generation is expected to increase by 190 % by 2060 and by more than 400 % by 2100, due to the increase in population and plastic consumption in the Nile basin. In OECD policy scenarios, emphasis is put on enhancing the recycled fraction (+320 % in OECD-RA and +530 % in OECD-GA, averaged in the whole Mediterranean region) and reducing the mismanaged fraction (−80 % in OECD-RA and −97 % in OECD-GA) by 2060. Total plastic waste generation is also expected to increase less by 2060 under OECD scenarios, from 60 Mt yr−1 (2060, BAU) to 50 Mt yr−1 (2060, OECD-RA) to 40 Mt yr−1 (2060, OECD-GA). This however means that plastic waste generation will increase by at least 90 % by 2060 compared to 2015 (21 Mt yr−1) under OECD scenarios.
Under the BAU scenario, the modeled terrestrial MMPW stock increases by more than 330 %, from 72 Mt in 2015 to 310 Mt in 2060. This rise is mainly due to an increase in MMPW quantity in N. Africa and M. East (+430 %, Fig. 6b) and the Nile basin (+730 %). The model also shows that efforts in reducing the mismanaged fraction implemented in OECD scenarios would allow this stock to be lowered to 220 Mt under OECD-RA or to stabilize at around 180 Mt under OECD-GA by 2060. We estimate that the implementation of remediation measures to remove P from this pool will further help to reduce it to 90 Mt (P: 3 %, LMP: 34 %, SMP: 62 %) by 2060.
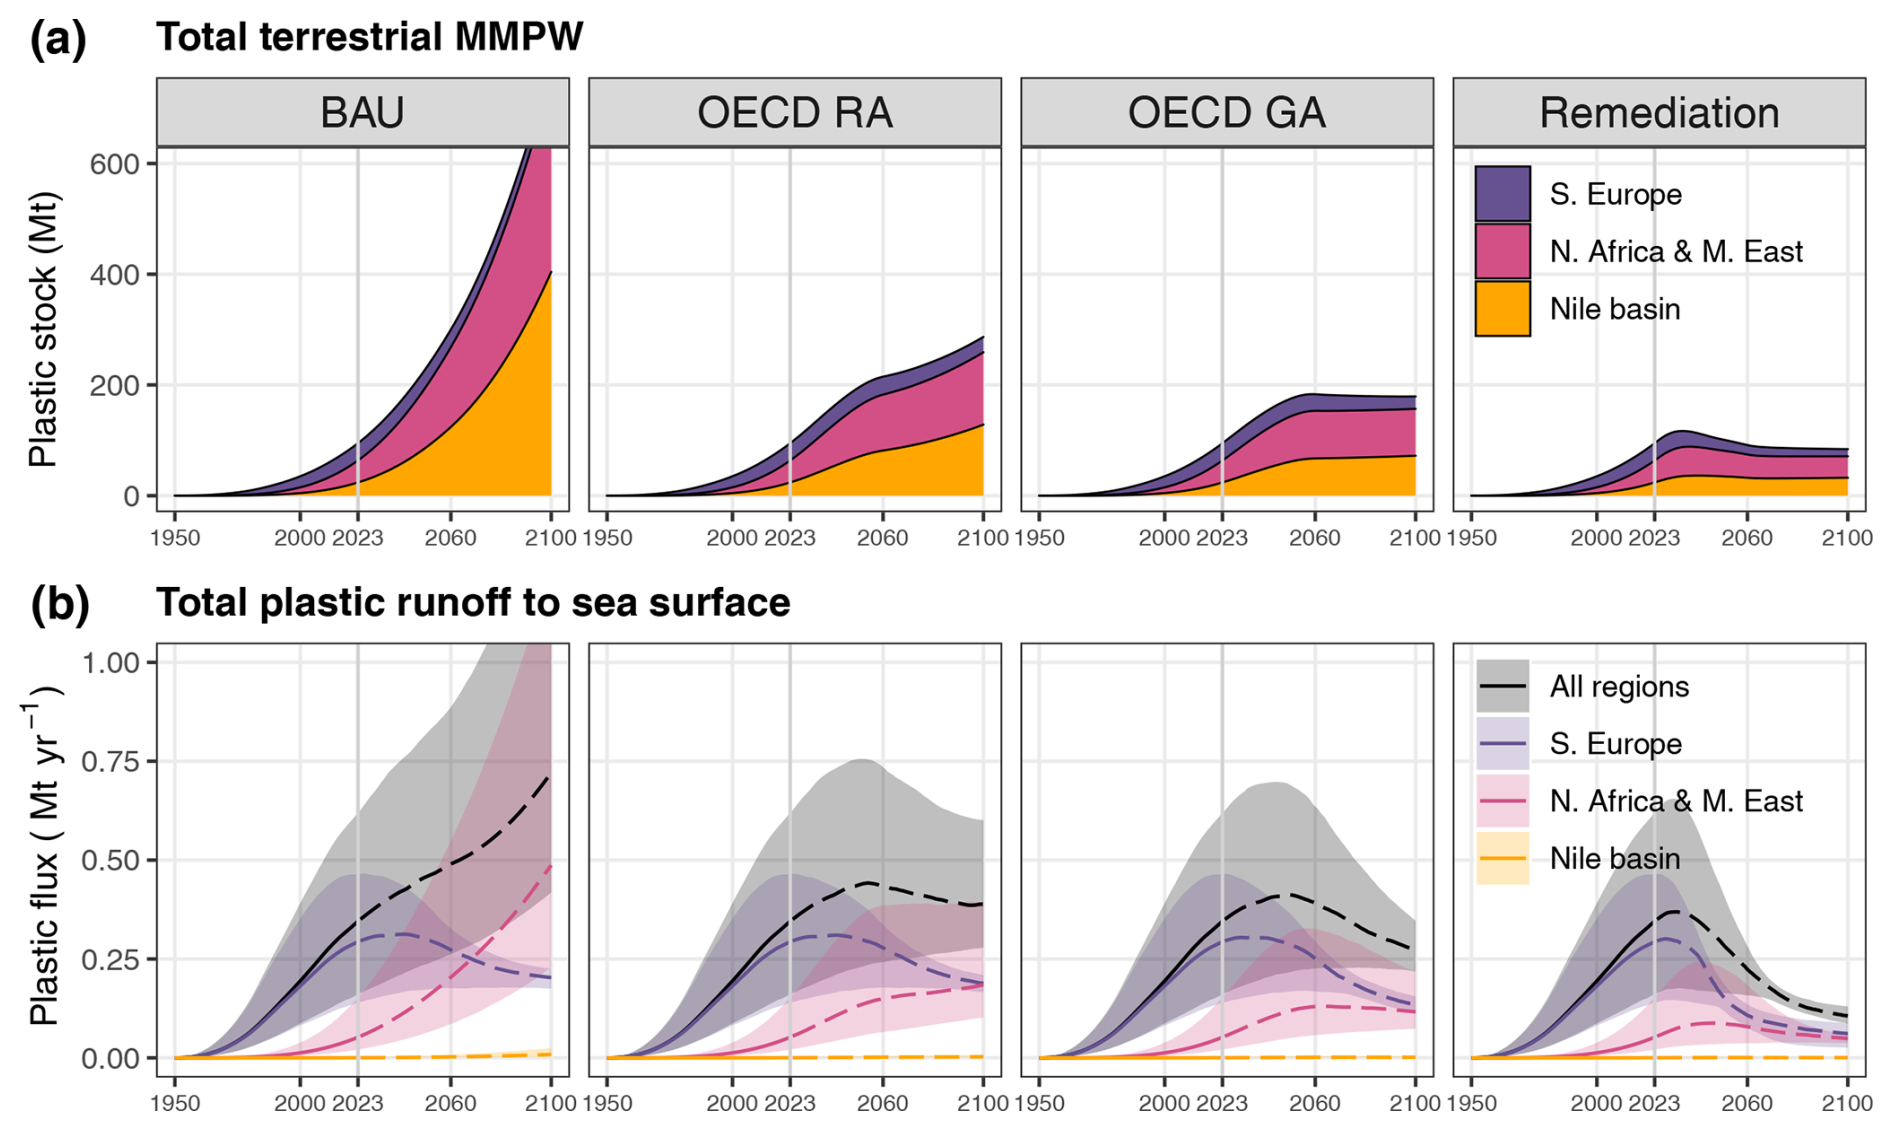
Figure 6Total terrestrial mismanaged plastic waste (a) and total plastic input to the Mediterranean Sea surface (b) according to the four modeled scenarios: business-as-usual scenario (BAU), regional action scenario from OECD (OECD-RA), Global Ambition scenario from OECD (OECD-GA), and OECD-GA and terrestrial removal of mismanaged P (remediation). See Fig. 1 for region delimitation.
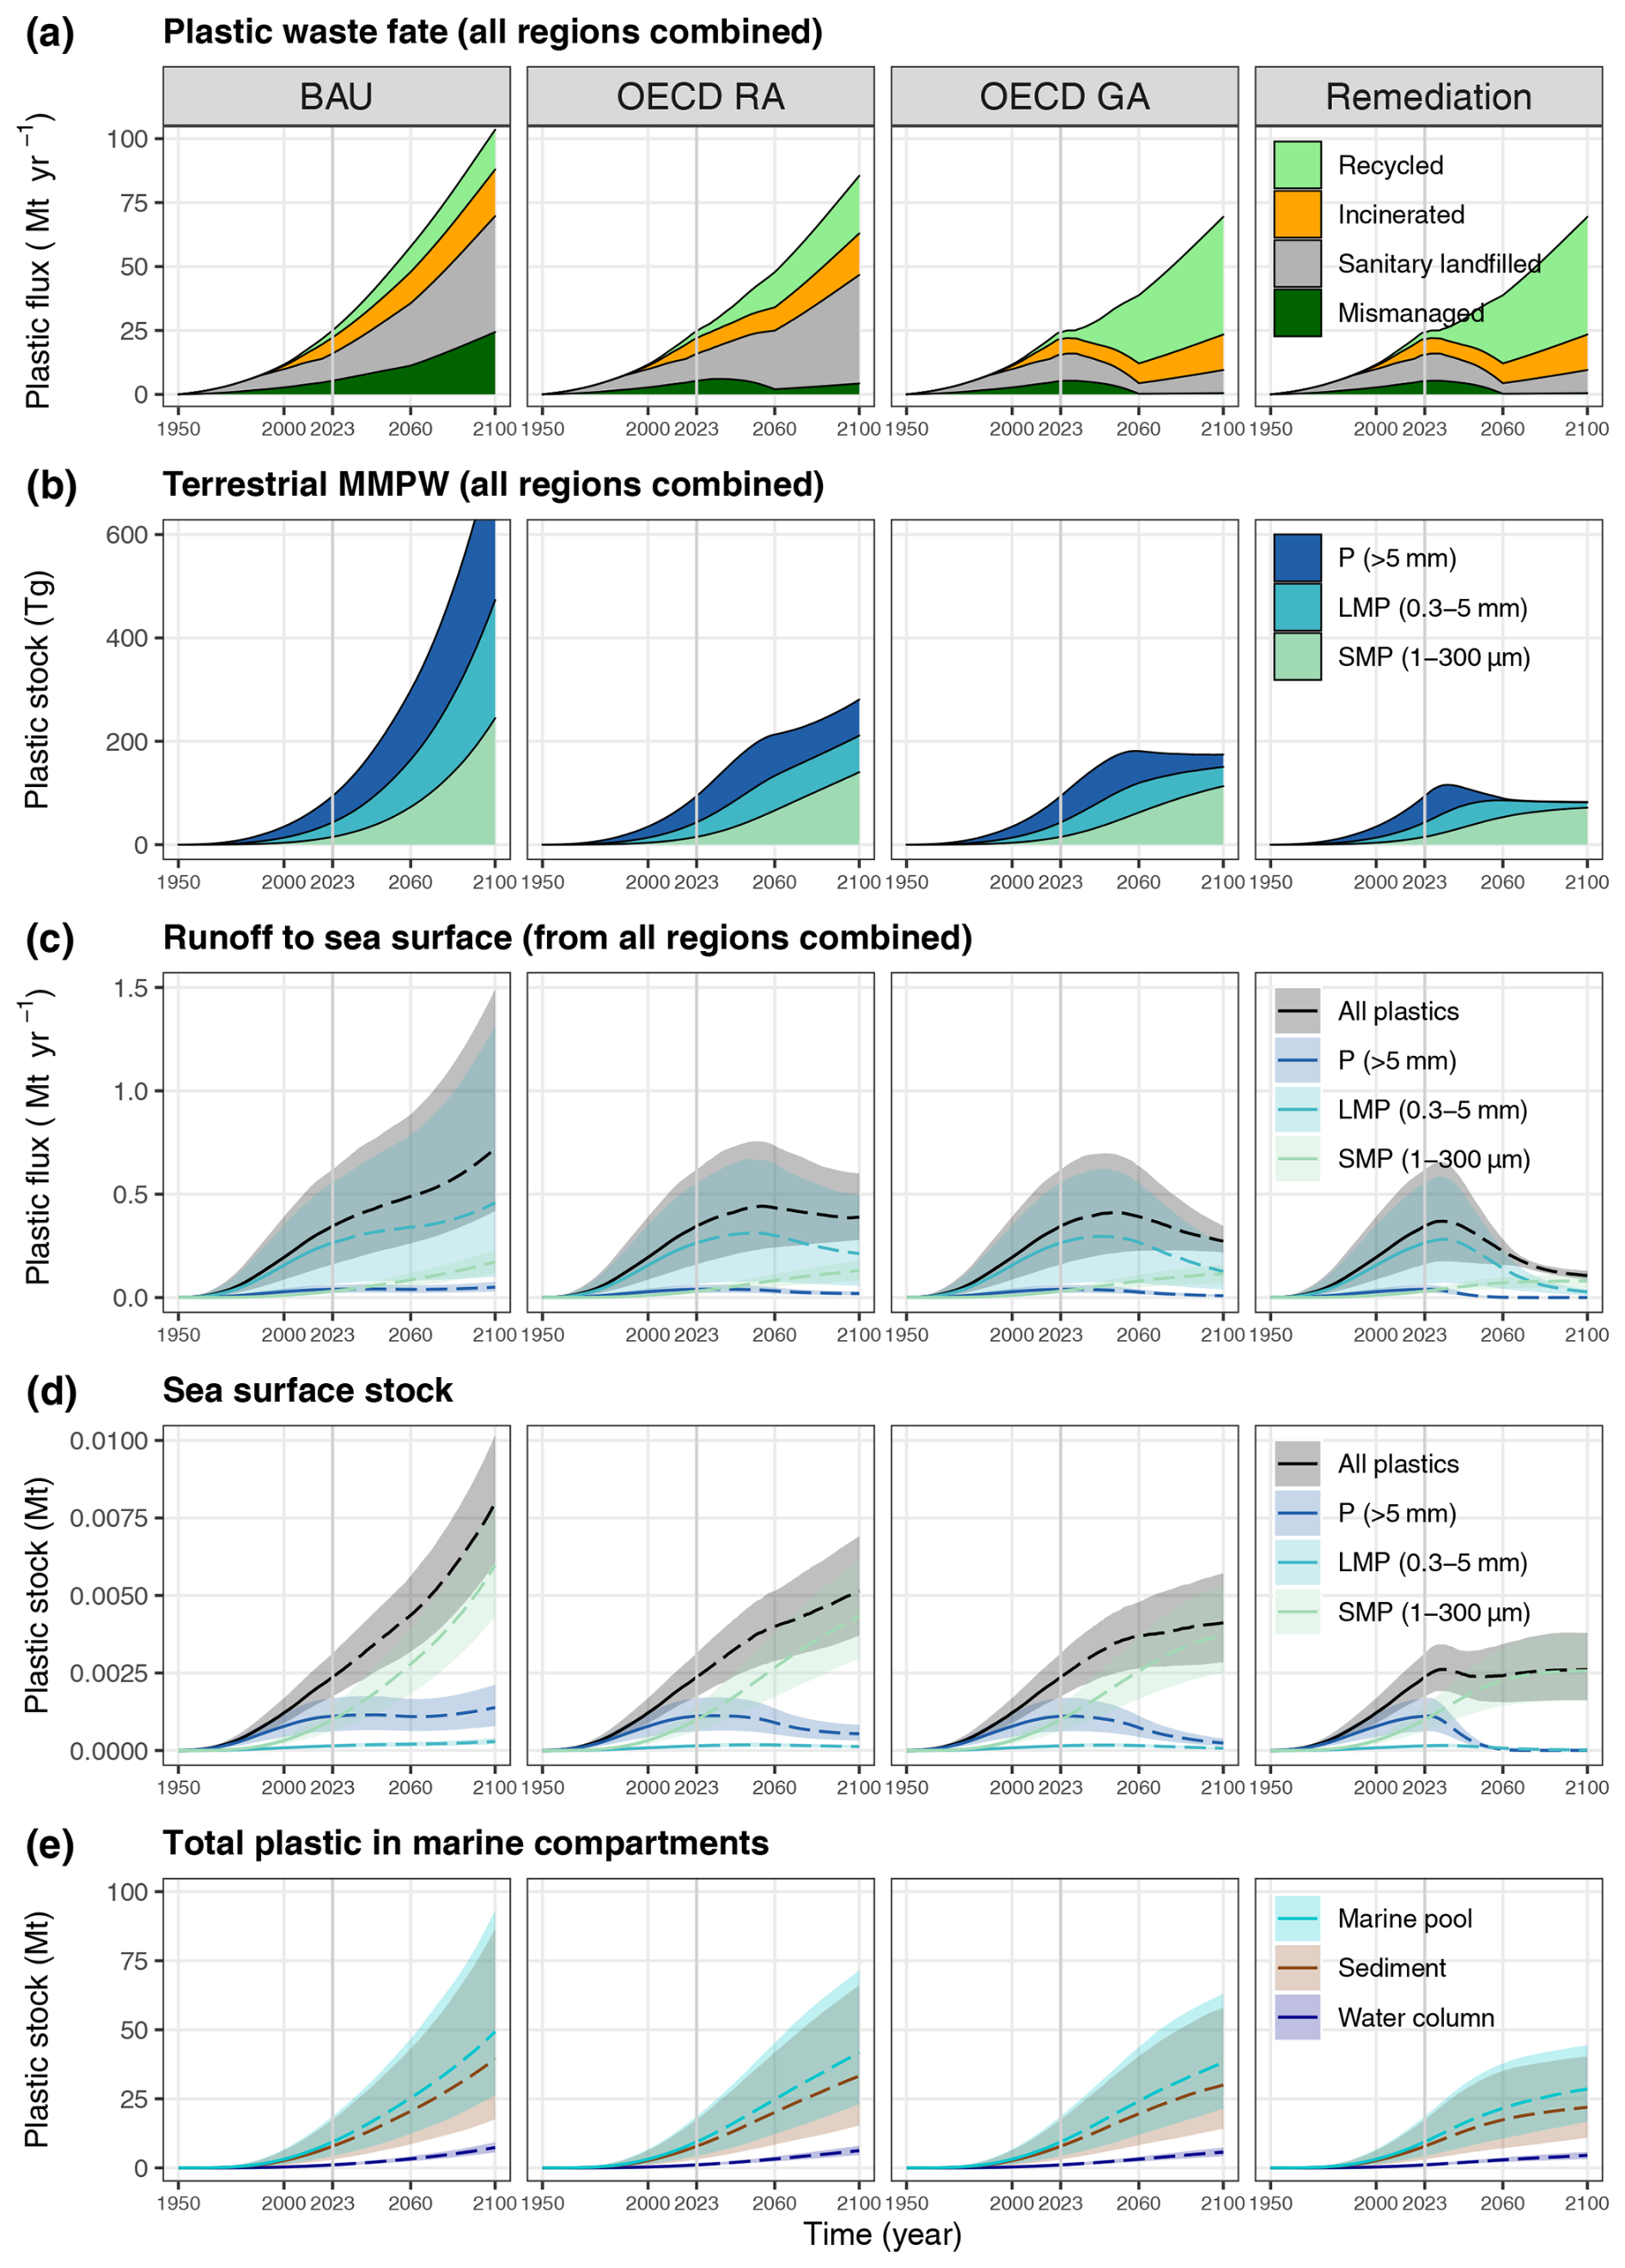
Figure 7Comparison of the plastic transport to the marine environment between the four modeled scenarios: total plastic waste generation and fate (a); total terrestrial mismanaged plastic waste (b); plastic input to sea surface (c); Mediterranean Sea surface stock (d); and marine total plastic stock (e), including water column and total sediment (shelf and deep sediments). P: macroplastics (>5 mm), LMP: large microplastics (0.3–5 mm), and SMP: small microplastics (1–300 µm). BAU: business-as-usual scenario; OECD-RA: regional action scenario from OECD; OECD-GA: Global Ambition scenario; and remediation: removal of P in the MMPW terrestrial pool, alongside OECD-GA measures, with an objective of 25 % remediation per year in 2060, increasing linearly from 2025. Uncertainties are the interquartile range (Q25–Q75).
The modeled terrestrial remediation scenario would require a considerable cleaning effort: 2.7 Mt of mismanaged terrestrial P removed per year on average for the period 2025–2060. This effort will peak to a removal of 4 Mt yr−1 around 2040, which is very substantial: roughly 400 times superior to the current (2023) global cleaning efforts by the NGO “The Ocean Cleanup” in rivers. However, this effort would be, at its maximum, equivalent to a daily removal of 17 g of mismanaged macroplastics per person, which is about half the weight of a standard 1.5 L plastic bottle. On average, this value would be 11 g per capita per day (roughly the weight of two credit cards).
3.3 Plastic input to the sea
The simulated total plastic input to the Mediterranean Sea is presented in Fig. 7c, and under the BAU scenario, it is expected to increase by 40 % by 2060 compared to present values, reaching 0.49 Mt yr−1 (0.35 Mt yr−1 in 2023). The OECD-RA scenario stabilizes total plastic input at 0.43 Mt yr−1, and OECD-GA allows a decrease in plastic input to sea below the 2023 value by the end of the century. The remediation scenario would lower plastic input to sea below the 2023 value by 2050, stabilizing at around 0.1 Mt yr−1 by the end of the century.
In the model, the total river plastic input to sea of 0.31 Mt yr−1 (median, IQR 0.14–0.57 Mt yr−1) is constrained by the amount of total plastic observed in the marine environment. Our estimate is three times higher than the upper limit proposed by the Mediterranean Lagrangian model of Kaandorp et al. (2020) (0.1 Mt yr−1 for 2015, Fig. 8). These authors did not use sediment plastic mass as a constraint in their plastic input estimate. However, this reservoir has considerable uncertainty (5 orders of magnitude), which directly influences our input estimation. A more reliable estimate of plastic mass stored in sediments would help to better constrain the model plastic input to sea. Our total plastic input to the Mediterranean Sea is in accordance with the estimation of Boucher and Billard (2020) (0.23 Mt yr−1) and Jambeck et al. (2015) (0.65 Mt yr−1). These values are among the highest estimations in the literature. Our estimate of LMP land-to-sea input of 0.24 Mt yr−1 is also much larger than a recent LMP input estimate of Mt yr−1 by Weiss et al. (2025). Again, our estimate is constrained by the total Mediterranean marine LMP pool, including deep waters and sediments, whereas the low estimate by Weiss et al. (2025) assumes an average river LMP particle weight of 0.745 and 233 µg for fibers and fragments, respectively. LMP particle volume and mass, however, are not constant and increase non-linearly across LMP particle size distributions, indicating that most mass resides in the larger LMP near the 5 mm cut-off (Kaandorp et al., 2023).
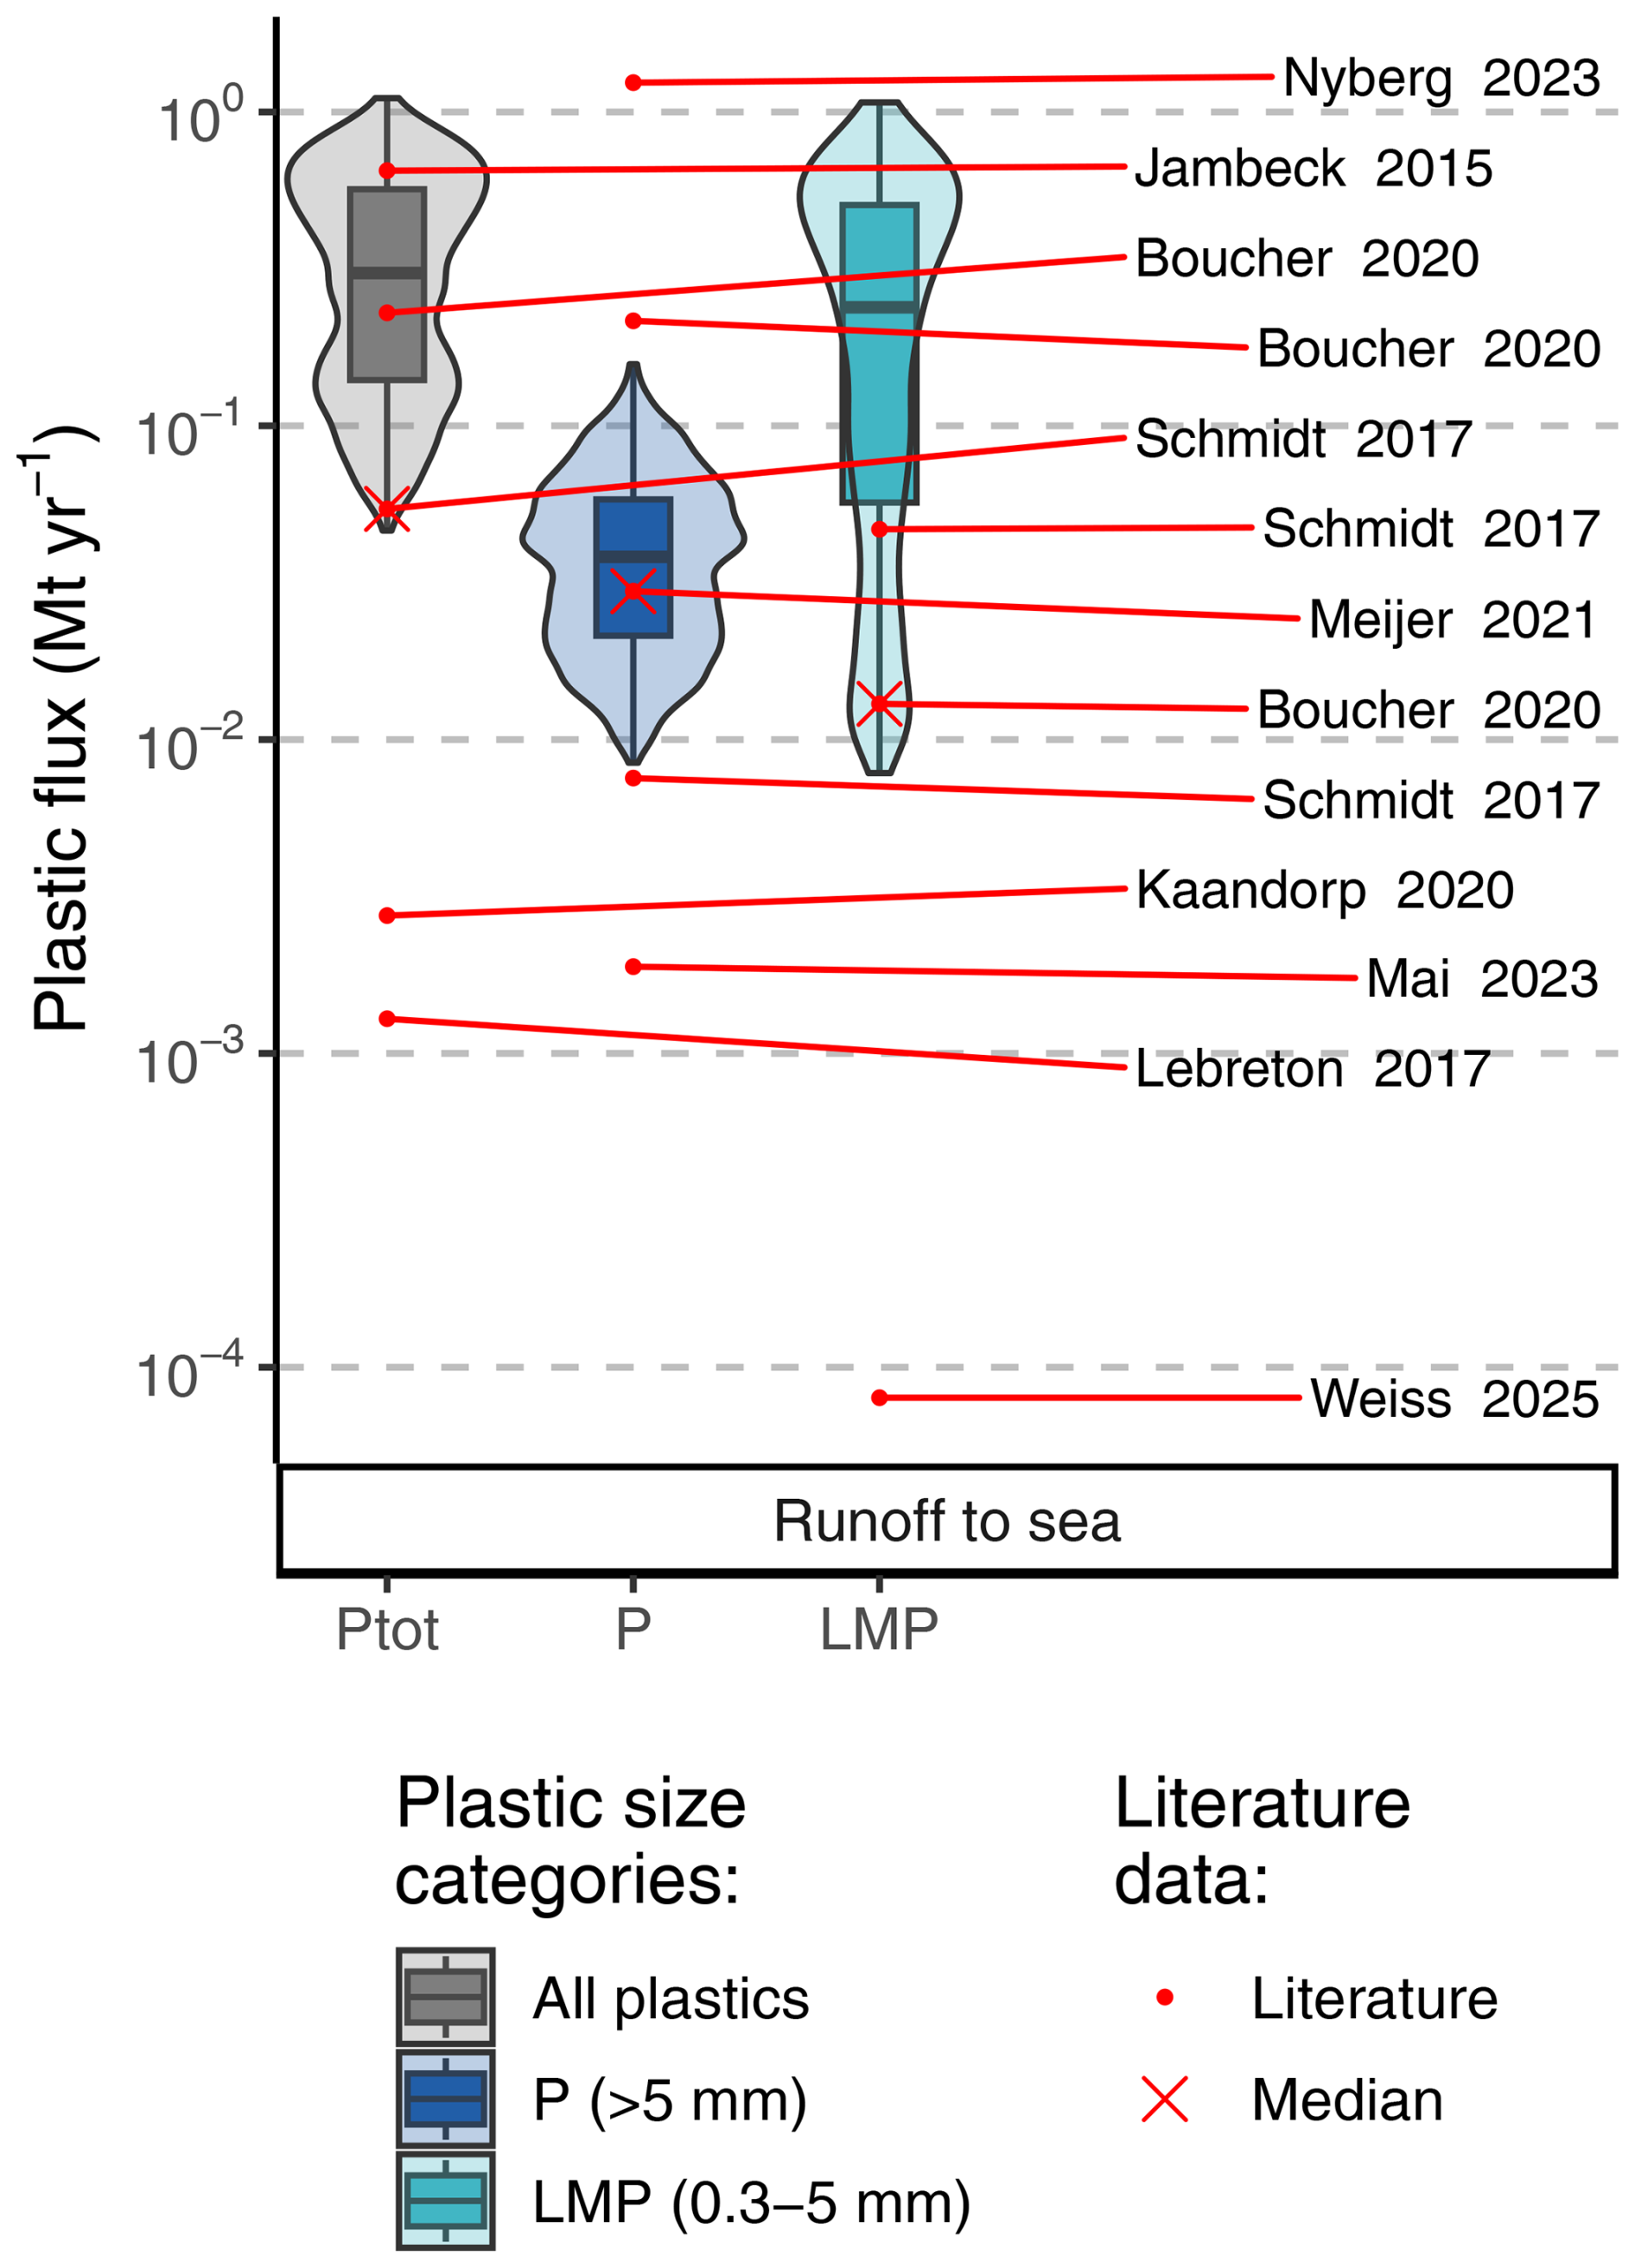
Figure 8Comparison between modeled and literature plastic input to sea. The Monte Carlo model output distribution (N=1000 iterations) for the year 2015 is represented by violin and boxplots and compared with the literature data (red dots). The median of the literature data points is represented by a red cross. Only boxes with corresponding literature data are plotted. Note that the y axis is log-scaled.
The regional distribution of plastic input to sea was constrained in our model using Cózar et al.'s georeferenced observations of near-shore floating debris. Cózar et al.'s observations suggest a different geographical plastic input distribution (S. Europe ≫ N. Africa and M. East ≫ Nile basin) compared to previous studies that estimated Mediterranean plastic input to sea by extrapolation of global river observation (N. Africa and M. East > S. Europe and Nile basin) (Table 5). In this study, we selected the observations of Cózar et al. (2024) over the older extrapolations, as discussed in the Methods section (see Sect. 2.4.6 and Table S4). These new observations are also supported by Weiss et al. (2025), who found very similar trends using a top-down approach based on population density and water runoff (Table 5). However, we emphasize that the model trajectories of future marine plastic dispersal are very sensitive to the assigned geographical distribution of plastic input to the sea. This highlights the need for further research to reliably quantify regional contributions to plastic input to the Mediterranean Sea.
3.4 Plastic in the marine environment
Modeled plastic stocks in the Mediterranean marine environment (sea surface, water column, sandy beaches, and shelf and deep sediments) are presented in Fig. 7d and e. The total marine plastic pool is currently estimated to be 10 Mt (median, IQR 4–19 Mt) and could increase to 26 Mt (median, IQR 13–48 Mt) in 2060 under the BAU scenario. Both OECD-RA and OECD-GA would have no significant effect on the total marine plastic stock by 2060 (Kruskal test; see Fig. S4 in the Supplement). The remediation scenario is the only scenario modeled here that could significantly lower the total marine plastic stock by 2060 to 22 Mt (median, IQR 11–38 Mt), which is still more than twice the current marine stock.
The simulated Mediterranean Sea surface (Fig. 7d) would see its plastic stock increase by 83 % between 2023 and 2060 under the BAU scenario (median 0.004 Mt, IQR 0.003–0.006 Mt) and potentially by more than 230 % by the end of the century (median 0.008 Mt, IQR 0.006–0.010 Mt). The OECD scenarios seem to be efficient against P and LMP mitigation at the sea surface but would still allow floating SMP stock to rise by 160 % between 2023 and 2060 due to continuous fragmentation of legacy P and LMP on land and subsequent SMP input to sea. The total floating plastic stock would reach 0.004 Mt under the OECD-GA scenario by 2060. Remediation of the MMPW terrestrial pool would allow for maintaining the total floating plastic stock close to the current estimate (median 0.0024 Mt, IQR 0.0018–0.0032 Mt).
It is important, however, to keep in mind that the sea surface compartment is the smallest stock of plastic in the marine environment. Most of the plastic input to sea is expected to sink in the water column and deposit to sediments (Fig. 7e). By 2060, shelf sediments are expected to contain around 83 % of total marine plastic. This forecast is concerning, as shelf sediments are known to support most of the biodiversity of the Mediterranean Sea (Coll et al., 2010). Remediation of plastic stored in shelf sediments cannot be recommended, as these ecosystems are very fragile. This highlights the need to address plastic pollution directly at the source – on land – and not only rely on remediation once plastic has spread to the marine environment. Likewise, the beached plastic stock is expected to double by 2060 and could potentially impact tourism, which is a major economic factor in the Mediterranean region.
3.5 Model limitations
Our modeling approach allows the exploration of various medium- and long-term policy scenarios, but it is still subject to substantial uncertainties. This work is meant as an exploratory approach, which could produce a general understanding of the dynamic of plastics in the environment, highlighting where data are lacking. Currently, the SMP cycle in the Mediterranean region is not constrained enough to allow any precise assessment. More observations of these smaller-size fractions <300 um are needed in all reservoirs, as SMP is a major threat to ecosystem and human health. Similarly, potential major pools of plastic (sediments, water column) are still very uncertain.
At this stage, we choose to ignore P in the water column and deep-sediment compartments due to a lack of observation. Nevertheless, we acknowledge that P can be transported by turbidity currents from the shelf to deep sediment and that macro litter from coastal sources and fishing activities can directly sink to the deep sediments.
Numerous improvements to this modeling work are necessary and are briefly summarized below. Fragmentation and biodegradation should normally be a function of polymer type, size, and shape (Chamas et al., 2020). However, we do not consider plastic polymer properties in the model, and the goal is to include this in future work. Important uncertainties in the mass budget come from the conversion of plastic number concentration to mass concentration. Indeed, the reported uncertainty of the mean size of plastic particles (L) is raised to the power of 3 during the number-to-mass conversion (). To allow a more precise mass budget in the future, we recommend reporting plastic observations in both number and mass concentration. Future model development should aim to provide number concentrations, as this information is critical for ecotoxicity risk assessments.
Plastic stock and fluxes inside the study area are assessed in this study. Net plastic exchange between the study area and the rest of the globe (through human activities, water currents, and by air or by land) is considered negligible. We acknowledge however that plastic waste may travel long distances by land before being recycled, incinerated, landfilled, or mismanaged. It could potentially leave the catchment area or, on the contrary, be imported inside the study region. We choose to ignore plastic inflow from the North Atlantic via the Gibraltar Strait following Liubartseva et al. (2018) and Kaandorp et al. (2020). This study estimated leakage from discarded plastic pools to the environment, but these leaks represent only a few percent of all plastic waste generated since 1950 (3 % according to Sonke et al., 2024; 2 % in this study). This means that most of MMPW is still in terrestrial areas, which are not yet detailed in the model. Future improvements could be to separate urban, agricultural, and natural soils or freshwater (lake, riverbed, and floodplain) systems to better understand the fate of plastics on land. Finally, the model does not yet account for plastic fragmentation to nanoplastics (NP). However, it is becoming apparent that NP also poses a serious risk to biota and human health (Atugoda et al., 2023). Literature addressing environmental NP concentrations is rapidly increasing, possibly allowing NP to be implemented in future versions of the model.
In this study, we explored the fate of plastic waste generated in the Mediterranean Sea catchment. We proposed a mass budget for the year 2015, and we calibrated a box model to evaluate different OECD policy scenarios toward 2060. According to our estimates, the Mediterranean marine environment (sea surface, water column, sandy beach, and sediments) stocked around 7×10⁶ metric tonnes (Mt) (median, IQR 3–15 Mt) of plastic in 2015. According to our model, this stock would increase almost 4-fold by 2060 under a business-as-usual scenario, reaching 26 Mt (median, IQR 13–48 Mt). Our results highlight the need to address plastic pollution directly on land, since >90 % of the legacy MMPW is still terrestrial and will leak into the environment for decades and centuries to come. According to the OECD Global Ambition scenario modeled here, the plastic stock in the Mediterranean marine environments (sea surface, water column, beach, and sediments) is expected to increase by 150 % between 2023 and 2060, reaching 25 Mt. This estimation is not significantly different from the business-as-usual scenario, which suggests that more ambitious measures should be implemented, such as the terrestrial remediation of MMPW. The current scenarios proposed by the OECD mainly impact the dispersion of macroplastics and large microplastics (>300 µm). Small microplastics (1–300 µm) will however be formed through the fragmentation of larger plastic items, perpetuating the plastics cycle. The dedicated large-scale remediation of mismanaged terrestrial macroplastics could, by the end of the century, decrease the quantity of small microplastics in the marine environment by 36 % compared to the business-as-usual scenario. Most of the marine plastics (83 %) would accumulate in the shelf sediment, which concentrates most of the Mediterranean biodiversity.
In order to prevent escalating environmental impacts of plastics on the Mediterranean environment beyond present levels, ambitious policies are needed. Recommended measures are as follows:
-
Encourage the ambitious reduction of plastic waste generation (and, by extension, virgin plastic production and consumption).
-
Significantly reduce plastic leakage to the environment by, for instance, promoting efficient collection systems and education.
-
Encourage the remediation of terrestrial legacy plastics. Upstream remediation and prevention are to be prioritized.
-
Improve international cooperation, as the Mediterranean Sea is surrounded by contrasting socioeconomic environments.
As international negotiations around a legally binding tool to address plastic pollution are unfolding (IUCN, 2023), an evaluation of the impact of different environmental policies on a regional and global scale is needed. Further modeling development would help to better apprehend the fate of plastics and microplastics in the environment and identify efficient strategies to address this pressing issue. Our results highlight the need for more reliable observations in critical compartments such as marine sediments and subsurface waters to better constrain the plastic mass budget and reduce modeling uncertainties. Moreover, small microplastics (1–300 µm) are not documented in the basin, which considerably increases the uncertainties regarding their cycling and fate. Additionally, more studies on plastic sinking, degradation, and emissions in the environment would help to better constrain plastic fluxes and lower model uncertainties.
The model code and supplementary data are available at https://github.com/TheoSEGUR/Med_Plastic_BoxModel.git (last access: 26 September 2025; https://doi.org/10.5281/zenodo.17100118, Segur and Sonke, 2025).
The supplement related to this article is available online at https://doi.org/10.5194/bg-22-5139-2025-supplement.
JES conceived the study and reviewed the paper. TS developed the model code, processed the data, and conceived and wrote the paper.
The contact author has declared that neither of the authors has any competing interests.
Publisher's note: Copernicus Publications remains neutral with regard to jurisdictional claims made in the text, published maps, institutional affiliations, or any other geographical representation in this paper. While Copernicus Publications makes every effort to include appropriate place names, the final responsibility lies with the authors.
We acknowledge financial support via the ANR-20-CE34-0014 ATMO-PLASTIC and ANR-23-CE34-0012 BUBBLPLAST grants and a PhD scholarship from the French Ministry of Higher Education and Research.
We would like to thank the reviewers for their constructive comments and suggestions during the review of this manuscript and for their support for publication. We would like to thank the associated editor for their support during the publication process.
This research has been supported by the Agence Nationale de la Recherche (grant nos. ANR-20-CE34-0014 ATMO-PLASTIC and ANR-23-CE34-0012 BUBBLPLAST).
This paper was edited by Edouard Metzger and reviewed by two anonymous referees.
Aliani, S. and Molcard, A.: Hitch-hiking on floating marine debris: macrobenthic species in the Western Mediterranean Sea, in: Migrations and Dispersal of Marine Organisms, edited by: Jones, M. B., Ingólfsson, A., Ólafsson, E., Helgason, G. V., Gunnarsson, K., and Svavarsson, J., Developments in Hydrobiology, Springer Netherlands, Dordrecht, 59–67, https://doi.org/10.1007/978-94-017-2276-6_8, 2003. a
Allen, D., Allen, S., Le Roux, G., Simonneau, A., Galop, D., and Phoenix, V. R.: Temporal Archive of Atmospheric Microplastic Deposition Presented in Ombrotrophic Peat, Environ. Sci. Technol. Lett., 8, 954–960, https://doi.org/10.1021/acs.estlett.1c00697, 2021a. a
Allen, D., Allen, S., Abbasi, S., Baker, A., Bergmann, M., Brahney, J., Butler, T., Duce, R. A., Eckhardt, S., Evangeliou, N., Jickells, T., Kanakidou, M., Kershaw, P., Laj, P., Levermore, J., Li, D., Liss, P., Liu, K., Mahowald, N., Masque, P., Materić, D., Mayes, A. G., McGinnity, P., Osvath, I., Prather, K. A., Prospero, J. M., Revell, L. E., Sander, S. G., Shim, W. J., Slade, J., Stein, A., Tarasova, O., and Wright, S.: Microplastics and nanoplastics in the marine-atmosphere environment, Nat. Rev. Earth Environ., 3, 393–405, https://doi.org/10.1038/s43017-022-00292-x, 2022. a, b
Allen, S., Allen, D., Moss, K., Le Roux, G., Phoenix, V. R., and Sonke, J. E.: Examination of the ocean as a source for atmospheric microplastics, PLOS ONE, 15, e0232746, https://doi.org/10.1371/journal.pone.0232746, 2020. a, b
Allen, S., Allen, D., Baladima, F., Phoenix, V. R., Thomas, J. L., Le Roux, G., and Sonke, J. E.: Evidence of free tropospheric and long-range transport of microplastic at Pic du Midi Observatory, Nat. Commun., 12, 7242, https://doi.org/10.1038/s41467-021-27454-7, 2021b. a
Alomar, C., Estarellas, F., and Deudero, S.: Microplastics in the Mediterranean Sea: Deposition in coastal shallow sediments, spatial variation and preferential grain size, Marine Environ. Res., 115, 1–10, https://doi.org/10.1016/j.marenvres.2016.01.005, 2016. a, b
Atugoda, T., Piyumali, H., Wijesekara, H., Sonne, C., Lam, S. S., Mahatantila, K., and Vithanage, M.: Nanoplastic occurrence, transformation and toxicity: a review, Environ. Chem. Lett., 21, 363–381, https://doi.org/10.1007/s10311-022-01479-w, 2023. a
Baini, M., Fossi, M. C., Galli, M., Caliani, I., Campani, T., Finoia, M. G., and Panti, C.: Abundance and characterization of microplastics in the coastal waters of Tuscany (Italy): The application of the MSFD monitoring protocol in the Mediterranean Sea, Marine Pollution Bulletin, 133, 543–552, https://doi.org/10.1016/j.marpolbul.2018.06.016, 2018. a, b, c, d, e
Barrett, J., Chase, Z., Zhang, J., Holl, M. M. B., Willis, K., Williams, A., Hardesty, B. D., and Wilcox, C.: Microplastic Pollution in Deep-Sea Sediments From the Great Australian Bight, Front. Marine Sci., 7, https://doi.org/10.3389/fmars.2020.576170, 2020. a, b
Bergmann, M., Collard, F., Fabres, J., Gabrielsen, G. W., Provencher, J. F., Rochman, C. M., van Sebille, E., and Tekman, M. B.: Plastic pollution in the Arctic, Nat. Rev. Earth Environ., 3, 323–337, https://doi.org/10.1038/s43017-022-00279-8, 2022. a
Bolo, P. and Préville, A.: Pollution Plastique: une bombe à retardement?, Rapport d'office parlementaire 3654 (Assemblée nationale), 217 (Sénat), Office parlementaire d'évaluation des choix scientifiques et technologiques, https://www.senat.fr/notice-rapport/2020/r20-217-notice.html (last access: 1 March 2023), 2020. a
Boucher, J. and Billard, G.: The Mediterranean: Mare plasticum, IUCN, Gland, Switzerland, 78, 2020. a, b, c, d, e, f, g, h, i, j
Brahney, J., Mahowald, N., Prank, M., Cornwell, G., Klimont, Z., Matsui, H., and Prather, K. A.: Constraining the atmospheric limb of the plastic cycle, P. Natl. Acad. Sci. USA, 118, e2020719118, https://doi.org/10.1073/pnas.2020719118, 2021. a, b, c, d
Browne, M. A., Underwood, A. J., Chapman, M. G., Williams, R., Thompson, R. C., and van Franeker, J. A.: Linking effects of anthropogenic debris to ecological impacts, P. Roy. Soc. B, 282, 20142929, https://doi.org/10.1098/rspb.2014.2929, 2015. a
Cau, A., Sbrana, A., Franceschini, S., Fiorentino, F., Follesa, M. C., Galgani, F., Garofalo, G., Gerigny, O., Profeta, A., Rinelli, P., Sbrana, M., and Russo, T.: What, where, and when: Spatial-temporal distribution of macro-litter on the seafloor of the western and central Mediterranean sea, Environ. Pollut., 342, 123028, https://doi.org/10.1016/j.envpol.2023.123028, 2024. a, b, c
Chamas, A., Moon, H., Zheng, J., Qiu, Y., Tabassum, T., Jang, J. H., Abu-Omar, M., Scott, S. L., and Suh, S.: Degradation Rates of Plastics in the Environment, ACS Sustainable Chemistry & Engineering, 8, 3494–3511, https://doi.org/10.1021/acssuschemeng.9b06635, 2020. a, b, c, d
Cincinelli, A., Martellini, T., Guerranti, C., Scopetani, C., Chelazzi, D., and Giarrizzo, T.: A potpourri of microplastics in the sea surface and water column of the Mediterranean Sea, TrAC Trends in Analytical Chemistry, 110, 321–326, https://doi.org/10.1016/j.trac.2018.10.026, 2019. a, b, c
Coll, M., Piroddi, C., Steenbeek, J., Kaschner, K., Lasram, F. B. R., Aguzzi, J., Ballesteros, E., Bianchi, C. N., Corbera, J., Dailianis, T., Danovaro, R., Estrada, M., Froglia, C., Galil, B. S., Gasol, J. M., Gertwagen, R., Gil, J., Guilhaumon, F., Kesner-Reyes, K., Kitsos, M.-S., Koukouras, A., Lampadariou, N., Laxamana, E., López-Fé de la Cuadra, C. M., Lotze, H. K., Martin, D., Mouillot, D., Oro, D., Raicevich, S., Rius-Barile, J., Saiz-Salinas, J. I., Vicente, C. S., Somot, S., Templado, J., Turon, X., Vafidis, D., Villanueva, R., and Voultsiadou, E.: The Biodiversity of the Mediterranean Sea: Estimates, Patterns, and Threats, PLOS ONE, 5, e11842, https://doi.org/10.1371/journal.pone.0011842, 2010. a, b
Cózar, A., Sanz-Martín, M., Martí, E., González-Gordillo, J. I., Ubeda, B., Gálvez, J. Á., Irigoien, X., and Duarte, C. M.: Plastic Accumulation in the Mediterranean Sea, PLOS ONE, 10, e0121762, https://doi.org/10.1371/journal.pone.0121762, 2015. a, b, c, d
Cózar, A., Arias, M., Suaria, G., Viejo, J., Aliani, S., Koutroulis, A., Delaney, J., Bonnery, G., Macías, D., De Vries, R., Sumerot, R., Morales-Caselles, C., Turiel, A., González-Fernández, D., and Corradi, P.: Proof of concept for a new sensor to monitor marine litter from space, Nat. Commun., 15, 4637, https://doi.org/10.1038/s41467-024-48674-7, 2024. a, b, c, d, e, f, g, h, i, j
Cutroneo, L., Capello, M., Domi, A., Consani, S., Lamare, P., Coyle, P., Bertin, V., Dornic, D., Reboa, A., Geneselli, I., and Anghinolfi, M.: Microplastics in the abyss: a first investigation into sediments at 2443 m depth (Toulon, France), Environ. Sci. Pollut. Res., 29, 9375–9385, https://doi.org/10.1007/s11356-021-17997-z, 2022. a
Fastelli, P., Blašković, A., Bernardi, G., Romeo, T., Čižmek, H., Andaloro, F., Russo, G. F., Guerranti, C., and Renzi, M.: Plastic litter in sediments from a marine area likely to become protected (Aeolian Archipelago's islands, Tyrrhenian sea), Marine Pollution Bulletin, 113, 526–529, https://doi.org/10.1016/j.marpolbul.2016.08.054, 2016. a, b
Filgueiras, A. V., Gago, J., Campillo, J. A., and León, V. M.: Microplastic distribution in surface sediments along the Spanish Mediterranean continental shelf, Environ. Sci. Pollut. Res., 26, 21264–21273, https://doi.org/10.1007/s11356-019-05341-5, 2019. a, b
Fossi, M. C., Vlachogianni, T., Galgani, F., Innocenti, F. D., Zampetti, G., and Leone, G.: Assessing and mitigating the harmful effects of plastic pollution: the collective multi-stakeholder driven Euro-Mediterranean response, Ocean & Coastal Management, 184, 105005, https://doi.org/10.1016/j.ocecoaman.2019.105005, 2020. a
Geyer, R., Jambeck, J. R., and Law, K. L.: Production, use, and fate of all plastics ever made, Sci. Adv., 3, e1700782, https://doi.org/10.1126/sciadv.1700782, 2017. a, b, c, d, e
González-Fernández, D., Roebroek, C. T. J., Laufkötter, C., Cózar, A., and van Emmerik, T. H. M.: Diverging estimates of river plastic input to the ocean, Nat. Rev. Earth Environ., 4, 424–426, https://doi.org/10.1038/s43017-023-00448-3, 2023. a, b
Gregory, M. R.: Environmental implications of plastic debris in marine settings–entanglement, ingestion, smothering, hangers-on, hitch-hiking and alien invasions, Philos. T. Roy. Soc. B, 364, 2013–2025, https://doi.org/10.1098/rstb.2008.0265, 2009. a
Haarr, M. L., Falk-Andersson, J., and Fabres, J.: Global marine litter research 2015–2020: Geographical and methodological trends, Sci. Total Environ., 820, 153162, https://doi.org/10.1016/j.scitotenv.2022.153162, 2022. a, b
Hinata, H., Mori, K., Ohno, K., Miyao, Y., and Kataoka, T.: An estimation of the average residence times and onshore-offshore diffusivities of beached microplastics based on the population decay of tagged meso- and macrolitter, Marine Pollution Bulletin, 122, 17–26, https://doi.org/10.1016/j.marpolbul.2017.05.012, 2017. a
IUCN: INC-2 Plastic Pollution Treaty, 2023. a, b
Jambeck, J. R., Geyer, R., Wilcox, C., Siegler, T. R., Perryman, M., Andrady, A., Narayan, R., and Law, K. L.: Plastic waste inputs from land into the ocean, Science, 347, 768–771, https://doi.org/10.1126/science.1260352, 2015. a, b, c, d, e
Kaandorp, M. L. A., Dijkstra, H. A., and van Sebille, E.: Closing the Mediterranean Marine Floating Plastic Mass Budget: Inverse Modeling of Sources and Sinks, Environ. Sci. Technol., 54, 11980–11989, https://doi.org/10.1021/acs.est.0c01984, 2020. a, b, c, d, e, f, g, h, i
Kaandorp, M. L. A., Lobelle, D., Kehl, C., Dijkstra, H. A., and van Sebille, E.: Global mass of buoyant marine plastics dominated by large long-lived debris, Nature Geoscience, 16, 689–694, https://doi.org/10.1038/s41561-023-01216-0, 2023. a, b
Kazour, M., Jemaa, S., Issa, C., Khalaf, G., and Amara, R.: Microplastics pollution along the Lebanese coast (Eastern Mediterranean Basin): Occurrence in surface water, sediments and biota samples, Sci. Total Environ., 696, 133933, https://doi.org/10.1016/j.scitotenv.2019.133933, 2019. a, b
Kooi, M. and Koelmans, A. A.: Simplifying Microplastic via Continuous Probability Distributions for Size, Shape, and Density, Environ. Sci. Technol. Lett., 6, 551–557, https://doi.org/10.1021/acs.estlett.9b00379, 2019. a, b
Lebreton, L., Egger, M., and Slat, B.: A global mass budget for positively buoyant macroplastic debris in the ocean, Sci. Rep., 9, 12922, https://doi.org/10.1038/s41598-019-49413-5, 2019. a, b, c
Lebreton, L. C. M., van der Zwet, J., Damsteeg, J.-W., Slat, B., Andrady, A., and Reisser, J.: River plastic emissions to the world's oceans, Nat. Commun., 8, 15611, https://doi.org/10.1038/ncomms15611, 2017. a, b, c, d, e, f, g, h
Lefebvre, C., Saraux, C., Heitz, O., Nowaczyk, A., and Bonnet, D.: Microplastics FTIR characterisation and distribution in the water column and digestive tracts of small pelagic fish in the Gulf of Lions, Marine Pollution Bulletin, 142, 510–519, https://doi.org/10.1016/j.marpolbul.2019.03.025, 2019. a, b, c
Lehner, B. and Grill, G.: Global river hydrography and network routing: baseline data and new approaches to study the world's large river systems, https://www.hydrosheds.org (last access: 26 September 2023), 2013. a, b
Liubartseva, S., Coppini, G., Lecci, R., and Clementi, E.: Tracking plastics in the Mediterranean: 2D Lagrangian model, Marine Pollution Bulletin, 129, 151–162, https://doi.org/10.1016/j.marpolbul.2018.02.019, 2018. a, b
Mai, L., Sun, X., and Zeng, E. Y.: Country-specific riverine contributions to marine plastic pollution, Sci. Total Environ., 874, 162552, https://doi.org/10.1016/j.scitotenv.2023.162552, 2023. a, b
Meijer, L. J. J., van Emmerik, T., van der Ent, R., Schmidt, C., and Lebreton, L.: More than 1000 rivers account for 80 % of global riverine plastic emissions into the ocean, Sci. Adv., 7, eaaz5803, https://doi.org/10.1126/sciadv.aaz5803, 2021. a, b, c, d, e, f, g, h
Miralles, L., Gomez-Agenjo, M., Rayon-Viña, F., Gyraitė, G., and Garcia-Vazquez, E.: Alert calling in port areas: Marine litter as possible secondary dispersal vector for hitchhiking invasive species, Journal for Nature Conservation, 42, 12–18, https://doi.org/10.1016/j.jnc.2018.01.005, 2018. a
Mistri, M., Infantini, V., Scoponi, M., Granata, T., Moruzzi, L., Massara, F., De Donati, M., and Munari, C.: Microplastics in marine sediments in the area of Pianosa Island (Central Adriatic Sea), Rendiconti Lincei, Scienze Fisiche e Naturali, 29, 805–809, https://doi.org/10.1007/s12210-018-0736-1, 2018. a, b
Nyberg, B., Harris, P. T., Kane, I., and Maes, T.: Leaving a plastic legacy: Current and future scenarios for mismanaged plastic waste in rivers, Sci. Total Environ., 869, 161821, https://doi.org/10.1016/j.scitotenv.2023.161821, 2023. a, b, c, d, e, f
OECD: Global Plastics Outlook: Policy Scenarios to 2060, https://read.oecd-ilibrary.org/environment/global-plastics-outlook_aa1edf33-en (last access: 4 September 2023), 2022. a, b, c, d, e, f, g, h, i, j
Pedrotti, M. L., Lombard, F., Baudena, A., Galgani, F., Elineau, A., Petit, S., Henry, M., Troublé, R., Reverdin, G., Ser-Giacomi, E., Kedzierski, M., Boss, E., and Gorsky, G.: An integrative assessment of the plastic debris load in the Mediterranean Sea, Sci. Total Environ., 838, 155958, https://doi.org/10.1016/j.scitotenv.2022.155958, 2022. a, b, c, d
Poulos, S. E.: The Mediterranean and Black Sea Marine System: An overview of its physico-geographic and oceanographic characteristics, Earth-Sci. Rev., 200, 103004, https://doi.org/10.1016/j.earscirev.2019.103004, 2020. a, b, c, d
Rech, S., Salmina, S., Borrell Pichs, Y. J., and García-Vazquez, E.: Dispersal of alien invasive species on anthropogenic litter from European mariculture areas, Marine Pollution Bulletin, 131, 10–16, https://doi.org/10.1016/j.marpolbul.2018.03.038, 2018. a
Schmidt, C., Krauth, T., and Wagner, S.: Export of Plastic Debris by Rivers into the Sea, Environ. Sci. Technol., 51, 12246–12253, https://doi.org/10.1021/acs.est.7b02368, 2017. a, b
Schwarz, A. E., Ligthart, T. N., Boukris, E., and van Harmelen, T.: Sources, transport, and accumulation of different types of plastic litter in aquatic environments: A review study, Marine Pollution Bulletin, 143, 92–100, https://doi.org/10.1016/j.marpolbul.2019.04.029, 2019. a
Segur, T. and Sonke, J.: Mediterranean Plastic box-model, V1.0.0, Zenodo [code], https://doi.org/10.5281/zenodo.17100118, 2025. a, b
Shaw, D. B., Li, Q., Nunes, J. K., and Deike, L.: Ocean emission of microplastic, PNAS Nexus, 2, pgad296, https://doi.org/10.1093/pnasnexus/pgad296, 2023. a
Simon-Sánchez, L., Grelaud, M., Franci, M., and Ziveri, P.: Are research methods shaping our understanding of microplastic pollution? A literature review on the seawater and sediment bodies of the Mediterranean Sea, Environ. Pollut., 292, 118275, https://doi.org/10.1016/j.envpol.2021.118275, 2022. a, b, c
Sonke, J. E., Koenig, A. M., Yakovenko, N., Hagelskjær, O., Margenat, H., Hansson, S. V., De Vleeschouwer, F., Magand, O., Le Roux, G., and Thomas, J. L.: A mass budget and box model of global plastics cycling, degradation and dispersal in the land-ocean-atmosphere system, Microplastics and Nanoplastics, 2, 28, https://doi.org/10.1186/s43591-022-00048-w, 2022. a, b
Sonke, J. E., Koenig, A., Segur, T., and Yakovenko, N.: Global environmental plastic dispersal under OECD policy scenarios toward 2060, Sci. Adv., 11, eadu2396, https://doi.org/10.1126/sciadv.adu2396, 2025. a, b, c, d, e, f, g, h, i, j, k, l
Tatsii, D., Bucci, S., Bhowmick, T., Guettler, J., Bakels, L., Bagheri, G., and Stohl, A.: Shape Matters: Long-Range Transport of Microplastic Fibers in the Atmosphere, Environ. Sci. Technol., 58, 671–682, https://doi.org/10.1021/acs.est.3c08209, 2024. a
Tenzer, R. and Gladkikh, V.: Assessment of Density Variations of Marine Sediments with Ocean and Sediment Depths, The Scientific World Journal, 2014, e823296, https://doi.org/10.1155/2014/823296, 2014. a
Tsiaras, K., Hatzonikolakis, Y., Kalaroni, S., Pollani, A., and Triantafyllou, G.: Modeling the Pathways and Accumulation Patterns of Micro- and Macro-Plastics in the Mediterranean, Front. Marine Sci., 8, https://doi.org/10.3389/fmars.2021.743117, 2021. a, b
Tuuri, E. M. and Leterme, S. C.: How plastic debris and associated chemicals impact the marine food web: A review, Environ. Pollut., 321, 121156, https://doi.org/10.1016/j.envpol.2023.121156, 2023. a
UN: World Population Prospects 2022, ISBN 978-92-1-148373-4, 2022. a, b, c, d, e, f
UNEP: From Pollution to Solution: A Global Assessment of Marine Litter and Plastic Pollution, Tech. Rep. 747, United Nations Environment Programme, Nairobi, ISBN 978-92-807-3881-0, 2021. a
UNEP/MAP: State of the Environment and development in the Mediterranean, Tech. rep., United Nations Environment Programme/Mediterranean Action Plan and Plan Bleu, ISBN 978-92-807-3796-7, 2020. a, b
van Emmerik, T. and Schwarz, A.: Plastic debris in rivers, WIREs Water, 7, e1398, https://doi.org/10.1002/wat2.1398, 2020. a
Verla, A. W., Enyoh, C. E., Verla, E. N., and Nwarnorh, K. O.: Microplastic–toxic chemical interaction: a review study on quantified levels, mechanism and implication, SN Applied Sciences, 1, 1400, https://doi.org/10.1007/s42452-019-1352-0, 2019. a
Wang, Y., Okochi, H., Tani, Y., Hayami, H., Minami, Y., Katsumi, N., Takeuchi, M., Sorimachi, A., Fujii, Y., Kajino, M., Adachi, K., Ishihara, Y., Iwamoto, Y., and Niida, Y.: Airborne hydrophilic microplastics in cloud water at high altitudes and their role in cloud formation, Environ. Chem. Lett., 21, 3055–3062, https://doi.org/10.1007/s10311-023-01626-x, 2023. a
Watkins, L., McGrattan, S., Sullivan, P. J., and Walter, M. T.: The effect of dams on river transport of microplastic pollution, Sci. Total Environ., 664, 834–840, https://doi.org/10.1016/j.scitotenv.2019.02.028, 2019. a
Weiss, L., Estournel, C., Marsaleix, P., Mikolajczak, G., Constant, M., and Ludwig, W.: From source to sink: part 1–characterization and Lagrangian tracking of riverine microplastics in the Mediterranean Basin, Environ. Sci. Pollut. Res., 32, 10081–10104, https://doi.org/10.1007/s11356-024-34635-6, 2025. a, b, c, d, e, f, g, h, i
WorldPop: Unconstrained individual countries 2000–2020 UN adjusted (1 km resolution), https://hub.worldpop.org/geodata/listing?id=75 (last access: 24 September 2023), 2020. a, b, c, d
Wu, P., Xu, R., Wang, X., Schartup, A., Luijendijk, A., and Zhang, Y.: Transport and Fate of All-Time Released Plastics in the Global Ocean, Environmental Sciences [preprint], https://doi.org/10.31223/X50W58, 2021. a
Xiao, S., Cui, Y., Brahney, J., Mahowald, N. M., and Li, Q.: Long-distance atmospheric transport of microplastic fibres influenced by their shapes, Nature Geoscience, 16, 863–870, https://doi.org/10.1038/s41561-023-01264-6, 2023. a
Zhu, X., Rochman, C. M., Hardesty, B. D., and Wilcox, C.: Plastics in the deep sea – A global estimate of the ocean floor reservoir, Deep-Sea Res. Pt. I, 206, 104266, https://doi.org/10.1016/j.dsr.2024.104266, 2024. a, b, c, d