the Creative Commons Attribution 4.0 License.
the Creative Commons Attribution 4.0 License.
 | 07 Oct 2025
Chemical and stable carbon isotopic compositions of PM2.5 from two typical forests in China: implication for sources
Mingyu Li
Zhanjie Xu
Zhichao Dong
Junjun Deng
Pingqing Fu
Chandra Mouli Pavuluri
To elucidate the origin and seasonality of atmospheric aerosols in forest areas, simultaneous PM2.5 collection was carried out in two typical forest sites: Changbai Mountain (CB, 42.40° N, 128.11° E), North China and Xishuangbanna (BN, 22.25° N, 100.89° E), South China, at day and night during the summer and winter periods of 2023–2024. Carbonaceous and nitrogenous components, water-soluble inorganic ions (WSII) and stable carbon isotopic composition of total carbon () were measured in PM2.5. Generally, the contents of carbonaceous and nitrogenous components were higher in winter than in summer, with secondary organic carbon (SOC) and water-soluble organic carbon (WSOC) being higher in daytime than that in nighttime at both CB and BN. The average concentrations of WSII in total samples were 5.36 and 2.23 µg m−3 at CB and BN, respectively. , and were dominant at CB, while , and Na+ were dominant at BN, which accounted for 86 % and 89 % to the total ions, respectively. ranged from −27.8 ‰ to −22.1 ‰ at CB, while −27.6 ‰ to −24.5 ‰ at BN. Besides biogenic emissions, the emissions from biomass burning and terrestrial and/or marine organisms were major sources of aerosols at both sites. Furthermore, fossil fuel combustion contributed more significantly at CB than at BN in winter. This study sheds better light on the seasonality in chemical composition and origins of PM2.5 in forest areas in North and South China.
- Article
(8824 KB) - Full-text XML
-
Supplement
(447 KB) - BibTeX
- EndNote


Fine aerosols are the particulate matter with an aerodynamic diameter less than or equal to 2.5 µm (PM2.5) in the atmosphere. PM2.5 can influence the Earth's climate system through solar radiation absorption or scattering, and indirectly by acting as cloud condensation nuclei (Liou and Ou, 1989; Ramana and Devi, 2016). In addition, PM2.5 has been found to have adverse impacts on visibility, human health and ecosystems (Shaughnessy et al., 2015; Maji et al., 2018; Zhang et al., 2019; Xue et al., 2022; Chen et al., 2023; Zheng et al., 2024). Furthermore, recent studies have found that PM2.5 affects productivity and aggravates socio-economic inequality (Peeples, 2020; Canaday et al., 2024; Li et al., 2024).
PM2.5 consists mainly of water-soluble inorganic ions (WSII), carbonaceous components and trace elements (Wang et al., 2017; Zhao et al., 2022). Among them, WSII account for about 20 %–60 % of PM2.5, and their proportion increases with increasing pollution levels (Cao et al., 2007; Tao et al., 2014; Yin et al., 2014; He et al., 2017; Guo et al., 2023). Carbonaceous components primarily consist of elemental carbon (EC) and organic carbon (OC). EC originates mainly from incomplete combustion of biomass and fossil fuels (Sharma et al., 2022). While OC is derived from primary organic matter directly released as particulate matter from pollution sources and by secondary formation from anthropogenic or biogenic emissions of volatile organic compounds (VOCs) (Ehn et al., 2014). Notably, WSII promote the formation of secondary organic aerosols (SOA) (Pathak et al., 2003; Fu et al., 2024). However, tracing the sources clearly by measuring only the chemical components in PM2.5 is difficult. In recent studies, the stable carbon isotope ratios of total carbon () have been proven to aid in identifying the sources and transformation processes of PM2.5 (Kawamura et al., 2004; Aggarwal et al., 2013; Kunwar et al., 2016; Pavuluri et al., 2011b).
Recent research on the sources of PM2.5 has been extensively conducted worldwide (Kawashima et al., 2023; Espina-Martin et al., 2024; Chen et al., 2025). Therefore, comprehensive chemical composition studies of PM2.5 from different regions remain important. Chinese studies on atmospheric PM2.5 are predominantly focused on large and medium-sized cities and other regions with substantial populations or severe pollution, like the Beijing-Tianjin-Hebei urban agglomeration and the Yangtze River Delta. (Huang et al., 2014; Wang et al., 2021; Dong et al., 2023; Li et al., 2024). Nevertheless, due to variations in pollution sources, climate, geographical location, and other factors in different regions, the characteristics of PM2.5 concentration and its chemical composition differ in various areas. Compared with urban areas, the composition of aerosols in forest regions are complex due to larger contributions of natural source components and their secondary formation and aging mechanisms make them more complicated (Bhat and Fraser, 2007; Mo et al., 2015; Ren et al., 2019; Ehn et al., 2014; Kourtchev et al., 2009). Forest plants act as major sources of biogenic VOCs, which serve as crucial precursors to PM2.5, and can form biogenic SOA through photochemical reactions (Yuan et al., 2013; Wu et al., 2020). Furthermore, biomass burning is also a significant source of organic aerosol (OA), during which significant quantities of VOCs and particulate matter are emitted. These substances undergo a series of intricate chemical transformations, resulting in substantial OA formation (Long et al., 2023). This can seriously affect air quality, inducing marked elevations in PM2.5 mass concentrations and posing a threat to public health (Bu et al., 2021; Chen et al., 2024; Yin et al., 2024). Therefore, research on the characterization and origin of aerosols in forest areas is necessary.
China has a vast land with a forest coverage of 24.02 % in 2022. Therefore, we selected two typical forest areas that covered with different types of vegetation and located in the southern and northern China, representing the temperate and tropical zones of China, respectively, for this study. Here, we report the temporal variability in the concentrations and compositions of carbonaceous components, WSII, nitrogenous components, as well as of PM2.5 at each site. Based on the data obtained, we explore the origins and aging processes of PM2.5 in the forest regions in China.
2.1 PM2.5 Sampling
PM2.5 sampling was performed at two forest sites: (i) the Changbai Mountain Forest Ecosystem Positioning Research Station of the Chinese Academy of Sciences (CB) in Jilin Province, Northeastern China [42.40° N, 128.11° E, 740 m a.s.l.] and (ii) the Guanping Management Station of Xishuangbanna National Nature Reserve (BN) in Yunnan Province, Southwestern China [22.25° N, 100.89° E, 872 m a.s.l.]. The weather over CB, where mixed coniferous and deciduous broad-leaved forests predominate, is characterized by temperate monsoon climate with cold-dry winters and warm-humid summers. The winter atmospheric conditions are significantly influenced by northwest monsoon, resulting in distinct atmospheric pollutant transport over the CB region. The BN is situated in the tropical monsoon climate zone with year-round warm-humid conditions, featuring predominantly tropical rainforest vegetation with rich biodiversity, where minimal human activity due to remoteness from industrial regions maintains atmospheric conditions closer to natural background levels.
Aerosol samples (n=120) were collected on pre-combusted (450 °C, 6 h) quartz membrane filters (405.3 cm2) employing a high-volume air sampler operated at 1.0 m3 min−1 in daytime (23:30–10:30 UTC) and nighttime (11:00–24:00 UTC) in summer from 22 July to 7 August 2023 and in winter from 26 December 2023 to 9 January 2024. Prior to and after sampling, blank samples were obtained by setting the filter membrane on the sampler and allowing it to remain for 5 min without air pumping. The filter membrane was immediately wrapped in aluminum foil, sealed in a plastic pouch, and stored away from light after sampling. All samples were preserved under −20 °C conditions until analysis.
2.2 Chemical analyses
2.2.1 Measurement of carbonaceous components
The mass concentrations of OC and EC were measured using a semi-continuous thermal/optical OC EC analyzer (Sunset Laboratory, USA). The distinction between OC and EC is achieved via real-time monitoring of light reflectance/transmittance changes during the heating process using a laser/light source, i.e. the IMPROVE protocol of the protective visual environment (Wan et al., 2017, 2015). Briefly, a portion of a filter was extracted and positioned in a quartz boat situated within the thermal desorption chamber, followed by combustion through a two-step heating procedure.
Water-soluble OC (WSOC) was isolated from filter aliquots through ultrasonic extraction using Milli-Q water and quantified employing a TOC analyzer (OI Analytical, model 1030W C 1088). All measured concentrations were field blank-corrected to ensure data accuracy, by subtracting the measured blank values from the sample values. The following equation was used to estimate the total carbon (TC) and water-insoluble OC (WIOC).
Owing to technical limitations in direct SOC determination, an EC tracer-based method was implemented for SOC assessment, which was estimated based on the following equation (Castro et al., 1999):
where (OC EC)min is the minimum value of the mass concentration ratio of OC EC produced from primary emissions. Considering the differences in meteorological conditions and pollution source emissions at each sampling sites in different seasons, the average value of three (OC EC)min monitored in different seasons at the sampling sites was applied to estimate the SOC. The minimum OC EC ratios of 23.59, 7.15 in CB and 7.57, 17.26 in BN during the summer and winter, respectively.
2.2.2 Measurement of inorganic ions
The water-soluble ionic species (Cl−, , , Na+, K+, , Ca2+ and Mg2+) were measured using ion chromatography (ICS 5000+, Thermo Fisher). Briefly, an aliquot of a filter sample was ultrasonically extracted into 10 mL of Milli-Q water for 10 min (repeated 3 times). The extracts were then filtered through 0.22 µm polytetrafluoroethylene (PTFE). To measure anions, an eluent consisting of Na2CO3, NaHCO3, and H2SO4 was utilized at a controlled flow rate of 1.2 mL min−1. For cation determination, methyl sulfonic acid functioned as the eluent, operating at a flow rate of 1.0 mL min−1 as described elsewhere (Dong et al., 2023; Pavuluri et al., 2011a). The concentrations of all ionic components were corrected for field blanks, by subtracting the measured blank values from the sample values. Generally, the error in duplicate analyses did not exceed 4 %. The nss-, and nss-K+ were calculated using Na+ as a reference tracer for sea-salt correction (Tripathee et al., 2017).
It is worth noting that quartz filter membranes may interfere with certain specific cations (Na+, Mg2+, and Ca2+). After measurement, it was found that the values of Na+, Mg2+, and Ca2+ (1.54, 0.05 and 0.02 mg L−1; respectively) in the blank membranes were high, while the concentrations of Mg2+ and Ca2+ in the PM2.5 samples were very low (0.06 and 0.10 mg L−1, respectively) at BN. Therefore, the Ca2+ and Mg2+ in the BN's PM2.5 samples were not discussed. The values of all ions in the blank membranes at CB were very low, and hence we believe that their influence on these cations is negligible at CB.
2.2.3 Measurement of nitrogenous components
Water-soluble total nitrogen (WSTN) was measured by a continuous-flow analyzer. The filter sample was ultrasonically extracted for 10 min in 10 mL of Milli-Q water, repeated 3 times. The aqueous fractions were filtered using a 0.22 µm-sized PTFE membrane filter and subsequently mixed with excess K2SO4. The nitrogen (N) is converted to nitrate () through ultraviolet digestion and then reduced to nitrite (). After that, reacts with aminobenzene sulfonic acid to produce high molecular weight nitrogen compounds (Azo dye), and then the absorbance of total N was measured at 540 nm. The inorganic nitrogen (IN) concentration was calculated by summing the measured concentrations of -N, -N, and -N. The concentration difference between WSTN and IN was regarded as water-soluble organic nitrogen (WSON) (Pavuluri et al., 2015; Dong et al., 2023).
2.2.4 Determination of stable carbon isotope ratios of TC
Stable carbon isotope ratios of TC () in PM2.5 were analyzed through a Flash 2000HT elemental analyzer connected to a 253 Plus isotope ratio mass spectrometer (EA-IRMS). Overall, an aliquot of the filter was wrapped and injected into EA, with the evolved gases CO2 delivered to an IRMS via ConFlo-II for the determination of in TC. The delta (δ) values represent the isotope ratio of , in parts per mille (‰) with reference to Pee Dee Belemnite for carbon isotopes. The isotope conversion equation is as follows:
The error derived from replicate analysis remains within 0.3 ‰. The samples were not decarbonized before measurement. Due to the fact that average Ca2+ concentrations were found to be low (0.03 ± 0.02 µg m−3, CB; 0.09 ± 0.07 µg m−3, BN) in these samples so that we assume that the contribution of CaCO3 and its δ13C to aerosols is negligible (Wang et al., 2005; Pavuluri et al., 2011b).
2.3 Meteorological parameters and simulations of air mass trajectories
Meteorological parameters, including temperature, relative humidity, and wind speed at CB and BN, were from the Xihe Energy Big Data Platform (https://xihe-energy.com/#geo, last access: 31 July 2025). Seasonal and diurnal variations in the planetary boundary layer height were reported by Wu et al. (2024). To analyze air mass transport patterns, 72 h backward trajectories arriving at CB and BN at an altitude of 300, 500, and 1000 m above the ground level were calculated employing the Hybrid Single Particle Lagrangian Integrated Trajectory (HYSPLIT) model from the National Oceanic and Atmospheric Administration (https://www.ready.noaa.gov/index.php, last access: 1 October 2025).
3.1 Differences in meteorology and long-range transported air masses between the sampling sites
Figure 1 illustrates 72 h backward air mass trajectory clusters. It revealed the air masses that reaching CB originated primarily from the Pacific Ocean, including the Yellow Sea and the East China Sea, while BN was primarily affected by the southwestern airflow from the Indian Ocean from the Bay of Bengal in summer. In winter, the air masses to CB were derived from, North China and Mongolia. Compared with CB, the local source contribution at BN during winter was higher.
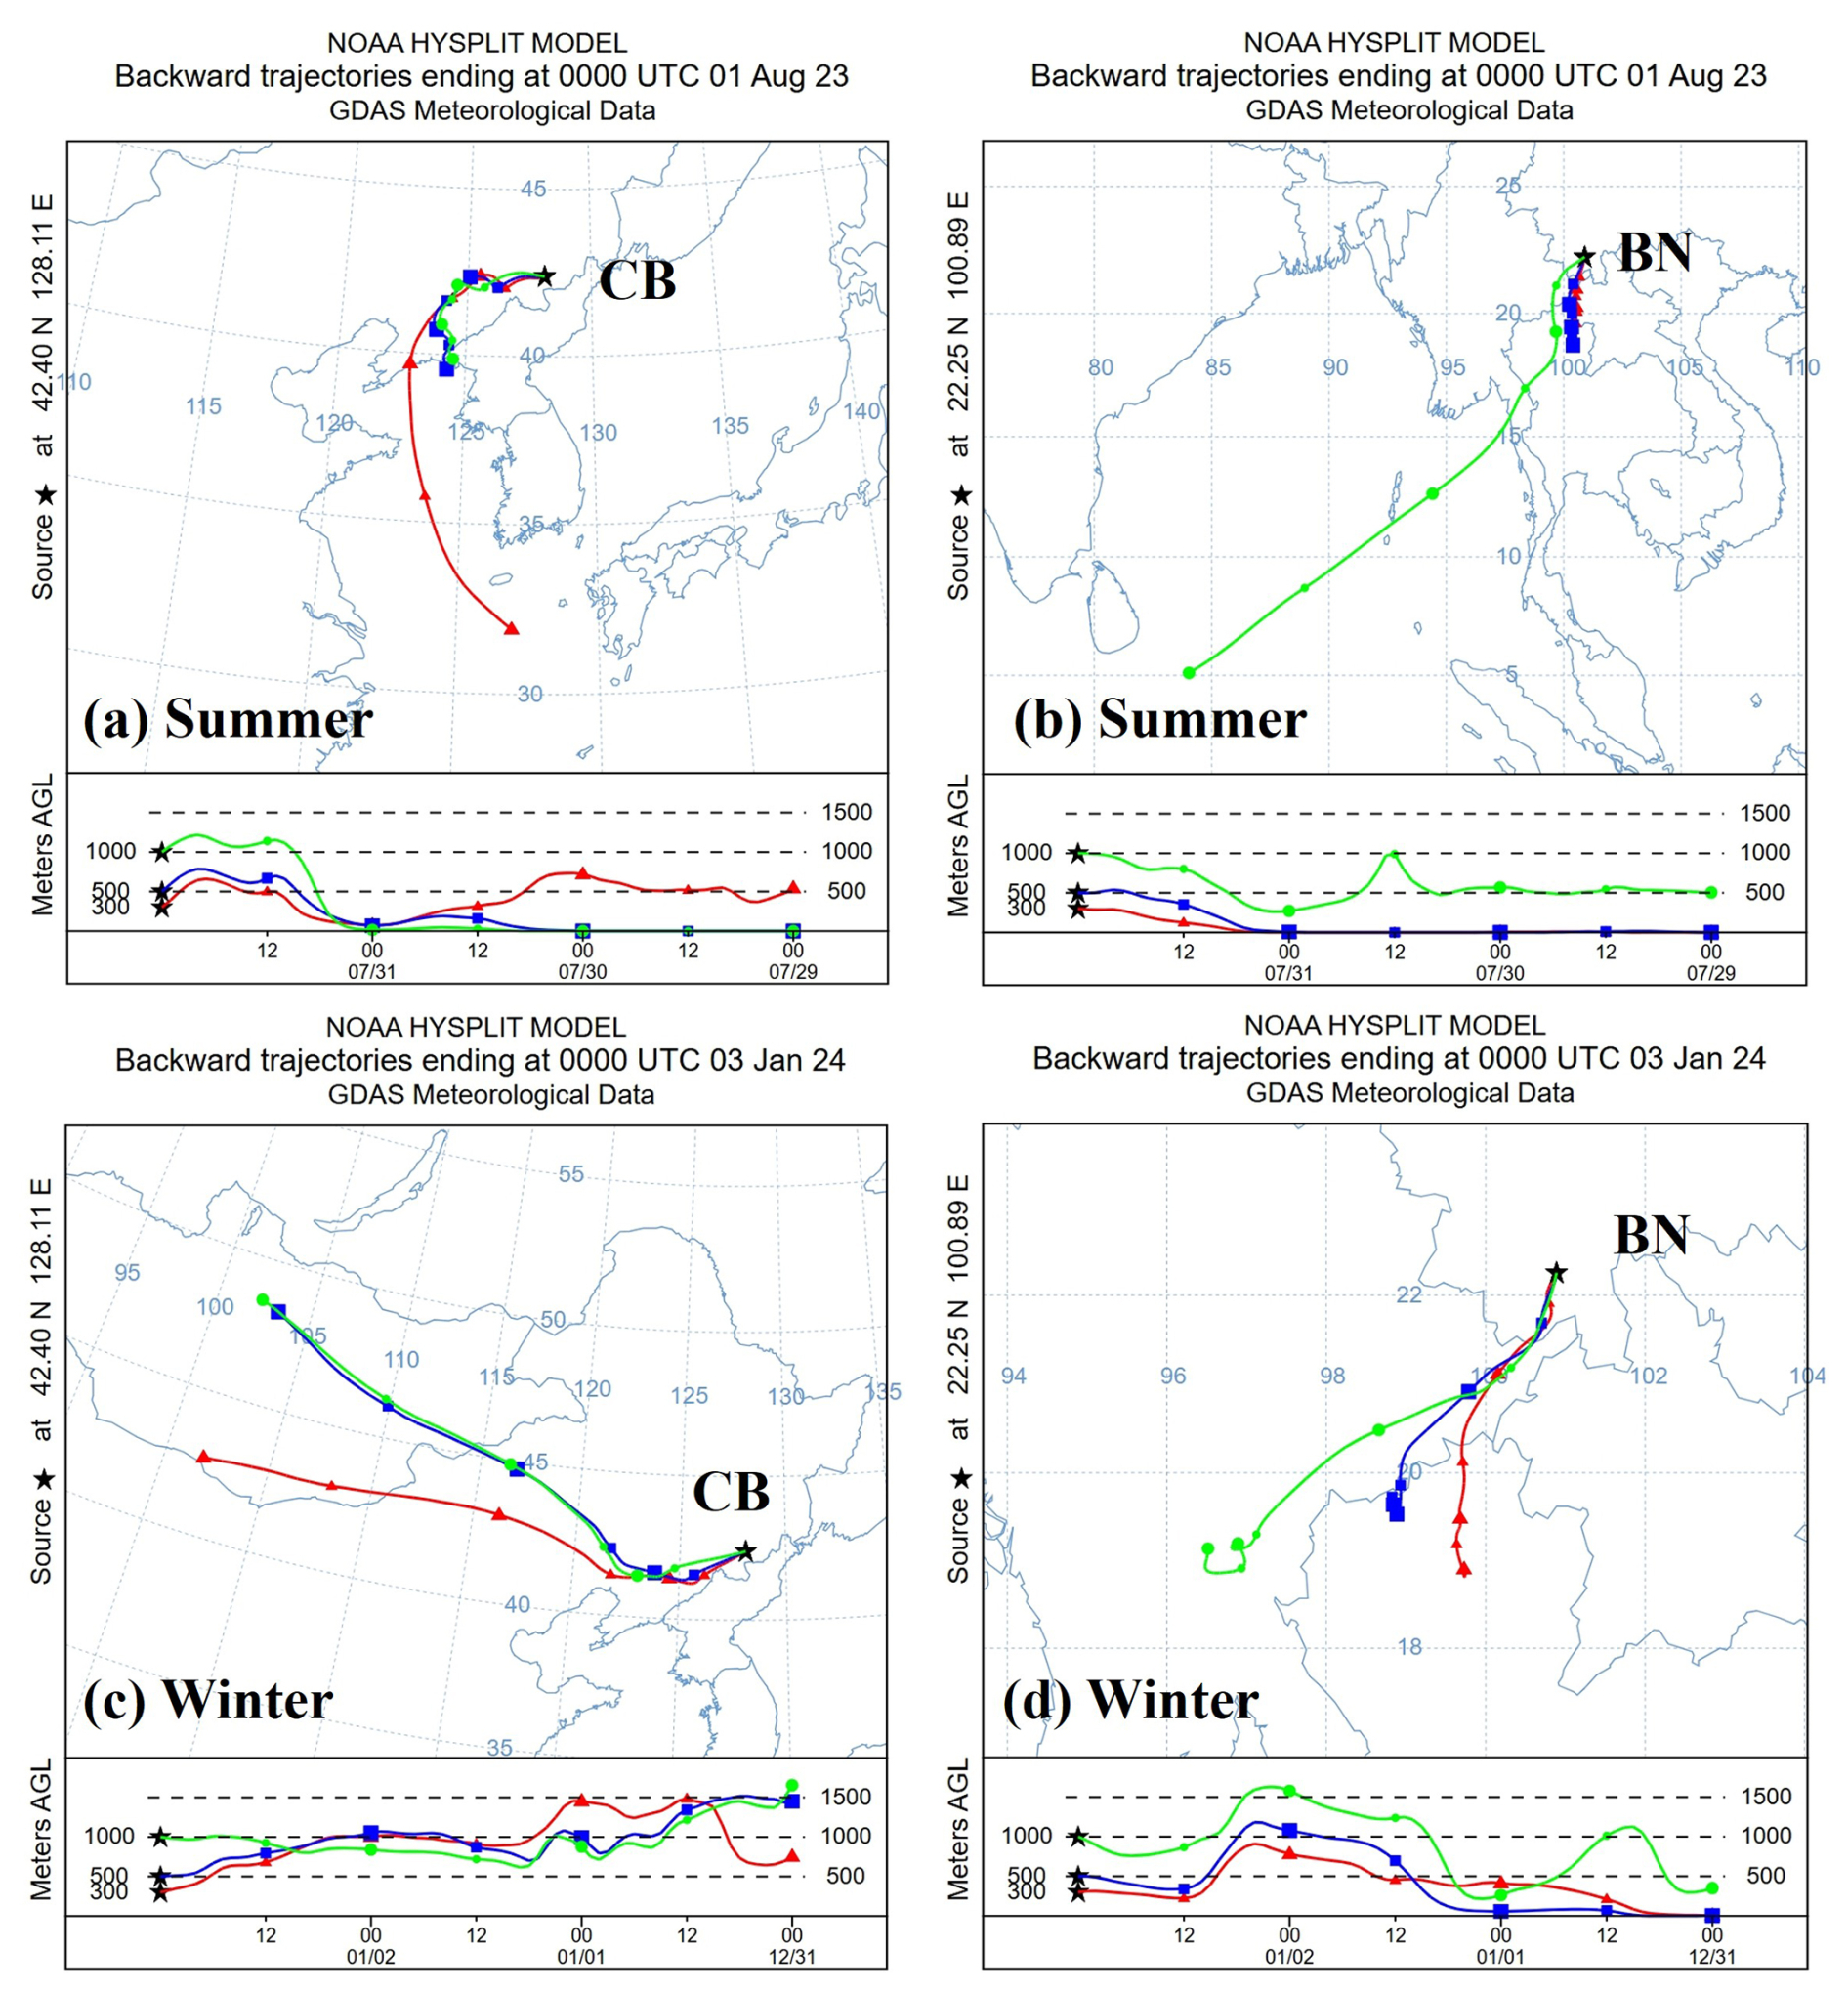
Figure 1Clustered 72 h backward airmass trajectories plots (above the ground level: 300, 500, and 1000 m) at CB and BN, China during 2023–2024.
The temporal variations of meteorological parameters at two sites are depicted in Fig. 2. The ambient temperatures at CB and BN during the campaigns exhibited seasonal variations. The temperatures at BN were similar to those at CB during summer, whereas in winter, the temperatures at BN (avg. 14.8 °C) were significantly higher than those at CB (avg. −10.9 °C). Both the pressure and wind speed were found to be higher at CB. Significant diurnal variations in relative humidity were observed at both sites, where CB demonstrated daytime and nighttime values of 84.84 % and 72.03 %, respectively, compared to BN's corresponding measurements of 90.84 % and 73.96 %.
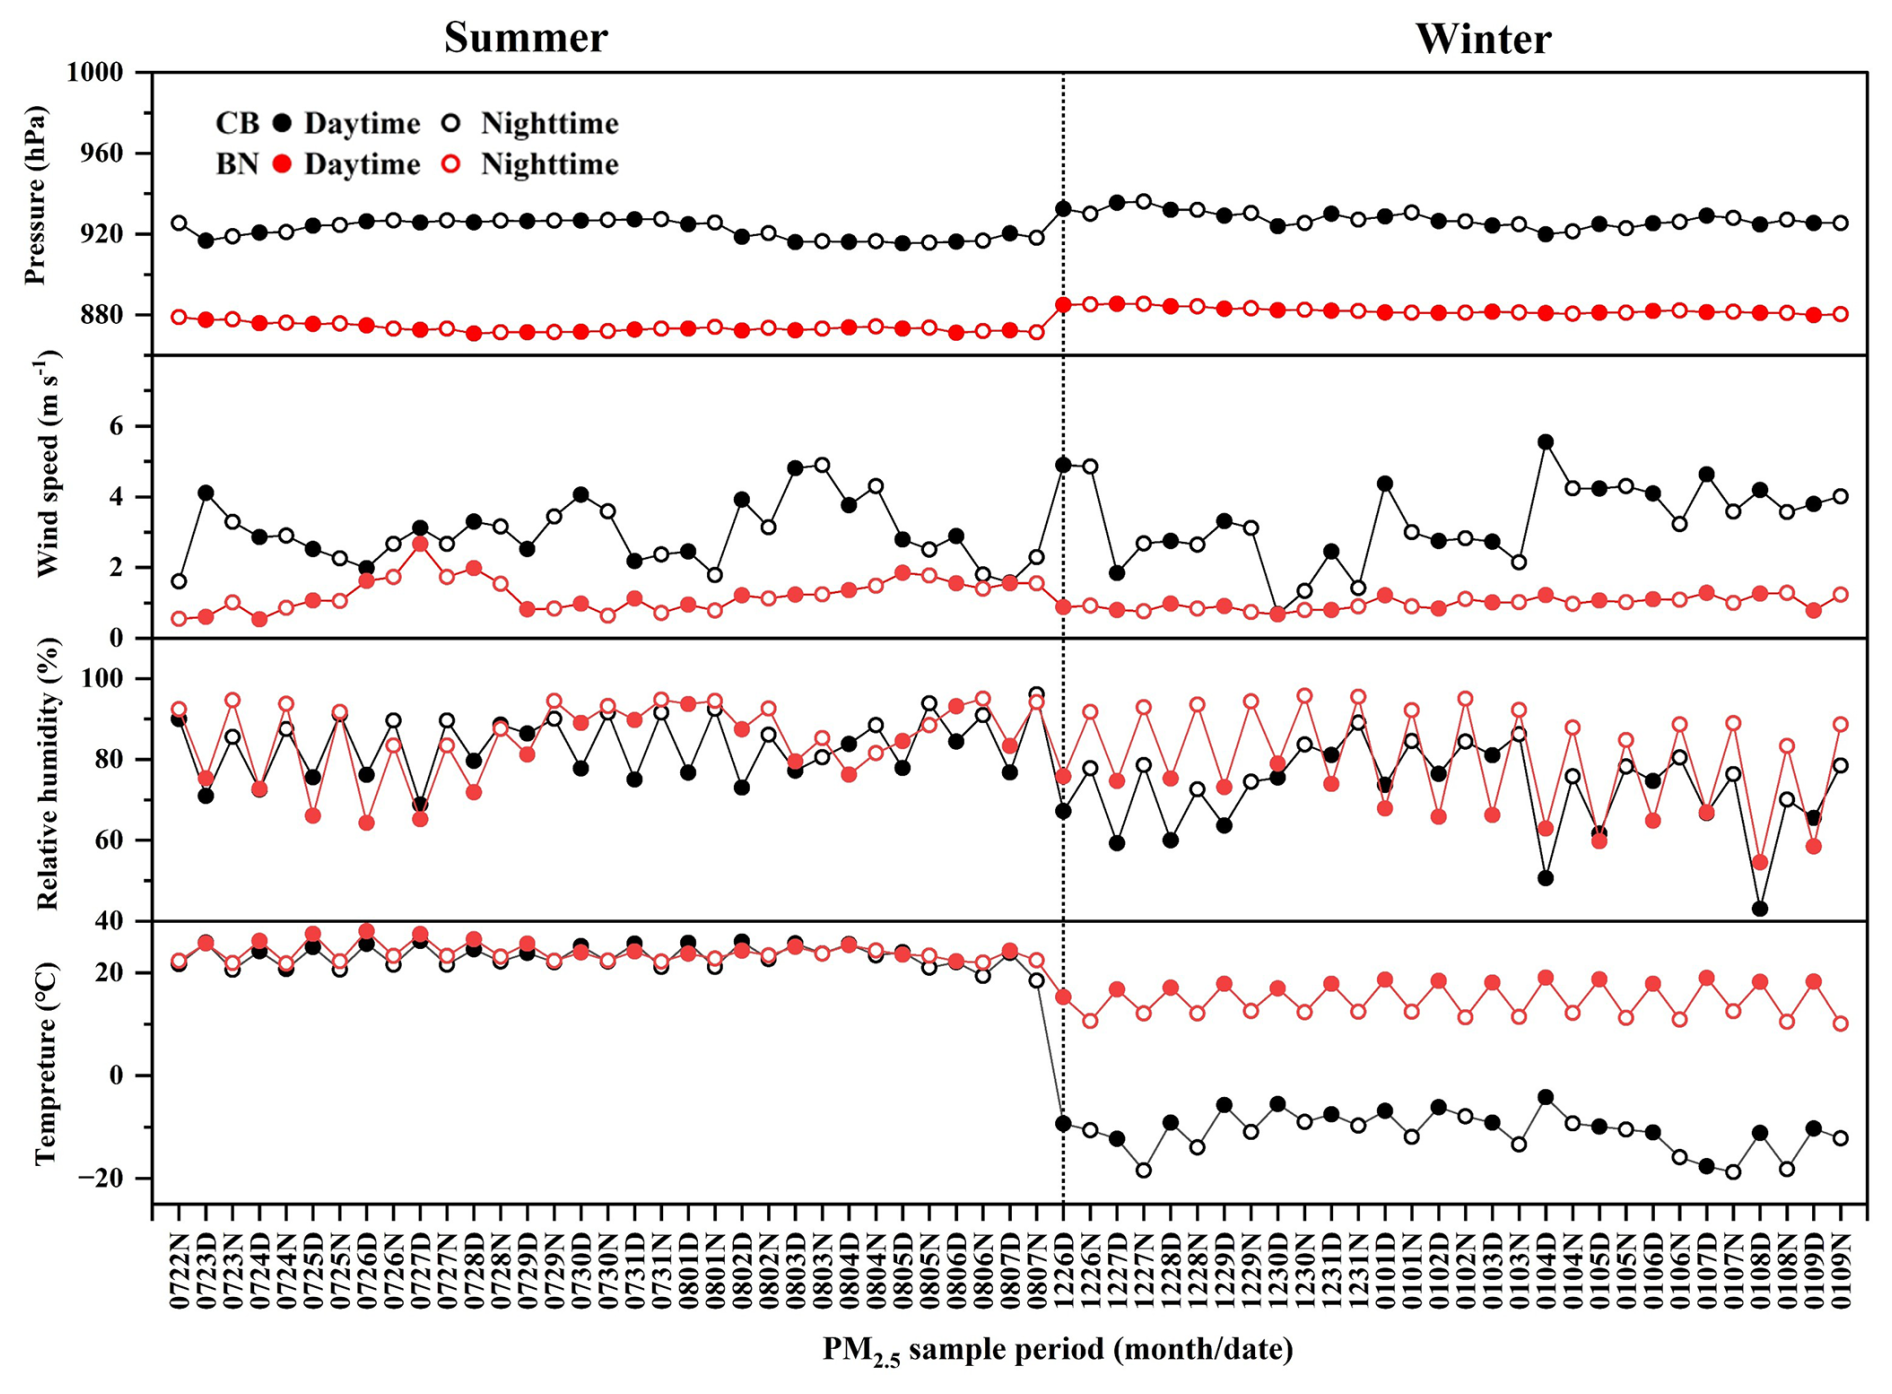
Figure 2Temporal variations of meteorological parameters at CB and BN, China during 2023–2024.
3.2 Chemical results
3.2.1 Characterization of inorganic ions and nitrogenous components
The linear regressions of total cations and anions were shown in Fig. 3. The ratio of the equivalent concentrations of cation (CE) and anion (AE) can effectively evaluate the acid-base balance of aerosols (Tian et al., 2018). The formulas are as follows:
If the CE is greater than the AE, PM2.5 is alkaline, and vice versa. Average annual equivalent ratios of total cations (Na+, , K+, Mg2+ and Ca2+) to anions (Cl−, and ) were 1.62 ± 0.53 at CB and 1.92 ± 0.80 at BN, indicating that the aerosols at these two sites are alkaline. The high ratio of CEAE might be due to the enhanced NH3 emission caused by high temperature and agricultural activities (Qiao et al., 2019). It also should be noted that the excessive cations at both sites might be related to unmeasured anions like oxalate. Furthermore, soluble organic acid ions might also be the cause of the anion deficits at CB and BN. A more comprehensive investigation of this matter will be conducted in future research initiatives.
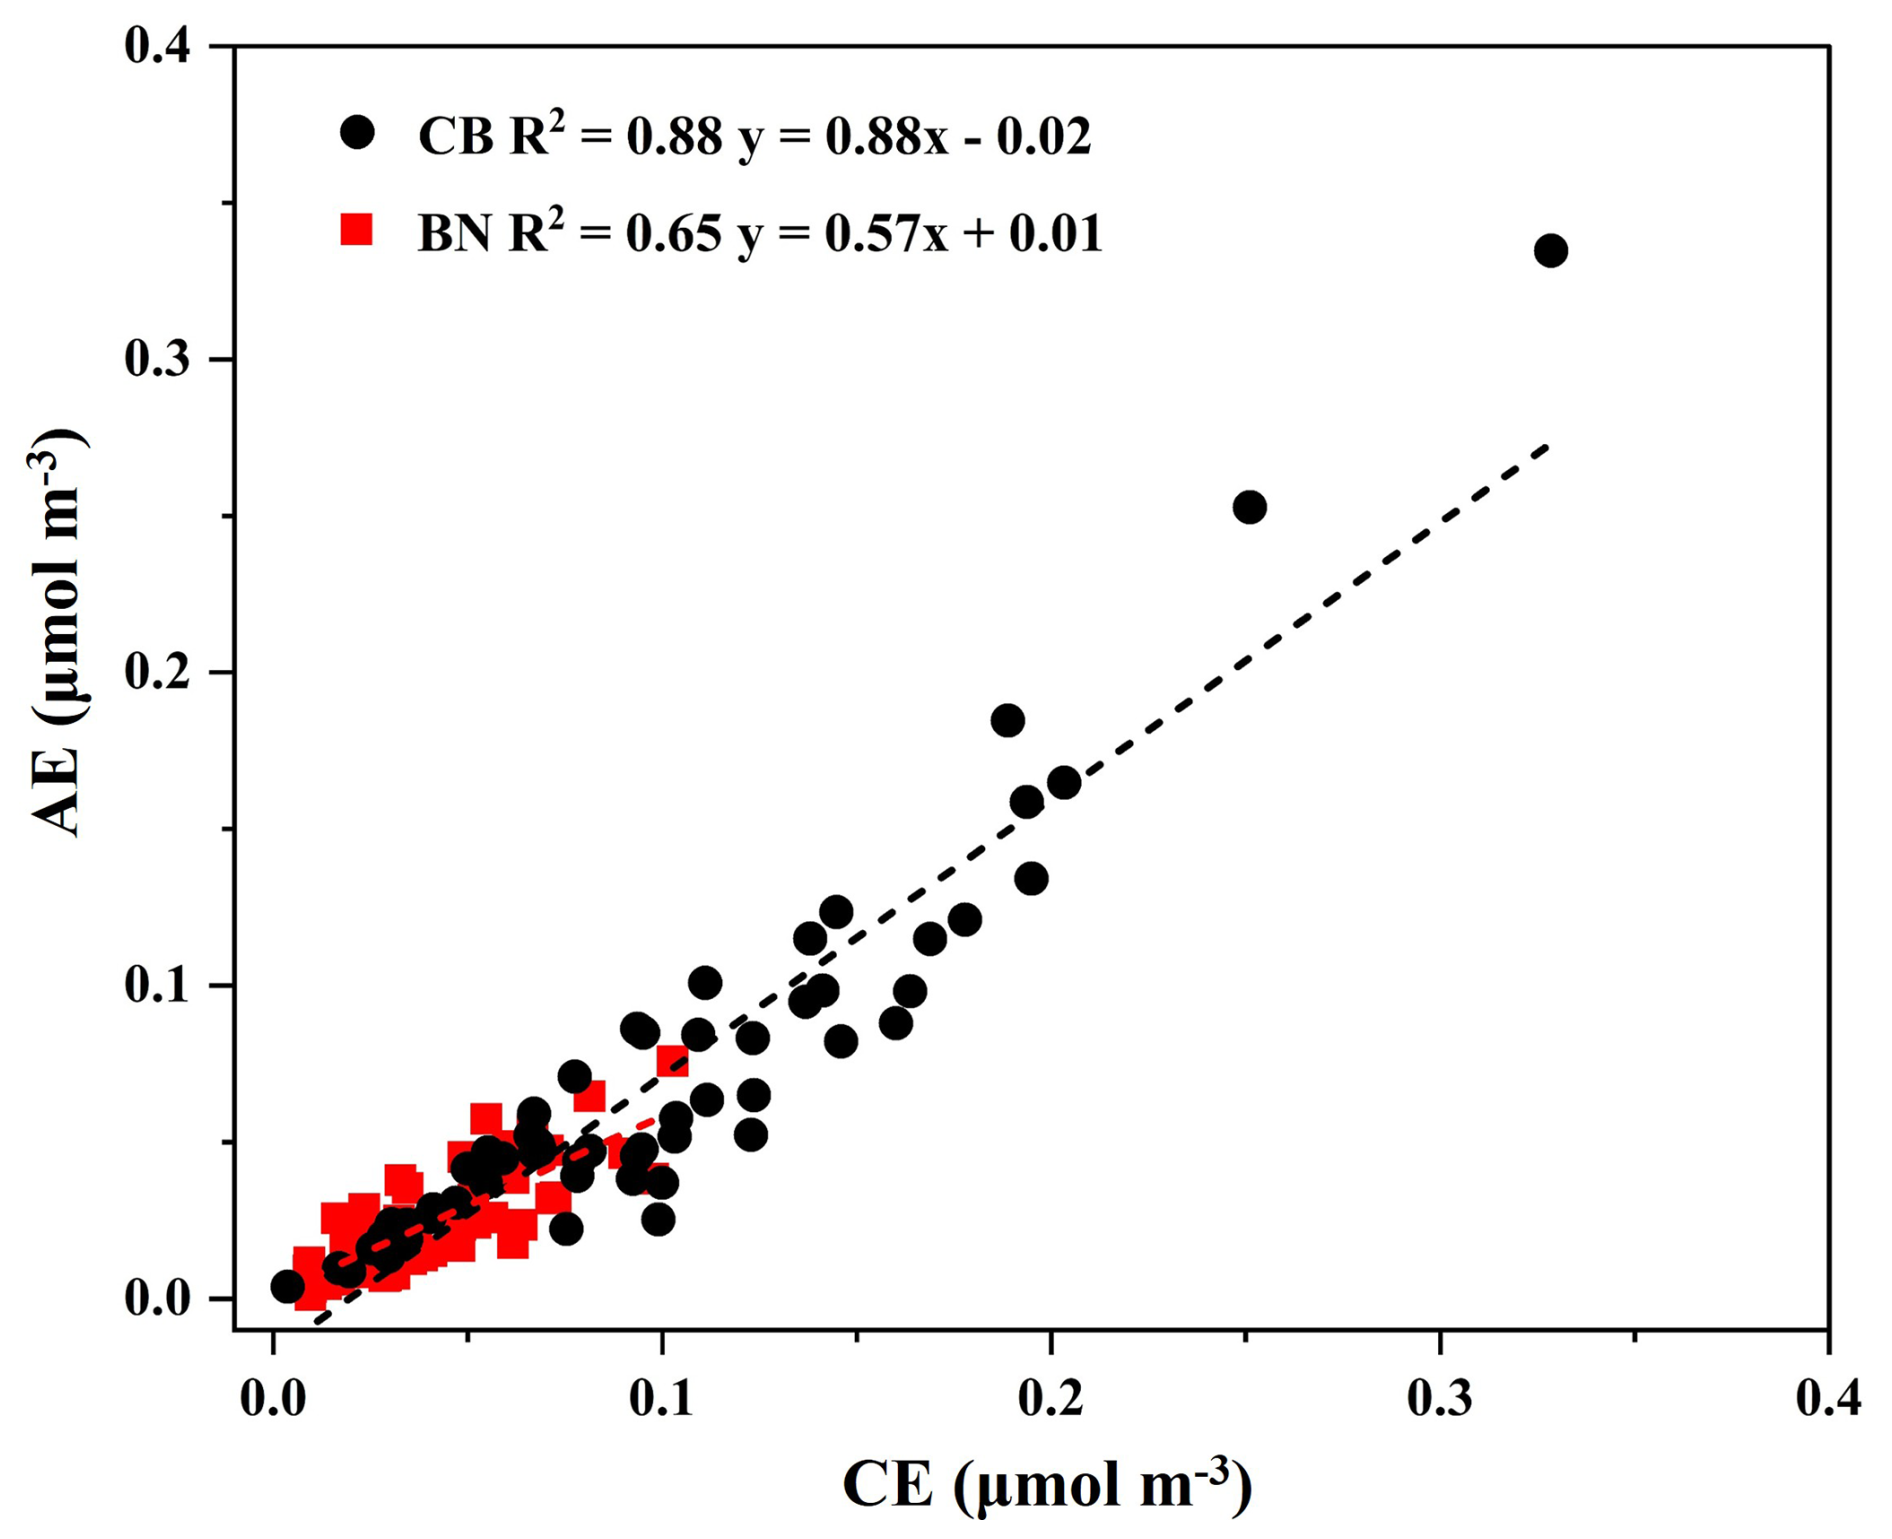
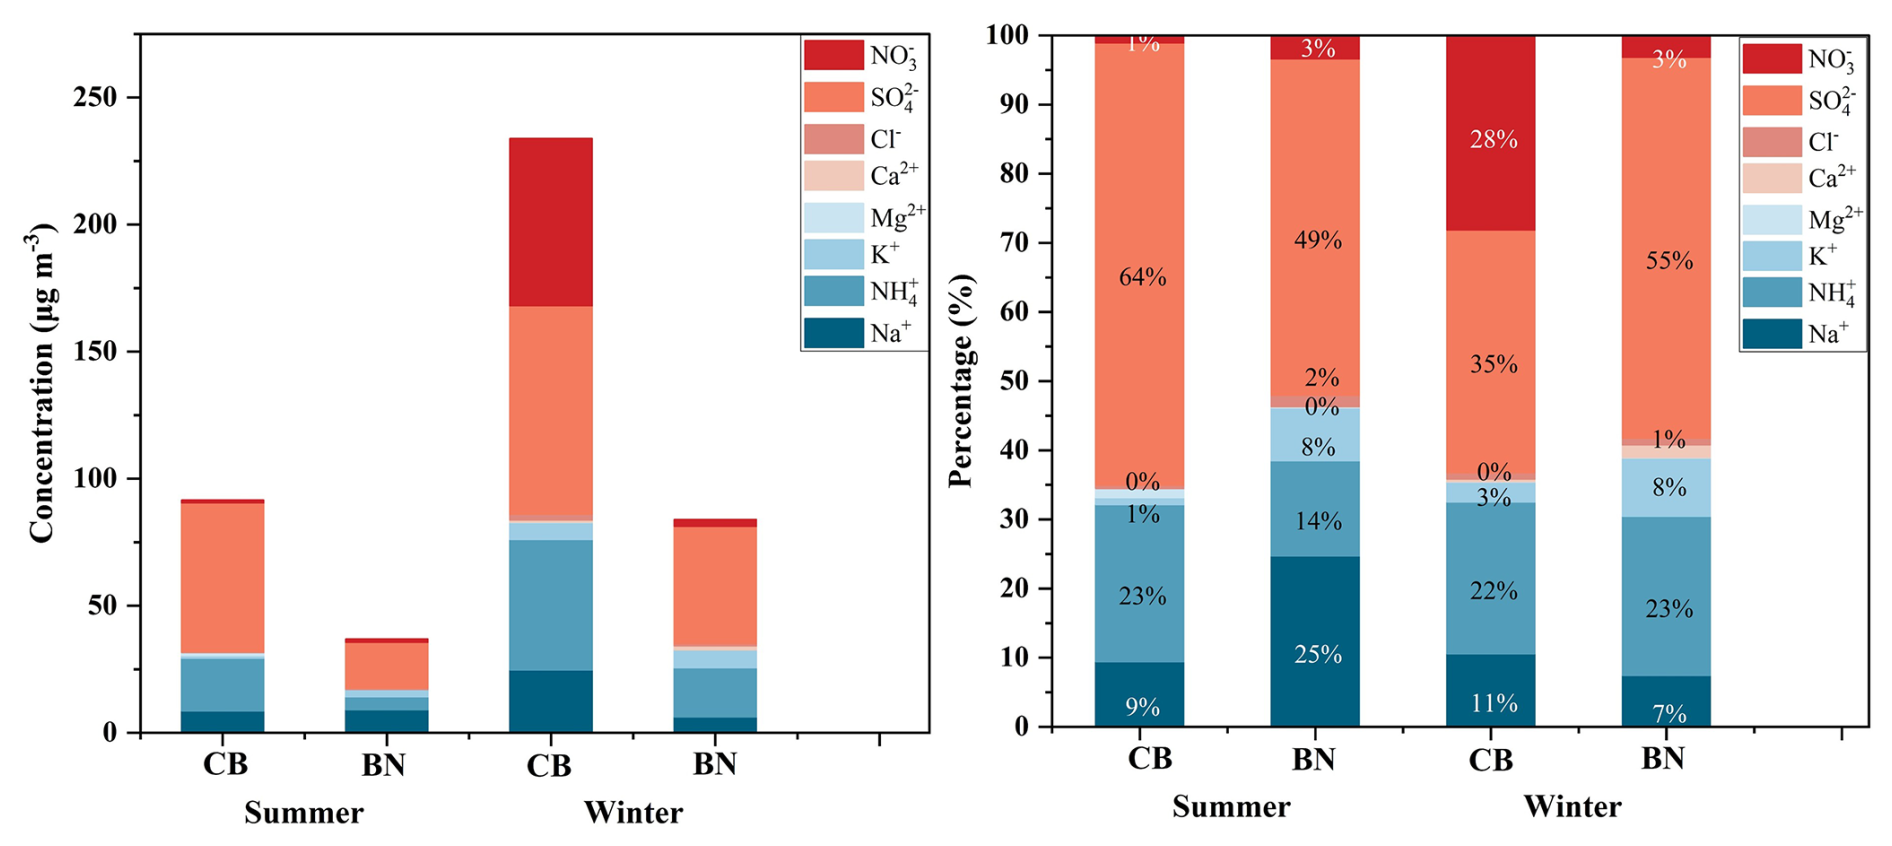
Table S1 in the Supplement shows concentrations of carbonaceous (EC, OC, SOC, WSOC and WIOC) and nitrogenous (WSTN, IN and WSON) components, WSII and in PM2.5 at CB and BN, China in this study. For anions, was identified as the predominant ionic species at both sites (CB: 2.31 µg m−3; BN: 1.07 µg m−3). They accounted for 43 % and of total ionic mass at CB and 52 % at BN, respectively. was the second abundant anion at both sites, followed by Cl−. For cations, was the most abundant ion (CB: 1.18 µg m−3; BN: 0.41 µg m−3) followed by Na+, K+, Mg2+ and Ca2+ at CB, whereas at BN, their abundances followed an order: . As the main secondary ions in PM2.5, the cumulative concentration , and reached 86 % at CB and 76 % at BN of the total ions, respectively. The concentrations of main secondary ions were significantly lower compared to those typically observed in urban sites, such as Tianjin, Beijing, Guangzhou, Chongqing in China, Chennai in India, and Hachinohe in Japan (Pathak et al., 2009; Qiao et al., 2019; Pavuluri et al., 2011a; Dong et al., 2023; Sun and Zhang, 2024). On the other hand, they were comparable to those reported at rural background sites in France (Bressi et al., 2013) and the southeastern United States (Nah et al., 2018), but lower than those reported at the forested site, K-puszta (Kourtchev et al., 2009). Except for Na+ and K+, the mean levels of different ions at CB exceeded those at BN. Ionic species exhibited peak concentrations in winter in their seasonal distributions (Fig. 4). However, the ionic species did not show a clear diurnal variation.
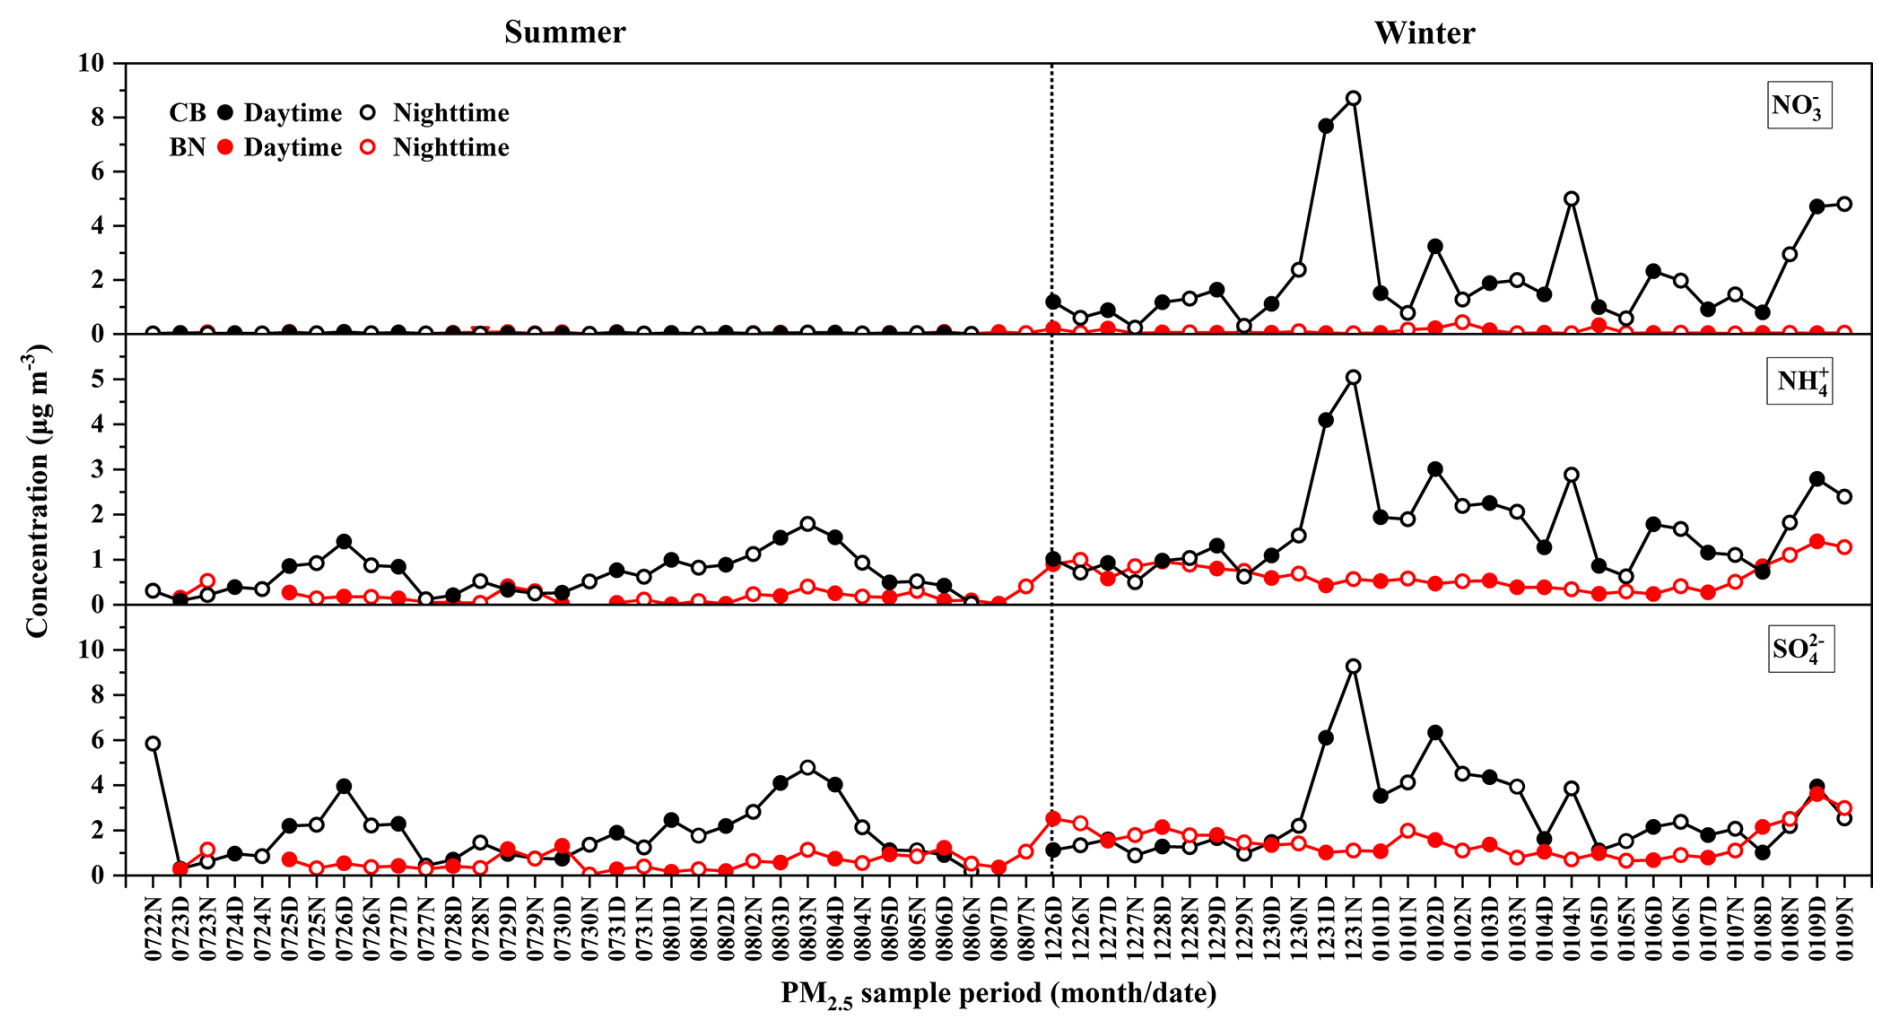
Figure 4Temporal variations of secondary ionic species concentrations (µg m−3) in PM2.5 collected from CB and BN, China during 2023–2024.
The concentrations of , , and in PM2.5 during winter were higher than those in summer by 1.45, 2.55, and 73.00 times, respectively, at CB, and 2.57, 3.76, and 2.25 times, respectively, at BN. The coal combustion is considered as a major source of SO2, NOx, and NH3 (Zhang et al., 2020; Zheng et al., 2022). The concentrations of secondary ions at CB were higher than that at BN in winter. This could be linked to the increased utilization of coal for domestic heating in winter, which leads to substantial emissions of gaseous precursors like SO2 and NOx. This also explains the rapid increase in concentrations during winter at CB. is primarily influenced by industrial and vehicular sources. Except during winter at CB, its concentrations remain consistently low, indicating minimal anthropogenic influence on forest sites. This was consistent with the concentrations reported by Tanner et al. (2004) for rural (avg. 0.04 µg m−3) and background sites (avg. 0.01 µg m−3) in the Tennessee Valley, USA, particularly during summer. Oceanic phytoplankton and/or dimethyl sulfide (DMS) emitted from biomass burning undergo photochemical oxidation to convert into SO2, which subsequently transformed into (Meinardi et al., 2003). However, Cl− can also come from the oceanic emission, but its concentration was very low, indicating that was not significantly affected by the oceanic emissions. This further implies the significance of anthropogenic sources. In addition, the low temperatures in winter resulted in a decreased atmospheric boundary layer, which hindered the dispersion of pollutants.
Figure 5 summarizes the concentrations and percentage contributions of various water-soluble ionic components. The contribution of to total ions at BN was very small in both summer (3 %) and winter (3 %), which may be attributed to the removal effect of wet deposition on nitrate particles due to the hot and humid climate throughout the year. However, the lower temperature environment (<15 °C) in winter might facilitated the transformation of gaseous nitric (HNO3) acid to particulate (NH4NO3), thereby potentially increasing the concentration of particulate . On the other hand, anthropogenic activities such as winter heating might emit more NOx, which, after undergoing a sequence of chemical reactions in the atmosphere, were converted into . Therefore, the contribution of (28 %) in winter at CB was relatively high.
The average concentration of WSTN was 2.33 ± 2.34 µg m−3, and IN was 1.85 ± 1.26 µg m−3 at CB, while 1.29 ± 0.51 µg m−3 and 0.52 ± 0.23 µg m−3 at BN. WSTN, IN, WSON and secondary ions had the same seasonal variation trend in concentration, with higher levels in winter (Fig. 6). WSON constituted an average of 57.7 % of WSTN at CB and 40.3 % at BN, respectively. WSONWSTN at CB and BN were significantly higher as than other sites located in Himalaya (18 %, hill site), New Delhi, India (19 %, urban site), Sapporo, Japan (9 %, urban site) and Svalbard Islands, Norway (8 %, Coastal site) (Pavuluri et al., 2015; Tripathee et al., 2021; Boreddy et al., 2024; Pei et al., 2024). Similarities were noted with the forest aerosols collected from Rondônia, Brazil, during an intense biomass burning period. (∼45 %, forest site) (Mace et al., 2003).
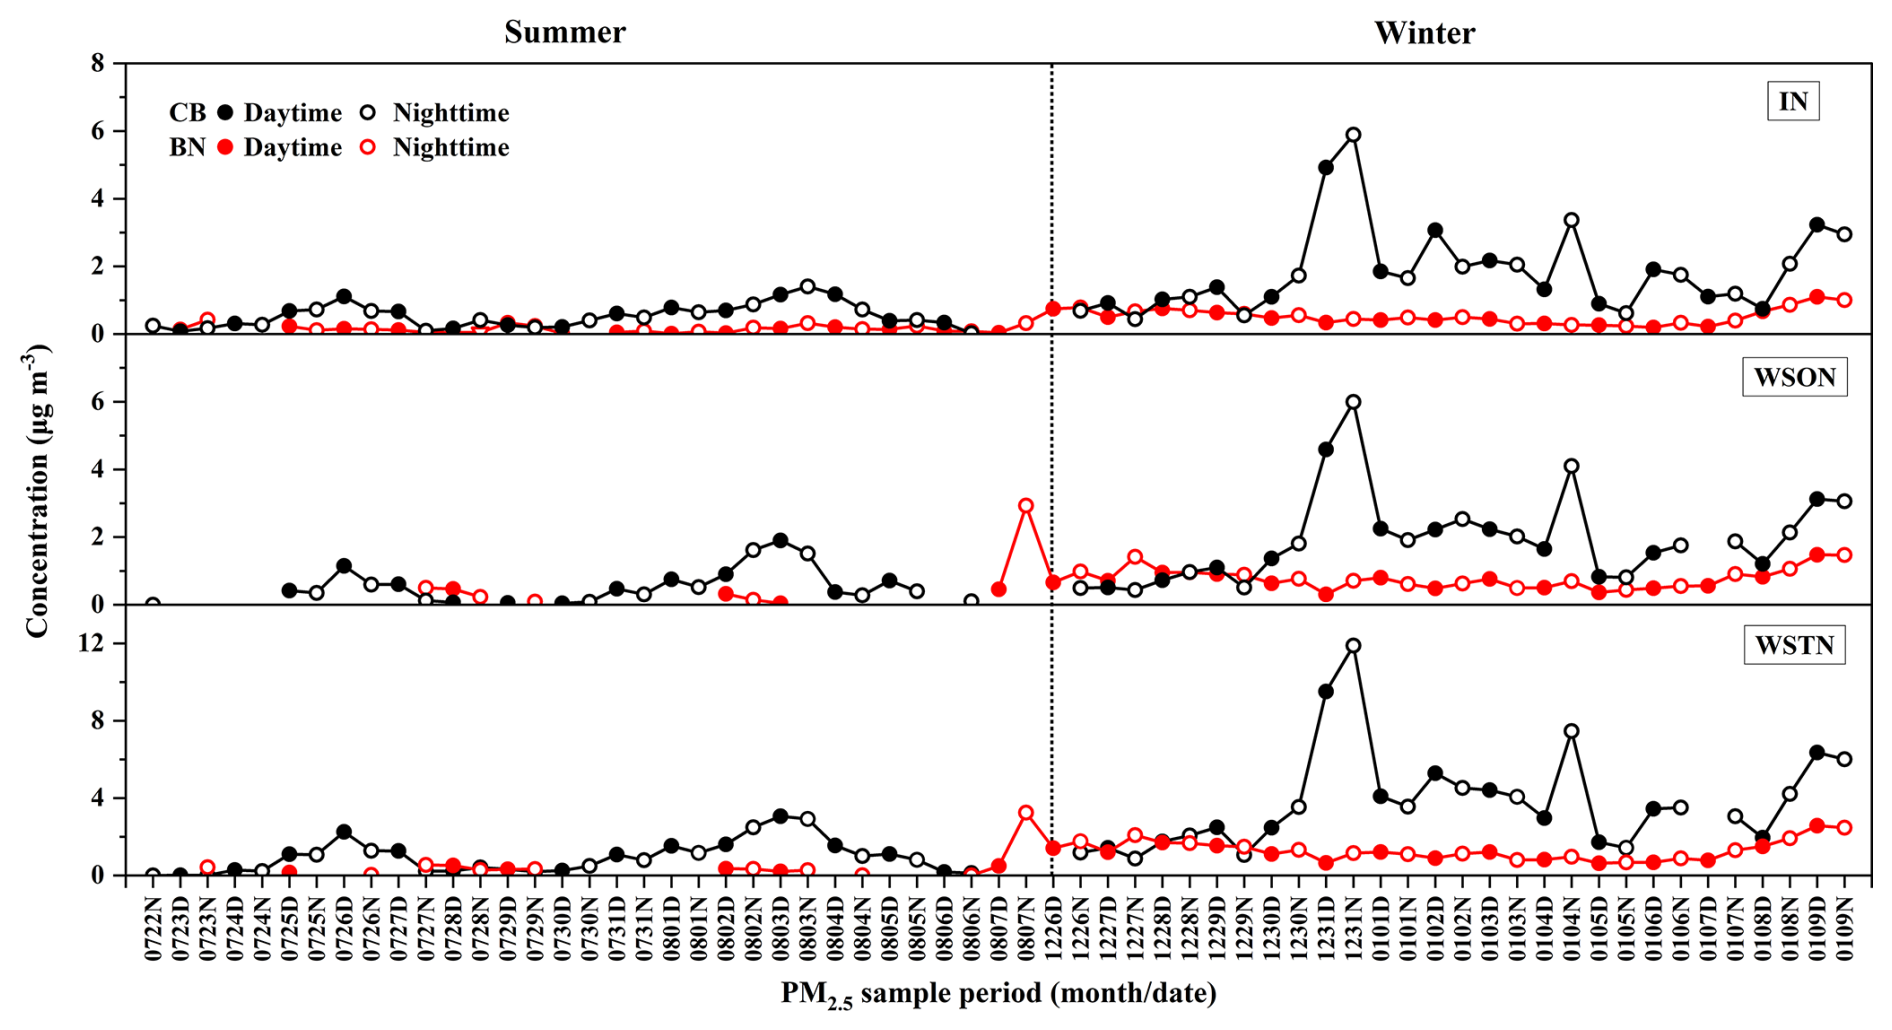
Figure 6Temporal variations of concentrations (µg m−3) of nitrogenous components in PM2.5 collected from CB and BN, China during 2023–2024.
3.2.2 Characterization of carbonaceous components and
Table S1 and Fig. 7 show the mass concentrations and temporal variations of OC, EC, SOC, and WSOC in PM2.5 at CB and BN in China. The average mass concentrations of OC and EC at CB were 2.73 ± 1.72 µg m−3 and 0.17 ± 0.14 µg m−3, while those at BN were 3.75 ± 1.33 µg m−3 and 0.19 ± 0.09 µg m−3. Furthermore, average concentrations of OC were consistently higher than EC at both sites. OC, WSOC and SOC exhibited notable seasonal variations (Fig. 7), and their average concentrations were all higher in winter compared to summer. Overall, OC levels in winter were twice as high as in summer at both CB and BN. EC in winter were 7 times higher at CB but only 1.4 times higher at BN compared to that in summer. Elevated EC levels in winter suggested a higher influence of fossil fuel combustion. Moreover, the higher loads of OC in contrast to EC in winter and summer at both sites implied that secondary OC formation and/or increased emissions from coal combustion and biomass burning were significant. The average concentration of SOC at CB in winter (2.36 ± 1.28 µg m−3) was twice as high as in summer (1.16 ± 0.60 µg m−3). In addition, the average concentration of WSOC was 1.46 ± 1.00 µg m−3 at CB and 2.16 ± 1.03 µg m−3 at BN. BN exhibited a higher level of WSOC, suggesting that there might be higher emissions and/or more secondary formation occurred under conditions of greater oxidant abundance at BN than at CB. Furthermore, the temporal variations of OC, WIOC, SOC, and WSOC exhibited comparable trends, suggesting a common or similar source origin and potentially similar formation processes at CB and BN.
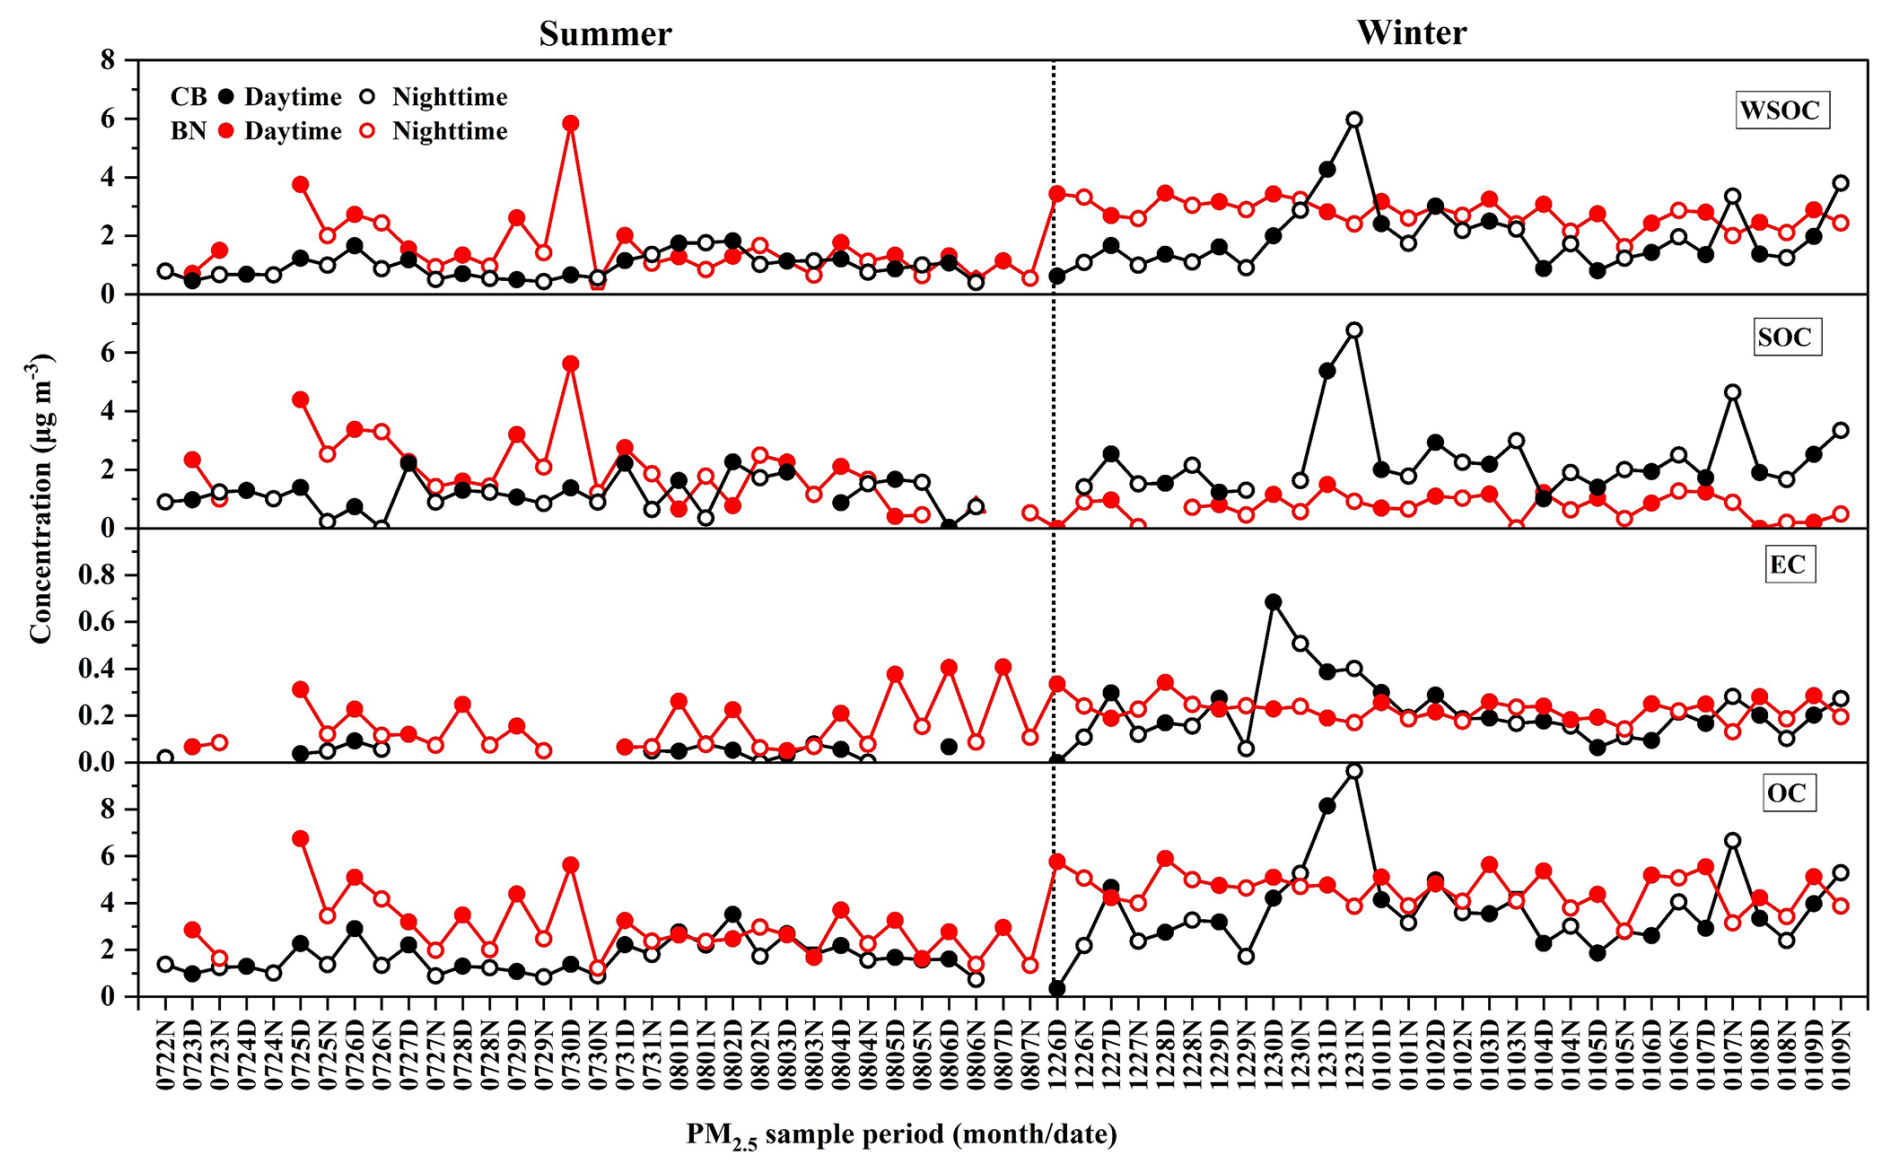
Figure 7Temporal variations in the concentrations of OC, EC, WSOC, and SOC in PM2.5 collected from CB and BN, China during 2023–2024.
The concentrations of OC, SOC and WSOC were higher during the daytime than at nighttime at CB and BN (Fig. 8). The intense sunlight and high temperatures prevalent in the local region might have facilitated the enhanced formation of SOC during the summer. However, EC displayed no significant diurnal variation at CB. As shown in Fig. 7, OC, SOC and WSOC at CB in winter showed similar diurnal trends, suggesting that they could share similar/same origins and formation processes. Elevated concentrations of carbonaceous components at CB on 31 December 2023 was observed, which could be attributed to local fireworks and firecracker celebrations in advance of the New Year's Eve. We also noticed an increase in the concentrations of OC, SOC, and WSOC in the daytime on 30 July and 25 July 2023 at BN, which might be related to local biomass burning events.
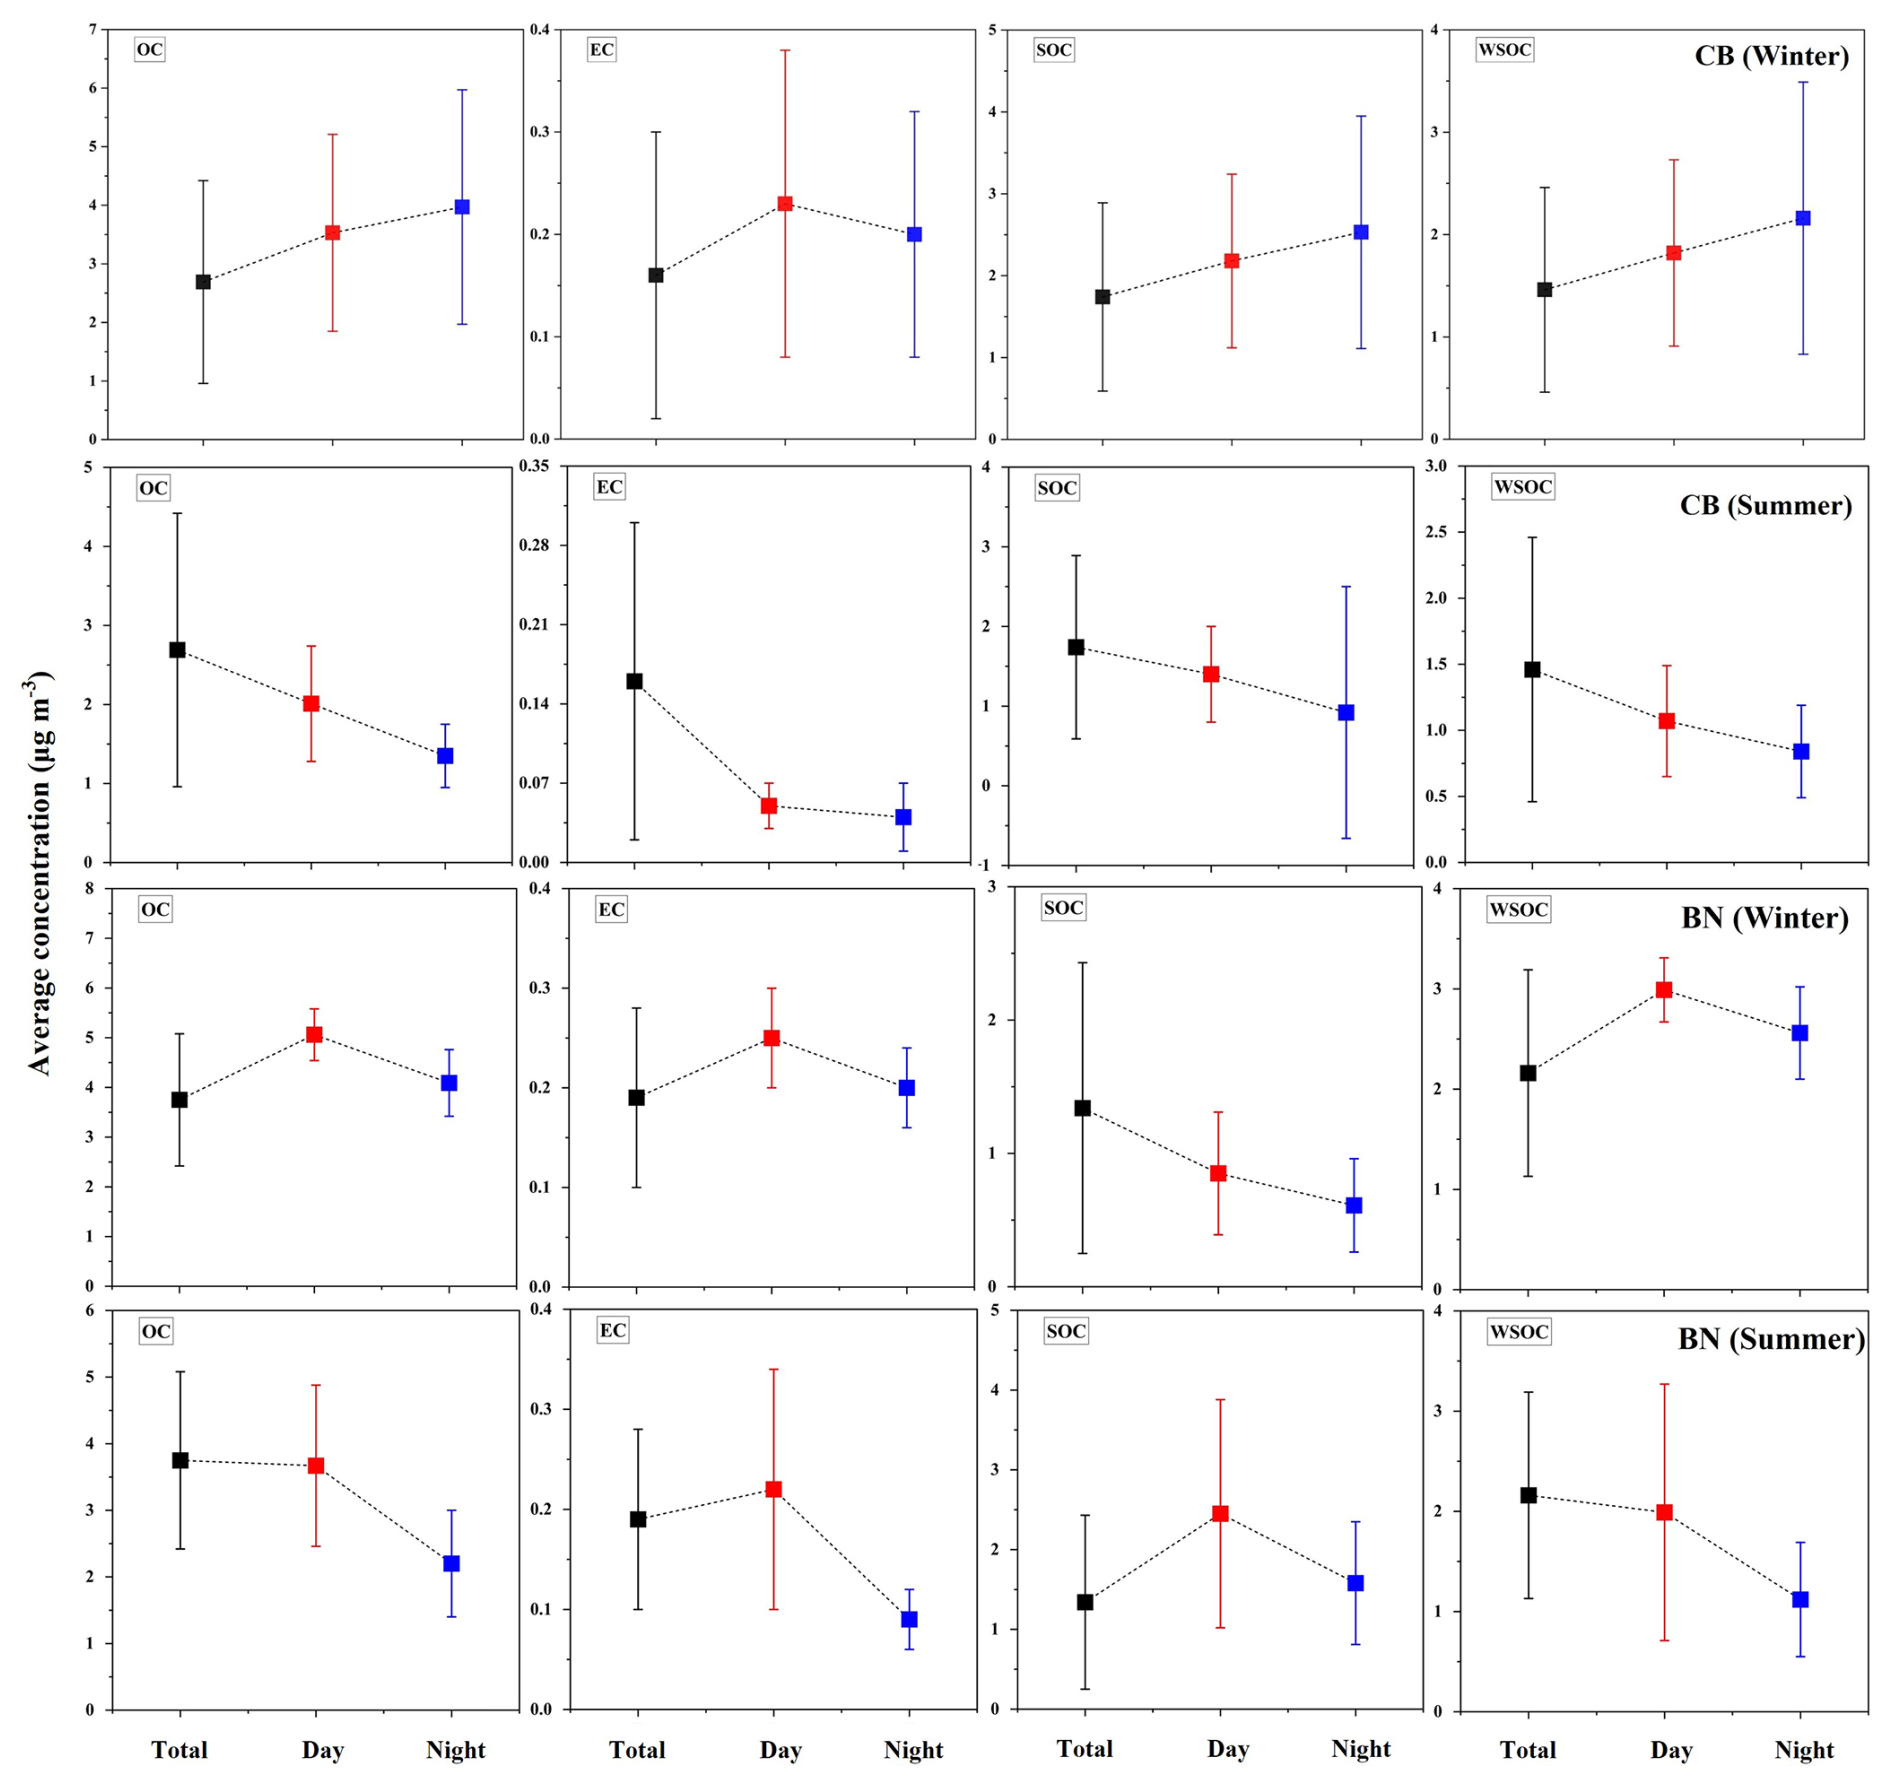
Figure 8Diurnal variations in carbonaceous components in summer and winter forest aerosol samples collected from CB and BN, China during 2023–2024. The black, red and blue squares represent the average concentrations of total (T), daytime (D) and nighttime (N).
Figure 9 illustrates the seasonal and annual variations in of CB and BN aerosols. The annual variability in PM2.5 ranged from −27.8 ‰ to −22.1 ‰, (avg. −25.7 ‰ ± 1.5 ‰) at CB, while −27.6 ‰ to −24.5 ‰ (avg. −26.0 ‰ ± 0.9 ‰) at BN during the campaign. Overall, the at CB was more positive than that at BN. Compared with winter, the in summer were much lower, whose values ranged from −27.8 ‰ to −26.2 ‰ (avg. −27.0 ‰ ± 0.5 ‰) at CB, and from −27.6 ‰ to −26.2 ‰ (avg. −26.9 ‰ ± 0.4 ‰) at BN.
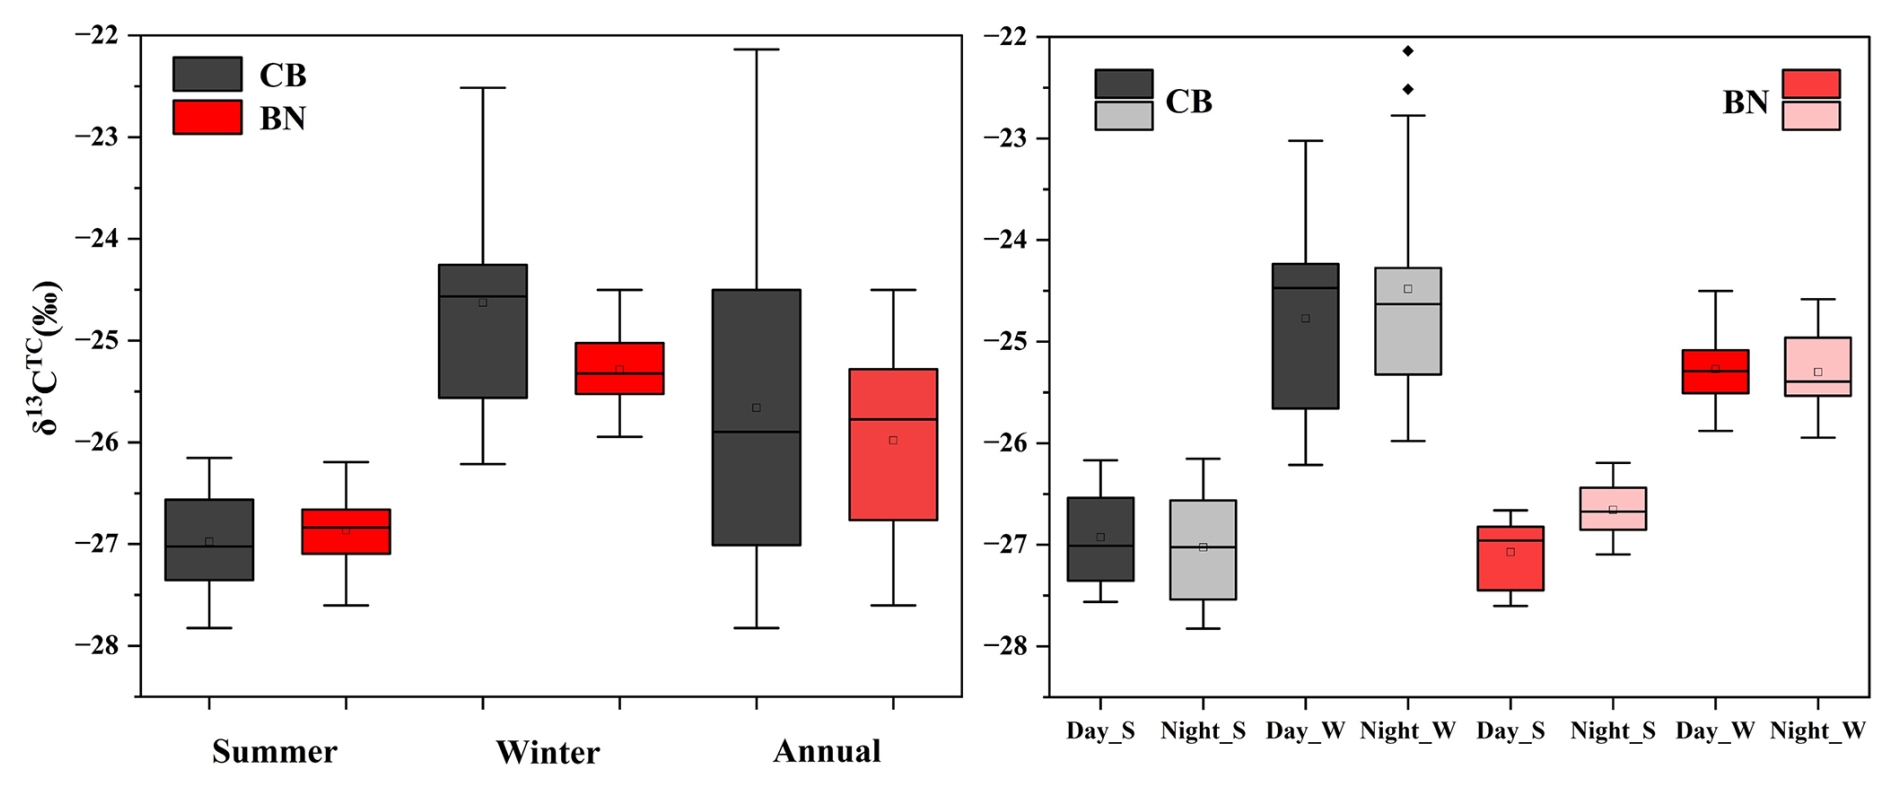
Figure 9Seasonal and diurnal variations of collected form CB and BN during the campaign. The S and W represent summer and winter, respectively.
The diurnal variation of in the aerosols of CB and BN was not very significant, except for a slight difference in winter at CB and in summer at BN, where the average values were −24.8 ‰ ± 1.0 ‰ and −27.1 ‰ ± 0.3 ‰ at the daytime, −24.5 ‰ ± 1.2 ‰ and −26.7 ‰ ± 0.3 ‰ at the nighttime, respectively. Their values were more positive at the nighttime. This might be associated with stronger plant emissions/biological activity during the daytime, and higher humidity and lower temperatures at nighttime that favored gas-to-particle transformation of organic compounds (Ren et al., 2019).
3.3 Implications for PM2.5 sources
3.3.1 Origins of inorganic ions
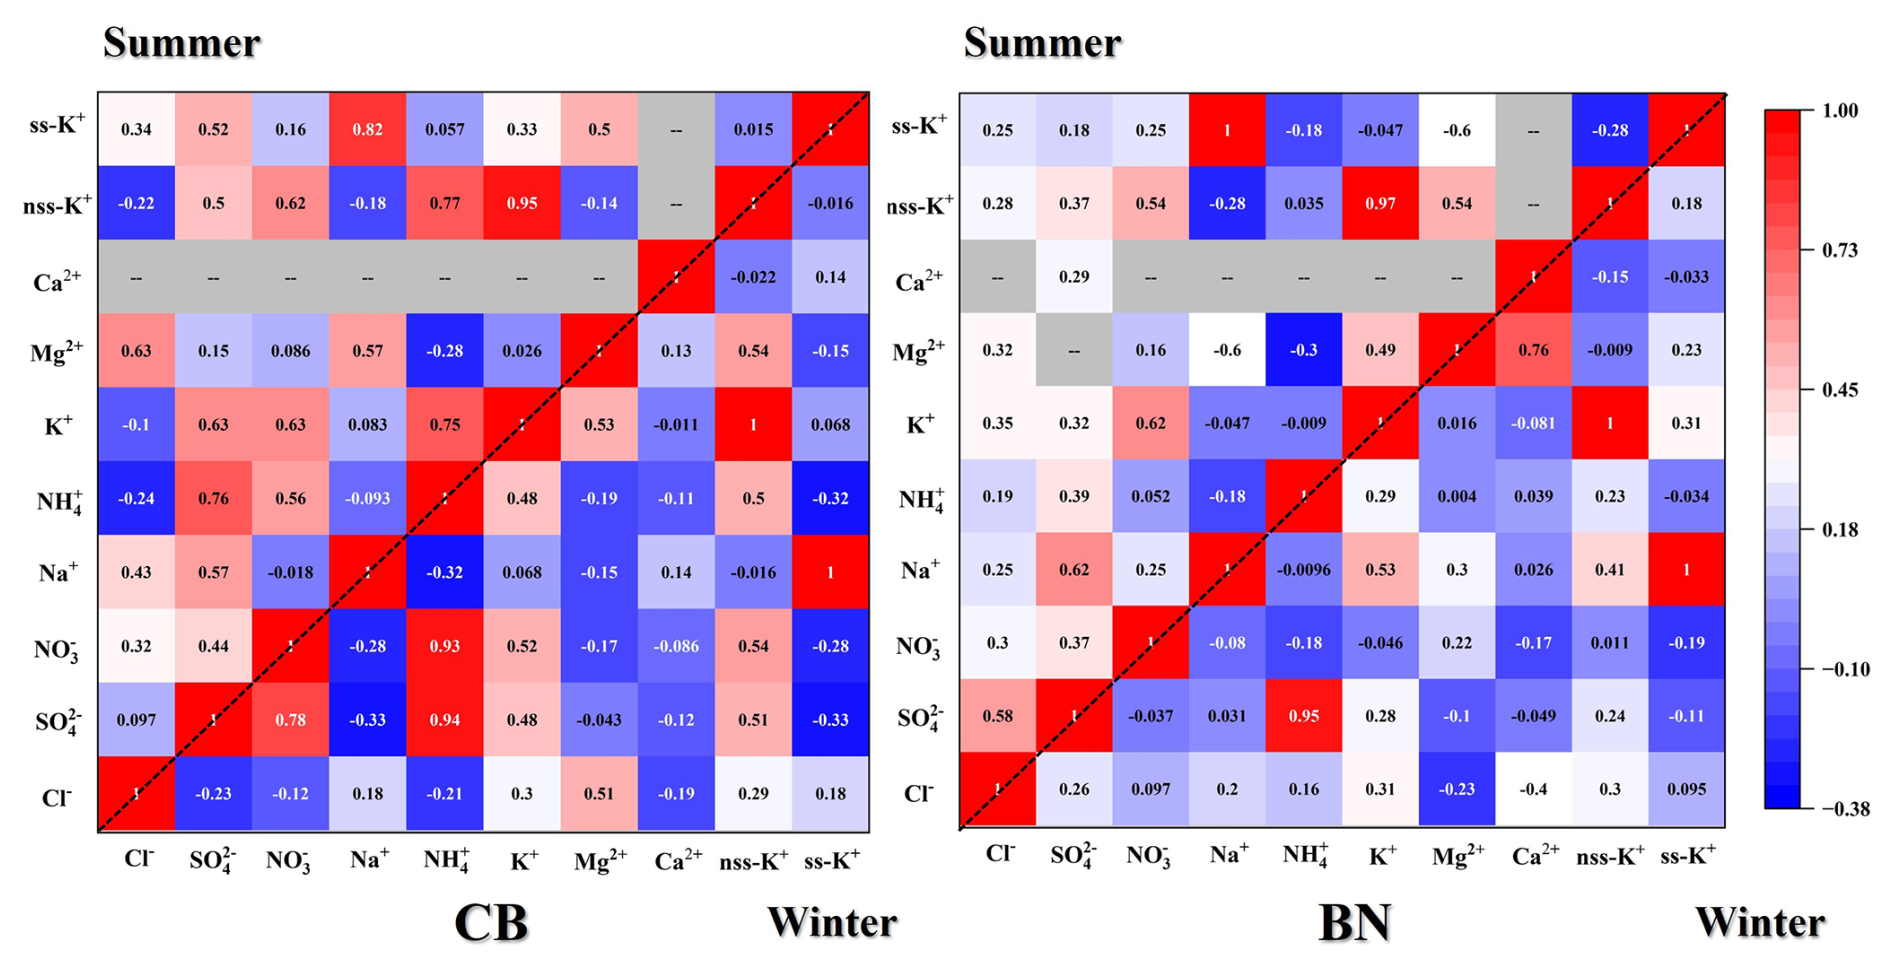
Characterization of the ionic components of aerosols from primary sources can reflect the changing characteristics of the emission sources. nss-K+ serves as a tracer for emissions from biomass combustion, Cl− is associated with emissions from combustion activities (coal and straw burning, etc.). However, the lower concentration of particulate Cl− in summer may be attributed to the formation of gaseous HCl, which is volatile under high-temperature and high-humidity conditions and could escape from aerosols. The results were comparable to previously reported levels at Mt. Changbai (avg. 0.02 µg m−3) and Mt. Dinghu (avg. 0.02 µg m−3) (Li et al., 2010).The contributions of nss- and nss-K+ to the total and K+ concentrations were on average 87 % (summer: 78 %; winter: 96 %) and 85 % (summer: 76 %; winter: 94 %) in BN, 92 % (summer: 95 %; winter: 88 %) and 76 % (summer: 69 %; winter: 83 %) at CB, indicating a predominant influence of anthropogenic sources over marine sources, especially in winter. Since the anthropogenic sources at CB contributed more to the ions in PM2.5, the concentration of total ions at CB was consistently higher than that at BN in both seasons, with the annual average of total ion concentration at CB being approximately 2.63 times to that at BN. There were significant correlations among , , and at CB (Fig. 10), implying a common origin and analogous oxidation processes. The positive correlation between nss-K+ and , , at CB (R2>0.50) implied that they were predominantly influenced by biomass burning.
The concentrations of secondary inorganic ions are mainly associated with the content of their gaseous precursors (SO2, NOx, NH3) and the chemical reactions then undergo in the atmosphere, as well as meteorological conditions. The precursor of primarily originates from vehicle exhaust emissions, while the precursor of mainly stems from coal combustion emissions from industries, residential life, and other sources. Thus, the mass ratio of can evaluate the influence of mobile and stationary sources on atmospheric aerosols. The concentrations of were significantly low in summer at CB and BN, implying negligible contributions from motor vehicle emissions. However, the at CB in winter (0.79 ± 0.39) was approximately 26 times that in summer (0.03 ± 0.02), indicating a notable rise in the contribution of mobile sources during winter. Annual average temperature of BN was about 20 °C, with a relatively large volatilization of , leading to a lower value (avg. 0.08 ± 0.08).
The molar ratio of in aerosols can be used to determine the acidity of aerosols and the combination form of the main secondary inorganic ions (Pathak et al., 2004; Lyu et al., 2015). When , the aerosols are almost completely neutralized although ammonium nitrate (NH4NO3) is present. If , the concentration of free acid in the particulate phase is relatively high, and there is almost no NH4NO3 present. The average ratio of at CB was 1.74 (summer: 0.97; winter: 2.54), whereas that at BN was 0.84 (summer: 0.44; winter: 1.25), suggesting an excess of ammonium existed in the aerosols at both sites, and nearly no NH4NO3 was present at BN. In fact, the concentrations of and Cl− were extremely low at both sites in summer, so the main form of were (NH4)2SO4 and NH4HSO4. This resulted from elevated summer temperatures enhancing the breakdown of particulate NH4NO3 into gaseous NH3 and HNO3. was strongly correlated with at both sites, particularly in winter, which further demonstrates that (NH4)2SO4 and NH4HSO4 were their primary forms. However, a favorable correlation existed between and at CB, and the fitting slope of ammonium and in winter was greater than 1 (Fig. 11), indicating that there was an adequate amount of NH3 in the atmosphere to undergo neutralization reactions with H2SO4 and HNO3, thereby forming ammonium NH4NO3 and (NH4)2SO4.
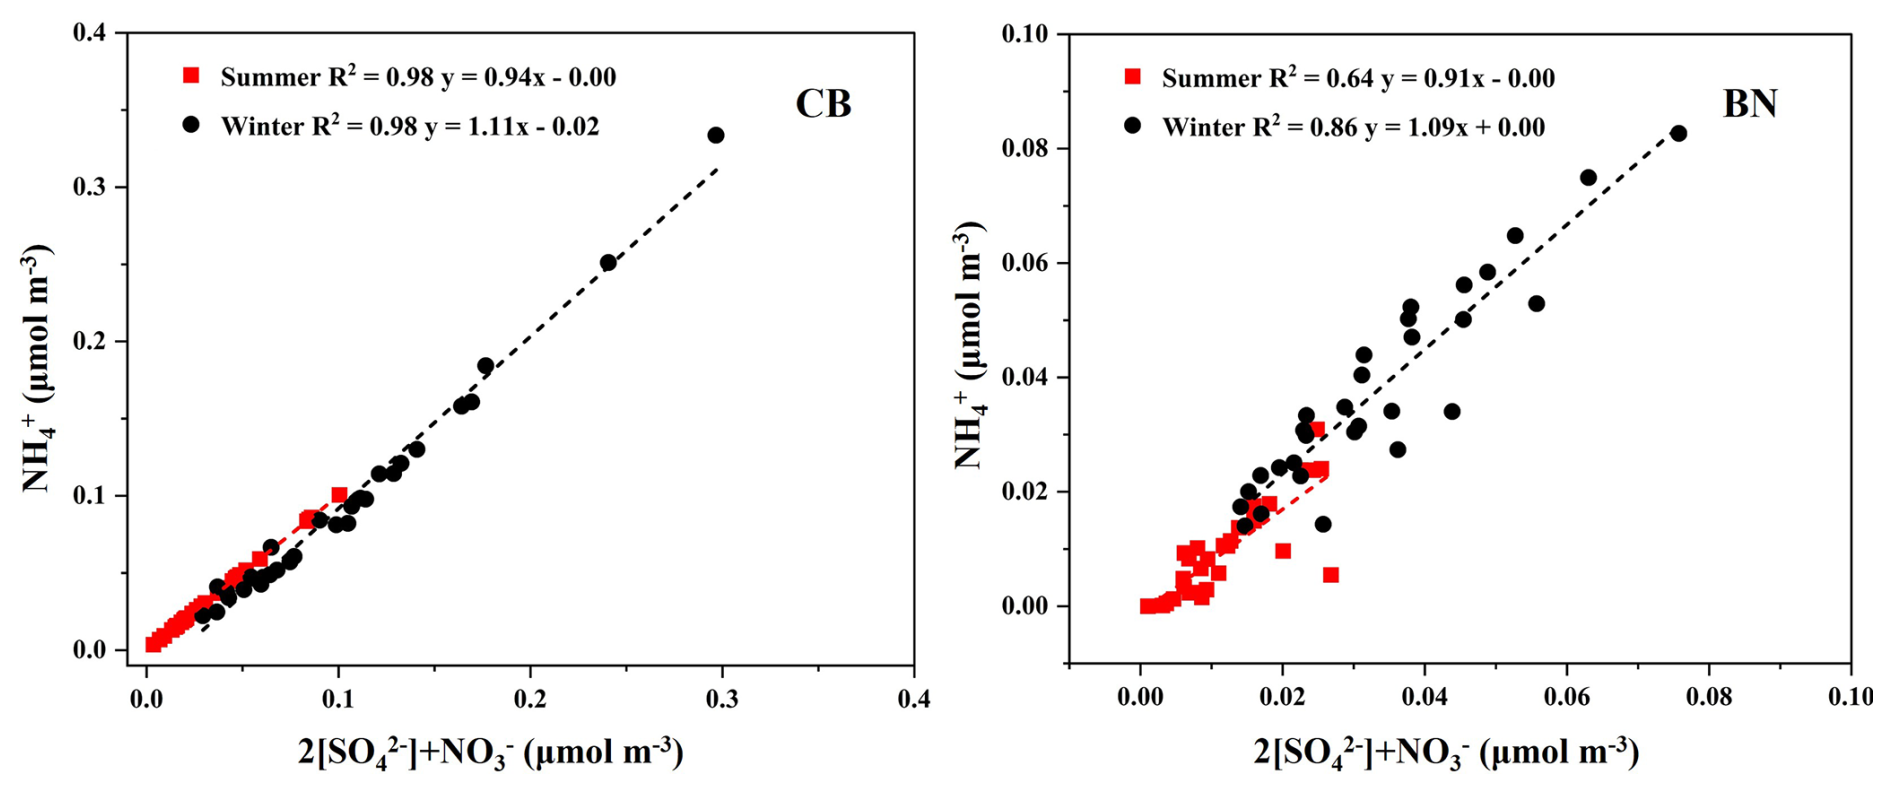
Figure 11Linear correlations of secondary ions in PM2.5 collected from CB and BN during the campaign period (2023–2024).
3.3.2 Origins of carbonaceous components
The variation in the correlation coefficient between OC and EC was primarily affected by pollutant sources, meteorological conditions and seasonal changes. A good correlation between OC and EC suggested a single emission source, whereas a weak correlation indicated a more complex emission source. Consequently, investigating the correlation between OC and EC across different seasons can help infer the sources of carbonaceous aerosols. There were moderate correlations between OC and EC during winter at CB (R2=0.46) and BN (R2=0.67), but weak correlations in summer at both sites (Fig. 12). This implied that OC and EC likely shared similar sources in winter but diverged in summer.
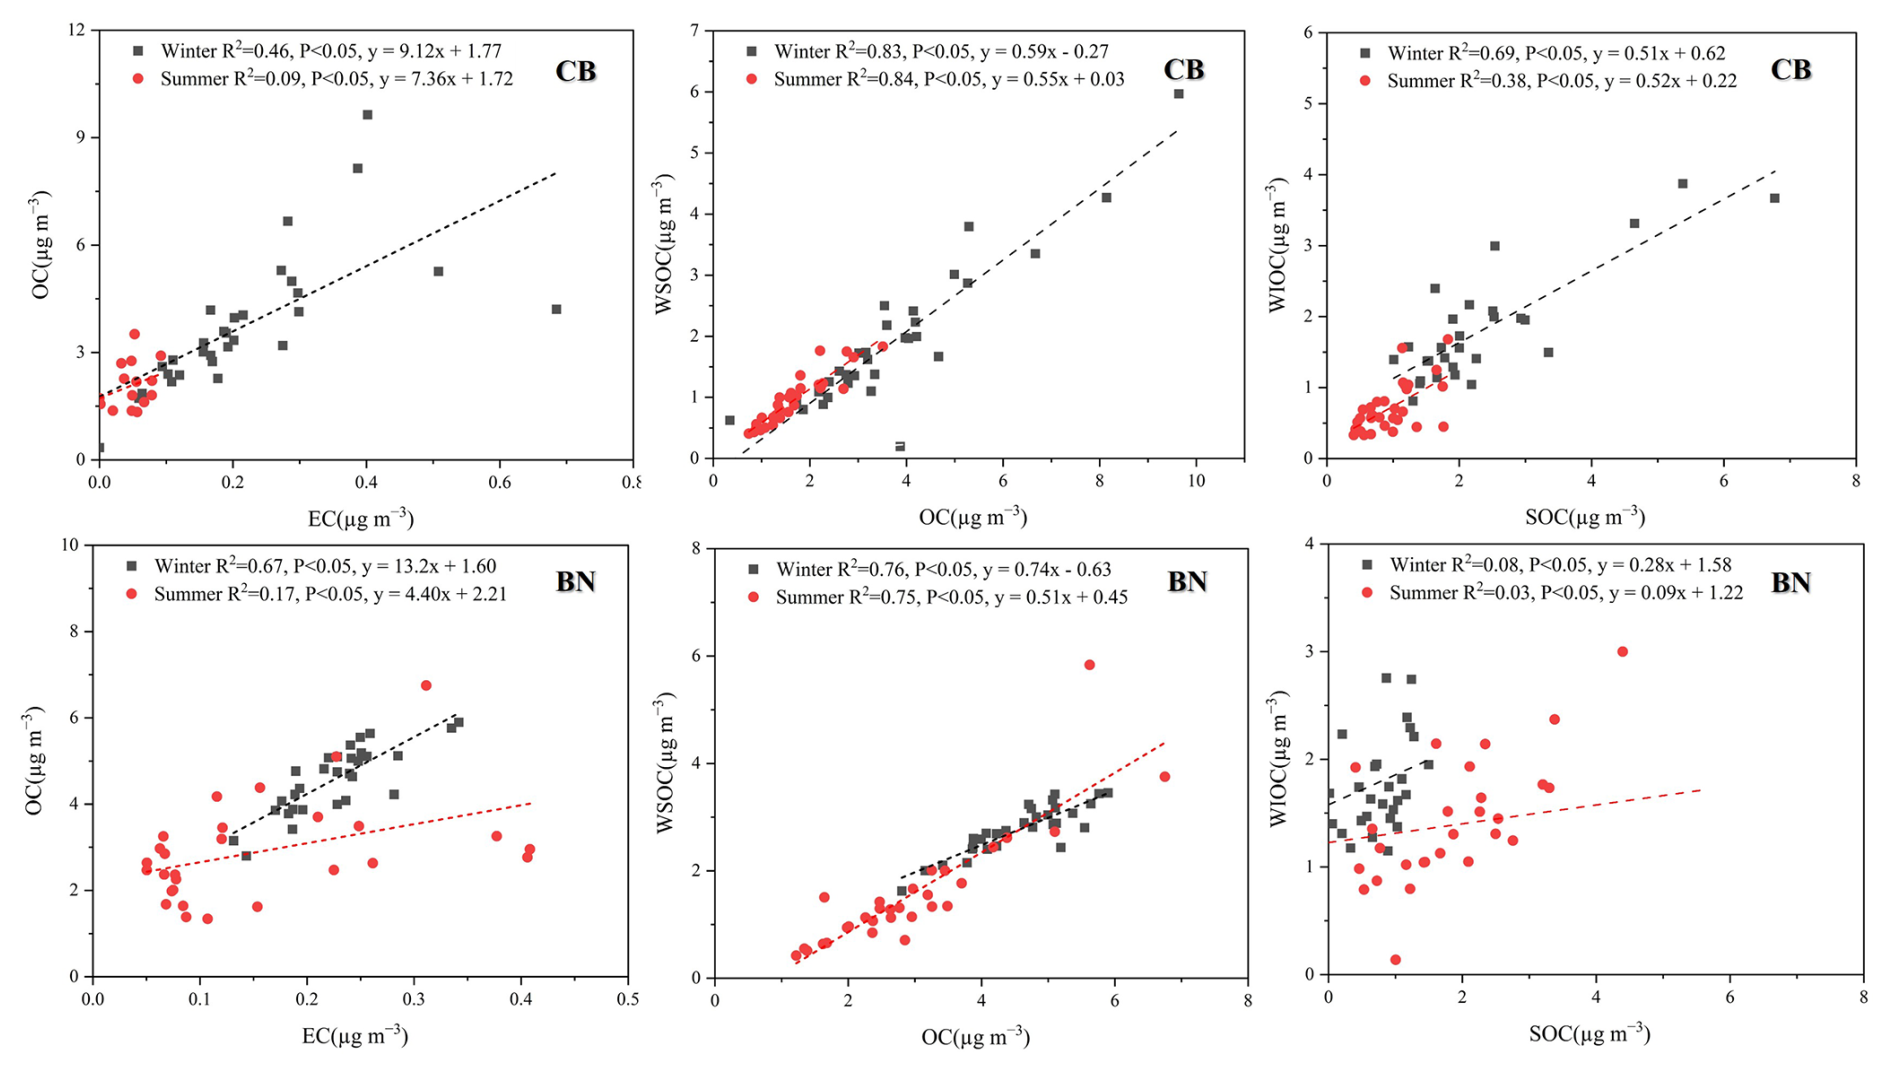
Figure 12Correlations of certain carbonaceous components in PM2.5 collected from CB and BN, China during 2023–2024.
Research indicates that in the regression equation , the term “aEC” reflects primary OC emissions from combustion sources (e.g., coal and traffic), while “b” represents OC from non-combustion sources (Cao et al., 2007). The value of a at CB and BN were notably higher in winter in contrast to that in summer, implying a prominent contribution from combustion-related emissions during the winter season. The higher b value at BN in summer, implying that the impact of non-combustion source emissions was greater in summer than in winter.
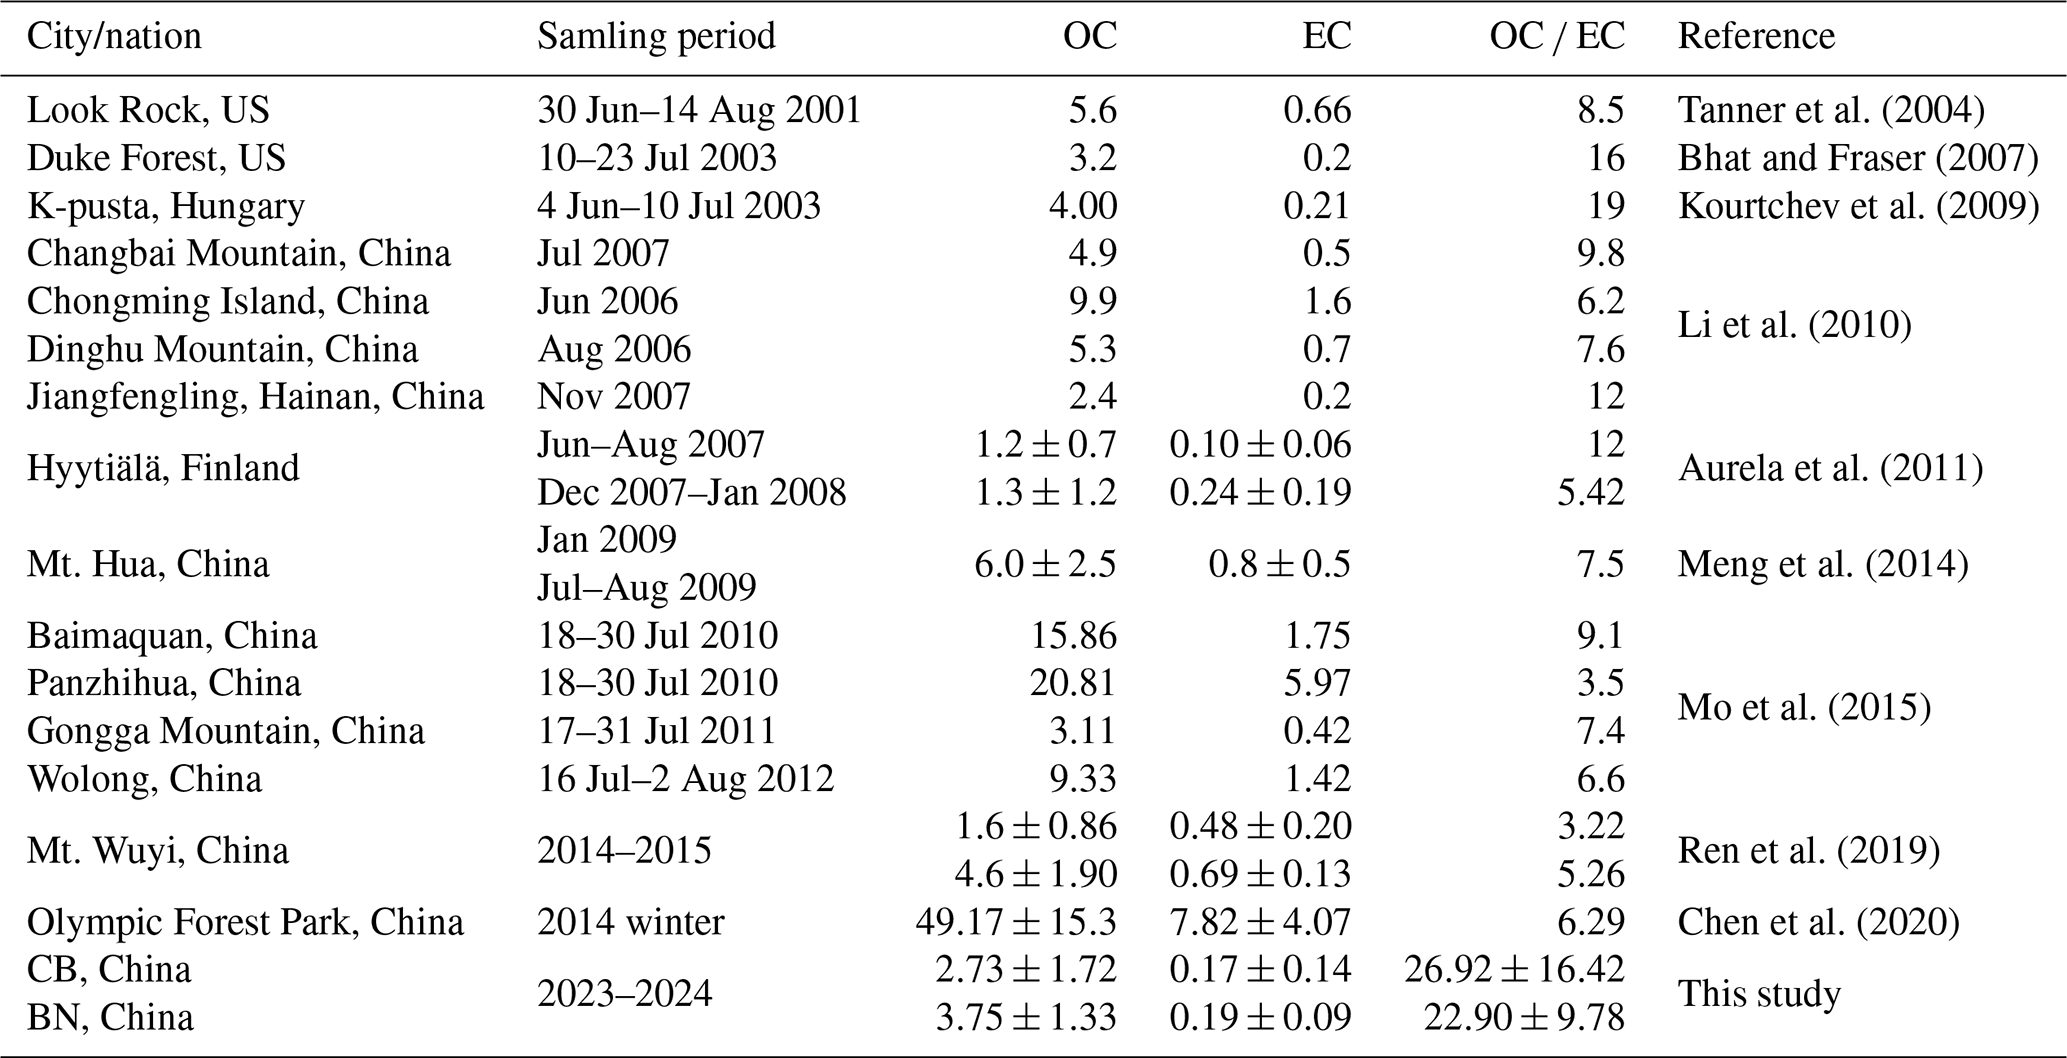
The OC EC ratios differ among various pollution sources, so the OC EC is useful for identifying the sources and emission characteristics of carbonaceous components in PM2.5. When the , it can be inferred that the secondary formation of OC is likely present (Chow et al., 2007). Studies have shown that OC EC ratios ranging from 1.0 to 4.2 indicate traffic sources, with approximately 0.8 for heavy diesel vehicles and 2.2 for light gasoline vehicles; ratios of 2.5 to 10.5 imply coal combustion; ratios of 16.8 to 40 indicate biomass burning (Schauer et al., 1999; Chen et al., 2005). Average OC EC ratios were 26.92 ± 16.42 at CB and 22.90 ± 9.78 at BN, which closely matched the values reported for biomass burning emissions. Table 1 showed the concentrations of OC and EC in PM2.5 at urban and forest sites. It was not difficult to find that OC EC at forest sites was considerably higher than that at urban sites. The average OC EC were 13.5 and 11.5, significantly exceeding 2.0, indicating substantial SOA formation, with higher ratios observed in summer. The elevated OC levels in summer likely resulted from the typically higher temperatures and stronger solar radiation promoted the active life activities in forest areas, which favored the emission of VOCs and thus promote the occurrence of photochemical reactions.
Table 1Comparison of mass concentrations of OC, EC (µg m−3) and OC EC for forest aerosols over the world.
WSOC can be derived directly from biomass burning or form through atmospheric oxidation of VOCs (Schnelle-Kreis et al., 2007; Tang et al., 2020). When biomass burning influence is minimal, the WSOC OC is regarded as an indicator of photochemical aging during long-range atmospheric transport. The average WSOC OC was 0.51 ± 0.09 at CB and 0.61 ± 0.11 at BN. These results suggested that WSOC constituted a significant fraction of OC. Their range and average at CB and BN (Table S1) were comparable to those reported at urban sites, Tianjin, China (range 0.37–0.84, avg. 0.63) (Wang et al., 2018), Chennai, India (range 0.23–0.6; avg. 0.45) (Pavuluri et al., 2011a), Mt. Tai, China (0.55) (Fu et al., 2012), Gwangju, Korera (range 0.26–0.73, average 0.52) (Cho and Park, 2013) and Chengdu, China (avg. 0.50) (Tao et al., 2013), where biomass burning was regarded as the primary aerosol source, undergoing aging. In fact, during summer, higher temperatures and stronger solar radiation result in more vigorous plant activity in forest areas, leading to increased emissions of VOCs. Consequently, high WSOC OC at both sites during summer were likely driven by SOA formation, linked to increased O3 levels, solar radiation, and VOC emissions (Xiang et al., 2017). A strong correlation between WSOC and OC was found at CB (R2=0.84, summer; R2=0.83, winter) and BN (R2=0.77, summer; R2=0.75, winter), indicating that WSOC and OC share similar sources across different seasons.
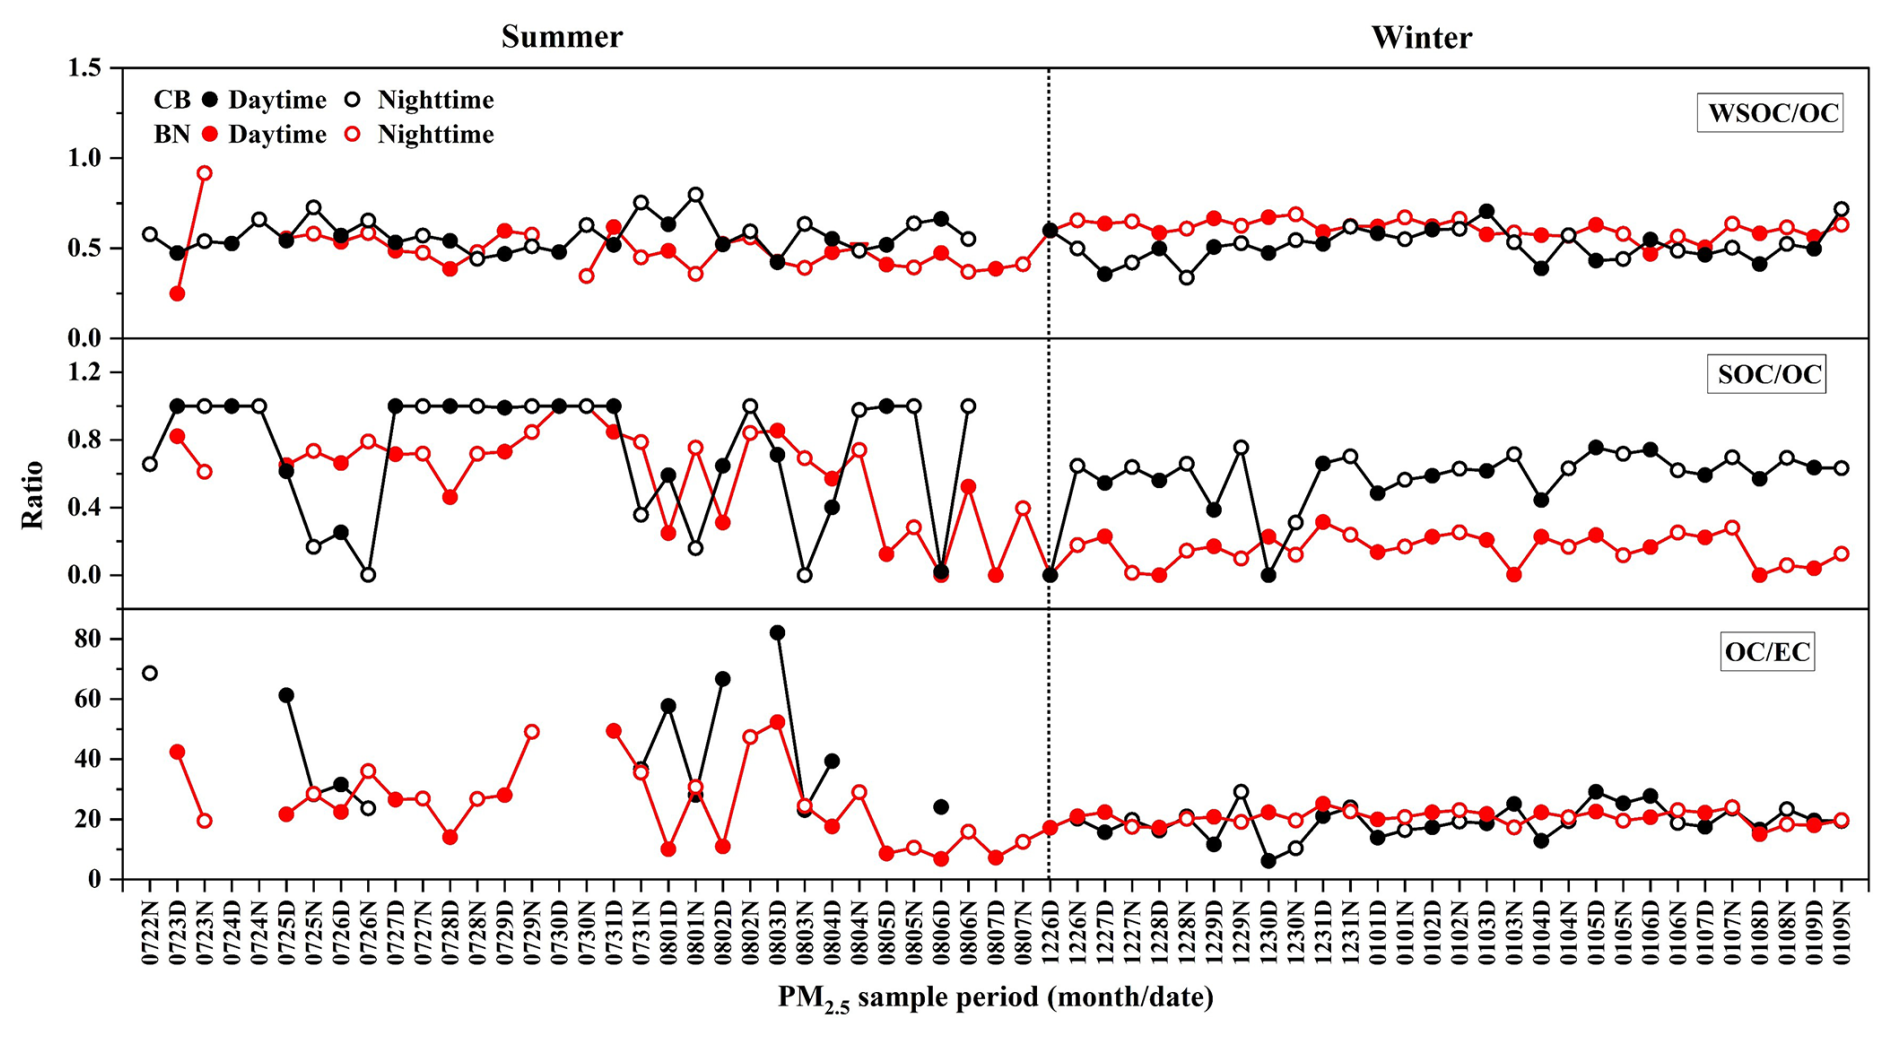
Figure 13Temporal variations of OC EC, WSOC OC and SOC OC in PM2.5 collected from CB and BN, China during 2023–2024.
SOC at CB and BN accounted for 65.2 % and 38.4 % of OC, respectively, and its proportions were higher in summer. The elevated SOC levels in summer likely resulted from increased atmospheric photochemical oxidation. The low SOC OC ratio (0.15) indicated that in winter at BN, the OC was mainly directly driven by local primary emissions (e.g., biomass burning, coal burning, and transportation), rather than by photochemical secondary transformation. The backward trajectory of the air mass in winter at BN further confirms that. However, SOC OC at CB (0.57) in winter was about four times that at BN. It has been shown that biomass burning significantly increases emissions of both primary and secondary aerosols (Fu et al., 2012; Zheng et al., 2018). Specifically, these activities can enhance the formation of SOA by increasing emissions of compounds such as monoterpenes and through the action of the resultant O3 and NOx. Thus, the high SOC OC at CB during winter might be linked to the effective promotion of secondary aerosol formation by burning wood for heating. Furthermore, the daytime and nighttime samples collected at CB in winter exhibited diurnal variations in SOC concentrations, further confirming the significant contributions of local anthropogenic emissions and photochemical oxidation.
The WIOC fraction in the samples likely contains substantial quantities of partially combusted biogenic residues. It was noteworthy that SOC exhibited a moderate correlation with WIOC at CB (R2=0.69; R2=0.38), but showed no correlation at BN (R2=0.08; R2=0.03; Fig. 12). This implied that the source of WIOC and SOC might be similar at CB, with a significant portion of SOC being water-insoluble, while primary emissions contributed substantially at BN. The average WIOCOC ratios at CB (summer: 0.43; winter: 0.47) and BN (summer: 0.50; winter: 0.39) were comparable to that (0.55) reported in Chennai, India, which were regarded as predominantly originating from biomass burning and undergoing aging during long-range transport (Pavuluri et al., 2011a).
3.3.3 Impact of biomass burning based on
The aerosol particles released by plants (primary biological aerosols) exhibit a broad range: C3 plants emit particles with δ13C values ranging from −35 ‰ to −24 ‰ and C4 plants (e.g., corn, sugarcane) have δ13C values in the range of −20 ‰ to −11 ‰ (Das et al., 2010; Jung and Kawamura, 2011; Mašalaitė et al., 2024). The values of δ13C in summer (CB: −27.8 ‰ to −26.2 ‰; BN: −27.6 ‰ to −26.2 ‰) were significantly more negative than those in winter (CB: −26.2 ‰ to −22.1 ‰; BN: −25.9 ‰ to −24.5 ‰). This is primarily attributed to the vigorous metabolism of C3 plants under high-temperature and high-humidity summer conditions. The Calvin cycle in plants preferentially fixes 12C, resulting in 12C-enriched volatile organic compounds (VOCs) such as isoprene and monoterpenes that are emitted (Hubick and Farquhar, 1989; Hobbie and Werner, 2004). In contrast, during winter, vegetation activity declines, and anthropogenic sources (e.g., coal combustion and biomass burning) contribute more, thereby elevating the overall isotopic ratio (Singh et al., 2018).
The observed at CB and BN during summer were comparable to those reported for aerosols in Singapore, Indonesia (−27.5 ‰ to −26.0 ‰) and Delhi, India (−27.7 ‰ to −24.9 ‰), where it was clearly indicated that the emissions from the burning of C3 plants were the primary source of aerosols (Narukawa et al., 1999; Agarwal et al., 2024). The δ13C value of aerosol derived from fossil fuel combustion was significantly higher compared to those originating from biomass burning. Moreover, Boreddy et al. (2018) had observed depletion of 13C in aerosols linked to increased contributions from C3 plant burning in Southeast Aisa and reported that photochemical aging of aerosols could have led to an increase in values (Boreddy et al., 2018). The ranged from −26.2 ‰ to −22.1 ‰ at CB (avg. −24.6 ‰ ± 1.1 ‰) and ranged from −25.9 ‰ to −24.5 ‰ at BN (avg. −25.3 ‰ ± 0.4 ‰) in winter could be linked to the consumption of fossil fuels for heating and the aging of aerosols transported from continental and marine regions.
In addition, special events can also significantly affect the value of δ13C. On the Chinese New Year's Eve in winter at CB, significant firework – setting events were observed, resulting in a less negative δ13C value on that day compared to the regular winter level (−22.8 ‰ vs. −26.2 ‰ to −22.1 ‰). The high temperature during the combustion of fireworks may cause the preferential volatilization of 12C, leading to the enrichment of 13C in the remaining particulate matter. The non – biogenic carbon from additives in fireworks may further increase the isotope ratio. Moreover, fossil fuel sources such as traffic emissions and coal – burning activities on New Year's Eve may also contribute to the isotope signal (Aguilera and Whigham, 2018).
However, no significant correlations were found between WSOC OC and for the biomass burning aerosols, suggesting that OA at CB and BN were mostly derived from primary emissions (Cao et al., 2016). It has shown that the average values of in the remote marine aerosols ranged from −24.0 ‰ to −18.1 ‰ (Kawamura et al., 2017; Verwega et al., 2021). In this research, the ranged from −27.8 ‰ to −22.1 ‰ at CB and from −27.6 ‰ to −24.5 ‰ at BN, indicating that the contribution of marine aerosols during the campaign was relatively small. The values of in CB and BN aerosols might be the result of multiple sources' contribution, such as fossil fuel combustion (coal, natural gas and petroleum) (−28 ‰ to −21 ‰), marine phytoplankton (−28 ‰ to −15 ‰) and C3 plants biomass burning (−28 ‰ to −26 ‰) (Singh et al., 2018). The concentration of and at CB increased in winter, so the elevated values of were likely related to fossil fuel burning for heating. Therefore, fossil fuel combustion and C3 plant biomass burning are identified as primary sources, while also being slightly influenced by air masses transported from the ocean during the summer.
Day- and night-time PM2.5 samples (n=120) were collected at two typical forest areas in North and South China. Their carbonaceous, nitrogenous, WSII components and have been measured. The concentrations of carbonaceous and nitrogenous components displayed a distinct seasonal trend, higher in winter and lower in summer. In addition, the OC, SOC and WSOC showed diurnal variations in which their concentrations were higher during daytime than nighttime. The relationships and mass ratios of carbonaceous components indicated that the PM2.5 at CB and BN were dominantly from biomass burning and photochemical reactions of VOCs. We also found significant deficiencies of anions in aerosols from CB and BN. Moreover, correlations between nss-K+ and secondary ions suggested that the aerosols at two forest sites were affected by biomass burning and the primary source emissions were more important. The values of reaffirmed that biomass burning was the primary source of PM2.5 at two sites, while they were also influenced by fossil fuel burning during winter, especially at CB, and additionally by slight oceanic air masses. Regarding the anion deficiency phenomenon found in the aerosols at the two sites in this study, we will conduct further analysis in combination with organic acids in the subsequent research to better indicate the sources and composition characteristics of aerosols in forest regions.
All data supporting the findings of this study are available upon reasonable request from the corresponding author.
The supplement related to this article is available online at https://doi.org/10.5194/bg-22-5329-2025-supplement.
ML and ZX: Conceptualization, Investigation, Methodology, Writing – original draft. ZD: Investigation, Writing – review and editing; JD: Writing – review and editing. PF: Writing – review and editing. CMP: Funding acquisition, Writing – review and editing. ZX: Project administration, Funding acquisition, Supervision, Writing – review and editing.
The contact author has declared that none of the authors has any competing interests.
Publisher's note: Copernicus Publications remains neutral with regard to jurisdictional claims made in the text, published maps, institutional affiliations, or any other geographical representation in this paper. While Copernicus Publications makes every effort to include appropriate place names, the final responsibility lies with the authors. Also, please note that this paper has not received English language copy-editing. Views expressed in the text are those of the authors and do not necessarily reflect the views of the publisher.
This study is supported by the National Natural Science Foundation of China (nos. 42277090 and 42202199). We appreciate Rui Liu and Jin Liu for their assistance in the field investigation. We also extend our gratitude to Pierre Amato and the two anonymous reviewers for their valuable suggestions and constructive comments, which significantly enhanced the quality of this work.
This research has been supported by the National Natural Science Foundation of China (grant nos. 42277090 and 42202199).
This paper was edited by Pierre Amato and reviewed by two anonymous referees.
Agarwal, R., Aggarwal, S. G., Kunwar, B., Deshmukh, D. K., Singh, K., Soni, D., and Kawamura, K.: Stable isotopic, bulk, and molecular compositions of post-monsoon biomass-burning aerosols in Delhi suggest photochemical ageing during regional transport is more pronounced than local processing, J. Atmos. Chem., 81, https://doi.org/10.1007/s10874-024-09461-2, 2024.
Aggarwal, S. G., Kawamura, K., Umarji, G. S., Tachibana, E., Patil, R. S., and Gupta, P. K.: Organic and inorganic markers and stable C-, N-isotopic compositions of tropical coastal aerosols from megacity Mumbai: sources of organic aerosols and atmospheric processing, Atmos. Chem. Phys., 13, 4667–4680, https://doi.org/10.5194/acp-13-4667-2013, 2013.
Aguilera, J. and Whigham, L. D.: Using the carbon isotope ratio to characterise the emission sources of airborne particulate matter: a review of literature, Isot. Environ. Health Stud., 54, 573–587, https://doi.org/10.1080/10256016.2018.1531854, 2018.
Aurela, M., Saarikoski, S., Timonen, H., Aalto, P., Keronen, P., Saarnio, K., Teinilä, K., Kulmala, M., and Hillamo, R.: Carbonaceous aerosol at a forested and an urban background sites in Southern Finland, Atmos. Environ., 45, 1394–1401, https://doi.org/10.1016/j.atmosenv.2010.12.039, 2011.
Bhat, S. and Fraser, M. P.: Primary source attribution and analysis of α-pinene photooxidation products in Duke Forest, North Carolina, Atmospheric Environment, 41, 2958–2966, https://doi.org/10.1016/j.atmosenv.2006.12.018, 2007.
Boreddy, S. K. R., Parvin, F., Kawamura, K., Zhu, C., and Lee, C.-T.: Stable carbon and nitrogen isotopic compositions of fine aerosols (PM2.5) during an intensive biomass burning over Southeast Asia: Influence of SOA and aging, Atmos. Environ., 191, 478–489, https://doi.org/10.1016/j.atmosenv.2018.08.034, 2018.
Boreddy, S. K. R., Gogoi, M. M., Hegde, P., and Suresh Babu, S.: Chemical composition, source characteristics, and hygroscopic properties of organic-enriched aerosols in the high Arctic during summer, Sci. Total Environ., 942, 173780, https://doi.org/10.1016/j.scitotenv.2024.173780, 2024.
Bressi, M., Sciare, J., Ghersi, V., Bonnaire, N., Nicolas, J. B., Petit, J.-E., Moukhtar, S., Rosso, A., Mihalopoulos, N., and Féron, A.: A one-year comprehensive chemical characterisation of fine aerosol (PM2.5) at urban, suburban and rural background sites in the region of Paris (France), Atmos. Chem. Phys., 13, 7825–7844, https://doi.org/10.5194/acp-13-7825-2013, 2013.
Bu, X., Xie, Z., Liu, J., Wei, L., Wang, X., Chen, M., and Ren, H.: Global PM2.5-attributable health burden from 1990 to 2017: Estimates from the Global Burden of disease study 2017, Environ. Res., 197, 111123, https://doi.org/10.1016/j.envres.2021.111123, 2021.
Canaday, F. T., Georas, S. N., and Croft, D. P.: Examining the impact of air pollution, climate change, and social determinants of health on asthma and environmental justice, Curr. Opin. Pulm. Med., 30, 276–280, https://doi.org/10.1097/mcp.0000000000001065, 2024.
Cao, F., Zhang, S.-C., Kawamura, K., and Zhang, Y.-L.: Inorganic markers, carbonaceous components and stable carbon isotope from biomass burning aerosols in Northeast China, Sci. Total Environ., 572, 1244–1251, https://doi.org/10.1016/j.scitotenv.2015.09.099, 2016.
Cao, J. J., Lee, S. C., Chow, J. C., Watson, J. G., Ho, K. F., Zhang, R. J., Jin, Z. D., Shen, Z. X., Chen, G. C., Kang, Y. M., Zou, S. C., Zhang, L. Z., Qi, S. H., Dai, M. H., Cheng, Y., and Hu, K.: Spatial and seasonal distributions of carbonaceous aerosols over China, J. Geophys. Res.: Atmos., 112, https://doi.org/10.1029/2006JD008205, 2007.
Castro, L. M., Pio, C. A., Harrison, R. M., and Smith, D. J. T.: Carbonaceous aerosol in urban and rural European atmospheres: estimation of secondary organic carbon concentrations, Atmos. Environ., 33, 2771–2781, https://doi.org/10.1016/S1352-2310(98)00331-8, 1999.
Chen, B., Liu, C., Fan, J., Shi, J., and Yu, H.: Effects of forest belt in park on the chemical composition for PM2.5, IOP Conf. Ser.: Earth Environ. Sci., 569, 012038, https://doi.org/10.1088/1755-1315/569/1/012038, 2020.
Chen, L., Xu, H., Huang, R., Pang, X., Wang, B., Wu, Z., and Yu, S.: Effects of nocturnal boundary layer subsidence and long-distance transports on PM2.5 vertical profiles in the Yangtze River Delta of China measured by PM sensor on unmanned aerial vehicle and PM Lidar, Environ. Pollut., 371, 125935, https://doi.org/10.1016/j.envpol.2025.125935, 2025.
Chen, S., Liu, D., Huang, L., Guo, C., Gao, X., Xu, Z., Yang, Z., Chen, Y., Li, M., and Yang, J.: Global associations between long-term exposure to PM2.5 constituents and health: A systematic review and meta-analysis of cohort studies, J. Hazard. Mater., 474, 134715, https://doi.org/10.1016/j.jhazmat.2024.134715, 2024.
Chen, W., Lu, X., Yuan, D., Chen, Y., Li, Z., Huang, Y., Fung, T., Sun, H., and Fung, J. C. H.: Global PM2.5 Prediction and Associated Mortality to 2100 under Different Climate Change Scenarios, Environ. Sci. Technol., 57, 10039–10052, https://doi.org/10.1021/acs.est.3c03804, 2023.
Chen, Y., Sheng, G., Bi, X., Feng, Y., Mai, B., and Fu, J.: Emission Factors for Carbonaceous Particles and Polycyclic Aromatic Hydrocarbons from Residential Coal Combustion in China, Environ. Sci. Technol., 39, 1861–1867, https://doi.org/10.1021/es0493650, 2005.
Cho, S. Y. and Park, S. S.: Resolving sources of water-soluble organic carbon in fine particulate matter measured at an urban site during winter, Environ. Sci.-Proc. Imp., 15, https://doi.org/10.1039/c2em30730h, 2013.
Chow, J. C., Watson, J. G., Chen, L. W. A., Chang, M. C. O., Robinson, N. F., Trimble, D., and Kohl, S.: The IMPROVE_A temperature protocol for thermal/optical carbon analysis: maintaining consistency with a long-term database, J. Air & Waste Manage., 57, 1014–1023, https://doi.org/10.3155/1047-3289.57.9.1014, 2007.
Das, O., Wang, Y., and Hsieh, Y.-P.: Chemical and carbon isotopic characteristics of ash and smoke derived from burning of C3 and C4 grasses, Org. Geochem., 41, 263–269, https://doi.org/10.1016/j.orggeochem.2009.11.001, 2010.
Dong, Z., Pavuluri, C. M., Xu, Z., Wang, Y., Li, P., Fu, P., and Liu, C.-Q.: Measurement report: Chemical components and 13C and 15N isotope ratios of fine aerosols over Tianjin, North China: year-round observations, Atmos. Chem. Phys., 23, 2119–2143, https://doi.org/10.5194/acp-23-2119-2023, 2023.
Ehn, M., Thornton, J. A., Kleist, E., Sipilä, M., Junninen, H., Pullinen, I., Springer, M., Rubach, F., Tillmann, R., Lee, B., Lopez-Hilfiker, F., Andres, S., Acir, I.-H., Rissanen, M., Jokinen, T., Schobesberger, S., Kangasluoma, J., Kontkanen, J., Nieminen, T., Kurtén, T., Nielsen, L. B., Jørgensen, S., Kjaergaard, H. G., Canagaratna, M., Maso, M. D., Berndt, T., Petäjä, T., Wahner, A., Kerminen, V.-M., Kulmala, M., Worsnop, D. R., Wildt, J., and Mentel, T. F.: A large source of low-volatility secondary organic aerosol, Nature, 506, 476–479, https://doi.org/10.1038/nature13032, 2014.
Espina-Martin, P., Perdrix, E., Alleman, L. Y., and Coddeville, P.: Origins of the seasonal variability of PM2.5 sources in a rural site in Northern France, Atmos. Environ., 333, 120660, https://doi.org/10.1016/j.atmosenv.2024.120660, 2024.
Fu, P. Q., Kawamura, K., Chen, J., Li, J., Sun, Y. L., Liu, Y., Tachibana, E., Aggarwal, S. G., Okuzawa, K., Tanimoto, H., Kanaya, Y., and Wang, Z. F.: Diurnal variations of organic molecular tracers and stable carbon isotopic composition in atmospheric aerosols over Mt. Tai in the North China Plain: an influence of biomass burning, Atmos. Chem. Phys., 12, 8359–8375, https://doi.org/10.5194/acp-12-8359-2012, 2012.
Fu, X., Wang, X., Liu, T., He, Q., Zhang, Z., Zhang, Y., Song, W., Dai, Q., Chen, S., and Dong, F.: Secondary inorganic aerosols and aerosol acidity at different PM2.5 pollution levels during winter haze episodes in the Sichuan Basin, China, Sci. Total Environ., 918, 170512, https://doi.org/10.1016/j.scitotenv.2024.170512, 2024.
Guo, Q., Chen, K., and Xu, G.: Characteristics and Sources of Water-Soluble Inorganic Ions in PM2.5 in Urban Nanjing, China, Atmos., 14, 135, https://doi.org/10.3390/atmos14010135, 2023.
He, Q., Yan, Y., Guo, L., Zhang, Y., Zhang, G., and Wang, X.: Characterization and source analysis of water-soluble inorganic ionic species in PM2.5 in Taiyuan city, China, Atmos. Res., 184, 48–55, https://doi.org/10.1016/j.atmosres.2016.10.008, 2017.
Hobbie, A. E. and Werner, R. A.: Intramolecular, compound-specific, and bulk carbon isotope patterns in C3 and C4 plants: a review and synthesis, New Phytol., 161, 371–385, https://doi.org/10.1111/j.1469-8137.2004.00970.x, 2004.
Huang, R.-J., Zhang, Y., Bozzetti, C., Ho, K.-F., Cao, J.-J., Han, Y., Daellenbach, K. R., Slowik, J. G., Platt, S. M., Canonaco, F., Zotter, P., Wolf, R., Pieber, S. M., Bruns, E. A., Crippa, M., Ciarelli, G., Piazzalunga, A., Schwikowski, M., Abbaszade, G., Schnelle-Kreis, J., Zimmermann, R., An, Z., Szidat, S., Baltensperger, U., Haddad, I. E., and Prévôt, A. S. H.: High secondary aerosol contribution to particulate pollution during haze events in China, Nature, 514, 218–222, https://doi.org/10.1038/nature13774, 2014.
Hubick, K. and Farquhar, G.: Carbon isotope discrimination and photosynthesis, Annu. Rev. Plant Physiol. Plant Mol. Biol., https://doi.org/10.1146/annurev.pp.40.060189.002443, 1989.
Jung, J. and Kawamura, K.: Springtime carbon emission episodes at the Gosan background site revealed by total carbon, stable carbon isotopic composition, and thermal characteristics of carbonaceous particles, Atmos. Chem. Phys., 11, 10911–10928, https://doi.org/10.5194/acp-11-10911-2011, 2011.
Kawamura, K., Kobayashi, M., Tsubonuma, N., Mochida, M., Watanabe, T., and Lee, M.: Organic and inorganic compositions of marine aerosols from East Asia: Seasonal variations of water-soluble dicarboxylic acids, major ions, total carbon and nitrogen, and stable C and N isotopic composition, in: Geochemical Investigation in Earth and Space Science, edited by: Hill, R. J., Leventhal, J., Aizenshtat, Z., Baedecker, M. J., Claypool, G., Eganhouse, R., Goldhaber, M., and Peters, K., The Geochemical Society Special Publications, Elsevier, 243–265, https://doi.org/10.1016/S1873-9881(04)80019-1, 2004.
Kawamura, K., Hoque, M. M. M., Bates, T. S., and Quinn, P. K.: Molecular distributions and isotopic compositions of organic aerosols over the western North Atlantic: Dicarboxylic acids, related compounds, sugars, and secondary organic aerosol tracers, Org. Geochem., 113, 229–238, https://doi.org/10.1016/j.orggeochem.2017.08.007, 2017.
Kawashima, H., Yoshida, O., and Suto, N.: Long-Term Source Apportionment of Ammonium in PM2.5 at a Suburban and a Rural Site Using Stable Nitrogen Isotopes, Environ. Sci. Technol., 57, 1268–1277, https://doi.org/10.1021/acs.est.2c06311, 2023.
Kourtchev, I., Copolovici, L., Claeys, M., and Maenhaut, W.: Characterization of Atmospheric Aerosols at a Forested Site in Central Europe, Environ. Sci. Technol., 43, 4665–4671, https://doi.org/10.1021/es803055w, 2009.
Kunwar, B., Kawamura, K., and Zhu, C.: Stable carbon and nitrogen isotopic compositions of ambient aerosols collected from Okinawa Island in the western North Pacific Rim, an outflow region of Asian dusts and pollutants, Atmos. Environ., 131, 243–253, https://doi.org/10.1016/j.atmosenv.2016.01.035, 2016.
Li, L., Wang, W., Feng, J., Zhang, D., Li, H., Gu, Z., Wang, B., Sheng, G., and Fu, J.: Composition, source, mass closure of PM2.5 aerosols for four forests in eastern China, J. Environ. Sci., 22, 405–412, https://doi.org/10.1016/S1001-0742(09)60122-4, 2010 (in Chinese).
Li, Y., Wang, X., Xu, P., Gui, J., Guo, X., Yan, G., Fei, X., and Yang, A.: Chemical characterization and source identification of PM2.5 in the Huaxi urban area of Guiyang, Sci. Rep., 14, 30451, https://doi.org/10.1038/s41598-024-81048-z, 2024.
Liou, K.-N. and Ou, S.-C.: The role of cloud microphysical processes in climate: An assessment from a one-dimensional perspective, J. Geophys. Res.-Atmos., 94, 8599–8607, https://doi.org/10.1029/JD094iD06p08599, 1989.
Long, Y., Zhang, W., Sun, N., Zhu, P., Yan, J., and Yin, S.: Sequential interaction of biogenic volatile organic compounds and SOAs in urban forests revealed ssing Toeplitz Inverse Covariance-Based clustering and causal inference, Forests, 14, 1617, https://doi.org/10.3390/f14081617, 2023.
Lyu, X.-P., Wang, Z.-W., Cheng, H.-R., Zhang, F., Zhang, G., Wang, X.-M., Ling, Z.-H., and Wang, N.: Chemical characteristics of submicron particulates (PM1.0) in Wuhan, Central China, Atmos. Res., 161–162, 169–178, https://doi.org/10.1016/j.atmosres.2015.04.009, 2015.
Mace, K. A., Artaxo, P., and Duce, R. A.: Water-soluble organic nitrogen in Amazon Basin aerosols during the dry (biomass burning) and wet seasons, J. Geophys. Res.-Atmos., 108, https://doi.org/10.1029/2003JD003557, 2003.
Maji, K. J., Ye, W.-F., Arora, M., and Shiva Nagendra, S. M.: PM2.5-related health and economic loss assessment for 338 Chinese cities, Environ. Int., 121, 392–403, https://doi.org/10.1016/j.envint.2018.09.024, 2018.
Mašalaitė, A., Garbarienė, I., Garbaras, A., Šapolaitė, J., Ežerinskis, Ž., Bučinskas, L., Dudoitis, V., Kalinauskaitė, A., Pashneva, D., and Minderytė, A.: Dual-isotope ratios of carbonaceous aerosols for seasonal observation and their assessment as source indicators, Sci. Total Environ., 949, 175094, https://doi.org/10.1016/j.scitotenv.2024.175094, 2024.
Meinardi, S., Simpson, I. J., Blake, N. J., Blake, D. R., and Rowland, F. S.: Dimethyl disulfide (DMDS) and dimethyl sulfide (DMS) emissions from biomass burning in Australia, J. Geophys. Res.-Atmos., 30, https://doi.org/10.1029/2003GL016967, 2003.
Meng, J., Wang, G., Li, J., Cheng, C., Ren, Y., Huang, Y., Cheng, Y., Cao, J., and Zhang, T.: Seasonal characteristics of oxalic acid and related SOA in the free troposphere of Mt. Hua, central China: Implications for sources and formation mechanisms, Sci. Total Environ., 493, 1088–1097, https://doi.org/10.1016/j.scitotenv.2014.04.086, 2014.
Mo, H., Li, L., Lai, W., Zhao, M., Pu, J., Zhou, Y., and Deng, S.: Characterization of summer PM2.5 aerosols from four forest areas in Sichuan, SW China, Particuology, 20, 94–103, https://doi.org/10.1016/j.partic.2014.10.009, 2015.
Nah, T., Guo, H., Sullivan, A. P., Chen, Y., Tanner, D. J., Nenes, A., Russell, A., Ng, N. L., Huey, L. G., and Weber, R. J.: Characterization of aerosol composition, aerosol acidity, and organic acid partitioning at an agriculturally intensive rural southeastern US site, Atmos. Chem. Phys., 18, 11471–11491, https://doi.org/10.5194/acp-18-11471-2018, 2018.
Narukawa, M., Kawamura, K., Takeuchi, N., and Nakajima, T.: Distribution of dicarboxylic acids and carbon isotopic compositions in aerosols from 1997 Indonesian forest fires, J. Geophys. Res.-Atmos., 26, 3101–3104, https://doi.org/10.1029/1999GL010810, 1999.
Pathak, R. K., Yao, X., Lau, A. K. H., and Chan, C. K.: Acidity and concentrations of ionic species of PM2.5 in Hong Kong, Atmos. Environ., 37, 1113–1124, https://doi.org/10.1016/S1352-2310(02)00958-5, 2003.
Pathak, R. K., Louie, P. K. K., and Chan, C. K.: Characteristics of aerosol acidity in Hong Kong, Atmos. Environ., 38, 2965–2974, https://doi.org/10.1016/j.atmosenv.2004.02.044, 2004.
Pathak, R. K., Wu, W. S., and Wang, T.: Summertime PM2.5 ionic species in four major cities of China: nitrate formation in an ammonia-deficient atmosphere, Atmos. Chem. Phys., 9, 1711–1722, https://doi.org/10.5194/acp-9-1711-2009, 2009.
Pavuluri, C. M., Kawamura, K., Aggarwal, S. G., and Swaminathan, T.: Characteristics, seasonality and sources of carbonaceous and ionic components in the tropical aerosols from Indian region, Atmos. Chem. Phys., 11, 8215–8230, https://doi.org/10.5194/acp-11-8215-2011, 2011a.
Pavuluri, C. M., Kawamura, K., Swaminathan, T., and Tachibana, E.: Stable carbon isotopic compositions of total carbon, dicarboxylic acids and glyoxylic acid in the tropical Indian aerosols: Implications for sources and photochemical processing of organic aerosols, J. Geophys. Res.-Atmos, 116, https://doi.org/10.1029/2011JD015617, 2011b.
Pavuluri, C. M., Kawamura, K., and Fu, P. Q.: Atmospheric chemistry of nitrogenous aerosols in northeastern Asia: biological sources and secondary formation, Atmos. Chem. Phys., 15, 9883–9896, https://doi.org/10.5194/acp-15-9883-2015, 2015.
Peeples, L.: How air pollution threatens brain health, Proc. Natl. Acad. Sci., 117, 13856–13860, https://doi.org/10.1073/pnas.2008940117, 2020.
Pei, Q., Wan, X., Widory, D., Ram, K., Adhikary, B., Wu, G., Diao, X., Bhattarai, H., Zhang, Y.-L., Loewen, M., and Cong, Z.: Nitrogen aerosols in New Delhi, India: Speciation, formation, and sources, Atmos. Res., 304, 107343, https://doi.org/10.1016/j.atmosres.2024.107343, 2024.
Qiao, B., Chen, Y., Tian, M., Wang, H., Yang, F., Shi, G., Zhang, L., Peng, C., Luo, Q., and Ding, S.: Characterization of water soluble inorganic ions and their evolution processes during PM2.5 pollution episodes in a small city in southwest China, Sci. Total Environ., 650, 2605–2613, https://doi.org/10.1016/j.scitotenv.2018.09.376, 2019.
Ramana, M. V. and Devi, A.: CCN concentrations and BC warming influenced by maritime ship emitted aerosol plumes over southern Bay of Bengal, Sci. Rep., 6, 30416, https://doi.org/10.1038/srep30416, 2016.
Ren, Y., Wang, G., Tao, J., Zhang, Z., Wu, C., Wang, J., Li, J., Wei, J., Li, H., and Meng, F.: Seasonal characteristics of biogenic secondary organic aerosols at Mt. Wuyi in Southeastern China: Influence of anthropogenic pollutants, Environ. Pollut., 252, 493–500, https://doi.org/10.1016/j.envpol.2019.05.077, 2019.
Schauer, J. J., Kleeman, M. J., Cass, G. R., and Simoneit, B. R. T.: Measurement of Emissions from Air Pollution Sources. 2. C1 through C30 Organic Compounds from Medium Duty Diesel Trucks, Environ. Sci. Technol., 33, 1578–1587, https://doi.org/10.1021/es980081n, 1999.
Schnelle-Kreis, J., Sklorz, M., Orasche, J., Stölzel, M., Peters, A., and Zimmermann, R.: Semi Volatile Organic Compounds in Ambient PM2.5. Seasonal Trends and Daily Resolved Source Contributions, Environ. Sci. Technol., 41, 3821–3828, https://doi.org/10.1021/es060666e, 2007.
Sharma, S. K., Mandal, T. K., Banoo, R., Rai, A., and Rani, M.: Long-Term Variation in Carbonaceous Components of PM2.5 from 2012 to 2021 in Delhi, B. Environ. Contam. Tox., 109, 502–510, https://doi.org/10.1007/s00128-022-03506-6, 2022.
Shaughnessy, W. J., Venigalla, M. M., and Trump, D.: Health effects of ambient levels of respirable particulate matter (PM) on healthy, young-adult population, Atmos. Environ., 123, 102–111, https://doi.org/10.1016/j.atmosenv.2015.10.039, 2015.
Singh, G. K., Rajput, P., Paul, D., and Gupta, T.: Wintertime study on bulk composition and stable carbon isotope analysis of ambient aerosols from North India, J. Aerosol Sci., 126, 231–241, https://doi.org/10.1016/j.jaerosci.2018.09.010, 2018.
Sun, M. and Zhang, X.: Characteristics of PM2.5 in Hachinohe, the priority pollution control city in Japan, Atmos. Pollut. Res., 15, 102204, https://doi.org/10.1016/j.apr.2024.102204, 2024.
Tang, J., Li, J., Su, T., Han, Y., Mo, Y., Jiang, H., Cui, M., Jiang, B., Chen, Y., Tang, J., Song, J., Peng, P., and Zhang, G.: Molecular compositions and optical properties of dissolved brown carbon in biomass burning, coal combustion, and vehicle emission aerosols illuminated by excitation–emission matrix spectroscopy and Fourier transform ion cyclotron resonance mass spectrometry analysis, Atmos. Chem. Phys., 20, 2513–2532, https://doi.org/10.5194/acp-20-2513-2020, 2020.
Tanner, R. L., Parkhurst, W. J., Valente, M. L., and David Phillips, W.: Regional composition of PM2.5 aerosols measured at urban, rural and “background” sites in the Tennessee valley, Atmos. Environ., 38, 3143–3153, https://doi.org/10.1016/j.atmosenv.2004.03.023, 2004.
Tao, J., Zhang, L., Engling, G., Zhang, R., Yang, Y., Cao, J., Zhu, C., Wang, Q., and Luo, L.: Chemical composition of PM2.5 in an urban environment in Chengdu, China: Importance of springtime dust storms and biomass burning, Atmos. Res., 122, 270–283, https://doi.org/10.1016/j.atmosres.2012.11.004, 2013.
Tao, Y., Yin, Z., Ye, X., Ma, Z., and Chen, J.: Size distribution of water-soluble inorganic ions in urban aerosols in Shanghai, Atmos. Pollut. Res., 5, 639–647, https://doi.org/10.5094/APR.2014.073, 2014.
Tian, S., Pan, Y., and Wang, Y.: Ion balance and acidity of size-segregated particles during haze episodes in urban Beijing, Atmos. Res., 201, 159–167, https://doi.org/10.1016/j.atmosres.2017.10.016, 2018.
Tripathee, L., Kang, S., Rupakheti, D., Cong, Z., Zhang, Q., and Huang, J.: Chemical characteristics of soluble aerosols over the central Himalayas: insights into spatiotemporal variations and sources, Environ. Sci. Pollut. Res., 24, 24454–24472, https://doi.org/10.1007/s11356-017-0077-0, 2017.
Tripathee, L., Kang, S., Chen, P., Bhattarai, H., Guo, J., Shrestha, K. L., Sharma, C. M., Sharma Ghimire, P., and Huang, J.: Water-soluble organic and inorganic nitrogen in ambient aerosols over the Himalayan middle hills: Seasonality, sources, and transport pathways, Atmos. Res., 250, https://doi.org/10.1016/j.atmosres.2020.105376, 2021.
Verwega, M.-T., Somes, C. J., Schartau, M., Tuerena, R. E., Lorrain, A., Oschlies, A., and Slawig, T.: Description of a global marine particulate organic carbon-13 isotope data set, Earth Syst. Sci. Data, 13, 4861–4880, https://doi.org/10.5194/essd-13-4861-2021, 2021.
Wan, X., Kang, S., Wang, Y., Xin, J., Liu, B., Guo, Y., Wen, T., Zhang, G., and Cong, Z.: Size distribution of carbonaceous aerosols at a high-altitude site on the central Tibetan Plateau (Nam Co Station, 4730 m a.s.l.), Atmos. Res., 153, 155–164, https://doi.org/10.1016/j.atmosres.2014.08.008, 2015.
Wan, X., Kang, S., Li, Q., Rupakheti, D., Zhang, Q., Guo, J., Chen, P., Tripathee, L., Rupakheti, M., Panday, A. K., Wang, W., Kawamura, K., Gao, S., Wu, G., and Cong, Z.: Organic molecular tracers in the atmospheric aerosols from Lumbini, Nepal, in the northern Indo-Gangetic Plain: influence of biomass burning, Atmos. Chem. Phys., 17, 8867–8885, https://doi.org/10.5194/acp-17-8867-2017, 2017.
Wang, B., Li, Y., Tang, Z., and Cai, N.: The carbon components in indoor and outdoor PM2.5 in winter of Tianjin, Sci. Rep., 11, 17881, https://doi.org/10.1038/s41598-021-97530-x, 2021.
Wang, Q., Jiang, N., Yin, S., Li, X., Yu, F., Guo, Y., and Zhang, R.: Carbonaceous species in PM2.5 and PM10 in urban area of Zhengzhou in China: Seasonal variations and source apportionment, Atmos. Res., 191, 1–11, https://doi.org/10.1016/j.atmosres.2017.02.003, 2017.
Wang, S., Pavuluri, C. M., Ren, L., Fu, P., Zhang, Y.-L., and Liu, C.-Q.: Implications for biomass/coal combustion emissions and secondary formation of carbonaceous aerosols in North China, RSC Advances, 8, 38108–38117, https://doi.org/10.1039/C8RA06127K, 2018.
Wang, Y., Zhang, X., Arimoto, R., Cao, J., and Shen, Z.: Characteristics of carbonate content and carbon and oxygen isotopic composition of northern China soil and dust aerosol and its application to tracing dust sources, Atmos. Environ., 39, 2631–2642, https://doi.org/10.1016/j.atmosenv.2005.01.015, 2005.
Wu, K., Yang, X., Chen, D., Gu, S., Lu, Y., Jiang, Q., Wang, K., Ou, Y., Qian, Y., Shao, P., and Lu, S.: Estimation of biogenic VOC emissions and their corresponding impact on ozone and secondary organic aerosol formation in China, Atmos. Res., 231, https://doi.org/10.1016/j.atmosres.2019.104656, 2020.
Wu, W., Chen, H., Guo, J., Xu, Z., and Zhang, X.: Regionalization of the boundary-layer height and its dominant influence factors in Summer over China, Chinese J. Atmos. Sci., 48, 1201–1216, https://doi.org/10.3878/j.issn.1006-9895.2212.22183, 2024 (in Chinese).
Xiang, P., Zhou, X., Duan, J., Tan, J., He, K., Yuan, C., Ma, Y., and Zhang, Y.: Chemical characteristics of water-soluble organic compounds (WSOC) in PM2.5 in Beijing, China: 2011–2012, Atmos. Res., 183, 104–112, https://doi.org/10.1016/j.atmosres.2016.08.020, 2017.
Xue, B., Kuang, Y., Xu, W., and Zhao, P.: Joint increase of aerosol scattering efficiency and aerosol hygroscopicity aggravate visibility impairment in the North China Plain, Sci. Total Environ., 839, 156279, https://doi.org/10.1016/j.scitotenv.2022.156279, 2022.
Yin, H., McDuffie, E. E., Martin, R. V., and Brauer, M.: Global health costs of ambient PM2.5 from combustion sources: a modelling study supporting air pollution control strategies, Lancet Planet. Health, 8, e476-e488, https://doi.org/10.1016/S2542-5196(24)00098-6, 2024.
Yin, L., Niu, Z., Chen, X., Chen, J., Zhang, F., and Xu, L.: Characteristics of water-soluble inorganic ions in PM2.5 and PM2.5−10 in the coastal urban agglomeration along the Western Taiwan Strait Region, China, Environ. Sci. Pollut. Res., 21, 5141–5156, https://doi.org/10.1007/s11356-013-2134-7, 2014.
Yuan, B., Hu, W. W., Shao, M., Wang, M., Chen, W. T., Lu, S. H., Zeng, L. M., and Hu, M.: VOC emissions, evolutions and contributions to SOA formation at a receptor site in eastern China, Atmos. Chem. Phys., 13, 8815–8832, https://doi.org/10.5194/acp-13-8815-2013, 2013.
Zhang, Z., Shao, C., Guan, Y., and Xue, C.: Socioeconomic factors and regional differences of PM2.5 health risks in China, Journal of Environmental Management, 251, 109564, https://doi.org/10.1016/j.jenvman.2019.109564, 2019.
Zhang, Z., Zeng, Y., Zheng, N., Luo, L., Xiao, H., and Xiao, H.: Fossil fuel-related emissions were the major source of NH3 pollution in urban cities of northern China in the autumn of 2017, Environ. Pollut., 256, 113428, https://doi.org/10.1016/j.envpol.2019.113428, 2020.
Zhao, X., Xu, Z., Li, P., Dong, Z., Fu, P., Liu, C.-Q., and Pavuluri, C. M.: Characteristics and seasonality of trace elements in fine aerosols from Tianjin, North China during 2018–2019, Environ. Adv., 9, 100263, https://doi.org/10.1016/j.envadv.2022.100263, 2022.
Zheng, L., Yang, X., Lai, S., Ren, H., Yue, S., Zhang, Y., Huang, X., Gao, Y., Sun, Y., Wang, Z., and Fu, P.: Impacts of springtime biomass burning in the northern Southeast Asia on marine organic aerosols over the Gulf of Tonkin, China, Environ. Pollut., 237, 285–297, https://doi.org/10.1016/j.envpol.2018.01.089, 2018.
Zheng, M., Wang, Y., Yuan, L., Chen, N., and Kong, S.: Ambient observations indicating an increasing effectiveness of ammonia control in wintertime PM2.5 reduction in Central China, Sci. Total Environ., 824, 153708, https://doi.org/10.1016/j.scitotenv.2022.153708, 2022.
Zheng, Z., Chen, L., Sun, N., Jin, Y., and Wang, Y.: Pollution, hazards, and health inequalities: a longitudinal exploration of the impact of PM2.5 on depression among rural older adults with different incomes in China, Humanit. Soc. Sci. Commun., 11, 1682, https://doi.org/10.1057/s41599-024-04233-5, 2024.