the Creative Commons Attribution 4.0 License.
the Creative Commons Attribution 4.0 License.
 | 15 Dec 2025
Marine snow surface production and bathypelagic export at the Equatorial Atlantic from an imaging float
Lars Stemmann
Alexandre Accardo
Alberto Baudena
Franz Philip Tuchen
Peter Brandt
The marine biological carbon pump (BCP) plays a central role in the global carbon cycle, transporting carbon from the surface to the deep ocean and sequestering it for long periods. Sinking of surface-produced particles, known as the Biological Gravity Pump (BGP) constitutes the main component of the BCP. To study the BGP in the equatorial Atlantic upwelling region, a biogeochemical (BGC) Argo float equipped with an Underwater Vision Profiler 6 (UVP6) camera was deployed from July 2021 to March 2022. The float was recovered after its eastward drift from 23 to 7° W along the equator, during which it conducted profiles to 2000 m depth every 3 d. For the first time in this oceanic region, in situ images and physical and biogeochemical data from a BGC-Argo float were acquired and analyzed in combination with satellite data. During the float trajectory, two blooms were recorded followed by two main export events of sinking aggregates that lasted for over a month, consistently reaching 2000 m depth. A Lagrangian approach was applied to investigate the production, transformation, and deep export of marine particles. Based on the characterization of the morphology of detritus within and outside of the plumes, five particle morphotypes with different sinking properties were detected. Small and dense aggregates were present throughout the water column while porous morphotypes, despite being larger, were predominantly concentrated in the surface layer. Export was driven by small and compact particles with higher particle abundance and flux during upwelling and export events. Our investigation reveals the stability of the equatorial Atlantic BCP system during this period, yielding an export efficiency of 6 %–7 % during and outside of export events. This study highlights the importance of using new technologies on autonomous platforms to characterize the temporal variability in the magnitude and functioning of the BCP.
- Article
(3555 KB) - Full-text XML
-
Supplement
(3000 KB) - BibTeX
- EndNote


The term “biological carbon pump” (BCP) encompasses physical and biological processes responsible for the generation, export, and remineralization of organic matter from the upper ocean to depth (Boyd et al., 2019; DeVries et al., 2012; Steinberg and Landry, 2017). The biological pump connects various aspects of the carbon cycle: the upper-ocean photosynthetic carbon uptake, the alimentation of the midwater biota (Irigoien et al., 2014), and the carbon storage within the deep sea (Buesseler et al., 2007). Within the euphotic zone, organic particles are continuously generated and recycled, with only a small fraction descending into deeper layers (de La Rocha and Passow, 2006), while remineralization occurs within a few hundred meters of the surface and is facilitated by processes such as zooplankton feeding or microbial degradation (Giering et al., 2014; Steinberg and Landry, 2017; Stemmann et al., 2004a). Given the retroactive potential of the BCP to significantly impact anthropogenic climate warming (Bernardello et al., 2014; Bopp et al., 2013), understanding the multitude of mechanisms governing the BCP is of paramount importance.
Among the different processes of the BCP, sinking marine snow is the key component of particulate carbon transport to the deep ocean, a process known as the biological gravitational pump (BGP). Marine snow consists of detritus, formed from a mixture of source particles produced by the surface ecosystem and aggregated together by physical (coagulation) or biological (trophic activity) mechanisms (Alldredge and Silver, 1988). Their composition is determined by multiple characteristics, mainly the phytoplankton and zooplankton community composition (Bach et al., 2019; Tréguer et al., 2018). In the mesopelagic layers, several biological and physical factors influence their dynamics and control their size distribution and morphology, which affect their sinking (Cael et al., 2021; Stemmann et al., 2004a). Shear and differential settling modulates aggregation (Jackson, 1990; Stemmann et al., 2004b) while fragmentation rates have been proposed to depend on shear and swimming organisms (Briggs et al., 2011; Dilling and Alldredge, 2000; Jackson, 1990). Additionally, particle volume and surface area condition interactions with microorganisms (e.g., colonization and degradation of particles; Bianchi et al., 2018), modifying marine snow morphology by making them more porous and fragile with time (Biddanda and Pomeroy, 1988; Ploug and Grossart, 2000). Mineral ballasting, through the association of marine snow with dense inorganic materials such as calcium carbonate, lithogenic or biogenic silica, can also significantly enhance sinking velocities and control the carbon export efficiency (Armstrong et al., 2001; Klaas and Archer, 2002).
An efficient tool to track the particle morphology, study their abundance, and estimate the vertical carbon flux is the Underwater Vision Profiler (UVP; Picheral et al., 2010, 2022). This imaging tool measures particle abundance and distribution (Guidi et al., 2009; Kiko et al., 2022; Stemmann et al., 2002), to estimate the BGP (Forest et al., 2013; Guidi et al., 2015; Kiko et al., 2017; Ramondenc et al., 2016), and more recently, to explore particle morphology (Accardo et al., 2025; Soviadan et al., 2024; Trudnowska et al., 2021). One decade of observation with the UVP5 during ship surveys allowed a global monitoring (Forest et al., 2013; Guidi et al., 2008, 2015; Kiko et al., 2017; Stemmann et al., 2002) and enabled the reconstruction of global export fluxes from the spatially variable euphotic zone and mixed layer depths (Clements et al., 2022, 2023; Guidi et al., 2015).
Despite significant improvement in observation capacities from ships, high frequency observations during long-term deployment to study relevant scales of marine snow dynamics over a large depth range was not possible. Autonomous platforms equipped with imaging sensors have emerged and are currently being utilized to remotely record plankton and particle distributions in addition to the core parameters such as salinity, temperature, and optically derived other variables (Claustre et al., 2020; Picheral et al., 2022). Recently, surface blooms followed by plumes of sinking material were monitored using optical sensors (fluorescence and backscatter) mounted on BGC-Argo float drifting in a quasi-Lagrangian mode (Briggs et al., 2011, 2020) and global POC standing stocks have been calculated (Fox et al., 2024). Such studies with optical sensors (fluorescence, backscatter) are key to understanding particle dynamics in the core of the oceans but they are not adapted to study marine snow.
We selected the equatorial Atlantic Ocean to conduct our study, as it is characterized by enhanced primary productivity concentrated within the equatorial and coastal regions (Grodsky et al., 2008). This productivity is due to the presence of upwelling zones in the central and eastern parts of the equatorial basin (Schott et al., 1998) which bring nutrients to the euphotic zone (Radenac et al., 2020; Brandt et al., 2025). This enhanced productivity results in a stronger passive and active export of particulate matter reaching up to 4000 m (Kiko et al., 2017). The strength of the equatorial upwelling system is modulated by the strength of seasonally varying winds associated with the meridional migration of the intertropical convergence zone (Brandt et al., 2023). At intraseasonal (20–50 d) scales, Tropical Instability Waves (TIWs) are another factor influencing the equatorial local productivity. TIWs are westward-propagating, cusp-shaped oscillations prevalent in the central and western equatorial Atlantic generated by baroclinic and barotropic instabilities (Athie and Marin, 2008; von Schuckmann et al., 2008). They induce strong intraseasonal variations in sea surface temperature, sea surface salinity, and ocean currents (Tuchen et al., 2022), and are associated with sharp fronts (Warner et al., 2018). TIWs can also influence nitrate (Radenac et al., 2020) and chlorophyll distribution (Menkes et al., 2002; Sherman et al., 2022).
We here focus on the equatorial Atlantic BGP, using data from a UVP6 camera mounted on a BGC-Argo float deployed at 0° N, 23° W in July 2021 to study the impact of seasonal upwelling and intraseasonal TIWs on productivity and particle export. In particular, we use a plume-based approach to follow the initiation and vertical extent of export events, to characterize particle production of various morphotypes during two bloom events, and to describe the patterns of their attenuation as they are exported to the meso- and bathypelagic layers.
2.1 Satellite data
2.1.1 Sea surface chlorophyll a
Estimates of chlorophyll a (Chl a) concentration and anomalies for the tropical Atlantic were obtained from the combination of two different products: the Global Ocean Color product (OCEANCOLOUR_GLO_BGC_L4_MY_009_104) produced by ACRI-ST and the NOAA-VIIRS provided by NOAA CoastWatch. Both of these data sets provide gap-free time series, with a temporal extent from 1997 till 2023 for the first product, while the second one only started in 2018. The temporal resolution for both products is one day with a spatial resolution of 4 km for the first product and 9 km for the second one.
2.1.2 Sea surface temperature
Sea surface temperature (SST) data were downloaded from the NOAA OI-SST data set (Huang et al., 2021; https://psl.noaa.gov/data/gridded/data.noaa.oisst.v2.highres.htm, last access: 17 October 2025). SST anomalies are computed relative to a 30 year climatological mean. The gridded data are available daily from 1981–present at a horizontal resolution of 0.25°. To isolate TIW induced SST variability from the time series, a temporal (20–50 d) and a zonal (4–20° wavelength) bandpass filter were applied in accordance with previous studies (Olivier et al., 2020; Tuchen et al., 2022).
2.1.3 Lagrangian diagnostics
Several Lagrangian diagnostics were computed for each sampling station using velocity data and environmental satellite products. To this aim, we defined for each station a circular region that we consider representative of the water parcel sampled by the BGC-Argo float. A radius of 0.1° was used (consistent with previous studies, Baudena et al., 2021; Fabri-Ruiz et al., 2023; Ser-Giacomi et al., 2021), and the circular region was filled with virtual particles. A given diagnostic is calculated for each virtual particle in the circular region. These values are then averaged together, providing one value of a given diagnostic per station.
The velocity field used is the Copernicus CMEMS product MULTIOBS GLO PHY REP 015 004-TDS at 15 m depth. This product has a spatial resolution of 0.25° and a daily temporal resolution. It is derived from satellite altimetry and model assimilation and includes both geostrophic and Ekman components. Using the surface velocity, each particle within the circular region of a given sampling station was advected using a Runge-Kutta scheme of order 4 from the day of the sampling backward in time. Different advective times were used, from 5 to 45 d. Two types of diagnostics were carried out: Eulerian and purely Lagrangian diagnostics. These groups consist of calculating properties that are integrated in time: at the sampling location (Eulerian) or along the trajectory of the water parcel (Lagrangian). In this study, we only present diagnostics that are relevant to our area of study, such as the Lagrangian and Eulerian chl a, divergence, and vorticity. The Lagrangian chlorophyll, the average chl a content carried by the water parcel in the previous days, provides information on the recent primary productivity. The Lagrangian divergence can be considered as a proxy of the upwelling (when negative) of downwelling (when positive) experience by the water parcel in the previous days. This metric has been correlated with chlorophyll (Hernández-Carrasco et al., 2018).
In the following, we will report diagnostics calculated using an advective time of 15 d. This value was chosen as it showed the highest correlations between the chl a concentrations and the abundance of micrometric particles and macroscopic particles between 0–100 m (Fig. S8 in the Supplement).
2.2 Float data
2.2.1 Coverage and data collection
For this study, a BGC-Argo float (WMO:6904139) was deployed at the equator during RV Sonne SO284 cruise traversing the transect from 23 to 7° W migrating from west to east during the period between July 2021 and March 2022. The float was recovered during the PIRATA FR32 cruise. This float was equipped with several physical and biogeochemical sensors to measure the pressure, temperature, salinity, chlorophyll, oxygen, and particle backscattering coefficient (BBP, measured at 700 nm) with a vertical resolution of 5 m. BGC-Argo float data were collected through the International Argo Program and can be found at https://argo.ucsd.edu (last access: 7 October 2025). Chl a and BBP both present a gap between the 1 and the 5 January 2022.
2.2.2 UVP measurements
An Underwater Vision Profiler 6 (UVP6) was mounted on the BGC Argo float. This camera-based particle counter sizes and counts marine particles (Kiko et al., 2022) covering a size range from 0.102 to 16.4 mm. The UVP contributes to understanding sinking organic particles and carbon sequestration at global (Guidi et al., 2015) and regional scales (Baudena et al., 2025; Ramondenc et al., 2016). More information about calibration and data processing can be found in Picheral et al. (2022). In total, our data set includes 86 profiles reaching at least 1000 m. Every 3 d, the BGC Argo float reached 2000 m. According to the recorded profiling times, at least 50 % of the profiles were conducted during nighttime, with many occurring close to local midnight. For all parameters, we interpolated the data set with a vertical resolution of 10 m and a temporal resolution of a day.
2.2.3 Mixed layer depth calculation
To determine the mixed layer depth, we use temperature profiles provided by the BGC-Argo float. Using the definition outlined in De Boyer Montégut et al. (2004), the mixed layer was determined by identifying the depth at which the temperature decreased by 0.2 °C relative to the temperature at 10 m depth. The mixed layer depth in this study reached a maximum depth of 60 m.
2.2.4 Particle abundance and carbon flux calculation
Particle size abundances (number of particles per liter) for depth bins of 2.5 m along the water column were obtained by the UVP. Particles were divided into two categories based on their size: Micrometric particles (MiP) for particles ranging between 0.1–0.5 mm, and Macroscopic particles (MaP) ranging between 0.5–16 mm. The carbon flux was obtained by integrating all size classes and therefore represents the total carbon flux. To calculate the flux for a given size class, we used the relationship provided by Kriest (2002), linking the particle size to the sinking speed and its carbon content. This relationship has been used in former studies using UVP observations (Kiko et al., 2017). For each parameter, we interpolated the profiles in depth with a vertical resolution of 10 m and a temporal resolution of a day.
2.2.5 Determination of export events
We determined periods of export events, using the anomalous carbon flux. We calculated the total mean particle abundance and mean carbon flux along the water column from the interpolated fields for the deployment period. The resulting mean profile was then subtracted from the individual particle abundance and carbon flux profiles, yielding anomaly profiles. This helped us determine two different types of periods: periods with main export events and periods where no or weak export occurred.
2.2.6 Regime shift detection for surface export
A sequential algorithm for regime shift detection (Rodionov, 2004) was applied to the MaP abundance for the first 200 m to identify accurately the beginning and the end of the carbon export events. This method identifies discontinuities in a time series without prior assumptions of the timing of the regime shifts. The algorithm requires a set of parameters to specify: the target significance level and the cutoff length. The target significance used here is p = 0.05. The cutoff length affects the time scale of the regime by removing regimes of shorter duration than the reference value. In this study, the cutoff length was set to 9 d to cover at least 3 profiles. For more details, see Rodionov (2004, 2006). We determined three masks, two corresponding to periods of export “event 1”, “event 2”, and a period where no main export plume was observed, hereafter referred to as the “outside-between” mask. It should be noted that “outside-between” refers to periods that do not belong to the two main export events.
2.2.7 Morphological properties of detritus
The data set consisted of 127 000 images. Each image underwent individual classification using the Ecotaxa program with the support of machine learning classifiers (Picheral et al., 2017). This classification differentiates between living and non-living organisms. The automatically classified images were then manually validated or reclassified. To distinguish between different types of marine snow, we examined the morphological properties of individual objects such as size (area, perimeter), shade intensity (mean/median gray level), shape (elongation), and structural complexity (homogeneity or heterogeneity of gray levels). This was done using a principal component analysis (Fig. S6 in the Supplement) to summarize the morphological information into a few new variables, followed by k-means clustering to separate different morphotypes of particles (Trudnowska et al. 2021). Using this method, we distinguish between five types of marine snow, as this number was a good compromise between the continuum of change in morphology and a need for simplicity. Concentration in numbers (numbers m−3) was computed per 10 m bins for each UVP6 profile.
2.2.8 Flux attenuation and biological carbon pump efficiency
The biological carbon pump (BCP) was computed following Engel et al. (2023), and Buesseler et al. (2020):
With Eeff, as the carbon export efficiency (Eeff)
FZ0 is the carbon export flux out of the surface ocean layer, corresponding to 100 m. While PP is the amount of CO2 fixed by primary production, both in . Satellite-based net primary production (NPP) was downloaded from the Ocean Productivity website (http://www.science.oregonstate.edu/ocean.productivity, last access: 7 October 2025) using the Vertically Generalized Production Model (VGPM)-Eppley.
Teff represents the carbon transfer efficiency:
FZ is the flux at a particular depth and Z0 is the reference depth (taken here as 100 m). Teff is related to the attenuation of carbon flux with depth, over 0–1000 m, quantified by a Martin power law (Martin et al., 1987).
Z is the depth. The exponent b represents the attenuation with depth. An analogous equation was used to describe the particle attenuation.
nZ, nZ0 are the concentrations of particles at depth Z or Z0.
3.1 Satellite data analysis
Throughout the float trajectory (Fig. S1 in the Supplement), satellite observations disclosed the presence of relatively cold surface waters during two distinct periods: August–October 2021 and December 2021 to February 2022 (Fig. 1a). The first period aligned with the seasonal development and peak of the Atlantic cold tongue with minimum surface temperatures around 23.8 °C. The second period was from December to February with temperatures around 26 °C. The seasonal surface warming occurring between October and December featured values reaching 27.5 °C, while temperatures reached almost 29.5 °C during March and April (Fig. S2a in the Supplement). The temperatures were warmer than usual compared to the climatology from 2012–2022, especially throughout the boreal summer of 2021 (Fig. S2a).
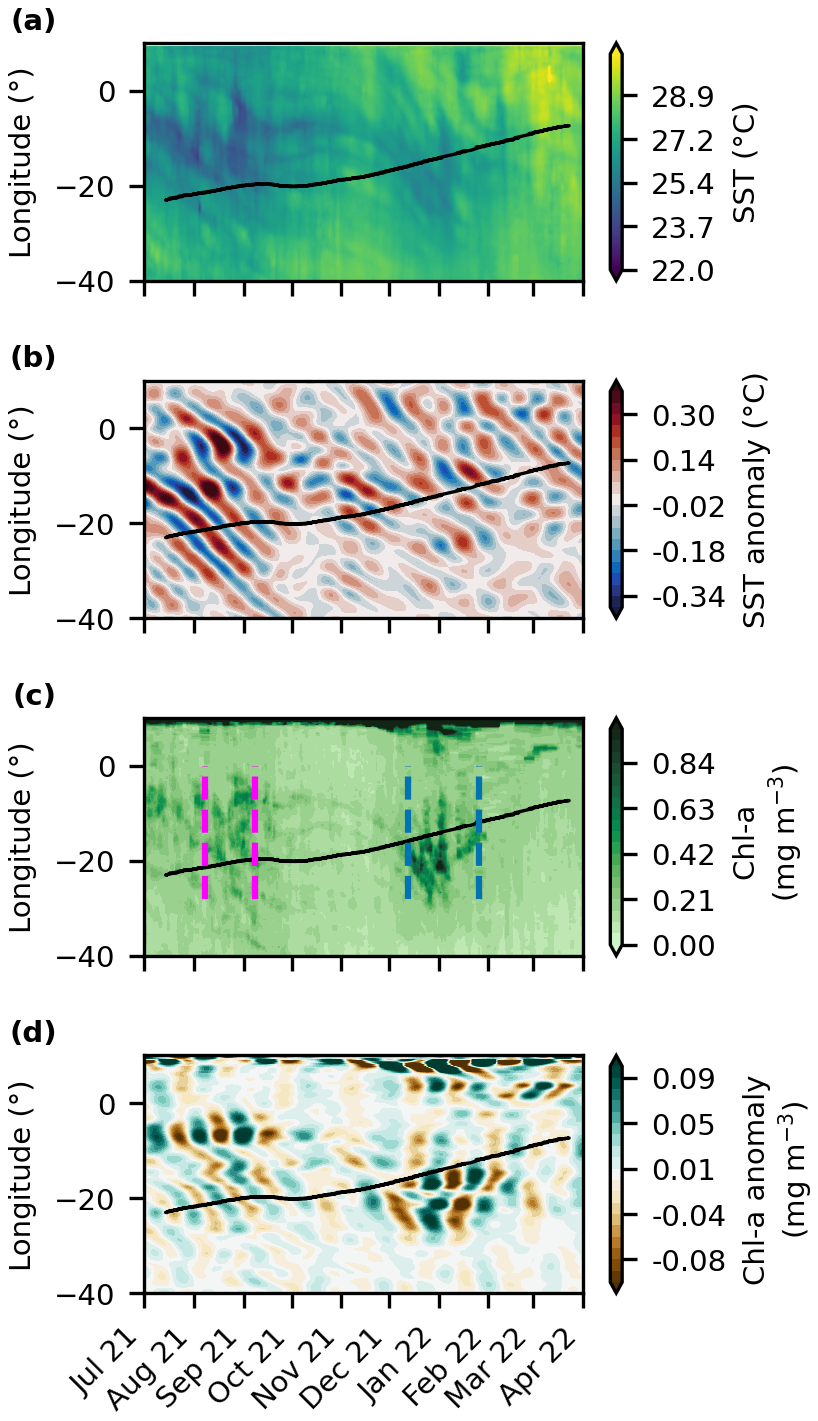
Figure 1Satellite-derived properties as a function of time (x-axis) and longitude (y-axis): (a) sea surface temperature (,°C), (b) bandpass-filtered sea surface temperature anomaly, (c) surface chl a concentration (mg m−3), and (d) bandpass-filtered chl a anomaly along the equator from July 2021 to March 2022. The black line represents the float trajectory from west to east. The blue and magenta lines determine the beginning and the end of the first and the second export event, respectively.
Before and during the cold tongue development in July to September 2021, bandpass-filtered SST anomalies oscillated between −0.3 and 0.3 °C and showed westward propagation (Fig. 1b), suggesting the presence of TIWs. A weaker TIW signal was observed during the second period when SST anomalies ranged between −0.1 and 0.1 °C.
Peaks of chl a were observed during both low-temperature periods reaching about 0.4 mg m−3 on 10 September 2021 and 2 January 2022 (Figs. 1c and S2b). The surface chl a concentration ranged between 0.1 and 0.4 mg m−3 along the float trajectory. When comparing the chl a to the climatology, a delay in both peaks was observed (Fig. S2b) with a low peak during summer 2021 and a second high peak during winter 2022 for the float compared to the climatology. The bandpass-filtered chl a anomaly oscillated between −0.04 and 0.04 mg m−3 from August to October (Fig. 1d). These anomalies seem to be anti-correlated with the SST anomalies (Fig. S2c and d). However, westward propagation of bandpass-filtered chl a anomalies is less obvious than for SST. From December to March, more pronounced chl a anomalies were observed.
3.2 Float data analysis
3.2.1 Physical parameters (Temperature, Salinity, mixed layer)
During August, the mixed layer depth (MLD) was at about 42 m, salinity integrated over the first 100 m showed a maxima of 36 PSU (Figs. 2a and S3a in the Supplement) while temperature (averaged over the top 100 m) showed a first minimum of 21 °C (Fig. 2b). Average 100 m temperature increased with the progressive deepening of the ML from September to January. MLD reached a maximum of 60 m in October. Salinity was high during the same period with a maximum of 36 PSU in November (Fig. 2a). A second temperature minimum of 18.8 °C was also recorded in January coinciding with the shoaling of the Deep Chlorophyll Maximum (DCM) and the presence of a salinity minimum in the top 100 m (Figs. 2a, b and S3a, b). A subsurface maximum was determined for the salinity between 50–100 m (Fig. 2a and b). The thermocline, represented by the 20 °C isotherm (black line, Fig. 2e) was unusually deep during summer (80 m) compared to the Argo climatology and reached a maximum of 100 m in October. It was also unusually shallow (50 m) in January 2022.
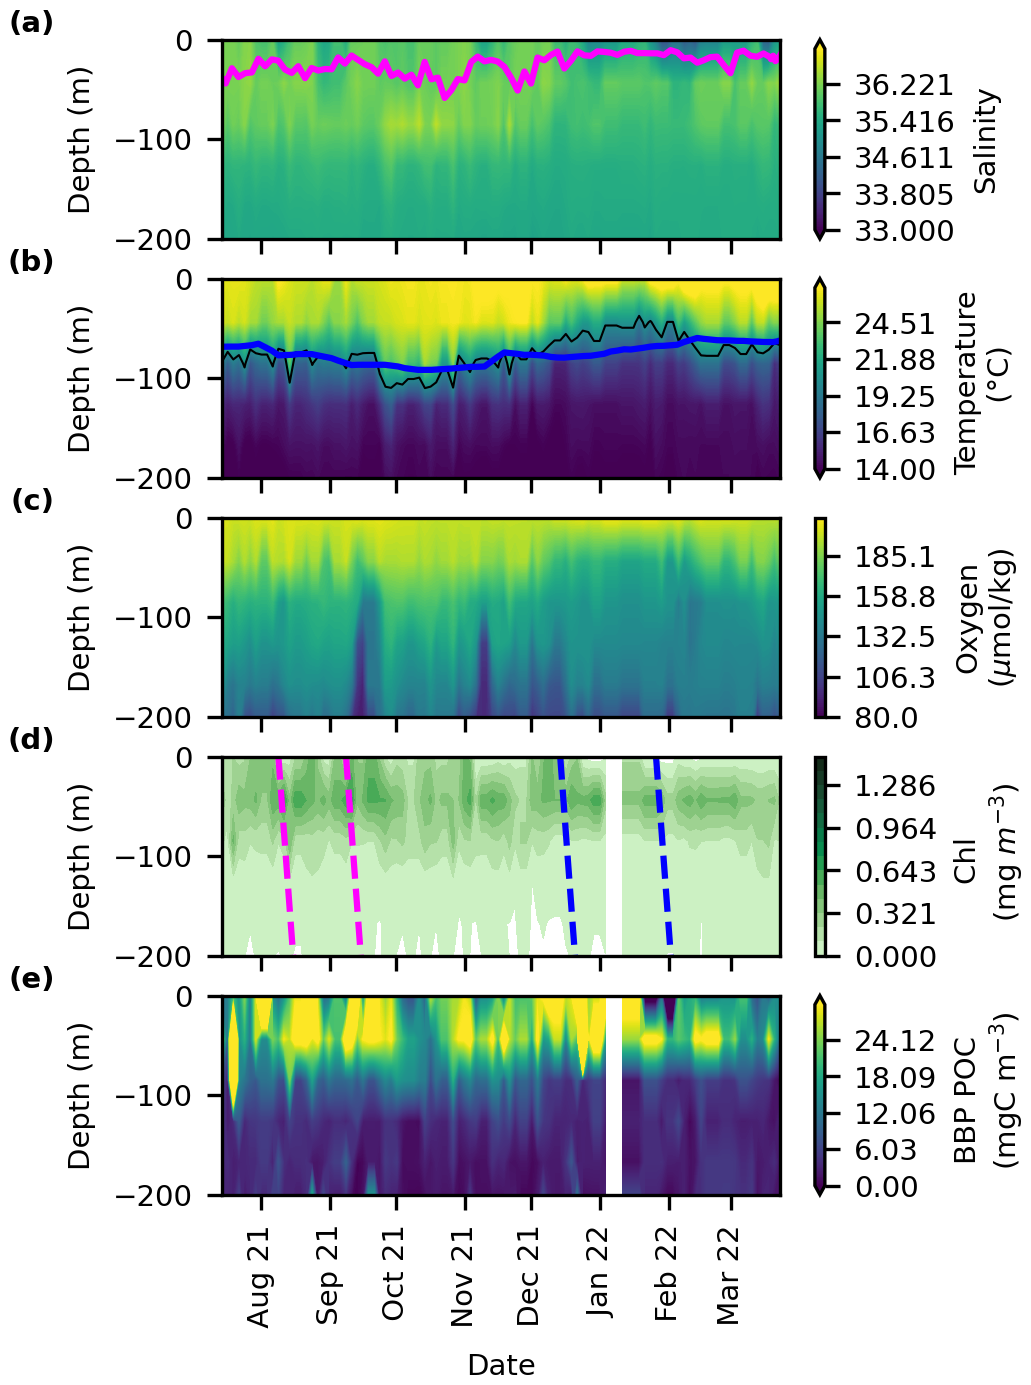
Figure 2Time–depth profiles determined from the BGC-Argo float for (a) salinity, (b) temperature (°C), (c) oxygen (µmol kg−1), (d) chl a (mg m−3) (e) and BBP POC (mg C m−3). The magenta line in (a) represents the mixed layer depth defined as a decrease of 0.2 °C relative to temperature at 10 m depth. The black line in (b) represents the 20 °C isotherm depth which is a well-known proxy for the thermocline in the tropics. The blue line in (b) is the average depth of the 20 °C isotherm from the Argo climatology (2012 to 2022). The blue and magenta dashed lines in (d) determine the beginning and the end of the first and the second export event, respectively.
3.2.2 Biogeochemical parameters (chl a, BBP, oxygen)
The chl a concentration reported by the BGC-Argo float in the first 100 m, varied between 0 and 0.5 mg m−3. Peaks reached 0.45–0.5 mg m−3 values on 18 September, 3 November, and 8 December (Figs. 2d and S3a). Elevated chl a concentrations were observed at 70 m depth, corresponding to the depth of the deep chl a maximum. These values varied between 0.28 and 0.8 mg m−3. Both satellite and float chl a data show the presence of two blooms (Fig. S3a). However, float data presented a more variable chl a concentration compared to the satellite. This can be attributed to the low resolution of satellite images compared to the float and the interpolation methods applied to ensure a gap-free time series, but also to fundamental differences in how chl a is measured. Float-based chl a is derived from fluorescence and is sensitive to phytoplankton physiology, community composition, nutrient availability, and environmental conditions, whereas satellite measurements rely on optical reflectance and are largely insensitive to these factors (Long et al., 2024). BBP POC, calculated using a BBP-to-carbon relationship (Koestner et al., 2022), followed the same pattern as chl a and small particles were concentrated in the first 90 m (Fig. 2e). Periods of high chl a were correlated with an increase in the BBP POC. Oxygen concentrations reached values around 189 µmol kg−1 (Fig. 2c) in the mixed layer. Concentrations decreased with depth, with values below 134 µmol kg−1 below 100 m.
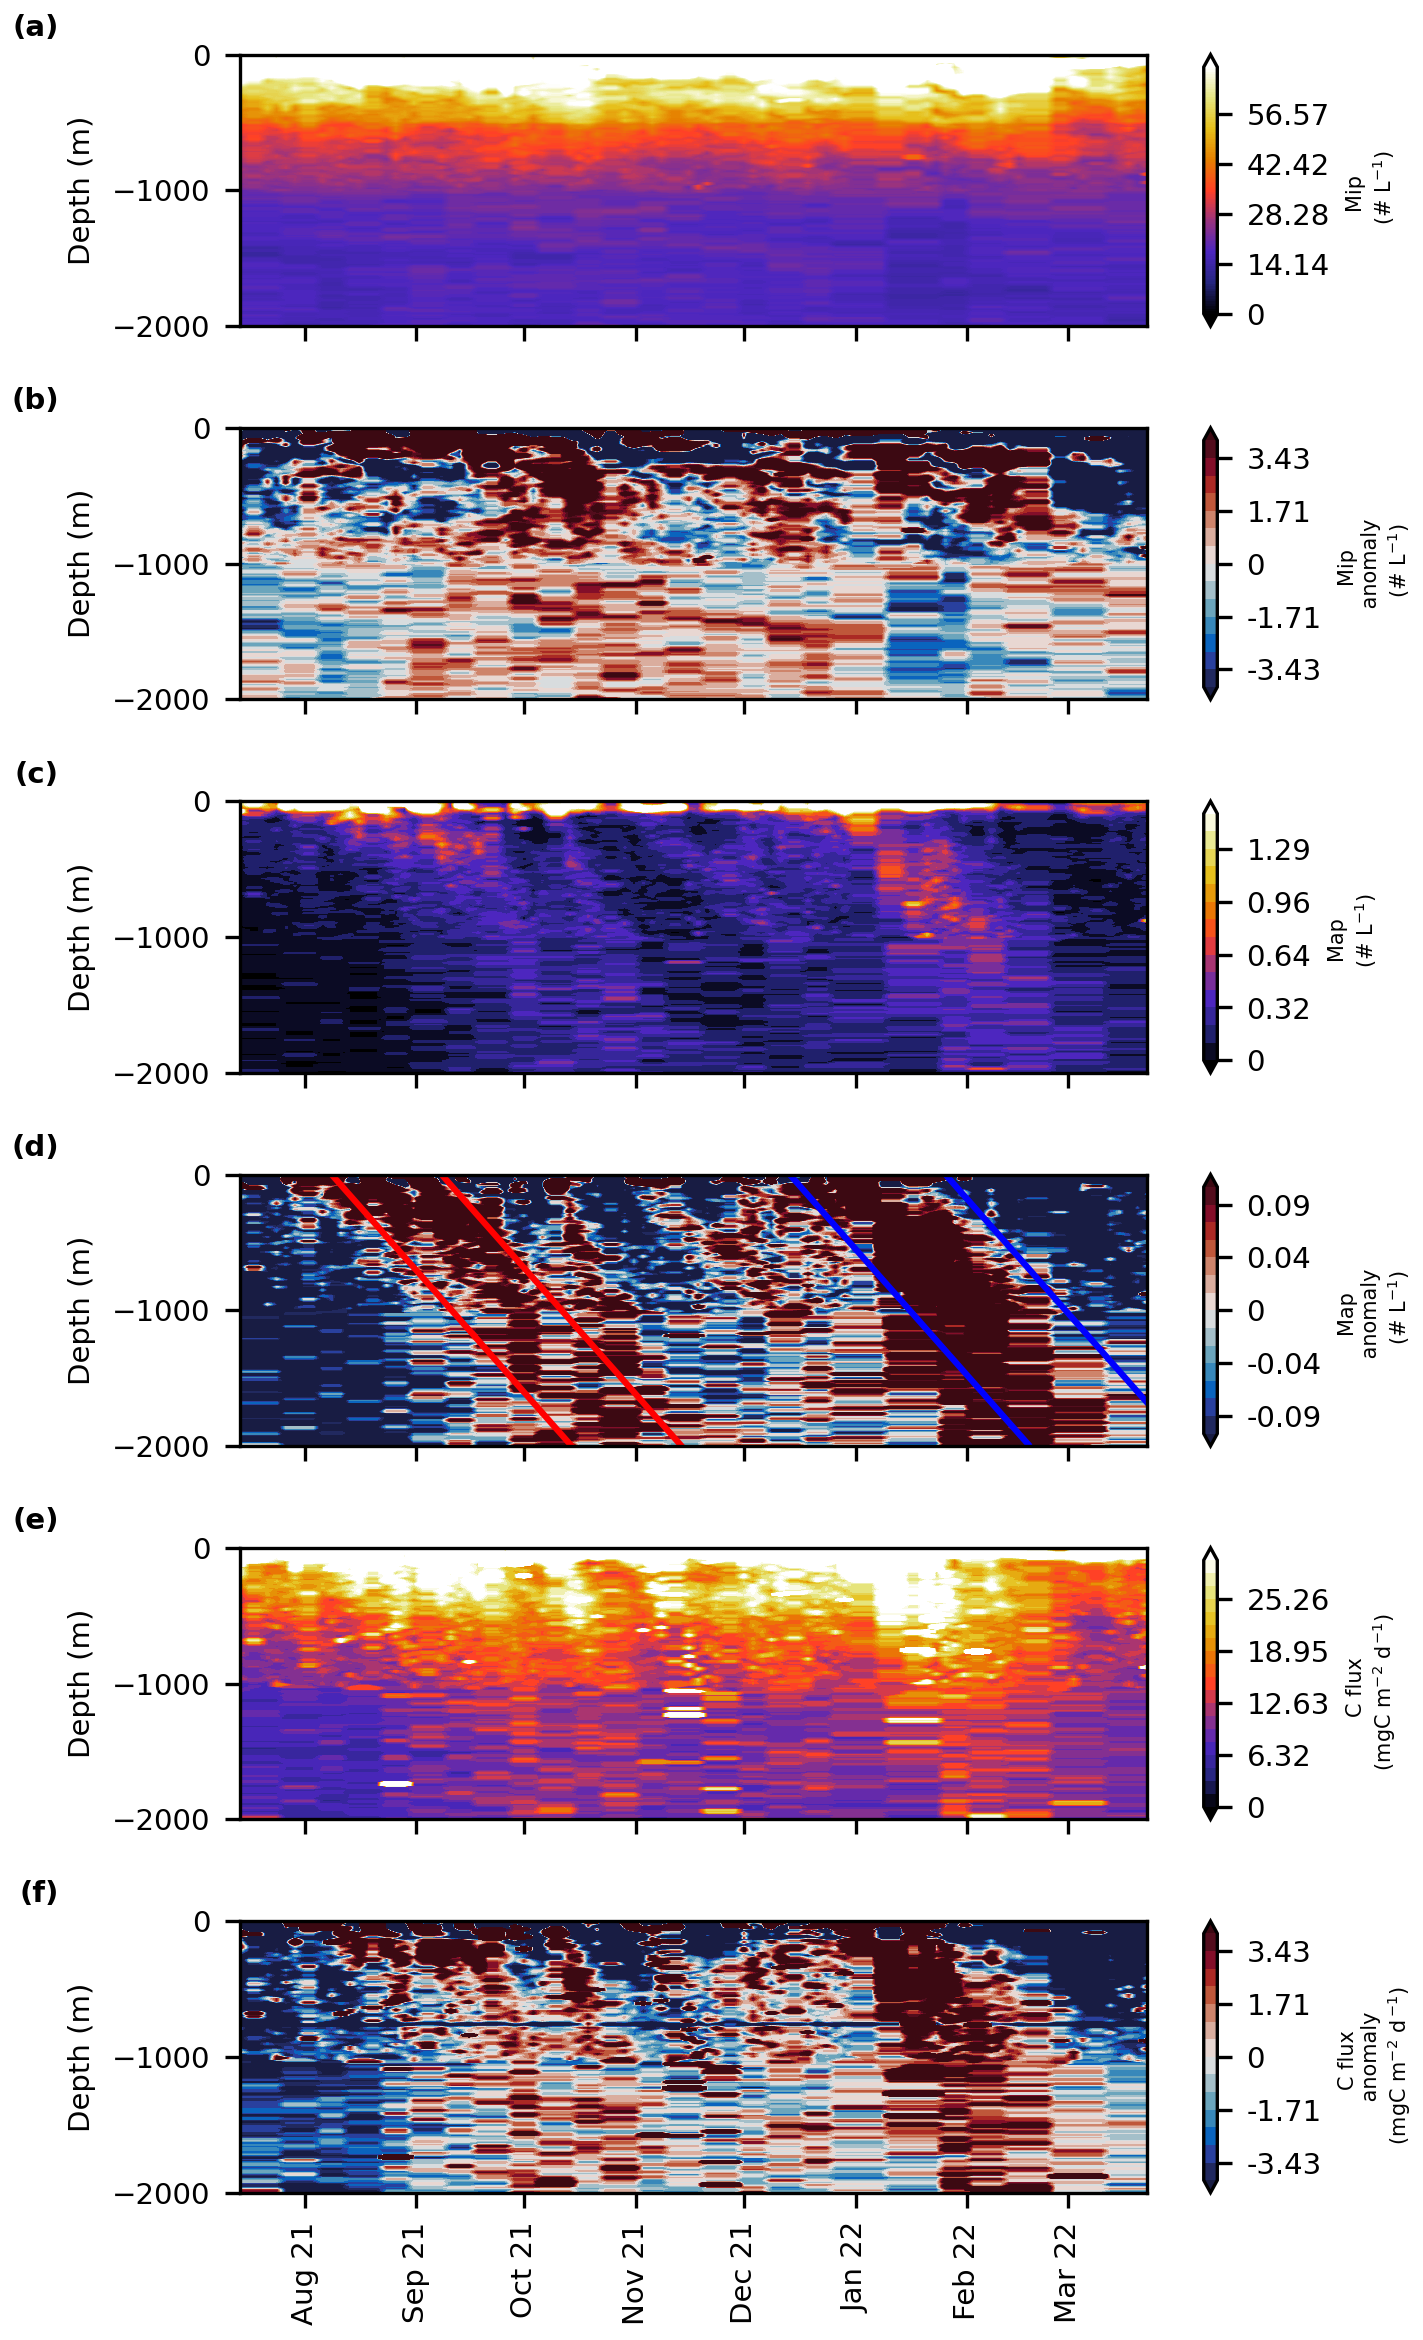
Figure 3Time series of (a) MiP abundance (# L−1), (b) MiP anomaly, (c) MaP abundance (# L−1), (d) MaP anomaly, (e) carbon flux (), and (f) carbon flux anomaly. The blue and red lines determine the beginning and the end of the first and the second export event, respectively.
3.3 Carbon flux dynamics
3.3.1 Surface flux and particle abundance along the trajectory (0–100 m)
The increase in surface chl a in the first 100 m was linked to an increase in surface carbon flux, MaP and MiP abundance (particles between 0.1–0.5 mm) (Fig. S3). All were significantly correlated with in situ chl a (r2 = 0.4, 0.6 and 0.3, respectively, p-value < 0.01). No significant correlation was found between surface chl a and MaP abundance (particles > 0.5 mm). The highest integrated MiP abundance in the surface layer was recorded on the 18 August 2021 with values reaching 316 particles L−1 (Figs. 3a, c and S3d). This also coincided with the highest MaP abundance with around 5 particles L−1. Simultaneously with the surface chl a peak, on 3 November 2021 a peak of MiP with 348 particles L−1 was also observed (Fig. S3d), while carbon flux increased after a 15 d delay reaching 250 (Fig. S3f). The peak of chl a, in December 2021 caused an increase in carbon flux, MiP, and MaP abundance.
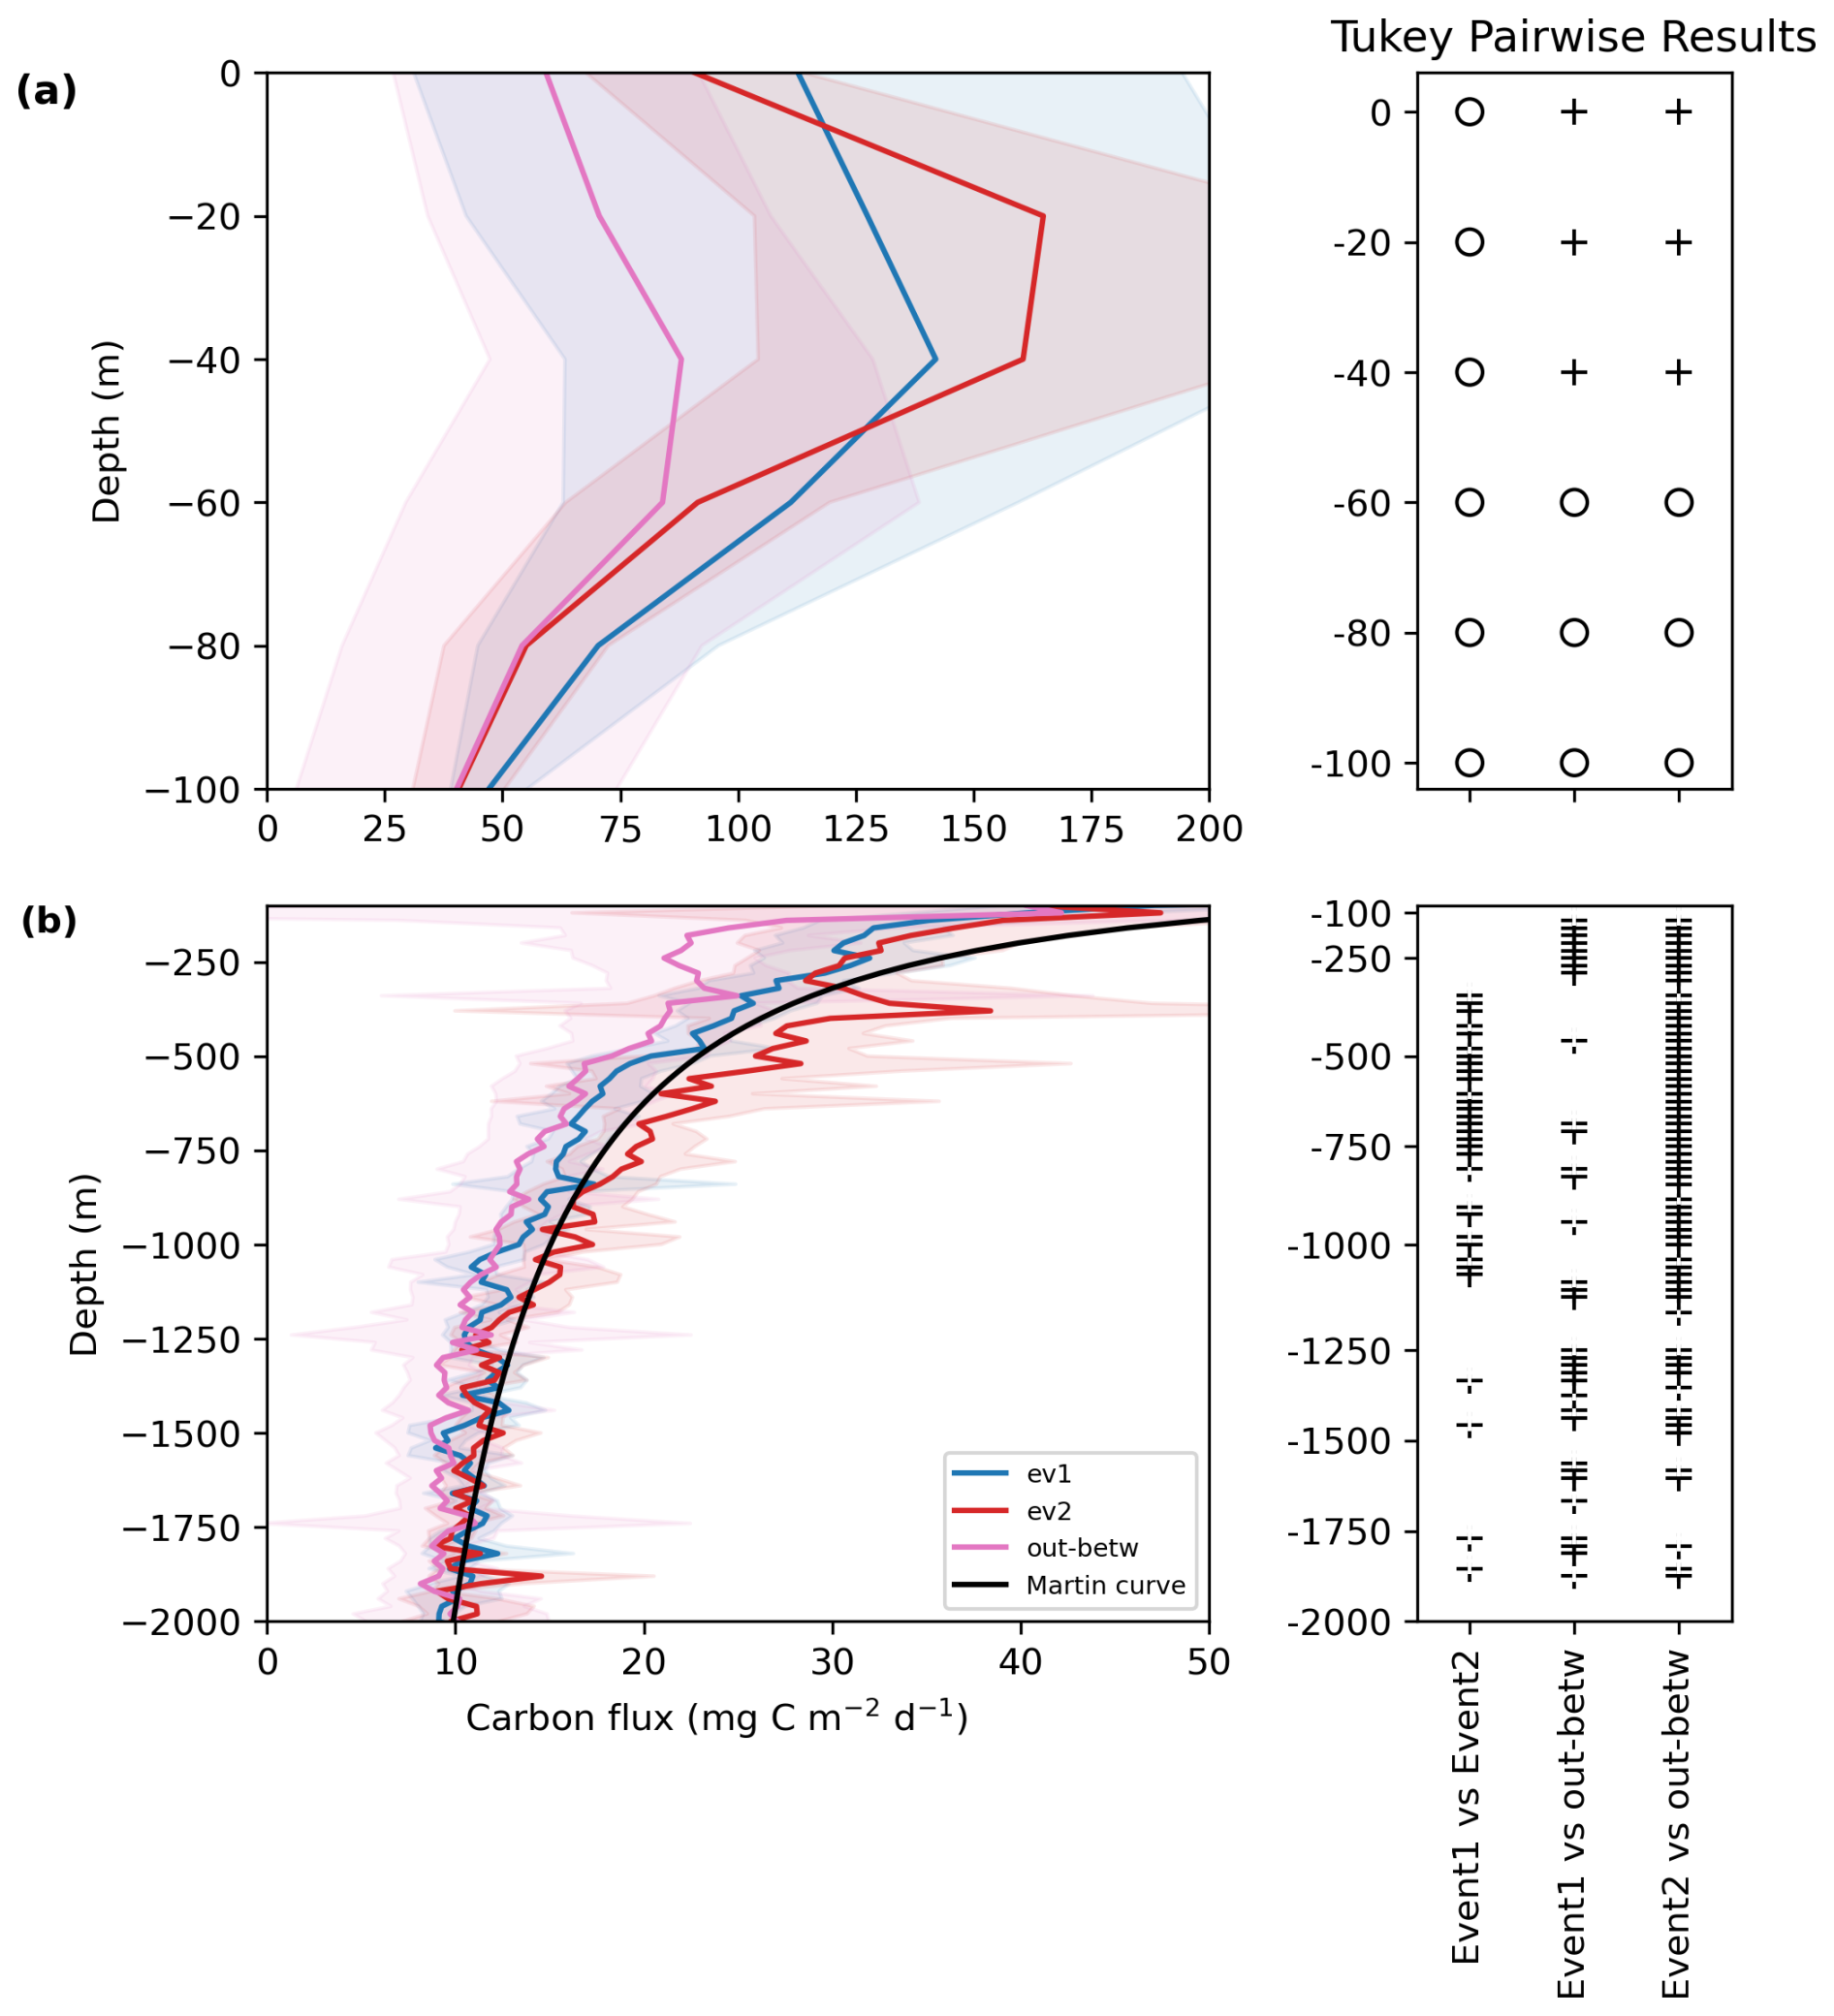
Figure 4Averaged carbon flux profiles () along the plumes during event 1 (blue), event 2 (red), and the outside-between mask (purple) (a) from 0–100 m, (b) from 200–2000 m. The shading represents the standard deviation. The Tukey pairwise results were conducted for each depth. Plus signs indicate a significant difference, and blank space or empty circles indicate a non-significant difference. The black line represents the Martin curve of event 2 calculated using Eq. (4) with b = −0.6 and FZ0 = 100 m.
3.3.2 Flux and particle abundance pattern along the water column (averaged profile)
Throughout the float trajectory, the UVP6 data showcased high variability in MiP and MaP abundance, and carbon flux in the upper 100 m, with a dominance of small particles compared to big particles (Figs. 4a and S3). MiP and MaP increased in the surface layer peaking at 30–40 m, respectively. The maximum carbon flux, 104.1 ± 61.5 , coincided with the MaP's maximum. After the surface layer peaks, MiP abundance and carbon flux declined rapidly until 1000 m, reaching 22.5 ± 1.3 particles L−1 and 13.2 ± 2.9 , while MaP's abundance decreased rapidly until 200 m with 0.3 ± 0.2 particles L−1. Flux and abundance declined further with depth. The carbon flux was dominated by MiP abundance and followed its pattern.
3.3.3 Evaluation of export events
To investigate two settling plumes depicted in Fig. 3d, four spaced lines were drawn on the MaP abundance with a slope of 30 m d−1, as suggested by Stemmann et al. (2004) using a model for particle size distribution. In reality, the plumes contain different types of sinking particles with varying velocities. Although the second plume appears to exhibit a higher sinking speed, particle composition does not change between the plumes. Therefore, to maintain consistency across all events, the same 30 m d−1 criterion was applied throughout. The periods of surface production and export were determined using the Rodionov algorithm (Fig. S4 in the Supplement). The first export event, “Event 1”, started at the surface on the 8 August and lasted until the 8 September 2021, while the second event, “Event 2”, occurred from the 13 December 2021 to the 26 January 2022. Both events lasted one month (Fig. 3f). These events are easily discernible on the MaP abundance and carbon flux plots as two plumes that reach 2000 m depth (Fig. 3c–f) while they are less visible in the MiP pattern.
Interestingly, the carbon flux profiles for events 1 and 2, and the “outside-between” mask showed the same attenuation of the mean carbon flux along the water column (Fig. 4a and b). Flux at 30 m depth reached 168, 139, and 83 for event 2, 1 and outside-between mask, respectively (Fig. 4a). The flux then decreased with depth during all periods. An intermediate particle maximum was observed for “outside-between” and event 2 between 300–500 m (Fig. S5 in the Supplement). The “outside-between” mask showed the lowest carbon flux along the water column compared to the two export events. Flux during event 2 was the highest from 0–60 m and then from 120 to 2000 m (Fig. 4a–c). Post hoc Tukey tests showed a significant difference between the outside-between mask and the two main export events for most of the layers of the water column (Fig. 4), while there was rarely a difference between events 1 and 2.
3.3.4 Flux attenuation and export efficiency
We parameterize the strength of the BCP using the export efficiency calculated at 100 m. Export efficiency ranged between 6 %–7 % of the NPP (from satellite data estimates) exiting the 0–100 m layer. The attenuation rate of carbon flux was determined using a power law regression fit. The b values ranged between −0.4 and −0.6. The highest transfer efficiency was found during event 2, where 40 % of the flux at 100 m reaches 1000 m, followed by the between-outside mask and event 1 (31 % and 29 %, respectively; Table 1).
Table 1Parameters characterizing the biological carbon pump efficiency calculated in the plumes.
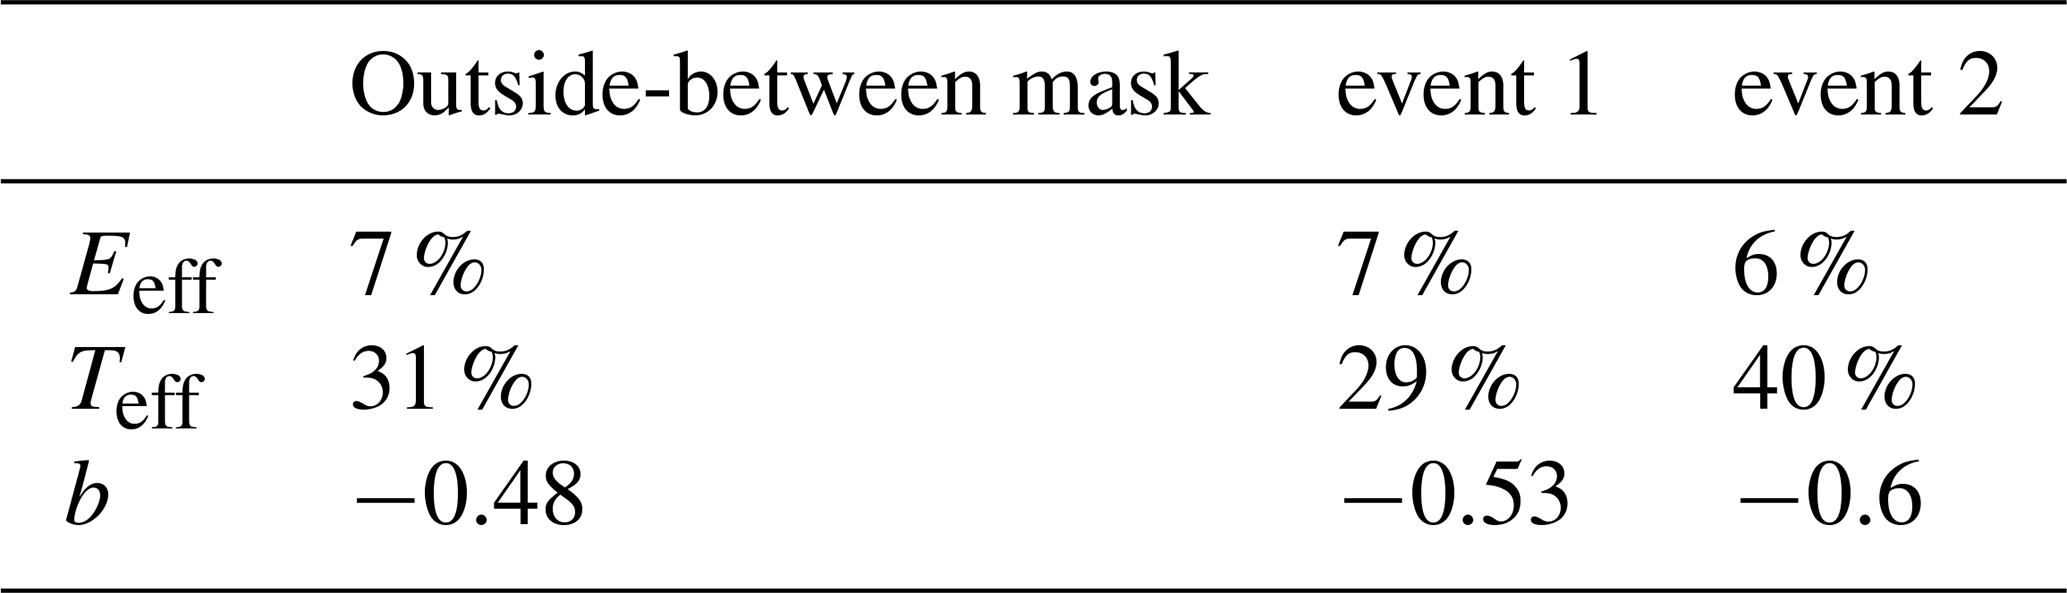
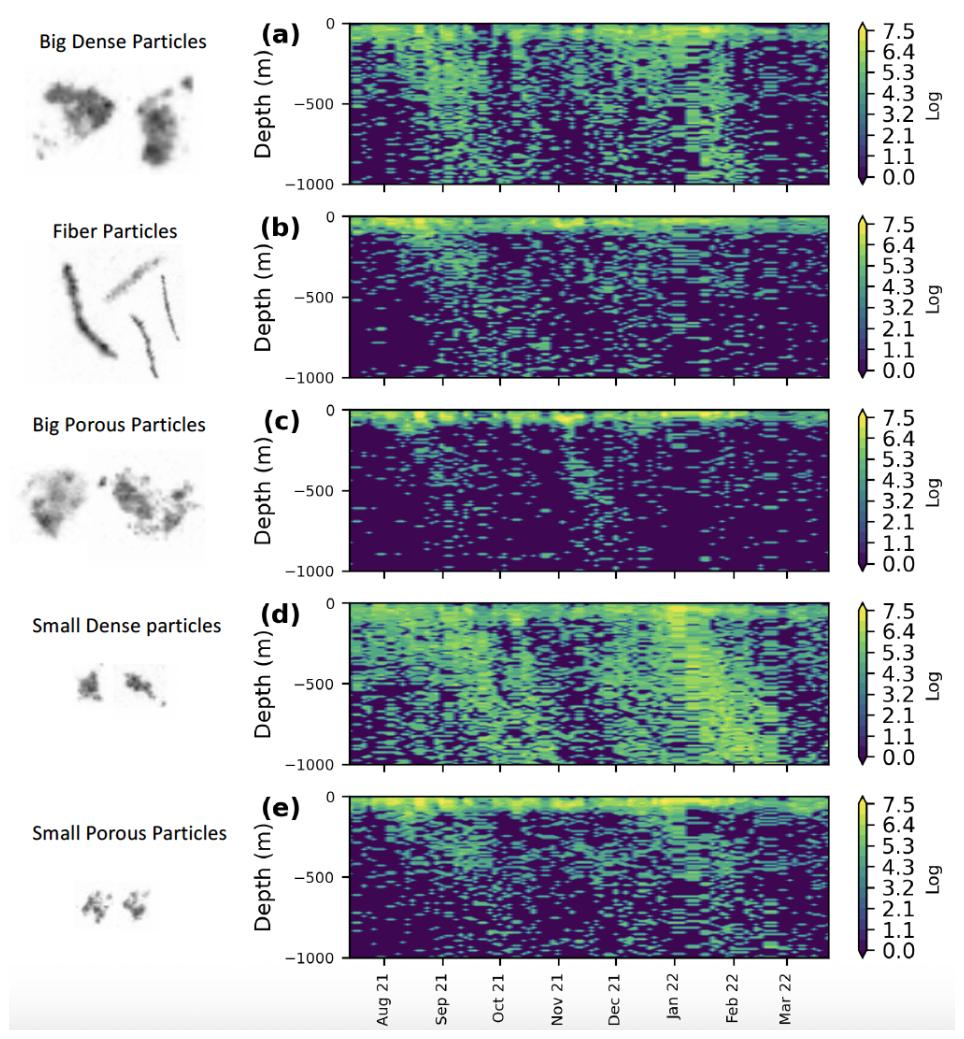
Figure 5Time series of the logarithmic concentration of (a) Big Dense, (b) Fiber, (c) Big Porous, (d) Small Dense, and (e) Small Porous morphotypes.
3.4 Particle composition
3.4.1 Morphotypes of marine snow and composition of the different events
The k-means clustering applied to the PCA coordinates helped us to distinguish between five marine snow morphotypes illustrated in Fig. 5. Type 1 consisted of large, compact objects with an Equivalent Spherical Diameter (ESD) > 0.8 mm referred to as big and dense objects (Big Dense Particles, BDP). Type 2 comprised elongated, thread-like objects termed Fiber particles (FP), and type 3 consisted of large, bright, and porous objects referred to as Big Porous particles (BPP). Type 4 was mainly formed of dense, small, and circular objects (Small Dense particles: SDP) and type 5 consisted of small, bright and porous objects Small Porous particles (SPP). These five morphotypes were then used to characterize the distribution and composition of marine snow. It should be noted that the terms “porous” and “dense” refer to brightness, with “porous” indicating greater light transmission while “dense” denotes lower light transmission.
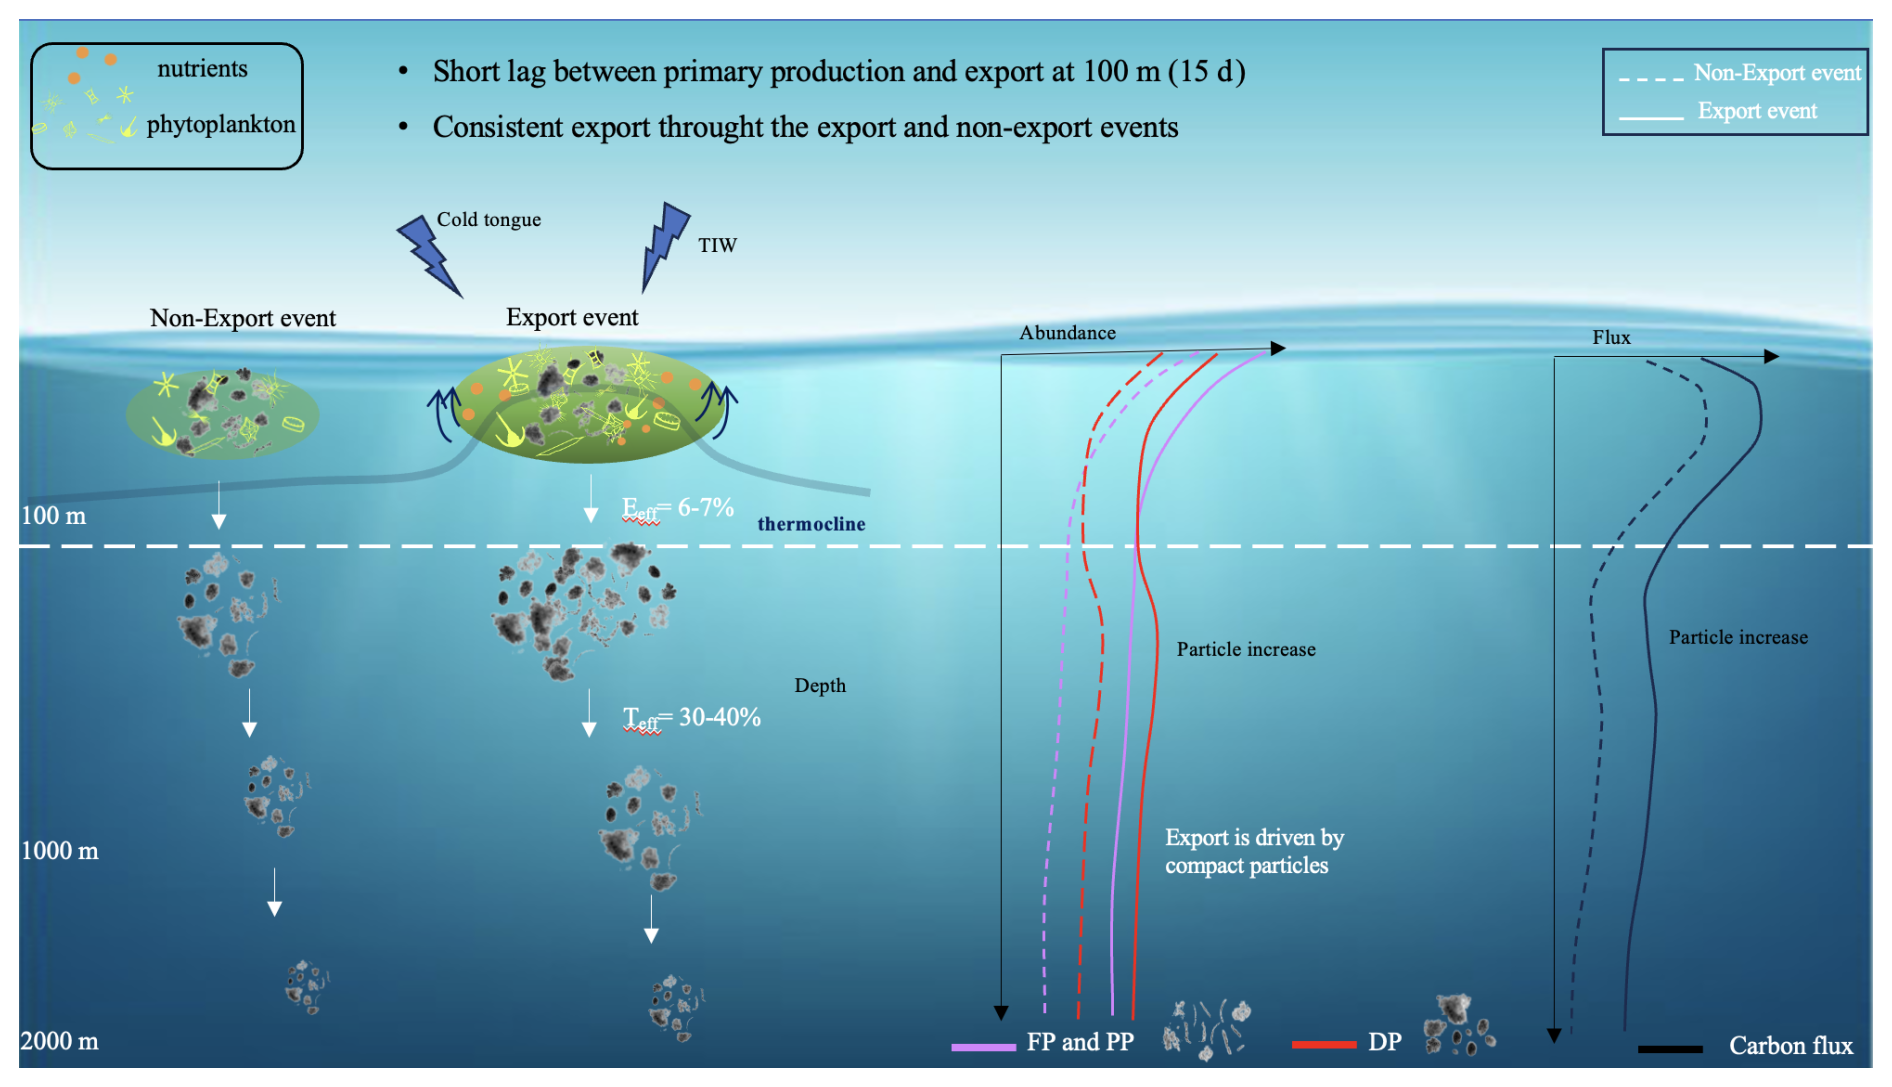
Figure 6Illustrative example of the particle export system in the Atlantic equatorial region during export and non-export events. FP: fiber particles, PP: porous particles, DP: dense particles. Teff: Transfer efficiency, Eeff: Export efficiency, TIW: Tropical instability Wave. We do not distinguish between small and large particles, as the particle composition remains consistent across both export and non-export events and only the concentration changes.
The different detritus morphotypes showed high concentrations of particles in the surface, especially during the export events (Figs. 5 and S7 in the Supplement). They shared similar temporal dynamics primarily in the surface layer: FP, BPP, BDP, SDP, and SPP decreased exponentially between 0 and 150 m. While FB, BPP and SPP decreased slowly throughout the water column in the mesopelagic layers, BDP and SDP increased gradually between 400–600 m and then decreased again (Fig. S7). BDP and SDP presented two discernable plumes during the two delineated export events, reaching 2000 m with significant concentrations all along the plumes (Figs. 6a, d and S6). Other morphotypes such as FP and SPP were sometimes present in deeper layers but with low concentrations. In the deeper mesopelagic, only SDP showed no decrease with depth (Fig. S7).
SPP were most abundant across the different periods (Fig. S7). For the outside-between mask, these particles constituted 28 % within the 0–100 m range. In events 1 and 2, their presence increased up to 50 %–60 % within the 0–50 m range (Fig. S7). However, this percentage notably declined between 50–100 m for events 1 and 2 with values dropping to 25 % below 100 m. It further decreased between 100–150 m outside of these events, 18 % below 150 m (Fig. S7). BPP and FP also exhibited high concentrations within the upper 100 m where they were primarily located.
Even though BDP and SDP were the least preponderant classes in the first 100 m, they dominated deeper layers compared to clusters BPP, SPP, and FP which were found almost exclusively in the surface layer. Their proportions were more than 20 % for events 1 and 2 and 15 % outside of these export events in the first 100 m. Concentrations of small, dark, and compact marine snow decreased until 200 m and then increased until 1000 m, while big, dark, and compact particles decreased until 400–450 m for all masks and increased afterward (Fig. S7). Small compact particles showed a mean proportion of more than 40 % for both events and 28 % for the period outside of those (Fig. S7). Throughout the observation period, the vertical attenuation of dark, compact, and small particles was the lowest of all marine snow categories with visibly more dark dense morphotypes in deep waters for all periods, while the highest vertical attenuation amongst all marine snow types was observed for the BPP cluster.
3.5 Lagrangian diagnostics
To determine the optimal advective time scale for the different particle sizes, we correlated both MiP and MaP abundance in the first 100 m with the Lagrangian chl a (chlorophyll in the moving water mass) for the different advective times (from 0–45 d). The highest correlation was determined for t = 15 d (Fig. S8). Chl a and BBP POC were positively correlated with MiP in the first 100 m (Fig. S9 in the Supplement). While MaP showed a low correlation with chl a. As for the different morphotypes, FP, SDP, and SPP were significantly correlated with chl a while no significant correlation was observed with BDP and BPP. POC flux, MiP, and MaP abundances were also significantly correlated with the Lagrangian vorticity and divergence for an advective time scale of 15 d.
4.1 Cold tongue and TIW related equatorial upwelling dynamics
The equatorial Atlantic follows a pronounced seasonal cycle in upwelling activity, forced by the seasonal winds and the meridional migration of the intertropical convergence zone (Brandt et al., 2023), which translates into a respective cycle of productivity (Grodsky et al. 2008) and a slight seasonality in carbon export (Fischer et al., 2000; Wefer and Fischer, 1993).
Here, we use a combination of satellite data analysis and in situ biogeochemical and image-based measurements from a BGC-Argo/UVP float to further our understanding of equatorial Atlantic biological pump dynamics. We observed relatively cool SST between August and October corresponding to the occurrence of the Atlantic Cold Tongue (ACT; Brandt et al., 2011), and during boreal winter in December and February corresponding to a secondary cooling period as was reported by Jouanno et al. (2011) and Okumura and Xie (2006). Seasonal cooling events are largely linked to diapycnal heat flux out of the mixed layer into the deeper ocean (Hummels et al., 2013). This heat flux is due to the enhancement of the vertical shear driven by the strength and the direction of the surface current (Jouanno et al., 2011) and the eastward Equatorial Undercurrent (EUC) at the thermocline level (Hummels et al., 2013). The equatorial Atlantic was warmer than usual at the surface throughout the boreal summer of 2021. This was the result of the occurrence of a strong Atlantic Niño driven by wind and equatorial wave forcings (Lee et al., 2023; Song et al., 2023; Tuchen et al., 2024). The physical processes controlling the downward heat flux out of the mixed layer also control the upward supply of nitrate to the euphotic layer (Brandt et al., 2025; Radenac et al., 2020). The equatorial Atlantic is a nitrate-limited upwelling regime (Grodsky et al., 2008; Moore et al., 2013) and modeling studies showed that in the equatorial Atlantic, the seasonal variations in chl a are closely linked to the seasonal variability of the nitrate input via upwelling and mixing (Loukos and Mémery, 1999; Radenac et al., 2020). The chl a blooms that are normally found in the equatorial Atlantic are linked to the upwelling of nitrate-rich thermocline waters during these periods and the diffusive flux of nitrate into the mixed layer through mixing (Longhurst, 1993; Radenac et al., 2020). Likewise, we found that chl a concentration followed a pronounced semiannual cycle with peaks in boreal summer and winter, as also described by Grodsky et al. (2008) and Brandt et al. (2023). During the first peak, from August to October, the thermocline was relatively deep compared to climatology (as a consequence of the presence of the Atlantic Niño), and chl a levels were likewise relatively low. A shallower nitracline together with a shallower EUC (Tuchen et al., 2024) during the second peak in boreal winter might have favored the growth of the phytoplankton assemblage showing anomalously high chl a levels. These variations with respect to the climatological cycle are in agreement with what was proposed by Grodsky et al. (2008) that the interannual variability of the secondary bloom in boreal winter is as large as those of the primary bloom in boreal summer, even though its climatological expression is weaker.
Another process affecting local productivity at the equator is intraseasonal TIWs with a 20–50 d period range as indicated by the bandpass-filtered SST and chl a anomalies. In this study, elevated primary production was located between 10–25° W in a region affected by TIWs. Their occurrence strongly suggests that TIWs might influence the biogeochemistry of the equatorial upper-ocean system. On the one hand, TIWs are associated with meridional currents at the equator modulating the boundary of the Atlantic cold tongue eventually resulting in local variations of SST and chl a. On the other hand, TIWs are associated with phases of enhanced mixing (Foltz et al., 2020; Heukamp et al., 2022; Inoue et al., 2019; Moum et al., 2009) or front generation (Warner et al., 2018) leading to upward nutrient supply. It has been suggested that TIWs could enhance upper-ocean fertilization by promoting local nitrate upwelling alleviating the nitrate depletion which usually affects this region (Radenac et al., 2020; Sherman et al., 2022). Enhanced chlorophyll concentration has been associated with TIWs suggesting that TIWs drive intraseasonal chl a variability (Grodsky et al., 2008; Menkes et al., 2002; Shi and Wang, 2021). Pronounced positive and negative anomalies in bandpass-filtered chl a data were anti-correlated with anomalies in bandpass-filtered positive SST anomalies. The SST anomalies were moderate during the secondary bloom in boreal winter, accompanied by a shallower thermocline. However, during that period, a pronounced chl a bloom was observed together with the largest bandpass-filtered chl a anomalies.
In brief, the development of the cold tongue during boreal summer, the secondary cooling during boreal winter, and the presence of TIWs in the equatorial Atlantic exert major controls on the surface ocean hydrographic characteristics and biogeochemistry on intraseasonal to seasonal time scales. We suggest that the combination of seasonal thermocline upwelling and TIWs was responsible for the observed enhanced chl a signals indicating enhanced variability of primary productivity. Therefore, we can examine their impact on particulate matter build up and export.
4.2 Upwelling events translate into size-differentiated enhanced export from the mixed layer
The timing of the two upwelling events which lead to chl a accumulation is consistent with the objective detection of two peaks in the MaP concentration. Both MiP and MaP in top 100 m are correlated to the in situ chl a biomass suggesting that the primary producers provided the elemental particles for the two size classes of marine snow aggregates. Stronger correlation with MiP than with MaP may indicate that MaP are formed with a delay through the transformation of MiP by aggregation. This is also supported by Lagrangian chl a which is more correlated with MiP and MaP (for the same advective time scale of 10 to 15 d) than with concomitant in situ chl a biomass. This time scale is consistent with particle aggregation by coagulation of phytoplankton cells followed by the export of aggregates (Burd and Jackson, 2009; Jackson, 1990). Correlation between Lagrangian chl a and MiP emphasizes that MiP are also built up with time.
More comprehensive understanding of pelagic functioning can arise from the identification of marine snow morphotypes (Trudnowska et al., 2021). Fiber Particles (FP) , Small Dense particles (SDP), and Small Porous Particles (SPP) in the epipelagial were significantly correlated with chl a while no significant correlation was observed for BDP and BPP. This means that both fiber and porous aggregates might be of phytoplanktonic origin. Elongated or porous particles in the surface layer, for example, can result from phytoplankton colonies such as diatom chains or Trichodesmium colonies (Dupouy et al., 2018; Villareal et al., 2011) (Fig. S10 in the Supplement). These diatoms were mostly detected during event 1 in our study, their presence increases in conditions of high export systems (Henson et al., 2019). Porous aggregates might be associated with the accumulation of phytoplankton biomass. When the bloom is massive enough to enhance aggregation, small porous aggregates are precursors of bigger ones. As for dense particles, they could be potential fecal pellets produced by zooplankton's feeding as generally found in other studies (Stemmann and Boss, 2012; Trudnowska et al., 2021), but they could also originate from other sources such as aggregated phytoplankton or phytodetritus (Alldrege and Silver, 1988; Guidi et al., 2009).
All morphotypes, particle size classes and POC flux were significantly correlated with Lagrangian vorticity and divergence highlighting that physical dynamics of the upper ocean (such as up- and downwelling) leading to primary production were the primary control in particle production and transformations. In their paper, Siegel et al. (2025) found that turbulence levels close to the surface tend to favor smaller particle sizes and increase fragmentation while turbulence near the base of the mixed layer encourages coagulation and the formation of larger particles.
POC production is associated with phytoplankton production which ultimately influences the export flux. To investigate the ratio of POC flux leaving the euphotic zone, we calculated the export efficiency ratio at 100 m during and outside of the events. The export efficiency (e-ratio) was 6 %–7 % and fell within the global average e-ratio range (Bam et al., 2023 and references within). These values suggest that strong remineralization occurs in surface waters, aligning with existing literature (Clements et al., 2022). The same e-ratio during and outside of events highlights the stability of the export efficiency of the equatorial system. One of the hypotheses explaining this stability is the distribution and contribution of the morphotypes during and outside of export events. During and before export events, all five morphotypes were detected, with proportions varying with depth. This suggests that within our observation period, the equatorial region, during or before export events, possesses a similar phytoplanktonic bloom behavior leading to the same marine snow morphotypes which might explain the similar behavior of the biological pump. This is in contrast with what was observed for the Arctic system, where two successive blooms of different nature occur and are associated with different morphotypes. The first bloom was an ice edge bloom and was dominated by diatoms, while the second was ice free and was associated with the presence of Phaeocystis leading to agglomerated morphotypes and their slow settling compared to the first bloom (Trudnowska et al., 2021). These differences in morphotypes reflect not only contrasting environmental conditions between the Arctic and equatorial Atlantic, but also distinct bloom successions and morpho dynamic responses, supporting the idea that regional ecosystem characteristics shape marine snow structure and its role in export processes.
Another hypothesis for the stability of the system might be related to the tight coupling between primary production and export. In this study, the lag between PP and particle production was estimated to be 10–15 d, corresponding to a similarly short lag determined by Henson et al. (2015) usually found in upwelling regions. This lag increases with the increase of seasonality and also affects the seasonality of the eeff (Henson et al., 2015). In our case, the same eeff highlights the low seasonality of the carbon pump in the equatorial system: producers and grazers are tightly coupled due to the low seasonality in PP and export (Owens et al., 2015). This coupling might be due to the combination of euphotic-zone irradiance and the supply of nutrients: strong light penetration combined with the energetic intraseasonal variability of the system bringing nutrients to the surface (Menkes et al., 2002), allows producers to be present all year long in the surface layer. Further studies on the dynamics and composition of detrital particles in bloom situations, in combination with planktonic measurements, are necessary to understand surface dynamics of particle formation and export.
4.3 Deep particle sequestration is driven by compact particles
Particle production within the upper 100 m led to the formation of sinking plumes reaching down to 2000 m of depth. Although particle concentrations were higher during export events, the vertical carbon flux, within and outside the plumes followed the general asymptotic shape characteristic of particle flux observations, with rapid attenuation in the surface layer transitioning to a more gradual decrease in the bathypelagic layer. This was also true for the MiP and MaP abundances. More likely, the observed general decrease in small and big particles is driven by biological processes such as degradation and aggregation. Yool et al. (2013), using a biogeochemical model, attributed the flux of particles at deep depths of the ocean to MaPs. However, Kiko et al. (2017) found an abundance of MiPs in the bathypelagic zone that can be observed down to the sea floor. They suggest that shedding and other disaggregation processes might result in a more effective export of particulate matter, both actively and passively. We suggest that their presence in the meso- and bathypelagic layer highlights both their important roles in contributing to the flux. The difference in flux amplitude inside versus outside of the plumes, along with the higher particle concentration within the plumes, suggests a seasonal pulse in flux to the deep sea, as previously described by Beaulieu (2002). This rapid and deep flux is mainly associated with bloom events, consistent with earlier observations of flux events(flux at 3000 m, 2.07 ) reaching depths of up to 4000 m (Beaulieu, 2002; Kiko et al., 2017; Lampitt et al., 1993).
We combined the quantitative analysis of particle mass distribution with particle image analysis to investigate the nature of particles exported to deeper layers. In this study, SDP were more deeply exported compared to other morphotypes, indicating that most of the MaP abundance found at depth is dominated by small dense particles. This trend toward more circular and less elongated aggregates with increasing depth confirms prior research (Drago, 2023; Trudnowska et al., 2021; Accardo et al., 2025; Soviadan et al., 2024). SDP vertical profiles also showed a particle maximum between 450 and 800 m as found by Kiko et al. (2017) and Siegel et al. (2025), unlike the rest of the morphotypes which attenuated with depth. The observed increase in small particles is more likely driven by diel vertical migrations of zooplankton that actively exports organic material to depth (Hidaka et al., 2001; Turner, 2015). Most of the float profiles were conducted during the night (approximately 50 %), which further supports the interpretation that the increased abundance of small dense particles at depth is linked to nocturnal zooplankton migration. This can be confirmed by the increase of zooplankton for all periods between 300–600 m (Fig. S11 in the Supplement) coinciding with the depth of increase of dense particles and the upper limit of zooplankton migration depth extracted from shipboard ADCP data (shown in Fig. S11) and the range mentioned in Kiko et al. (2017) and Bianchi and Mislan, (2016). Kiko et al. (2017) also found a particle maximum between 300 and 600 m in the equatorial Atlantic and attributed it to migrating zooplankton. Food ingested near the surface is carried downward in the guts of migrating zooplankton to be egested, eaten by consumers of zooplankton, or metabolized at depth (Packard and Gómez, 2013). Model studies suggest that zooplankton diel vertical migration might account for 10 %–30 % of the total vertical flux of carbon downward from epipelagic layers (Bianchi et al., 2013), enhancing the efficiency of carbon export (Gorgues et al., 2019) through the generation of fecal pellets which can be incorporated in marine snow. Kiko et al. (2020) found that gut flux and mortality might make up about 30 %–40 % of particulate matter supply to the 300–600 m depth layer in the eastern tropical North Atlantic and that the amount of carbon supplied via these mechanisms could suffice to generate a flux and particle increase.
Because our study includes periods of both high and low export, we aimed to assess the flux attenuation rate by calculating the transfer efficiency for different periods. The transfer efficiency was estimated using flux at depths of 100 and 1000 m. Although our export reached depths of 2000 m, we selected the 1000 m layer due to the relatively small reduction in POC flux with increasing depth, as noted by François et al. (2002). Teff values obtained in our study indicate a high efficiency of the biological pump with up to 40 % of the organic material exported at 100 m also reaching 1000 m, regardless of the conditions. This means that despite seasonal variation in primary production and carbon flux during and outside of export events, the biological pump exhibits a consistent response in the equatorial region, rendering it a predictable system. The b values calculated (around 0.5) show a low attenuation rate of the computed POC flux, suggesting that part of the particulate matter exported at the equator and undergoes little further remineralization at mesopelagic depths (Henson et al., 2015; Omand et al., 2015). Global studies showcased the seasonal and regional variability in the exponent b and showed values around 0.7 in Guidi et al. (2015) and 0.6 in Henson et al. (2012) for the tropical equatorial region. The consistent low e-ratio associated with high Teff aligns with the pattern proposed by Guidi et al. (2015) and Henson et al. (2012). This means that deeper particle injection and rapid sinking result in longer carbon sequestration as the time a given water parcel needs to travel from the ocean interior to the surface increases with depth.
For the first time, we characterized the distribution of particles within an export plume, and offered a morphological description of exported particles using in situ imaging. The comparisons made with previous studies for the e-ratio and the transfer efficiency show that opting for the plume method yields more accurate results and a more comprehensive understanding of the fate of particles along their progression into deeper layers (Table S1 in the Supplement).
The integration of the UVP on an Argo float has allowed us to study the temporal variability and the dynamics of the BCP. Our study follows the particle dynamics along the water column in the equatorial Atlantic region between July 2021 and March 2022 including the strong 2021 Atlantic Niño event, using the plume method and a novel BGC-Argo/UVP6 dataset. Ocean dynamics in the equatorial system exhibit a seasonal cycle with a decrease in temperature during boreal summer and winter leading to the presence of two distinct blooms. These blooms are characterized by significant export events reaching depths of 2000 m. The production and export of carbon during that year was dampened because of the strong Atlantic Niño event during boreal summer 2021. Detritus were classified into five distinct morphotypes based on morphological variables. In surface waters, marine snow is dominated by porous aggregates and fibers while deeper layers primarily receive big and small dense particles during export events. Unlike most of the morphotypes decreasing with depth, dense particles show an increase between 300–600 m. Zooplankton diel vertical migration might play a role in the generation of a particle maximum at intermediate layers consisting of the small dense cluster. The equatorial region acts as a stable export system throughout all periods observed, with an export efficiency steadily ranging between 6 %–7 % probably due to the short lag between the primary production and the export and the same morphotype composition along the year. Regardless of the initial conditions, 30 %–40 % of the flux at 100 m is exported to 1000 m. Such consistency highlights the equilibrium inherent in the equatorial region's carbon dynamics along the float trajectory during this special event, providing further context to the observed patterns of carbon and particle export. Moreover, it underscores the necessity for additional observations to ascertain whether the system is truly stable over the long term. This study contributes to a deeper understanding of the intricacies of carbon cycling in equatorial waters using autonomous vehicle-derived estimates of particle fluxes. By elucidating the role of export events and different particle morphotypes, we underscore the significance of these factors in shaping the equatorial biological pump. The successful combination of the UVP6 with other float sensors and the development of a continuous monitoring strategy will provide insights that were previously unattainable with sparse and temporally limited shipboard and moored sediment trap observations.
The codes used post-data treatment are available on this GitHub repository: https://github.com/joellehabib/Floatpaper.git (last access: 30 October 2025; DOI: https://doi.org/10.5281/zenodo.17584543, Habib, 2025).
The sea surface temperature data is available on the NOAA website at: https://psl.noaa.gov/data/gridded/data.noaa.oisst.v2.highres.htm (last access: 17 October 2025). Float data are available at https://argo.ucsd.edu (last access: 7 October 2025). Data used in this manuscript for the carbon flux and particle concentrations are available online using the following DOI: https://doi.org/10.5281/zenodo.14007570 (Habib et al., 2024). Further data can be made available by the authors upon request.
The supplement related to this article is available online at https://doi.org/10.5194/bg-22-7985-2025-supplement.
JH, RK, and LS developed the study's concept. RK, LS, JH, FPT, PB, and AB contributed to data acquisition; RK, LS, JH, PB, AA, AB, and FPT contributed substantially to the data analysis; JH wrote the initial version of the paper. All authors contributed substantially to drafting the manuscript. All authors approved the final submitted manuscript.
The contact author has declared that none of the authors has any competing interests.
Publisher's note: Copernicus Publications remains neutral with regard to jurisdictional claims made in the text, published maps, institutional affiliations, or any other geographical representation in this paper. While Copernicus Publications makes every effort to include appropriate place names, the final responsibility lies with the authors. Views expressed in the text are those of the authors and do not necessarily reflect the views of the publisher.
We thank the crews, scientists, and technicians involved in the deployment and recovery of the Argo float during RV Sonne cruise SO284 and PIRATA FR32 cruise with RV Thalassa.
The study was supported by EU H2020 under grant agreement 817578 TRIATLAS project. Rainer Kiko acknowledges support via a Make Our Planet Great Again grant from the French National Research Agency (ANR) within the Programme d’Investissements d’Avenir #ANR-19-MPGA-0012 and funding from the Heisenberg Programme of the German Science Foundation #KI 1387/5-1. We acknowledge financial support of the Federal Maritime and Hydrographic Agency, Germany for the float acquisition and satellite data transmission.
This paper was edited by Jack Middelburg and reviewed by two anonymous referees.
Accardo, A., Laxenaire, R., Baudena, A., Speich, S., Kiko, R., and Stemmann, L.: Intense and localized export of selected marine snow types at eddy edges in the South Atlantic Ocean, Biogeosciences, 22, 1183–1201, https://doi.org/10.5194/bg-22-1183-2025, 2025.
Alldredge, A. L. and Silver, M. W.: Characteristics, dynamics and significance of marine snow, Prog. Oceanogr., 20, 41–82, https://doi.org/10.1016/0079-6611(88)90053-5, 1988.
Armstrong, R. A., Lee, C., Hedges, J. I., Honjo, S., and Wakeham, S. G.: A new, mechanistic model for organic carbon fluxes in the ocean based on the quantitative association of POC with ballast minerals, Deep Sea Res. Part II Top. Stud. Oceanogr., 49, 219–236, https://doi.org/10.1016/S0967-0645(01)00101-1, 2001.
Athie, G. and Marin, F.: Cross-equatorial structure and temporal modulation of intraseasonal variability at the surface of the Tropical Atlantic Ocean, J. Geophys. Res., 113, C08020, https://doi.org/10.1029/2007JC004332, 2008.
Bach, L. T., Stange, P., Taucher, J., Achterberg, E. P., Algueró-Muñiz, M., Horn, H., Esposito, M., and Riebesell, U.: The Influence of Plankton Community Structure on Sinking Velocity and Remineralization Rate of Marine Aggregates, Glob. Biogeochem. Cycles, 33, 971–994, https://doi.org/10.1029/2019GB006256, 2019.
Bam, W., Gasser, B., Maiti, K., Levy, I., Miquel, J. C., Hansman, R. L., Scholten, J., Xie, R. C., Sommer, S., Kiko, R., and Swarzenski, P. W.: Particulate organic carbon export fluxes estimates by 234Th238U disequilibrium in the oxygen minimum zone off the Peruvian coast, Mar. Chem., 257, 104325, https://doi.org/10.1016/j.marchem.2023.104325, 2023.
Baudena, A., Ser-Giacomi, E., D'Onofrio, D., Capet, X., Cotté, C., Cherel, Y., and D'Ovidio, F.: Fine-scale structures as spots of increased fish concentration in the open ocean, Sci. Rep., 11, 15805, https://doi.org/10.1038/s41598-021-94368-1, 2021.
Baudena, A., Laxenaire, R., Catalano, C., Ioannou, A., Leymarie, E., Picheral, M., Poteau, A., Speich, S., Stemmann, L., and Kiko, R.: A Lagrangian perspective reveals the carbon and oxygen budget of an oceanic eddy, Commun. Earth Environ., 6, 318, https://doi.org/10.1038/s43247-025-02262-9, 2025.
Beaulieu, S. E.: Accumulation and fate of phytodetritus on the sea floor, Oceanogr. Mar. Biol., 40, 179–217, 2002.
Bernardello, R., Marinov, I., Palter, J. B., Sarmiento, J. L., Galbraith, E. D., and Slater, R. D.: Response of the Ocean Natural Carbon Storage to Projected Twenty-First-Century Climate Change, J. Climate, 27, 2033–2053, https://doi.org/10.1175/JCLI-D-13-00343.1, 2014.
Bianchi, D. and Mislan, K. A. S.: Global patterns of diel vertical migration times and velocities from acoustic data, Limnol. Oceanogr., 61, 353–364, https://doi.org/10.1002/lno.10219, 2016.
Bianchi, D., Galbraith, E. D., Carozza, D. A., Mislan, K. A. S., and Stock, C. A.: Intensification of open-ocean oxygen depletion by vertically migrating animals, Nat. Geosci., 6, 545–548, https://doi.org/10.1038/ngeo1837, 2013.
Bianchi, D., Weber, T. S., Kiko, R., and Deutsch, C.: Global niche of marine anaerobic metabolisms expanded by particle microenvironments, Nat. Geosci., 11, 263–268, https://doi.org/10.1038/s41561-018-0081-0, 2018.
Biddanda, B. and Pomeroy, L.: Microbial aggregation and degradation of phytoplankton-derived detritus in seawater. I. Microbial succession, Mar. Ecol. Prog. Ser., 42, 79–88, https://doi.org/10.3354/meps042079, 1988.
Bopp, L., Resplandy, L., Orr, J. C., Doney, S. C., Dunne, J. P., Gehlen, M., Halloran, P., Heinze, C., Ilyina, T., Séférian, R., Tjiputra, J., and Vichi, M.: Multiple stressors of ocean ecosystems in the 21st century: projections with CMIP5 models, Biogeosciences, 10, 6225–6245, https://doi.org/10.5194/bg-10-6225-2013, 2013.
Boyd, P. W., Claustre, H., Levy, M., Siegel, D. A., and Weber, T.: Multi-faceted particle pumps drive carbon sequestration in the ocean, Nature, 568, 327–335, https://doi.org/10.1038/s41586-019-1098-2, 2019.
Brandt, P., Caniaux, G., Bourlès, B., Lazar, A., Dengler, M., Funk, A., Hormann, V., Giordani, H., and Marin, F.: Equatorial upper-ocean dynamics and their interaction with the West African monsoon, Atmospheric Sci. Lett., 12, 24–30, https://doi.org/10.1002/asl.287, 2011.
Brandt, P., Alory, G., Awo, F. M., Dengler, M., Djakouré, S., Imbol Koungue, R. A., Jouanno, J., Körner, M., Roch, M., and Rouault, M.: Physical processes and biological productivity in the upwelling regions of the tropical Atlantic, Ocean Sci., 19, 581–601, https://doi.org/10.5194/os-19-581-2023, 2023.
Brandt, P., Körner, M., Moum, J. N., Roch, M., Subramaniam, A., Czeschel, R., Krahmann, G., Dengler, M., and Kiko, R.: Seasonal productivity of the equatorial Atlantic shaped by distinct wind-driven processes, Nat. Geosci., 18, 84–90, https://doi.org/10.1038/s41561-024-01609-9, 2025.
Briggs, N., Perry, M. J., Cetinić, I., Lee, C., D'Asaro, E., Gray, A. M., and Rehm, E.: High-resolution observations of aggregate flux during a sub-polar North Atlantic spring bloom, Deep Sea Res. Part Oceanogr. Res. Pap., 58, 1031–1039, https://doi.org/10.1016/j.dsr.2011.07.007, 2011.
Briggs, N., Dall'Olmo, G., and Claustre, H.: Major role of particle fragmentation in regulating biological sequestration of CO2 by the oceans, Science, 367, 791–793, https://doi.org/10.1126/science.aay1790, 2020.
Buesseler, K. O., Lamborg, C. H., Boyd, P. W., Lam, P. J., Trull, T. W., Bidigare, R. R., Bishop, J. K. B., Casciotti, K. L., Dehairs, F., Elskens, M., Honda, M., Karl, D. M., Siegel, D. A., Silver, M. W., Steinberg, D. K., Valdes, J., Van Mooy, B., and Wilson, S.: Revisiting Carbon Flux Through the Ocean's Twilight Zone, Science, 316, 567–570, https://doi.org/10.1126/science.1137959, 2007.
Buesseler, K. O., Boyd, P. W., Black, E. E., and Siegel, D. A.: Metrics that matter for assessing the ocean biological carbon pump, Proc. Natl. Acad. Sci. USA, 117, 9679–9687, https://doi.org/10.1073/pnas.1918114117, 2020.
Burd, A. B. and Jackson, G. A.: Particle Aggregation, Annu. Rev. Mar. Sci., 1, 65–90, https://doi.org/10.1146/annurev.marine.010908.163904, 2009.
Cael, B. B., Cavan, E. L., and Britten, G. L.: Reconciling the Size-Dependence of Marine Particle Sinking Speed, Geophys. Res. Lett., 48, e2020GL091771, https://doi.org/10.1029/2020GL091771, 2021.
Claustre, H., Johnson, K. S., and Takeshita, Y.: Observing the Global Ocean with Biogeochemical-Argo, Annu. Rev. Mar. Sci., 12, 23–48, https://doi.org/10.1146/annurev-marine-010419-010956, 2020.
Clements, D. J., Yang, S., Weber, T., McDonnell, A. M. P., Kiko, R., Stemmann, L., and Bianchi, D.: Constraining the Particle Size Distribution of Large Marine Particles in the Global Ocean With In Situ Optical Observations and Supervised Learning, Glob. Biogeochem. Cycles, 36, e2021GB007276, https://doi.org/10.1029/2021GB007276, 2022.
Clements, D. J., Yang, S., Weber, T., McDonnell, A. M. P., Kiko, R., Stemmann, L., and Bianchi, D.: New Estimate of Organic Carbon Export From Optical Measurements Reveals the Role of Particle Size Distribution and Export Horizon, Glob. Biogeochem. Cycles, 37, e2022GB007633, https://doi.org/10.1029/2022GB007633, 2023.
De Boyer Montégut, C., Madec, G., Fischer, A. S., Lazar, A., and Iudicone, D.: Mixed layer depth over the global ocean: An examination of profile data and a profile-based climatology, J. Geophys. Res.-Oceans, 109, 2004JC002378, https://doi.org/10.1029/2004JC002378, 2004.
de La Rocha, C. L. and Passow, U.: The biological pump, in: Treatise on Geochemistry, 2nd Edn., vol. 6, edited by: Holland, H. D. and Turekian, K. K., Elsevier, Amsterdam, 83–111, ISBN 978-0-08-045101-5, 2006.
DeVries, T., Primeau, F., and Deutsch, C.: The sequestration efficiency of the biological pump, Geophys. Res. Lett., 39, 2012GL051963, https://doi.org/10.1029/2012GL051963, 2012.
Dilling, L. and Alldredge, A. L.: Fragmentation of marine snow by swimming macrozooplankton: A new process impacting carbon cycling in the sea, Deep Sea Res. Part Oceanogr. Res. Pap., 47, 1227–1245, https://doi.org/10.1016/S0967-0637(99)00105-3, 2000.
Drago, L.: Analyse globale de la pompe à carbone biologique à partir de données en imagerie quantitative, PhD thesis, Sorbonne Université, Paris, https://theses.hal.science/tel-04483392 (last access: 5 December 2025), 2023.
Dupouy, C., Frouin, R., Tedetti, M., Maillard, M., Rodier, M., Lombard, F., Guidi, L., Picheral, M., Neveux, J., Duhamel, S., Charrière, B., and Sempéré, R.: Diazotrophic Trichodesmium impact on UV–Vis radiance and pigment composition in the western tropical South Pacific, Biogeosciences, 15, 5249–5269, https://doi.org/10.5194/bg-15-5249-2018, 2018.
Engel, A., Cisternas-Novoa, C., Hauss, H., Kiko, R., and Le Moigne, F. A. C.: Hypoxia-tolerant zooplankton may reduce biological carbon pump efficiency in the Humboldt current system off Peru, Commun. Earth Environ., 4, 458, https://doi.org/10.1038/s43247-023-01140-6, 2023.
Fabri-Ruiz, S., Baudena, A., Moullec, F., Lombard, F., Irisson, J.-O., and Pedrotti, M. L.: Mistaking plastic for zooplankton: Risk assessment of plastic ingestion in the Mediterranean sea, Sci. Total Environ., 856, 159011, https://doi.org/10.1016/j.scitotenv.2022.159011, 2023.
Fischer, G., Ratmeyer, V., and Wefer, G.: Organic carbon fluxes in the Atlantic and the Southern Ocean: relationship to primary production compiled from satellite radiometer data, Deep-Sea Res. Pt. II, 47, 1961–1997, https://doi.org/10.1016/S0967-0645(00)00013-8, 2000.
Foltz, G. R., Hummels, R., Dengler, M., Perez, R. C., and Araujo, M.: Vertical Turbulent Cooling of the Mixed Layer in the Atlantic ITCZ and Trade Wind Regions, J. Geophys. Res.-Oceans, 125, e2019JC015529, https://doi.org/10.1029/2019JC015529, 2020.
Forest, A., Babin, M., Stemmann, L., Picheral, M., Sampei, M., Fortier, L., Gratton, Y., Bélanger, S., Devred, E., Sahlin, J., Doxaran, D., Joux, F., Ortega-Retuerta, E., Martín, J., Jeffrey, W. H., Gasser, B., and Carlos Miquel, J.: Ecosystem function and particle flux dynamics across the Mackenzie Shelf (Beaufort Sea, Arctic Ocean): an integrative analysis of spatial variability and biophysical forcings, Biogeosciences, 10, 2833–2866, https://doi.org/10.5194/bg-10-2833-2013, 2013.
Fox, J. E., Behrenfeld, M., Halsey, K. H., and Graff, J.: Global estimates of particulate organic carbon from the surface ocean to the base of the mesopelagic, https://doi.org/10.22541/essoar.171017314.40658424/v1, 11 March 2024.
François, R., Honjo, S., Krishfield, R., and Manganini, S.: Factors controlling the flux of organic carbon to the bathypelagic zone of the ocean, Glob. Biogeochem. Cycles, 16, 1087–1107, https://doi.org/10.1029/2001GB001722, 2002.
Giering, S. L. C., Sanders, R., Lampitt, R. S., Anderson, T. R., Tamburini, C., Boutrif, M., Zubkov, M. V., Marsay, C. M., Henson, S. A., Saw, K., Cook, K., and Mayor, D. J.: Reconciliation of the carbon budget in the ocean's twilight zone, Nature, 507, 480–483, https://doi.org/10.1038/nature13123, 2014.
Gorgues, T., Aumont, O., and Memery, L.: Simulated Changes in the Particulate Carbon Export Efficiency due to Diel Vertical Migration of Zooplankton in the North Atlantic, Geophys. Res. Lett., 46, 5387–5395, https://doi.org/10.1029/2018GL081748, 2019.
Grodsky, S. A., Carton, J. A., and McClain, C. R.: Variability of upwelling and chlorophyll in the equatorial Atlantic, Geophys. Res. Lett., 35, L03610, https://doi.org/10.1029/2007GL032466, 2008.
Guidi, L., Jackson, G. A., Stemmann, L., Miquel, J. C., Picheral, M., and Gorsky, G.: Relationship between particle size distribution and flux in the mesopelagic zone, Deep Sea Res. Part Oceanogr. Res. Pap., 55, 1364–1374, https://doi.org/10.1016/j.dsr.2008.05.014, 2008.
Guidi, L., Stemmann, L., Jackson, G. A., Ibanez, F., Claustre, H., Legendre, L., Picheral, M., and Gorskya, G.: Effects of phytoplankton community on production, size, and export of large aggregates: A world-ocean analysis, Limnol. Oceanogr., 54, 1951–1963, https://doi.org/10.4319/lo.2009.54.6.1951, 2009.
Guidi, L., Legendre, L., Reygondeau, G., Uitz, J., Stemmann, L., and Henson, S. A.: A new look at ocean carbon remineralization for estimating deepwater sequestration, Glob. Biogeochem. Cycles, 29, 1044–1059, https://doi.org/10.1002/2014GB005063, 2015.
Habib, J.: Marine snow surface production and bathypelagic export at the Equatorial Atlantic from an imaging float, Zenodo [code], https://doi.org/10.5281/zenodo.17584543, 2025.
Habib, J., Stemmann, L., Accardo, A., Baudena, A., Tuchen, F. P., Peter, B., and Kiko, R.: Marine snow surface production and bathypelagic export at the Equatorial Atlantic from an imaging float, Zenodo [data set], https://doi.org/10.5281/zenodo.14007570, 2024.
Henson, S., Le Moigne, F., and Giering, S.: Drivers of Carbon Export Efficiency in the Global Ocean, Glob. Biogeochem. Cycles, 33, 891–903, https://doi.org/10.1029/2018GB006158, 2019.
Henson, S. A., Sanders, R., and Madsen, E.: Global patterns in efficiency of particulate organic carbon export and transfer to the deep ocean, Glob. Biogeochem. Cycles, 26, GB1028, https://doi.org/10.1029/2011GB004099, 2012.
Henson, S. A., Yool, A., and Sanders, R.: Variability in efficiency of particulate organic carbon export: A model study, Glob. Biogeochem. Cycles, 29, 33–45, https://doi.org/10.1002/2014GB004965, 2015.
Hernández-Carrasco, I., Orfila, A., Rossi, V., and Garçon, V.: Effect of small scale transport processes on phytoplankton distribution in coastal seas, Sci. Rep., 8, 8613, https://doi.org/10.1038/s41598-018-26857-9, 2018.
Heukamp, F. O., Brandt, P., Dengler, M., Tuchen, F. P., McPhaden, M. J., and Moum, J. N.: Tropical Instability Waves and Wind-Forced Cross-Equatorial Flow in the Central Atlantic Ocean, Geophys. Res. Lett., 49, e2022GL099325, https://doi.org/10.1029/2022GL099325, 2022.
Hidaka, K., Kawaguchi, K., Murakami, M., and Takahashi, M.: Downward transport of organic carbon by diel migratory micronekton in the western equatorial Pacific: its quantitative and qualitative importance, Deep-Sea Res. Pt. I, 48, 1923–1939, https://doi.org/10.1016/S0967-0637(01)00003-6, 2001.
Huang, B., Liu, C., Banzon, V., Freeman, E., Graham, G., Hankins, B., Smith, T., and Zhang, H.-M.: Improvements of the Daily Optimum Interpolation Sea Surface Temperature (DOISST) Version 2.1, J. Climate, 34, 2923–2939, https://doi.org/10.1175/JCLI-D-20-0166.1, 2021.
Hummels, R., Dengler, M., and Bourlès, B.: Seasonal and regional variability of upper ocean diapycnal heat flux in the Atlantic cold tongue, Prog. Oceanogr., 111, 52–74, https://doi.org/10.1016/j.pocean.2012.11.001, 2013.
Inoue, R., Lien, R., Moum, J. N., Perez, R. C., and Gregg, M. C.: Variations of Equatorial Shear, Stratification, and Turbulence Within a Tropical Instability Wave Cycle, J. Geophys. Res.-Oceans, 124, 1858–1875, https://doi.org/10.1029/2018JC014480, 2019.
Irigoien, X., Klevjer, T. A., Røstad, A., Martinez, U., Boyra, G., Acuña, J. L., Bode, A., Echevarria, F., Gonzalez-Gordillo, J. I., Hernandez-Leon, S., Agusti, S., Aksnes, D. L., Duarte, C. M., and Kaartvedt, S.: Large mesopelagic fishes biomass and trophic efficiency in the open ocean, Nat. Commun., 5, 3271, https://doi.org/10.1038/ncomms4271, 2014.
Jackson, G. A.: A model of the formation of marine algal flocs by physical coagulation processes, Deep Sea Res. Part Oceanogr. Res. Pap., 37, 1197–1211, https://doi.org/10.1016/0198-0149(90)90038-W, 1990.
Jouanno, J., Marin, F., Du Penhoat, Y., Sheinbaum, J., and Molines, J.-M.: Seasonal heat balance in the upper 100 m of the equatorial Atlantic Ocean, J. Geophys. Res., 116, C09003, https://doi.org/10.1029/2010JC006912, 2011.
Kiko, R., Biastoch, A., Brandt, P., Cravatte, S., Hauss, H., Hummels, R., Kriest, I., Marin, F., McDonnell, A. M. P., Oschlies, A., Picheral, M., Schwarzkopf, F. U., Thurnherr, A. M., and Stemmann, L.: Biological and physical influences on marine snowfall at the equator, Nat. Geosci., 10, 852–858, https://doi.org/10.1038/ngeo3042, 2017.
Kiko, R., Brandt, P., Christiansen, S., Faustmann, J., Kriest, I., Rodrigues, E., Schütte, F., and Hauss, H.: Zooplankton-Mediated Fluxes in the Eastern Tropical North Atlantic, Front. Mar. Sci., 7, 358, https://doi.org/10.3389/fmars.2020.00358, 2020.
Kiko, R., Picheral, M., Antoine, D., Babin, M., Berline, L., Biard, T., Boss, E., Brandt, P., Carlotti, F., Christiansen, S., Coppola, L., de la Cruz, L., Diamond-Riquier, E., Durrieu de Madron, X., Elineau, A., Gorsky, G., Guidi, L., Hauss, H., Irisson, J.-O., Karp-Boss, L., Karstensen, J., Kim, D., Lekanoff, R. M., Lombard, F., Lopes, R. M., Marec, C., McDonnell, A. M. P., Niemeyer, D., Noyon, M., O'Daly, S. H., Ohman, M. D., Pretty, J. L., Rogge, A., Searson, S., Shibata, M., Tanaka, Y., Tanhua, T., Taucher, J., Trudnowska, E., Turner, J. S., Waite, A., and Stemmann, L.: A global marine particle size distribution dataset obtained with the Underwater Vision Profiler 5, Earth Syst. Sci. Data, 14, 4315–4337, https://doi.org/10.5194/essd-14-4315-2022, 2022.
Klaas, C. and Archer, D. E.: Association of sinking organic matter with various types of mineral ballast in the deep sea: Implications for the rain ratio, Glob. Biogeochem. Cycles, 16, https://doi.org/10.1029/2001gb001765, 2002.
Koestner, D., Stramski, D., and Reynolds, R. A.: A Multivariable Empirical Algorithm for Estimating Particulate Organic Carbon Concentration in Marine Environments From Optical Backscattering and Chlorophyll-a Measurements, Front. Mar. Sci., 9, 941950, https://doi.org/10.3389/fmars.2022.941950, 2022.
Kriest, I.: Different parameterizations of marine snow in a 1D-model and their influence on representation of marine snow, nitrogen budget and sedimentation, Deep Sea Res. Part Oceanogr. Res. Pap., 49, 2133–2162, https://doi.org/10.1016/S0967-0637(02)00127-9, 2002.
Lampitt, R. S., Wishner, K. F., Turley, C. M., and Angel, M. V.: Marine snow studies in the Northeast Atlantic Ocean: distribution, composition and role as a food source for migrating plankton, Mar. Biol., 116, 689–702, https://doi.org/10.1007/BF00355486, 1993.
Lee, S., Lopez, H., Tuchen, F. P., Kim, D., Foltz, G. R., and Wittenberg, A. T.: On the Genesis of the 2021 Atlantic Niño, Geophys. Res. Lett., 50, e2023GL104452, https://doi.org/10.1029/2023GL104452, 2023.
Long, J. S., Takeshita, Y., Plant, J. N., Buzby, N., Fassbender, A. J., and Johnson, K. S.: Seasonal biases in fluorescence-estimated chlorophyll-a derived from biogeochemical profiling floats, Commun. Earth Environ., 5, 598, https://doi.org/10.1038/s43247-024-01762-4, 2024.
Longhurst, A.: Seasonal cooling and blooming in tropical oceans, Deep Sea Res. Part Oceanogr. Res. Pap., 40, 2145–2165, https://doi.org/10.1016/0967-0637(93)90095-K, 1993.
Loukos, H. and Mémery, L.: Simulation of the nitrate seasonal cycle in the equatorial Atlantic Ocean during 1983 and 1984, J. Geophys. Res.-Oceans, 104, 15549–15573, https://doi.org/10.1029/1999JC900084, 1999.
Martin, J. H., Knauer, G. A., Karl, D. M., and Broenkow, W. W.: VERTEX: carbon cycling in the northeast Pacific, Deep Sea Res. Part Oceanogr. Res. Pap., 34, 267–285, https://doi.org/10.1016/0198-0149(87)90086-0, 1987.
Menkes, C. E., Kennan, S., Flament, P., Dandonneau, Y., Masson, S., Biessy, B., Marchal, E., and Eldin, G.: A whirling ecosystem in the equatorial Atlantic, Geophys. Res. Lett., 29, 1553, https://doi.org/10.1029/2001GL014576, 2002.
Moore, C. M., Mills, M. M., Arrigo, K. R., Berman-Frank, I., Bopp, L., Boyd, P. W., Galbraith, E. D., Geider, R. J., Guieu, C., Jaccard, S. L., Jickells, T. D., La Roche, J., Lenton, T. M., Mahowald, N. M., Marañón, E., Marinov, I., Moore, J. K., Nakatsuka, T., Oschlies, A., Saito, M. A., Thingstad, T. F., Tsuda, A., and Ulloa, O.: Processes and patterns of oceanic nutrient limitation, Nat. Geosci., 6, 701–710, https://doi.org/10.1038/ngeo1765, 2013.
Moum, J. N., Lien, R.-C., Perlin, A., Nash, J. D., Gregg, M. C., and Wiles, P. J.: Sea surface cooling at the Equator by subsurface mixing in tropical instability waves, Nat. Geosci., 2, 761–765, https://doi.org/10.1038/ngeo657, 2009.
Okumura, Y. and Xie, S.-P.: Some Overlooked Features of Tropical Atlantic Climate Leading to a New Niño-Like Phenomenon, J. Climate, 19, 5859–5874, https://doi.org/10.1175/JCLI3928.1, 2006.
Olivier, L., Reverdin, G., Hasson, A., and Boutin, J.: Tropical Instability Waves in the Atlantic Ocean: Investigating the Relative Role of Sea Surface Salinity and Temperature From 2010 to 2018, J. Geophys. Res.-Oceans, 125, e2020JC016641, https://doi.org/10.1029/2020JC016641, 2020.
Omand, M. M., D'Asaro, E. A., Lee, C. M., Perry, M. J., Briggs, N., Cetinić, I., and Mahadevan, A.: Eddy-driven subduction exports particulate organic carbon from the spring bloom, Science, 348, 222–225, https://doi.org/10.1126/science.1260062, 2015.
Owens, S. A., Pike, S., and Buesseler, K. O.: Thorium-234 as a tracer of particle dynamics and upper ocean export in the Atlantic Ocean, Deep Sea Res. Part II Top. Stud. Oceanogr., 116, 42–59, https://doi.org/10.1016/j.dsr2.2014.11.010, 2015.
Packard, T. T. and Gómez, M.: Modeling vertical carbon flux from zooplankton respiration, Prog. Oceanogr., 110, 59–68, https://doi.org/10.1016/j.pocean.2013.01.003, 2013.
Picheral, M., Guidi, L., Stemmann, L., Karl, D. M., Iddaoud, G., and Gorsky, G.: The Underwater Vision Profiler 5: An advanced instrument for high spatial resolution studies of particle size spectra and zooplankton, Limnol. Oceanogr. Methods, 8, 462–473, https://doi.org/10.4319/lom.2010.8.462, 2010.
Picheral, M., Colin, S., and Irisson, J.-O.: EcoTaxa: a tool for the taxonomic classification of images, Sorbonne Université, CNRS, Institut de la Mer de Villefranche, https://ecotaxa.obs-vlfr.fr (last access: 2024), 2017.
Picheral, M., Catalano, C., Brousseau, D., Claustre, H., Coppola, L., Leymarie, E., Coindat, J., Dias, F., Fevre, S., Guidi, L., Irisson, J. O., Legendre, L., Lombard, F., Mortier, L., Penkerch, C., Rogge, A., Schmechtig, C., Thibault, S., Tixier, T., Waite, A., and Stemmann, L.: The Underwater Vision Profiler 6: an imaging sensor of particle size spectra and plankton, for autonomous and cabled platforms, Limnol. Oceanogr. Methods, 20, 115–129, https://doi.org/10.1002/lom3.10475, 2022.
Ploug, H. and Grossart, H.: Bacterial growth and grazing on diatom aggregates: Respiratory carbon turnover as a function of aggregate size and sinking velocity, Limnol. Oceanogr., 45, 1467–1475, https://doi.org/10.4319/lo.2000.45.7.1467, 2000.
Radenac, M.-H., Jouanno, J., Tchamabi, C. C., Awo, M., Bourlès, B., Arnault, S., and Aumont, O.: Physical drivers of the nitrate seasonal variability in the Atlantic cold tongue, Biogeosciences, 17, 529–545, https://doi.org/10.5194/bg-17-529-2020, 2020.
Ramondenc, S., Madeleine, G., Lombard, F., Santinelli, C., Stemmann, L., Gorsky, G., and Guidi, L.: An initial carbon export assessment in the Mediterranean Sea based on drifting sediment traps and the Underwater Vision Profiler data sets, Deep Sea Res. Part Oceanogr. Res. Pap., 117, 107–119, https://doi.org/10.1016/j.dsr.2016.08.015, 2016.
Rodionov, S. N.: A sequential algorithm for testing climate regime shifts, Geophys. Res. Lett., 31, 2004GL019448, https://doi.org/10.1029/2004GL019448, 2004.
Rodionov, S. N.: Use of prewhitening in climate regime shift detection, Geophys. Res. Lett., 33, 2006GL025904, https://doi.org/10.1029/2006GL025904, 2006.
Schott, F. A., Fischer, J., and Stramma, L.: Transports and Pathways of the Upper-Layer Circulation in the Western Tropical Atlantic, J. Phys. Oceanogr., 28, 1904–1928, https://doi.org/10.1175/1520-0485(1998)028<1904:TAPOTU>2.0.CO;2, 1998.
Ser-Giacomi, E., Baudena, A., Rossi, V., Follows, M., Clayton, S., Vasile, R., López, C., and Hernández-García, E.: Lagrangian betweenness as a measure of bottlenecks in dynamical systems with oceanographic examples, Nat. Commun., 12, 4935, https://doi.org/10.1038/s41467-021-25155-9, 2021.
Sherman, J., Subramaniam, A., Gorbunov, M. Y., Fernández-Carrera, A., Kiko, R., Brandt, P., and Falkowski, P. G.: The Photophysiological Response of Nitrogen-Limited Phytoplankton to Episodic Nitrogen Supply Associated With Tropical Instability Waves in the Equatorial Atlantic, Front. Mar. Sci., 8, 814663, https://doi.org/10.3389/fmars.2021.814663, 2022.
Shi, W. and Wang, M.: Tropical instability wave modulation of chlorophyll-a in the Equatorial Pacific, Sci. Rep., 11, 22517, https://doi.org/10.1038/s41598-021-01880-5, 2021.
Siegel, D. A., Burd, A. B., Estapa, M. L., Fields, E., Johnson, L., Passow, U., Romanelli, E., Brzezinski, M. A., Buesseler, K. O., Clevenger, S., Cetinić, I., Drago, L., Durkin, C. A., Kiko, R., Kramer, S. J., Maas, A., Omand, M., and Steinberg, D. K.: Assessing marine snow dynamics during the demise of the North Atlantic spring bloom using in situ particle imagery, Global Biogeochem. Cycles, 39, e2025GB008676, https://doi.org/10.1029/2025GB008676, 2025.
Song, Q., Tang, Y., and Aiki, H.: Dual Wave Energy Sources for the Atlantic Niño Events Identified by Wave Energy Flux in Case Studies, J. Geophys. Res.-Oceans, 128, e2023JC019972, https://doi.org/10.1029/2023JC019972, 2023.
Soviadan, Y. D., Beck, M., Habib, J., Baudena, A., Drago, L., Accardo, A., Laxenaire, R., Speich, S., Brandt, P., Kiko, R., and Stemmann, L.: Marine snow morphology drives sinking and attenuation in the ocean interior, EGUsphere [preprint], https://doi.org/10.5194/egusphere-2024-3302, 2024.
Steinberg, D. K. and Landry, M. R.: Zooplankton and the Ocean Carbon Cycle, Annu. Rev. Mar. Sci., 9, 413–444, https://doi.org/10.1146/annurev-marine-010814-015924, 2017.
Stemmann, L. and Boss, E.: Plankton and Particle Size and Packaging: From Determining Optical Properties to Driving the Biological Pump, Annu. Rev. Mar. Sci., 4, 263–290, https://doi.org/10.1146/annurev-marine-120710-100853, 2012.
Stemmann, L., Gorsky, G., Marty, J.-C., Picheral, M., and Miquel, J.-C.: Four-year study of large-particle vertical distribution (0–1000 m) in the NW Mediterranean in relation to hydrology, phytoplankton, and vertical flux, Deep Sea Res. Part II Top. Stud. Oceanogr., 49, 2143–2162, https://doi.org/10.1016/S0967-0645(02)00032-2, 2002.
Stemmann, L., Jackson, G. A., and Ianson, D.: A vertical model of particle size distributions and fluxes in the midwater column that includes biological and physical processes—Part I: model formulation, Deep Sea Res. Part Oceanogr. Res. Pap., 51, 865–884, https://doi.org/10.1016/j.dsr.2004.03.001, 2004a.
Stemmann, L., Jackson, G. A., and Gorsky, G.: A vertical model of particle size distributions and fluxes in the midwater column that includes biological and physical processes—Part II: application to a three year survey in the NW Mediterranean Sea, Deep Sea Res. Part Oceanogr. Res. Pap., 51, 885–908, https://doi.org/10.1016/j.dsr.2004.03.002, 2004b.
Tréguer, P., Bowler, C., Moriceau, B., Dutkiewicz, S., Gehlen, M., Aumont, O., Bittner, L., Dugdale, R., Finkel, Z., Iudicone, D., Jahn, O., Guidi, L., Lasbleiz, M., Leblanc, K., Levy, M., and Pondaven, P.: Influence of diatom diversity on the ocean biological carbon pump, Nat. Geosci., 11, 27–37, https://doi.org/10.1038/s41561-017-0028-x, 2018.
Trudnowska, E., Lacour, L., Ardyna, M., Rogge, A., Irisson, J. O., Waite, A. M., Babin, M., and Stemmann, L.: Marine snow morphology illuminates the evolution of phytoplankton blooms and determines their subsequent vertical export, Nat. Commun., 12, 2816, https://doi.org/10.1038/s41467-021-22994-4, 2021.
Tuchen, F. P., Perez, R. C., Foltz, G. R., Brandt, P., and Lumpkin, R.: Multidecadal Intensification of Atlantic Tropical Instability Waves, Geophys. Res. Lett., 49, e2022GL101073, https://doi.org/10.1029/2022GL101073, 2022.
Tuchen, F. P., Perez, R. C., Foltz, G. R., Brandt, P., Subramaniam, A., Lee, S., Lumpkin, R., and Hummels, R.: Modulation of Equatorial Currents and Tropical Instability Waves During the 2021 Atlantic Niño, J. Geophys. Res.-Oceans, 129, e2023JC020431, https://doi.org/10.1029/2023JC020431, 2024.
Turner, J. T.: Zooplankton fecal pellets, marine snow, phytodetritus and the ocean's biological pump, Prog. Oceanogr., 130, 205–248, https://doi.org/10.1016/j.pocean.2014.08.005, 2015.
Villareal, T. A., Adornato, L., Wilson, C., and Schoenbaechler, C. A.: Summer blooms of diatom-diazotroph assemblages and surface chlorophyll in the North Pacific gyre: A disconnect, J. Geophys. Res., 116, C03001, https://doi.org/10.1029/2010JC006268, 2011.
von Schuckmann, K., Brandt, P., and Eden, C.: Generation of tropical instability waves in the Atlantic Ocean, J. Geophys. Res.-Oceans, 113, https://doi.org/10.1029/2007JC004712, 2008.
Warner, S. J., Holmes, R. M., M. Hawkins, E. H., S. Hoecker-Martínez, M., Savage, A. C., and Moum, J. N.: Buoyant Gravity Currents Released from Tropical Instability Waves, J. Phys. Oceanogr., 48, 361–382, https://doi.org/10.1175/JPO-D-17-0144.1, 2018.
Wefer, G. and Fischer, G.: Seasonal patterns of vertical particle flux in equatorial and coastal upwelling areas of the eastern Atlantic, Deep Sea Res. Part Oceanogr. Res. Pap., 40, 1613–1645, https://doi.org/10.1016/0967-0637(93)90019-Y, 1993.
Yool, A., Popova, E. E., and Anderson, T. R.: MEDUSA-2.0: an intermediate complexity biogeochemical model of the marine carbon cycle for climate change and ocean acidification studies, Geosci. Model Dev., 6, 1767–1811, https://doi.org/10.5194/gmd-6-1767-2013, 2013.