the Creative Commons Attribution 4.0 License.
the Creative Commons Attribution 4.0 License.
 | 16 Dec 2025
Dynamics and environmental drivers of methane and nitrous oxide fluxes at the soil and ecosystem levels in a wet tropical forest
Laëtitia M. Bréchet
Mercedes Ibáñez
Robert B. Jackson
Benoît Burban
Clément Stahl
Damien Bonal
Ivan A. Janssens
Tropical forests are critical for maintaining the global carbon balance and mitigating climate change, yet their exchange of greenhouse gases with the atmosphere remains understudied, particularly for methane (CH4) and nitrous oxide (N2O). This study reports on continuous measurements of CH4 and N2O fluxes at the ecosystem and soil levels, respectively through eddy covariance and an automated chamber technique, in a wet tropical forest in French Guiana over a period of 26 months. We studied the magnitude of CH4 and N2O fluxes and their drivers (climatic variables) during the driest and wettest seasons. Seasonal ecosystem fluxes showed near-zero net CH4 uptake during the driest season and emissions during the wettest season that were larger in magnitude than the uptake. Meanwhile, N2O emissions were of similar magnitudes in both seasons. Upland soils within the footprint of the eddy covariance tower emitted N2O in both seasons, although these fluxes were particularly small. In contrast, upland soils were characterised by CH4 uptake. Overall, seasonal ecosystem and soil CH4 and N2O fluxes were partially explained by seasonal variations in soil water content, soil temperature and global radiation. The magnitude and sign of the net ecosystem fluxes of CH4 and N2O were likely due to outgassing from aboveground biomass and the presence of seasonally flooded areas within the footprint of the eddy covariance system. Further studies of other ecosystem compartments in different forest habitats are needed to better understand the temporal variations in CH4 and N2O fluxes in wet tropical forests.
- Article
(3486 KB) - Full-text XML
-
Supplement
(1914 KB) - BibTeX
- EndNote


The lack of knowledge on greenhouse gas fluxes in the tropical forests of the Amazon Basin contributes significantly to the uncertainty in the global greenhouse gas budget, particularly for methane (CH4) and nitrous oxide (N2O) (Davidson et al., 2012; Covey et al., 2021), the two most important greenhouse gases in the atmosphere after carbon dioxide (CO2). Early observations show that tropical forests in the Amazon Basin may contribute disproportionately to global CH4 and N2O exchanges compared to other forests (Tian et al., 2015), but considerable uncertainties remain due to the paucity of data and lack of detailed understanding of CH4 and N2O cycling at both soil and ecosystem levels in these forests.
The role of tropical forest soils is crucial as they can act either as a source or a sink for CH4 and N2O (Bouwman et al., 1993). In contrast to the consistent emissions from soil microbial decomposition and root activity for CO2, anaerobic CH4-emitting microbes (methanogenic archaea) are dominant in wetland environments, whereas aerobic CH4-consuming microbes (methanotrophic bacteria) are more abundant in upland soils (Ito and Inatomi, 2012; Welch et al., 2019) where they play the role of CH4 sinks. For N2O as well, both emission and uptake can occur in soils. N2O can be produced by microbes under both anaerobic (via denitrification) and aerobic (via nitrification) conditions (Khalil et al., 2004), although the majority of N2O production occurs in waterlogged soils (Oertel et al., 2016). On the other hand, soil microbes that are not denitrifiers can reduce N2O to dinitrogen (Sanford et al., 2012; Jones et al., 2014) to complete the biogeochemical cycle.
Microbial CH4 and N2O fluxes in tropical soils are controlled by the complex interplay of multiple environmental and biological factors. The key factors regulating net CH4 fluxes in tropical soils include redox potential and water table depth (Silver et al., 1999; Teh et al., 2005; von Fischer and Hedin, 2007), plant productivity (Whiting and Chanton, 1993; von Fischer and Hedin, 2007), labile soil organic matter (Wright et al., 2011), competition for carbon substrates among anaerobic microorganisms (Teh and Silver, 2006; von Fischer and Hedin, 2007), temperature (Knox et al., 2021), and the presence of plants that facilitate atmospheric escape (Pangala et al., 2013). The key factors regulating net soil N2O fluxes in tropical soils include redox potential, soil water content (SWC) or water table depth, temperature, pH, labile carbon availability and labile nitrogen availability (Groffman et al., 2009). For both CH4 and N2O flux dynamics, of all these factors, variations in soil redox conditions, mediated by variations in water table depth, play a particularly important regulatory role in tropical soils (Zhu et al., 2013; Yu et al., 2021) due to the underlying physiology of the microbes that produce and uptake CH4 and N2O.
Production and uptake of both CH4 and N2O in the soil are highly variable in space (hot spots) and time (hot moments) (Blagodatsky and Smith, 2012). This is because microbial processes are discontinuous (Blagodatsky and Smith, 2012), environmental conditions can change rapidly at short timescales, and the strong seasonality of climate conditions, with pronounced wet and dry seasons, in most tropical forests can significantly affect physical and ecophysiological ecosystem processes, which in turn affect greenhouse gas fluxes. In addition, most published N2O and CH4 flux data from tropical ecosystems have been derived from chamber-based measurements at the soil level, often with low spatial and temporal resolutions. Automated soil chambers capture fine-scale temporal variations, including hot moments. However, they represent only a tiny part of the landscape (i.e. a few square metres of soil surface at most) and therefore fail to capture emergent ecosystem properties that may be manifest at larger spatial scales. Moreover, above-ground plant tissues also exchange CH4 and N2O with the atmosphere (i.e. produced in the soil and transported in the transpiration stream and/or by diffusion, or produced within the stems), and this cannot be captured by soil chamber measurements alone. This makes chamber approaches insufficient to quantify the magnitude and seasonal pattern of whole-ecosystem greenhouse gas fluxes. Chamber-based measurements also hamper our ability to assess the role of tropical forests in the exchange of CH4 and N2O between the atmosphere and the land surface, and induce large uncertainties in our current assessment of the greenhouse gas sink potential of tropical forests.
On the other hand, a combination of soil and ecosystem level measurements can be a powerful tool to reduce the gap between different levels of measurement (e.g. plot to ecosystem) (Lucas-Moffat et al., 2018). Continuous ecosystem-level measurements via the eddy covariance technique provide high temporal resolution data on mass and energy exchanges at the ecosystem level (Baldocchi, 2014, 2020; Delwiche et al., 2021) and more detailed information on ecosystem functioning at a broader spatial scale than do mere soil measurements, which miss above-ground exchanges and typically, also emissions from wetland areas within the ecosystem (Bonal et al., 2008; Aguilos et al., 2018; Wang et al., 2021; Liu et al., 2022). However, eddy covariance cannot indicate how much different land cover types relatively contribute to the ecosystem's total flux since the measurements integrate high and low frequency flux over time and space. Chamber and eddy covariance-based approaches each have their own strengths and weaknesses; however, taken together, they effectively represent the magnitude of ecosystem fluxes and can help determine the drivers of greenhouse gas flux dynamics (Eugster and Merbold, 2015). We therefore combined these two approaches to test the following assumptions:
-
H1: Ecosystem- and soil-level CH4 and N2O fluxes vary seasonally in the studied tropical forest, switching between uptake and emission,
-
H2: At both the soil and ecosystem levels, soil water content is the primary abiotic driver of these gaseous fluxes during the driest and the wettest seasons.
This study provides, for the first time, a comprehensive assessment of CH4 and N2O dynamics at both ecosystem and soil levels based on high-frequency eddy covariance and continuous soil chamber time series over 26 months in a wet tropical forest.
2.1 Study site
Our research was conducted at the Guyaflux site ( N, W) (Bonal et al., 2008), an ICOS-associated ecosystem station (GF-Guy) located 15 km from the coast and approximately 40 km west of Kourou, in French Guiana, South America. On a decadal time scale, the average annual precipitation at the study site is 3102 ± 70 mm and average annual air temperature is 25.7 ± 0.1 °C (Aguilos et al., 2018). The climate is humid tropical and highly seasonal due to the north-south movement of the Inter-Tropical Convergence Zone (ITCZ), which drives regional precipitation. The ITCZ dictates the wet season (from December to July, with rainfall of up to 500 mm month−1) and the long dry season from mid-August (mid-November, with less than 100 mm month−1). In the northernmost part of the Guiana shield, where the study site is located, the topography results in a succession of small elliptical hills from 10 to 40 m a.s.l., with soils classified as nutrient-poor acrisols (IUSS Working Group WRB, 2015). The site is totally surrounded by undisturbed forest, locally characterised by a tree density of about 620 trees ha−1 (for trees >10 cm dbh), an average tree height of 35 m, an average tree diameter at breast height (DBH) of 40.1 cm, with emergent trees over 40 m tall, and a tree species richness of about 140 species ha−1 (Bonal et al., 2008; Aguilos et al., 2018; Daniel et al., 2023).
2.2 Tower-based flux measurements
Continuous measurements of the surface-atmosphere exchange of CO2, H2O and energy were initiated in 2003 based on the Euroflux methodology (Aubinet et al., 2000) and the eddy covariance approach (Baldocchi, 2003); they have previously been reported and fully documented (Bonal et al., 2008; Aguilos et al., 2018). The Guyaflux flux tower is 55 m high and extends about 20 m beyond the top of the canopy. The putative average footprint of the eddy fluxes from the tower covers approximately 50–100 ha of undisturbed forest in the direction of the prevailing winds (Bonal et al., 2008; Fang et al., 2024). Within the estimated footprint of the Guyaflux tower, 52 % of the area is upland forest, 13 % is seasonally flooded forest and the rest (35 %) is slope forest. Most of the meteorological and eddy flux sensors are mounted three meters above the top of the tower and include equipment measuring air temperature and humidity (HMP155, Vaisala, Helsinki, Finland), bulk precipitation (ARG100, EM lmt, Sunderland, UK), wind direction and speed (A05103-5, Young, Traverse City, MI, USA), and global infrared incident and reflected radiation (Rg) (CNR1, Kipp and Zonen, Bohemia, NY, USA). All the meteorological data in the present study were collected at 1 min intervals and compiled as 30 min averages or sums with data loggers (CR23X, CR1000 or CR3000 models; Campbell Scientific Inc., Utah, USA).
In 2017, a closed-path fast greenhouse gas analyser (FGGA, Los Gatos Research, Mountain View, California, USA), whose head (gas inlet) was mounted 0.3 m from the head of a 3-D sonic anemometer (R3-50; Gill Instruments, Lymington, UK), was set up at the top of the eddy flux tower to provide eddy covariance measurements of the CH4 and N2O fluxes. The FGGA, equipped with a fourth-generation cavity-enhanced laser absorption spectroscopy analyser (DLT-100; Los Gatos Research Inc.), was connected to an external pump (Edwards XDS-35i, Edwards, England, UK) and to a 62 m long PFA inlet tube (4 mm inlet diameter) protected by black foam with a 15 µm filter. All data were sampled at a frequency of 20 Hz with data loggers (model CR3000; Campbell Scientific Inc.).
In addition, to take conditions where non-turbulent processes prevail (e.g. calm nights) into account, the eddy covariance measurements were complemented with a vertical profile measurement system to estimate variations in CH4 and N2O concentrations at six different heights above ground (i.e. 0.5, 6, 13, 23, 32 and 58 m) with a 0.8 L min−1 pump connected to a six-line solenoid valve and a closed-path FGGA. The entire system was controlled by a data logger (model CR10X; Campbell Scientific Inc.) which recorded greenhouse gas concentration data every 15 min. The vertical profile system for CH4 and N2O was stopped after 1 year because the storage of the gases was found to be negligible (see below).
2.3 Tower-based CH4 and N2O flux computation
We used EDDYPRO V6.2.2 (LI-COR Inc.), a software based on a set of standardised post-processing calculations and corrections, to calculate CH4 and N2O fluxes from the raw high-frequency eddy covariance data. The parameterization of the software included: a two-dimensional coordinate rotation to set lateral and vertical mean wind speed to zero; a time lag between each scalar and wind speed measurement estimated by covariance maximisation; an empirical frequency correction for high-frequency attenuation; and a Webb-Pearman-Leuning correction for density fluctuations where required, i.e. where concentrations were not measured as mixing ratios. Details of these corrections are given in Aubinet et al. (2012). After the greenhouse gas flux computation, the EDDYPRO output files contained continuous time series for ecosystem-atmosphere greenhouse gas (CH4 and N2O) fluxes reported at a 30 min time step (from 17 May 2016 to 2 August 2018). The output files also included uncertainties, quality control flags, friction velocity.
To calculate net ecosystem production or uptake, we added the storage term to the turbulent flux measured by the eddy covariance tower. This correction is particularly relevant for CO2 exchanges in forest ecosystems to reduce the uncertainty of the net flux estimate (Nicolini et al., 2018). However, for the net CH4 and N2O fluxes, the relevance of the storage term correction was only marginal. In contrast to CO2, whose concentrations clearly built up at soil level during low-turbulence conditions, this was not the case for N2O and CH4 (Figs. S1 and S2 in the Supplement). Comparisons between ecosystem fluxes with and without correction for the storage term showed that the change in the resulting flux was minimal (Figs. S1 and S2). Consequently, we assumed that the storage of CH4 and N2O was negligible and we then ignored it in this study. This meant that a larger period of eddy covariance flux measurements could be used in this study (starting in 2016), in addition to the January 2017–January 2018 period where CH4 and N2O storage data were available. Half-hourly ecosystem fluxes of CH4 and N2O were expressed in (unit of ground area).
2.4 Chamber measurements
In addition to the flux tower and its associated instrumentation, automated non-steady-state flow-through chambers for continuous measurement of soil greenhouse gas fluxes were installed in June 2016 on hypoferralic soils with deep vertical drainage and a very deep water table (∼15 m depth), approximately 50 m upwind from the flux tower in some of the upland forest part of the tower footprint. This automated system had two constraints, which when combined, limited the spatial coverage of the soil greenhouse gas flux measurements to the upland forest area: the power supply was only available at the flux tower, and the maximum distance between the automated chambers and the gas analysers was 30 m. Thirteen of the sixteen initial chambers functioned correctly throughout the study period and their data were retained in this study. Briefly, the chambers (LI-8100-104, LI-COR Inc., Lincoln, NE, USA) were mounted on PVC collars (20.3 cm inner diameter; enclosed soil area ∼318 cm2; offset ∼4 cm) that were permanently inserted into the soil. The chambers were connected to a multiplexer (LI-8150, LI-COR Inc.) used to program specific measurement cycles. It operated with a cavity ring-down spectroscopy (CRDS) analyser (G2308; Picarro Inc., Santa Clara, CA, USA) to measure CO2, H2O and dry air-CH4 and N2O concentrations (water corrected concentrations) at 1 Hz. This analyser relied on an external recirculation pump (A0702; Picarro Inc.). The multiplexer program purged the system 15 s before and 45 s after the measurements to flush out the tubing and return to ambient-air greenhouse gas concentrations. A dead band of 60 s avoided potential measurement errors ascribed to pressure changes inside the chamber-tubing-analyser loop following chamber or solenoid valve closure and accounted for time lags. In addition, to maximise the percentage of fluxes that can be detected for N2O and CH4 without affecting spatial coverage and temporal resolution, we initially developed a program combining two different closure times. Briefly, each week, four of the initial sixteen chambers were manually set to remain closed for 25 min, while the other chambers were set to remain closed for a much shorter period of 2 min. This program was rotated across the chambers. The 25 min closure time was a compromise between reliably estimating low N2O fluxes and ensuring a sufficient number of flux measurements per chamber and per day. The measurement cycle duration was 2.5 h, providing approximately nine measurements per chamber per day for all gases. Each chamber was therefore measured with the longer closure time for one 7-consecutive-day period per month (4 weeks). More detail of equipment can be found in previous publications (Courtois et al., 2019; Bréchet et al., 2021).
2.5 Chamber-based CH4 and N2O flux computation
We used the SOILFLUXPRO software (LI-COR Biosciences) to compute soil greenhouse gas fluxes based on the linear and exponential regression of the change in headspace concentrations over time, the collar area and the system volume, after correction for atmospheric pressure and temperature.
After calculating the fluxes and implementing our standard soil greenhouse gas QC procedure (Courtois et al., 2019; Bréchet et al., 2021), all CO2 fluxes with an insufficiently high R2 (<0.90), an initial concentration greater than 900 ppm, or a value outside the range of variation from 0.10 to 30 , were discarded for all three gases, based on the assumption that poor-quality CO2 implied poor-quality values for CH4 and N2O. Based on previous work (Courtois et al., 2019), all CH4 fluxes with R2<0.80 were excluded (17 % of the total 89 380 values). These fluxes were not set to zero, as a low R2 value does not provide information on the flux value itself. This criterion was inapplicable to N2O, however, due to the low overall R2 values, meaning all fluxes were retained for the study. Additionally, we computed the minimum detectable fluxes (MDF) suitable for high-resolution, in situ greenhouse gas measurements with the metric proposed by Nickerson (2016): 0.040 and 0.002 for 2 and 25 min, respectively, for CH4; and 0.100 and 0.002 for 2 and 25 min, respectively, for N2O. This implies that null fluxes were included in the analysis if the flux values for each gas and measurement length fell within the range defined by the corresponding absolute MDF value. The soil fluxes of CH4 and N2O were expressed in (unit of soil surface area).
2.6 Tower and chamber flux data analysis
In order to include the most complete information possible, we based the study period on the soil flux measurements and included all available data from 17 May 2016 to 2 August 2018. This 26 month period included both very dry and very wet seasons (Fig. 1).
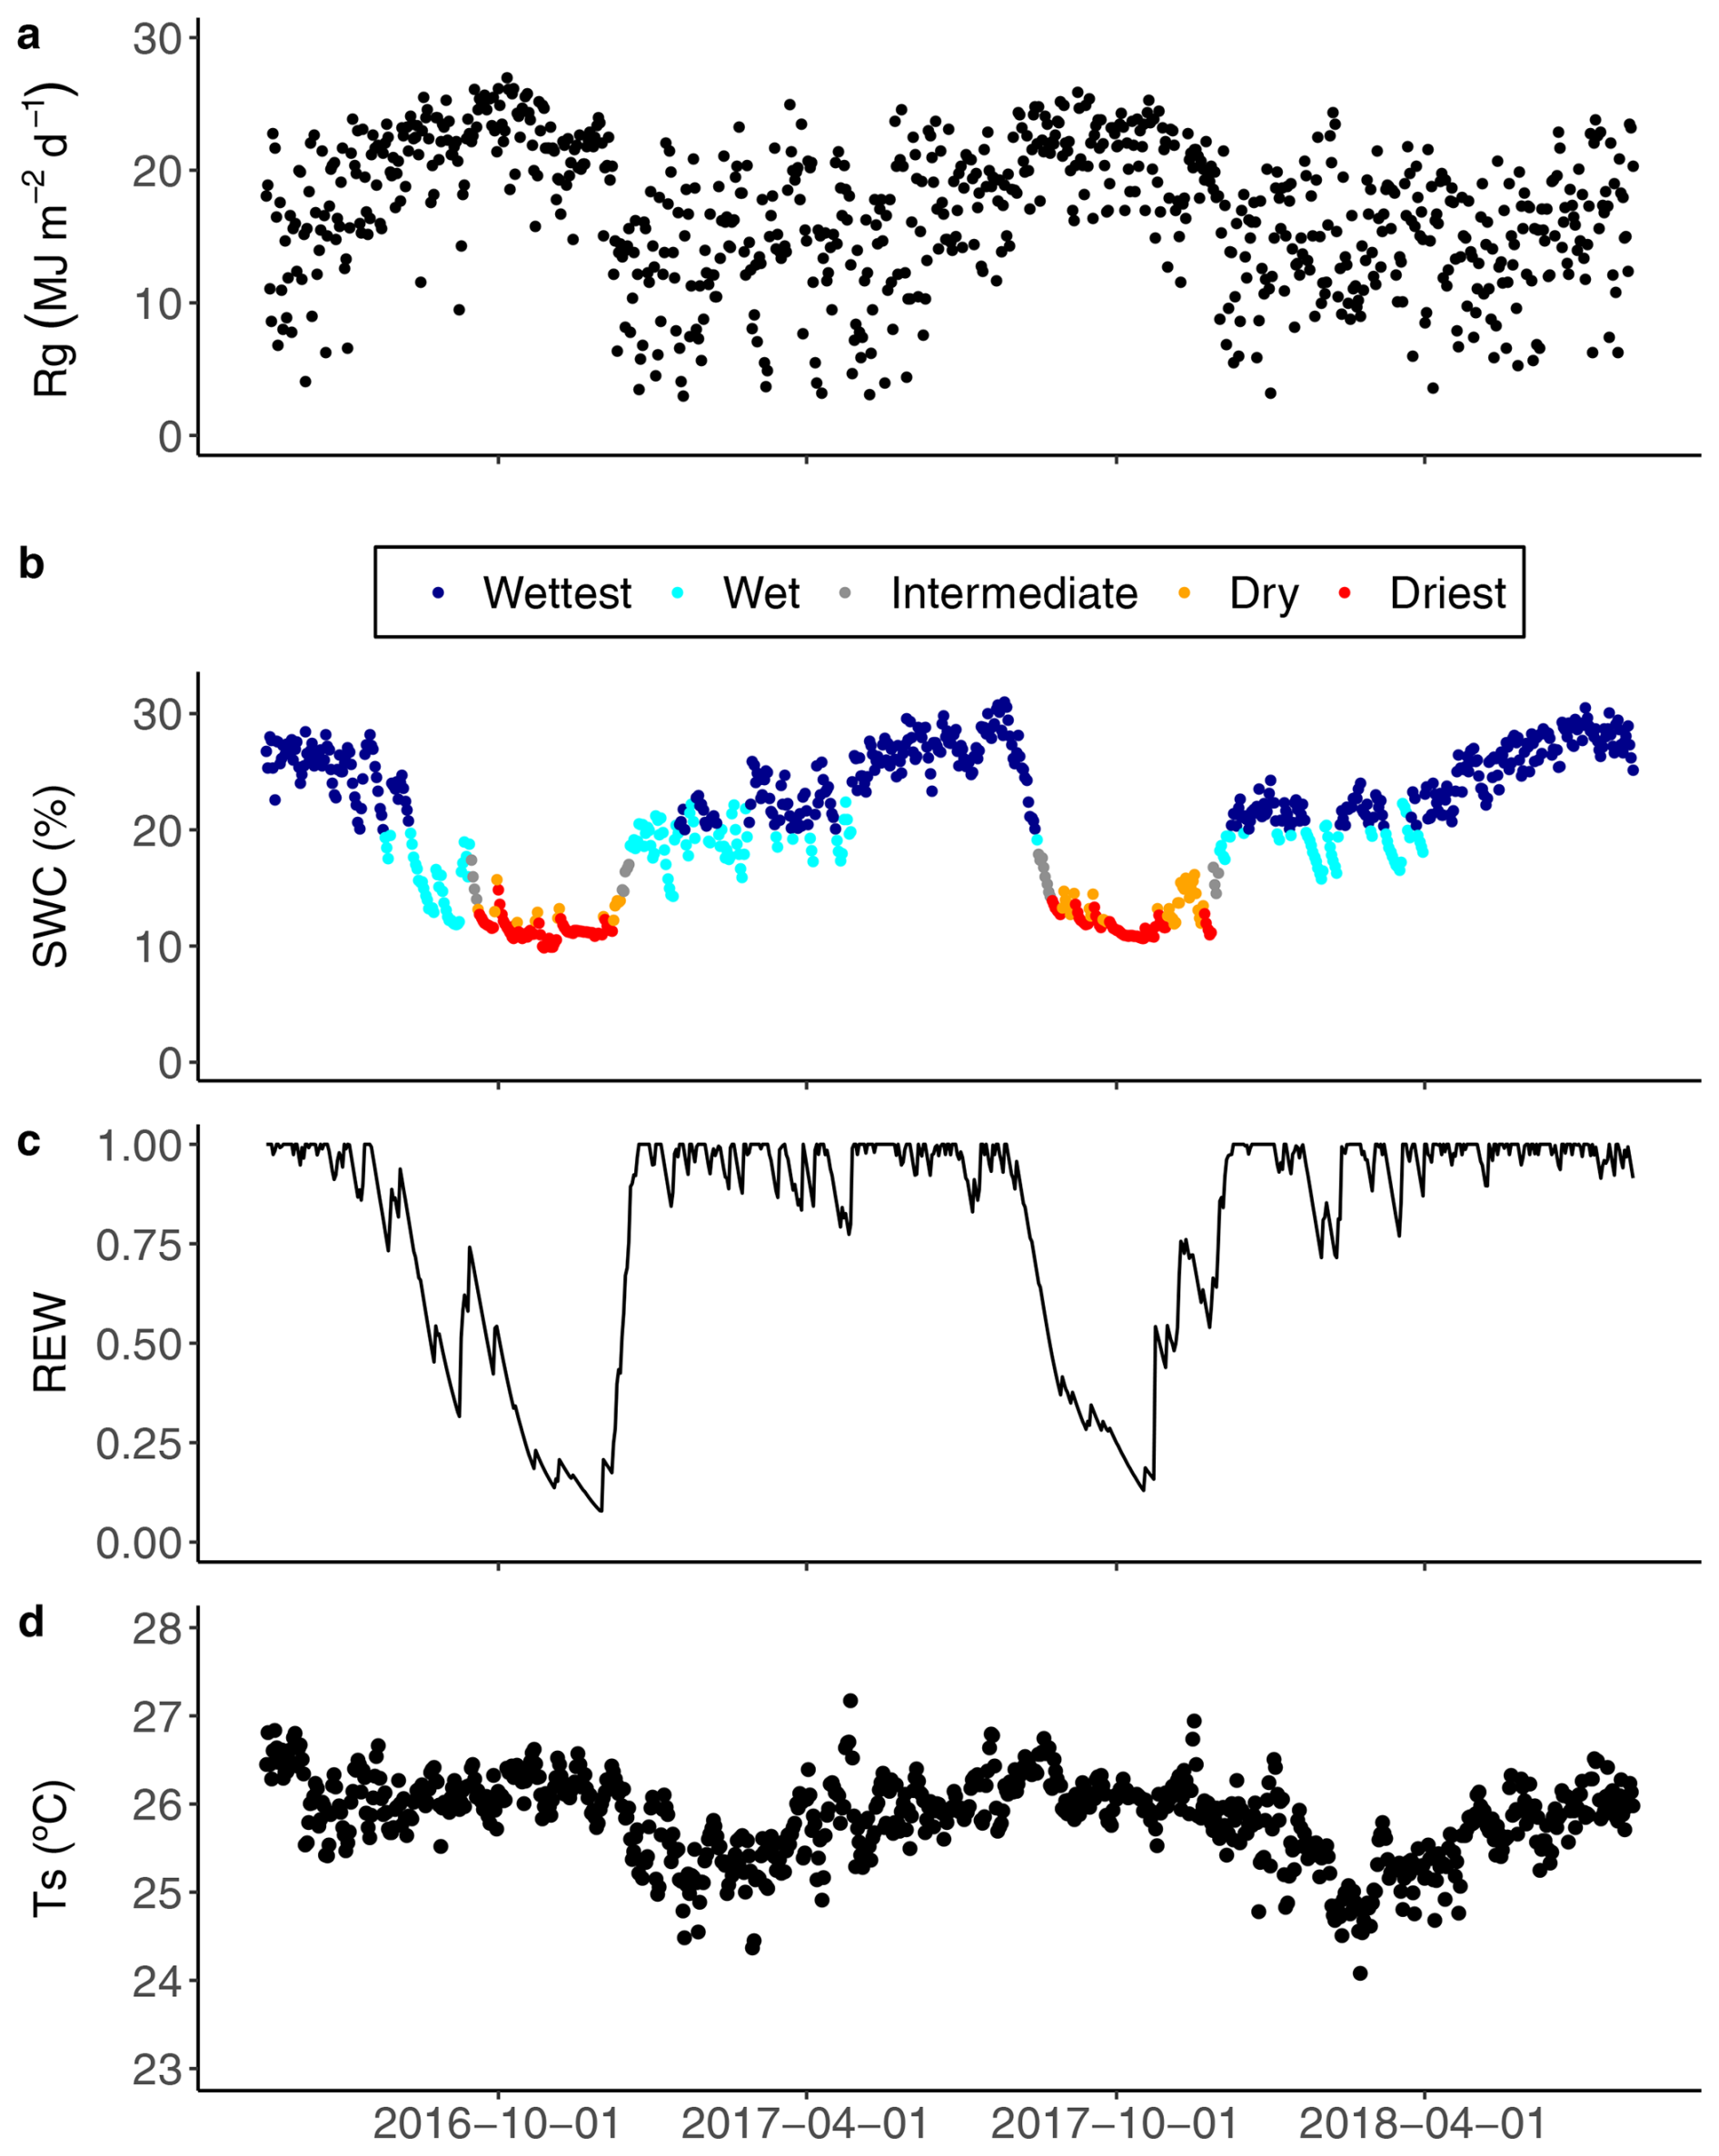
Figure 1Daily (a) accumulated global radiation (Rg); (b) average soil water content (SWC) at 5 cm in depth during the wet, intermediate and dry seasons, and for two contrasted seasons defined as the wettest (dark blue dots) and the driest (red dots); (c) average relative extractable water (REW) to 3 m in depth based on the water balance model developed by Wagner et al. (2011); and (d) soil temperature (Ts) at 5 cm in depth, from 17 May 2016 to 2 August 2018 in the Guyaflux tropical forest, French Guiana. See Sect. 2.7 for details of the methods used to define the “driest” and “wettest” periods with extreme SWC.
Some flawed data was found (and eliminated) for both eddy covariance and soil chamber measurements. They resulted from particular physical or biological conditions at the sampling point or inside the soil chamber (e.g. wasp nests, disturbance by birds, dust, a branch preventing proper closure of the chamber and causing a leak), or from mechanical issues (e.g. a power cut, soil chamber remaining closed, gas analyser malfunction), which generated gaps in each time series. After flux computation, the eddy covariance data for CH4 and N2O were filtered: data below a u∗ threshold of 0.15 m s−1 were discarded (Bonal et al., 2008) – as were data with a quality flag of 2 (on a scale from 0 to 2) (Mauder and Foken, 2004).
To calculate daily averages for greenhouse gas fluxes, we first estimated the optimal number of observations per day necessary to obtain representative daily averages. To do this, we selected a data pool with at least 42 observations per day in the eddy covariance dataset. In the soil chamber dataset, we first calculated daily means based on a minimum of five observations for each of the thirteen chambers. Then, for each day, we created subsets of values from 1 to 42 for the eddy covariance data, and from 1 to 13 for the soil chamber data, based on 100 bootstrap iterations. Representative daily means were found for minimum thresholds of 12 observations per day for the eddy covariance and 10 chambers per day for the soil flux system. These tests were performed separately for CH4 and N2O and the driest and wettest seasons, giving similar threshold results. Daily means with a number of observations below the corresponding threshold were then discarded. After filtering out the non-representative days, the missing daily means for the whole study period represented 27 % for both CH4 and N2O flux data derived from eddy covariance and 34 % and 30 % for CH4 and N2O flux data derived from the soil chambers.
2.7 Environmental measurements
In the vicinity of the tower, we used temperature sensors (CS107; Campbell Scientific Inc., Logan, UT, USA) to measure surface soil temperature (Ts) and frequency domain sensors (CS615 or CS616; Campbell Scientific Inc.) to measure soil volumetric water content (SWC) at a depth of 5 cm. To estimate the daily relative extractable water (REW) for trees from the soil surface to a depth of 3 m, we used a soil water balance model previously validated for tropical forests (Wagner et al., 2011) with daily precipitation, evapotranspiration and solar radiation as input variables. Daily SWC (%), Ts (°C) and REW were defined as the average of the half-hourly flux values over 24 h, while daily Rg () was the sum of the half-hourly flux values over 24 h.
To examine the effect of environmental variables on CH4 and N2O fluxes at the ecosystem and soil levels, we extracted data from two contrasting periods, termed “Driest” and “Wettest” (Fig. 1). The driest days occurred at the end of the dry season, when SWC was less than 15 % and decreased for at least three consecutive days. The wettest days had a SWC above 20 %, corresponding to a REW above 0.4 and unlimited available water for trees (Wagner el al., 2011) for more than two consecutive days.
2.8 Data analysis
We used the mgcv (Wood and Wood, 2015) and stats packages in R version V3.6.3 (R Core Team, 2020) for the data analyses and ggplot2 for visualisations (Wickham, 2016). The significance level for all tests was set at 0.05.
We used Kolmogorov-Smirnov tests (ks.test function) to evaluate the effects of contrasting seasons, specifically the driest and wettest periods, on the distributions of CH4 and N2O fluxes at both ecosystem and soil levels. A Student's t test (t.test function) was used to determine if the greenhouse gas fluxes were statistically different from 0. Generalised additive models (GAM; gam function) were used to assess whether climate variables (i.e. Rg, Ts, SWC) explained the temporal variations in CH4 and N2O fluxes at the ecosystem and soil levels. We included the default thin-plate spline smoothing parameter selected by restricted maximum likelihood (REML) and modelled the fluxes of each greenhouse gas as a function of season, climate variables and their interaction. For all GAMs, the “select” option was set to TRUE so that terms could be removed from the GAM during model fitting if they provided no benefit (Wood, 2017). Because of the highly right-skewed nature of the data, particularly for net ecosystem CH4 fluxes (Fig. 3), similar GAMs were conducted on the 1st–99th percentile ranges of the data. This approach mitigated the influence of two episodic CH4 production events that occurred during the wettest periods (e.g. July 2016 and June 2018; Fig. S5) at the ecosystem level, providing a more representative assessment of the extent to which each environmental variable predicts the fluxes.
3.1 Environmental seasonality
The Guyaflux site is characterised by alternating wet and dry seasons, typical of a wet tropical climate. During the wet season, mean daily global radiation (Rg; Fig. 1a) was at its lowest, while soil water content (SWC; Fig. 1b) was at its highest, accompanied by peak values for relative extractable water (REW; Fig. 1c). In contrast, the dry season had elevated mean daily Rg, minimal SWC and the lowest values of REW. The soil temperature (Ts; Fig. 1d) also exhibited a clear seasonal pattern, albeit weak in absolute values (approximately 2 °C), which was influenced by changes in air temperature. During the study period, the driest season (SWC ranging from 9.9 % to 15.0 %) covered 15.8 % of the total study period (128 d), while the wettest season (SWC ranging from 20.0 % to 30.0 %) covered 55 % of the total study period (444 d) and represented near-saturated conditions.
3.2 Greenhouse gas flux seasonality under contrasting environmental conditions
The ecosystem and soil CH4 and N2O fluxes also displayed some seasonality (Figs. 2, S3, and S4), with seasonal differences particularly evident between the wettest and the driest seasons (Fig. 3).
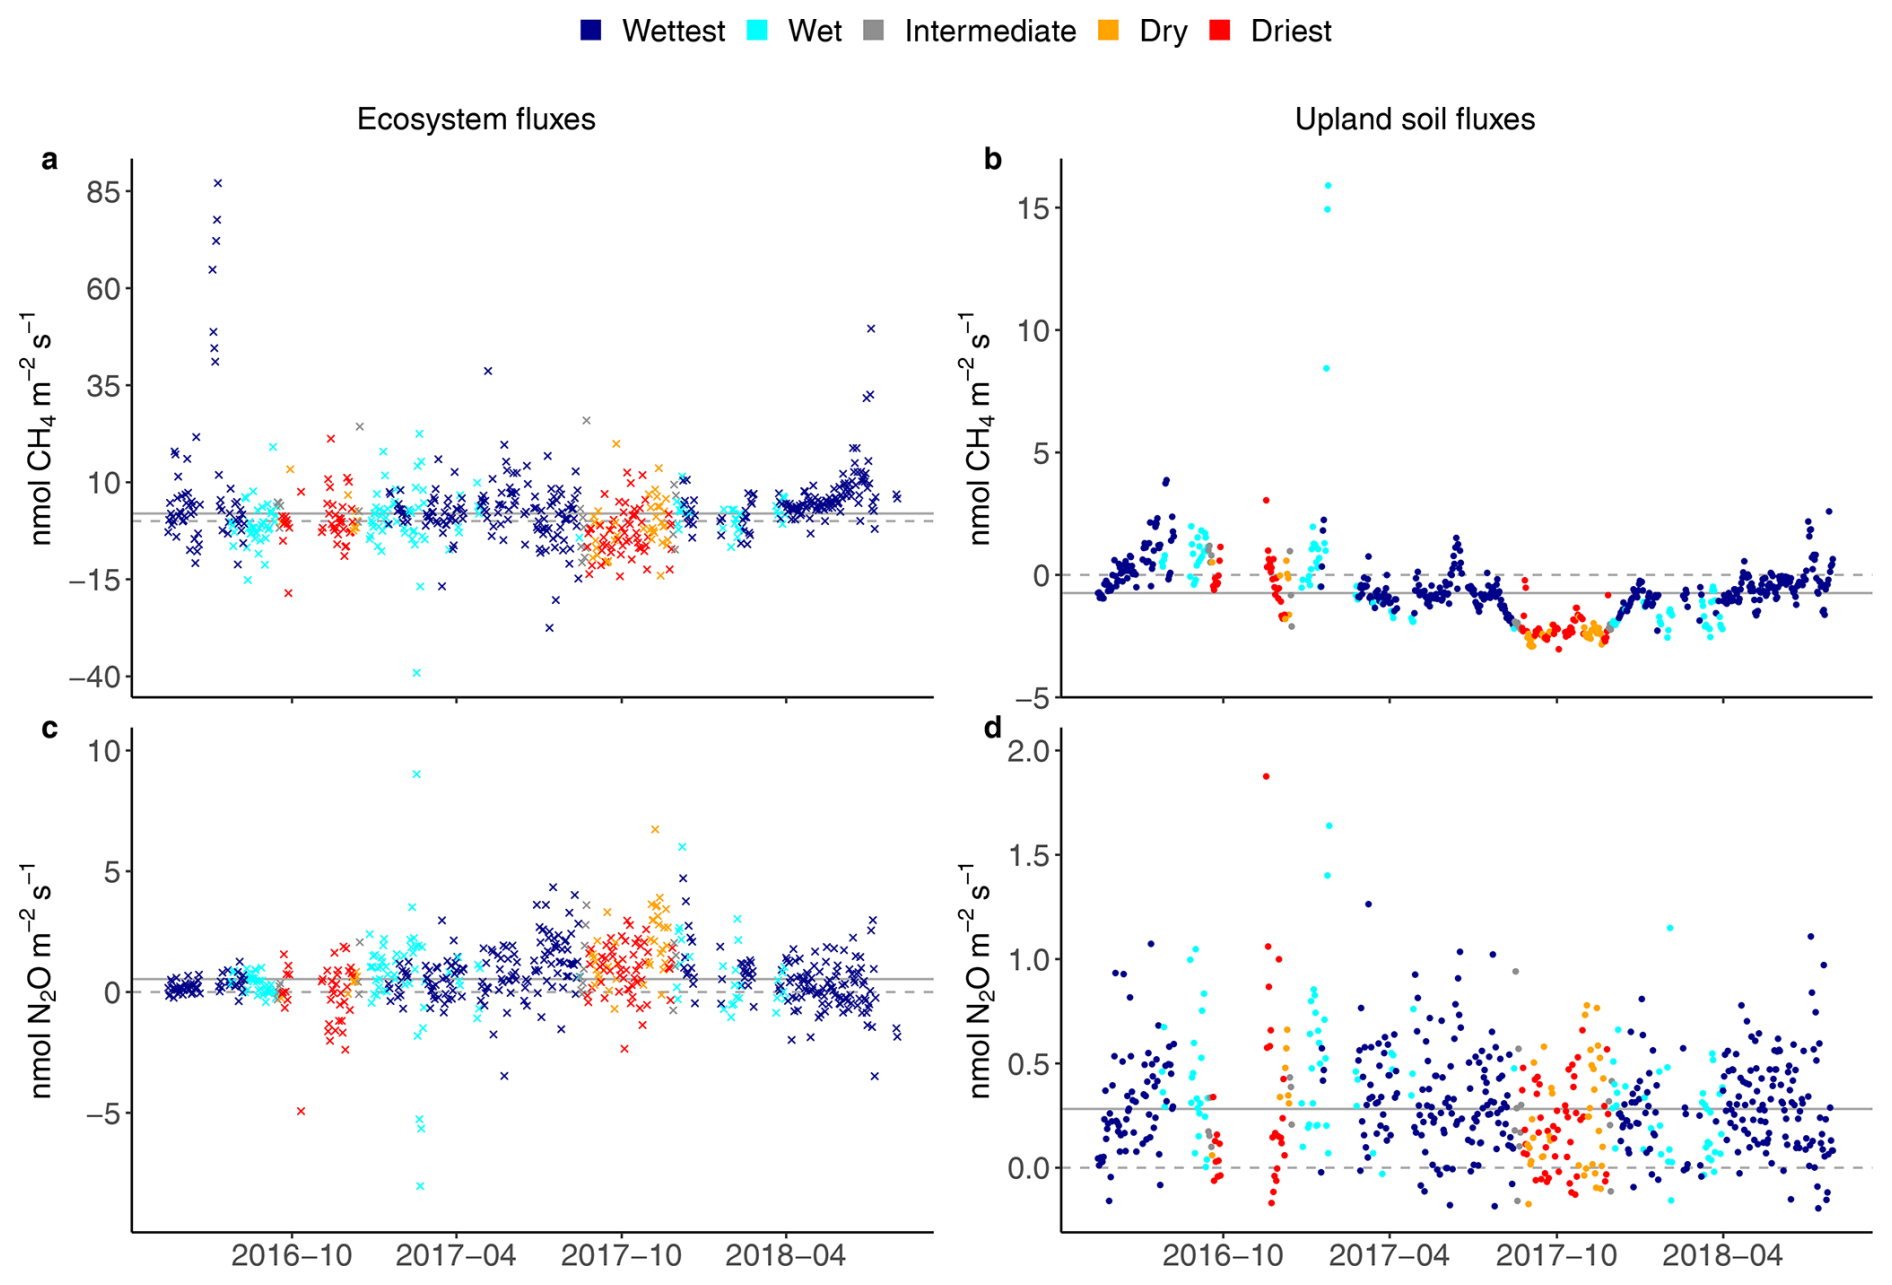
Figure 2Seasonal courses of average daily ecosystem (crosses on the left) and upland soil (solid dots on the right) fluxes for the wet, intermediate and dry seasons, and for two contrasted seasons defined as the wettest (dark blue dots) and the driest (red dots) for 24 h CH4 fluxes (a, b) and N2O fluxes from 17 May 2016 to 2 August 2018 (c, d) in the Guyaflux tropical forest, French Guiana. Positive fluxes (above the dashed grey “0” line) indicate greenhouse gas emissions and negative fluxes (below the “0” line) indicate greenhouse gas uptake; the solid grey line represents the median over the whole period. Note that the scale of the y axis has been adjusted for each gas and compartment to improve clarity. Comparable seasonal courses of the 1st–99th percentile range of CH4 and N2O flux data are shown in Fig. S5.
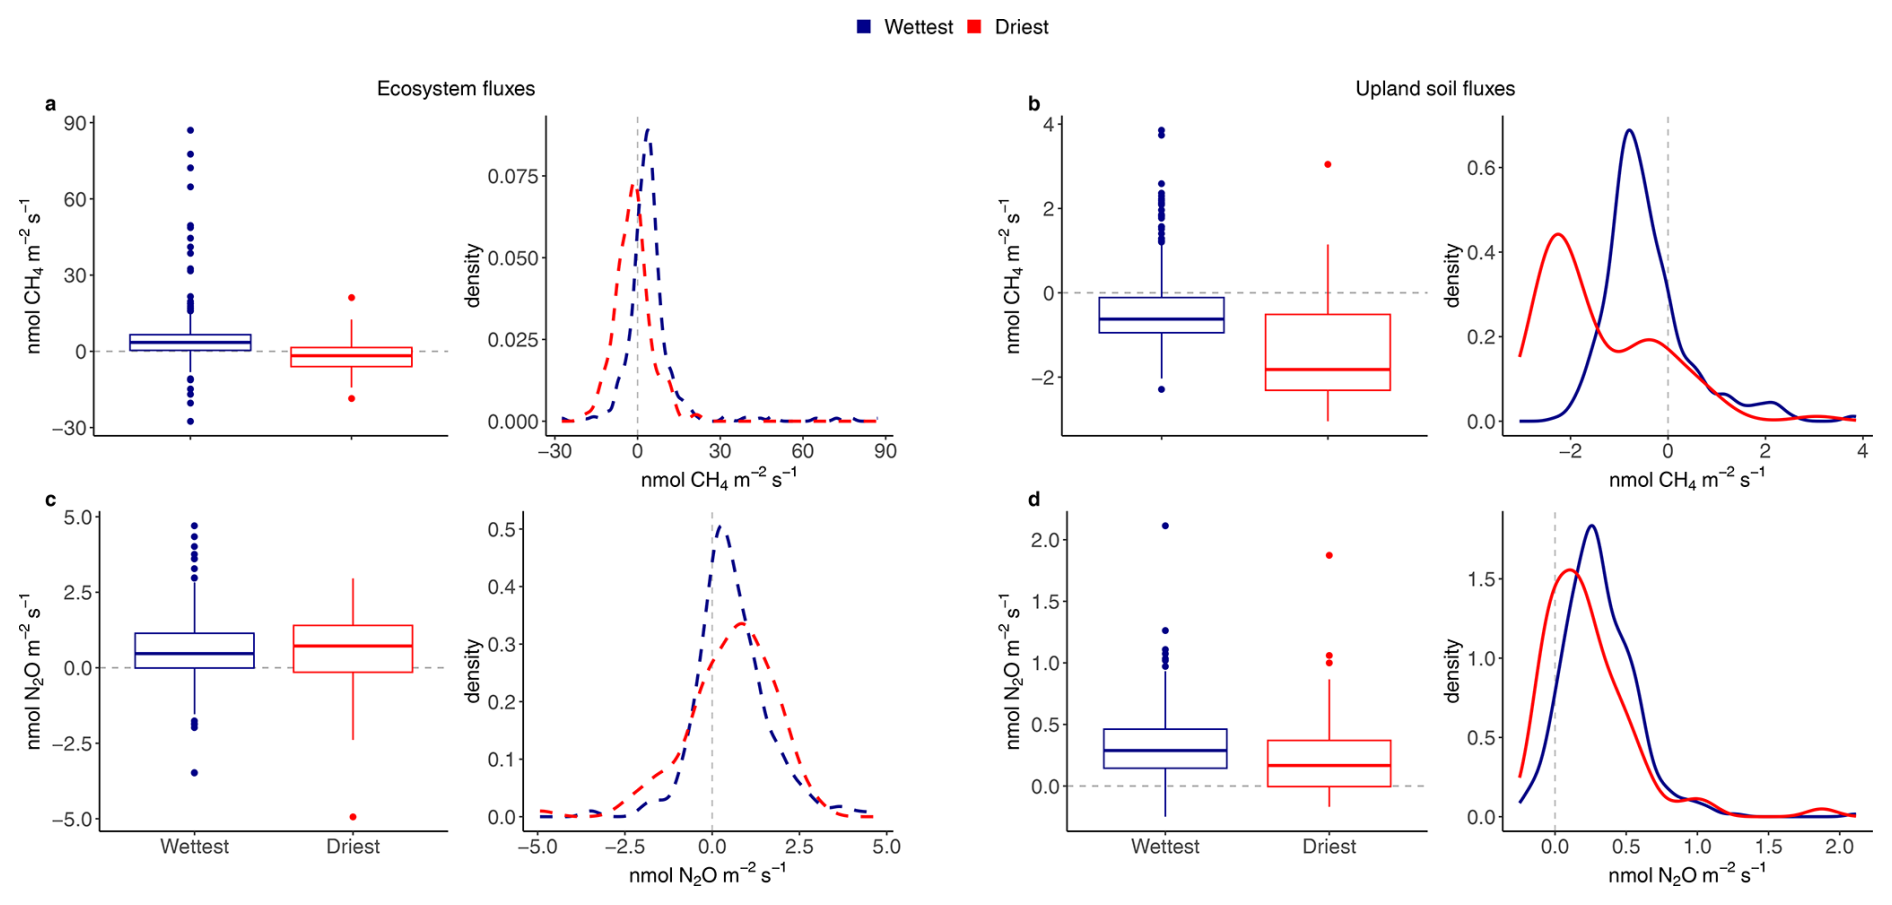
Figure 3Boxplots and associated density plots of average daily ecosystem fluxes (dashed lines on the left) and upland soil (solid lines on the right) fluxes of 24 h CH4 fluxes (a, b) and N2O fluxes (c, d) for the wettest (blue) and driest (red) seasons, from 17 May 2016 to 2 August 2018 in the Guyaflux tropical forest, French Guiana. In the box plots, solid bold lines represent medians, box boundaries mark the 25th and 75th percentiles and whiskers show the 10th and 90th percentiles. Dots mark outliers. In the density plots, positive fluxes on the right side of the dotted “0” line indicate greenhouse gas emissions and negative fluxes on the left side of the “0” line indicate greenhouse gas uptake. All fluxes, except the ecosystem N2O fluxes (c), exhibited statistically significant differences between the wettest and driest seasons at p<0.05 based on Kolmogorov-Smirnov tests.
Ecosystem CH4 emissions were greater during the wettest season than during the driest season, when net fluxes hovered around zero (Table 1; Fig. 3a). In contrast to the ecosystem-level fluxes, soil CH4 fluxes in the studied upland forest were mainly negative, indicating net soil CH4 uptake throughout the year (Fig. 2b), even under varying environmental conditions (Table 1; Fig. 3b). Soil CH4 uptake did decreased significantly in the wettest season compared to the driest season, although the fluxes remained negative overall (i.e. CH4 uptake, Table 1; Fig. 3b).
Table 1Mean, standard deviation (SD) and median ecosystem and upland soil CH4 and N2O fluxes for the wettest and driest seasons in the Guyaflux tropical forest, French Guiana. All values are different from 0 at p level <0.05 based on Student's t tests.
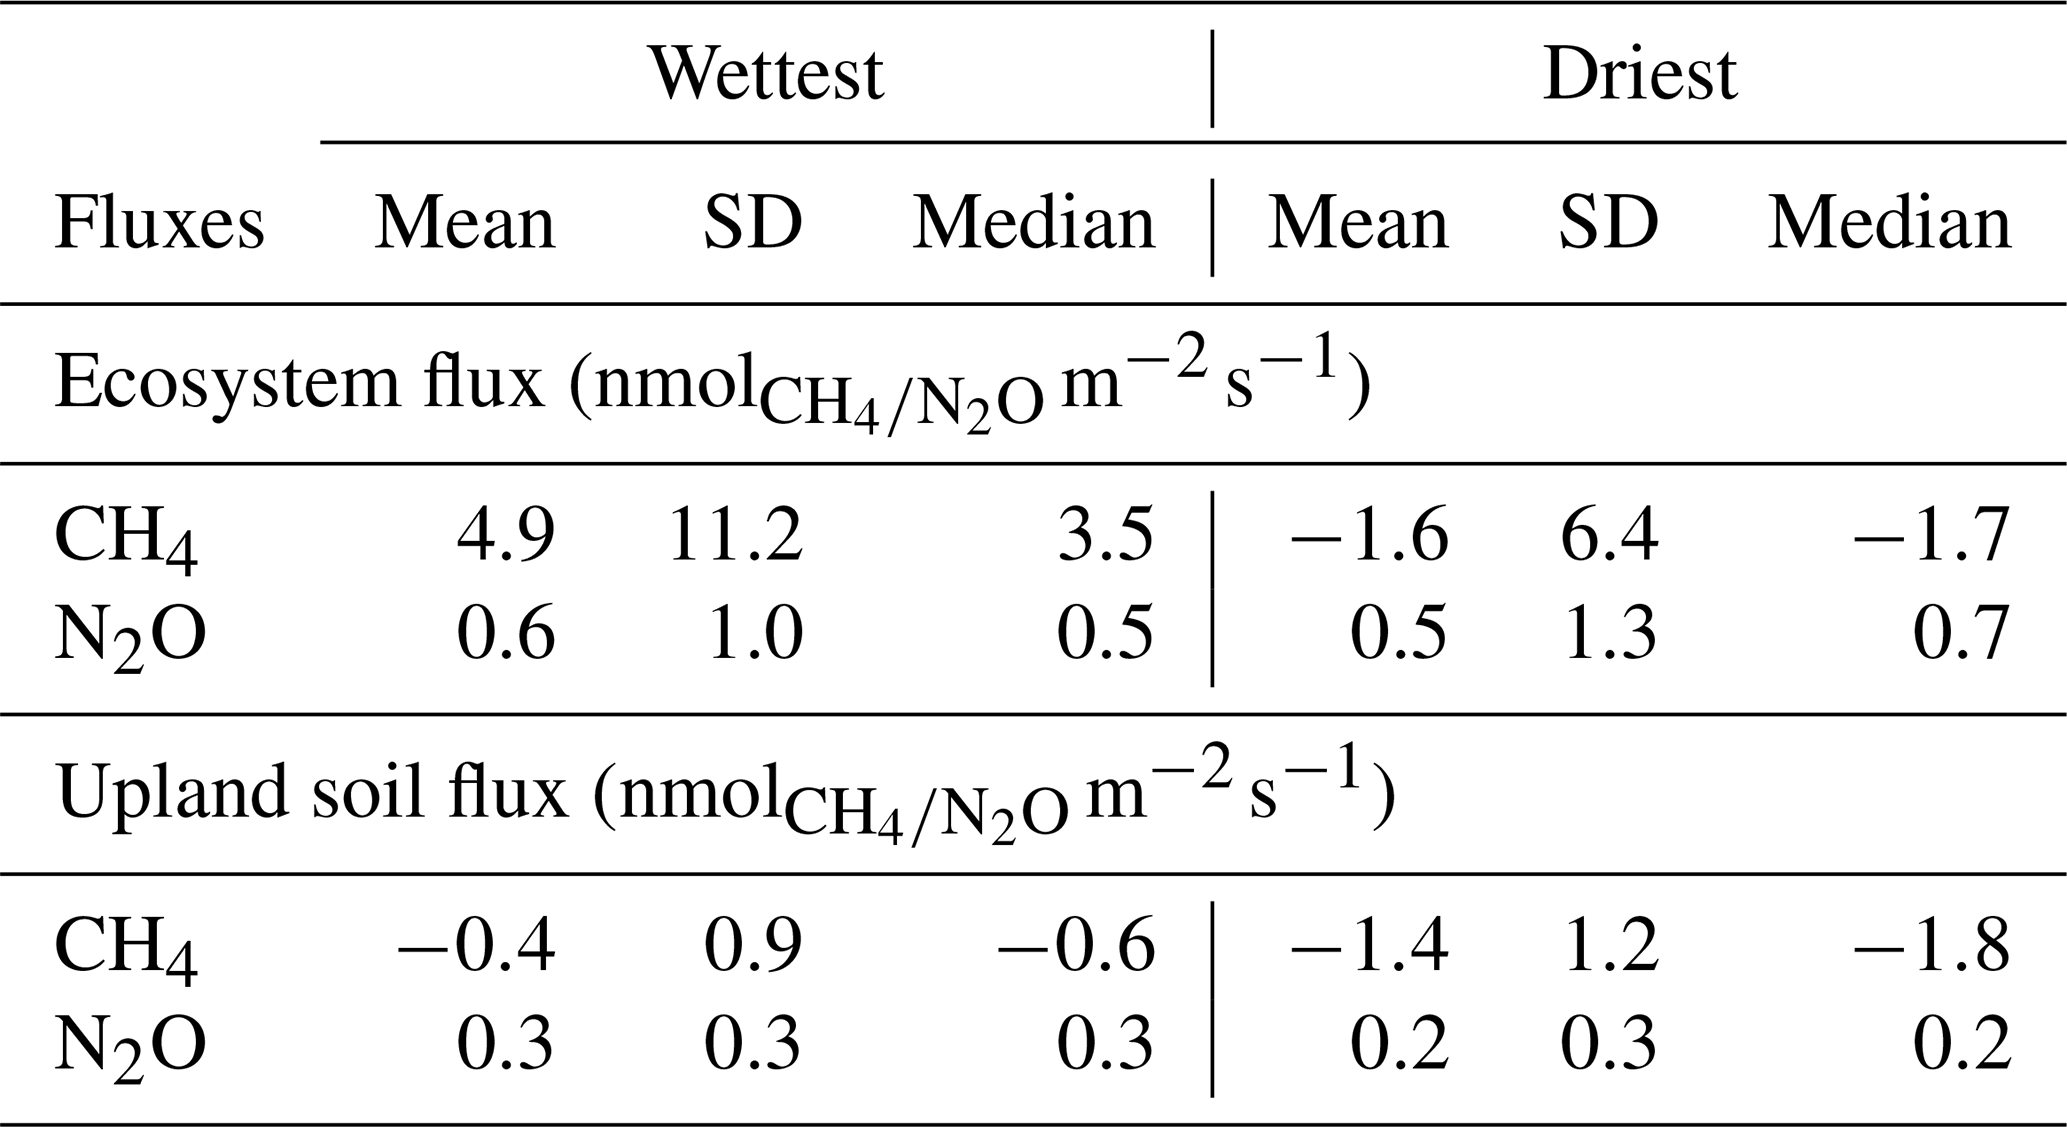
The seasonal pattern of ecosystem N2O fluxes was less pronounced than that of CH4 (Fig. 2c). Similar emission rates were observed during the driest and the wettest seasons (Table 1; Fig. 3c). In contrast to the ecosystem-level fluxes, soil N2O fluxes in the studied upland forest not only had a more pronounced seasonal pattern, but these soils also emitted more N2O during the wettest season than during the driest season (Table 1; Fig. 3d). It is noteworthy that all the overall flux means were significantly different from zero (Table 1) and that there were significant differences in fluxes between seasons at both the ecosystem and soil levels, except for N2O fluxes at the ecosystem level (Fig. 3). This suggests that the magnitude of the fluxes was large compared to the seasonal variations.
3.3 Environmental drivers of ecosystem and upland soil greenhouse gas fluxes
Keeping the 1st–99th percentile range of the flux data was sufficient to account for the majority of the statistical leverage (Tables 2 and S3 in the Supplement). This was particularly true for net ecosystem CH4 fluxes, which showed that CH4 emissions decreased with increasing Rg (Figs. 4a, S5a, and S6a), although this negative correlation was statistically significant only during the wettest season (Table S3) when net emissions occasionally switched to net uptakes at highest Rg values (Figs. 4a and S6a). Net ecosystem CH4 fluxes were strongly positively correlated with SWC (Figs. 4b and S6b), showing increased CH4 emissions with increasing SWC, although this correlation was statistically significant only during the wettest season (Table S3).
Table 2Results of generalised additive models (GAM) assessing the relationships between environmental variables, i.e. global radiation (Rg), soil water content (SWC), soil temperature (Ts), and daily mean ecosystem and upland soil CH4 and N2O fluxes during the wettest and driest seasons from 17 May 2016 to 2 August 2018 in the Guyaflux tropical forest, French Guiana. The effective degrees of freedom (edf) and the reference number of degrees of freedom (Ref. df) of the fitted models, with values for each spline term, are shown. Significant terms at p level <0.05 are shown in bold. Comparable GAM results with the 1st–99th percentile ranges of CH4 and N2O fluxes are shown in Table S3.
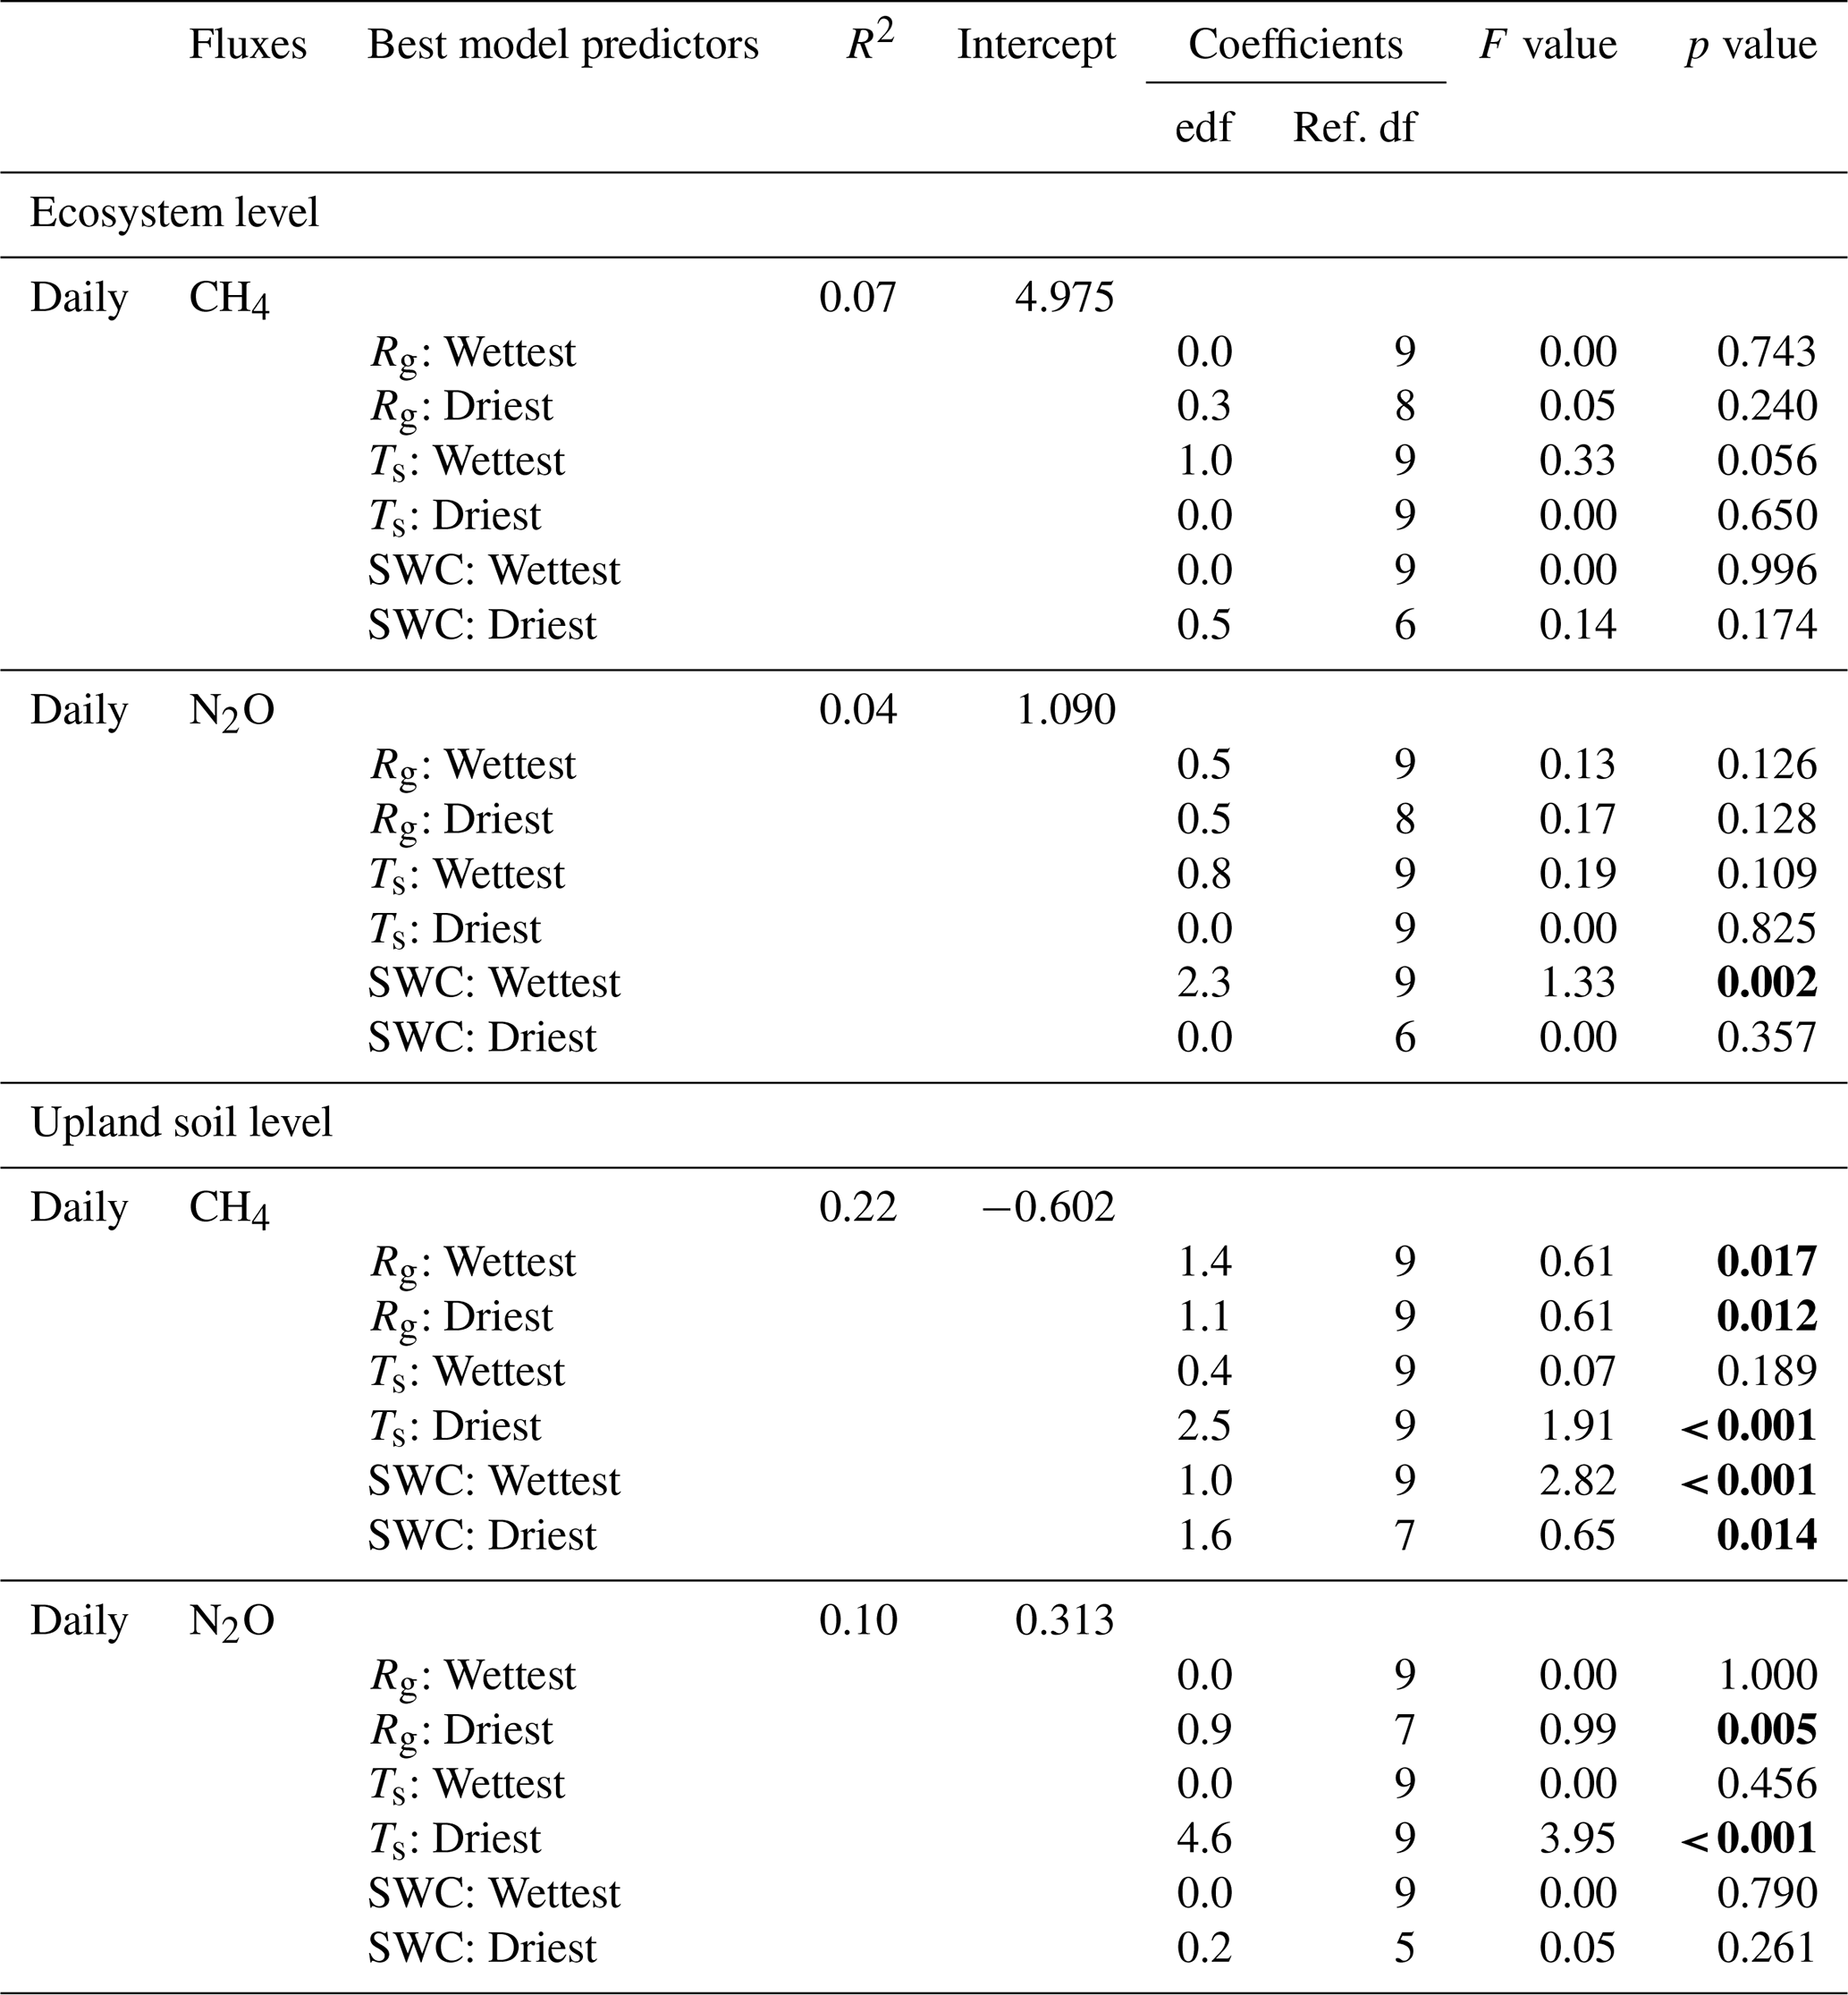
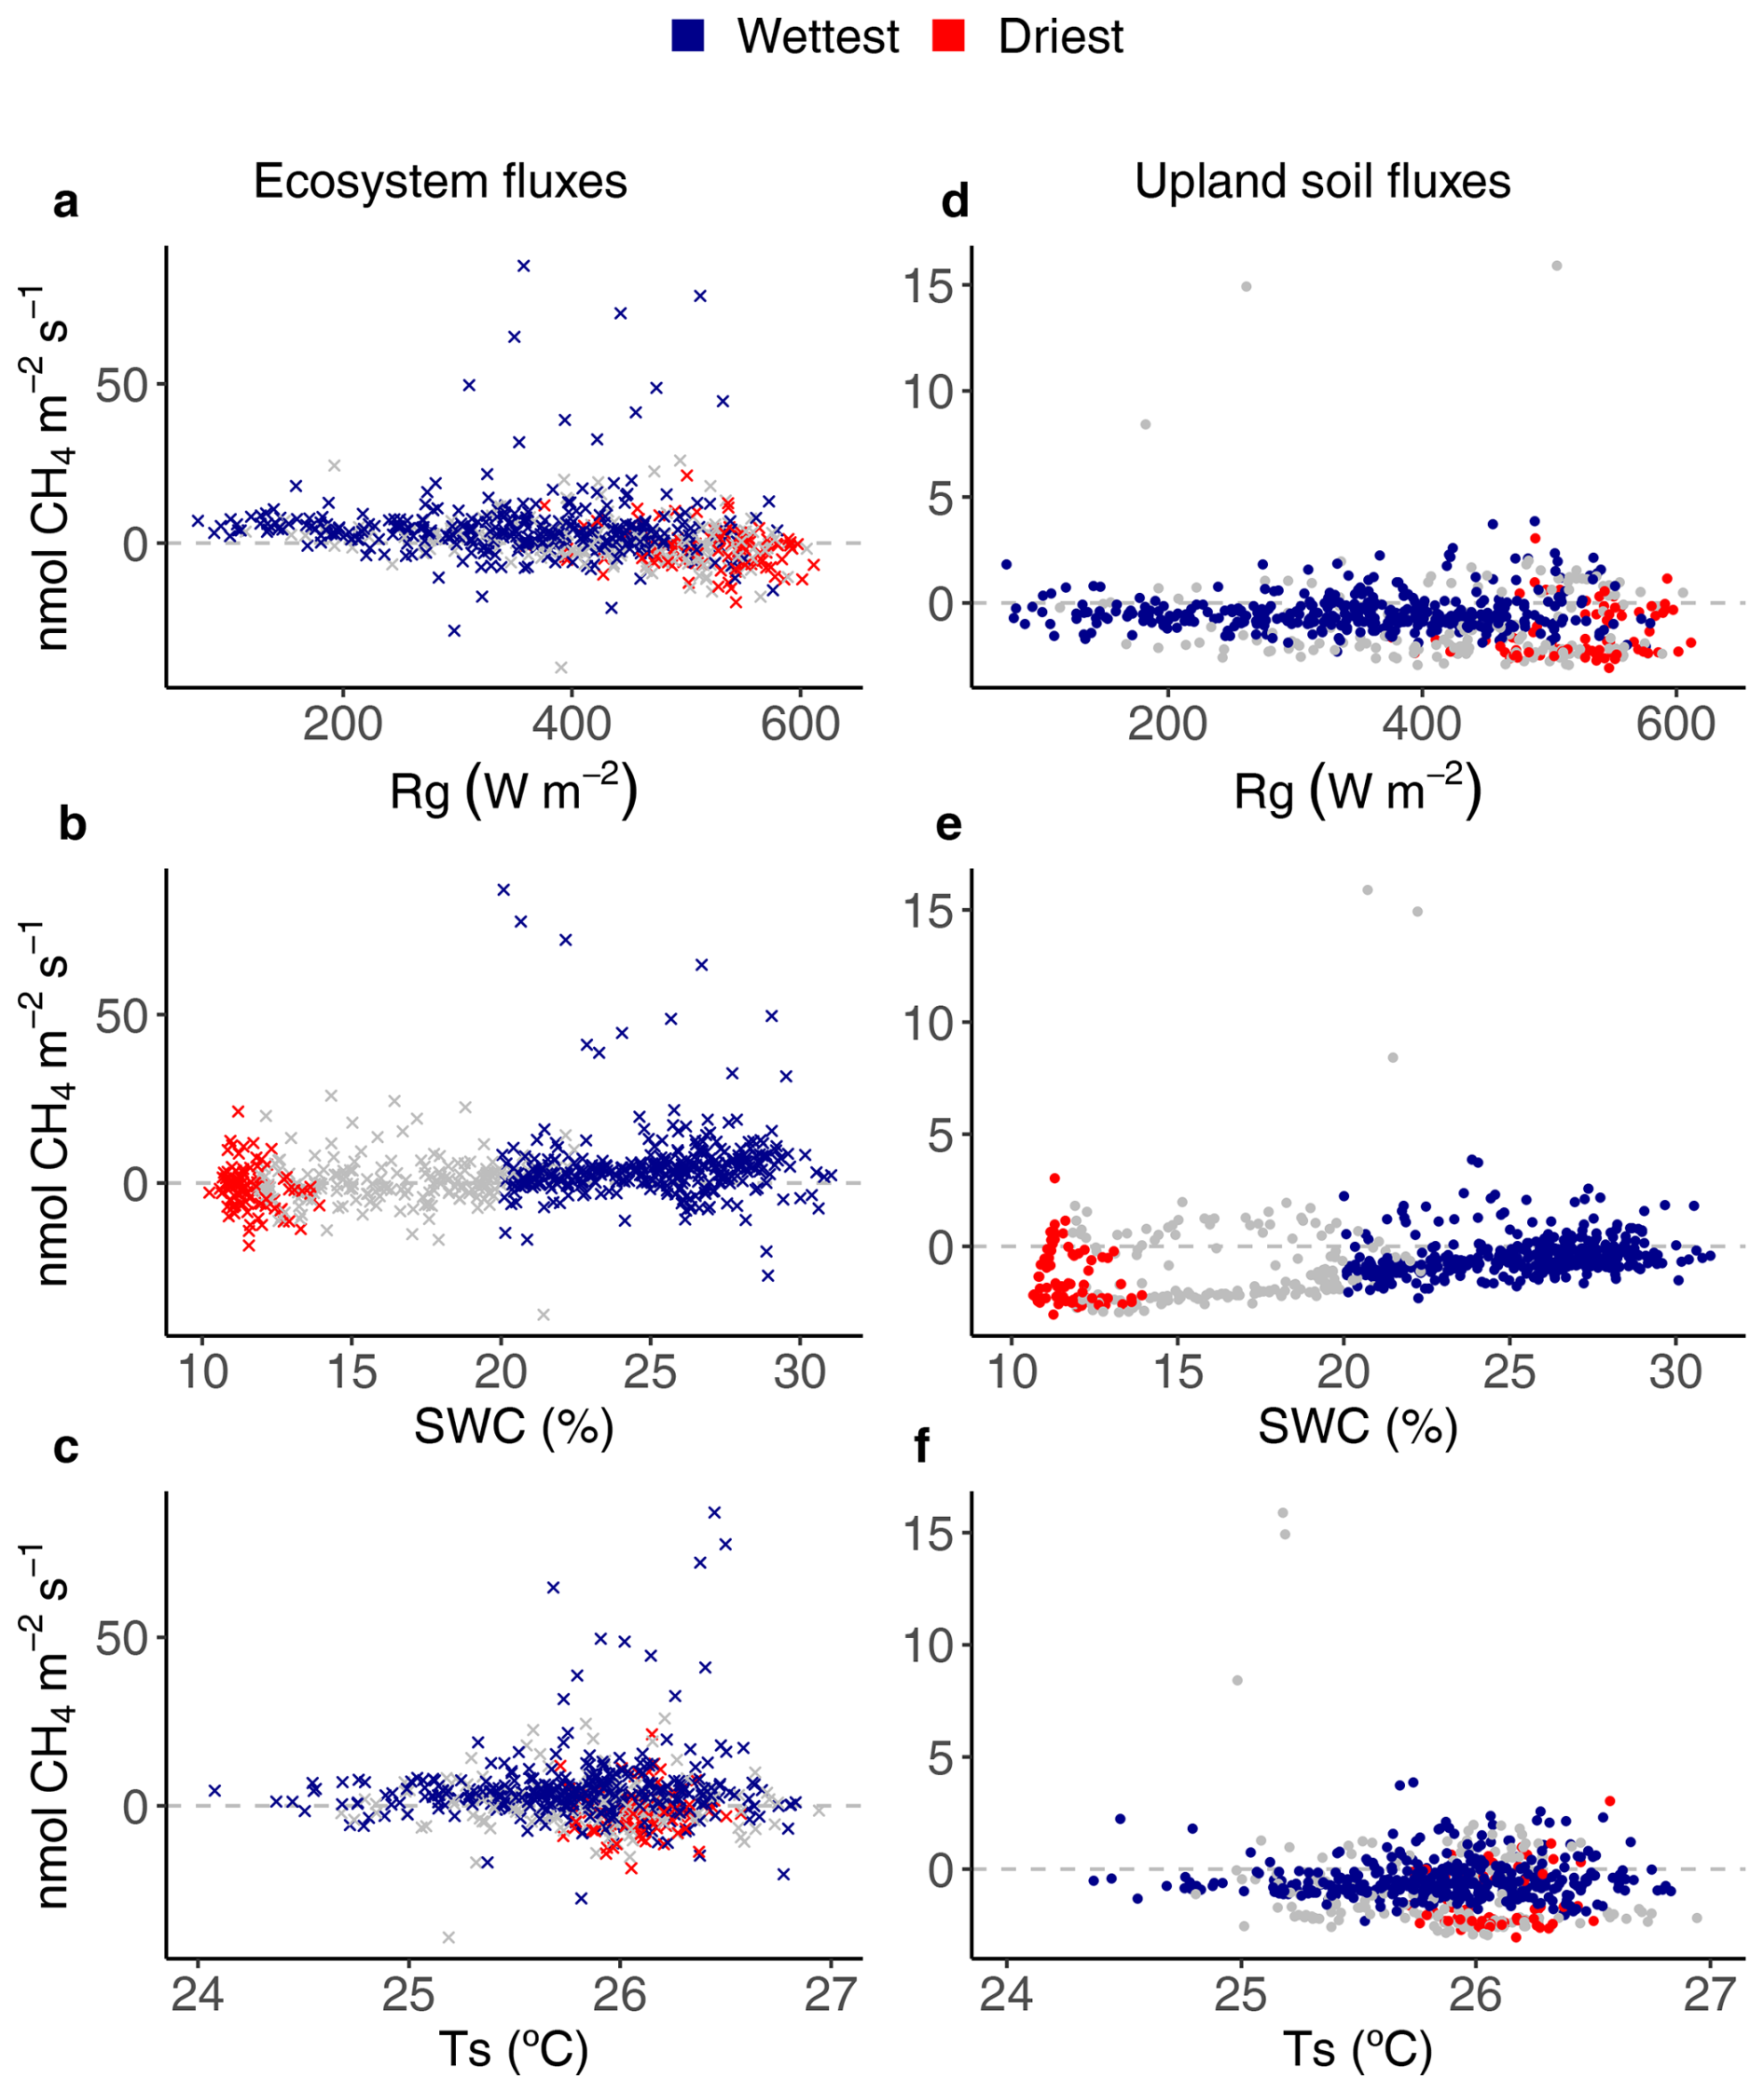
Figure 4Relationships between environmental drivers (global radiation (Rg), soil water content (SWC) and soil temperature (Ts)) and daily average ecosystem (crosses on the left) and upland soil (solid dots on the right) CH4 fluxes for the wettest (blue) and driest (red) seasons, with remaining data in grey, from 17 May 2016 to 2 August 2018 in the Guyaflux tropical forest, French Guiana. Positive fluxes above the horizontal “0” line indicate CH4 emissions and negative fluxes below the horizontal “0” line indicate CH4 uptake. Comparable relationships with the 1st–99th percentile range of CH4 flux data are shown in Fig. S6.
Even though the signs of the net CH4 flux were different at the ecosystem and soil levels, comparable relationships between CH4 fluxes and the environmental drivers were observed for the studied upland soils as for the ecosystem : net soil CH4 uptake increased with increasing Rg (Figs. 4d and S6d) and decreased with increasing SWC (Figs. 4e and S6e). Statistically significant terms were found during the driest season (i.e. ). However, the strongest relationship was observed with SWC during the wettest season (Table 2).
Ecosystem N2O fluxes only showed a significant response to SWC during the wettest season (Fig. 5b). However, the R2 of the model was very low (R2=0.04; Table 2). The best results for upland soil N2O fluxes were found with Ts and Rg, but only during the driest season (Fig. 5; Table 2).
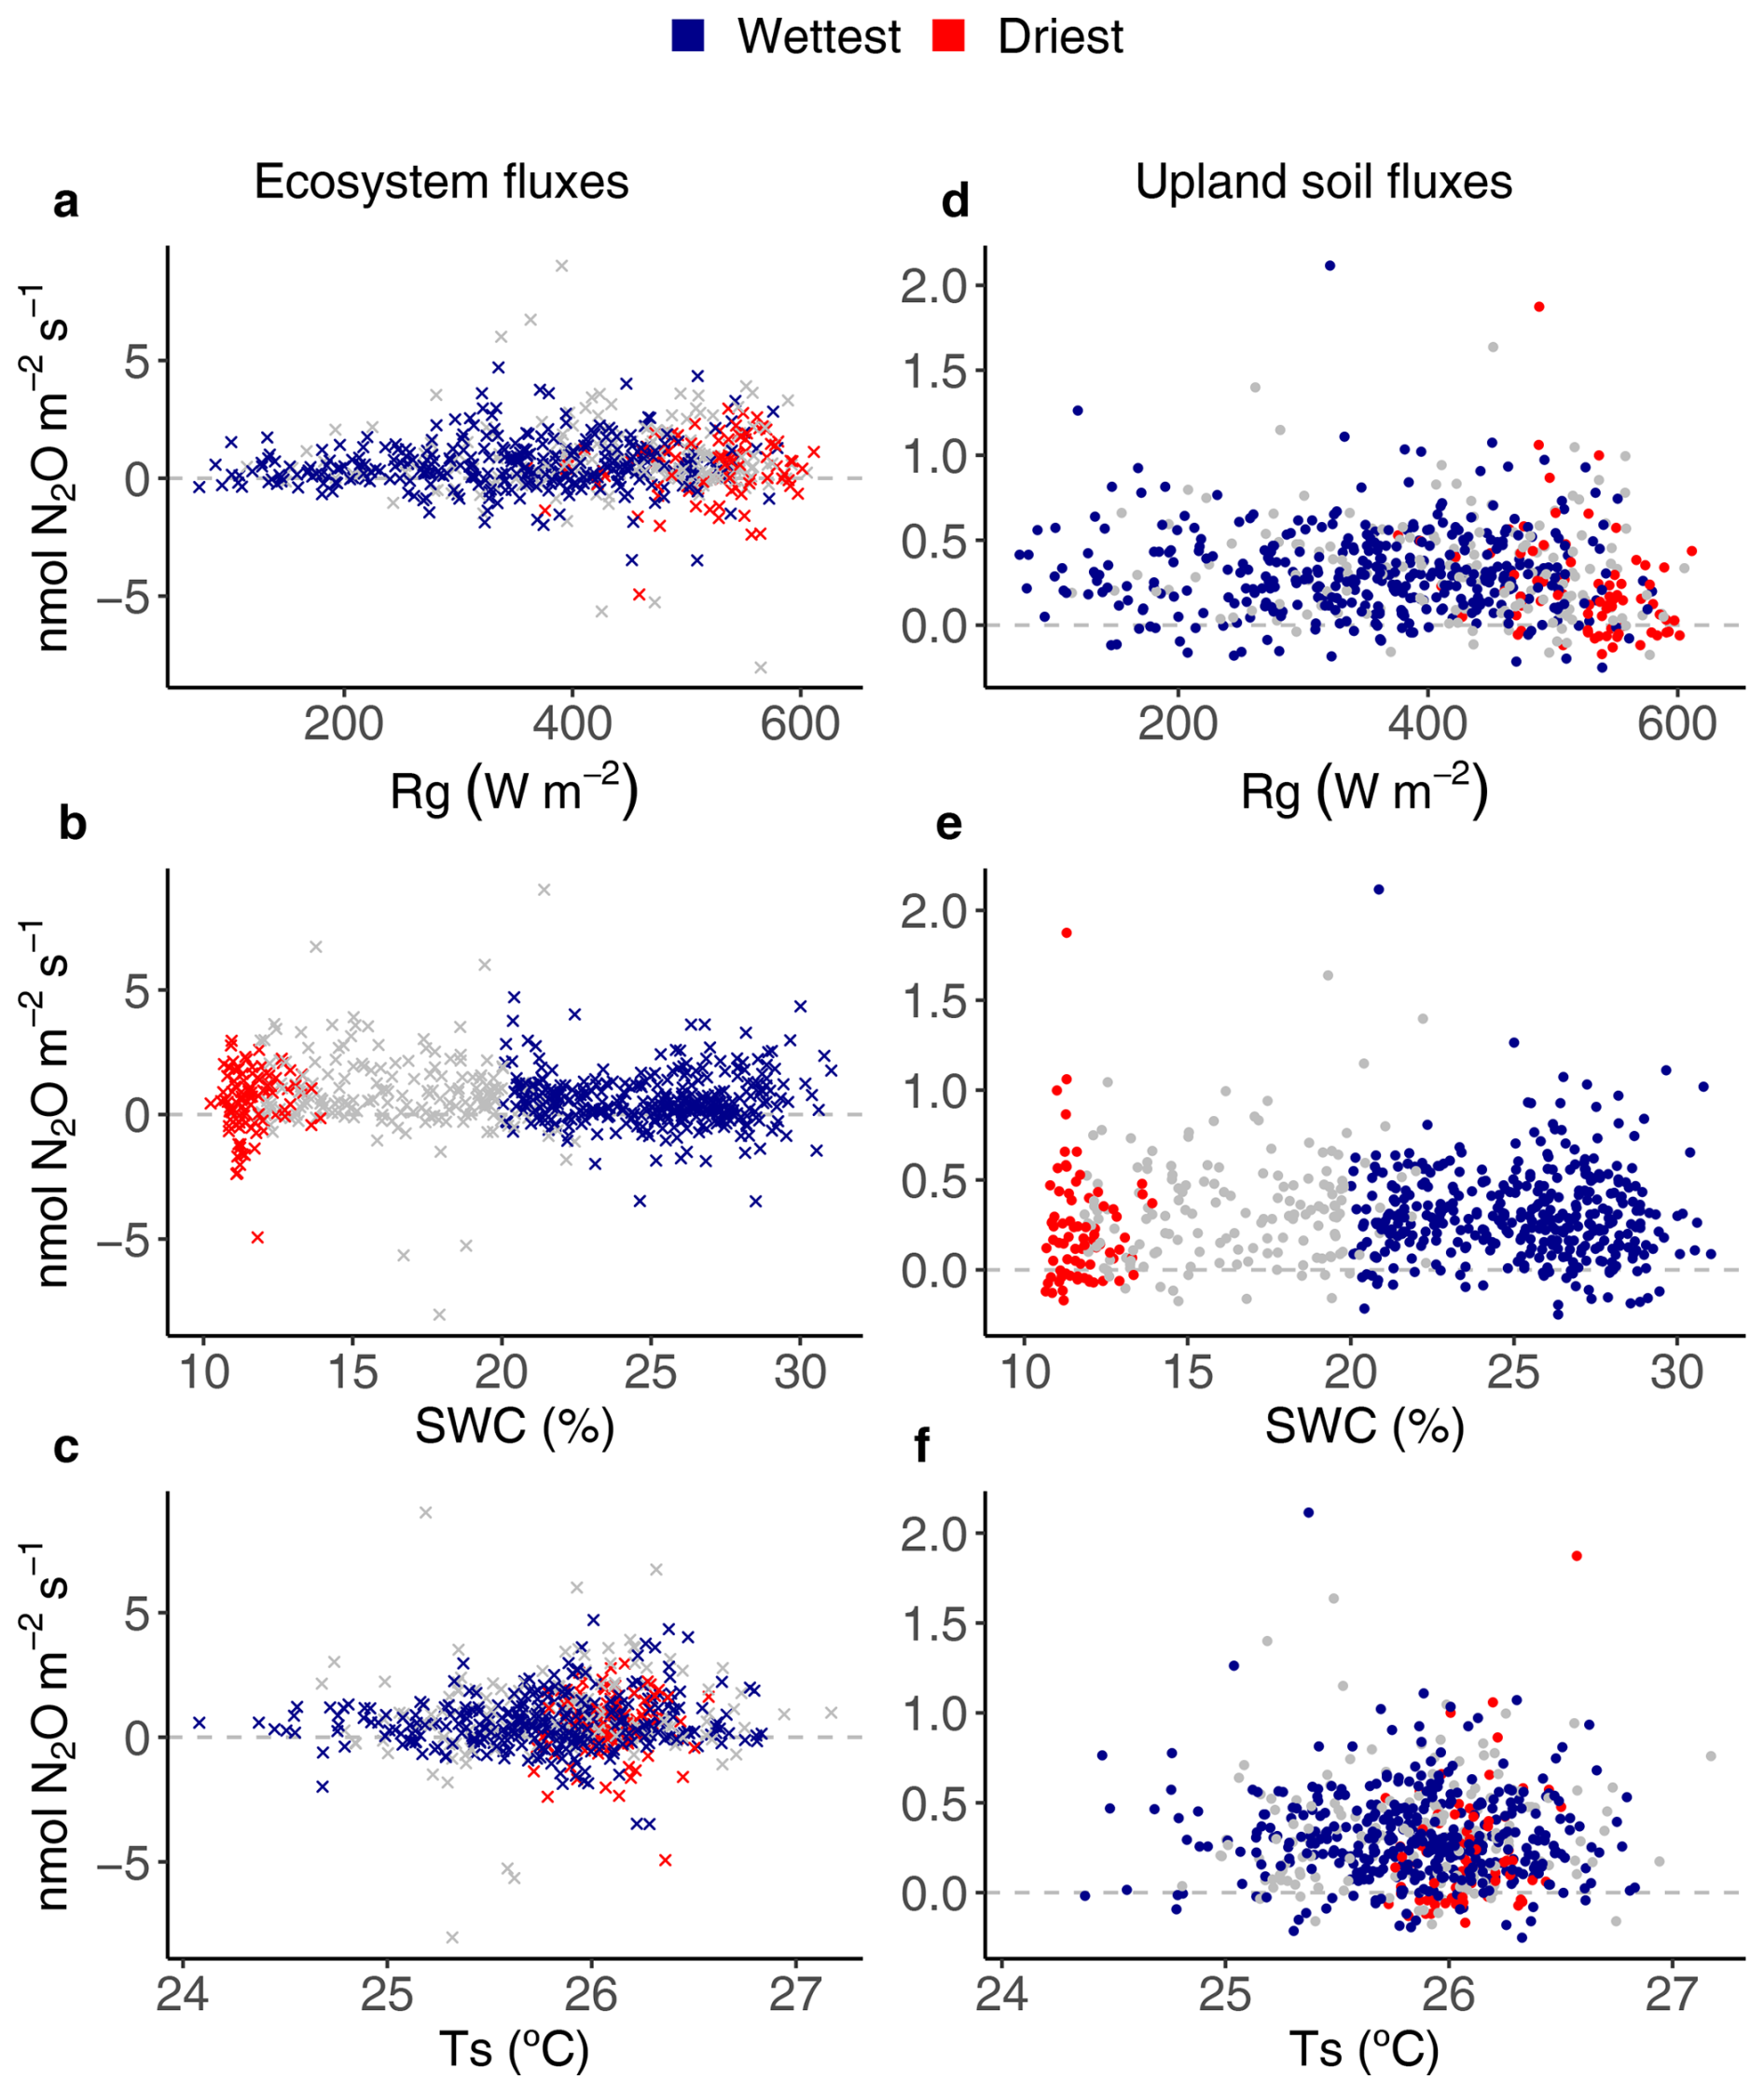
Figure 5Relationships between environmental drivers (global radiation (Rg), soil water content (SWC) and soil temperature (Ts)) and daily average ecosystem (crosses on the left) and upland soil (solid dots on the right) N2O fluxes for the wettest (blue) and driest (red) seasons, with remaining data in grey, from 17 May 2016 to 2 August 2018 in the Guyaflux tropical forest, French Guiana. Positive fluxes above the horizontal “0” line indicate N2O emissions and negative fluxes below the horizontal “0” line indicate N2O uptake. Comparable relationships with the 1st–99th percentile range of N2O flux data are shown in Fig. S7.
To our knowledge, this is the first study to report on simultaneous ecosystem and upland soil CH4 and N2O flux observations in a wet tropical forest over a period of more than 2 years (Fig. 2). This study provides a unique opportunity to investigate the dynamics and environmental drivers of CH4 and N2O fluxes in these ecosystems.
4.1 Ecosystem and upland soil-CH4 fluxes
4.1.1 Seasonal variations in ecosystem CH4 fluxes: trends and drivers
Our long-term monitoring of eddy covariance CH4 fluxes above the Guyaflux forest canopy showed high temporal variability, with changes in the sign (net emission or uptake) and amount of the ecosystem fluxes observed over short time scales, supporting hypothesis H1 (Fig. 2). Net CH4 emission rates (4.9 ± 11.2 ; Mean ± SD) dominated during the wettest season, whereas net CH4 uptake (−1.6 ± 6.4 ) was more common during the driest season, although large temporal variations occurred throughout the study seasons (Figs. 2 and 3, Table 1). Much higher wet-season net fluxes had previously been found in two Brazilian tropical forests, Manaus and Sinop (62.3 and 34.6 , respectively; Carmo et al., 2006), though the studies were based on canopy air samples and a modelling approach. Surprisingly, these Brazilian forests acted as an even larger CH4 source during the driest season (64.1 and 88.3 , respectively; Carmo et al., 2006), while the Guyaflux forest switched from a CH4 source during the wet periods to a small sink during the dry ones. Ecosystem CH4 fluxes are driven by a combination of plant, microbial and abiotic processes, which are mediated by both living and dead plants and can explain episodic bursts (Eugster and Plüss, 2010; Covey and Megonigal, 2019). The mechanisms underlying the large CH4 emissions during the dry season observed in the Brazilian forests remain unknown, but the authors suggest that it may have been connected to the anaerobic decay of waterlogged wood, undrained soil patches or the waterlogged cavities of tank bromeliads. Concomitantly, drought-induced reduced oxidation in the soil surface layer may have exacerbated the net CH4 emissions. Contrary to Carmo et al. (2006), Sakabe et al. (2018) found a seasonal pattern similar to the one we observed in our study where the eddy covariance technique was applied. Although the flux values they found had a higher range of variation (10.3 vs. −8.5 , respectively, in the wet and dry seasons), this was most likely due to the different ecosystem they studied, an Indonesian tropical peat swamp forest.
Surprisingly, in contrast to H2, the generalised additive models (GAM) revealed that none of the environmental variables studied, including SWC, were relevant drivers of ecosystem CH4 flux (Table 2; Fig. 4a–c). However, a similar statistical analysis of the remaining 1st-99th percentile range of data revealed a significant effect of various environmental drivers (Table S3). While these findings indicate that the models are relatively sensitive to extreme flux values, further explanation may be suggested. Indeed, a significant increase in SWC in the wettest season could stimulate CH4 production in most compartments of the ecosystem, not only in the seasonally flooded soils. At shallow depths, a higher SWC may reduce the amount of air-filled pore space, thereby decreasing the diffusion of oxygen and CH4 from the atmosphere through the soil to methanotrophs. As a result, there may be a decrease in net uptake or an increase in net emissions if production exceeds uptake (Wang et al., 2013). Such processes may occur in all the soil types within the footprint of the eddy flux tower (see Sect. 4.1.2) and may explain some of the seasonal trends observed at our site. Using the same range of data (excluding episodic CH4 peaks in July 2016 and June 2018), a statistically significant relationship was found between CH4 emissions and Rg during the wettest season (Table S3). This could occur if the occasional high light intensity (Fig. 1a) is sufficient to stimulate plant-mediated CH4 transport through sap flow, and/or if the measured forest area has more seasonally flooded areas than upland forest. However, the latter explanation is mitigated by the fact that the Guyaflux tower (∼300 m from the seasonally flooded area) was specifically chosen to guarantee consistent types of ecosystem flux observations regardless of the season and of associated changes in wind direction and atmospheric stability. Further research is needed to clarify the correlation between Rg and net CH4 flux. Increased fluxes in the flooded areas and anaerobic microsites, rather than seasonal changes in the footprint, probably explain part of the observed seasonal variations.
Disentangling the drivers of net CH4 fluxes is further complicated by aboveground processes that also contribute to CH4 emissions and uptake in forest ecosystems. Soil-produced CH4 dissolved in water can indeed be taken up by roots, transported through the xylem stream in the stem, branches and leaves, and then released into the atmosphere, thus bypassing the oxidation processes in the shallow soil layers. As such, the highest CH4 emissions from trees have been found in waterlogged soils, for example, in wetland and riparian forests (Pangala et al., 2013; Covey and Megonigal, 2019; Gauci, 2025). However, recent studies have shown that tree compartments (i.e. stems, branches, and leaves) can also consume CH4, particularly in free-draining upland soils (Gauci et al., 2024). At our study site, both stem CH4 emission and uptake were observed within the footprint of the Guyaflux tower (Bréchet et al., 2021, 2025; Daniel et al., 2023). Although these fluxes were weak, they may contribute to the seasonal variations in ecosystem CH4 exchanges (Bréchet et al., 2021, 2025; Daniel et al., 2023).
4.1.2 Seasonal variations in upland soil CH4 fluxes: trends and drivers
The upland soils studied within the tower footprint were active consumers of atmospheric CH4 (Fig. 3b), with an overall net uptake rates of 0.7 ± 1.5 (or 1.0 ), which is consistent with the global average for tropical forests (−0.7 or −2.5 , Dutaur and Verchot, 2007). Our results were also close to those of an Australian tropical rainforest (−0.8 , Butterbach-Bahl et al., 2004), but higher (i.e. lower uptake) than those of a Kenyan rainforest (ranging from −2.8 to −1.3 , Werner et al., 2007), with both studies using automated chamber systems. CH4 fluxes at our site ranged seasonally from −0.4 ± 0.9 in the wettest season to −1.4 ± 1.2 in the driest season (Table 1), supporting H1 and globally corroborating other seasonal studies in tropical forests. The sign of the upland soil CH4 fluxes were consistent between the driest and wettest seasons. A study conducted in a seasonal tropical forest in China with static chambers showed a comparable seasonal pattern for soils: they acted mainly as CH4 consumers, with an uptake rate of 0.7 ± 0.0 (or 29.5 ± 0.3 ; Werner et al., 2006) during the dry period. The uptake decreased by approximately 50 % after the first rainfall events and the associated increases in SWC. Another study carried out with the static chamber technique near the Guyaflux forest and in similar environmental conditions reported that upland soils consumed 1.0 ± 3.2 during the dry season (Courtois et al., 2018). Yet, those soils become slight emitters during the wet season (0.1 ± 0.9 ; corresponding to −44.0 ± 139.7 and 3.7 ± 40.1 for the dry and wet seasons, respectively; Courtois et al., 2018). Although meaningful, these comparisons between studies should be interpreted with great caution because the measurement techniques differed (i.e. automated in our study versus manual chambers in the other studies) as well as study duration (i.e. months versus years). In addition, CH4 flux dynamics in our upland soils were characterised by a large range of variation. Microtopographic and edaphic heterogeneity may have caused some chamber locations to remain aerobic in surface horizons, even during the wettest season. This may explain their year-round CH4-uptake, albeit reduced during the wettest season. Other locations, in contrast, may have become anaerobic during the wet season, disabling methanotrophs to oxidize the produced CH4 and eliciting a switch to net CH4 emissions.
From the GAMs, the best set of climatic variables, which explained 22 % of the seasonal variation in CH4 fluxes from upland soils, were SWC, Ts and Rg (Table 2), consistent with H2. We observed a net upland soil CH4 uptake during both the driest and the wettest seasons; CH4 emissions occurred only on a few days during the wettest season (Fig. 2b). This can likely be explained by the soil characteristics at our site where upland soils were hypoferralic acrisols, characterised by deep vertical drainage (Epron et al., 2006). It is likely that these well aerated soils provided the aerobic conditions for methanotrophic CH4 oxidation (Smith et al., 2003). The seasonal variations in net CH4 fluxes were strong (Fig. 3b), with a net soil CH4 uptake more than three times higher in the driest season than in the wettest season. This is consistent with the known dependence of soil CH4 fluxes on topsoil SWC (Figs. 4e and S6e; Tables 1 and 2): dryer soil conditions favour soil methanotrophy (Le Mer and Roger, 2001), whereas wetter soil conditions reduce methanotrophic communities and/or their activity (Covey and Megonigal, 2019). In addition, the significant influence of Ts on soil CH4 uptake may be attributed to the temperature sensitivity of the underlying enzymatic process. However, at elevated temperatures (>15 °C), such as in tropical forests, gas diffusion limitations and drought effects may supersede temperature responses (Steinkamp et al., 2001). The significant relationships between Rg and upland soil CH4 fluxes are still unclear. Yet when the combined effects of changes in SWC and Ts were considered, the explanatory power of the GAM with regard to soil CH4 flux variations remained low. This suggests that other factors, such as substrate availability, soil aeration, gas diffusivity and microbial processes, may significantly control the temporal dynamics of CH4 fluxes at our study site.
4.2 Ecosystem and upland soil-N2O fluxes
4.2.1 Seasonal variations in ecosystem N2O fluxes: trends and drivers
The measurements at the Guyaflux wet-tropical-forest site revealed very low N2O fluxes, with an average net emission of 0.7 ± 1.3 (Fig. 3c; Table S2). Though low, this loss of nitrogen (N) from the ecosystem is equivalent to approximately one-fourth of the annual atmospheric N deposition at the site (3.1 here vs. 13 in Van Langenhove et al., 2020b). Compared to other publications on forest ecosystem N2O fluxes from studies based on eddy covariance techniques, net ecosystem N2O fluxes at our study site were similar to the average fluxes reported by Stiegler et al. (2023) for a regularly-fertilised Indonesian oil palm plantation (0.7 ± 0.0 or 0.32 ± 0.003 ) but much higher than those reported by Mander et al. (2021) for a temperate riparian deciduous forest (0.1 or 87.3 mg N2O-N m−2 for the September 2017–December 2019 period).
Measured ecosystem-level N2O fluxes at the Guyaflux site were highly variable, but overall showed little seasonal variation (means of 0.5 ± 1.3 and 0.6 ± 1.0 , in the driest and the wettest seasons, respectively; Table 1), partially supporting H1. These observations fall within the range of net ecosystem N2O exchanges measured by eddy covariance reported in an oil palm plantation in Indonesia, with comparable mean N2O emissions of 0.7 for both the dry and wet seasons (Stiegler et al., 2023). Once again, this comparison must be interpreted with extreme caution even though both studies used the eddy covariance technique as the ecosystems and seasons concerned were different (a tropical oil palm plantation with strong seasons versus a primary wet tropical forest).
As with CH4 fluxes, the temporal variability of the N2O fluxes was very high (Fig. 2c). Although the explanatory power of the relationships was poor (R2=0.04, Table 2), the GAM analyses supported H2 by attributing some of the variations in N2O fluxes to changes in SWC. Furthermore, daily mean ecosystem N2O fluxes switched signs and changed in order of magnitude on short time scales, most likely because these fluxes are controlled by discontinuous microbial processes (Blagodatsky and Smith, 2012). Yet, although there were no seasonal differences, the statistically significant relationships between ecosystem N2O fluxes and SWC suggested that the wettest season may provide favourable conditions for soil bacterial N2O production and plant-mediated N2O transport, which could contribute to higher net N2O emissions at the ecosystem level (Stiegler et al., 2023). It is worth noting that the extent to which trees mediate N2O emissions is still uncertain; at Guyaflux, within the tower footprint, tree stems in the seasonally flooded forest emit N2O while those in the upland forest absorb N2O (Daniel et al., 2023). Other studies at Guyaflux and in a lowland tropical rain forest in the Réunion Islands reported that tree stems can absorb N2O through as yet unknown mechanisms (Bréchet et al., 2021, 2025; Machacova et al., 2021). This could indeed counteract the overriding, albeit small, net ecosystem N2O emissions, suggesting that the proportion of upland versus seasonally flooded areas should be taken into account.
4.2.2 Seasonal variations in upland soil N2O fluxes: trends and drivers
In support of H1, N2O fluxes recorded for the studied upland soils were small, averaging 0.3 ± 0.3 (Table S2), but significantly higher during the wettest season (0.3 ± 0.3 ) compared to the driest season (0.2 ± 0.3 ; Table 1).
Our average flux value, 15.6 , was nearly 3 times smaller than those reported for a Kenyan rainforest (42.9 , Werner et al., 2007) and about 1.5 times smaller than those found for an Australian tropical rainforest (25.6 , Butterbach-Bahl et al., 2004), even though the soils in both cases were predominantly N2O emitters and all measurements were performed with automated chamber systems. However, our seasonal N2O flux observations were within the same order of magnitude as those in two tropical rainforests where soil N2O emissions measured with manual chambers were lower in the dry season than in the wet season (<0.20 and 0.34 , respectively, Yu et al., 2021; 0.10 and 0.49 , respectively, Werner et al., 2006). In addition, net N2O uptake was observed in the studied upland soil, a phenomenon that has rarely been reported in tropical forests. Previous observations at the Guyaflux site revealed soil N2O uptake and showed that, although these fluxes were low, they were primarily recorded over short measurement periods (2 min instead of 25 min; Courtois et al., 2019). The very low flux detection limit of our instrument (G2308; Picarro) may explain why net uptake fluxes were frequently measured. Since N2O uptake rates are typically small, setups with a high MDF, which are usually employed in remote areas such as tropical rainforests, are often unable to detect these small uptake fluxes. Regarding the seasonal pattern, we suspect that during the wet season, when conditions are ideal for both litter mineralisation and heterotrophic N2 fixation (Van Langenhove et al., 2020a), as well as denitrification, N2O production typically exceeds consumption. During the dry season, however, the drier conditions in the topsoil favour N2O uptake, enabling microbial communities to consume all the N2O produced on average.
Unlike H2, the GAMs, including climatic variables, could only partially predict the observed seasonal variations in upland soil N2O fluxes, with Ts and Rg as drivers (Table 2; Fig. 5). This was even more unexpected as it only occurred during the driest season (Table 2), when low SWC occurred alongside high and stable Ts and Rg (Fig. 1b, d, and a, respectively). Previous studies have observed an exponential increase in soil N2O fluxes with Ts (Schindlbacher et al., 2004; Smith et al., 2003), which can be explained by the temperature sensitivity of the underlying enzymatic processes. However, Ts at our tropical site did not vary greatly (Fig. 1d). In addition, the significant relationships between Rg and the upland soil N2O fluxes are still unclear. Although these relationships were significant, their explanatory power was poor (R2=0.10), suggesting that other controlling variables such as N and carbon availability (Morley and Baggs, 2010), or microbial community dynamics (Regan et al., 2011), may also substantially influence the temporal dynamics of N2O fluxes. This emphasised the potential for both synergistic and antagonistic effects of key environmental drivers (e.g. Ts, SWC) on regulating variables, highlighting the complexity of predicting seasonal variations in N2O flux in upland tropical forest soils.
Our long-term monitoring of ecosystem and soil CH4 and N2O fluxes over a period of 26 months under contrasting climatic conditions revealed highly variable fluxes that changed direction and amount on short time scales and between the driest and the wettest seasons. At the ecosystem level, mean daily CH4 and N2O fluxes were low, but N2O emissions were observed all-year-round, whereas CH4 emissions or uptake depended on the season. Seasonality was statistically significant for CH4, with uptake mainly occurring during the driest season compared to the wettest season. For the upland soil we studied, CH4 and N2O fluxes were highly variable, with statistically significant increase in CH4 uptake and decrease in N2O emissions from the wettest to the driest season. Overall, the selected climatic variables only explained a minor part of the seasonal variations in net ecosystem greenhouse gas fluxes. In addition, the results of the relationships for CH4 depended on the selected ecosystem flux values. The best results were found when the effects of changes in SWC and Ts were considered, although the explanatory power of the models with regard to seasonal variations in soil CH4 and N2O fluxes was at most 20 %.
Measurements at the ecosystem and soil levels showed divergent fluxes, probably because studied upland soil fluxes represent only one compartment of the whole ecosystem. Furthermore, upland soils (52 % of the footprint area) are just one type of the wide variety of soils found within the footprint of the Guyaflux tower. Soil chambers also provide integrated fluxes for a much smaller area than does the eddy covariance technique, which collects data from integrated processes across various forest habitats, soil types, tree species, hydrological conditions, and topographical positions. To improve the understanding of seasonal variations in ecosystem CH4 and N2O fluxes, it is crucial to characterise the fluxes in all existing ecosystem compartments simultaneously, including all tree components (leaves, stems, branches) and species in the forest habitats, not just those on upland soils. Our study still provides valuable data which, when combined with mechanistic models, could help to identify the missing drivers responsible for the seasonal variations in CH4 and N2O fluxes in wet tropical forest ecosystems.
The datasets analysed during the current study are available at the Zenodo repository (Bréchet et al., 2025; Bréchet, 2025): https://doi.org/10.5281/zenodo.17535314, and are also available from the corresponding author upon request.
The supplement related to this article is available online at https://doi.org/10.5194/bg-22-8031-2025-supplement.
LMB, MI, CS, DB, IAJ conceived the ideas and designed the methodology; LMB and BB collected the data; LMB and MI performed quality control checks on the data and analysed the data; IAJ and RBJ obtained the funding; LMB led the writing of the manuscript and all authors contributed to the manuscript and gave final approval for submission.
The contact author has declared that none of the authors has any competing interests.
Publisher's note: Copernicus Publications remains neutral with regard to jurisdictional claims made in the text, published maps, institutional affiliations, or any other geographical representation in this paper. While Copernicus Publications makes every effort to include appropriate place names, the final responsibility lies with the authors. Views expressed in the text are those of the authors and do not necessarily reflect the views of the publisher.
We would like to thank Jean-Yves Goret, Nicola Arriga and Elodie Courtois for their technical support. We would also like to thank Vicki Moore for correcting the English in this paper, and the two anonymous reviewers who made valuable contributions to the previous version of the manuscript.
This work was supported by the European Research Council Synergy grant ERC-2013-SyG-610028-IMBALANCE-P and the European Commission through a Marie Skodowska-Curie Individual Fellowship H2020-MSCA-IF-2017-796438 awarded to L. M. Bréchet, the UMR “Ecologie des Forets de Guyane” (EcoFoG) and the Research Fund of the University of Antwerp. This work was also supported by the Gordon and Betty Moore Foundation, Stanford University and the National Research Institute for Agriculture, Food and Environment (INRAE) through the Gordon and Betty Moore Foundation grant GBMF-11519 for L. M. Bréchet's Postdoctoral Fellowship, and by an Investissement d'Avenir grant from the Agence Nationale de la Recherche (CEBA: ANR-10-LABX-25-01).
This paper was edited by Lutz Merbold and reviewed by two anonymous referees.
Aguilos, M., Hérault, B., Burban, B., Wagner, F., and Bonal, D.: What drives long-term variations in carbon flux and balance in a tropical rainforest in French Guiana?, Agr. Forest Meteorol., 253–254, 114–123, https://doi.org/10.1016/j.agrformet.2018.02.009, 2018.
Aubinet, M., Grelle, A., Ibrom, A., Rannik, Ü., Moncrieff, J., Foken, T., Kowalski, A. S., Martin, P. H., Berbigier, P., Bernhofer, C., Clement, R., Elbers, J., Granier, A., Grünwald, T., Morgenstern, K., Pilegaard, K., Rebmann, C., Snijders, W., Valentini, R., and Vesala, T.: Estimates of the annual net carbon and water exchange of European forests: the EUROFLUX methodology, Adv. Ecol. Res., 30, 114–175, https://doi.org/10.1016/S0065-2504(08)60018-5, 2000.
Aubinet, M., Vesala, T., and Papale, D. (Eds.): Eddy covariance: a practical guide to measurement and data analysis, Springer Science and Business Media, https://doi.org/10.1007/978-94-007-2351-1, 2012.
Baldocchi, D.: Measuring fluxes of trace gases and energy between ecosystems and the atmosphere – the state and future of the eddy covariance method, Glob. Change Biol., 20, 3600–3609, https://doi.org/10.1111/gcb.12649, 2014.
Baldocchi, D. D.: Assessing the eddy covariance technique for evaluating carbon dioxide exchange rates of ecosystems: past, present and future, Glob. Change Biol., 9, 479–492, https://doi.org/10.1046/j.1365-2486.2003.00629.x, 2003.
Baldocchi, D. D.: How eddy covariance flux measurements have contributed to our understanding of Global Change Biology, Glob. Change Biol., 26, 242–260, https://doi.org/10.1111/gcb.14807, 2020.
Blagodatsky, S. and Smith, P.: Soil physics meets soil biology: towards better mechanistic prediction of greenhouse gas emissions from soil, Soil Biol. Biochem., 47, 78–92, https://doi.org/10.1016/j.soilbio.2011.12.015, 2012.
Bonal, D., Bosc, A., Ponton, S., Goret, J.-Y., Burban, B. T., Gross, P., Bonnefond, J. M., Elbers, J., Longdoz, B., Epron, D., Guehl, J. M., and Granier, A.: Impact of severe dry season on net ecosystem exchange in the Neotropical rainforest of French Guiana, Glob. Change Biol., 14, 1917–1933, https://doi.org/10.1111/j.1365-2486.2008.01610.x, 2008.
Bouwman, A. F., Fung, I., Matthews, E., and John, J.: Global analysis of the potential for N2O production in natural soils, Global Biogeochem. Cy., 7, 557–597, https://doi.org/10.1029/93GB01186, 1993.
Bréchet, L.: Dynamics and environmental drivers of methane and nitrous oxide fluxes at the soil and ecosystem levels in a wet tropical forest, Zenodo [data set], https://doi.org/10.5281/zenodo.17535314, 2025.
Bréchet, L. M., Daniel, W., Stahl, C., Burban, B., Goret, J.-Y., Salomόn, R. L., and Janssens, I. A.: Simultaneous tree stem and soil greenhouse gas (CO2, CH4, N2O) flux measurements: a novel design for continuous monitoring towards improving flux estimates and temporal resolution, New Phytol., 230, 2487–2500, https://doi.org/10.1111/nph.17352, 2021.
Bréchet, L. M., Salomόn, R. L., Machacova, K., Stahl, C., Burban, B., Goret, J.-Y., Steppe, K., Bonal, D., and Janssens, I. A.: Insights into the subdaily variations in methane, nitrous oxide and carbon dioxide fluxes from upland tropical tree stems, New Phytol., 245, 2451–2466, https://doi.org/10.1111/nph.20401, 2025.
Butterbach-Bahl, K., Kock, M., Willibald, G., Hewett, B., Buhagiar, S., Papen, H., and Kiese, R.: Temporal variations of fluxes of NO, NO2, N2O, CO2, and CH4 in a tropical rain forest ecosystem, Global Biogeochem. Cy., 18, 3, https://doi.org/10.1029/2004GB002243, 2004.
Carmo, J. B., Keller, M., Dias, J. D., Camargo, P. B., and Crill, P.: A source of methane from upland forests in the Brazilian Amazon, Geophys. Res. Lett., 33, 4, https://doi.org/10.1029/2005GL025436, 2006.
Courtois, E. A., Stahl, C., Van den Berge, J., Bréchet, L., Van Langenhove, L., Richter, A., Urbina, I., Soong, J. L., Penuelas, J., and Janssens, I. A.: Spatial variation of soil CO2, CH4 and N2O fluxes across topographical positions in tropical forests of the guiana shield, Ecosystems, 21, 1445–1458, https://doi.org/10.1007/s10021-018-0232-6, 2018.
Courtois, E. A., Stahl, C., Burban, B., Van den Berge, J., Berveiller, D., Bréchet, L., Soong, J. L., Arriga, N., Peñuelas, J., and Janssens, I. A.: Automatic high-frequency measurements of full soil greenhouse gas fluxes in a tropical forest, Biogeosciences, 16, 785–796, https://doi.org/10.5194/bg-16-785-2019, 2019.
Covey, K., Soper, F., Pangala, S., Bernardino, A., Pagliaro, Z., Basso, L., Cassol, H., Fearnside, P., Navarrete, D., Novoa, S., and Sawakuchi, H.: Carbon and beyond: The biogeochemistry of climate in a rapidly changing Amazon, Front. For. Glob. Change., 4, 1–20, https://doi.org/10.3389/ffgc.2021.618401, 2021.
Covey, K. R. and Megonigal, J. P.: Methane production and emissions in trees and forests, New Phytol., 222, 35–51, https://doi.org/10.1111/nph.15624, 2019.
Daniel, W., Stahl, C., Burban, B., Goret, J.-Y., Cazal, J., Richter, A., Janssens, I. A., and Bréchet, L. M.: Tree stem and soil methane and nitrous oxide fluxes, but not carbon dioxide fluxes, switch sign along a topographic gradient in a tropical forest, Plant Soil, 488, 533–549, https://doi.org/10.1007/s11104-023-05991-y, 2023.
Davidson, E. A., De Araüjo, A. C., Artaxo, P., Balch, J. K., Brown, I. F., Mercedes, M. M., Coe, M. T., Defries, R. S., Keller, M., Longo, M., Munger, J. W., Schroeder, W., Soares-Filho, B. S., Souza, C. M., and Wofsy, S. C.: The Amazon basin in transition, Nature, 481, 321–328, https://doi.org/10.1038/nature10717, 2012.
Delwiche, K. B., Knox, S. H., Malhotra, A., Fluet-Chouinard, E., McNicol, G., Feron, S., Ouyang, Z., Papale, D., Trotta, C., Canfora, E., Cheah, Y.-W., Christianson, D., Alberto, Ma. C. R., Alekseychik, P., Aurela, M., Baldocchi, D., Bansal, S., Billesbach, D. P., Bohrer, G., Bracho, R., Buchmann, N., Campbell, D. I., Celis, G., Chen, J., Chen, W., Chu, H., Dalmagro, H. J., Dengel, S., Desai, A. R., Detto, M., Dolman, H., Eichelmann, E., Euskirchen, E., Famulari, D., Fuchs, K., Goeckede, M., Gogo, S., Gondwe, M. J., Goodrich, J. P., Gottschalk, P., Graham, S. L., Heimann, M., Helbig, M., Helfter, C., Hemes, K. S., Hirano, T., Hollinger, D., Hörtnagl, L., Iwata, H., Jacotot, A., Jurasinski, G., Kang, M., Kasak, K., King, J., Klatt, J., Koebsch, F., Krauss, K. W., Lai, D. Y. F., Lohila, A., Mammarella, I., Belelli Marchesini, L., Manca, G., Matthes, J. H., Maximov, T., Merbold, L., Mitra, B., Morin, T. H., Nemitz, E., Nilsson, M. B., Niu, S., Oechel, W. C., Oikawa, P. Y., Ono, K., Peichl, M., Peltola, O., Reba, M. L., Richardson, A. D., Riley, W., Runkle, B. R. K., Ryu, Y., Sachs, T., Sakabe, A., Sanchez, C. R., Schuur, E. A., Schäfer, K. V. R., Sonnentag, O., Sparks, J. P., Stuart-Haëntjens, E., Sturtevant, C., Sullivan, R. C., Szutu, D. J., Thom, J. E., Torn, M. S., Tuittila, E.-S., Turner, J., Ueyama, M., Valach, A. C., Vargas, R., Varlagin, A., Vazquez-Lule, A., Verfaillie, J. G., Vesala, T., Vourlitis, G. L., Ward, E. J., Wille, C., Wohlfahrt, G., Wong, G. X., Zhang, Z., Zona, D., Windham-Myers, L., Poulter, B., and Jackson, R. B.: FLUXNET-CH4: a global, multi-ecosystem dataset and analysis of methane seasonality from freshwater wetlands, Earth Syst. Sci. Data, 13, 3607–3689, https://doi.org/10.5194/essd-13-3607-2021, 2021.
Dutaur, L. and Verchot, L. V.: A global inventory of the soil CH4 sink. Global Biogeochem. Cy., 21, 4, https://doi.org/10.1029/2006GB002734, 2007.
Epron, D., Bosc, A., Bonal, D., and Freycon, V.: Spatial variation of soil respiration across a topographic gradient in a tropical rain forest in French Guiana, J. Trop. Ecol., 22, 565–574, https://doi.org/10.1017/S0266467406003415, 2006.
Eugster, W. and Merbold, L.: Eddy covariance for quantifying trace gas fluxes from soils, SOIL, 1, 187–205, https://doi.org/10.5194/soil-1-187-2015, 2015.
Eugster, W. and Plüss, P.: A fault-tolerant eddy covariance system for measuring CH4 fluxes, Agr. Forest Meteorol., 150, 841–851, https://doi.org/10.1016/j.agrformet.2009.12.008, 2010.
Fang, J., Fang, J., Chen, B., Zhang, H., Dilawar, A., Guo, M., and Liu, S. A.: Assessing spatial representativeness of global flux tower eddy-covariance measurements using data from FLUXNET2015, Sci. Data, 11, 569, https://doi.org/10.1038/s41597-024-03291-3, 2024.
Gauci, V.: Tree methane exchange in a changing world, Nat. Rev. Earth Environ., 6, 471–483, https://doi.org/10.1038/s43017-025-00692-9, 2025.
Gauci, V., Pangala, S. R., Shenkin, A., Barba, J., Bastviken, D., Figueiredo, V., Gomez, C., Enrich-Prast, A., Sayer, E., Stauffer, T., and Welch, B.: Global atmospheric methane uptake by upland tree woody surfaces, Nature, 631, 796–800, https://doi.org/10.1038/s41586-024-07592-w, 2024.
Groffman, P. M., Butterbach-Bahl, K., Fulweiler, R. W., Gold, A. J., Morse, J. L., Stander, E. K., Tague, C., Tonitto, C., and Vidon, P.: Challenges to incorporating spatially and temporally explicit phenomena (hotspots and hot moments) in denitrification models, Biogeochemistry, 93, 49–77, https://doi.org/10.1007/s10533-008-9277-5, 2009.
Ito, A. and Inatomi, M.: Use of a process-based model for assessing the methane budgets of global terrestrial ecosystems and evaluation of uncertainty, Biogeosciences, 9, 759–773, https://doi.org/10.5194/bg-9-759-2012, 2012.
IUSS Working Group WRB: World Reference Base for Soil Resources 2014, update 2015 International soil classification system for naming soils and creating legends for soil maps, World Soil Resources Reports No. 106, FAO, Rome, https://www.fao.org/3/i3794en/I3794en.pdf (last access: 5 November 2020), 2015.
Jones, C. M., Spor, A., Brennan, F. P., Breuil, M. C., Bru, D., Lemanceau, P., Griffiths, B., Hallin, S., and Philippot, L.: Recently identified microbial guild mediates soil N2O sink capacity, Nat. Clim. Change, 4, 801–805, https://doi.org/10.1038/nclimate2301, 2014.
Khalil, K., Mary, B., and Renault, P.: Nitrous oxide production by nitrification and denitrification in soil aggregates as affected by O2 concentration, Soil Biol. Biochem., 36, 687–699, https://doi.org/10.1016/j.soilbio.2004.01.004, 2004.
Knox, S. H., Bansal, S., McNicol, G., Schafer, K., Sturtevant, C., Ueyama, M., Valach, A. C., Baldocchi, D., Delwiche, K., Desai, A. R., Euskirchen, E., Liu, J., Lohila, A., Malhotra, A., Melling, L., Riley, W., Runkle, B. R. K., Turner, J., Vargas, R., Zhu, Q., Alto, T., Fluet-Chouinard, E., Goeckede, M., Melton, J. R., Sonnentag, O., Vesala, T., Ward, E., Zhang, Z., Feron, S., Ouyang, Z., Alekseychik, P., Aurela, M., Bohrer, G., Campbell, D. I., Chen, J., Chu, H., Dalmagro, H. J., Goodrich, J. P., Gottschalk, P., Hirano, T., Iwata, H., Jurasinski, G., Kang, M., Koebsch, F., Mammarella, I., Nilsson, M. B., Ono, K., Peichl, M., Peltola, O., Ryu, Y., Sachs, T., Sakabe, A., Sparks, J. P., Tuittila, E.-S., Vourlitis, G. L., Wong, G. X., Windham-Myers, L., Poulter, B., and Jackson, R. B.: Identifying dominant environmental predictors of freshwater wetland methane fluxes across diurnal to seasonal time scales, Glob. Change Biol., 27, 35823604, https://doi.org/10.1111/gcb.15661, 2021.
Le Mer, J. and Roger, P.: Production, oxidation, emission and consumption of methane by soils: a review, Eur. J. Soil Biol., 37, 25–50, https://doi.org/10.1016/S1164-5563(01)01067-6, 2001.
Liu, Z., Li, H., Wu, F., Wang, H., Chen, H., Zhu, Q., Yang, G., Liu, W., Chen, D., Li, Y., and Peng, C.: Quantification of ecosystem-scale methane sinks observed in a tropical rainforest in Hainan, China, Land, 11, 154, https://doi.org/10.3390/land11020154, 2022.
Lucas-Moffat, A. M., Huth, V., Augustin, J., Brummer, C., Herbst, M., and Kutsch, W. L.: Towards pairing plot and field scale measurements in managed ecosystems: Using eddy covariance to cross-validate CO2 fluxes modeled from manual chamber campaigns, Agr. Forest Meteorol., 256, 362–378, https://doi.org/10.1016/j.agrformet.2018.01.023, 2018.
Machacova, K., Borak, L., Agyei, T., Schindler, T., Soosaar, K., Mander, Ü., and Ah-Peng, C.: Trees as net sinks for methane (CH4) and nitrous oxide (N2O) in the lowland tropical rain forest on volcanic Réunion Island, New Phytol., 229, 1983–1994, https://doi.org/10.1111/nph.17002, 2021.
Mander, Ü., Krasnova, A., Escuer-Gatius, J., Espenberg, M., Schindler, T., Machacova, K., Pärn, J., Maddison, M., Megonigal, J. P., Pihlatie, M., and Kasak, K.: Forest canopy mitigates soil N2O emission during hot moments, npj Clim. Atmos. Sci., 4, 39, https://doi.org/10.1038/s41612-021-00194-7, 2021.
Mauder, M. and Foken, T.: Documentation and instruction manual of the eddy covariance software package TK2, Universität Bayreuth, Abt. Mikrometeorologie, Arbeitsergebnisse 26:44 pp. Internet, ISSN 1614-8926, 2004.
Morley, N. and Baggs, E. M.: Carbon and oxygen controls on N2O and N2 production during nitrate reduction, Soil Biol. Biochem., 42, 1864–1871, https://doi.org/10.1016/j.soilbio.2010.07.008, 2010.
Nickerson, N.: Evaluating gas emission measurements using Minimum Detectable Flux (MDF), Eosense Inc., Dartmouth, Nova Scotia, Canada, https://eosense.com/wp-content/uploads/2019/11/Eosense-white-paper-Minimum-Detectable-Flux.pdf (last access: 7 December 2025), 2016.
Nicolini, G., Aubinet, M., Feigenwinter, C., Heinesch, B., Lindroth, A., Mamadou, O., Moderow, U., Mölder, M., Montagnani, L., Rebmann, C., and Papale, D.: Impact of CO2 storage flux sampling uncertainty on net ecosystem exchange measured by eddy covariance, Agr. Forest Meteorol., 248, 228–239, https://doi.org/10.1016/j.agrformet.2017.09.025, 2018.
Oertel, C., Matschullat, J., Zurba, K., Zimmermann, F., and Erasmi, S.: Greenhouse gas emissions from soils – A review, Geochem., 76, 327–352, https://doi.org/10.1016/j.chemer.2016.04.002, 2016.
Pangala, S. R., Moore, S., Hornibrook, E. R., and Gauci, V.: Trees are major conduits for methane egress from tropical forested wetlands, New Phytol., 197, 524–531, https://doi.org/10.1111/nph.12031, 2013.
R Core Team: R: A Language and Environment for Statistical Computing, R Foundation for Statistical Computing [computer software], Vienna, Austria, https://www.r-project.org/ (last access: 31 October 2025), 2020.
Regan, K., Kammann, C., Hartung, K., Lenhart, K., Müller, C., Philippot, L., Kandeler, E., and Marhan, S.: Can differences in microbial abundances help explain enhanced N2O emissions in a permanent grassland under elevated atmospheric CO2?, Glob. Change Biol., 17, 3176–3186, https://doi.org/10.1111/j.1365-2486.2011.02470.x, 2011.
Sakabe, A., Itoh, M., Hirano, T., and Kusin, K.: Ecosystem-scale methane flux in tropical peat swamp forest in Indonesia, Glob. Change Biol., 24, 5123–5136, https://doi.org/10.1111/gcb.14410, 2018.
Sanford, R. A., Wagner, D. D., Wu, Q., Chee-Sanford, J. C., Thomas, S. H., Cruz-García, C., Rodríguez, G., Massol-Deyá, A., Krishnani, K. K., Ritalahti, K. M., and Nissen, S.: Unexpected nondenitrifier nitrous oxide reductase gene diversity and abundance in soils, P. Natl. Acad. Sci. USA, 109, 19709–19714, https://doi.org/10.1073/pnas.1211238109, 2012.
Schindlbacher, A., Zechmeister-Boltenstern, S., and Butterbach-Bahl, K.: Effects of soil moisture and temperature on NO, NO2, and N2O emissions from European forest soils, J. Geophys. Res., 109, D17302, https://doi.org/10.1029/2004JD004590, 2004.
Silver, W. L., Lugo, A., and Keller, M.: Soil oxygen availability and biogeochemistry along rainfall and topographic gradients in upland wet tropical forest soils, Biogeochemistry, 44, 301–328, https://doi.org/10.1007/BF00996995, 1999.
Smith, K. A., Ball, T., Conen, F., Dobbie, K. E., Massheder, J., and Rey, A.: Exchange of greenhouse gases between soil and atmosphere: interactions of soil physical factors and biological processes, Eur. J. Soil Sci., 54, 779–791, https://doi.org/10.1111/ejss.12539, 2003.
Steinkamp, R., Butterbach-Bahl, K., and Papen, H.: Methane oxidation by soils of an N limited and N fertilized spruce forest in the Black Forest, Germany, Soil Biol. Biochem., 33, 145–153, https://doi.org/10.1016/S0038-0717(00)00124-3, 2001.
Stiegler, C., Koebsch, F., Ali, A. A., June, T., Veldkamp, E., Corre, M. D., Koks, J., Tjoa, A., and Knohl, A.: Temporal variation in nitrous oxide (N2O) fluxes from an oil palm plantation in Indonesia: An ecosystem-scale analysis, GCB Bioenergy, 15, 1221–1239, https://doi.org/10.1111/gcbb.13088, 2023.
Teh, Y. A. and Silver, W. L.: Effects of soil structure destruction on methane production and carbon partitioning between methanogenic pathways in tropical rain forest soils, J. Geophys. Res.-Biogeo., 111, G1, https://doi.org/10.1029/2005JG000020, 2006.
Teh, Y. A., Silver, W. L., and Conrad, M. E.: Oxygen effects on methane production and oxidation in humid tropical forest soils, Glob. Change Biol., 11, 1283–1297, https://doi.org/10.1111/j.1365-2486.2005.00983.x, 2005.
Tian, H., Chen, G., Lu, C., Xu, X., Ren, W., Zhang, B., Banger, K., Tao, B., Pan, S., Liu, M., and Zhang, C.: Global methane and nitrous oxide emissions from terrestrial ecosystems due to multiple environmental changes, Ecosyst. Health Sustain., 1, 1–20, https://doi.org/10.1890/EHS14-0015.1, 2015.
Van Langenhove, L., Depaepe, T., Vicca, S., van den Berge, J., Stahl, C., Courtois, E. A., Weedon, J., Urbina, I., Grau, O., Asensio, D., Peñuelas, J., Boeckx, P., Richter, A., Van Der Straeten, D., and Janssens, I. A.: Regulation of nitrogen fixation from free-living organisms in soil and leaf litter of two tropical forests of the Guiana shield, Plant Soil, 450, 93–110, https://doi.org/10.1007/s11104-019-04012-1, 2020a.
Van Langenhove, L., Verryckt, L. T., Bréchet, L., Courtois, E. A., Stahl, C., Hofhansl, F., Bauters, M., Sardans, J., Boeckx, P., Fransen, E., Peñuelas, J., and Janssens, I. A.: Atmospheric deposition of elements and its relevance for nutrient budgets of tropical forests, Biogeochemistry, 149, 175–193, https://doi.org/10.1007/s10533-020-00673-8, 2020b.
von Fischer, J. C. and Hedin, L. O.: Controls on soil methane fluxes: Tests of biophysical mechanisms using stable isotope tracers, Global Biogeochem. Cy., 21, 9-Gb2007, https://doi.org/10.1029/2006gb002687, 2007.
Wagner, F., Hérault, B., Stahl, C., Bonal, D., and Rossi, V.: Modeling water availability for trees in tropical forests, Agr. Forest Meteorol., 151, 1202–1213, https://doi.org/10.1016/j.agrformet.2011.04.012, 2011.
Wang, H., Li, H., Liu, Z., Lv, J., Song, X., Li, Q., Jiang, H., and Peng, C.: Observed methane uptake and emissions at the ecosystem scale and environmental controls in a subtropical forest, Land, 10, 975, https://doi.org/10.3390/land10090975, 2021.
Wang, Z. P., Chang, S. X., Chen, H., and Han, X. G.: Widespread non-microbial methane production by organic compounds and the impact of environmental stresses, Earth-Sci. Rev., 127, 193–202, https://doi.org/10.1016/j.fuel.2015.12.074, 2013.
Welch, B., Gauci, V., and Sayer, E. J.: Tree stem bases are sources of CH4 and N2O in a tropical forest on upland soil during the dry to wet season transition, Glob. Change Biol., 25, 361–372, https://doi.org/10.1111/gcb.14498, 2019.
Werner, C., Zheng, X., Tang, J., Xie, B., Liu, C., Kiese, R., and Butterbach-Bahl, K.: N2O, CH4 and CO2 emissions from seasonal tropical rainforests and a rubber plantation in Southwest China, Plant Soil, 289, 335–353, https://doi.org/10.1007/s11104-006-9143-y, 2006.
Werner, C., Kiese, R., and Butterbach-Bahl, K.: Soil-atmosphere exchange of N2O, CH4, and CO2 and controlling environmental factors for tropical rain forest sites in western Kenya, J. Geophys. Res.-Atmos., 112, D3, https://doi.org/10.1029/2006JD007388, 2007.
Whiting, G. J. and Chanton, J. P.: Primary production control of methane emission from wetlands, Nature, 364, 794–795, https://doi.org/10.1038/364794a0, 1993.
Wickham, H.: Toolbox, in: ggplot2: Elegant graphics for data analysis, Springer International Publishing, Cham, 33–74, https://doi.org/10.1007/978-3-319-24277-4, 2016.
Wood, S. and Wood, M. S.: Package “mgcv”, R package version, 1:729, https://doi.org/10.32614/CRAN.package.mgcv, 2015.
Wood, S. N.: Generalized additive models: an introduction with R, Chapman and Hall/CRC, Boca Raton, 496 pp., https://doi.org/10.1201/9781315370279, 2017.
Wright, E. L., Black, C. R., Cheesman, A. W., Drage, T., Large, D., Turner, B. L., and Sjoegersten, S.: Contribution of subsurface peat to CO2 and CH4 fluxes in a neotropical peatland, Glob. Change Biol., 17, 2867–2881, https://doi.org/10.1111/j.1365-2486.2011.02448.x, 2011.
Yu, L., Zhu, J., Ji, H., Bai, X., Lin, Y., Zhang, Y., Sha, L., Liu, Y., Song, Q., Dörsch, P., and Mulder, J.: Topography-related controls on N2O emission and CH4 uptake in a tropical rainforest catchment, Sci. Total Environ., 775, 145616, https://doi.org/10.1016/j.scitotenv.2021.145616, 2021.
Zhu, J., Mulder, J., Wu, L. P., Meng, X. X., Wang, Y. H., and Dörsch, P.: Spatial and temporal variability of N2O emissions in a subtropical forest catchment in China, Biogeosciences, 10, 1309–1321, https://doi.org/10.5194/bg-10-1309-2013, 2013.