the Creative Commons Attribution 4.0 License.
the Creative Commons Attribution 4.0 License.
 | 12 Feb 2026
Satellite-derived Ecosystem Functional Types capture ecosystem functional heterogeneity at regional scale
Beatriz P. Cazorla
Ana Meijide
Javier Cabello
Julio Peñas
Javier Martínez-López
Rodrigo Vargas
Leonardo Montagnani
Alexander Knohl
Lukas Siebicke
Benimiano Gioli
Jiří Dušek
Ladislav Šigut
Andreas Ibrom
Georg Wohlfahrt
Eugénie Paul-Limoges
Kathrin Fuchs
Antonio Manco
Marian Pavelka
Lutz Merbold
Lukas Hörtnagl
Pierpaolo Duce
Ignacio Goded
Kim Pilegaard
Domingo Alcaraz-Segura
Assessing ecosystem functioning is crucial for managing and conserving ecosystems and their services. Numerous ways to evaluate ecosystem functioning have been developed, using species traits, such as Plant Functional Types (PFTs), flux measurements with the Eddy Covariance (EC) technique, and remote sensing techniques. We propose that the spatial heterogeneity in ecosystem functioning at a regional scale can be assessed and monitored using satellite-derived Ecosystem Functional Types (EFTs): groups of ecosystems or patches of the land surface that share similar dynamics of matter and energy exchanges. We hypothesize that, as observed for PFTs, different EFTs should have distinct patterns and magnitudes of Net Ecosystem Exchange (NEE) of carbon dioxide measured using the EC technique. We derived EFTs from 2001–2014 time-series of satellite images of the Enhanced Vegetation Index (EVI) and compared them with NEE measurements (derived from in situ field observations using the EC technique) across 50 European sites. Our results show that distinct EFTs classes display significantly different dynamics and magnitudes of NEE and that EFTs perform marginally better than PFTs in explaining NEE regional patterns. Land-cover maps based on PFTs are difficult to update on an annual basis and are not sensitive to changes in ecosystem performance (e.g., droughts or pests) that do involve short-term changes in PFT composition. In contrast, satellite-derived EFTs are sensitive to short-term changes in ecosystem performance. Satellite-derived EFTs are an ecosystem functional classification built from satellite observations that allow the identification of homogeneous land patches based on ecosystem functions, e.g., ecosystem net productivity measured on the ground as NEE. Satellite-derived EFTs can be recalculated annually, providing a straightforward way to assess and monitor interannual changes in ecosystem functioning and functional diversity.
- Article
(3560 KB) - Full-text XML
-
Supplement
(2276 KB) - BibTeX
- EndNote


Ecosystem functioning and functional diversity are critical issues in current ecological research (Jax, 2010; Violle et al., 2014, 2017; Tilman et al., 2014; Pettorelli et al., 2018; Villarreal et al., 2018; Malaterre et al., 2019; Díaz et al., 2019). Quantifying, monitoring, and understanding ecosystem functioning help provide insights into the management and conservation of ecosystems and their services (Cabello et al., 2012; Pettorelli et al., 2018; Nicholson et al., 2021). Variables capable of describing ecosystem functioning at regional to global scales are needed to define essential biodiversity variables to monitor biodiversity status (Pereira et al., 2013; Jetz et al., 2019), to advance in the definition of critical but still unassessed planetary boundary (Steffen et al., 2015; Richardson et al., 2023), and to quantify their associated ecosystem services (Costanza et al., 1997; Balvanera et al., 2017).
There are multiple ways to evaluate ecosystem functioning, from concepts such as species traits or Plant Functional Types (PFTs) to direct observation techniques such as eddy covariance (EC) and remote sensing. Traditionally, studies on ecosystem functioning were approached by grouping species into PFTs based on structural (e.g., biotypes), phylogenetic (e.g., coniferous), or functional species traits (e.g., metabolic pathway) that were linked to biological processes (Lavorel and Garnier, 2002; Lavorel et al., 2007). For instance, the PFT approach has been widely used in land-cover mapping and dynamic vegetation models to simplify the continuum of species traits into a reduced number of discrete categories suitable for regional-to-global synthesis and modeling studies (Wullschleger et al., 2014). However, this simplification can lead to information loss (Funk et al., 2017) and may not be capable of predicting the overall ecosystem functioning (Saccone et al., 2017; Thomas et al., 2019). Another more recent way to evaluate ecosystem functioning is by using EC (Reichstein et al., 2014; Migliavacca et al., 2021). EC uses high-frequency wind and scalar mixing ratio data for calculating the Net Ecosystem CO2 Exchange (NEE) between the land surface and the atmosphere at the field scale (Baldocchi et al., 2001; Baldocchi, 2020). This approach is widely used and regional (e.g., AmeriFlux, AsiaFlux, ICOS, NEON), and a global network of EC measurements has been formed (e.g., FLUXNET) (Franz et al., 2018; Knox et al., 2019). Although FLUXNET has provided unprecedented information on the carbon, water, and energy exchange between the earth's surface and the atmosphere, these measurements still show limitations to assessing ecosystem functioning at regional or global scales due to their small footprints (essentially considered as point-scale data (Chu et al., 2021) and a lack of spatial representativity (Villarreal et al., 2018; Villarreal and Vargas, 2021). In parallel, advances in remote sensing are providing new opportunities to quantify ecosystem functioning and functional diversity from regional to global scales (Rocchini et al., 2018; Skidmore et al., 2021). Consequently, combining field-based measurements (e.g., EC) with remote sensing data may allow for better information integration across multiple spatial and temporal scales (Running et al., 1999; Wang et al., 2017). Indeed, multiple studies have aimed to derive global maps combining flux measurements with earth observation data, although challenges and limitations still need to be addressed (e.g., FLUXCOM; Huang et al., 2019; Jung et al., 2020; Liu et al., 2023; Pacheco-Labrador et al., 2022; Gomarasca et al., 2024; Nelson et al., 2024).
Ecosystem functioning and functional diversity at the regional scale can be assessed using satellite-derived Ecosystem Functional Types (EFTs) (Paruelo et al., 2001). Conceptually, EFTs are defined as patches of the land surface that share similar dynamics of matter and energy exchanges between the biota and the physical environment (Alcaraz-Segura et al., 2006, 2013; Cazorla et al., 2020, 2021, 2023). The concept of EFT is equivalent to the concept of PFTs but applied to a higher level of biological organization. That is, just like plant species can be grouped based on shared functional traits (e.g., growth rates, nitrogen fixation) into PFTs, ecosystems can be grouped based on their common functional dynamics (e.g., productivity, seasonality, phenology) into EFTs (Paruelo et al., 2001). Remote sensing has been empirically applied to identify EFTs, mainly through spectral indices related to carbon dynamics (Paruelo et al., 2001; Alcaraz-Segura et al., 2006; Ivits et al., 2013), but also incorporating other functional attributes such as evapotranspiration, surface temperature, and albedo (e.g., Fernández et al., 2010; Pérez-Hoyos et al., 2014) or soil characteristics based on their greenhouse gas flux dynamics (Petrakis et al., 2018). Among these functional attributes, those linked to carbon dynamics, particularly primary production, represent one of the most integrative dimensions of ecosystem functioning because they reflect the main entry of energy into ecosystems and are directly related to key carbon and energy exchanges (Virginia and Wall, 2001; Pereira et al., 2013; Xiao et al., 2019). Moreover, primary production provides a holistic response to environmental changes and constitutes a synthetic indicator of ecosystem health (Costanza et al., 1997; Skidmore et al., 2015). Other authors have used EFTs to: describe large-scale functional biogeographical patterns (Ivits et al., 2013; Cazorla et al., 2021), assess the representativeness of environmental observatory networks (Villarreal et al., 2018, 2019), assess the ecosystem functional diversity (Alcaraz-Segura et al., 2013; Liu et al., 2023; Armstrong et al., 2024), evaluate the effects of land-use changes on ecosystem functioning (Oki et al., 2013; Domingo-Marimon et al., 2024), improve weather forecasting (Lee et al., 2013; Müller et al., 2014) and species distribution/abundance models (Arenas-Castro et al., 2018, 2019), and to identify geographic priorities for biodiversity conservation (Cazorla et al., 2020).
So far, EFTs have been identified from satellite remote sensing data. However, whether such top-down-identified EFT classes are biologically meaningful in ecological processes measured on the ground, such as biogeochemical fluxes, remains untested. That is, whether satellite-derived EFT classes differ in their exchanges of energy and matter between ecosystems and the atmosphere. Therefore, linking satellite-derived EFTs identified at large scales to biogeochemical fluxes measured at the site level could help strengthen the ecological significance of the EFT patterns for ecosystem modeling and functional diversity assessments remotely, as it provides empirical evidence for using the concept at these scales.
This study aims to provide field-based empirical evidence for using satellite-derived EFTs as descriptors of regional heterogeneity in ecosystem functioning measured on the ground (i.e., seasonal dynamics of NEE). We hypothesize that satellite-derived EFTs classes significantly differ in their exchanges of energy and matter with the atmosphere from each other, in the same way as estimated with in situ field observations. Here, we propose that different satellite-derived EFTs classes display significantly different NEE measurements using the EC technique, while sites under the same EFT should exhibit similar NEE dynamics. To achieve our goal, we used publicly available data across continental Europe, given its high density of EC sites, (1) to characterize the regional patterns of ecosystem functioning using satellite-derived EFTs; (2) to assess whether different satellite-derived EFTs correspond to different NEE dynamics measured on the ground with the EC technique; and (3) to assess how EFTs perform compared to traditional PFTs to discriminate different NEE dynamics.
2.1 Study area
We used NEE information from continental Europe as it has one of the largest densities of EC sites worldwide (Table 1). The sites were distributed across four biogeographical regions (EEA 2016): Mediterranean (12 sites), Continental (21 sites), Atlantic (9 sites), and Alpine (8 sites). Only sites with a long-term (i.e., from 3 to 14 years) NEE time-series were included in the analysis (detailed below).
Table 1Main characteristics of the 50 Eddy Covariance (EC) sites in the study area. Data from FLUXNET 2015 dataset.

2.2 Satellite-derived Ecosystem Functional Types (EFTs)
To characterize the regional heterogeneity in ecosystem functioning across continental Europe, we identified EFTs based on the 2001–2014 time-series of satellite images of the Enhanced Vegetation Index (EVI) captured by the MODIS-Terra sensor. These images (MOD13Q1.C006 product) provide a maximum composite EVI value every 16 d at a ∼ 230 m spatial resolution. EVI is a proxy for canopy greenness, vegetation carbon gains, or primary production (Huete et al., 1999). Based on the approach by Alcaraz-Segura et al. (2013), we identified EFTs using three biologically meaningful metrics of the EVI seasonal dynamics: the EVI annual mean (EVI_mean; an estimator of annual primary production), the EVI seasonal standard deviation (EVI_SD; a descriptor of seasonality), and the date of maximum EVI (EVI_DMAX; an indicator of phenology). We chose to use MODIS data instead of other satellites with higher spatial resolution (e.g., Landsat or Sentinel-2) because MODIS has several advantages in terms of data availability and quality (e.g. more years of data and cloud-free image every 16 d) along the time series (see Supplement Sect. S1).
The range of values of each EVI metric was divided into four intervals, giving a potential number of 64 EFTs (4 × 4 × 4). For EVI_DMAX, the four intervals agreed with the four seasons of the year. For EVI_mean and EVI_SD, we extracted the first, second, and third quartiles for each year. For each quartile, we calculated the interannual mean of the 14-year period and used them as breaks between classes. These breaks were applied back to each year as the thresholds for EVI_Mean and EVI_sSD to set EFT classes (Supplement Sect. S2, Table S1). We used this four-class discretization and fixed class boundaries to obtain a coherent and ecologically interpretable classification (Noble and Gitay, 1996) that applies consistently across years. This approach enables interannual comparisons of spatial functional heterogeneity and maintains continuity with previous EFT implementations (Alcaraz-Segura et al., 2013; Cazorla et al., 2021, 2023). Moreover, recent methodological assessments indicate that EFT derivation is robust to the number of bins used to discretize functional attributes (e.g., Liu et al., 2023). To name EFTs, we used two letters and a number: the first capital letter indicates net primary production (EVI_mean), increasing from A to D; the second small letter represents seasonality (EVI_SD), decreasing from a to d; the numbers are a phenological indicator of the growing season (EVI_DMAX), with values 1 – spring, 2 – summer, 3 – autumn, 4 – winter (see Supplement Sect. S3, Table S2 for a schematic summary of code combinations and examples). To summarize the ecosystem functional diversity of the 2001–2014 period, we calculated the dominant EFT (i.e., the mode value for each pixel) of these years.
2.3 Eddy covariance (EC) sites for net ecosystem exchange (NEE)
To obtain NEE fluxes, 50 EC sites were selected across our study area from the FLUXNET2015 dataset (Table 1). The FLUXNET network (Baldocchi, 2020) provides high-quality, community-based, global data on CO2, H2O, and energy exchanges between the biosphere and the atmosphere measured using the EC technique (Baldocchi, 2003). We used data of NEE of CO2 (NEE_VUT_REF, gC m−2 d−1) from the FLUXNET2015 database. We selected data from FLUXNET2015 because they are publicly available and offer benefits in terms of standardized methodology. FLUXNET2015 incorporates NEE measurements along with a quality flag based on an annually determined Variable Ustar Threshold (VUT), which is selected to maximize model efficiency (MEF) (Pastorello et al., 2020). The MEF analysis is repeated for each one of the half-hourly data (Baldocchi et al., 2001; Baldocchi, 2020). We selected sites that: (a) were located in our study area; (b) provided more than three consecutive years of data over the 2001–2014 period; (c) provided daily averages of NEE calculated from half-hourly data; and (d) had quality control information (i.e., NEE_VUT_REF data with quality control flag QC > 1 were removed since they represent medium and poor quality gap-filled data).
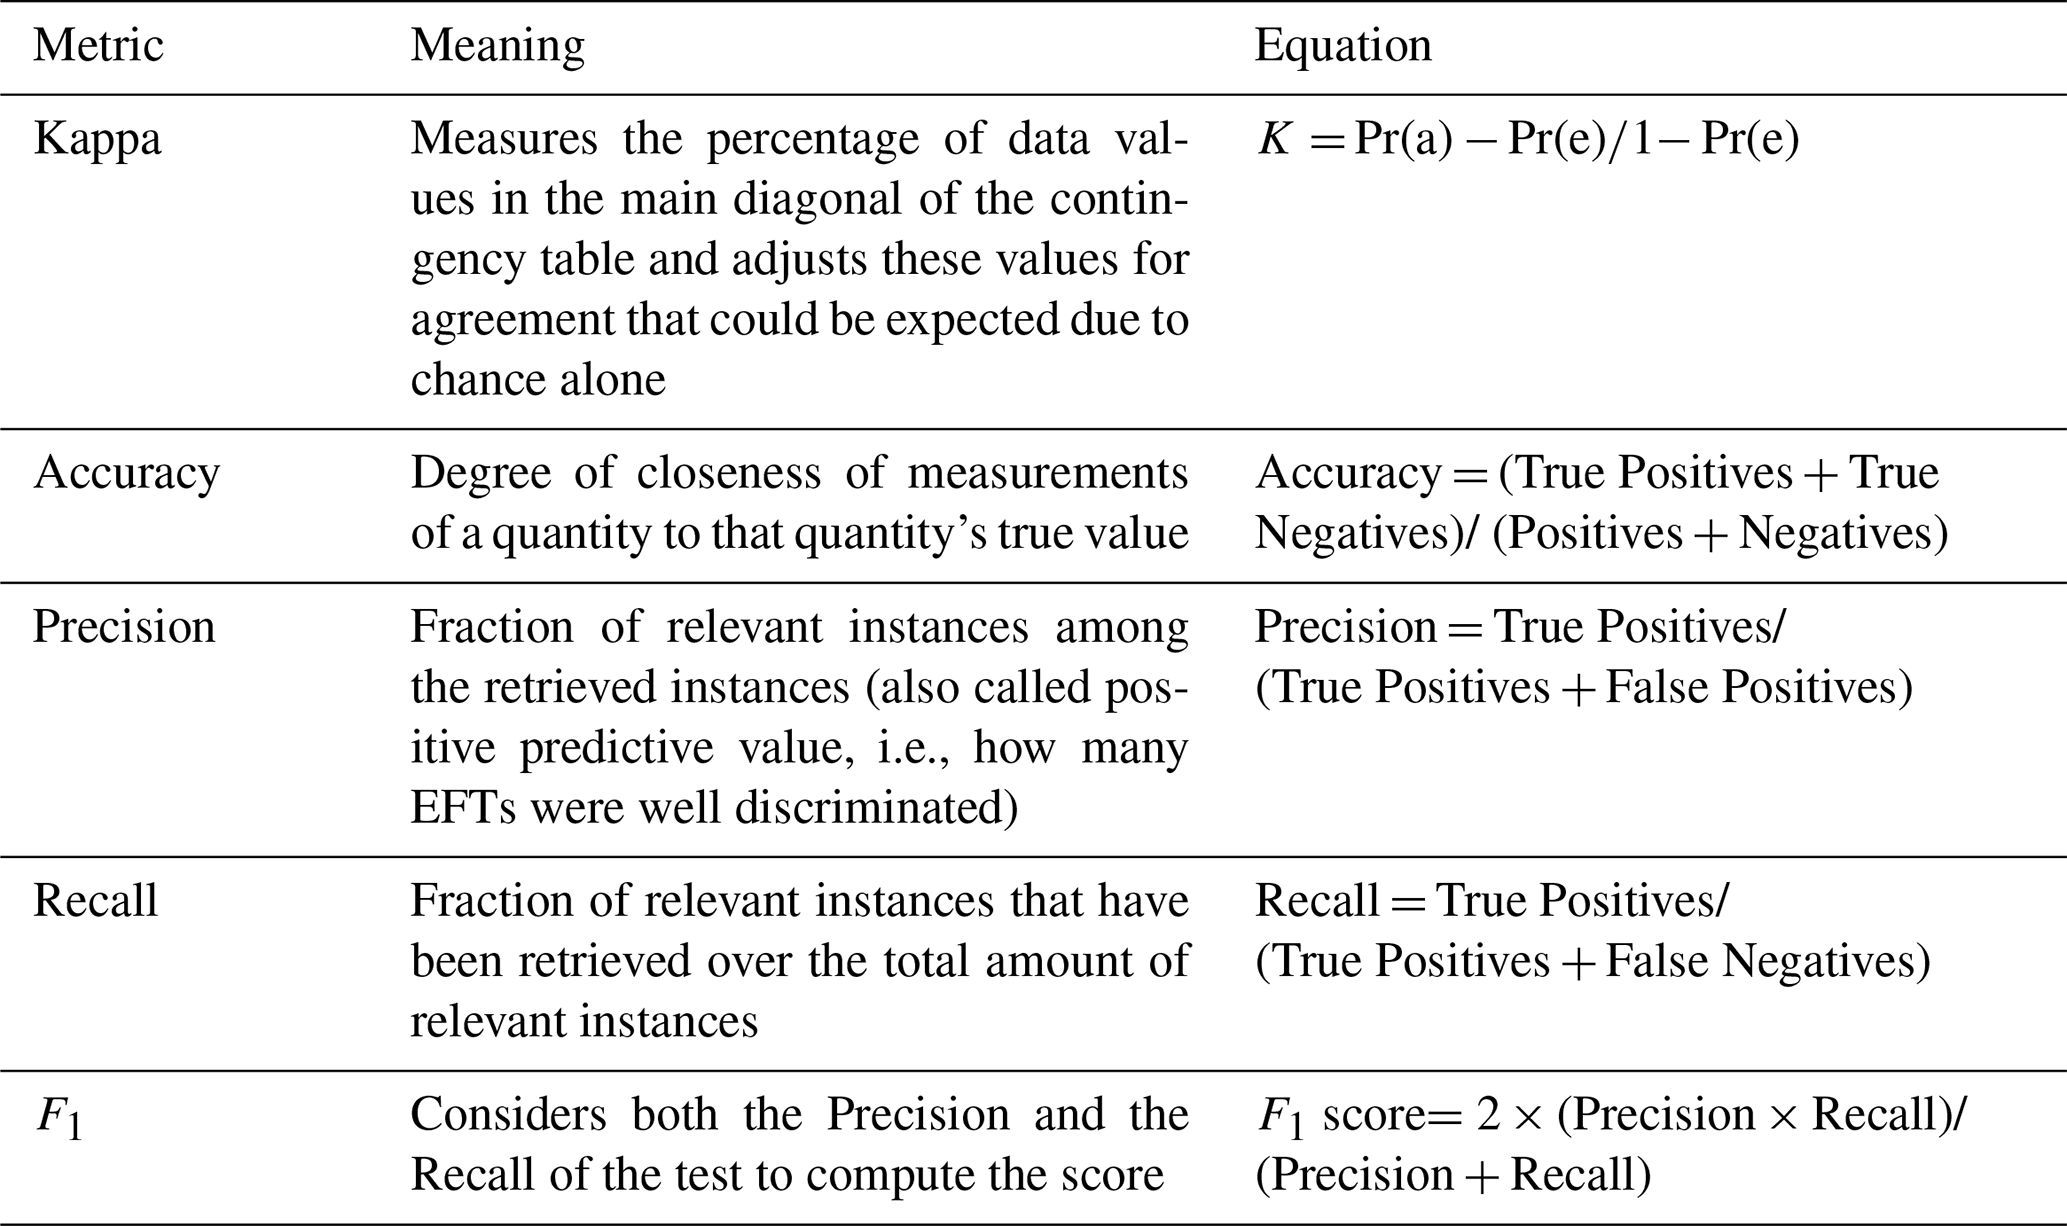
We applied Discriminant Analysis (DA) to assess whether different satellite-derived EFT classes correspond to different NEE dynamics and whether sites under the same EFT exhibit similar NEE dynamics (Supplement Sect. S4). The DA allowed us to examine the homogeneity within each EFT class and the differences among EFT classes based on the annual dynamics of NEE as a predictor variable (Williams, 1981, 1983). We selected the EFT where each EC site was located and its corresponding interannual average of the seasonal cycle of NEE for the available years. EC sites fluxes were regarded as the ground truth standard against which the satellite data were compared to calculate five performance metrics: Kappa, Accuracy, Precision, Recall, and F1 score (Table 2).
Table 2Metrics, interpretations, and equations used to evaluate and compare results from the discriminant analysis, Pr(a) is the relative observed agreement between observations, and Pr(e) is the hypothetical probability of agreement by chance. True Positives are correctly classified as positive, True Negative are correctly classified as negative, Positives are all positives including false positives (i.e., including falsely classified as positive, Type I error) and, Negatives are all negatives including false negatives (i.e. falsely classified as negative, Type II error). All performance metrics oscillate between 0 (disagreement) and 1 (maximum agreement).
2.4 Comparing how EFTs and PFTs discriminate different NEE dynamics
The PFT corresponding to each EC site was assigned by each of their principal investigators using the International Geosphere-Biosphere Programme (IGBP, 1992). Subsequently, we verified the assigned PFTs using the MODIS MCD12Q1 land cover product. The PFT categories present in the EC sites were: cropland (15 sites), deciduous broadleaf trees (6), evergreen needleleaf trees (10), grassland (6), mixed trees (7), shrubland (3), and wetland (1) (Table 1).
During the comparison of the performance of PFTs and EFTs to discriminate the seasonal dynamics of NEE, we considered the unbalanced sample size due to the different number of classes of EFTs (18) and PFTs (7) represented by FLUXNET2015 and the different number of EC sites per PFT class (which ranged between 3 and 31). To do this, we performed the following steps:
First, we calculated all possible combinations (C) without repetitions between the 18 EFT and the 7 PFT classes (C(18,7) = 31 834). Second, since the DA needs balanced data, we discarded all combinations with different numbers of EC sites in the combined EFT and PFT classes. Third, for each combination, we applied discriminant analysis to assess how the EFT and PFT classifications performed to discriminate the seasonal dynamics of NEE. For each discriminant analysis, we obtained five metrics of performance (Table 2). Fourth, to assess whether significant differences existed in the performance metrics between EFTs and PFTs, we applied the Wilcoxon non-parametric test. For each combination of a number of classes and EC sites, there was a different number of discriminant analyses in the EFT subset and the PFT subset (Supplement Sect. S4, Table S3). To account for such an unbalanced design during the Wilcoxon test, we fixed the sample size to the smaller subset (either from the EFT or the PFT classification) and randomly bootstrapped the performance metrics from the bigger one. Fifth, we calculated the mean and standard deviation of each metric obtained by the EFTs and PFTs classifications, the average p-value, and the percentage of times we obtained significant differences (p-value < 0.05) between EFTs and PFTs.
3.1 Regional heterogeneity in ecosystem functioning using satellite-derived EFTs
The map of the EVI-derived proxies of productivity (EVI_mean), seasonality (EVI_SD), and phenology (DMAX) (Supplement Sect. S5, Fig. S1a–c) and their integration into EFTs (Fig. 1) provided a characterization of the spatial patterns of our focal ecosystem function across Europe. At the continental scale, productivity decreased eastwards and southwards (Fig. 1, Supplement Sect. S5, Fig. S4). Seasonality was greater in cultivated and mountain grassland areas (Fig. 1, Supplement Sect. S5, Fig. S5), and the most frequent EVI maxima occurred in spring and summer (Fig. 1, Supplement Sect. S5, Fig. S6).
The greatest EVI_mean (D) was reached in the Atlantic and Continental biogeographic regions (Fig. 1, Supplement Sect. S5, Fig. S4d). At the same time, the lowest EVI_mean (A) occurred in the western part of the Mediterranean region, corresponding to most of the Iberian Peninsula, some parts of the Italian Peninsula, the mountainous areas of the Alpine region, and in the eastern part of the Continental region (Fig. 1, Supplement Sect. S5, Fig. S4a). The greatest seasonality (a) occurred in the highest altitudes of the Alpine region (peaks of Alps <3000 m), the Continental region (southwestern, northwestern, and eastern part of this region), and the eastern part of the Atlantic region (Fig. 1, Supplement Sect. S5, Fig. S5a). The lowest seasonality (d) was observed in the western part of the Mediterranean region, specifically in the Iberian Peninsula, the Gulf of Lion's surroundings, and the Atlantic region's Coastal western places (Fig. 1, Supplement Sect. S5, Fig. S5d). The phenological indicator of the growing season, DMAX, showed that most areas of the Mediterranean region have the EVI maxima in spring (1). EVI maxima in spring (1) were also observed in the Continental and Alpine regions (Fig. 1, Supplement Sect. S5, Fig. S6a). Maxima in summer (2) were identified in western places of the Atlantic and most of the Alpine regions (Fig. 1, Supplement Sect. S5, Fig. S6b). EVI maxima in autumn (3) mainly in the Mediterranean region (Fig. 1, Supplement Sect. S5, Fig. S6c). Maxima in winter (4) were rare and emerged in the eastern part of the Atlantic region, where the maximum productivity was found and in the western part of the Mediterranean region (Fig. 1, Supplement Sect. S5, Fig. S6d). A simplified representation of the EFT map, obtained by clustering EFTs based on their functional similarity, is provided in the Supplement (Supplement Sect. S6).

Figure 1Ecosystem Functional Types (EFTs) based on MODIS-EVI dynamics (∼ 230 m resolution) and Eddy Covariance (EC) sites corresponding to the 2001–2014 period. Capital letters in the legend correspond to the EVI annual mean (EVI_mean) level, ranging from A to D for low to high productivity. Small letters show the seasonal standard deviation (EVI_SD), ranging from a to d for high to low seasonality of carbon gains. The numbers indicate the season when the maximum EVI took place (DMAX): (1) spring, (2) summer, (3) autumn, (4) winter. Places with EC sites are indicated with colored circles , where each color represents a different plant functional type (PFT). Biogeographical regions are based on the official European biogeographical regions map (EEA, 2016) and are represented by black lines.
3.2 Ground-based NEE of the satellite-derived EFTs
In total, 20 of the 64 potential EFTs, containing 73.10 % of our study area, were represented by the network of the 50 long-term EC sites that met our selection criteria (Fig. 2). The most abundant EFT, Da1, showed high productivity (D), high seasonality (a), and maximum EVI in spring (1) (Fig. 2). Da1 occupied 10.87% of the surface and was distributed throughout the study area but abundantly in the western and southern extremes of the Atlantic Region). Da1 was represented by 8 EC sites that exhibited NEE with a strong seasonal variability, with a pronounced peak of carbon assimilation between −7.23 and −7.46 g C m−2 d−1 in spring (Fig. 4) and corresponded with the most abundant ecosystem in Europe, the Deciduous Broadleaf and Mixed Forest (Supplement Sect. S4, Table S4). The second most abundant EFT, Ad1, showed low productivity (A), low seasonality (d), and maximum EVI also in spring (1). Ad1 occupied 9.98% of the territory, mainly in the Iberian Peninsula (Fig. 1). Ad1 was represented by 2 EC sites (Fig. 2) that exhibited NEE dynamics with low seasonality and the peak of carbon assimilation (NEE) between −0.72 and −1.98 g C m−2 d−1 in spring (Fig. 4) and was concentrated in areas dominated by shrub vegetation (Supplement Sect. S4, Table S4).

Figure 2Accumulated area covered by the Ecosystem functional types (EFTs; in %) represented in the study (ordered from highest to lowest). Colors indicate the number of eddy covariance (EC) sites, and the numbers indicate the area occupied by each of these EC sites (in %).
Regarding the abundance of EC sites, the EFT Da1 mentioned above was represented by 8 EC sites, followed by EFT Ba1 and Cb1 with 5 EC sites. The EFT Ba1, was also abundant, occupying 7.4 % of the total surface (Fig. 2), and was located mainly in the eastern part of the study area (Atlantic and Continental regions) (Fig. 1). The EFT Cb1, was less abundant than the previous one (3.61 %) and was located in central areas of the Atlantic and Continental regions. NEE dynamics were characterized by high (a) and medium-high (b) seasonality and the peak time of carbon assimilation between −6.40 and −7.53 g C m−2 d−1 in spring. In both cases, these places corresponded with cereal crops (Supplement Sect. S4, Table S4).
Our discriminant analysis showed that EFTs significantly differed in NEE measured in situ with the EC technique. The average of the performance metrics obtained from the discrimination that satellite EFTs made of EC site NEE ranged between 0.953 to 0.978 (Table 3a). NEE dynamics significantly differed between different EFTs but were similar within the same EFTs (Supplement Sect. S5, Fig. S2). For example, the EFT “Da1”, which had high productivity, high seasonality, and spring EVI maxima, also showed high average NEE values, high seasonality in NEE, and maximum carbon assimilation in spring (Fig. 4, EC sites DE-Lnf, FR-Fon). The EFT “Bc1”, with medium to high productivity, medium seasonality, and spring EVI maxima, was also characterized by moderate seasonality in terms of NEE and maximum carbon assimilation in spring (Fig. 4a for EC sites BE-Vie, DE-Tha). Contrary, the EFT “Ad1”, which had low productivity, low seasonality, and EVI spring maxima, also showed low average NEE, low seasonality in NEE, and a peak of maximum carbon assimilation in spring (ES-Lju, IT-Noe). As another example, the EFT “Cb1”, with medium productivity, medium-high seasonality, and spring EVI maxima, also showed medium to high seasonality in terms of NEE and maximum carbon assimilation in spring (Fig. 4a for EC sites DE-she, DE-RuS).
3.3 Comparison between EFTs and PFTs to discriminate NEE measured by EC
EFTs performed marginally better than PFTs in capturing differences in NEE dynamics measured on the ground (Table 3). The average across all discriminant analyses in all performance indices was marginally but not significantly higher for EFTs (e.g., mean Kappa = 0.953) than for PFTs (e.g., mean Kappa = 0.923) (Table 3, Fig. 3); However, the standard deviation (SD) across all discriminant analyses was higher for PFTs (e.g., SD of Kappa = 0.078) than for EFTs (e.g., SD of Kappa = 0.067). No significant differences between the performance metrics of EFTs and PFTs were detected by the Wilcoxon-test in any of the indices (Table 3).
Table 3Mean performances metrics, their standard deviation (SD) and differences in: Kappa, Accuracy, Precision, Recall and F1 values obtained from discriminant analysis of combinations with equal number of classes and EC sites of (a) ecosystem functional types (EFTs) and (b) plant functional types (PFTs). To assess for significant differences, we applied a Wilcoxon-test (p-values showed), and we calculated the percentage of cases in which differences between EFTs or PFTs with NEE were significant (% sig), in this case, none.
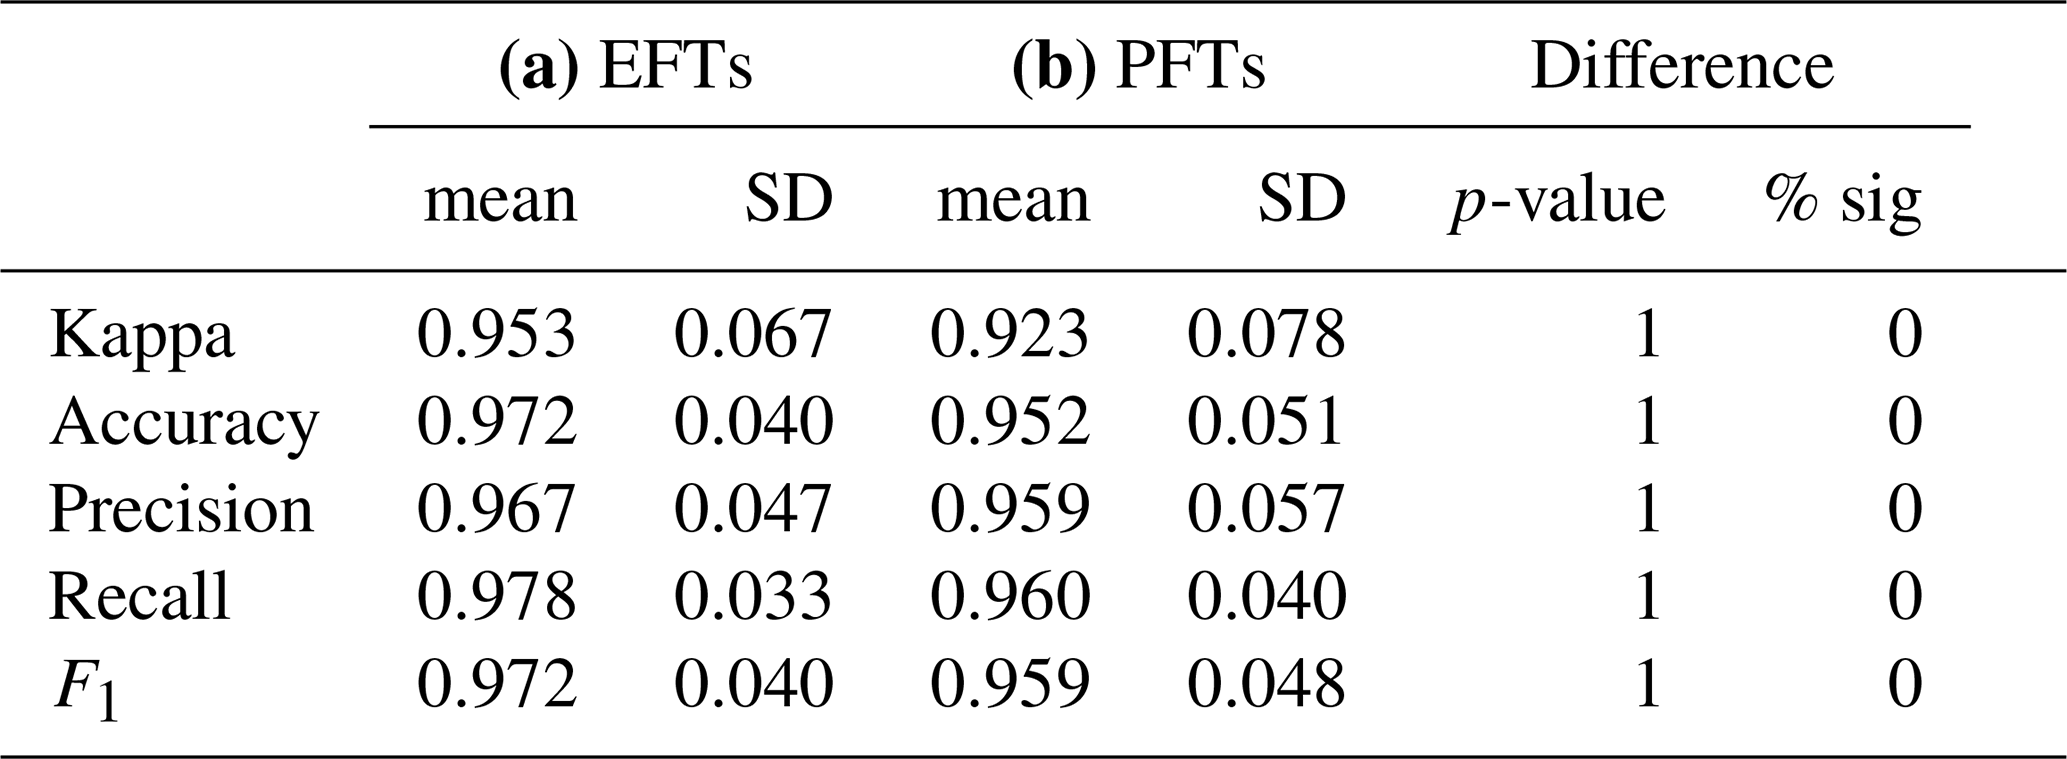

Figure 3Histograms of performances from discriminant analysis for all combinations of Ecosystem Functional Types (EFTs) and Plant Functional Types (PFTs) with equal number of classes and EC sites. Blue lines correspond to EFTs and green lines to PFTs.
In general, NEE dynamics were similar for the same PFT or EFT across EC sites (Fig. 4), though there were some exceptions for certain PFTs (Fig. 4b; Supplement Sect. S5, Fig. S3). Sites corresponding to the PFT “deciduous broadleaf trees” or the EFT “Da1” always showed similar NEE (Fig. 4; Table 1). However, for the PFT “evergreen needleleaf trees”, NEE dynamics exhibited a different seasonality and variable maximum carbon assimilation across sites (Fig. 4b for EC sites CH-Dav, DE-Lkb). Differences in NEE dynamics across sites were also observed for shrublands where the ES-LJu site (EFT Ad1) was assimilating carbon throughout the year, particularly in spring, while the ES-Amo site (EFT Ad4) was mainly emitting carbon throughout the year except for winter. Larger differences in NEE occurred in the PFT croplands, with maximum carbon sequestration occurring in different seasons (Fig. 4b, for sites CH-Oe1 and CH-Oe2 (EFT Cb1).

Figure 4Comparison of the variability within and across classes of Ecosystem Functional Types (EFTs) and Plant Functional Types (PFTs) in the seasonal dynamics of NEE. (a) Variability inter EFTs: annual mean of NEE dynamics from different places randomly selected with the same EFT; and (b) variability inter PFTs and intra EFTs: annual mean of NEE dynamics from different places with the same PFT and different EFT.
Remotely-sensed EFTs successfully mapped functionally homogeneous land patches regarding NEE dynamics measured in situ with the EC technique. Furthermore, EFTs performed at least similarly to the commonly used PFTs for discriminating among different NEE seasonal dynamics (Table 3). EFTs have the advantage of being more sensitive in their responses to short-term changes in ecosystem functioning than the slower-responding plant community composition or canopy structure. Furthermore, they can be recalculated on an annual basis using the same classification rules, which provides a straightforward way to track interannual changes in ecosystem functioning (Müller et al., 2014). Our focal ecosystem function was NEE dynamics, which is related to primary production (but also to ecosystem respiration), one of the most essential and integrative descriptors of ecosystem functioning (Virginia and Wall, 2001). Hence, satellite-derived EFT classifications could be used to monitor the status and changes of the regional heterogeneity or spatial diversity of the essential variable of ecosystem productivity as a surrogate of the overall ecosystem performance (Jax, 2010; Pettorelli et al., 2016).
4.1 EFTs capture differences in NEE
EFTs quantified and mapped the spatio-temporal characteristics of carbon dynamics, a crucial aspect for biodiversity conservation and ecosystem services maintenance in a global change context (Midgley et al., 2010). Twenty of the 64 EFTs identified in Europe (corresponding to 73 % of the study area) were represented by at least one EC site in the FLUXNET2015 dataset with at least three years of data. This number of site-years and the covered area provided sufficient evidence to confirm the validity of the EFT concept. Therefore, our approach could help to assess carbon dynamics at a regional scale by providing homogeneous land areas in terms of their primary production dynamics (Running et al., 2004; Zhang et al., 2016). This fact helps to understand the regional patterns and drivers of the differences in carbon dynamics at the regional scale and could contribute to reducing the uncertainties in the global carbon balance (Beer et al., 2010).
EFTs capture spatial differences in NEE seasonal dynamics equally well or marginally better than other mainstream approaches, such as PFTs. Different areas may respond differently to environmental changes despite being dominated by the same PFT, and frequently, ecosystem-process models (parameterized for a specific PFT) may not be able to represent these differential responses (Vargas et al., 2013). Usually, the parameterization of a particular PFT is homogeneous within such PFT and does not change, for instance, according to the eco-physiological status of a specific area or its intrinsic plasticity (Müller et al., 2014). In addition, land-cover maps based on a PFT concept are static and difficult to update (i.e., PFT database structure and assumptions are not easily adapted to new data). At the same time, EFTs are a data-driven classification through which we can annually obtain new data and detect changes in the exchange of matter and energy between the ecosystems and the atmosphere in response to environmental variability. In this sense, the literature (Bret-Harte et al., 2008; Suding and Goldstein, 2008; Clark, 2016; Saccone et al., 2017; Thomas et al., 2019) has pointed out that the PFT approach is not straightforward enough to represent ecosystem functional properties at the ecosystem level.
EFTs derived in this study rely on EVI-based attributes, which primarily represent the dynamics of primary production. This focus is consistent with the fact that vegetation greenness and light absorption are tightly linked to APAR, GPP and NEE (e.g. Huete et al., 1999; Running et al., 2004; Shi et al., 2017), making EVI a direct and widely used indicator of ecosystem functional behaviour at large scales. The strong agreement between our EFTs and in situ NEE patterns confirms that EVI captures the dominant functional axis related to carbon uptake. Although additional attributes associated with water or energy fluxes (e.g., NDWI, land-surface temperature or albedo) could enrich multidimensional EFT frameworks in the future, the carbon-related dynamics encoded in EVI already provide a robust and ecologically meaningful foundation for functional ecosystem classification.
4.2 EFT spatial patterns and environmental controls
EFTs allowed us to characterize the regional heterogeneity of ecosystem functioning across Europe. In relation to the three descriptive attributes of ecosystem functioning from which the EFTs were constructed (EVI_mean; an estimator of primary production, EVI_SD; a descriptor of seasonality and EVI_DMAX; an indicator of phenology), we found general patterns determined by the combination of vegetation characteristics and environmental controls. The role of environmental variables (abiotic and biotic) that control ecosystem processes differ according to the level of biological organization and the spatial scale considered (Reed et al., 1993; Pearson and Dawson, 2003). Ecosystem functioning in natural areas are known to be mainly driven by precipitation (Lauenroth et al., 1978), temperature (Rosenzweig and Dickinson, 1986; Jobbágy et al., 2002), soil characteristics (Noy-Meir, 1973), and vegetation structure (Epstein et al., 1998). In this case, EFTs productivity decreased from east to west influenced by rainfall patterns determined by the Gulf Stream and the distance from the ocean (Palter, 2015), which also determines changes in vegetation. Regarding the seasonality of EVI, it increased in relation to two factors: (1) the altitude, having the highest values of seasonality in the mountainous areas (influenced by changes in precipitation, temperature, and consequently, in vegetation), and; (2) the crop areas, where management practices, harvests, and crop changes are responsible of this dynamic and therefore it cannot be explained by natural environmental controls alone. Peaks of maximum EVI in Europe took place in spring and summer when the availability of water (precipitation) and energy (temperature) for vegetation was at its optimum (Whittaker et al., 2007).
Boundaries of the biogeographical regions (EEA, 2016) were consistent with the EFTs (Fig. 1). Still, while the classification from EEA is static, EFTs provide a data-driven classification that could be better coupled to ecosystem functioning. The Alpine region was dominated by EFTs with low productivity, high seasonality, and maxima in summer. In the high mountain peaks (<3000 m), the vegetation was reduced to a low density of highly adapted plants that can tolerate extreme conditions (i.e., the short growing period and fluctuating air temperatures, and therefore, has low productivity, also detected in the global primary productivity patterns of Beer et al., 2010 and Zhang et al., 2016). In the highest altitudes, snow is present over most of the year, leaving only a short period for the development of the plants, mainly in summer, leading to a summer maximum and a high seasonality (Sundseth, 2009a).
A high heterogeneity of EFTs characterized the Mediterranean region due to their high habitat diversity (i.e., high mountains and rocky shores, thick scrub and semi-arid steppes, coastal wetlands, and sandy beaches, constituting a global biodiversity hotspot (Myers et al., 2000)). The main driver of ecosystem functional diversity is the climate (characterized by hot, dry summers and cool winters) (Lionello et al., 2006), in combination with human influence, (i.e., livestock grazing, forest cultivation, and forest fires) (Blondel and Aronson, 1999).
The Atlantic region was characterized by EFTs with high productivity, high seasonality, and maximum greening in spring due to the mild winters, cool summers, predominantly westerly winds, and moderate rainfall throughout the year (Hurrell, 1995). These conditions favor non-water-limited deciduous species with high productivity, resulting in a high seasonality. Due to the anthropogenic influence, agricultural landscapes are widespread in this region, one of Europe's five major agricultural regions, according to Kostrowicki (1991). Thus, the region's high productivity must be partly attributed to irrigation, and high seasonality is driven by harvest and cropping cycles.
Finally, in the Continental region, the ecosystem's functioning varied largely in terms of productivity, reflecting regional climatic patterns. In the eastern part of the continental region, extremes of hot and cold temperatures and wet and dry conditions are more frequent and strongly impact ecosystem functioning (dominant EFT was Aa1, low productivity, high seasonality, and maximum in spring). These areas are mountainous and experience sub-alpine conditions. Moving west, the climate is characterized by relatively small temperature fluctuations due to the buffering effect of the nearby ocean and the flat landscape (Da1 and Ca1 in the transition) (Sundseth, 2009b).
4.3 Opportunities and limitations of EFTs
Since EFTs describe ecosystem functioning on an annual basis in homogeneous patches on the land surface, they offer opportunities for application in ecology and conservation compared to approaches that do not represent short-term dynamics (such as PFTs). The concept of EFT has been highlighted as “the first serious attempt to group ecosystems (at large scales) based on shared functional behavior” (Mucina, 2019), and its strength for being applied as a classification scheme is determined by its ability to translate ecosystem functions into discrete entities that can be mapped. EFTs are identified by remote sensing tools from aggregated measurements of ecosystem functions at the pixel level, which, in practice, represents information on the performance of the whole ecosystem at that grain scale. Having the possibility of mapping entities (EFTs) that reflect the principal performance of the entire ecosystem opens a straightforward, tangible, and biologically meaningful way to quantify distributions of ecosystem functions at the regional scale, complementing our traditional view of ecosystems (Paruelo et al., 2001; Butchart et al., 2010; Asner et al., 2017). Specifically, satellite-derived dynamic functional classifications, such as EFTs, have several advantages over other static approaches, such as PFTs. Satellite-derived EFAs and EFTs (1) are capable of capturing differences in ecosystem processes as measured in the field; (2) they provide a valuable framework for understanding the mechanisms underlying large-scale ecological changes (Cabello-Piñar et al., 2016; Alcaraz-Segura et al., 2013; Requena-Mullor et al., 2017, 2018; Arenas-Castro et al., 2018; Lourenço et al., 2018; Vaz et al., 2018); (3) they offer a faster response than compositional or structural approaches to environmental changes (McNaughton et al., 1989; Mouillot et al., 2013), which are particularly noticeable at the ecosystem level (Vitousek, 1994); (4) they can be more easily monitored and updated than structural or compositional ones under a common protocol in space and time, at different spatial scales and over large extents (Paruelo et al., 2001); (5) they can complement information on vegetation structure and composition (e.g., canopy architecture, vegetation type, PFT), because they constitute complementary dimensions of biodiversity complexity (Noss, 1990); (6) they facilitate the direct assessment of ecosystem functions and services (Costanza et al., 2006; Hellmann et al., 2017) and would link critical dimensions of biodiversity to ecosystem processes including the carbon cycle, the water cycle and the provisioning of ecosystem services; (7) they have already been proposed as essential variables for monitoring biodiversity (Pettorelli et al., 2016; Skidmore et al., 2021).
Our approach, as with any other ecosystem classification framework, is still subject to some challenges. First, EFTs represented by several EC sites could be parameterized in terms of NEE dynamics, though not all EFTs (18 %) are represented yet. Nevertheless, the subset of EFTs covered by multiple EC sites spans the dominant functional types across Europe, providing a solid empirical basis for validating the classification. Second, the footprint or spatial resolution of the EC measurements varies depending on the micrometeorological conditions (wind direction, wind speed, atmospheric stability) and the ratio of measurement to vegetation height, e.g., forest flux footprints are generally larger than grassland footprints (oscillates between 50 and 200 m) (Schmid, 2002; Kljun et al., 2015). In contrast, the MODIS pixels used have a constant spatial resolution of ∼ 231 m, generating an unavoidable scale mismatch. However, because EC towers are typically placed in relatively large and functionally homogeneous land patches (Aubinet et al., 2012), the MODIS pixel and the flux footprint generally sample comparable surfaces, limiting the practical impact of this mismatch on the regional-scale patterns captured by our EFTs. Nonetheless, we acknowledge that some challenges regarding spatial representativeness remain (Chu et al., 2021). Future studies may reduce this mismatch by using higher-resolution sensors such as Sentinel-2 (10 m/pixel), but currently is not possible because the time period of Sentinel-2 data is not covered by FLUXNET data (i.e., Sentinel-2 starts taking data in 2015 and the available FLUXNET 2015 database goes up to this year). Alternatively, footprint modelling could be applied when appropriate micrometeorological data exist, but footprint-weighted averaging was not feasible in our study because daily or sub-daily footprint estimates are unavailable for most FLUXNET sites and years, a limitation commonly acknowledged in previous RS–flux integration studies (Chu et al., 2021). Third, different ecosystems regarding other functional aspects (e.g., evapotranspiration, heat exchange) can be classified here as the same EFT from the NEE dynamics, as dime we used it as our focal function. However, EFTs could also be identified to characterize the spatiotemporal heterogeneity of multiple ecosystem processes and functions at different scales, including other functional aspects (e.g., albedo, evapotranspiration, heat exchange) (Fernández et al., 2010). Also other temporal metrics, such as daily anomalies or interannual variability can provide complementary information on short-term or year-to-year ecosystem responses, but they are not expected to improve the discrimination among EFTs, which is intrinsically based on intra-annual functional patterns. Similarly, additional phenological transition metrics such as the start and end of the season (SOS/EOS) may offer complementary insights into growing-season timing and duration; however, their higher sensitivity to noise and temporal gaps, particularly in 16 d MODIS time series, makes peak-greenness metrics like EVI_DMAX more robust and comparable for regional-scale functional classifications. Finally, incorporating EFTs into earth system models is challenging since these models generally use simple and few numbers of categories in a variable, and some models might not be able to run with so many (64) EFT categories. Nevertheless, some studies have successfully incorporated EFTs into earth system models (Lee et al., 2013; Müller et al., 2014). The incorporation of these types of variables (dynamic and easily accessible) into the models might be helpful in the monitoring and sustainable management of carbon reservoirs at short to medium-time scales.
Satellite-derived EFTs are an ecosystem functional classification built from satellite observations of radiation exchanges between the land surface and the atmosphere that allow the identification of homogeneous land patches in terms of an essential ecosystem function, e.g., NEE dynamics, measured on the ground by means of which is related to ecosystem productivity. EFTs performed as well as PFTs in discriminating different NEE dynamics, EFTs, however, have two main advantages: they can be easily updated for any region of the world at an annual frequency based on available satellite information, and EFTs maps are more sensitive to environmental changes than vegetation composition or structure.
Our results showed the capability of using ecosystem functional attributes for grouping ecosystems at large scales according to their different net carbon flux dynamics. Such classification, based on the essential biodiversity variable of ecosystem production as a focal ecosystem function, opens the possibility of assessing and monitoring ecosystem functional diversity, the spatial heterogeneity in ecosystem functioning, and carbon-related ecosystem services at regional to global scales. Therefore, our study demonstrates that satellite-derived EFTs provide a valid tool to assess and monitor ecosystem functioning with potential applications in ecosystem monitoring and modeling and biodiversity and carbon management programs.
The MODIS database used in this work is maintained by NASA (satellite Terra, sensor MODIS, product MOD13Q1.006) and is mirrored by Google on the Earth Engine servers (https://developers.google.com/earth-engine/datasets/catalog/MODIS_006_MOD13Q1, last access: 3 February 2026). FLUXNET2015 eddy covariance data are available through the FLUXNET website (https://fluxnet.org/data/fluxnet2015-dataset, last access: 3 February 2026). The Google Earth Engine code used to derive Ecosystem Functional Types (EFTs) is openly available at https://doi.org/10.5281/zenodo.7524973 (Cazorla and Alcaraz-Segura, 2023). The Ecosystem Functional Types (EFTs) map generated in this study is available on Zenodo at https://doi.org/10.5281/zenodo.18325891 (Cazorla et al., 2026). The plant functional types (PFTs) used in this study are based on the IGBP-DIS global 1 km land cover data set “DISCover”: proposal and implementation plans, IGBP-DIS available at https://daac.ornl.gov/ISLSCP_II/guides/edc_landcover_xdeg.html (last access: 3 February 2026).
The supplement related to this article is available online at https://doi.org/10.5194/bg-23-1223-2026-supplement.
DAS, AM, JC, JP and BPC designed the study, AM and DAS coordinated it. BPC processed the data and prepared the manuscript with contributions from all authors. BPC and JML prepared the final Figs. LM, AK, LS, BG, JD, LŠ, AI, GW, EP, KF, AM, MP, LM, LH, PD, IG, and KP provided FLUXNET data. All authors reviewed the article and provided valuable feedback, especially RV and JML.
At least one of the (co-)authors is a member of the editorial board of Biogeosciences. The peer-review process was guided by an independent editor, and the authors also have no other competing interests to declare.
Publisher's note: Copernicus Publications remains neutral with regard to jurisdictional claims made in the text, published maps, institutional affiliations, or any other geographical representation in this paper. The authors bear the ultimate responsibility for providing appropriate place names. Views expressed in the text are those of the authors and do not necessarily reflect the views of the publisher.
This publication is part of the EVEREST project (PID2023-151939OB-I00) funded by MICIU/AEI/10.13039/501100011033 and by ERDF/EU. It was also supported by the project NevadEO – Earth observations for the characterisation and monitoring of ecosystem functioning in Sierra Nevada (Spain) (C-EXP-074-UGR23), co-funded by the Regional Government of Andalusia - Ministry of University, Research and Innovation and by the European Union through the ERDF Andalusia Programme 2021–2027. The study started with funds provided by ERDF and Spanish MINECO (project CGL2014-61610-EXP) and to B.C. by University of Almería (PhD contract: Plan Propio Investigación); ECOPOTENTIAL, which received funding from the European Union's Horizon 2020 Research and Innovation Program under grant agreement No. 641762, and the NASA 2016 GEOBON Work Programme Grant no. 80NSSC18K0446. This work used eddy covariance data acquired and shared by the FLUXNET community. The ERA-Interim reanalysis data are provided by ECMWF and processed by LSCE. The FLUXNET eddy covariance data processing and harmonization was carried out by the European Fluxes Database Cluster, AmeriFlux Management Project, and Fluxdata project of FLUXNET, with the support of CDIAC and ICOS Ecosystem Thematic Center, and the OzFlux, ChinaFlux and AsiaFlux offices.
EVEREST project (PID2023-151939OB-I00) funded by MICIU/AEI/10.13039/501100011033 and by ERDF/EU; NevadEO – Earth observations for the characterisation and monitoring of ecosystem functioning in Sierra Nevada (Spain) project (C-EXP-074-UGR23), co-funded by the Regional Government of Andalusia – Ministry of University, Research and Innovation and by the European Union through the ERDF Andalusia Programme 2021–2027; EarthCul (reference PID2020-118041GBI00), funded by the Spanish Ministry of Science and Innovation; Smart-EcoMountains, LifeWatch-ERIC action line, within LifeWatch-2019-10-UGR-01_WP-8, LifeWatch-2019-10-UGR-01_WP-7, and LifeWatch-2019-10-UGR-01_WP-4. Additional support was provided by the “Plan Complementario de I+D+i en Biodiversidad (PCBIO)” through the recovery Plan – NextGenerationEU, the Spanish Ministry of Science, and the Regional Government of Andalusia (PID2022–140092OB-I00, MCIN/AEI/FEDER, UE). JML was funded by the Plan Propio de Investigación (P9) of the University of Granada. AM was supported by the Deutsche Forschungsgemeinschaft (DFG, German Research Foundation) under Germany’s Excellence Strategy – EXC 2070–390732324. LM acknowledges the funding provided by Forest Services, Autonomous Province of Bolzano. LŠ acknowledges support from the Ministry of Education, Youth and Sports of the Czech Republic within the CzeCOS program (grant number LM2023048) and the AdAgriF project (CZ.02.01.01/00/22 008/0004635).
This paper was edited by Cornelius Senf and reviewed by Simon Besnard and one anonymous referee.
Alcaraz-Segura, D., Paruelo, J., and Cabello, J.: Identification of current ecosystem functional types in the Iberian Peninsula, Global Ecology and Biogeography, 15, 200–212, https://doi.org/10.1111/j.1466-822X.2006.00215.x, 2006.
Alcaraz-Segura, D., Paruelo, J. M., Epstein, H. E., and Cabello, J.: Environmental and human controls of ecosystem functional diversity in temperate South America, Remote Sens., 5, 127–154, https://doi.org/10.3390/rs5010127, 2013.
Arenas-Castro, S., Gonçalves, J., Alves, P., Alcaraz-Segura, D., and Honrado, J. P.: Assessing the multi-scale predictive ability of ecosystem functional attributes for species distribution modelling, PLoS ONE, 13, e0199292, https://doi.org/10.1371/journal.pone.0199292, 2018.
Arenas-Castro, S., Regos, A., Gonçalves, J. F., Alcaraz-Segura, D., and Honrado, J.: Remotely sensed variables of ecosystem functioning support robust predictions of abundance patterns for rare species, Remote Sens., 11, 2086, https://doi.org/10.3390/rs11182086, 2019.
Armstrong, A., Alcaraz-Segura, D., Raynolds, M., and Epstein, H.: Ecosystem functional types of the circumpolar Arctic tundra based on the seasonal dynamics of vegetation productivity, Environ. Res. Ecol., 3, 025003, https://doi.org/10.1088/2752-664X/ad4beb, 2024.
Asner, G. P., Martin, R. E., Knapp, D. E., Tupayachi, R., Anderson, C. B., Sinca, F., Vaughn, N. R., and Llactayo, W.: Airborne laser-guided imaging spectroscopy to map forest trait diversity and guide conservation, Science, 355, 385–389, https://doi.org/10.1126/science.aaj1987, 2017.
Aubinet, M., Vesala, T., and Papale, D. (Eds.): Eddy Covariance: A Practical Guide to Measurement and Data Analysis, Springer Atmospheric Sciences, Springer, Dordrecht, https://doi.org/10.1007/978-94-007-2351-1, 2012.
Baldocchi, D. D.: Assessing the eddy covariance technique for evaluating carbon dioxide exchange rates of ecosystems: past, present and future, Glob. Change Biol., 9, 479–492, https://doi.org/10.1046/j.1365-2486.2003.00629.x, 2003.
Baldocchi, D. D.: How eddy covariance flux measurements have contributed to our understanding of Global Change Biology, Glob. Change Biol., 26, 242–260, https://doi.org/10.1111/gcb.14807, 2020.
Baldocchi, D. D., Falge, E., Gu, L., Olson, R., Hollinger, D., Running, S., Anthoni, P., Bernhofer, C., Davis, K., Evans, R., Fuentes, J. D., Goldstein, A. H., Katul, G., Law, B. E., Lee, X., Malhi, Y., Meyers, T., Munger, W., Oechel, W., Paw U, K. T., Pilegaard, K., Schmid, H. P., Valentini, R., Verma, S. B., Vesala, T., Wilson, K., and Wofsy, S. C.: FLUXNET: A new tool to study the temporal and spatial variability of ecosystem-scale carbon dioxide, water vapor, and energy flux densities, Bull. Am. Meteorol. Soc., 82, 2415–2434, https://doi.org/10.1175/1520-0477(2001)082<2415:FANTTS>2.3.CO;2, 2001.
Balvanera, P., Quijas, S., Karp, D. S., Ash, N., Bennett, E. M., Boumans, R., Brown, C., Chan, K. M. A., Chaplin-Kramer, R., Halpern, B. S., Honey-Rosés, J., Kim, C.-K., Cramer, W., Martínez-Harms, M. J., Mooney, H., Mwampamba, T., Nel, J., Polasky, S., Reyers, B., Roman, J., Turner, W., Scholes, R. J., Tallis, H., Thonicke, K., Villa, F., Walpole, M., and Walz, A.: Ecosystem services, in: The GEO Handbook on Biodiversity Observation Networks, edited by: Walters, M. and Scholes, R. J., Springer, 39–78, https://doi.org/10.1007/978-3-319-27288-7_3, 2017.
Beer, C., Reichstein, M., Tomelleri, E., Ciais, P., Jung, M., Carvalhais, N., Rödenbeck, C., Arain, M. A., Baldocchi, D., Bonan, G. B., Bondeau, A., Cescatti, A., Lasslop, G., Lindroth, A., Lomas, M., Luyssaert, S., Margolis, H., Oleson, K. W., Roupsard, O., Veenendaal, E. M., Viovy, N., Williams, C., Woodward, F. I., and Papale, D.: Terrestrial gross carbon dioxide uptake: global distribution and covariation with climate, Science, 329, 834–838, https://doi.org/10.1126/science.1184984, 2010.
Blondel, J. and Aronson, J.: Biology and Wildlife of the Mediterranean Region, Oxford University Press, Oxford, 328 pp., ISBN 978-0-19-850035-3, 1999.
Bret-Harte, M. S., Mack, M. C., Goldsmith, G. R., Sloan, D. B., DeMarco, J., Shaver, G. R., Ray, P. M., Biesinger, Z., and Chapin, F. S.: Plant functional types do not predict biomass responses to removal and fertilization in Alaskan tussock tundra, J. Ecol., 96, 713–726, https://doi.org/10.1111/j.1365-2745.2008.01378.x, 2008.
Butchart, S. H. M., Walpole, M., Collen, B., van Strien, A., Scharlemann, J. P. W., Almond, R. E. A., Baillie, J. E. M., Bomhard, B., Brown, C., Bruno, J., Carpenter, K. E., Carr, G. M., Chanson, J., Chenery, A. M., Csirke, J., Davidson, N. C., Dentener, F., Foster, M., Galli, A., Galloway, J. N., Genovesi, P., Gregory, R. D., Hockings, M., Kapos, V., Lamarque, J.-F., Leverington, F., Loh, J., McGeoch, M. A., McRae, L., Minasyan, A., Hernández Morcillo, M., Oldfield, T. E. E., Pauly, D., Quader, S., Revenga, C., Sauer, J. R., Skolnik, B., Spear, D., Stanwell-Smith, D., Stuart, S. N., Symes, A., Tierney, M., Tyrrell, T. D., Vié, J.-C., and Watson, R.: Global biodiversity: indicators of recent declines, Science, 328, 1164–1168, https://doi.org/10.1126/science.1187512, 2010.
Cabello, J., Fernández, N., Alcaraz-Segura, D., Oyonarte, C., Piñeiro, G., Altesor, A., Delibes, M., and Paruelo, J. M.: The ecosystem functioning dimension in conservation: insights from remote sensing, Biodivers. Conserv., 21, 3287–3305, https://doi.org/10.1007/s10531-012-0370-7, 2012.
Cabello-Piñar, J., Alcaraz-Segura, D., Reyes-Díez, A., Lourenço, P., Requena Mullor, J. M., Bonache Albacete, J., Castillo, P., Valencia, S., Naya, J., Ramírez, L., and Serrada, J.: System for monitoring ecosystem functioning of Network of National Parks of Spain with remote sensing, Rev. Teledetección, 46, 119, https://doi.org/10.4995/raet.2016.5731, 2016.
Cazorla, B. and Alcaraz-Segura, D.: ajpelu/eftsn_gee: first release (v1.0), Zenodo [code], https://doi.org/10.5281/zenodo.7524973, 2023.
Cazorla, B., Cabello, J., Peñas, J., Garcillán, P. P., Reyes, A., and Alcaraz-Segura, D.: Incorporating ecosystem functional diversity into geographic conservation priorities using remotely-sensed Ecosystem Functional Types, Ecosystems, https://doi.org/10.1007/s10021-020-00533-4, 2020.
Cazorla, B., Garcillán, P. P., Cabello, J., Alcaraz-Segura, D., Reyes, A., and Peñas, J.: Patterns of ecosystem functioning as tool for biological regionalization: the case of the mediterranean-desert-tropical transition of Baja California, Mediterr. Bot., 42, e68529, https://doi.org/10.5209/mbot.68529, 2021.
Cazorla, B. P., Cabello, J., Reyes, A., Guirado, E., Peñas, J., Pérez-Luque, A. J., and Alcaraz-Segura, D.: A remote-sensing-based dataset to characterize the ecosystem functioning and functional diversity in the Biosphere Reserve of the Sierra Nevada (southeastern Spain), Earth Syst. Sci. Data, 15, 1871–1887, https://doi.org/10.5194/essd-15-1871-2023, 2023.
Cazorla, B. P., Meijide, A., Cabello, J., Peñas, J., Vargas, R., Martínez-López, J., Montagnani, L., Knohl, A., Siebicke, L., Gioli, B., Dušek, J., Šigut, L., Ibrom, A., Wohlfahrt, G., Paul-Limoges, E., Fuchs, K., Manco, A., Pavelka, M., Merbold, L., Hörtnagl, L., Duce, P., Goded, I., Pilegaard, K., and Alcaraz-Segura, D.: Satellite-derived Ecosystem Functional Types of Europe, Zenodo [data set], https://doi.org/10.5281/zenodo.18325891, 2026.
Chu, H., Luo, X., Ouyang, Z., Chan, W. S., Dengel, S., Biraud, S. C., Torn, M. S., Metzger, S., Kumar, J., Arain, M. A., Arkebauer, T. J., Baldocchi, D., Bernacchi, C., Billesbach, D., Black, T. A., Blanken, P. D., Bohrer, G., Bracho, R., Brown, S., Brunsell, N. A., Chen, J., Chen, X., Clark, K., Desai, A. R., Duman, T., Durden, D., Fares, S., Forbrich, I., Gamon, J. A., Gough, C. M., Griffis, T., Helbig, M., Hollinger, D., Humphreys, E., Ikawa, H., Iwata, H., Ju, Y., Knowles, J. F., Knox, S. H., Kobayashi, H., Kolb, T., Law, B., Lee, X., Litvak, M., Liu, H., Munger, J. W., Noormets, A., Novick, K., Oberbauer, S. F., Oechel, W., Oikawa, P., Papuga, S. A., Pendall, E., Prajapati, P., Prueger, J., Quinton, W. L., Richardson, A. D., Russell, E. S., Scott, R. L., Starr, G., Staebler, R., Stoy, P. C., Stuart-Haëntjens, E., Sonnentag, O., Sullivan, R. C., Suyker, A., Ueyama, M., Vargas, R., Wood, J. D., and Zona, D.: Representativeness of eddy-covariance flux footprints for areas surrounding AmeriFlux sites, Agric. For. Meteorol., 301, 108350, https://doi.org/10.1016/j.agrformet.2021.108350, 2021.
Clark, J. S.: Why species tell more about traits than traits about species: predictive analysis, Ecology, 97, 1979–1993, https://doi.org/10.1002/ecy.1453, 2016.
Costanza, R., d'Arge, R., de Groot, R., Farber, S., Grasso, M., Hannon, B., Limburg, K., Naeem, S., O'Neill, R. V., Paruelo, J., Raskin, R. G., Sutton, P., and van den Belt, M.: The value of the world's ecosystem services and natural capital, Nature, 387, 253–260, https://doi.org/10.1038/387253a0, 1997.
Costanza, R., Wilson, M., Troy, A., Voinov, A., Liu, S., and D'Agostino, J.: The value of New Jersey's ecosystem services and natural capital, Institute for Sustainable Solutions, Burlington, VT, https://njseagrant.org/wp-content/uploads/2000/10/The-Value-of-New-Jerseys-Ecosystem-Services-and-Natural-Capital-1.pdf (last access: 3 February 2026), 2006.
Díaz, S. M., Settele, J., Brondízio, E., Ngo, H., Guèze, M., Agard, J., Arneth, A., Balvanera, P., Brauman, K., Butchart, S., Chan, K. M. A., Garibaldi, L. A., Ichii, K., Liu, J., Subramanian, S., Midgley, G., Miloslavich, P., Molnár, Z., Obura, D., Pfaff, A., Polasky, S., Purvis, A., Razzaque, J., Reyers, B., Roy Chowdhury, R., Shin, Y.-J., Visseren-Hamakers, I., Willis, K., and Zayas, C.: The global assessment report on biodiversity and ecosystem services: Summary for policy makers. Intergovernmental Science-Policy Platform on Biodiversity and Ecosystem Services, https://ipbes.net/global-assessment (last access: 3 February 2026), 2019.
Domingo-Marimon, C., Jenerowicz-Sanikowska, M., Pesquer, L., Ruciński, M., Krupiński, M., Woźniak, E., Foks-Ryznar, A., and Quader, M. A.: Developing an early warning land degradation indicator based on geostatistical analysis of Ecosystem Functional Types dynamics, Ecol. Indic., 169, 112815, https://doi.org/10.1016/j.ecolind.2024.112815, 2024.
Epstein, H. E., Burke, I. C., and Mosier, A. R.: Plant effects on spatial and temporal patterns of nitrogen cycling in shortgrass steppe, Ecosystems, 1, 374–385, https://doi.org/10.1007/s100219900030, 1998.
European Environment Agency (EEA): Biogeographical regions dataset, European Environment Agency [data set], https://www.eea.europa.eu/data-and-maps/data/biogeographical-regions-europe-3(last access: 3 February 2026), 2016.
Fernández, N., Paruelo, J. M., and Delibes, M.: Ecosystem functioning of protected and altered Mediterranean environments: a remote sensing classification in Doñana, Spain, Remote Sens. Environ., 114, 211–220, https://doi.org/10.1016/j.rse.2009.09.009, 2010.
Franz, D., Acosta, M., Altimir, N., Arriga, N., Arrouays, D., Aubinet, M., Aurela, M., Ayres, E., López-Ballesteros, A., Barbaste, M., Berveiller, D., Biraud, S., Boukir, H., Brown, T., Brümmer, C., Buchmann, N., Burba, G., Carrara, A., Cescatti, A., Ceschia, 70 E., Clement, R., Cremonese, E., Crill, P., Darenova, E., Dengel, S., D’Odorico, P., Filippa, G., Fleck, S., Fratini, G., Fuß, R., Gielen, B., Gogo, S., Grace, J., Graf, A., Grelle, A., Gross, P., Grünwald, T., Haapanala, S., Hehn, M., Heinesch, B., Heiskanen, J., Herbst, M., Herschlein, C., Hörtnagl, L., Hufkens, K., 75 Ibrom, A., Jolivet, C., Joly, L., Jones, M., Kiese, R., Klemedtsson, L., Kljun, N., Klumpp, K., Kolari, P., Kolle, O., Kowalski, A., Kutsch, W., Laurila, T., de Ligne, A., Linder, S., Lindroth, A., Lohila, A., Longdoz, B., Mammarella, I., Manise, T., Marañón Jiménez, S., Matteucci, G., Mauder, M., Meier, P., Mer- 80 bold, L., Mereu, S., Metzger, S., Migliavacca, M., Mölder, M., Montagnani, L., Moureaux, C., Nelson, D., Nemitz, E., Nicolini, G., Nilsson, M. B., Op de Beeck, M., Osborne, B., Ottosson Löfvenius, M., Pavelka, M., Peichl, M., Peltola, O., Pihlatie, M., Pitacco, A., Pokorný, R., Pumpanen, J., Ratié, C., Rebmann, C., 85 Roland, M., Sabbatini, S., Saby, N. P. A., Saunders, M., Schmid, H. P., Schrumpf, M., Sedlák, P., Serrano Ortiz, P., Siebicke, L., Šigut, L., Silvennoinen, H., Simioni, G., Skiba, U., Sonnentag, O., Soudani, K., Soulé, P., Steinbrecher, R., Tallec, T., Thimonier, A., Tuittila, E.-S., Tuovinen, J.-P., Vestin, P., Vincent, G., Vincke, 90 C., Vitale, D., Waldner, P., Weslien, P., Wingate, L., Wohlfahrt, G., Zahniser, M., and Vesala, T.: Towards long-term standardised carbon and greenhouse gas observations for monitoring Europe’s terrestrial ecosystems: a review, Int. Agrophys, 32, 439–455 https://doi.org/10.1515/intag-2017-0039, 2018.
Funk, J. L., Larson, J. E., Ames, G. M., Butterfield, B. J., Cavender-Bares, J., Firn, J., Laughlin, D. C., Sutton-Grier, A. E., Williams, L., and Wright, J.: Revisiting the holy grail: using plant functional traits to understand ecological processes, Biol. Rev., 92, 1156–1173, https://doi.org/10.1111/brv.12275, 2017.
Gomarasca, U., Duveiller, G., Pacheco-Labrador, J., Ceccherini, G., Cescatti, A., Girardello, M., Nelson, J. A., Reichstein, M., Wirth, C., and Migliavacca, M..: Satellite remote sensing reveals the footprint of biodiversity on multiple ecosystem functions across the NEON eddy covariance network, Environ. Res. Ecol., 3, 045003, https://doi.org/10.1088/2752-664X/ad87f9, 2024.
Hellmann, C., Große-Stoltenberg, A., Thiele, J., Oldeland, J., and Werner, C.: Heterogeneous environments shape invader impacts: integrating environmental, structural and functional effects by isoscapes and remote sensing, Sci. Rep., 7, 4118, https://doi.org/10.1038/s41598-017-04480-4, 2017.
Huang, X., Xiao, J., and Ma, M.: Evaluating the performance of satellite-derived vegetation indices for estimating gross primary productivity using FLUXNET observations across the globe, Remote Sens., 11, 1823, https://doi.org/10.3390/rs11151823, 2019.
Huete, A., Justice, C., and Van Leeuwen, W.: MODIS vegetation index (MOD13), Algorithm theoretical basis document, NASA EOS-MODIS, 3 pp., https://modis.gsfc.nasa.gov/data/atbd/atbd_mod13.pdf (last access: 3 February 2026), 1999.
Hurrell, A.: The Global Environment, in: International Relations Theory Today, Polity Press, Cambridge, UK, ISBN 978-0745611655, 1995.
IGBP: The IGBP-DIS global 1 km land cover data set “DISCover”: proposal and implementation plans, report of the Land Cover Working Group of IGBP-DIS, IGBP-DIS Office, Toulouse, France, 1992.
Ivits, E., Cherlet, M., Mehl, W., and Sommer, S.: Ecosystem functional units characterized by satellite observed phenology and productivity gradients: a case study for Europe, Ecol. Indic., 27, 17–28, https://doi.org/10.1016/j.ecolind.2012.11.011, 2013.
Jax, K.: Ecosystem Functioning, Cambridge University Press, Cambridge, UK, 280 pp., https://doi.org/10.1017/CBO9780511781216, 2010.
Jetz, W., McGeoch, M. A., Guralnick, R., Ferrier, S., Beck, J., Costello, M. J., Fernandez, M., Geller, G. N., Keil, P., Merow, C., Meyer, C., Muller-Karger, F. E., Pereira, H. M., Regan, E. C., Schmeller, D. S., and Turak, E.: Essential biodiversity variables for mapping and monitoring species populations, Nat. Ecol. Evol., 3, 539–551, https://doi.org/10.1038/s41559-019-0826-1, 2019.
Jobbágy, E. G., Sala, O. E., and Paruelo, J. M.: Patterns and controls of primary production in the Patagonian steppe: a remote sensing approach, Ecology, 83, 307–319, https://doi.org/10.1890/0012-9658(2002)083[0307:PACOPP]2.0.CO;2, 2002.
Jung, M., Schwalm, C., Migliavacca, M., Walther, S., Camps-Valls, G., Koirala, S., Anthoni, P., Besnard, S., Bodesheim, P., Carvalhais, N., Chevallier, F., Gans, F., Goll, D. S., Haverd, V., Köhler, P., Ichii, K., Jain, A. K., Liu, J., Lombardozzi, D., Nabel, J. E. M. S., Nelson, J. A., O'Sullivan, M., Pallandt, M., Papale, D., Peters, W., Pongratz, J., Rödenbeck, C., Sitch, S., Tramontana, G., Walker, A., Weber, U., and Reichstein, M.: Scaling carbon fluxes from eddy covariance sites to globe: synthesis and evaluation of the FLUXCOM approach, Biogeosciences, 17, 1343–1365, https://doi.org/10.5194/bg-17-1343-2020, 2020.
Kljun, N., Calanca, P., Rotach, M. W., and Schmid, H. P.: A simple two-dimensional parameterisation for Flux Footprint Prediction (FFP), Geosci. Model Dev., 8, 3695–3713, https://doi.org/10.5194/gmd-8-3695-2015, 2015.
Knox, S. H., Jackson, R. B., Poulter, B., McNicol, G., Fluet-Chouinard, E., Zhang, Z., Hugelius, G., Bousquet, P., Canadell, J. G., Saunois, M., Papale, D., Chu, H., Keenan, T. F., Baldocchi, D., Torn, M. S., Mammarella, I., Trotta, C., Aurela, M., Bohrer, G., Campbell, D. I., Cescatti, A., Chamberlain, S., Chen, J., Chen, W., Dengel, S., Desai, A. R., Euskirchen, E., Friborg, T., Gasbarra, D., Goded, I., Goeckede, M., Heimann, M., Helbig, M., Hirano, T., Hollinger, D. Y., Iwata, H., Kang, M., Klatt, J., Krauss, K. W., Kutzbach, L., Lohila, A., Mitra, B., Morin, T. H., Nilsson, M. B., Niu, S., Noormets, A., Oechel, W. C., Peichl, M., Peltola, O., Reba, M. L., Richardson, A. D., Runkle, B. R. K., Ryu, Y., Sachs, T., Schäfer, K. V. R., Schmid, H. P., Shurpali, N., Sonnentag, O., Tang, A. C. I., Ueyama, M., Vargas, R., Vesala, T., Ward, E. J., Windham-Myers, L., Wohlfahrt, G., and Zona, D.: FLUXNET-CH4 synthesis activity: objectives, observations, and future directions, Bull. Am. Meteorol. Soc., 100, 2607–2632, https://doi.org/10.1175/BAMS-D-18-0268.1, 2019.
Kostrowicki, J.: Trends in the transformation of European agriculture, in: Land Use Changes in Europe, edited by: Brouwer, F. M., Thomas, A. J., and Chadwick, M. J., Springer Netherlands, Dordrecht, 21–47, https://doi.org/10.1007/978-94-011-3290-9_2, 1991.
Lauenroth, W. K., Dodd, J. L., and Sims, P. L.: The effects of water- and nitrogen-induced stresses on plant community structure in a semiarid grassland, Oecologia, 36, 211–222, https://doi.org/10.1007/BF00349815, 1978.
Lavorel, S. and Garnier, E.: Predicting changes in community composition and ecosystem functioning from plant traits: revisiting the Holy Grail, Funct. Ecol., 16, 545–556, https://doi.org/10.1046/j.1365-2435.2002.00664.x, 2002.
Lavorel, S., Díaz, S., Cornelissen, J. H. C., Garnier, E., Harrison, S. P., McIntyre, S., Pausas, J. G., Pérez-Harguindeguy, N., Roumet, C., and Urcelay, C.: Plant functional types: are we getting any closer to the Holy Grail?, in: Terrestrial Ecosystems in a Changing World, edited by: Canadell, J. G., Pataki, D. E., and Pitelka, L. F., Springer, Berlin, Heidelberg, 149–164, https://doi.org/10.1007/978-3-540-32730-1_13, 2007.
Lee, S.-J., Berbery, E. H., and Alcaraz-Segura, D.: The impact of ecosystem functional type changes on the La Plata Basin climate, Adv. Atmos. Sci., 30, 1387–1405, https://doi.org/10.1007/s00376-012-2149-x, 2013.
Lionello, P., Malanotte-Rizzoli, P., Boscolo, R., Alpert, P., Artale, V., Li, L., Luterbacher, J., May, W., Trigo, R., Tsimplis, M., Ulbrich, U., and Xoplaki, E.: The Mediterranean climate: an overview of the main characteristics and issues, in: Developments in Earth and Environmental Sciences, vol. 4, edited by: Lionello, P., Malanotte-Rizzoli, P., and Boscolo, R., Elsevier, Amsterdam, 1–26, https://doi.org/10.1016/S1571-9197(06)80003-0, 2006.
Liu, L., Smith, J. R., Armstrong, A. H., Alcaraz-Segura, D., Epstein, H. E., Echeverri, A., Langhans, K. E., Schmitt, R. J. P., and Chaplin-Kramer, R.: Influences of satellite sensor and scale on derivation of ecosystem functional types and diversity, Remote Sens., 15, 5593, https://doi.org/10.3390/rs15235593, 2023.
Lourenço, P., Alcaraz-Segura, D., Reyes-Díez, A., Requena-Mullor, J. M., and Cabello, J.: Trends in vegetation greenness dynamics in protected areas across borders: what are the environmental controls?, Int. J. Remote Sens., 39, 4699–4713, https://doi.org/10.1080/01431161.2018.1466080, 2018.
Malaterre, C., Dussault, A. C., Mermans, E., Barker, G., Beisner, B. E., Bouchard, F., Desjardins, E., Handa, I. T., Kembel, S. W., Lajoie, G., Maris, V., Munson, A. D., Odenbaugh, J., Poisot, T., Shapiro, B. J., and Suttle, C. A.: Functional diversity: an epistemic roadmap, BioScience, 69, 800–811, https://doi.org/10.1093/biosci/biz086, 2019.
McNaughton, S. J., Oesterheld, M., Frank, D. A., and Williams, K. J.: Ecosystem-level patterns of primary productivity and herbivory in terrestrial habitats, Nature, 341, 142–144, https://doi.org/10.1038/341142a0, 1989.
Midgley, G. F., Bond, W. J., Kapos, V., Ravilious, C., Scharlemann, J. P. W., and Woodward, F. I.: Terrestrial carbon stocks and biodiversity: key knowledge gaps and some policy implications, Curr. Opin. Environ. Sustain., 2, 264–270, https://doi.org/10.1016/j.cosust.2010.05.003, 2010.
Migliavacca, M., Musavi, T., Mahecha, M. D., Nelson, J. A., Knauer, J., Baldocchi, D. D., Perez-Priego, O., Christiansen, R., Peters, J., Anderson, K., Bahn, M., Black, T. A., Blanken, P. D., Bonal, D., Buchmann, N., Caldararu, S., Carrara, A., Carvalhais, N., Cescatti, A., Chen, J., Cleverly, J., Cremonese, E., Desai, A. R., El-Madany, T. S., Farella, M. M., Fernández-Martínez, M., Filippa, G., Forkel, M., Galvagno, M., Gomarasca, U., Gough, C. M., Göckede, M., Ibrom, A., Ikawa, H., Janssens, I. A., Jung, M., Kattge, J., Keenan, T. F., Knohl, A., Kobayashi, H., Kraemer, G., Law, B. E., Liddell, M. J., Ma, X., Mammarella, I., Martini, D., Macfarlane, C., Matteucci, G., Montagnani, L., Pabon-Moreno, D. E., Panigada, C., Papale, D., Pendall, E., Penuelas, J., Phillips, R. P., Reich, P. B., Rossini, M., Rotenberg, E., Scott, R. L., Stahl, C., Weber, U., Wohlfahrt, G., Wolf, S., Wright, I. J., Yakir, D., Zaehle, S., and Reichstein, M.: The three major axes of terrestrial ecosystem function, Nature, 598, 468–472, https://doi.org/10.1038/s41586-021-03939-9, 2021.
Mouillot, D., Graham, N. A. J., Villéger, S., Mason, N. W. H., and Bellwood, D. R.: A functional approach reveals community responses to disturbances, Trends Ecol. Evol., 28, 167–175, https://doi.org/10.1016/j.tree.2012.10.004, 2013.
Mucina, L.: Biome: evolution of a crucial ecological and biogeographical concept, New Phytol., 222, 97–114, https://doi.org/10.1111/nph.15609, 2019.
Müller, O. V., Berbery, E. H., Alcaraz-Segura, D., and Ek, M. B.: Regional model simulations of the 2008 drought in southern South America using a consistent set of land surface properties, J. Clim., 27, 6754–6778, https://doi.org/10.1175/JCLI-D-13-00524.1, 2014.
Myers, N., Mittermeier, R. A., Mittermeier, C. G., da Fonseca, G. A. B., and Kent, J.: Biodiversity hotspots for conservation priorities, Nature, 403, 853–858, https://doi.org/10.1038/35002501, 2000.
Nelson, J. A., Walther, S., Gans, F., Kraft, B., Weber, U., Novick, K., Buchmann, N., Migliavacca, M., Wohlfahrt, G., Šigut, L., Ibrom, A., Papale, D., Göckede, M., Duveiller, G., Knohl, A., Hörtnagl, L., Scott, R. L., Dušek, J., Zhang, W., Hamdi, Z. M., Reichstein, M., Aranda-Barranco, S., Ardö, J., Op de Beeck, M., Billesbach, D., Bowling, D., Bracho, R., Brümmer, C., Camps-Valls, G., Chen, S., Cleverly, J. R., Desai, A., Dong, G., El-Madany, T. S., Euskirchen, E. S., Feigenwinter, I., Galvagno, M., Gerosa, G. A., Gielen, B., Goded, I., Goslee, S., Gough, C. M., Heinesch, B., Ichii, K., Jackowicz-Korczynski, M. A., Klosterhalfen, A., Knox, S., Kobayashi, H., Kohonen, K.-M., Korkiakoski, M., Mammarella, I., Gharun, M., Marzuoli, R., Matamala, R., Metzger, S., Montagnani, L., Nicolini, G., O'Halloran, T., Ourcival, J.-M., Peichl, M., Pendall, E., Ruiz Reverter, B., Roland, M., Sabbatini, S., Sachs, T., Schmidt, M., Schwalm, C. R., Shekhar, A., Silberstein, R., Silveira, M. L., Spano, D., Tagesson, T., Tramontana, G., Trotta, C., Turco, F., Vesala, T., Vincke, C., Vitale, D., Vivoni, E. R., Wang, Y., Woodgate, W., Yepez, E. A., Zhang, J., Zona, D., and Jung, M.: X-BASE: the first terrestrial carbon and water flux products from an extended data-driven scaling framework, FLUXCOM-X, Biogeosciences, 21, 5079–5115, https://doi.org/10.5194/bg-21-5079-2024, 2024.
Nicholson, E., Watermeyer, K. E., Rowland, J. A., Sato, C. F., Stevenson, S. L., Andrade, A., Brooks, T. M., Burgess, N. D., Cheng, S.-T., Grantham, H. S., Hill, S. L., Keith, D. A., Maron, M., Metzke, D., Murray, N. J., Nelson, C. R., Obura, D., Plumptre, A., Skowno, A. L., and Watson, J. E. M.: Scientific foundations for an ecosystem goal, milestones and indicators for the post-2020 global biodiversity framework, Nat. Ecol. Evol., 5, 1338–1349, https://doi.org/10.1038/s41559-021-01538-5, 2021.
Noble, I. R. and Gitay, H.: A functional classification for predicting the dynamics of landscapes, Journal of Vegetation Science, 7, 329–336, https://doi.org/10.2307/3236276, 1996.
Noss, R. F.: Indicators for monitoring biodiversity: a hierarchical approach, Conserv. Biol., 4, 355–364, https://doi.org/10.1111/j.1523-1739.1990.tb00309.x, 1990.
Noy-Meir, I.: Data transformations in ecological ordination: I. Some advantages of non-centering, J. Ecol., 61, 329–341, https://doi.org/10.2307/2258933, 1973.
Oki, T., Blyth, E. M., Berbery, E. H., and Alcaraz-Segura, D.: Land use and land cover changes and their impacts on hydroclimate, ecosystems and society, in: Climate Science for Serving Society: Research, Modeling and Prediction Priorities, edited by: Asrar, G. R. and Hurrell, J. W., Springer Netherlands, Dordrecht, 185–203, https://doi.org/10.1007/978-94-007-6692-1_10, 2013.
Pacheco-Labrador, J., Migliavacca, M., Ma, X., Mahecha, M. D., Carvalhais, N., Weber, U., Benavides, R., Bouriaud, O., Barnoaiea, I., Coomes, D. A., Bohn, F. J., Kraemer, G., Heiden, U., Huth, A., and Wirth, C.: Challenging the link between functional and spectral diversity with radiative transfer modeling and data, Remote Sens. Environ., 280, 113170, https://doi.org/10.1016/j.rse.2022.113170, 2022.
Palter, J. B.: The role of the Gulf Stream in European climate, Annu. Rev. Mar. Sci., 7, 113–137, https://doi.org/10.1146/annurev-marine-010814-015656, 2015.
Paruelo, J. M., Jobbágy, E. G., and Sala, O. E.: Current distribution of ecosystem functional types in temperate South America, Ecosystems, 4, 683–698, https://doi.org/10.1007/s10021-001-0037-9, 2001.
Pastorello, G., Trotta, C., Canfora, E., Chu, H., Christianson, D., Cheah, Y.-W., Poindexter, C., Chen, J., Elbashandy, A., Humphrey, M., Isaac, P., Polidori, D., Reichstein, M., Ribeca, A., van Ingen, C., Vuichard, N., Zhang, L., Amiro, B., Ammann, C., Arain, M. A., Ardö, J., Arkebauer, T., Arndt, S. K., Arriga, N., Aubinet, M., Aurela, M., Baldocchi, D., Barr, A., Beamesderfer, E., Belelli Marchesini, L., Bergeron, O., Beringer, J., Bernhofer, C., Berveiller, D., Billesbach, D., Black, T. A., Blanken, P. D., Bohrer, G., Boike, J., Bolstad, P. V., Bonal, D., Bonnefond, J.-M., Bowling, D. R., Bracho, R., Brodeur, J., Brümmer, C., Buchmann, N., Burban, B., Burns, S. P., Buysse, P., Cale, P., Cavagna, M., Cellier, P., Chen, S., Chini, I., Christensen, T. R., Cleverly, J., Collalti, A., Consalvo, C., Cook, B. D., Cook, D., Coursolle, C., Cremonese, E., Curtis, P. S., D'Andrea, E., da Rocha, H., Dai, X., Davis, K. J., De Cinti, B., de Grandcourt, A., de Ligne, A., De Oliveira, R. C., Delpierre, N., Desai, A. R., Di Bella, C. M., di Tommasi, P., Dolman, H., Domingo, F., Dong, G., Dore, S., Duce, P., Dufrêne, E., Dunn, A., Dušek, J., Eamus, D., Eichelmann, U., ElKhidir, H. A. M., Eugster, W., Ewenz, C. M., Ewers, B., Famulari, D., Fares, S., Feigenwinter, I., Feitz, A., Fensholt, R., Filippa, G., Fischer, M., Frank, J., Galvagno, M., Gharun, M., Gianelle, D., Gielen, B., Gioli, B., Gitelson, A., Goded, I., Goeckede, M., Goldstein, A. H., Gough, C. M., Goulden, M. L., Graf, A., Griebel, A., Gruening, C., Grünwald, T., Hammerle, A., Han, S., Han, X., Hansen, B. U., Hanson, C., Hatakka, J., He, Y., Hehn, M., Heinesch, B., Hinko-Najera, N., Hörtnagl, L., Hutley, L., Ibrom, A., Ikawa, H., Jackowicz-Korczynski, M., Janouš, D., Jans, W., Jassal, R., Jiang, S., Kato, T., Khomik, M., Klatt, J., Knohl, A., Knox, S., Kobayashi, H., Koerber, G., Kolle, O., Kosugi, Y., Kotani, A., Kowalski, A., Kruijt, B., Kurbatova, J., Kutsch, W. L., Kwon, H., Launiainen, S., Laurila, T., Law, B., Leuning, R., Li, Y., Liddell, M., Limousin, J.-M., Lion, M., Liska, A. J., Lohila, A., López-Ballesteros, A., López-Blanco, E., Loubet, B., Loustau, D., Lucas-Moffat, A., Lüers, J., Ma, S., Macfarlane, C., Magliulo, V., Maier, R., Mammarella, I., Manca, G., Marcolla, B., Margolis, H. A., Marras, S., Massman, W., Mastepanov, M., Matamala, R., Matthes, J. H., Mazzenga, F., McCaughey, H., McHugh, I., McMillan, A. M. S., Merbold, L., Meyer, W., Meyers, T., Miller, S. D., Minerbi, S., Moderow, U., Monson, R. K., Montagnani, L., Moore, C. E., Moors, E., Moreaux, V., Moureaux, C., Munger, J. W., Nakai, T., Neirynck, J., Nesic, Z., Nicolini, G., Noormets, A., Northwood, M., Nosetto, M., Nouvellon, Y., Novick, K., Oechel, W., Olesen, J. E., Ourcival, J.-M., Papuga, S. A., Parmentier, F.-J., Paul-Limoges, E., Pavelka, M., Peichl, M., Pendall, E., Phillips, R. P., Pilegaard, K., Pirk, N., Posse, G., Powell, T., Prasse, H., Prober, S. M., Rambal, S., Rannik, Ü., Raz-Yaseef, N., Rebmann, C., Reed, D., Resco de Dios, V., Restrepo-Coupe, N., Reverter, B. R., Roland, M., Sabbatini, S., Sachs, T., Saleska, S. R., Sánchez-Cañete, E. P., Sanchez-Mejia, Z. M., Schmid, H. P., Schmidt, M., Schneider, K., Schrader, F., Schroder, I., Scott, R. L., Sedlák, P., Serrano-Ortíz, P., Shao, C., Shi, P., Shironya, I., Siebicke, L., Šigut, L., Silberstein, R., Sirca, C., Spano, D., Steinbrecher, R., Stevens, R. M., Sturtevant, C., Suyker, A., Tagesson, T., Takanashi, S., Tang, Y., Tapper, N., Thom, J., Tomassucci, M., Tuovinen, J.-P., Urbanski, S., Valentini, R., van der Molen, M., van Gorsel, E., van Huissteden, K., Varlagin, A., Verfaillie, J., Vesala, T., Vincke, C., Vitale, D., Vygodskaya, N., Walker, J. P., Walter-Shea, E., Wang, H., Weber, R., Westermann, S., Wille, C., Wofsy, S., Wohlfahrt, G., Wolf, S., Woodgate, W., Li, Y., Zampedri, R., Zhang, J., Zhou, G., Zona, D., Agarwal, D., Biraud, S., Torn, M., and Papale, D.: The FLUXNET2015 dataset and the ONEFlux processing pipeline for eddy covariance data, Sci. Data, 7, 225, https://doi.org/10.1038/s41597-020-0534-3, 2020.
Pearson, R. G. and Dawson, T. P.: Predicting the impacts of climate change on the distribution of species: are bioclimate envelope models useful?, Glob. Ecol. Biogeogr., 12, 361–371, https://doi.org/10.1046/j.1466-822X.2003.00042.x, 2003.
Pereira, H. M., Ferrier, S., Walters, M., Geller, G. N., Jongman, R. H. G., Scholes, R. J., Bruford, M. W., Brummitt, N., Butchart, S. H. M., Cardoso, A. C., Coops, N. C., Dulloo, E., Faith, D. P., Freyhof, J., Gregory, R. D., Heip, C., Höft, R., Hurtt, G., Jetz, W., Karp, D. S., McGeoch, M. A., Obura, D., Onoda, Y., Pettorelli, N., Reyers, B., Sayre, R., Scharlemann, J. P. W., Stuart, S. N., Turak, E., Walpole, M., and Wegmann, M.: Essential biodiversity variables, Science, 339, 277–278, https://doi.org/10.1126/science.1229931, 2013.
Pérez-Hoyos, A., Martínez, B., García-Haro, F. J., Moreno, Á., and Gilabert, M. A.: Identification of ecosystem functional types from coarse resolution imagery using a self-organizing map approach: a case study for Spain, Remote Sens., 6, 11391–11419, https://doi.org/10.3390/rs61111391, 2014.
Petrakis, S., Barba, J., Bond-Lamberty, B., and Vargas, R.: Using greenhouse gas fluxes to define soil functional types, Plant Soil, 423, 285–294, https://doi.org/10.1007/s11104-017-3506-4, 2018.
Pettorelli, N., Wegmann, M., Skidmore, A., Mücher, S., Dawson, T. P., Fernandez, M., Lucas, R., Schaepman, M. E., Wang, T., O'Connor, B., Jongman, R. H. G., Kempeneers, P., Sonnenschein, R., Leidner, A. K., Böhm, M., He, K. S., Nagendra, H., Dubois, G., Fatoyinbo, T., Hansen, M. C., Paganini, M., de Klerk, H. M., Asner, G. P., Kerr, J. T., Estes, A. B., Schmeller, D. S., Heiden, U., Rocchini, D., Pereira, H. M., Turak, E., Fernandez, N., Lausch, A., Cho, M. A., Alcaraz-Segura, D., McGeoch, M. A., Turner, W., Mueller, A., St-Louis, V., Penner, J., Vihervaara, P., Belward, A., Reyers, B., and Geller, G. N.: Framing the concept of satellite remote sensing essential biodiversity variables: challenges and future directions, Remote Sens. Ecol. Conserv., 2, 122–131, https://doi.org/10.1002/rse2.15, 2016.
Pettorelli, N., Schulte to Bühne, H., Tulloch, A., Dubois, G., Macinnis-Ng, C., Queirós, A. M., Keith, D. A., Wegmann, M., Schrodt, F., Stellmes, M., Sonnenschein, R., Geller, G. N., Roy, S., Somers, B., Murray, N., Bland, L., Geijzendorffer, I., Kerr, J. T., Broszeit, S., Leitão, P. J., Duncan, C., El Serafy, G., He, K. S., Blanchard, J. L., Lucas, R., Mairota, P., Webb, T. J., and Nicholson, E.: Satellite remote sensing of ecosystem functions: opportunities, challenges and way forward, Remote Sens. Ecol. Conserv., 4, 71–93, https://doi.org/10.1002/rse2.59, 2018.
Reed, R. A., Peet, R. K., Palmer, M. W., and White, P. S.: Scale dependence of vegetation-environment correlations: a case study of a North Carolina piedmont woodland, J. Veg. Sci., 4, 329–340, https://doi.org/10.2307/3236104, 1993.
Reichstein, M., Bahn, M., Mahecha, M. D., Kattge, J., and Baldocchi, D. D.: Linking plant and ecosystem functional biogeography, Proc. Natl. Acad. Sci. USA, 111, 13697–13702, https://doi.org/10.1073/pnas.1216065111, 2014.
Requena-Mullor, J. M., López, E., Castro, A. J., Alcaraz-Segura, D., Castro, H., Reyes, A., and Cabello, J.: Remote-sensing based approach to forecast habitat quality under climate change scenarios, PLoS ONE, 12, e0172107, https://doi.org/10.1371/journal.pone.0172107, 2017.
Requena-Mullor, J. M., Quintas-Soriano, C., Brandt, J., Cabello, J., and Castro, A. J.: Modeling how land use legacy affects the provision of ecosystem services in Mediterranean southern Spain, Environ. Res. Lett., 13, 114008, https://doi.org/10.1088/1748-9326/aae5e3, 2018.
Richardson, K., Steffen, W., Lucht, W., Bendtsen, J., Cornell, S. E., Donges, J. F., Drüke, M., Fetzer, I., Bala, G., von Bloh, W., Feulner, G., Fiedler, S., Gerten, D., Gleeson, T., Hofmann, M., Huiskamp, W., Kummu, M., Mohan, C., Nogués-Bravo, D., Petri, S., Porkka, M., Rahmstorf, S., Schaphoff, S., Thonicke, K., Tobian, A., Virkki, V., Wang-Erlandsson, L., Weber, L., and Rockström, J.: Earth beyond six of nine planetary boundaries, Sci. Adv., 9, eadh2458, https://doi.org/10.1126/sciadv.adh2458, 2023.
Rocchini, D., Bacaro, G., Chirici, G., Da Re, D., Feilhauer, H., Foody, G. M., Galluzzi, M., Garzon-Lopez, C. X., Gillespie, T. W., He, K. S., Lenoir, J., Marcantonio, M., Nagendra, H., Ricotta, C., Rommel, E., Schmidtlein, S., Skidmore, A. K., Van De Kerchove, R., Wegmann, M., and Rugani, B.: Remotely sensed spatial heterogeneity as an exploratory tool for taxonomic and functional diversity study, Ecol. Indic., 85, 983–990, https://doi.org/10.1016/j.ecolind.2017.11.052, 2018.
Rosenzweig, C. and Dickinson, R. (Eds.): Climate-Vegetation Interactions, Office for Interdisciplinary Earth Studies, University Corporation for Atmospheric Research, Boulder, CO, USA, https://doi.org/10.1051/jp4:20020452, 1986.
Running, S. W., Baldocchi, D. D., Turner, D. P., Gower, S. T., Bakwin, P. S., and Hibbard, K. A.: A global terrestrial monitoring network integrating tower fluxes, flask sampling, ecosystem modeling and EOS satellite data, Remote Sens. Environ., 70, 108–127, https://doi.org/10.1016/S0034-4257(99)00061-9, 1999.
Running, S. W., Nemani, R. R., Heinsch, F. A., Zhao, M., Reeves, M., and Hashimoto, H.: A continuous satellite-derived measure of global terrestrial primary production, BioScience, 54, 547–560, https://doi.org/10.1641/0006-3568(2004)054[0547:ACSMOG]2.0.CO;2, 2004.
Saccone, P., Hoikka, K., and Virtanen, R.: What if plant functional types conceal species-specific responses to environment? Study on arctic shrub communities, Ecology, 98, 1600–1612, https://doi.org/10.1002/ecy.1822, 2017.
Schmid, H. P.: Footprint modeling for vegetation atmosphere exchange studies: a review and perspective, Agricultural and Forest Meteorology, 113, 159–183, https://doi.org/10.1016/S0168-1923(02)00107-7, 2002.
Shi, H., Li, L., Eamus, D., Huete, A., Cleverly, J., Tian, X., Yu, Q., Wang, S., Montagnani, L., Magliulo, V., and Rotenberg, E.: Assessing the ability of MODIS EVI to estimate terrestrial ecosystem gross primary production of multiple land cover types, Ecological Indicators, 72, 153–164, https://doi.org/10.1016/j.ecolind.2016.08.022, 2017.
Skidmore, A. K., Pettorelli, N., Coops, N. C., Geller, G. N., Hansen, M., Lucas, R., Mücher, C. A., O'Connor, B., Paganini, M., Pereira, H. M., Schaepman, M. E., Turner, W., Wang T., and Wegmann, M.: Environmental science: Agree on biodiversity metrics to track from space, Nature, 523, 403–405, https://doi.org/10.1038/523403a, 2015.
Skidmore, A. K., Coops, N. C., Neinavaz, E., Ali, A., Schaepman, M. E., Paganini, M., Kissling, W. D., Vihervaara, P., Darvishzadeh, R., Feilhauer, H., Fernandez, M., Fernández, N., Gorelick, N., Geijzendorffer, I., Heiden, U., Heurich, M., Hobern, D., Holzwarth, S., Muller-Karger, F. E., Van De Kerchove, R., Lausch, A., Leitão, P. J., Lock, M. C., Mücher, C. A., O'Connor, B., Rocchini, D., Roeoesli, C., Turner, W., Vis, J. K., Wang, T., Wegmann, M., and Wingate, V.: Priority list of biodiversity metrics to observe from space, Nat. Ecol. Evol., 5, 896–906, https://doi.org/10.1038/s41559-021-01451-x, 2021.
Steffen, W., Richardson, K., Rockström, J., Cornell, S. E., Fetzer, I., Bennett, E. M., Biggs, R., Carpenter, S. R., de Vries, W., de Wit, C. A., Folke, C., Gerten, D., Heinke, J., Mace, G. M., Persson, L. M., Ramanathan, V., Reyers, B., and Sörlin, S.: Planetary boundaries: guiding human development on a changing planet, Science, 347, 1259855, https://doi.org/10.1126/science.1259855, 2015.
Suding, K. N. and Goldstein, L. J.: Testing the Holy Grail framework: using functional traits to predict ecosystem change, New Phytol., 180, 559–562, https://doi.org/10.1111/j.1469-8137.2008.02667.x, 2008.
Sundseth, K.: Natura 2000 in the Alpine region, European Commission, https://data.europa.eu/doi/10.2779/81263 (last access: 3 February 2026), 2009a.
Sundseth, K.: Natura 2000 in the Continental region, European Commission, https://doi.org/10.2779/83178, 2009b.
Thomas, H. J. D., Myers-Smith, I. H., Bjorkman, A. D., Elmendorf, S. C., Blok, D., Cornelissen, J. H. C., Forbes, B. C., Hollister, R. D., Normand, S., Prevéy, J. S., Rixen, C., Schaepman-Strub, G., Wilmking, M., Wipf, S., Cornwell, W. K., Kattge, J., Goetz, S. J., Guay, K. C., Alatalo, J. M., Anadon-Rosell, A., Angers-Blondin, S., Berner, L. T., Björk, R. G., Buchwal, A., Buras, A., Carbognani, M., Christie, K., Siegwart Collier, L., Cooper, E. J., Eskelinen, A., Frei, E. R., Grau, O., Grogan, P., Hallinger, M., Heijmans, M. M. P. D., Hermanutz, L., Hudson, J. M. G., Hülber, K., Iturrate-Garcia, M., Iversen, C. M., Jaroszynska, F., Johnstone, J. F., Kaarlejärvi, E., Kulonen, A., Lamarque, L. J., Lévesque, E., Little, C. J., Michelsen, A., Milbau, A., Nabe-Nielsen, J., Nielsen, S. S., Ninot, J. M., Oberbauer, S. F., Olofsson, J., Onipchenko, V. G., Petraglia, A., Rumpf, S. B., Semenchuk, P. R., Soudzilovskaia, N. A., Spasojevic, M. J., Speed, J. D. M., Tape, K. D., te Beest, M., Tomaselli, M., Trant, A., Treier, U. A., Venn, S., Vowles, T., Weijers, S., Zamin, T., Atkin, O. K., Bahn, M., Blonder, B., Campetella, G., Cerabolini, B. E. L., Chapin, F. S., Dainese, M., de Vries, F. T., Díaz, S., Green, W., Jackson, R. B., Manning, P., Niinemets, Ü., Ozinga, W. A., Peñuelas, J., Reich, P. B., Schamp, B., Sheremetev, S., and van Bodegom, P. M.: Traditional plant functional groups explain variation in economic but not size-related traits across the tundra biome, Glob. Ecol. Biogeogr., 28, 78–95, https://doi.org/10.1111/geb.12856, 2019.
Tilman, D., Isbell, F., and Cowles, J. M.: Biodiversity and ecosystem functioning, Annu. Rev. Ecol. Evol. Syst., 45, 471–493, https://doi.org/10.1146/annurev-ecolsys-120213-091917, 2014.
Vargas, R., Sonnentag, O., Abramowitz, G., Carrara, A., Chen, J. M., Ciais, P., Correia, A., Keenan, T. F., Kobayashi, H., Ourcival, J.-M., Papale, D., Pearson, D., Pereira, J. S., Piao, S., Rambal, S., and Dennis, D.: Drought influences the accuracy of simulated ecosystem fluxes: a model-data meta-analysis for Mediterranean oak woodlands, Ecosystems, 16, 749–764, https://doi.org/10.1007/s10021-013-9648-1, 2013.
Vaz, A. S., Alcaraz-Segura, D., Campos, J. C., Vicente, J. R., and Honrado, J. P.: Managing plant invasions through the lens of remote sensing: a review of progress and the way forward, Sci. Total Environ., 642, 1328–1339, https://doi.org/10.1016/j.scitotenv.2018.06.142, 2018.
Villarreal, S. and Vargas, R.: Representativeness of FLUXNET sites across Latin America, J. Geophys. Res. Biogeosci., 126, e2020JG006090, https://doi.org/10.1029/2020JG006090, 2021.
Villarreal, S., Guevara, M., Alcaraz-Segura, D., Brunsell, N. A., Hayes, D., Loescher, H. W., and Vargas, R.: Ecosystem functional diversity and the representativeness of environmental networks across the conterminous United States, Agric. For. Meteorol., 262, 423–433, https://doi.org/10.1016/j.agrformet.2018.07.026, 2018.
Villarreal, S., Guevara, M., Alcaraz-Segura, D., and Vargas, R.: Optimizing an environmental observatory network design using publicly available data, J. Geophys. Res. Biogeosci., 124, 1812–1826, https://doi.org/10.1029/2018JG004776, 2019.
Violle, C., Reich, P. B., Pacala, S. W., Enquist, B. J., and Kattge, J.: The emergence and promise of functional biogeography, Proc. Natl. Acad. Sci. USA, 111, 13690–13696, https://doi.org/10.1073/pnas.1415442111, 2014.
Violle, C., Thuiller, W., Mouquet, N., Munoz, F., Kraft, N. J. B., Cadotte, M. W., Livingstone, S. W., and Mouillot, D.: Functional rarity: the ecology of outliers, Trends Ecol. Evol., 32, 356–367, https://doi.org/10.1016/j.tree.2017.02.002, 2017.
Virginia, R. A. and Wall, D. H.: Ecosystem function, principles of, in: Encyclopedia of Biodiversity, edited by: Levin, S. A., Academic Press, San Diego, 345–352, ISBN 0122268652, 2001.
Vitousek, P. M.: Beyond global warming: ecology and global change, Ecology, 75, 1861–1876, https://doi.org/10.2307/1941591, 1994.
Wang, L., Zhu, H., Lin, A., Zou, L., Qin, W., and Du, Q.: Evaluation of the latest MODIS GPP products across multiple biomes using global eddy covariance flux data, Remote Sens., 9, 418, https://doi.org/10.3390/rs9050418, 2017.
Whittaker, R. J., Nogués-Bravo, D., and Araújo, M. B.: Geographical gradients of species richness: a test of the water–energy conjecture of Hawkins (2003) using European data for five taxa, Glob. Ecol. Biogeogr., 16, 76–89, https://doi.org/10.1111/j.1466-8238.2006.00268.x, 2007.
Williams, B. K.: Discriminant analysis in wildlife research: theory and applications, in: The Use of Multivariate Statistics in Studies of Wildlife Habitat, edited by: Capen, D. E., 59–71, General Technical Report RM-87, U.S. Department of Agriculture, Forest Service, https://pubs.usgs.gov/publication/5210237 (last access: 3 February 2026), 1981.
Williams, B. K.: Some observations of the use of discriminant analysis in ecology, Ecology, 64, 1283–1291, https://doi.org/10.2307/1937839, 1983.
Wullschleger, S. D., Epstein, H. E., Box, E. O., Euskirchen, E. S., Goswami, S., Iversen, C. M., Kattge, J., Norby, R. J., van Bodegom, P. M., and Xu, X.: Plant functional types in Earth system models: past experiences and future directions for application of dynamic vegetation models in high-latitude ecosystems, Ann. Bot., 114, 1–16, https://doi.org/10.1093/aob/mcu077, 2014.
Xiao, H., McDonald-Madden, E., Sabbadin, R., Peyrard, N., Dee, L. E., and Chadés, I. The value of understanding feedbacks from ecosystem functions to species for managing ecosystems, Nature Communications, 10, 3901, https://doi.org/10.1038/s41467-019-11890-7, 2019.
Zhang, Y., Song, C., Sun, G., Band, L. E., McNulty, S., Noormets, A., Zhang, Q., and Zhang, Z.: Development of a coupled carbon and water model for estimating global gross primary productivity and evapotranspiration based on eddy flux and remote sensing data, Agric. For. Meteorol., 223, 116–131, https://doi.org/10.1016/j.agrformet.2016.04.003, 2016.