the Creative Commons Attribution 4.0 License.
the Creative Commons Attribution 4.0 License.
 | 19 Feb 2026
Carbon storage in coastal reed ecosystems
Margaret F. Williamson
Tom Jilbert
Alf Norkko
Camilla Gustafsson
Common reed (Phragmites australis) distribution has increased in coastal ecosystems across the globe, including the Baltic Sea. Understanding carbon (C) storage in reed beds is critical for developing more accurate blue carbon (BC) budgets and best management practices, yet there currently appears to be a gap in knowledge about C cycling in these ecosystems. Reed beds are typically categorized as salt marsh ecosystems in BC budgets, but preliminary findings indicate reed beds are unique from salt marsh ecosystems and show great potential for C storage. It is, therefore, important to understand C storage in reed beds so that these ecosystems can be taken into consideration while developing BC budgets.
The aim of this spatial study was to quantify how much C is stored in above- and belowground biomass, and sediments in the different zones of reed beds along the Pojo Bay system of the northern Baltic Sea in coastal Finland. We selected 6 reed bed sites to sample along Pojo Bay from the northern-most part of the Bay to the southern-most part opening into the Baltic Sea. In each site, samples were selected randomly within each of the 3 reed bed zones (terrestrial, intermittent, and littoral) and analyzed for sediment parameters (dry bulk density, organic matter content), plant characteristics (stem density), and plant and sediment-bound C content.
Sediment samples were collected down to 1m depth, when possible, with the use of Russian peat borers and a box corer. Dry bulk density (DBD) was variable across all sites, sediment depths, and reed bed zones with highest DBDs measuring 2.55 g cm−3 (LOI (loss on ignition) = 0.7 % and water = 1.3 %) and the lowest DBD measuring 0.05 g cm−3 (LOI = 74 % and water = 94.6 %). The results from sediment LOI show higher organic matter content in the upper 30 cm of sediment profiles and a general trend towards higher organic matter content in terrestrial and intermittent zones than littoral zones of reed beds. C content in sediment, above- and belowground biomass was significantly different at the zone level for all sites and, with one exception, was significantly different at the site level for all variables measured (DBD, LOI, sediment C stocks, stem counts, aboveground C stocks, and belowground C stocks). The highest sediment C stocks were typically found in the intermittent zone while the lowest were typically found in the littoral zone across all sites. Average stem counts were variable across sites and reed bed zones with the highest and lowest stem counts being 217 stems m−2 and 9 stems m−2, respectively. Aboveground biomass (stems and leaves) C stock averages were generally highest in the intermittent zones and lowest in the terrestrial and littoral zones. Belowground biomass (roots and rhizomes) C stock averages were generally highest in the intermittent zone and lowest in the littoral zone. C storage in reed bed sediments and belowground biomass was higher than C storage in aboveground biomass for all sites. The sites stored, on average, between approximately 8 and 20 kg C m−2 when looking at sediment C stocks, aboveground biomass C stocks, and belowground biomass C stocks together. The different reed bed zones stored, on average, between approximately 4 and 16 kg C m−2. with the highest C stocks found in the intermittent zones.
These findings are significant as they help rectify a gap in knowledge on how much C is stored in reed bed biomass and sediment which is important for management of this rapidly expanding coastal ecosystem type and enables researchers to develop more accurate coastal carbon budgets as part of climate change mitigation.
- Article
(1508 KB) - Full-text XML
-
Supplement
(968 KB) - BibTeX
- EndNote


Vegetated coastal ecosystems are important contributors to global carbon (C) sequestration (Buczko et al., 2022; Macreadie et al., 2019; Duarte et al., 2013; Jingtai et al., 2022) and coastal ecosystems that capture and store blue carbon (BC) include seagrass meadows, tidal marshes, mud and tidal flats, and mangrove forests (Macreadie et al., 2019; Müller et al., 2025; Howard et al., 2014). These ecosystems are a critical component of the global C budget and are essential in plans for climate change mitigation (Gilby et al., 2020; Kang et al., 2023; Macreadie et al., 2021; Mazarrasa et al., 2023). The common reed (Phragmites australis) is a wetland grass species that grows rapidly and is able to outcompete other vegetation in wetlands and coastal ecosystems throughout the world (Newton et al., 2020; Adams and Bate, 1999). It is native to coastal areas of the Baltic Sea though changes in both direct (grazing and harvesting) and indirect (e.g. eutrophication from nutrient runoff) management practices have led to increased distribution of reeds in areas such as the Baltic Sea coast (Niemi et al., 2023) and beyond (Meriste et al., 2012; Huhta, 2009).
Despite the expansion of the common reed in coastal ecosystems over recent decades, previous research on the role of reed beds in C cycling is fairly limited (Moore et al., 2012; Caplan et al., 2015; Duke et al., 2015; Mozdzer and Zieman, 2010). Research to date indicates that C stocks in reed beds could average around 17.4 kg C m−2 in comparison to the estimated global average for C stocks in tidal salt marshes of approximately 25 kg C m−2 (Pendleton et al., 2012), demonstrating that reed beds play a different role in C storage than tidal salt marshes and that further research into their storage capacity is needed to improve the precision of the coastal C budgets (Buczko et al., 2022; Silan et al., 2024).
Increased reed presence in coastal environments has also led to more interest in reed management practices, including ones financed by the European Union such as BalticReed. If reed beds are cut back in a way that disturbs root systems and discharges large amounts of sediment into water bodies, the C stored in these ecosystems could be released (Huhta, 2007; Güsewell, 2003). Additionally, careful management of reed beds could lead to improved C storage capacity (Cui et al., 2022), thus C storage in reed beds is important to take into account when developing best management practices for reed beds in order to avoid excessive C release from these ecosystems. Careful reed management is of particular importance to coasts of the Baltic Sea where eutrophication poses a large challenge as release of sediments into the water can increase nutrient discharge into the sea (Pawlak et al., 2009; Furman et al., 2014).
Increased interest in reed bed management means there is a greater need to understand the potential role these ecosystems play in C cycling. Despite the prevalence of reed beds, there is insufficient knowledge on how much C is stored in these systems and how it changes between sediment, belowground biomass (roots and rhizomes), aboveground biomass (stems and leaves), and topographical zones of the reed beds (i.e., the terrestrial zone, intermittent zone, and littoral zone). Current evidence suggests that these factors impact reed growth, filtration rates in reed beds, and C storage efficiency (Altartouri et al., 2014; Asaeda et al., 2003; Silan et al., 2024). Published findings suggest that most C storage in other types of vegetated coastal systems occur in their sediment and belowground roots and rhizomes (Howard et al., 2014) and that this also may hold true for reed beds (Dong et al., 2012). Results from Buczko et al. (2022) suggest that C storage may vary between reed bed zones as well. Hence, the aim in this study was to investigate C storage in different parts of the reed bed ecosystem. We hypothesized that reed bed C storage would differ between sites and reed bed zones and that the highest stocks of C storage would be found in reed bed sediments.
2.1 Study area
We conducted our study in reed beds in the well-described archipelago system of the microtidal Baltic Sea along gradients in the Pojo Bay system, Finland. This area has been noted as one of the largest reed-growing areas in Finland (Pitkänen, 2006). Six sites were chosen within Pojo Bay covering a range of salinities and wave exposure from the northern-most part of the Bay to the southern-most part opening into the Baltic Sea (van der Meijs and Isaeus, 2020; Iaeus and Rygg, 2005, Fig. 1). The six sites are spaced approximately 6–8 km apart, are distributed along both sides of Pojo Bay, and range in size from an area of approximately 0.01 to 0.3 km2. All sites were accessible by boat and by car (Table S1).
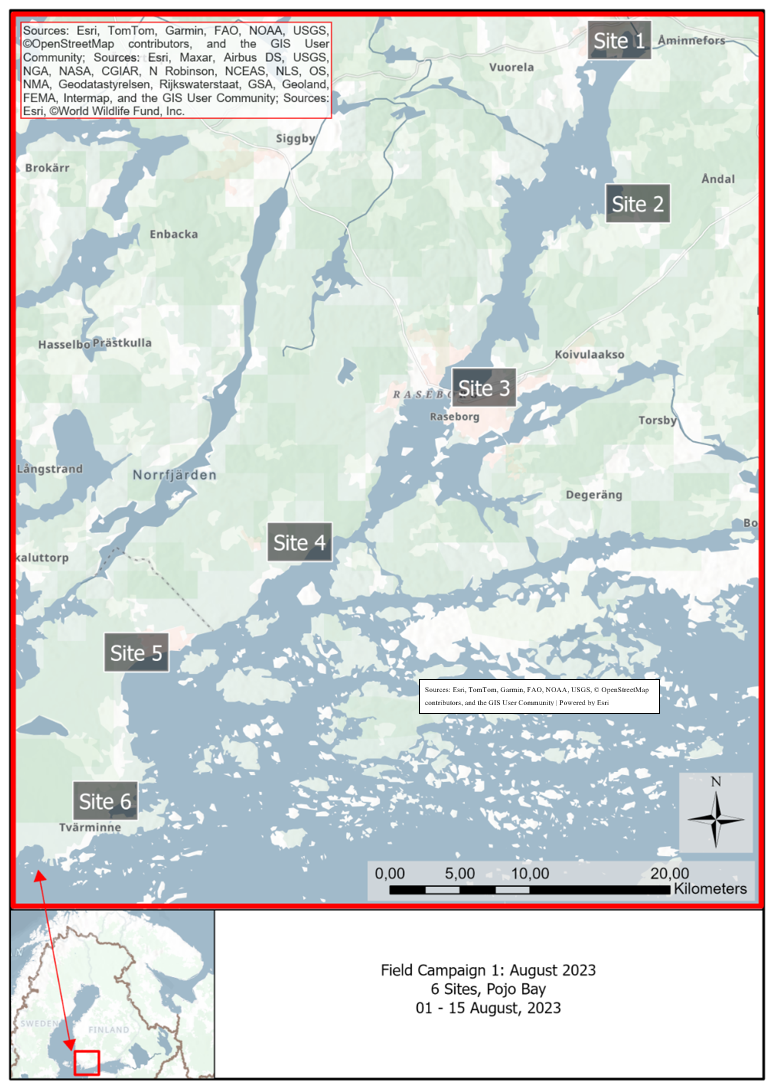
Figure 1Map of all reed bed site locations along the archipelago system in south-western Finland.
2.2 Experimental design and field sampling
C stocks in Phragmites were assessed from sediment and biomass samples taken in August 2023. Reed bed perimeters and their separate zones were delineated at each site prior to sample collection campaigns with the use of the ArcGIS Field Maps App, ArcGIS Online, and ArcGIS Pro. Zones within the reed beds were determined by the following parameters: (1) the terrestrial zone indicators included dry land, grass, trees, and/or rocks; (2) the intermittent zone indicators included saturated soils, lack of aquatic vegetation, and/or presence of algal species on top of rocks; and (3) the littoral zone indicators included standing water, presence of aquatic vegetation, and/or open water. Additionally, topographic changes in each reed bed usually coincided with changes in zone type (see Fig. 2 Reed Bed Zone Cross Section).
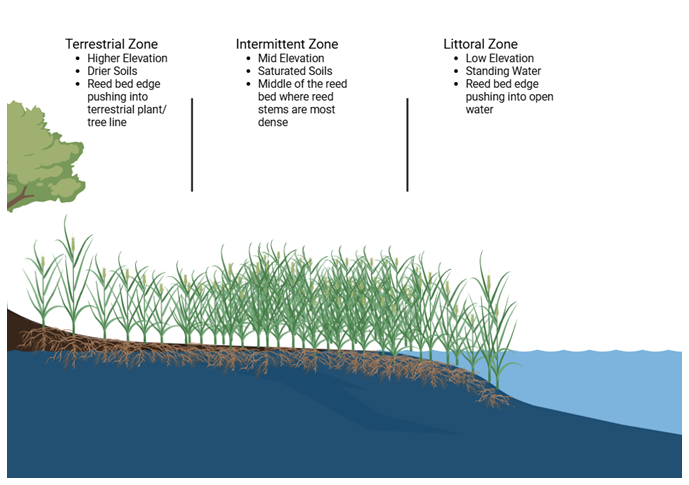
Figure 2Reed bed zone cross section. Created in BioRender by Williamson, M. (2025).
Wave exposure gradients were estimated at the site level using data layers from the Finnish Environment Institute (SYKE) open source library which used a nested-grid that includes finer grids with input fetch values to model wave exposure for the Finnish coast (Iaeus and Rygg, 2005). Within each reed bed, the littoral zones are along the open water's edge, the intermittent zones are in the middle, and the terrestrial zones are along the edge that pushes into the terrestrial tree line (Buczko et al., 2022, see Fig. 2 Reed Bed Zone Cross Section). See Table S1 for details about wave exposure for each of the zones at each site.
A random starting point for sampling was selected in each of the three zones of each site by placing a 1m grid overlay on maps of the reed beds created in ArcGIS Pro and using multi-sided dice to determine grid numbers (e.g. grid number 012 across and 006 up). Replicate locations were then selected along a transect within each zone at 3–5 m intervals from the starting point, resulting in 3 replicates per zone. 1 m × 1 m quadrats were used at each of the 9 sampling points per site and all Phragmites stem counts, sediment samples, and biomass samples collected during field campaigns were chosen from within the 1 m × 1 m quadrats (see Fig. S1 demonstrating the 1m grid overlay used to randomly select sampling starting points). A tape measure was used for stem measurements and depth of standing water within the quadrat. Datasheets for stem counts were generated in Survey123 using ArcGIS Online. Surface water level salinity was measured at each site with an YSI Pro Solo DO/CT meter.
Sediment samples were collected in each of the 9 sample quadrats using either a Russian Peat Borer to 50 cm depth or a box corer to 100 cm depth (Howard et al., 2014; Serrano et al., 2019). Soil cores were divided into subsamples of 10 cm depth intervals. Different coring devices were used in each of the three reed bed site zones. The box corer was used for sampling in the terrestrial and intermittent zones whenever possible, while the Russian peat borer was used for sampling in the littoral zones where longer handles were required to reach sediments through deep standing water. The Russian peat borer was also used in terrestrial and intermittent zones where the box corer did not work due to rocky terrain, sandy soils, or other challenging conditions. Sediment core lengths differed between sampling points based on which soil corer could be used and how far down the soil corer could go until either bedrock was reached or sand content or clay layers made deeper penetration by hand powered corers impossible. These sampling techniques enabled us to collect undisturbed samples from which bulk density could be calculated. Total organic carbon (TOC), loss on ignition (LOI), and DBD were measured in 10 cm intervals across the length of each sediment core. Sediment C stocks (mass per area) were calculated using LOI, TOC, and DBD for both the whole sampled core length and the upper-most organic matter rich layer. While many earlier studies focus only on the uppermost 10 cm for sediment C stock data, Yost and Hartemink (2020) emphasize the importance of generating data from deeper soil horizons as over half of the organic C in the soil column in some settings can be found below 30 cm and the potential for long-term C sequestration increases with depth.
Biomass samples of the reed were collected in the field using quadrats. Within each 1 m × 1 m quadrat, 12 healthy plants were selected from the corner of the quadrat closest to the person collecting the samples (Xiong et al., 2022; Howard et al., 2014). If less than 12 plants were present within the quadrat, then all plants were collected. Belowground biomass samples were collected using soil corers. The soil core samples collected for belowground biomass were sieved in the field using 1 mm sieve trays, though some required additional sieving back in the laboratory (Dong et al., 2012; Howard et al., 2014).
2.3 Aboveground and belowground biomass processing
Soil cores collected for belowground biomass that contained large amounts of clay required soaking in water for 24 h back in the laboratory and then additional sieving using 1 mm sieve trays (Hillmann et al., 2020). All biomass samples were rinsed clean back at the laboratory, weighed, and dried at 70 °C for 72 h until they reached a constant weight. Samples were then ground up and C content was determined using a Thermo Finnigan DELTAplus Advantage continuous-flow stable isotope-ratio mass spectrometer (CF-SIRMS) coupled with a FlashEA 1112 elemental analyzer (Thermo Electron, Bremen, Germany) at the University of Jyväskylä in Finland. Standards used for analysis of all samples included birch leaf lab standards, USGS88, and USGS91.
2.4 Sediment analysis
Each sediment subsample was bagged in the field, brought back to the laboratory and weighed fresh, then dried at 70 °C for 72 h until they reached a constant weight. Samples were then ground up and measured for organic matter content using the LOI method where samples were combusted in a muffle furnace at 450 °C for 4 h (Heiri et al., 2001). DBD of sediment samples was calculated based on LOI-based corrections for sediment density: sediment density = (1.4 ⋅ (LOI/100) + 2.65 ⋅ (1 − (LOI/100))). In this method, wet weights and dry weights were used to calculate sediment content which was then converted to sediment volume and porosity. Wet bulk density (WBD) and DBD were calculated using porosity, sediment density, and sediment content. C analysis (TOC) was also run on 127 of the total 305 sediment samples and analyzed at the University of Jyväskylä in the same manner as mentioned above for biomass using birch leaf, USGS88, and USGS91 lab standards. Sediment C stocks were calculated for a given sediment thickness (either 0 to 10 cm, or 0 cm to bottom of core) by multiplying the TOC content (%) by the DBD (g cm−3) and the sample volume (cm3) in a hypothetical sediment column of surface area 1 cm2. Data were then converted to g C m−2 for the given thickness of the layer (Table S4). For samples with no direct TOC measurement, a LOI % to TOC % conversion factor of was applied, as calculated in R from the slope of the linear regression line for all samples with both LOI and TOC data (Fig. S2).
2.5 Statistical analysis
All statistical analyses were done using R Statistical Software (v4.3.2, R Core Team, 2024). A variety of data exploration devices were implemented (Zuur et al., 2010). Due to the small sample size (54 observations for data related to each of the variables being measured), a Shapiro-Wilk's test and histograms were used to test for normal distribution of data results (DBD, stem counts, LOI results, sediment C stocks, and above- and belowground biomass C stocks). All data sets were found to be different from normal distribution and an additional Fligner-Killeen test was used to test for homogeneity of the non-normal data. Fligner-Killeen results showed all data were significantly different from homogeneity meaning the variance of the residuals was unequal (heteroskedasticity). Due to the heteroskedastic and non-normal nature of the data, analysis was conducted using PERMANOVA via the vegan package (Oksanen et al., 2020). PERMANOVA tests also allowed us to deal with the nested nature of the zones within each site and were used to determine significant differences in data at the site and zone levels. PERMANOVA results with p values < 0.05 were found to be statistically significant. PERMANOVA post hoc tests were used to further determine how C stocks differed between zones across sites. All averages are presented with standard error.
3.1 Environmental and sediment variables
Surface water salinity during sampling ranged between 0.68 and 6.15 ppt at the different sites (Table S1). Sampling sites consisted of dense stands of Phragmites australis with a few individual stems of Typha angustifolia and Schoenoplectus lacustris found in the littoral zone of site 1.
The average soil core length across all zones was 56.5 ± 3.2 cm while the average for each zone was 67.2 ± 6.4 cm (terrestrial), 58.3 ± 5.8 cm (intermittent), and 43.9 ± 2.2 cm (littoral). We detected significant differences at the site and zone level for DBD (Tables 1 and 2). DBD was variable across all sites, sediment depths, and reed bed zones (Fig. 3). The highest DBD was 2.55 g cm−3 (LOI = 0.71 % and water = 1.3 %) and lowest DBD was 0.05 g cm−3 (LOI = 74 % and water = 94.6 %). The average bulk densities per site and zone ranged from 0.64 ± 0.04 to 1.60 ± 0.12 g cm−3 (Table S2).
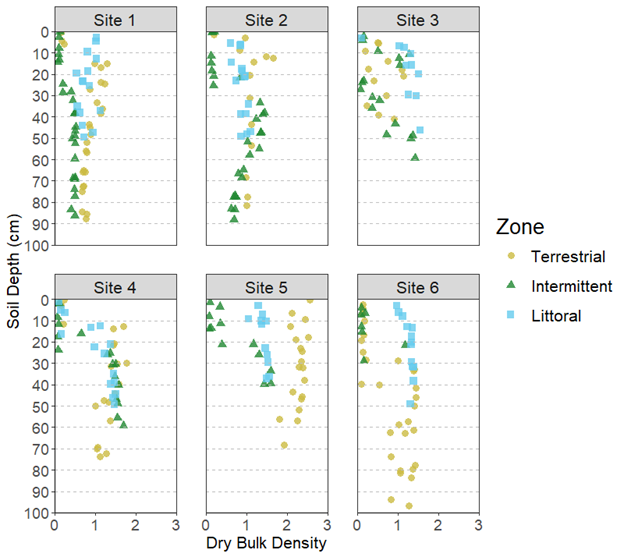
Figure 3Dry bulk density (g cm3) of sediment samples at varying depths across all reed bed zones and sites.
We detected significant differences at the site and zone level for LOI (Tables 1 and 2). The highest sediment organic matter percentages (LOI results, shown here as % OM) were found in the upper 30 cm of soil profiles and the lowest overall organic matter percentages were typically found in the sediments of littoral zones (Fig. 4). The average LOI results per site and zone for the full depth of the soil cores ranged from 0.5 ± 0.1 % OM in the littoral zone for site 5 to 40.7 ± 8.9 % OM in the intermittent zone for site 6. The average LOI results per site and zone for the upper 10 cm of the soil cores ranged from 0.7 ± 0.2 % OM in the littoral zone for site 5 % to 74.2 ± 0.5 % OM in the intermittent zone for site 4 (Table S3).
Table 1PERMANOVA results showing how response variables varied across sites for all terrestrial, intermittent, and littoral zone samples (p<0.05 statistically significant values indicated in bold).
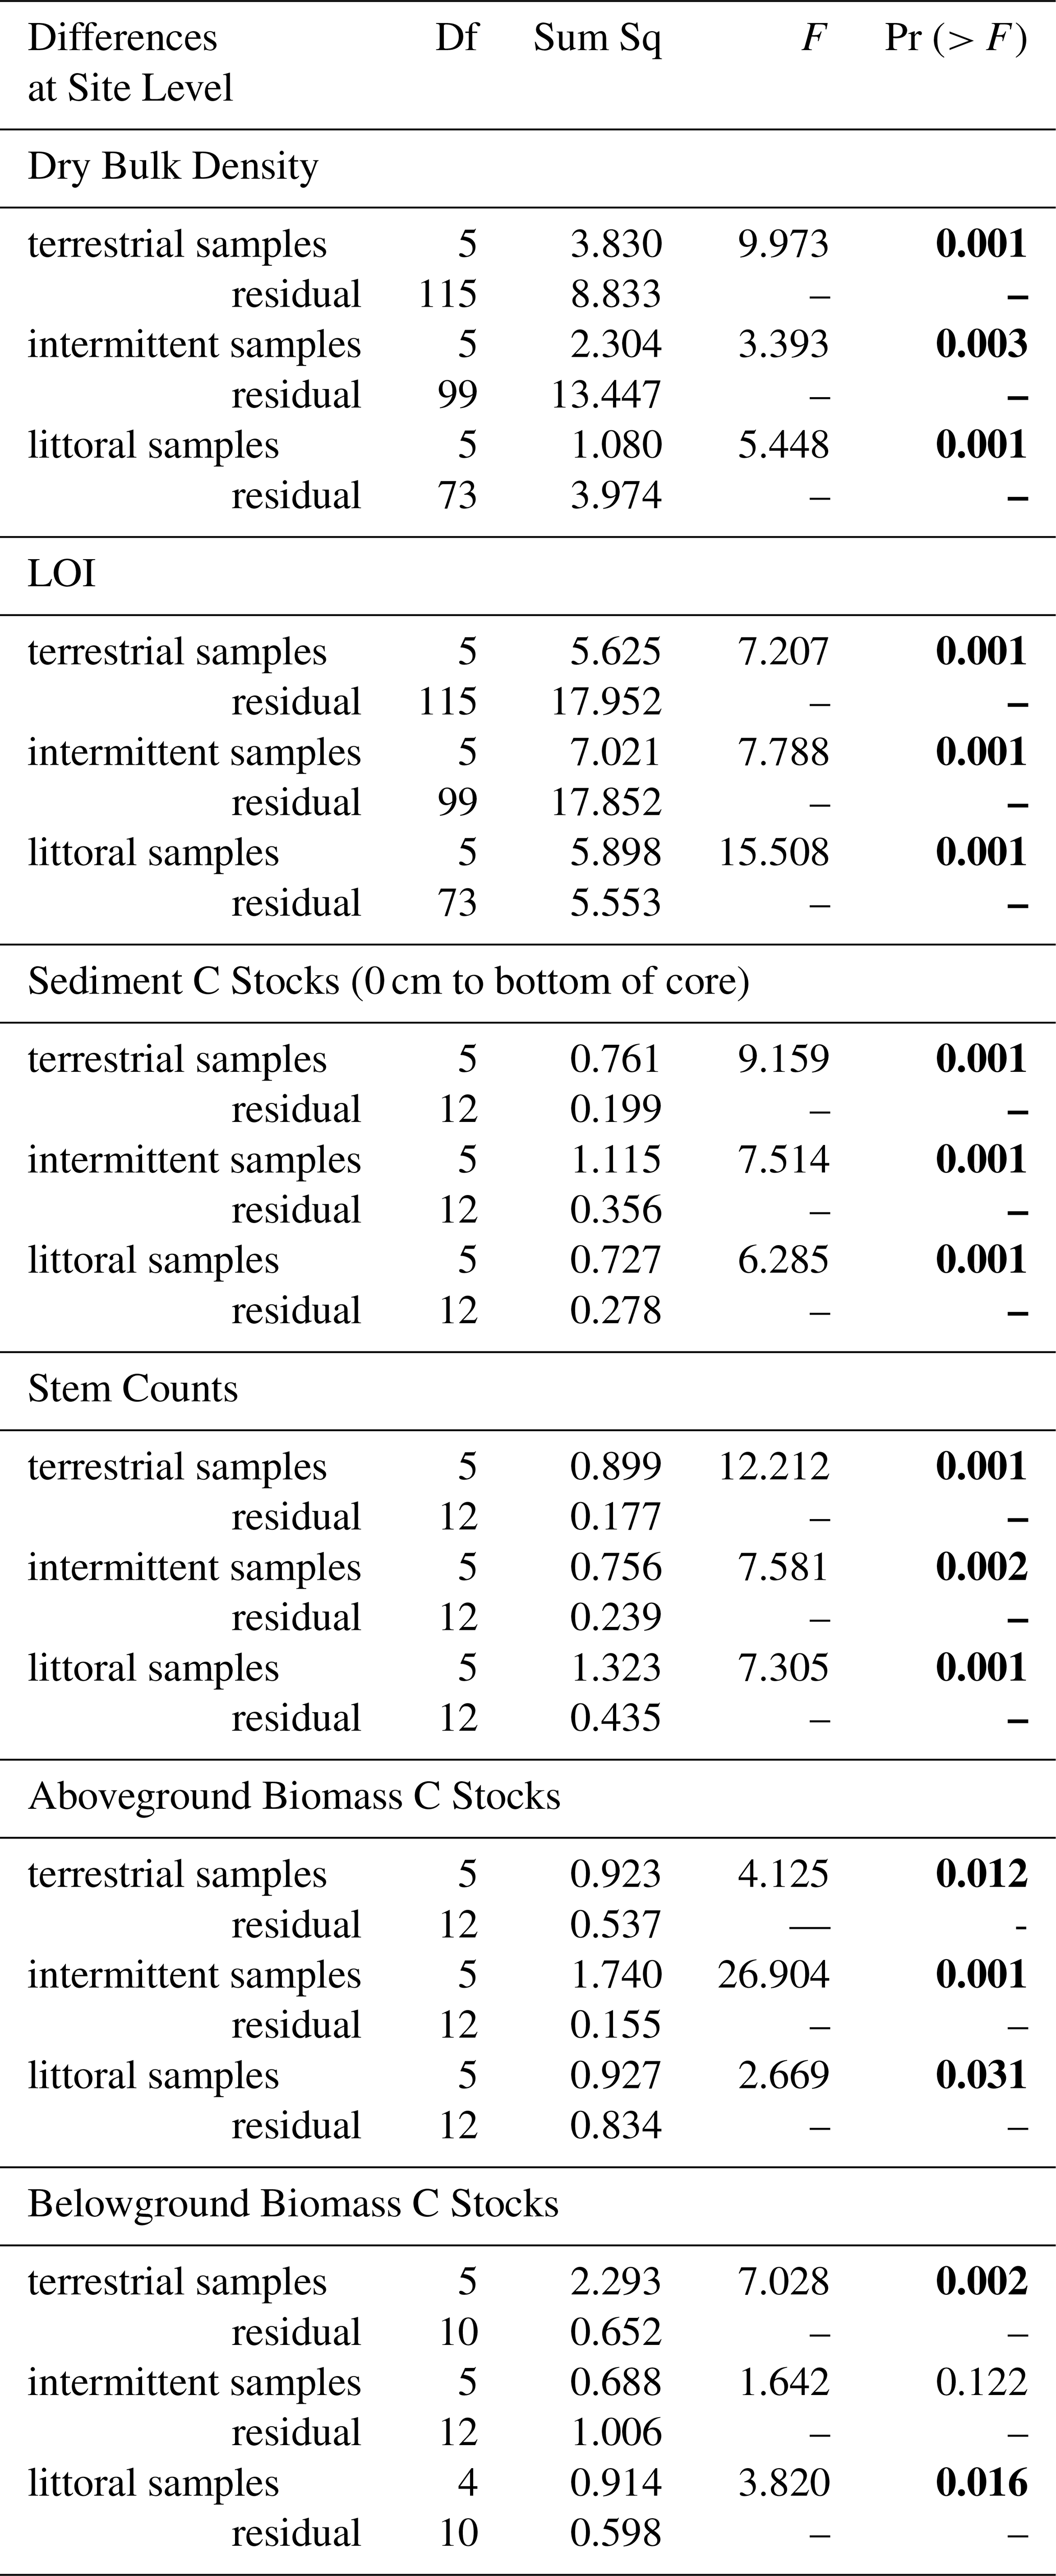
Table 2PERMANOVA results showing statistically significant (p<0.05) differences in response variables at the zone level accounting for the effect that site has on the zone.
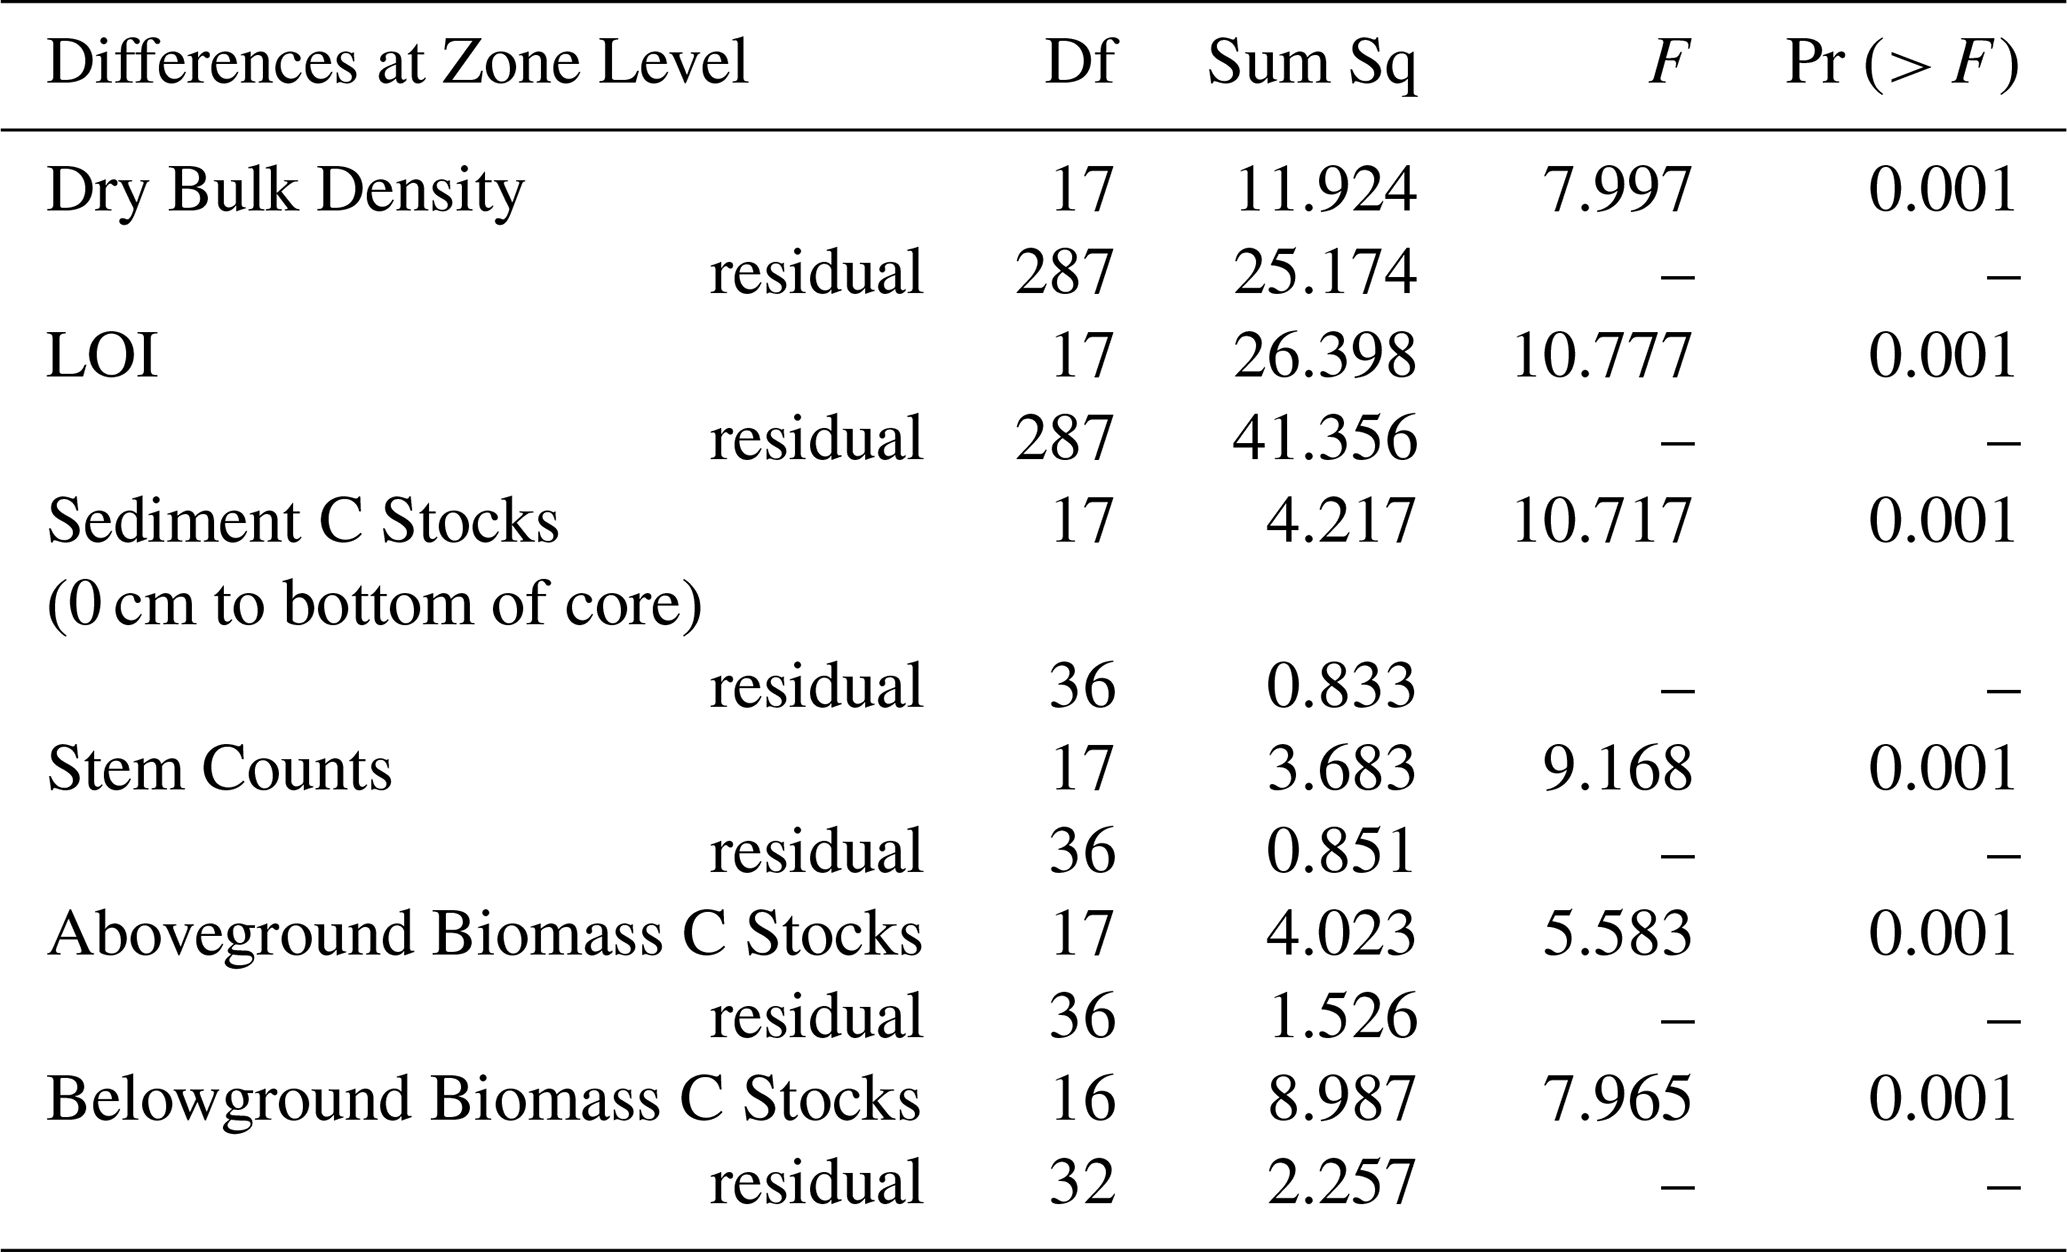
The average combined C stocks per site when looking at sediment and biomass C stocks ranged from approximately 8 to 20 kg C m−2. The different reed bed zones across all sites stored an average of approximately 4 to 16 kg C m−2 with the highest stocks found in the intermittent zones.
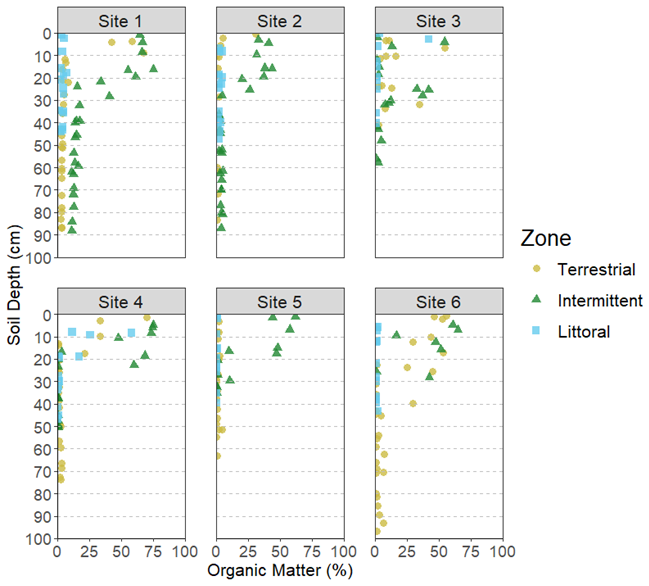
Figure 4Loss on Ignition (LOI) results showing Organic Matter (%) in sediment samples at varying depths across all reed bed sites.
3.2 Sediment C stocks
We detected significant differences at the site and zone level for sediment C stocks (Tables 1 and 2). Sediment C stocks were higher than belowground and aboveground biomass C stocks at all sites (Fig. 5). The highest sediment C stocks were typically found in the intermittent zone while the lowest were typically found in the littoral zone (Fig. 4). The average sediment C stocks per site and zone ranged from 1566.7 ± 409.2 C g m−2 in the littoral for site 5 to 24 408.3 ± 1607.4 C g m−2 in the intermittent zone for site 1 (Table S4). In our post hoc PERMANOVA tests, we found that sediment C stocks were significantly different between terrestrial and intermittent zones, between terrestrial and littoral zones, and between intermittent and littoral zones.
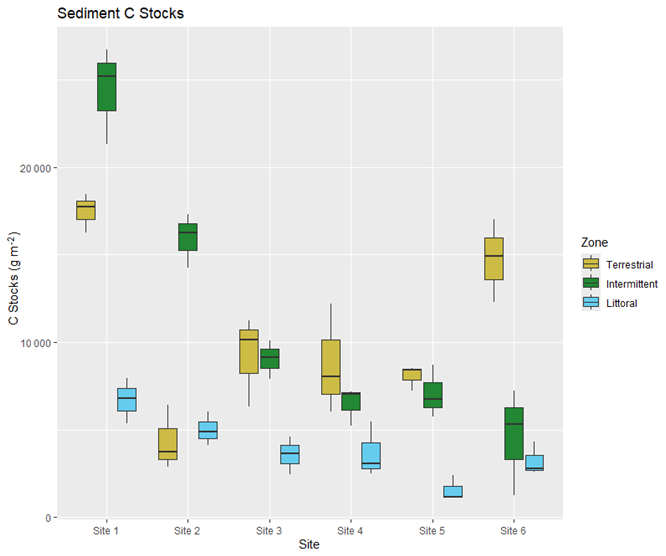
Figure 5Carbon stocks (g m−2) in sediment (0 cm to bottom of core) from all reed bed zones and sites. The box plot whiskers show minimum and maximum values, the horizontal line splitting the box shows the median value, and the box covers the interval where 50 % of the data is found.
3.3 Plant variables
Plant variables such as stem counts, aboveground biomass C stocks, and belowground biomass C stocks were analyzed to determine how they differ between sites and zones (Tables 1 and 2). Stem counts tended to be higher in the intermittent zone at sites 1, 2, and 6 and in the littoral zone at sites 3, 4, and 5 (Fig. S3). Highest stem counts for all sites ranged from 71 to 217 stems m −2 with the highest stem count recorded in the littoral zone at site 5.
Plant C stocks were lower in aboveground biomass than belowground biomass at all sites (Figs. 6 and 7). Aboveground biomass C stocks were highest in the intermittent zones for sites 1, 2, and 6, highest in the littoral zones for sites 3 and 5, and were similarly high in the terrestrial and littoral zones for site 4. The aboveground biomass C stocks were lowest in the intermittent zone for site 4, lowest in the terrestrial zone for sites 3 and 5, lowest in the littoral zone for sites 1 and 6, and were similarly low in the terrestrial and littoral zones for site 2 (Fig. 6). Aboveground biomass C stock averages per site and zone ranged from 24.6 ± 3.3 C g m−2 in the intermittent zone at site 4 to 244.9 ± 37.2 C g m−2 in the intermittent zone at site 6 (Table S5). In our post hoc PERMANOVA tests, we found that aboveground biomass C stocks were significantly different between the terrestrial and intermittent zones and between intermittent and littoral zones, but they were not significantly different between the terrestrial and littoral zones.
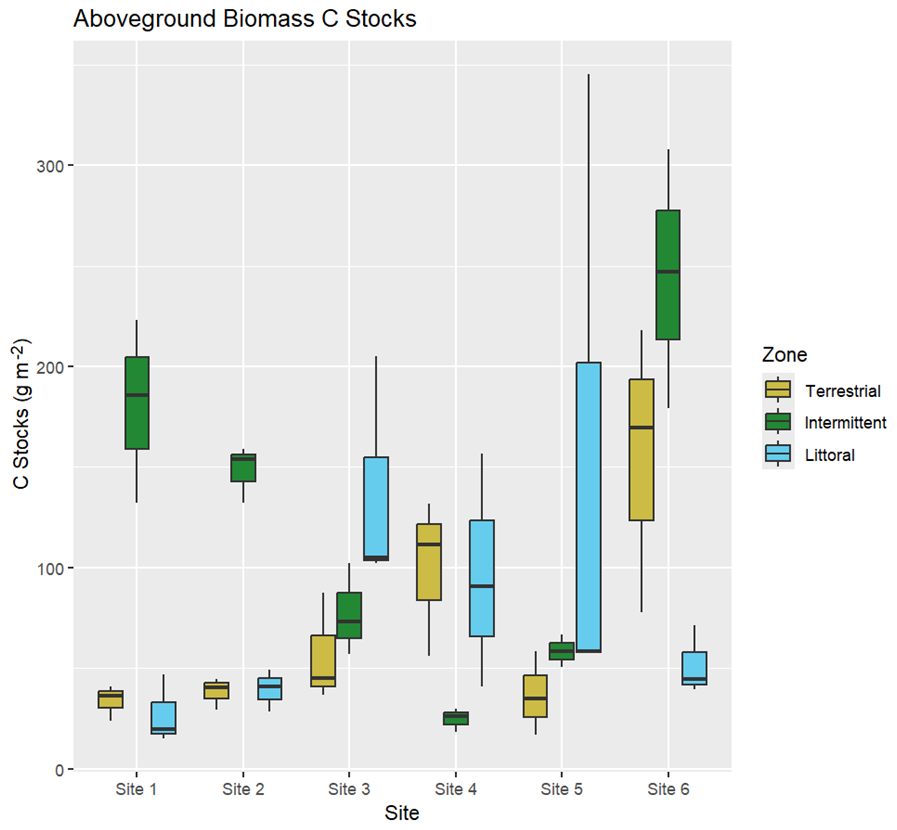
Figure 6Carbon stocks (g m−2) in aboveground biomass (stems and leaves) across all reed bed zones and sites.
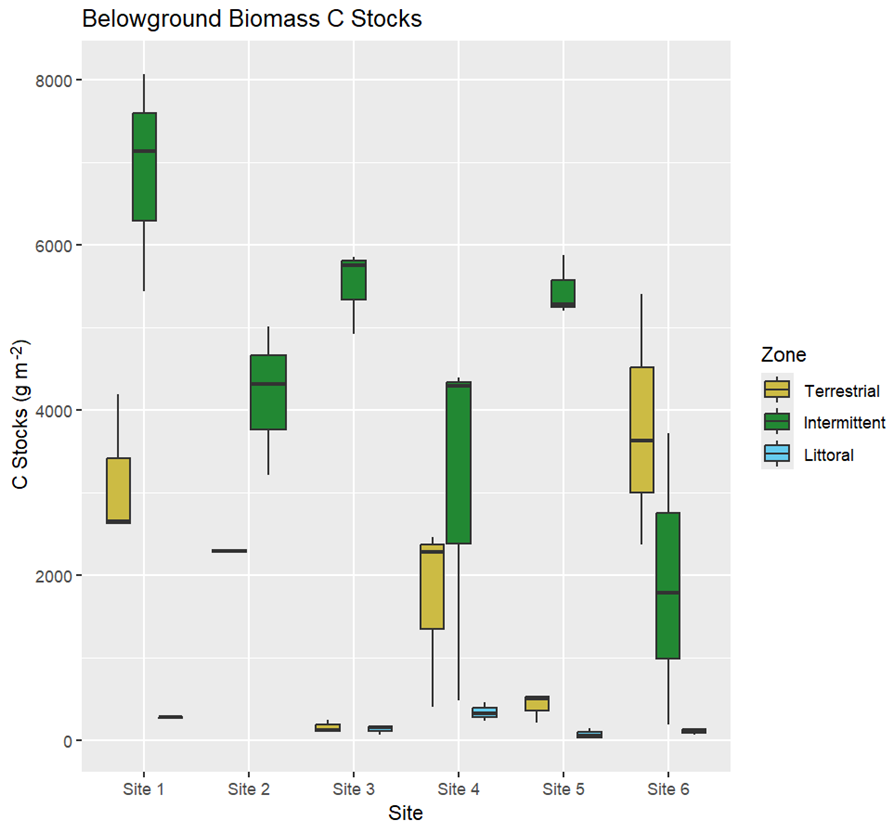
Figure 7Carbon stocks (g m−2) in belowground biomass (roots and rhizomes) across all reed bed zones and sites.
Belowground biomass C stocks were highest in the intermittent zones of all sites except for site 6 where they were highest in the terrestrial zone. Belowground biomass C stocks were lowest in the littoral zone for site 1, 4, 5, and 6, lowest in the terrestrial zone for site 2 where belowground biomass samples were not obtained from the littoral zone, and were similarly low in the terrestrial and littoral zones for site 3 (Fig. 7). Belowground biomass C stock averages per site and zone ranged from 75.0 ± 37.6 C g m−2 in the littoral zone for site 5 to 6883.6 ± 769.2 C g m−2 in the intermittent zone for site 1 (Table S6). We had trouble retrieving belowground biomass samples from the terrestrial and littoral zones at site 2 and were only able to retrieve one sample between these zones from the terrestrial zone (2289.41 C g m−2).
Understanding C storage in reed beds as they continue to increase their distribution across coastal ecosystems is imperative for developing more accurate coastal BC budgets as part of climate change mitigation. The results show that these systems contain averages of C stocks that are different from the tidal salt marsh ecosystems they are generally categorized as in BC budgets. The results also highlight that C storage is occurring in these systems in amounts that need to be accounted for in reed bed management plans.
4.1 Dry bulk density and loi
The differences we found in DBD and LOI results between zones and sites (Figs. 2 and 3, Tables 1 and 2) could be partly explained by the different environmental conditions present at these levels. Differences in standing water depths between the zones, stem counts between the zones and sites (and therefore the amount of rooting activity occurring in the sediments), have each been shown to impact soil physical properties and infiltration rates (Warrence et al., 2003). Cleophas et al. (2024) found that higher DBD was associated with lower OM and we see these trends clearly in our own DBD and LOI data. The soil cores obtained during sampling showed organic rich top layers with either clays or sandy soils below, which also explains the inverse relationships seen between the DBD and LOI results (Figs. 2 and 3).
4.2 C stocks in coastal reed sediments
The differences in sediment C stocks between different zones and sites could be related to the differences in DBD and stem counts we found at these levels. DBD, specifically, affects infiltration and organic matter and nutrient contents (Cleophas et al., 2024) while stem counts impact the amount of Phragmites australis available for sequestering C in the reed bed sediments through biogeochemical processes, reduced erosion, and increased filtration (Silan et al., 2024). The C stocks shown in Fig. 5 correspond to the same LOI and DBD trends found in Cleophas et al. (2024) and discussed in the previous section.
Our findings are consistent with Howard et al. (2014) which theorized that most C storage in tidal salt marshes occurs in sediments and belowground living biomass (roots and rhizomes). These findings are reasonable as belowground C stock systems are less prone to disturbance than aboveground systems (Fiala, 1976). Our sediment C stocks averaged between approximately 6 and 16 C kg m−2 across the different sites, compared to the values of 17.4 C kg m−2 reported by Buczko et al. (2022). Estimated global averages for C stocks in tidal salt marshes are approximately 25 kg C m−2 (Pendleton et al., 2012), demonstrating that reed bed C storage is unique from the tidal salt marsh ecosystems they are typically categorized as in current BC budgets and that further research into their storage capacity is needed to improve the precision of the coastal C budgets (Buczko et al., 2022). The differences between the C stock averages in our results and those of Buczko et al. (2022) could be related to differences between their sample sites in sheltered, brackish lagoon systems along Germany's Baltic Sea coast and our sites in Finland which included sheltered and exposed sites and occurred along a smaller salinity gradient. The German sites had tides and a salinity range from 0–10 PSU (ppt) while the Finnish sites had no tides and a salinity range from 0 to 6 ppt. It is not clear what time of year samples were collected in Buczko et al. (2022) but it could have differed from the August covered in our study. In addition, Buczko et al. (2022) notes that more research from other parts of the Baltic Sea are needed to better understand reed's role in BC storage in the Baltic Sea and the differences between their average sediment C stocks and ours further support this point.
4.3 Stem counts and C stocks in coastal reed aboveground biomass
The differences we found in stem counts between different zones and sites (Fig. S3 and Tables 1 and 2) could be explained by differences in water depth, salinity, and presence of competing species (such as plants in the tree lines of the terrestrial zone) as these are known to impact reed growth (Altartouri et al., 2014; Asaeda et al., 2003). The differences we found in aboveground biomass C stocks between different zones (Fig. 6 and Tables 1 and 2) could be due to the fluctuating nature of the terrestrial and littoral zones of reed beds. These zones represent the fringes of reed bed growth as reeds either start working their way into the open waters of the littoral zone to expand their territory or start competing with terrestrial plants and drier soils of the terrestrial zone (Pitkänen et al., 2007). The intermittent zones have the most sheltered environments for reed growth so it is reasonable that aboveground biomass C stocks found there would be different from the terrestrial and littoral zone ones, but that terrestrial and littoral zones C stocks might not be different from each other.
There has been an increased interest in reed bed management practices focused on removing aboveground biomass (e.g., Finnish-Swedish Interreg BalticReed project co-funded by the European Union). Some of these projects argue that removing aboveground biomass can serve as a way of reducing nutrient inputs to major water bodies, however previous research indicates aboveground biomass contains relatively low C content (Dong et al., 2012) and our findings support this. The density of aboveground biomass in reed beds can substantially impact erosion and water quality (Horppila et al., 2013) and management practices focused on removing aboveground biomass, such as mowing, can disturb reed bed sediments, releasing nutrients stored in reed beds into the surrounding environment (Güsewell, 2003) or even impacting greenhouse gas fluxes (Rietl et al., 2017). In light of this, C storage in reed beds must be taken into account when developing management practices in coastal reed bed ecosystems so the C storage potential of their sediments is not compromised during harvesting processes.
4.4 C stocks in coastal reed belowground biomass
The differences we found in belowground biomass C stocks between zones (Fig. 7 and Tables 1 and 2) indicate that zonation is important to consider when accounting for C stocks in belowground biomass. This could be related to the buffered state of the belowground intermittent zones.
The differences in above- and belowground biomass-bound C stocks between zones is also interesting to note. Belowground biomass C stocks were typically highest in the intermittent zone while there was more fluctuation in zones with the highest aboveground biomass C stocks. This finding could be related to the nature of the rhizosphere in reed beds. The terrestrial and littoral zones of reed beds are the fringe zones where reeds are just starting to push into new territories. Reeds are capable of producing stems up to 10 m away from rhizomes located in a suitably moist habitat, enabling them to push into wetter and drier areas than is preferable (Huhta, 2007) so it is understandable that a more established root system in the intermittent zone would lead to highest belowground biomass C stocks found there.
4.5 Remaining uncertainties and future recommendations
To develop a strong model for sediment C storage in reed beds, it would be preferable to conduct a large-scale sediment coring campaign across a large number of sites with more sediment samples than we were able to collect in this study. Developing methods to reliably collect full 1 m soil cores every time and run C analysis on a scale finer than 10 cm increments would further create very robust data for modeling purposes. As stated in Howard et al. (2014), though most C storage in vegetated coastal marshes occurs in sediments and belowground biomass, these systems are the least studied. Retrieving deep soil cores from reed beds and sieving out belowground biomass is cumbersome and time consuming and largely resource-dependent (e.g. number of people). Allocating more effort on a large-scale sampling campaign would, nevertheless, generate valuable data that would further contribute to robust models for calculating BC sequestration in coastal reed beds.
We had trouble retrieving belowground biomass samples from some of the terrestrial and littoral zones. In addition, we did not retrieve any belowground biomass samples from the littoral zone deeper than 1.4–1.8 m of standing water as this was logistically infeasible. For future sampling campaigns, we recommend sampling in parts of the littoral zones where standing water is not so deep or collecting samples from deeper standing water by SCUBA. We collected data from sites that covered a range of different environmental gradients such as salinity and wave exposure as a baseline for future investigations that explore how different environmental factors influence C storage in reed beds. At these high-latitudes, coastal reed beds are strongly influenced by seasonal succession, implying that an insightful analysis of environmental drivers requires data collected across different seasons.
The question also remains whether coastal reed bed ecosystems are functioning as true BC ecosystems. BC ecosystems function as overall C sinks where more C is stored in the ecosystem than lost (Röhr et al., 2016). Further information is needed showing seasonal variability in reed bed C storage, C isotope presence to tell where the C is coming from, and greenhouse gas fluxes to get a more comprehensive picture of C cycling in these growing coastal ecosystems. This will then allow us to better answer the question of whether or not coastal reed beds are acting as net C sinks.
Understanding C storage in coastal reed ecosystems is crucial for creating more robust estimates of BC. Increased reed presence in coastal Finland as well as other coastal areas across the world means that the reeds' role in BC storage impacts management of coastal systems. The results of this study indicate that reed beds are important C stocks, that environmental context within the different reed bed zones impacts C storage, and that C storage stocks are highest in reed bed sediments. The results further indicate that C storage in coastal reed bed ecosystems is unique from the tidal salt marsh ecosystems they are typically categorized as in current BC budgets. C storage in these reed beds needs to be considered in best management practices as authorities look to find new ways to control the reeds' expanding footprint and possibly develop new uses for reed materials.
The data used for this project can be accessed via https://doi.org/10.5281/zenodo.18537690 (Williamson, 2026).
The supplement related to this article is available online at https://doi.org/10.5194/bg-23-1327-2026-supplement.
MW, TJ, AN, and CG planned the campaign; MW performed the measurements; MW analyzed the data; MW wrote the manuscript draft; TJ, AN, and CG reviewed and edited the manuscript.
The contact author has declared that none of the authors has any competing interests.
Publisher's note: Copernicus Publications remains neutral with regard to jurisdictional claims made in the text, published maps, institutional affiliations, or any other geographical representation in this paper. The authors bear the ultimate responsibility for providing appropriate place names. Views expressed in the text are those of the authors and do not necessarily reflect the views of the publisher.
This research was supported by the Walter and Andree de Nottbeck Foundation and the University of Helsinki Doctoral School and utilized research infrastructure facilities at Tvärminne Zoological Station, University of Helsinki. CG was supported by the Research Council of Finland (project grant 354454). Additional infrastructure facilities at University of Jyväskylä were utilized. This study is part of research from the Center for Coastal Ecosystem and Climate Change Research (https://www.coastclim.org, last access: 16 February 2026). Special thanks to all who helped in the field with data collection: Kurt Spence, Anna Vesanen, Roel Lammerant, Janina Pykäri, and the Onni Talas interns. Special thanks to the following people for the use of R scripts they developed: Sonja Repetti, Quentin Bell, Ana Lindroth Dauner, and Tuomas Junna.
This research has been supported by the Walter ja Andrée de Nottbeckin Säätiö (grant nos. 20250027, 20240017, and 20230009). Camilla Gustafsson was supported by the Research Council of Finland (project grant 354454).
Open-access funding was provided by the Helsinki University Library.
This paper was edited by Tina Treude and reviewed by three anonymous referees.
Adams, J. and Bate, G.: Growth and photosynthetic performance of Phragmites australis in estuarine waters: A field and experimental evaluation, Aquatic Botany, 64, 359–367, 1999.
Altartouri, A., Nurminen, L., and Jolma, A.: Modeling the role of the close-range effect and environmental variables in the occurrence and spread of Phragmites australis in four sites on the Finnish coast of the Gulf of Finland and the Archipelago Sea, Ecology and Evolution, 4, 987–1005, 2014.
Asaeda, T., Manatunge, J., Fujino, T., and Sovira, D.: Effects of salinity and cutting on the development of Phragmites australis, Wetlands Ecology and Management, 11, 127–140, 2003.
BioRender.com: Figure 2, Reed bed zone cross section, created in BioRender by Williamson, M., https://app.biorender.com/illustrations/6899d3f5aa7b2163ca71671f (last access: 16 February 2026), 2025.
Buczko, U., Jurasinski, G., Glatzel, S., and Karstens, S.: Blue Carbon in Coastal Phragmites Wetlands Along the Southern Baltic Sea, Estuaries and Coasts, 45, 2274–2282, 2022.
Caplan, J. S., Hager, R. N., Megonigal, J. P., and Mozdzer, T. J.: Global change accelerates carbon assimilation by a wetland ecosystem engineer, Environ. Res. Lett., 10, 115006, https://doi.org/10.1088/1748-9326/10/11/115006, 2015.
Cleophas, F., Moktar, N., Zahari, N. Z., Adnan, F. A. F., Tair, R., Budin, K., Musta, B., and Bidin, K.: Field evaluation of a simple infiltration test and its relationship with soil physical properties of three different types of land uses, Science, Engineering and Health Studies, 2630-0087, https://doi.org/10.69598/sehs.18.24020008, 2024.
Cui, Q., Yang, H., Wang, G., Ma, J., Feng, L., and Jingtao, L.: Response of soil carbon fractions and enzyme activities to mowing management on in a coastal wetland of the yellow river delta, Frontiers in Marine Science, 9, https://doi.org/10.3389/fmars.2022.993181, 2022.
Dong, W., Shu, J., He, P., Ma, G., and Dong, M.: Study on the Carbon Storage and Fixation of Phramites autralis in Baiyangdian Demonstration Area. Procedia Environmental Sciences, 13, 324–330, 2012.
Duarte, C. M., Losada, I. J., Hendriks, I. E., Mazarrasa, I., and Marbà, N.: The role of coastal plant communities for climate change mitigation and adaptation, Nat. Clim. Change, 3, 961–968, 2013.
Duke, S. T., Francoeur, S. N., and Judd, K. E.: Effects of Phragmites australis Invasion on Carbon Dynamics in a Freshwater Marsh, Wetlands, 35, 311–321, 2015.
Fiala, K.: Underground organs of Phragmites communis, their growth, biomass and net production, Folia Geobotanica et Phytotaxonomica, 11, 225–259, 1976.
Furman, E., Pihlajamäki, M., Välipakka, P., and Myrberg, K.: The Baltic Sea: Environment and Ecology, Finish Environment Institute (SYKE), Helsinki, 69 pp., 2014.
Gilby, B., Weinstein, M. P., Baker, R., Cebrian, J., Alford, S. B., Chelsky, A., Colombano, D., Connolly, R. M., Currin, C. A., Feller, I. C., Frank, A., Goeke, J. A., Goodridge Gaines, L. A., Hardcastle, F. E., Henderson, C. J., Martin, C. W., McDonald, A. E., Morrison, B. H., Olds, A. D., Rehage, J. S., Waltham, N. J., and Ziegler, S. L.: Human Actions Alter Tidal Marsh Seascapes and the Provision of Ecosystem Services, Estuar. Coast., 44, https://doi.org/10.1007/s12237-020-00830-0, 2020.
Güsewell, S.: Management of Phragmites australis in Swiss fen meadows by mowing in early summer, Wetlands Ecology and Management, 11, 433–445, 2003.
Heiri, O., Lotter, A. F., and Lemcke, G.: Loss on ignition as a method for estimating organic and carbonate content in sediments: reproducibility and comparability of results, Journal of Paleolimnology, 25, 101–110, 2001.
Hillmann, E. R., Rivera-Monroy, V. H., Nyman, J. A., and La Peyre, M. K.: Estuarine submerged aquatic vegetation habitat provides organic carbon storage across a shifting landscape, Science of the Total Environment, 717, https://doi.org/10.1016/j.scitotenv.2020.137217 0048-9697, 2020.
Horppila, J., Kaitaranta, J., Joensuu, L., and Nurminen, L.: Influence of emergent macrophyte (Phragmites australis) density on water turbulence and erosion of organic-rich sediment, Journal of Hydrodynamics, 25, 288–293, 2013.
Howard, J., Hoyt, S., Isensee, K., Pidgeon, E., and Telszewski, M.: Coastal Blue Carbon: Methods for Assessing Carbon Stocks and Emissions Factors in Mangroves, Tidal Salt Marshes, and Seagrasses. Conservation International, Intergovernmental Oceanographic Commission of UNESCO, International Union for Conservation of Nature, Arlington, Virginia, USA, https://unesdoc.unesco.org/ark:/48223/pf0000372868 (last access: 16 February 2026), 2014.
Huhta, A.: To cut or not to cut? The relationship between Common Reed, mowing and water quality. Read up on Reed, Turku University of Applied Sciences, ISBN: 978-952-11-2781-6, 2007.
Huhta, A.: Decorative or Outrageous – The significance of the Common Reed (Phragmites australis) on water quality. Comments from Turku University of Applied Sciences, 48, Turku University of Applied Sciences, ISBN: 978-952-216-085-0, 2009.
Iaeus, M. and Rygg, B.: Wave Exposure Calculations for the Finnish Coast. Oslo, Norway: NIVA, Norwegian Institute for Water Research, ISBN: 82-577-4780-7, 2005.
Jingtai, L., Yan, D., Yao, X., Liu, Y., Xie, S., Sheng, Y., and Luan, Z.: Dynamics of Carbon Storage in Saltmarshes Across China's Eastern Coastal Wetlands From 1987 to 2020., Frontiers in Marine Science, 9, https://doi.org/10.3389/fmars.2022.915727, 2022.
Kang, B., Chen, X., Du, Z., Meng, W., and Li, H.: Species-based Mapping of Carbon Stocks in Salt Marsh: Tianjin Coastal zone as a Case Study, Ecosystem Health and Sustainability, 9, https://doi.org/10.34133/ehs.0052, 2023.
Macreadie, P. I., Anton, A., Raven, J. A., Beaumont, N., Connolly, R. M., Friess, D. A., Kelleway, J. J., Kennedy, H., Kuwae, T., Lavery, P. S., Lovelock, C. E., Smale, D. A., Apostolaki, E. T., Atwood, T. B., Baldock, J., Bianchi, T. S., Chmura, G. L., Eyre, B. D., Fourqurean, J. W., Hall-Spencer, J. M., Huxham, M., Hendriks, I. E., Krause-Jensen, D., Laffoley, D., Luisetti, T., Marbà, N., Masque, P., McGlathery, K. J., Megonigal, J. P., Murdiyarso, D., Russell, B. D., Santos, R., Serrano, O., Silliman, B. R., Watanabe, K., and Duarte, C. M.: The Future of Blue Carbon Science, Nature Communications, 10, https://doi.org/10.1038/s41467-019-11693-w, 2019.
Macreadie, P. I., Costa, M. D. P., Atwood, T. B., Friess, D. A., Kelleway, J. J., Kennedy, H., Lovelock, C. E., Serrano, O., and Duarte, C. M.: Blue carbon as a natural climate solution, Nat. Rev. Earth Environ., 2, 826–839, 2021.
Mazarrasa, I., Neto, J. M., Bouma, T. J., Grandjean, T., Garcia-Orellana, J., Masqué, P., Recio, M., Serrano, O., Puente, A., and Juanes, J. A.: Drivers of variability in Blue Carbon stocks and burial rates across European estuarine habitats, Science of the Total Environment, 886, https://doi.org/10.1016/j.scitotenv.2023.163957, 2023.
Meriste, M., Kirsimäe, K., and Freiberg, L.: Relative Sea-Level Changes at Shallow Coasts Inferred from Reed Bed Distribution over the Last 50 Years in Matsalu Bay, the Baltic Sea, Journal of Coastal Research, 28, 1–10, 2012.
Moore, G., Burdick, D., Peter, C., and Keirstead, D.: Belowground Biomass of Phragmites australis in Coastal Marshes, Northeastern Naturalist, 19, 611–626, 2012.
Mozdzer, T. J. and Zieman, J. C.: Ecophysiological differences between genetic lineages facilitate the invasion of non-native Phragmites australis in North American Atlantic coast wetlands, Journal of Ecology, 98, 451–458, 2010.
Müller, D., Liu, B., Geibert, W., Holtappels, M., Sander, L., Miramontes, E., Taubner, H., Henkel, S., Hinrichs, K., Bethke, D., Dohrmann, I., and Kasten, S.: Depositional controls and budget of organic carbon burial in fine-grained sediments of the North Sea- the Helgoland Mud Areas as a natural laboratory. Biogeosciences 22, 2541–2567, https://doi.org/10.5194/bg-22-2541-2025, 2025.
Newton, A., Icely, J., Cristina, S., Perillo, G. M. E., Turner, R. E., Ashan, D., Cragg, S., Luo, Y., Tu, C., Li, Y., Zhang, H., Ramesh, R., Forbes, D. L., Solidoro, C., Béjaoui, B., Gao, S., Pastres, R., Kelsey, H., Taillie, D., Nhan, N., Brito, A.C., de Lima, R., and Kuenzer, C.: Anthropogenic, Direct Pressures on Coastal Wetlands, Frontiers in Ecology and Evolution, 8, https://doi.org/10.3389/fevo.2020.00144, 2020.
Niemi, N., Hansen, J. P., Eklöf, J. S., Eriksson, B. K., Andersson, H. C., Bergström, U., and Östman, Ö.: Influence of reed beds (Phragmites australis) and submerged vegetation on pike (Esox lucius), Fisheries Research, 261, 106621, https://doi.org/10.1016/j.fishres.2023.106621, 2023.
Oksanen, J., Guillaume Blanchet, F., Friendly, M., Kindt, R., Legendre, P., McGlinn, D., Minchin, P. R., O'Hara, R. B., Simpson, G. L., Solymos, P., Stevens, H., Szoecs, E., and Wagner, H.: Vegan: Community ecology package. R package version 2.5-6, 2019, The Comprehensive R Archive Network (CRAN), https://doi.org/10.32614/CRAN.package.vegan, 2020.
Pawlak, J. F., Laamanen, M., and Andersen, J. H.: HELCOM, Eutrophication in the Baltic Sea: An integrated thematic assessment of the effects of nutrient enrichment in the Baltic Sea region, Baltic Sea Environment Protection Commission Proceedings No. 115B, Helsinki Commission, Helsinki, Finland, Baltic Sea Environment Protection Commission (HELCOM), https://doi.org/10.13140/RG.2.1.2758.0564, 2009.
Pendleton, L., Donato, D. C., Murray, B. C., Crooks, S., Jenkins, W. A., Sifleet, S., Craft, C., Fourqurean, J. W., Kauffman, J. B., Marba, N., Megonigal, P., Pidgeon E., Herr, D., Gordon, D., and Baldera, A.: Estimating global blue carbon emissions from conversion and degradation of vegetated coastal ecosystems, PLoS ONE, 7, e43542, https://doi.org/10.1371/journal.pone.0043542, 2012.
Pitkänen, T.: Where does the reed grow? Järviruokoalueidan satelliittikartoitus Etelä-Suomessa ja Viron Väinänmeren rannikoilla. Turuun ammattikorkeakoulun puheenvuoroja 29, Turku University of Applied Sciences, http://julkaisut.turkuamk.fi/isbn9525596664.pdf (last access: 16 February 2026), 2006.
Pitkänen, T., Meriste, M., Kikas, T., and Kask, U.: Reed resource mapping in Finland and Estonia, Read up on Reed, Turku University of Applied Sciences, ISBN: 978-952-11-2781-6, 2007.
R Core Team: R: A language and environment for statistical computing, R Foundation for Statistical Computing, Vienna, Austria, https://www.R-project.org/ (last access: 16 February 2026), 2024.
Rietl, A. J., Nyman, J. A., Lindau, C. W., and Jackson, C. R.: Wetland methane emissions altered by vegetation disturbance: An interaction between stem clipping and nutrient enrichment, Aquatic Botany, 136, 205–211, 2017.
Röhr, M. E., Boström, C., Canal-Vergés, P., and Holmer, M.: Blue carbon stocks in Baltic Sea eelgrass (Zostera marina) meadows, Biogeosciences, 13, 6139–6153, https://doi.org/10.5194/bg-13-6139-2016, 2016.
Serrano, O., Lovelock, C. E., Atwood, T. B., Macreadie, P. I., Canot, R., Phinn, S., Arias-Ortiz, A., Bai, L., Baldock, J., Bedulli, C., Carnell, P., Connolly, R. M., Donaldson, P., Esteban, A., Ewers Lewis, C. J., Eyre, B. D., Hayes, M. A., Horwitz, P., Hutley, L. B., Kavazos, C. R. J., Kelleway, J. J., Kendrick, G. A., Kilminster, K., Lafratta, A., Lee, S., Lavery, P. S., Maher, D. T., Marba, N., Masque, P., Mateo, M. A., Mount, R., Ralph, P. J., Roelfsema, C., Rozaimi, M., Ruhon, R., Salinas, C., Samper-Villarreal, J., Sanderman, J., Sanders, C. J., Santos, I., Sharples, C., Steven, A. D. L., Cannard, T., Trevathan-Tackett, S. M., and Duarte, C. M.: Australian vegetated coastal ecosystems as global hotspots for climate change mitigation, Nature Communications, 10, https://doi.org/10.1038/s41467-019-12176-8, 2019.
Silan, G., Buosi, A., Bertolini, C., and Sfriso, A.: Dynamics and drivers of carbon sequestration and storage capacity in Phragmites australis-dominated wetlands. Estuarine, Coastal and Shelf Science, 298, 108640, https://doi.org/10.1016/j.ecss.2024.108640, 2024.
van der Meijs, F. and Isaeus, M.: Wave exposure calculations for the Gulf of Finland, Aqua. Biot. Rep., 13, ISBN: 978-91-89085-22-0, 2020.
Warrence, N. J., Pearson, K. E., and Bauder, J. W.: Basics of salinity and sodicity effects on soil physical properties. Department of Land Resources and Environmental Sciences, Montana State University-Bozeman, https://waterquality.montana.edu/energy/cbm/background/soil-prop.html (last access: 16 February 2026), 2003.
Williamson, M. F.: Carbon Stocks in Coastal Reed Beds, Zenodo [data set], https://doi.org/10.5281/zenodo.18537690, 2026.
Xiong, J., Shao, X., Yuan, H., Liu, E., and Wu, M.: Carbon, Nitrogen, and Phosphorus Stoichiometry and Plant Growth Strategy as Related to Land-Use in Hangzhou Bay Coastal Wetland, China, Front. Plant Sci., 13, 946949, https://doi.org/10.3389/fpls.2022.946949, 2022.
Yost, J. L. and Hartemink, A. E.: How deep is the soil studied-an analysis of four soil science journals, Plant and Soil, 452, 5–18, 2020.
Zuur, A. F., Ieno, E. N., and Elphick, C. S.: A protocol for data exploration to avoid common statistical problems, Methods in Ecology and Evolution, 1, 3–14, 2010.