the Creative Commons Attribution 4.0 License.
the Creative Commons Attribution 4.0 License.
 | 23 Feb 2026
Phenology, fluxes and their drivers in major Indian agroecosystems: A modeling study using the Community Land Model (CLM5)
Kangari Narender Reddy
Somnath Baidya Roy
Agroecosystems cover over half of Indian land surface, yet their long-term and spatial variability in crop physiology and terrestrial fluxes is not well understood. Most previous studies rely on site-scale eddy covariance observations, and the only regional assessment over Indian agroecosystems (Reddy et al., 2023) focused solely on wheat with limited calibration. Reddy et al. (2025) calibrated CLM5 using multi-site data to simulate Indian wheat and rice. In this study, we use this capability of CLM5 to provide the first comprehensive regional analysis of long-term (1970–2014) trends in crop variables and terrestrial fluxes across major croplands of India. Further, numerical experiments are conducted with CLM5 to evaluate the role of climate, CO2, nitrogen fertilisation, and irrigation in driving the trends. The results show that LAI, yield, and dry matter of the crops increased more than twofold since the 1970s, with carbon uptake doubling and respiratory losses decreasing during this period. Nitrogen fertilisation and irrigation have the largest impact on the observed trends of crop variables and terrestrial fluxes, followed by CO2. This study highlights the important role of management practices in increasing crop productivity and carbon uptake under a changing climate and demonstrates that a robust modeling framework is now available for testing management strategies across Indian agroecosystems.
- Article
(4881 KB) - Full-text XML
-
Supplement
(5668 KB) - BibTeX
- EndNote


The exchange of water, energy, and carbon between the terrestrial ecosystems and the atmosphere play key role in shaping the water, energy and carbon cycles (Bonan and Doney, 2018; Migliavacca et al., 2021; Yu et al., 2024). Agroecosystems are one of the largest components of terrestrial ecosystems and have significant influence on the land-atmosphere interactions (Liu et al., 2016; Lokupitiya et al., 2016; Ingwersen et al., 2018). Almost 56 % of the Indian harvested land area is comprised of croplands (Zanaga et al., 2021), 80 % of which is by wheat and rice. Wheat is harvested in northern and central part of India during rabi season (November to April) and constitutes to 30 Mha (million hectares), while rice is harvested across India in the kharif (June to October; 39 Mha) and rabi (5 Mha) seasons (ASG-2023, 2024). Due to the large spatial coverage and annual growing time, terrestrial fluxes from wheat and rice croplands dominate regional land-atmosphere interaction processes. Agroecosystems are influenced by natural factors, including temperature, radiation, precipitation, and atmospheric CO2, as well as human management factors like irrigation, nitrogen fertilization, tillage, and residual management (Chenu et al., 2017). Changes in natural and management drivers have varied impacts on agroecosystems (Gahlot et al., 2020; Lombardozzi et al., 2020; Reddy et al., 2023). Hence, it is important to understand the dynamics of the fluxes and their drivers in Indian agroecosystems.
Studies over the past two decades used eddy covariance observations to investigate terrestrial fluxes in croplands across Asia, Europe, and North America (e.g., Saito et al., 2005; Chen et al., 2015; Wagle et al., 2021). However, findings from mid-latitude wheat systems with long vernalization periods are not representative of short, warm growing seasons observed in India. A few studies examined the terrestrial fluxes within Indian agroecosystems (Patel et al., 2011, 2021; Bhattacharya et al., 2013; Kumar et al., 2021), usually at one site, which fail to adequately represent the diverse climatic growing conditions and regions of India. For example, the sites in Patel et al. (2011, 2021) and Kumar et al. (2021) are in the northern part of India, which has colder temperatures and is well irrigated. These are not representative of all wheat-growing regions of India, most of which experience warm temperatures and low water availability (Gahlot et al., 2020). Additionally, these studies examine short time periods of 1–3 growing seasons failing to provide any long-term information about the diverse crop growth and fluxes from Indian agroecosystems. Despite their importance, Indian agroecosystems lack (1) regional scale estimates of crop phenology, productivity, and terrestrial fluxes, (2) long-term trend assessments, and (3) attribution of observed changes to natural and management drivers.
Land Surface Models (LSMs) provide a powerful framework for addressing the above-mentioned gaps in Indian agroecosystem studies. These models have come a long way, from their initial versions of simplified representation providing boundary conditions to the atmospheric models to currently very complex models, with accurate representation of the land surface and competition for resources amongst various land types (Fisher and Koven, 2020). Gahlot et al. (2020) and Reddy et al. (2023) investigated the impact of natural and management drivers on crop phenology and carbon fluxes in Indian wheat agroecosystems using the Integrated Science Assessment Model (ISAM) at a regional scale. The major limitation of these studies is using only one site for calibration and simulation of wheat. They fail to provide a complete picture of crop physiology and fluxes of Indian agroecosystems.
Land model benchmarking studies showed that Community Land Model version 5 (CLM5) offers advanced representations of terrestrial processes and performs better than other LSMs (Collier et al., 2018). Reddy et al. (2025) calibrated CLM5 using multi-site data with different climatic conditions of India. Building on the improved CLM5 model, the current study aims to (1) evaluate the CLM5 simulation of crop phenology and terrestrial fluxes against a new and long term site scale data (1970–2014) and widely used regional scale datasets (FAOSTAT and FLUXCOM); (2) investigate the long-term and spatial trends of crop physiology and fluxes; and finally, (3) understand the impact of natural and management drivers on the observed trends of crop physiology and fluxes.
By enhancing our understanding of the spatial and temporal dynamics of crop productivity, carbon, and water fluxes in a highly diverse and climatically sensitive region like India, this study provides valuable insights for future food security planning and sustainable land management. The approach demonstrated in Reddy et al. (2025) and in this study can serve as a blueprint for extending such analyses to other tropical and subtropical regions, where data limitations and complex agroecosystem interactions are observed. Ultimately, this research contributes to global efforts in predicting agricultural resilience, optimizing resource use, and mitigating the impacts of climate change on vulnerable agroecosystems.
2.1 Community Land Model Version 5 (CLM5)
CLM5 is the latest land component version in the Community Earth System Model (CESM) (Lawrence et al., 2018, 2019). The biogeochemistry mode of CLM5 (CLM5-BGC) is widely used to estimate the water, energy, and carbon fluxes in various climatic zones (Cheng et al., 2021; Denager et al., 2023; Song et al., 2020; Seo and Kim, 2023). The biogeochemistry and crop module of CLM5 (BGC-Crop) is modified in various studies to meet regional constraints, and the resulting impact on various fluxes is analyzed (Boas et al., 2021, 2023; Raczka et al., 2021; Yin et al., 2023). The CLM5 crop module includes new crop functional types, updated fertilization rates and irrigation triggers, a transient crop management option, and some adjustments to phenological parameters (Lombardozzi et al., 2020; Cheng et al., 2021).
Reddy et al. (2025) showed that the CLM5 model has significant deficiencies in simulating Indian crops. The growing seasons of wheat and rice were off by 4–6 months, causing the crops to grow in seasons which is not observed in India, leading to large biases in simulated LAI, yield, and terrestrial fluxes (Reddy et al., 2025). The other major reason for the biases in CLM5 simulation was the use of parameters (especially base temperature), calibrated for mid-latitude regions. Reddy et al. (2025) addressed these issues by calibrating the CLM5 model for the Indian region using a novel crop dataset put together from studies conducted at Indian agricultural colleges and institutions (further information on the novel crop data in Sect. 2.3.1). The model was improved in two phases. First, the crop planting window was corrected and crop growth parameters that impact the planting, phenological stages, and yield were calibrated. Second, because the crops in India experience a varying climatic condition from south to north of the country, a latitudinal variation in base temperature was calibrated for wheat crop and was introduced for rice crop which was missing in the default CLM5 model. The base temperature is part of Growing Degree Days (GDD) calculation (Eq. 1). The modifications to the model resulted in improvements in wheat LAI bias from 0.81 to 0.43 (all biases are unitless) and Pearson correlation from −0.45 to 0.30. The overall bias in simulating crop growth has improved from 0.51 to 0.24 and 0.48 to 0.25, respectively, for wheat and rice crops (Reddy et al., 2025).
The present study uses the CLM5 model from Reddy et al. (2025) to examine the trends in agricultural activities and the impact of various drivers on terrestrial fluxes. The CLM5_Mod2 version from Reddy et al. (2025) was the best in simulating crop phenology variation across sites and regional terrestrial fluxes during the crop-growing seasons. Therefore, the CLM5_Mod2 version of the model is used in this study.
2.1.1 Carbon fluxes in crops
Crops take in CO2 through photosynthesis, and a part of it is used to meet the maintenance and growth needs, and the remaining is converted to dry matter and distributed to various crop parts. Gross Primary Production (GPP) is the total assimilated CO2. Net Primary Production (NPP) is the difference between GPP and autotrophic respiration. Respiration in CLM5 is divided into two parts: maintenance respiration and growth respiration. Maintenance respiration is defined as the carbon cost to support the metabolic activity of existing live tissue. In contrast, growth respiration is the additional carbon cost for synthesizing new growth. Maintenance respiration costs are directly proportional to the nitrogen content per unit area in plant parts and inversely proportional to the mean 10 d air temperature (Sect. S1 in the Supplement). The CO2 assimilated from the atmosphere (GPP) by C3 crops in CLM5 is mainly limited by Rubisco availability, photosynthetically active radiation, and Triose phosphate utilization (product availability) (Sect. S1). The assimilation is also limited by 10 d mean air temperature and leaf nitrogen availability.
The Total Ecosystem Respiration (TER) is the sum of Autotrophic Respiration (Ra) and Heterotrophic Respiration (Rh). Ra is the sum of maintenance, growth, and dark respiration (Sect. S1). In CLM5, Ra is specific to plant functional type, while Rh is specific to the land unit. Net Ecosystem Productivity (NEP) is the difference between GPP and TER.
2.1.2 Crop phenological stages
Crops are represented mechanistically in a land surface model. The crop growth, assimilation of dry matter, and its distribution to different parts of the crop are controlled using the phenological stages. In the early stages of crop growth, more dry matter is directed toward roots and leaves to support the crop growth. During the later stages more dry matter is directed towards the reproductive parts so as to facilitate the new crop growth. The crop module simulates the phenological stages using the thermal units (GDD – Growing Degree Days), and it helps the model to direct the assimilated dry matter to the essential parts during various stages of crop growth.
CLM5 uses the AgroIBIS crop phenology algorithm (Badger and Dirmeyer, 2015; Levis et al., 2016), consisting of three distinct phases. Phase 1 starts at planting and ends with leaf emergence, phase 2 continues from leaf emergence to the beginning of grain fill, and phase 3 starts from the beginning of grain fill and ends with physiological maturity and harvest. The GDD required for maturity are input parameters to the model and are often derived from observations. GDD for maturity in rice is 2100 and 1700 °C d for wheat. Different phenological stages of a crop, such as emergence, grain fill, and harvest, are reached when a fixed ratio of GDD maturity is reached. For example, after sowing of the crop, emergence is reached when daily accumulated GDD reaches 3 % of GDD maturity, and the grain fill stage is reached when daily accumulated GDD reaches 60 % of GDD maturity. Daily accumulated GDD is calculated using:
where GDDi is the daily GDD accumulated over i days since sowing, GDDi−1 is the daily GDD accumulated over i−1 days since sowing, T2m is the 2 m temperature, and Tbase is the base temperature, defined for each crop type in CLM5. Daily accumulated GDD defines the phenological stages of the crop.
2.1.3 Surface Energy and Water Fluxes
The surface sensible and latent heat fluxes in CLM5 are defined by the Monin-Obukhov similarity theory (Lawrence et al., 2019), which relates the turbulent fluxes to the differences in mean temperature and humidity, respectively (Wang and Dickinson, 2012). The surface heat and water fluxes are defined as the contributions from the bare ground and the vegetation while neglecting the impact of air within the canopy. The sensible heat flux over vegetated land units is the sum of heat flux from the ground surface and heat flux from vegetation. Similarly, the latent heat flux over vegetated land units is the sum of water vapor fluxes from the ground surface and vegetation. The water vapor flux from vegetation is the sum of water vapor flux from wetted leaf and stem area, i.e., water evaporation intercepted by the canopy and transpiration from dry leaf surfaces (Lawrence et al., 2018). This study considered the total heat and water vapor fluxes from the land units over wheat and rice-growing regions of India.
2.1.4 Nitrogen Fertilization and Irrigation
Model simulates fertilization by adding nitrogen directly into the mineral nitrogen reservoir of soil to satisfy crop nitrogen requirements. A dedicated agricultural land unit in CLM guarantees that natural vegetation will not utilize the fertilizer supplied to crops. In CLM5, fertilizer application is according to crop functional types, and it varies spatially each year according to the LUMIP land use and land cover change time series (Lawrence et al., 2016). Fertilizer application commences during the leaf emerging phase of crop growth (phase 2) and persists for 20 d, mitigating significant nitrogen losses due to leaching and denitrification in the early stages of crop development (Lawrence et al., 2019).
Model irrigates the cropland areas that are equipped for irrigation. The implementation of irrigation adapts dynamically to the soil moisture conditions modeled by CLM. The irrigation algorithm is based on the work of Ozdogan (2011). Upon enabling irrigation, the crop fields inside each grid cell are partitioned into irrigated and rainfed fractions based on a dataset identifying regions equipped for irrigation (Portmann et al., 2010). Irrigated and rainfed crops reside on distinct soil columns, ensuring that irrigation is exclusively simulated to the soil beneath the irrigated crops. In irrigated agricultural fields, an assessment is conducted daily to determine the necessity of irrigation for that day. This verification occurs during the initial time step following 6 AM local time. Irrigation is necessary when the crop leaf area exceeds zero and the available soil water falls below a designated threshold (Lawrence et al., 2019). Rice croplands are often flooded in observations while this is missing in the model and irrigates like all other crops.
2.2 Details of experiments
In this study, the model simulations are land-only simulations with active biogeochemistry and active crops at 0.5° resolution using the Global Soil Wetness Programme Phase 3 (GSWP3) atmospheric forcing data. CLM5 is spun up for 200 years in an accelerated mode and 400 years in normal mode to achieve equilibrium conditions (Fig. S1 in the Supplement). We use the data from 1901–1920 cycled repeatedly for the spinup simulations. We use 0 to 40° N and 60 to 100° E as the domain. This simulation is the Control run and we refer it to as CTRL throughout the manuscript. We conduct four additional experiments to evaluate the impact of various drivers on the observed trends: SClim, S, SNFert, and SIrrig (Table 1). SClim uses the 1901–1920 GSWP3 data cycled over for 50 years (from 1965 to 2014). S is simulated using the pre-industrial CO2 levels in the atmosphere while keeping all other drivers similar to the CTRL simulation. SNFert is simulated by turning off the nitrogen fertilization for crops. Similarly, SIrrig is simulated by turning off irrigation for crops.
We use the data from 1970–2014 in all the analysis although CLM5 simulations are run from 1965 to 2014. The initial five years of the CLM5 simulations are discarded to minimize the initial noise in crop growth.
Table 1Description of CLM5 simulations conducted in this study (from 1965–2014) and the constraints used to extract the impact of individual drivers.
2.3 Evaluation of CLM5
2.3.1 Crop physiological variables
We evaluate the crop physiological variables simulated in the CTRL simulation using the site scale data from 1970 to 2014 (Varma et al., 2024; Table 1). The site scale observation data is from digitizing the thesis results of students in various agricultural colleges across India (Varma et al., 2024; Reddy et al., 2025). A part of the crop data from 2000 to 2014 was used to calibrate and validate the CLM5 model in Reddy et al. (2025). The data has a variety of experiments ranging from varying nitrogen fertilization, planting dates, irrigation, weed management, and others. We use only the control experiment data at the sites for evaluating CLM5 in this study. If any dataset in Varma et al. (2024) has multiple sowing dates, we use the sowing date mentioned as normal sowing for CLM5 model evaluation.
We consider LAI (m2 m−2), grain yield (GY) (t ha−1), and total dry matter (DM) (t ha−1) for evaluation. We report the following evaluation metrics: Mean Absolute Bias (MAB), Pearson's correlation (r), and Root Mean Square Error (RMSE).
where var is the crop phenology variable, CLMvar and Obsvar are the simulated and observed variable values, and are the respective mean values.
We also compare CLM5 simulated yield against the FAO annual data for wheat and rice from 1970–2014. The CLM5 yield is the CTRL simulation spatial average of wheat and rice yield across the wheat and rice growing regions. The FAOSTAT database (FAO, 2022) provides country-level data on area harvested and production for every year starting in 1961. We derive the country-scale annual yield by dividing production by the area harvested for the wheat and rice crops.
2.3.2 Terrestrial fluxes
The accurate simulation of carbon fluxes in various ecosystems by CLM5 is essential for two reasons. (1) The accurate simulation of carbon fluxes in agroecosystems during the growing season results in an accurate simulation of crop growth, and (2) the accurate simulation of carbon fluxes in all ecosystems will provide us confidence in the carbon uptake estimates by total ecosystem in a changing climate. To validate the carbon fluxes and other water and energy fluxes in Indian agroecosystems, we compare the fluxes with both available site scale data and regional scale reanalysis data (Table 2).
Table 2Variables, the scale of comparison, and the datasets used to evaluate the CLM5 data.
Site scale carbon fluxes
Carbon flux studies in Indian agroecosystems are limited, and the data they produce is not available publicly. Patel et al. (2011), Patel et al. (2021), and Bhattacharya et al. (2013) investigated the terrestrial fluxes in Indian agroecosystems, but the raw data is not provided. We extract the data from figures in the manuscripts using plotdigitizer software (PlotDigitizer, 2025). Patel et al. (2011) investigated the carbon fluxes in a wheat field in Meerut (29°05′ N, 77°41′ E) during the 2009–2010 growing season (December to April) and reported the fluxes as diurnal cycles during various phenological stages (Fig. 2 in Patel et al., 2011). We generate the monthly mean values from the diurnal cycles. Bhattacharya et al. (2013) investigated the carbon fluxes in rice fields at Cuttack (20°27′ N, 85°56′ E) in the kharif season in 2010 and reported the fluxes as diurnal cycles during various phenological stages (Fig. 1 in Bhattacharya et al., 2013). Reddy et al. (2023) used the carbon fluxes measured in a wheat field at IARI, New Delhi (28°40′ N, 77°12′ E), during the growing season of 2013–2014 to validate the ISAM carbon fluxes. The site scale wheat carbon fluxes data at IARI is generated by Kumar et al. (2021) and the fluxes are reported as monthly means.
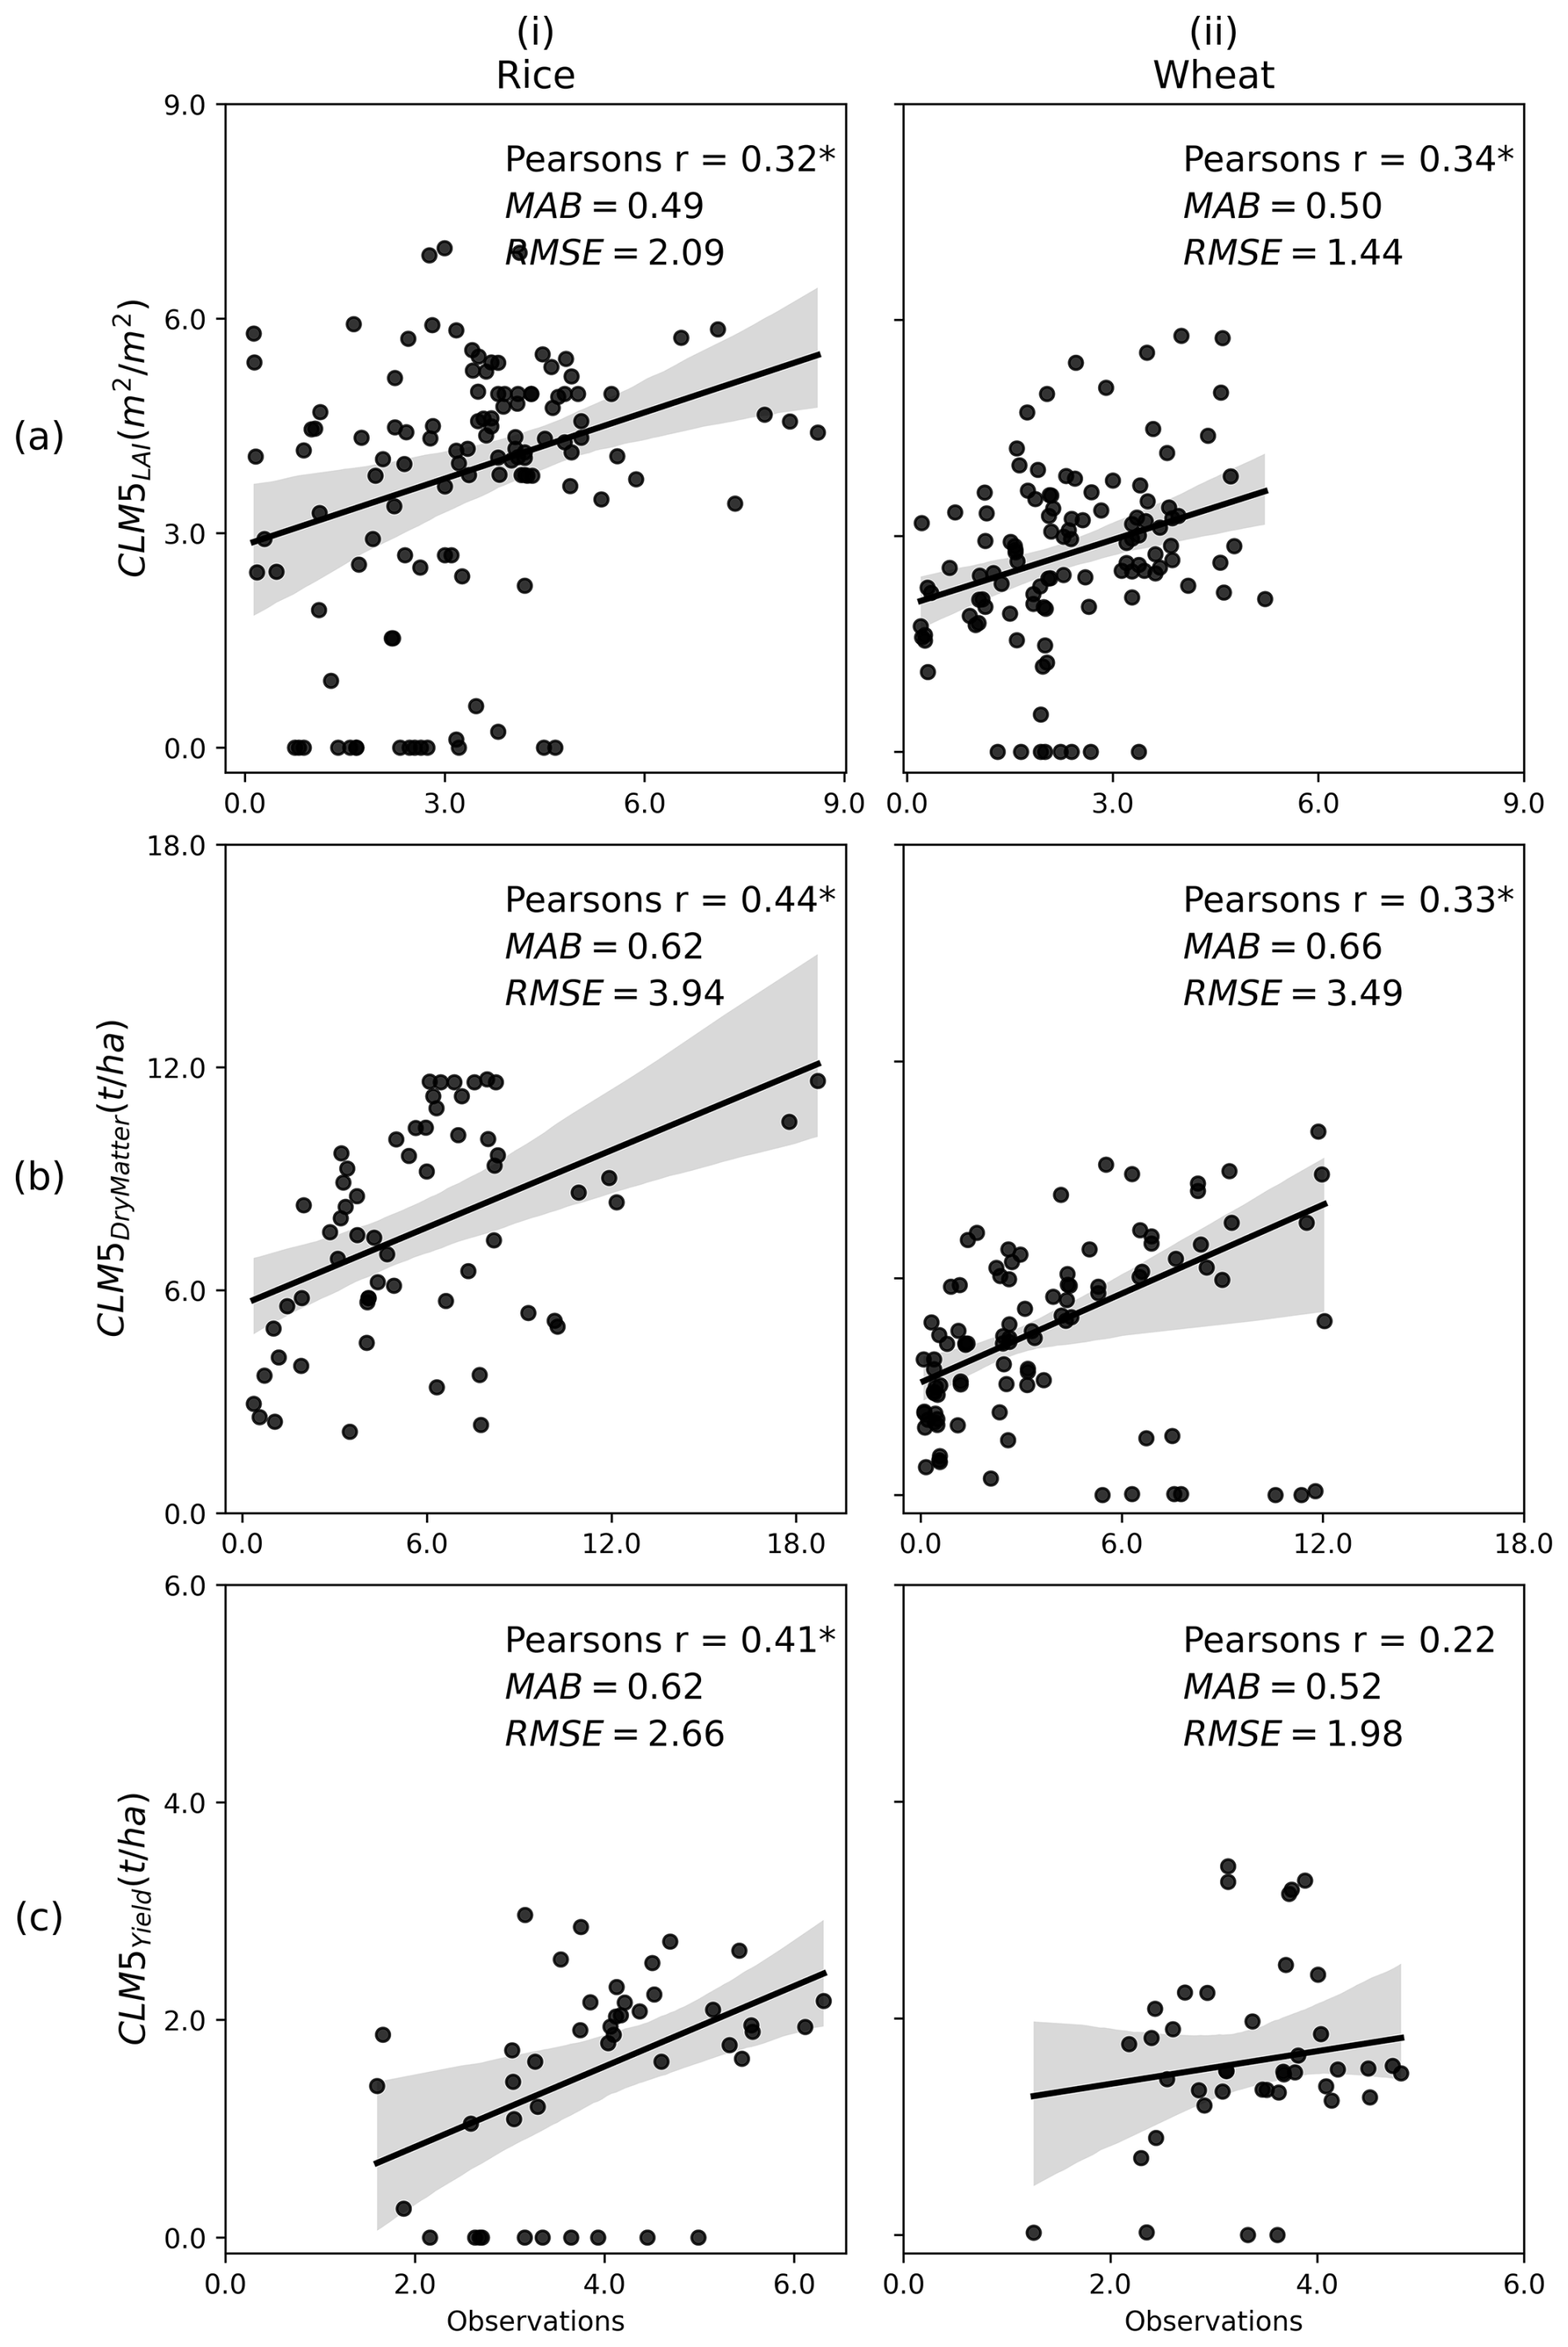
Figure 1Scatterplot comparing site-scale observed and CLM5 simulated (a) LAI, (b) Dry Matter, and (c) Yield of (i) rice and (ii) wheat crops for 1970–2014 period. The * indicates that the correlation is statistically significant at p<0.05. The black line is the best fit between the observed and simulated values, and the grey-shaded region is the 95 % Confidence Interval (CI).
For site-scale evaluation and analysis, we extract CLM5 simulated crop carbon flux estimates from the grid cell corresponding to the latitude and longitude of the site. We compare the site scale wheat flux data (GPP, TER, and NEP) from Reddy et al. (2023) against the wheat monthly mean carbon fluxes of CTRL simulation. We compare the site scale rice flux data (GPP) from Bhattacharya et al. (2013) and wheat flux data (NEP) from Patel et al. (2011) against the respective crop carbon fluxes from CTRL simulation. Comparing the CLM5 CTRL carbon fluxes of major Indian agroecosystems against the corresponding fluxes in observations provides the uncertainty in CLM5 simulations and help us better understand the trends and impacts of multiple drivers.
Regional scale carbon, water, and energy fluxes
We use the FLUXCOM reanalysis data to evaluate the CTRL simulation terrestrial fluxes at the regional scale (Table 2). FLUXCOM data is generated using machine learning to merge the flux measurements in eddy covariance towers with remote sensing and meteorological data and estimate surface fluxes (Jung et al., 2019). We use the monthly 0.5° resolution RS_METEO version of the FLUXCOM data for comparison against the CLM5 simulations. We compare the monthly spatial average of terrestrial fluxes against those from CLM5 simulations. The energy and water fluxes are available from 1950 to 2014, while the carbon fluxes are available from 2001 to 2014 in the FLUXCOM data. Hence, we evaluate the energy and water fluxes simulated by CLM5 from 1970 to 2014 against the FLUXCOM data, while we evaluate CLM5 simulated carbon fluxes data for the period 2001 to 2014.
2.4 Impact of drivers on crop phenology and terrestrial fluxes
We conduct numerical experiments (Table 1) to understand the impact of individual drivers on terrestrial fluxes and crop phenology. We use the Mann-Kendall test (Hussain and Mahmud, 2019) to estimate if a trend exists in the CTRL run, and we report the Theil-Sen slope. We test the significance of the slope using the student's two-tailed test at a significance level of p<0.05. We analysed the trend in the impact of individual drivers by finding the slope of CTRL-Sdriver. If the slope is high and significant at p<0.05, that particular driver has a significant impact on the agroecosystem. If the slope is near zero and p-value is higher than the threshold (0.05), then the driver has no significant impact on the agroecosystem.
3.1 Evaluation of crop physiological parameters and terrestrial fluxes
3.1.1 Crop growth variables
This study uses the best performing CLM5 model in Reddy et al. (2025) for estimating the Indian crop simulation. The Indian crop physiology bias against the site scale observations by the default CLM5 model is very high compared to that of the improved CLM5 model (brief details in Sect. S2).
Figure 1 compares the crop physiological variables simulated by CLM5 (CTRL experiment) against that of the observations from 1970–2014. CLM5 simulates rice reasonably well, with r-values of 0.32, 0.44, and 0.41 for LAI, total dry matter, and yield, respectively, significant at p<0.05. Similarly, CLM5 simulates wheat well with r-values of 0.34, 0.33, and 0.22 for LAI, total dry matter, and yield respectively. The bias in crop variables is 0.5–0.7 in Fig. 1. The bias in rice and wheat simulated by the default CLM5 model in Reddy et al. (2025) is in the range of 0.7–0.8.
The RMSE in yield estimates (Fig. 1c) is high, with 2.66 and 1.98 t ha−1, for rice and wheat, respectively. The high RMSE is due to a few sites having zero yield. CLM5 does not simulate the crop growth for a few years in the region because the grid cell has zero crop area in a particular year indicating a discrepancy between the land cover data in CLM5 and the ground reality. Therefore, CLM5 simulates zero yield for the corresponding year and grid cell. However, when we compare the FAO mean yield over the Indian region against that of the CLM5 simulation, we observe that CLM5 replicates the trend in FAO data for rice (r=0.96) and wheat (r=0.96) (Fig. S2). This shows that, although there are regional discrepancies in yield simulations for individual crops due to a number of reasons, the average crop yields at the country scale are very close to observations. The bias and RMSE are also very low for wheat and rice simulations at the country-scale.
3.1.2 Carbon fluxes
Site scale evaluation
Figure 2 shows the evaluation of carbon fluxes simulated by CLM5 against the observations (Fig. 2) at Cuttack (20°27′ N, 85°56′ E), IARI, New Delhi (28°40′ N, 77°12′ E), and Meerut (29°05′ N, 77°41′ E). Figure 3a–c compare the GPP, TER, and NEP, respectively, measured in a wheat field at IARI, New Delhi, during the rabi season of 2013–2014 against the monthly mean carbon fluxes from CLM5. The CLM5 simulations overestimate the fluxes during the early months and are close to observation estimates in the reproductive and maturity months. In CLM5, GPP is specific to the crop, while TER is the sum of crop-specific term (Ra) and Rh, which is representative of the cropland unit (explained in Sect. 2.1.1). Due to this discrepancy in flux estimates in CLM5, especially TER, and NEP, we observe high bias when we compare them against the site scale carbon estimates.
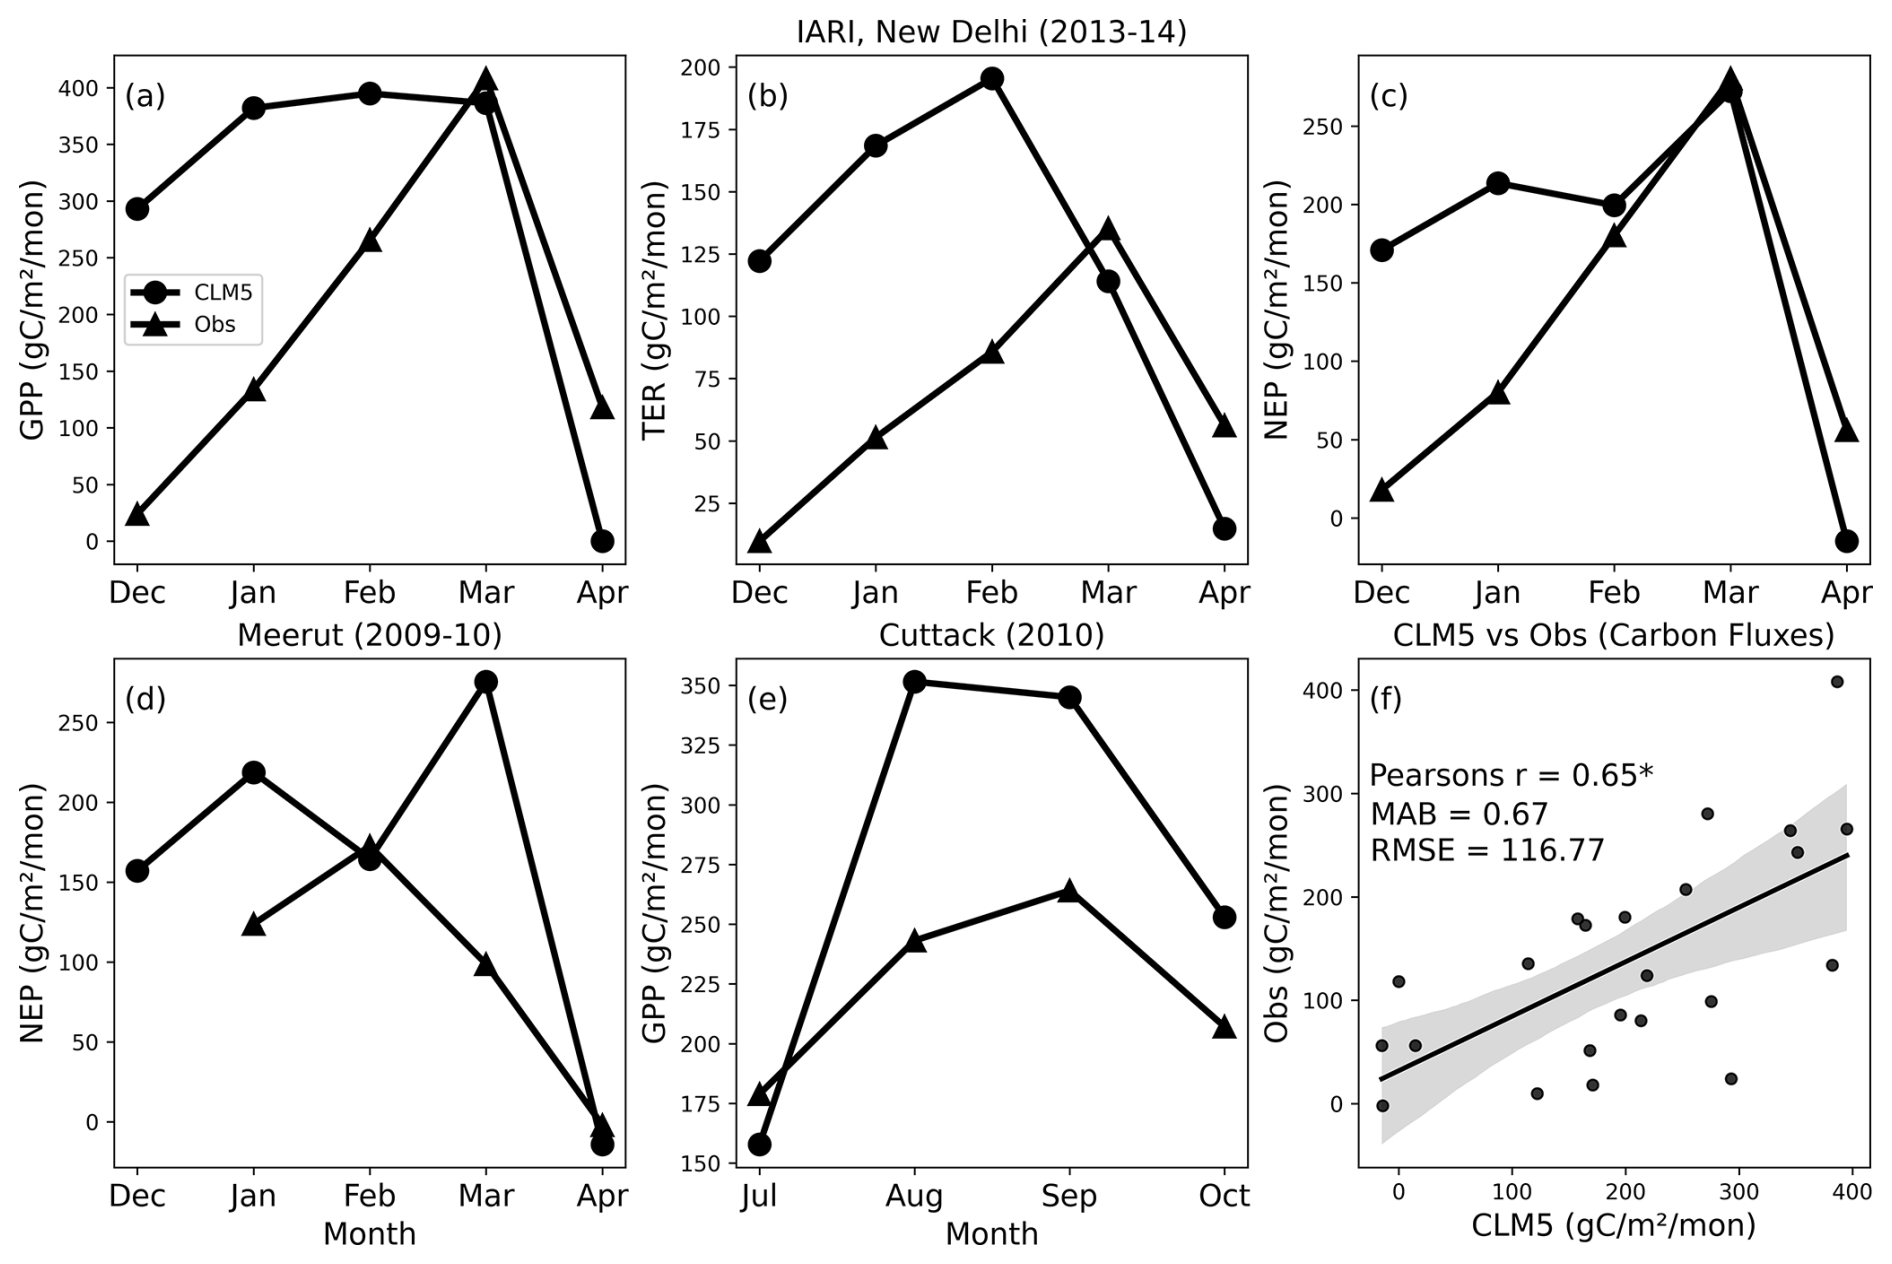
Figure 2Comparing CLM5 carbon fluxes against observations of wheat cropland (a–c) at IARI, New Delhi, from a study by Reddy et al. (2023), (d) wheat cropland at Meerut, from a study by Patel et al. (2011), (e) rice cropland at Cuttack from Bhattacharya et al. (2013), and (f) scatter plot of all monthly mean carbon flux observations against the monthly mean carbon fluxes from CLM5. The “*” on Pearson r in panel (f) signifies the statistical significance at p<0.001. The solid black line in (f) is the linear regression, and the shaded region is the 95 % confidence interval.
Figure 2d compares the NEP measured at Meerut during the rabi season of 2009–2010 over a wheat field against that of the CLM5 simulations. Analysing the NEP simulated by CLM5 at Meerut, although an erroneous high value is simulated in March, the fluxes simulated by CLM5 are close to observations in two months (February and April). Figure 2e compares the GPP measured during the 2010 kharif season against the CLM5 carbon fluxes. The CLM5 simulations overestimate the observed GPP. One reason for the low GPP at the site might be because the farmland was flooded (Liu et al., 2013), while the CLM5 does not simulate a flooded rice field. We compare the overall monthly mean carbon fluxes simulated by CLM5 against that of observations in a scatter plot in Fig. 2f. The Pearson r value between observations and CLM5 simulations is high (0.65) and is significant at p<0.001.
Site level comparison (Fig. 2a–e) of fluxes shows varied results due to the following reasons: (1) the site scale data is an average of infrequent and irregular sample taken during a phenological stage while the simulated data is an average of daily means. (2) differences in the sowing dates of crops by 3–4 weeks between the site and the model, and (3) Rh is not crop specific but defined for a land type in CLM5, and that introduces uncertainties in TER and NEP estimates of CLM5. Despite these differences, Fig. 2f clearly demonstrates that CLM5 simulates carbon fluxes with good seasonality (r=0.65) and low bias (0.67).
Regional scale
To evaluate the regional scale fluxes, we use the grid cells in which more than 10 % of the grid cell area is occupied by rice or wheat crop. This is done to reduce the noise and uncertainty at regional scale from regions with low crop area. This allows us to evaluate the ability of CLM5 to simulate the carbon fluxes in regions with reasonable crop cover. It should be noted that the grid cells have other vegetation types as well. Figure 3 shows the seasonal mean fluxes, i.e., for the rice growing season, the mean fluxes over July to October, and for the wheat growing season, the mean fluxes over December to March, from 2000 to 2014.
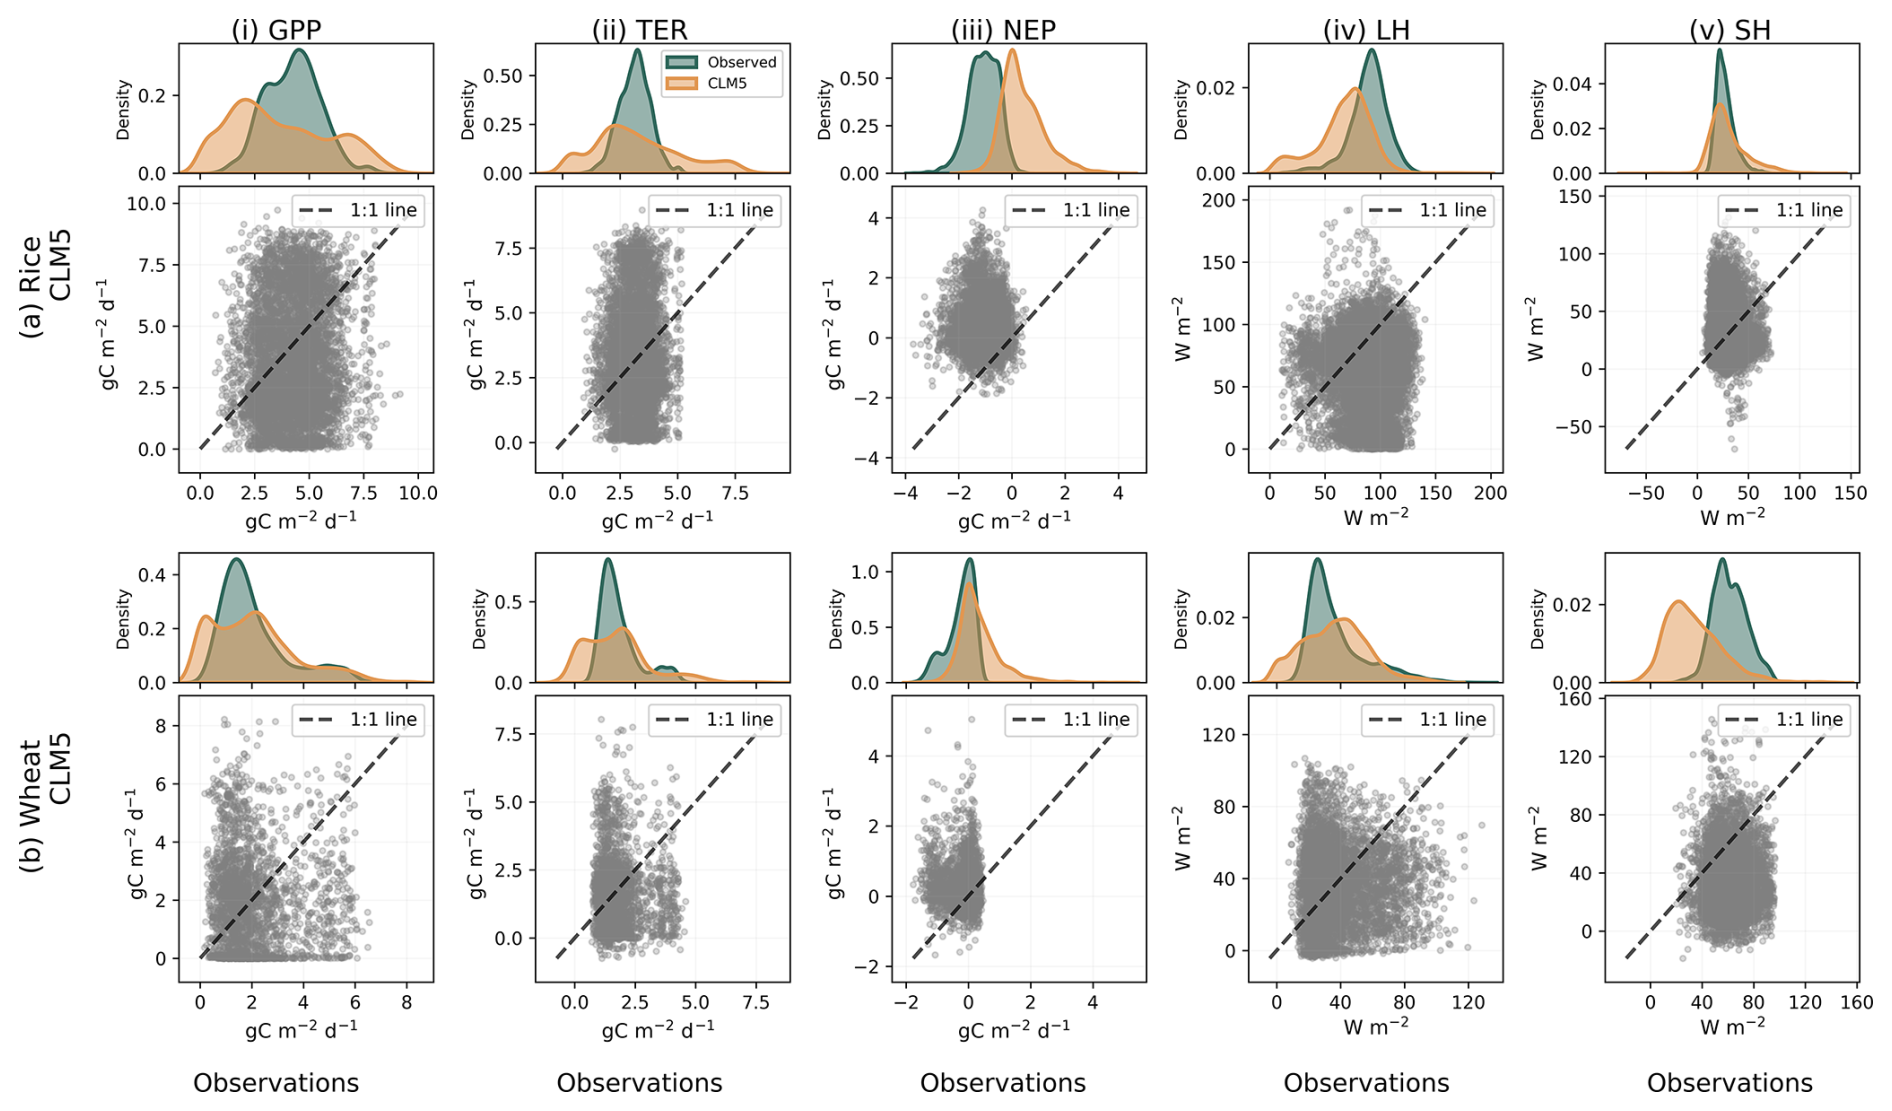
Figure 3Comparison of observed and CLM5 simulated fluxes for (a) wheat and (b) rice agroecosystems. Probability density functions (upper panels) and scatter plots (lower panels) show observed (blue) and CLM5-simulated (red) (i) Gross Primary Production (GPP), (ii) total ecosystem respiration (TER), (iii) net ecosystem production (NEP), (iv) latent heat flux (LH), and (v) sensible heat flux (SH). The dashed line in the scatter plots denotes the 1:1 relationship.
Figure 3 compares CLM5 simulations against FLUXCOM observations for key carbon and energy fluxes over rice and wheat growing seasons, revealing both systematic biases and terrestrial flux performance differences. For GPP, CLM5 broadly captures the observed range but shows a flatter and slightly right-shifted distribution, indicating an overestimation of moderate-to-high productivity, particularly evident in rice. Although there is no such right-shifted distribution for wheat, the flat density shows that moderate GPP values of 1–2.5 is underestimated by CLM5. TER is consistently overestimated by CLM5 for both crops, as seen from the right-skewed density and the clustering of scatter points above the 1:1 line, suggesting excessive simulated respiration. Therefore, NEP exhibits notable biases, CLM5 tends to simulate more positive NEP compared to observations, especially for rice, implying an overestimation of net carbon uptake driven by imbalances between GPP and TER.
Figure 4 shows the mean of carbon fluxes over the study period (2000–2014) for the rice growing regions and season. Figure 4aiii shows the difference in mean seasonal GPP, TER, and NEP simulated by CLM5 over the rice-growing region and observed FLUXCOM data. CLM5 simulated fluxes has a good spatial correlation for GPP and TER (0.53 and 0.49) and has a lower correlation in NEP (0.19). GPP is underestimated compared to the FLUXCOM data (), while TER has low bias (MAB=0.19). The NEP simulated by CLM5 (Fig. 4ciii) has spatial variation, but the FLUXCOM data does not, and therefore, the NEP simulated by CLM5 has low spatial correlation (0.19) and high bias (−0.51) with the FLUXCOM data. All spatial correlations calculated here are significant at p<0.01 tested using a two-tailed test.
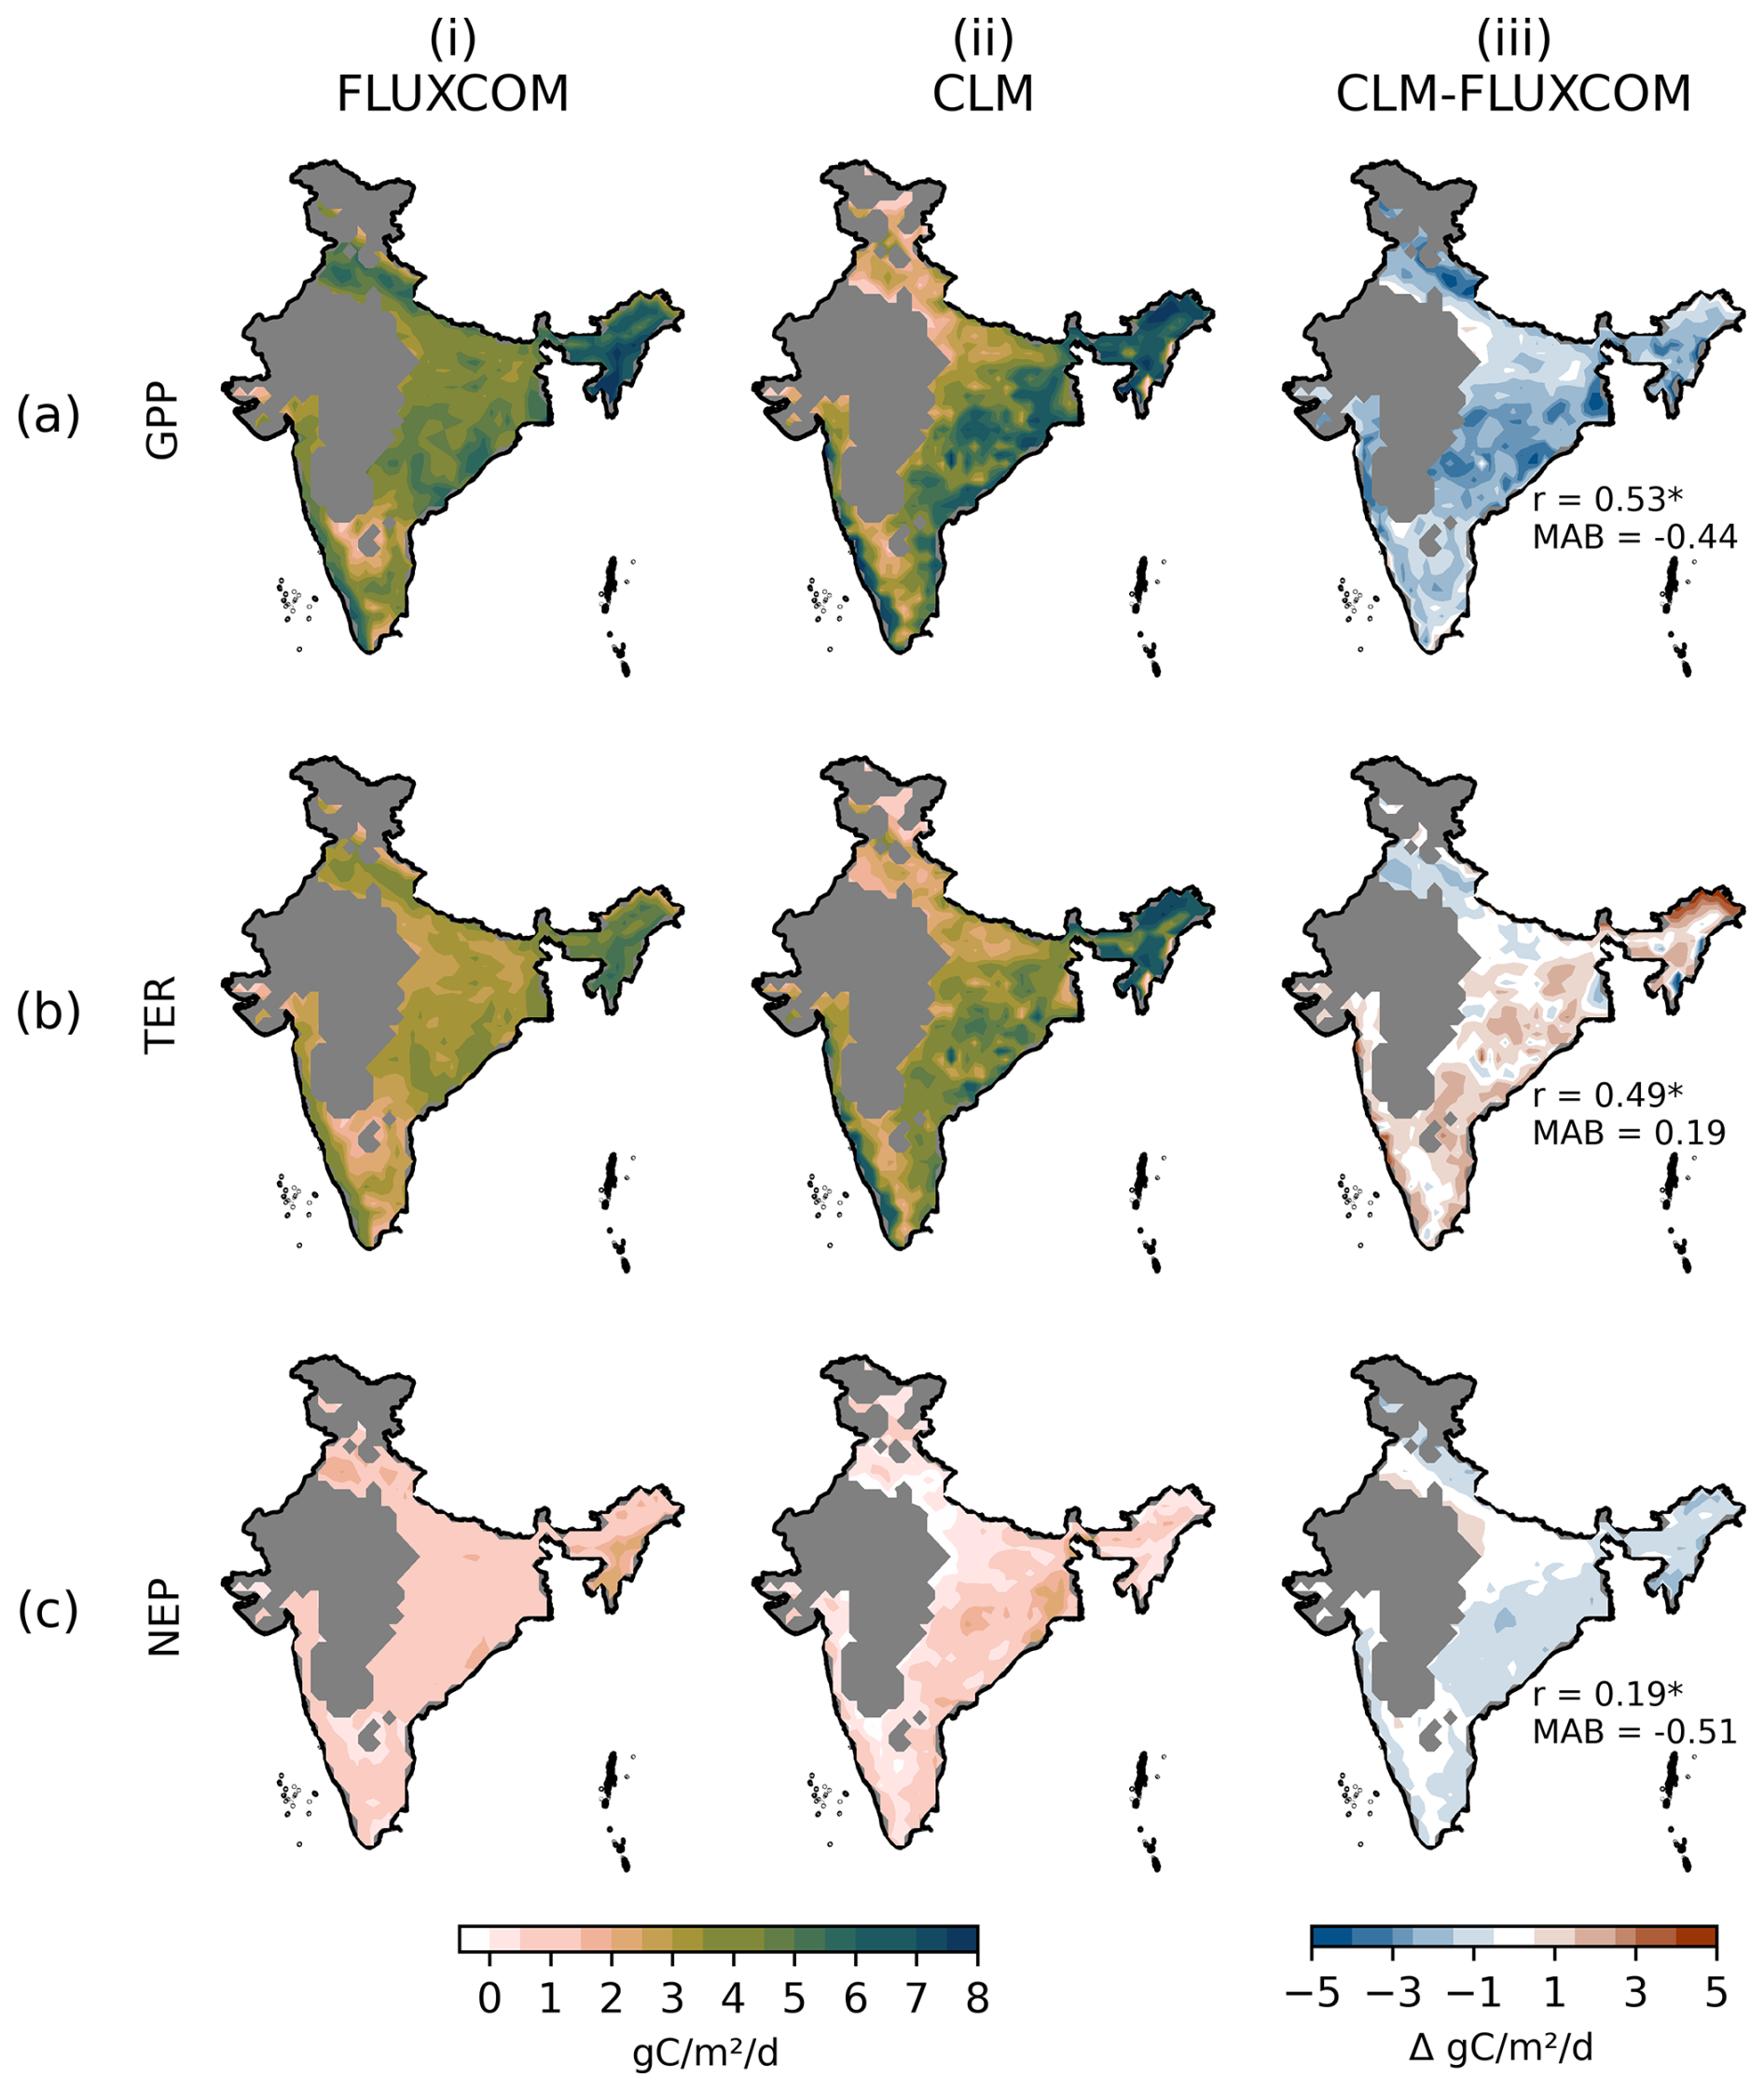
Figure 4Spatial plots of (a) GPP, (b) TER, and (c) NEP from (i) FLUXCOM, (ii) CLM5 over the Indian region, and (iii) the difference between the CLM5 and FLUXCOM data. All plots are for the rice-growing regions (grid cells with more than 10 % of land area covered by rice crop) and the mean of the data growing season (July to October). The “*” over the r value shows a significant correlation at p<0.01.
Figure 5 shows the mean seasonal GPP, TER, and NEP over the wheat-growing region. CLM5 simulated GPP, TER and NEP have a good spatial correlation (0.75, 0.57 and 0.75) and GPP and TER has low bias (0.03 and −0.17) when compared against the FLUXCOM data. The NEP simulated by CLM5 (Fig. 5c(iii)) has a high bias (0.83). However, the bias in large parts of the wheat-growing regions is within the range of ±0.5 (shown in white in Fig. 5c(iii)).
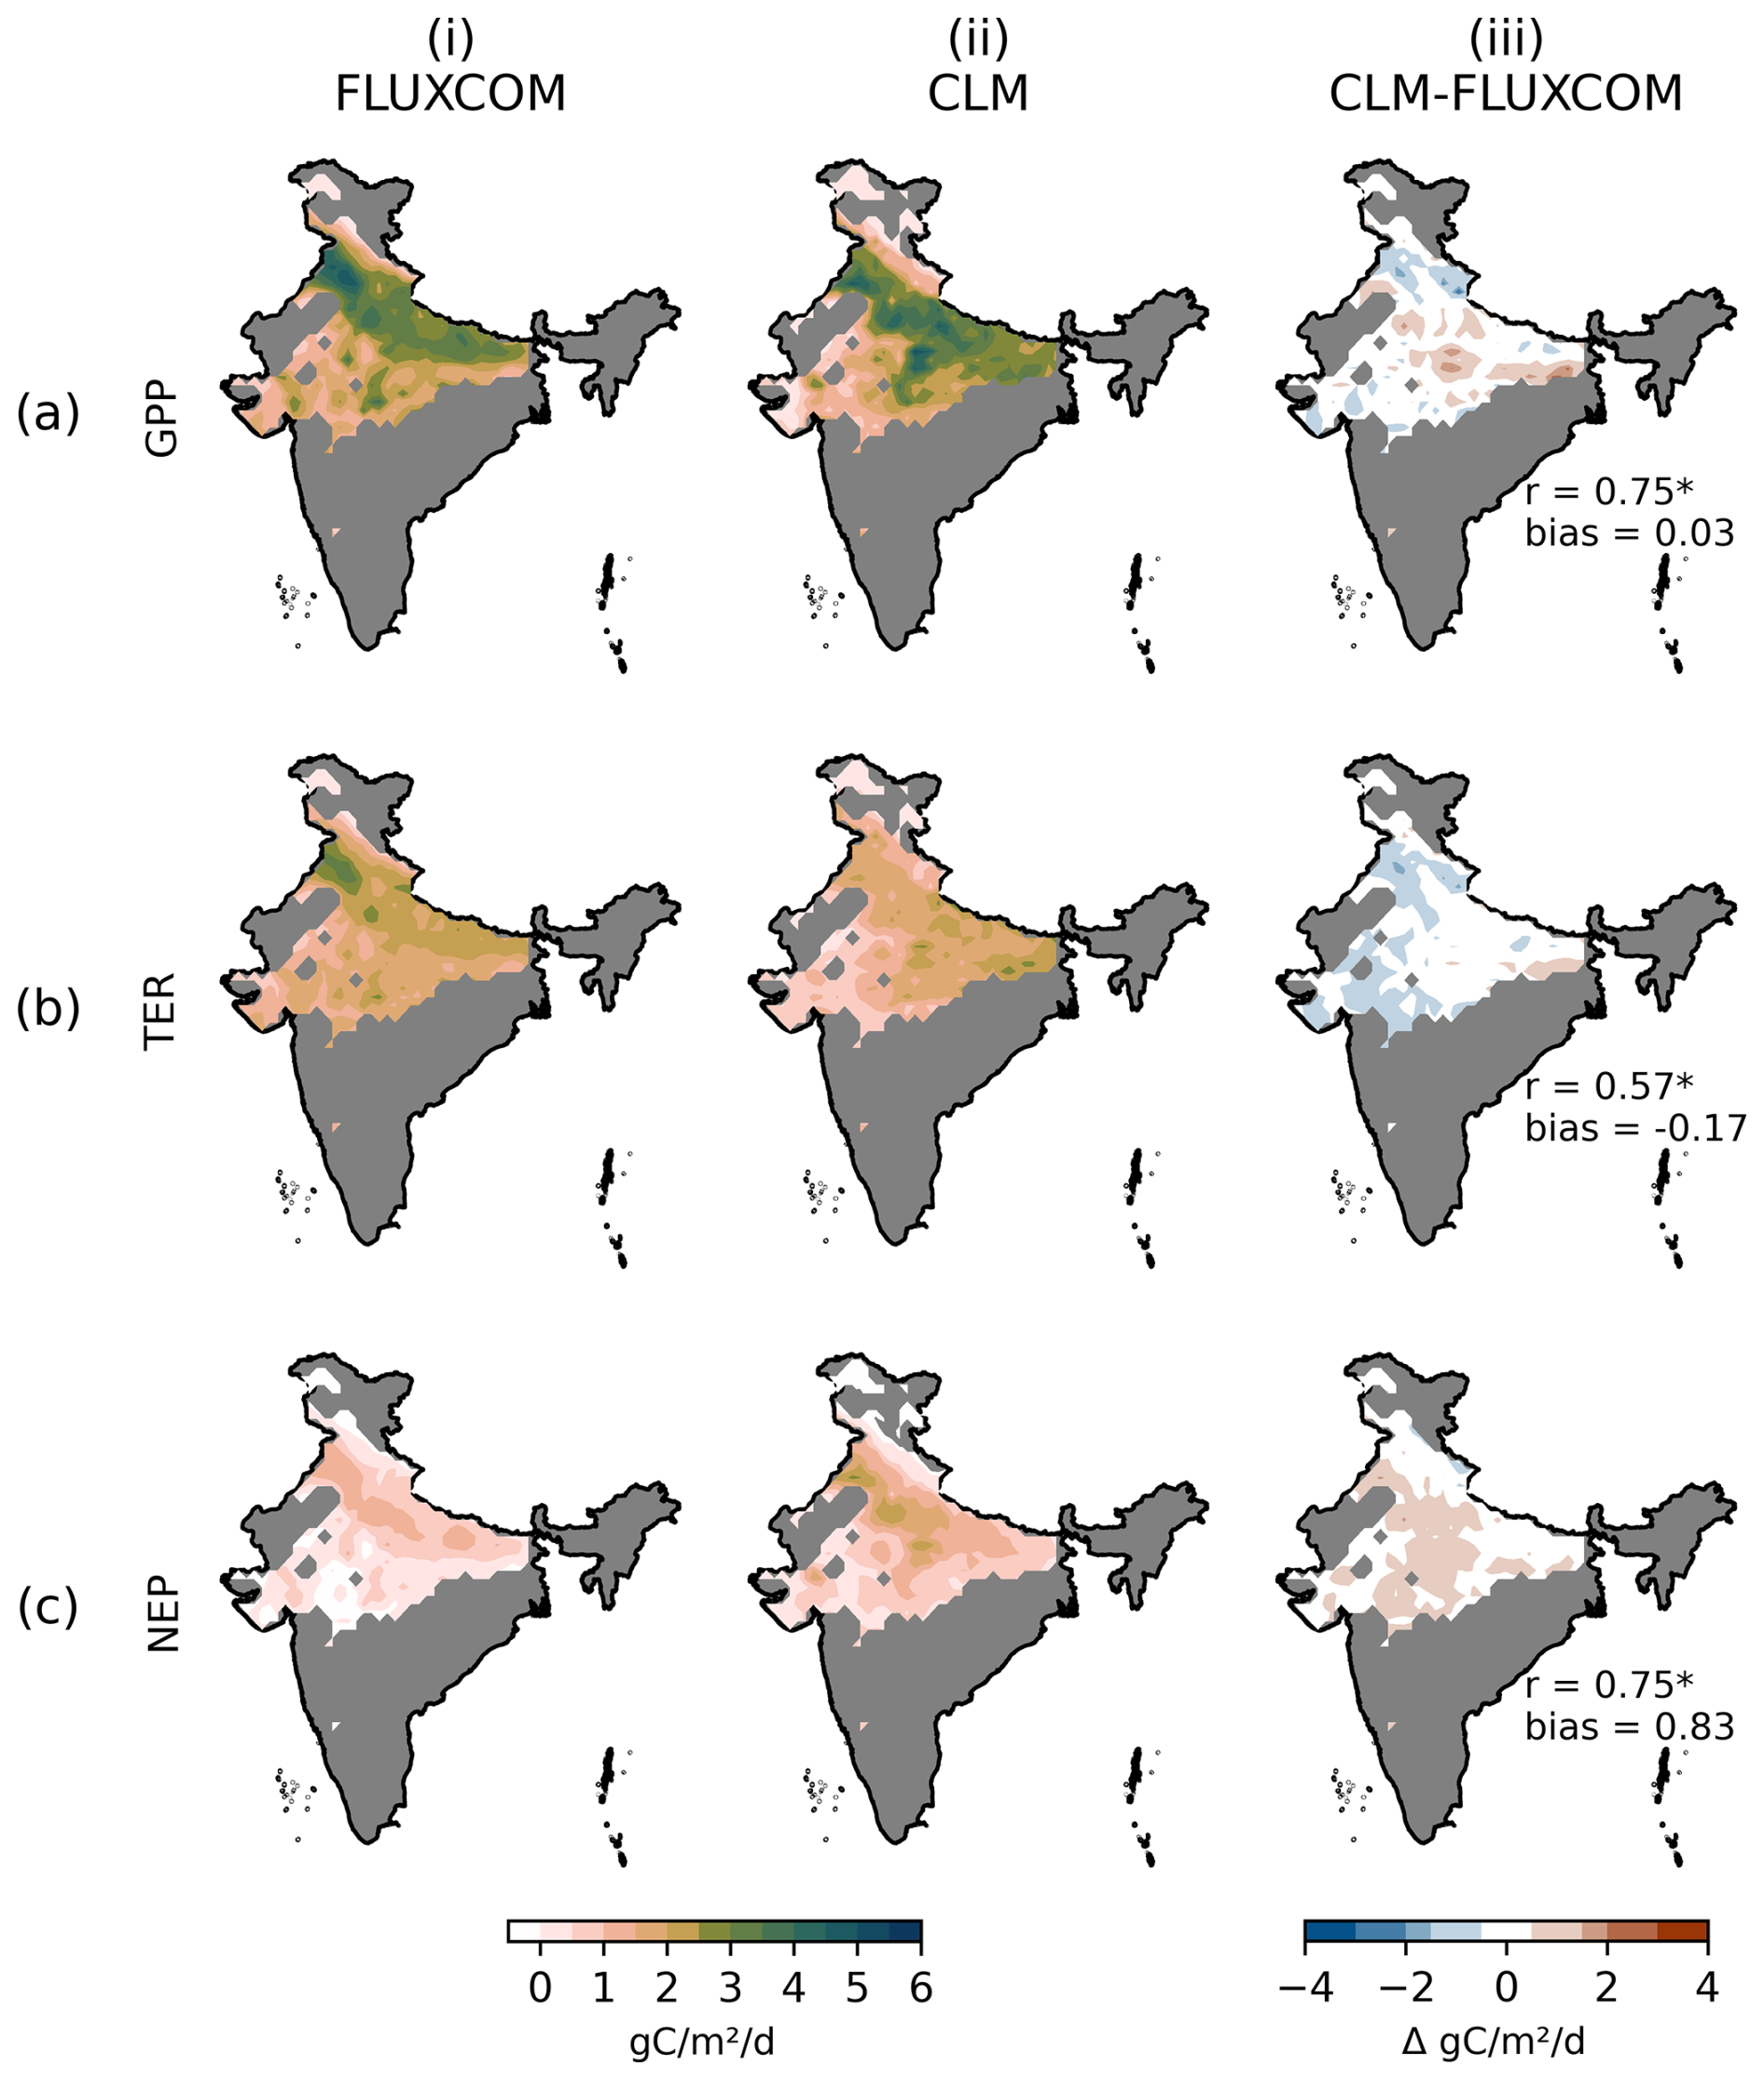
Figure 5Spatial plots of (a) GPP, (b) TER, and (c) NEP from (i) FLUXCOM, (ii) CLM5 over the Indian region, and (iii) the difference between the CLM5 and FLUXCOM data. All plots are for the wheat-growing regions (grid cells with more than 10 % of land area covered by wheat crop) and the mean of the growing season (December to March). The “*” over the r value shows a significant correlation at p<0.01.
The regional comparison between carbon fluxes simulated by CLM5 and observations from FLUXCOM reveals that the carbon fluxes simulated during the kharif season (warm and wet conditions) exhibit a larger bias than that in the rabi season (cold and dry conditions). This is clearly highlighted in Fig. S3, where NEP during kharif season is lower than the observations and GPP is consistently lower than the observations. The cause of this behaviour is not examined, but it is an important observation. The variation in seasonal carbon fluxes in CLM5 in different seasons might be caused by the changes in stomatal conductance at elevated temperatures and high vapor pressure deficit. GPP is calculated after accounting for respiration (Rd in Sect. S1), and at high temperatures and vapour pressure deficit during the warm seasons, we observe higher TER simulated by CLM5 and eventually reducing the GPP. The lower GPP and higher TER simulated by CLM5 for rice crops might also be caused due to the absence of flooded rice growth in CLM5 while most of the rice growth is in flooded conditions, especially in central India and the southern regions. And these are the regions in Fig. 5 where we observe a high bias.
3.1.3 Water and energy fluxes
Figure 3 shows that LH is generally underestimated by CLM5, with observed values extending to higher magnitudes than simulated ones, particularly in wheat, indicating weaker simulated evapotranspiration. In contrast, SH is underestimated, reflected by simulated densities in the range 0–40 W m−2 and scatter points lying below the 1:1 line, especially for wheat, suggesting excessive partitioning of available energy into sensible rather than latent heat.
Figures S4 and S5 show the latent and sensible heat over the rice and wheat growing regions. In Fig. S4, the spatial correlation of LH and SH simulated by CLM5 are high and the bias are low. In the IGP region LH is underestimated. The maximum bias in LH is observed during the late vegetation and early reproductive periods, i.e., in August and September (Fig. S6). However, considering the spatial correlation, CLM5 is simulating better in large parts (r=0.56 in September and r=0.67 in October). During the early reproductive stage, the crop reaches the maximum LAI and should have a high impact on the latent heat fluxes.
Figure S5 shows the average fluxes during the wheat growing season, i.e., December to March. We observe a strong correlation and low bias during the rabi season. However, a consistent overestimation of LH in the central India region is observed. Maximum bias in LH is observed during the early vegetation period, i.e., in December and January (Fig. S7). SH is highly correlated to the FLUXCOM data and has a low bias during all months except December (Fig. S7).
3.2 Trends in variables and impact of drivers
Figure 6 summarizes the long-term trends (1970–2014) and the relative contributions of climate, atmospheric CO2, nitrogen fertilization, and irrigation to carbon fluxes, crop physiological variables, and surface energy fluxes during the rice and wheat growing seasons.
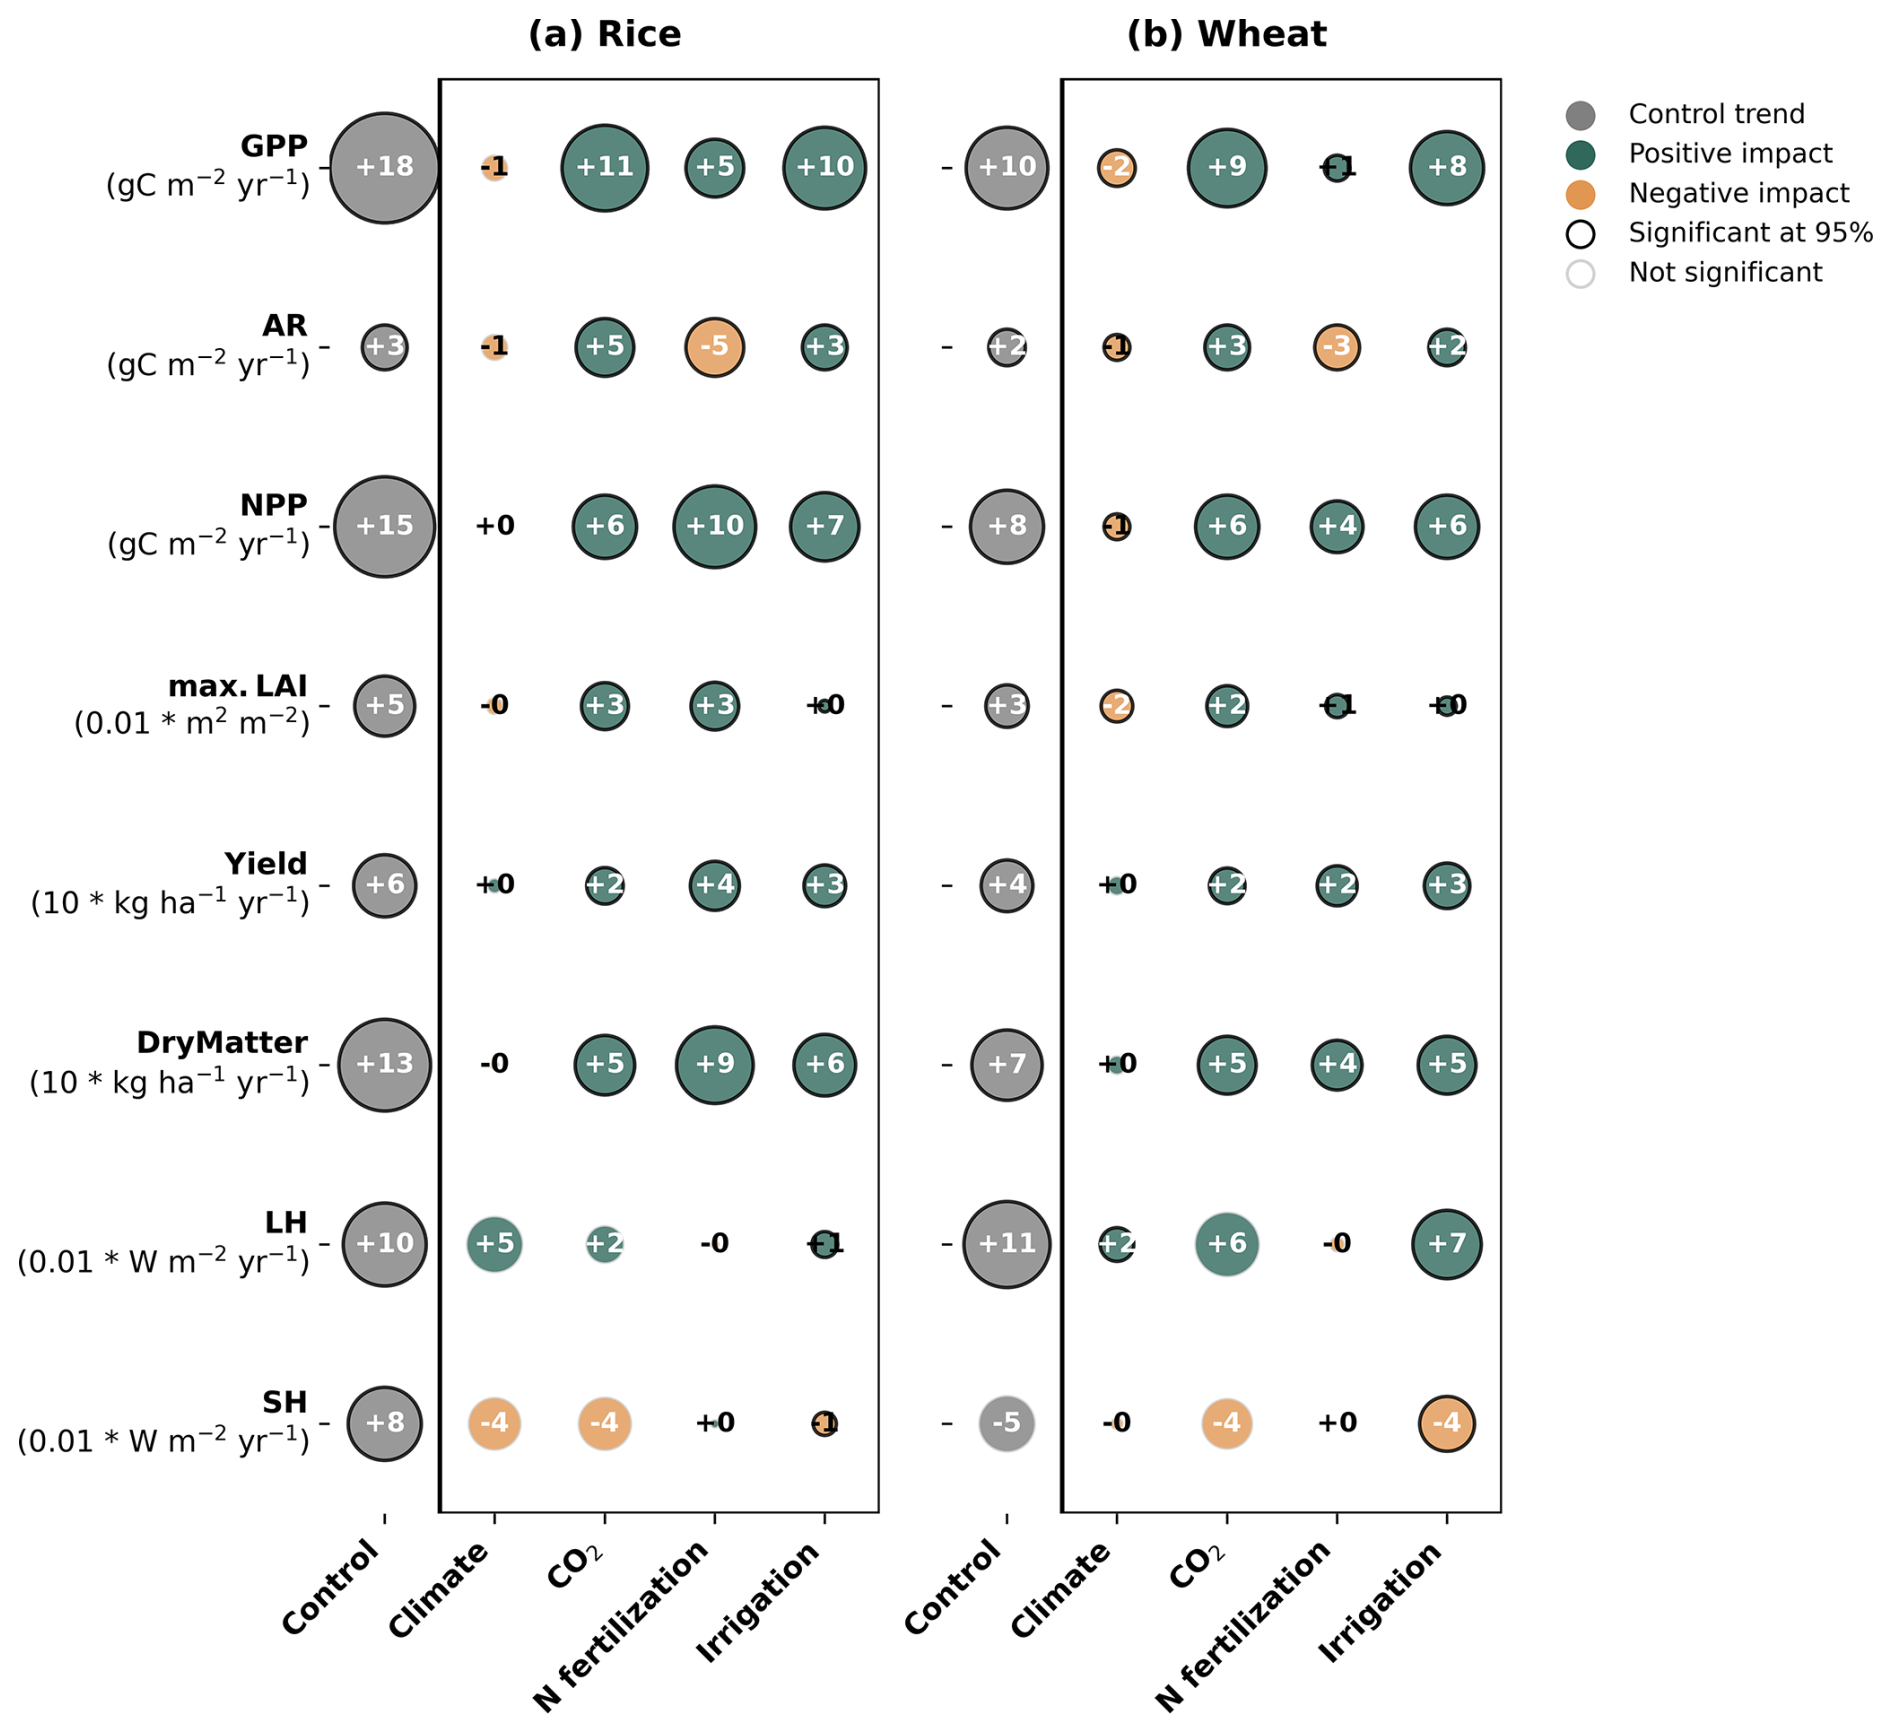
Figure 6Attribution of long-term trends in carbon fluxes, crop variables, and surface energy and water fluxes for (a) rice and (b) wheat agroecosystems. Grey bubbles show linear trends (1971–2015) in carbon fluxes (GPP, AR, and NPP), crop variables (max. LAI, yield, and dry matter), latent heat flux (LH), and sensible heat flux (SH) from the CLM5 control (CTRL) simulation. Colored bubbles within the rectangular boxes represent the contributions of individual drivers: climate, CO2 concentration, nitrogen fertilisation, and irrigation (trend of CLM5_CTRL – CLM5_Sdriver). Bubble size is proportional to the magnitude of the trend, with green and red indicating positive and negative contributions, respectively. Bubbles outlined with an edge denote trends or driver impacts that are statistically significant at the 95 % confidence level (p<0.05).
3.2.1 Carbon fluxes
Rice exhibits positive trends in GPP by 18 , AR by 3 , and NPP by 15 (Fig. 6a). Climate does not exert a statistically significant influence on these trends. Elevated CO2 contributes significantly to increasing GPP by 11 , AR by 5 , and NPP by 6 . Nitrogen fertilization significantly increases GPP by 5 and NPP by 10 while reducing AR by −5 . Irrigation contributes significantly to increases in GPP by 10 , AR by 3 , and NPP by 7 .
Figure S8 shows the spatial variation in the impact of various drivers over the rice-growing regions. The positive trend in GPP and NPP is significant (indicated by stippling) in all the rice-growing regions (Fig. S8(ai) and c(i)). CO2, nitrogen fertilization, and irrigation impact are statistically significant over the rice growing region (Fig. S8(iii), (iv), and (v)). Climate has a predominantly negative impact across the rice-growing regions but is statistically not significant (Fig. S8(ii)). A higher increase in carbon uptake during the growing season of rice is observed in central Indian region.
For wheat, trends over the period 1970–2014 are positive but smaller, with GPP increasing by 10 , AR by 2 , and NPP by 8 (Fig. 6b). Climate has a statistically significant negative impact on GPP of −2 , AR of −1 , and NPP of −1 . CO2 increases GPP by 9 , AR by 3 , and NPP by 6 . Nitrogen fertilization increases GPP by 1 and NPP by 4 and reduces AR by −3 . Irrigation significantly enhances GPP by 8 , AR by 2 , and NPP by 6 .
Figure S9 shows the spatial variation in the trend of carbon fluxes in the CTRL run and the impact of various drivers. GPP and NPP have positive trends across all the wheat-growing region, but higher in IGP region than others (Fig. S9(ai) and (ci)) and are significant at p<0.05. This positive trend is fuelled by higher CO2 and irrigation (Fig. S9(ii) and (v)). Nitrogen fertilization did not have a significant impact on GPP across all wheat growing regions, seen from scattered stippling in Fig. S9a(iv). However, nitrogen fertilization has significant positive impact on NPP across larger wheat region (Fig. S9c(iv)) due to significant and high negative impact on AR across all wheat growing regions (Fig. S9b(iv)).
Increasing atmospheric CO2 exerts the largest positive impact on annual GPP, followed by irrigation, with stronger responses in rice than wheat. In rice-growing season, CO2 has the strongest positive influence on GPP. Nitrogen fertilization also exerts the largest impact on NPP during the rice growing season, followed by irrigation and CO2, resulting in the largest increase in growing-season carbon uptake among the two crops. The increase in rice NPP over the study period reflects the combined effect of enhanced GPP and reduced AR driven by nitrogen fertilization. In wheat-growing regions, CO2 similarly dominates the increase in GPP, with irrigation as the second most important driver, while nitrogen fertilization and climate exert comparatively smaller influences on GPP. Autotrophic respiration in wheat is most strongly enhanced by CO2 and reduced by nitrogen fertilization, indicating higher respiratory losses under nitrogen-limited conditions. For wheat, increases in NPP are primarily driven by CO2 and irrigation, with smaller contributions from nitrogen fertilization and a significant negative contribution from climate. As a result, the increase in NPP during the winter wheat growing season is smaller than that observed for summer rice, reflecting both climatic constraints and a weaker response of carbon uptake. Overall, climate shows a significant negative impact during the wheat growing season.
3.2.2 Crop physiological variables
Trends in crop physiological variables during the rice growing season show increases in maximum LAI by 0.054 , yield by 58 , and dry matter by 126 (Fig. 6a). CO2 contributes 0.033 , 20 , and 53 , respectively, while nitrogen fertilization contributes 0.034 , 36 , and 88 . Irrigation contributes 0.002 , 26 , and 57 . Climate impacts on these variables are not statistically significant.
Figure S10 shows the spatial variation in crop physiology of rice. Higher CO2 led to increased LAI in rice crops across the rice growing region (Fig. S8a(iii)). However, the impact on yield is not significant in all rice-growing regions (Fig. S10bii). The rice yield has no significant impact due to higher CO2 in the southern regions. In comparison, the rice yield has a significant positive impact due to higher CO2 over the IGP region. Human management practices, fertilization, and irrigation have a positive impact on crop phenology across rice-growing regions. The impact on LAI due to irrigation is inconsistent across rice-growing regions (Fig. S10av).
For wheat, growing-season trends in maximum LAI is 0.027 , yield is 40 , and dry matter is 74 (Fig. 6b). Climate reduces maximum LAI by −0.015 but has no significant effect on yield or dry matter. CO2 increases LAI by 0.025 , yield by 19 , and dry matter by 50 . Nitrogen fertilization increases LAI by 0.008 , yield by 24 , and dry matter by 37 , while irrigation increases LAI by 0.005 , yield by 31 , and dry matter by 50 .
The spatial variation of crop physiology trends and the impact of various drivers over the wheat-growing regions shows that crop physiology has a significant positive trend across the wheat-growing region (Fig. S11(i)), and climate has a significant negative impact on the LAI of wheat across large parts of the wheat-growing regions (Fig. S11a(ii)). Climate showed no significant impact on yield across the wheat-growing region (Fig. S11b(ii)). CO2, nitrogen fertilization, and irrigation all have a positive impact on crop phenology of wheat and is statistically significant in large parts of the wheat growing region (Fig. S11).
For crop physiological variables, rice shows strong positive trends driven primarily by increasing atmospheric CO2 and nitrogen fertilization, with a comparatively small contribution from irrigation. The magnitude of the individual trends associated with CO2, and nitrogen fertilization closely approaches the overall trend in the control simulation, indicating a strong coupling between the carbon and nitrogen cycles in rice. Among the investigated drivers, nitrogen fertilization exerts the largest influence on rice yield and total dry matter accumulation during the growing season. In wheat, CO2 has the strongest positive impact on maximum LAI during the growing season. Although climate imposes a large and statistically significant negative effect on wheat maximum LAI, the combined positive contributions from CO2, nitrogen fertilization, and irrigation result in a net positive trend. While CO2 primarily controls change in LAI, agricultural management practices, particularly nitrogen fertilization and irrigation, have a significant positive impact on wheat yield and dry matter accumulation.
3.2.3 Water and energy fluxes
During the rice growing season, LH increases by 0.103 and SH decreases by −0.080 , with irrigation being the only driver exerting a significant influence on LH with +0.010 and SH with −0.008 (Fig. 6). For wheat, LH increases by 0.111 and SH decreases by −0.047 , with irrigation again being the sole significant driver of LH with +0.070 and SH with −0.045 .
3.3 Annual yield
The annual country-scale wheat and rice yield simulated by CLM5 in 1970 was 1.11 and 1.3 t ha−1, respectively. The wheat and rice yield reported by FAO for the same year is 1.2 and 1.6 t ha−1. The rice yield simulated by CLM5 is lower than FAO data in the year 1970. However, for the year 2014 CLM5 simulated 2.71 and 3.63 t ha−1 for wheat and rice, respectively, while FAO estimates are 3.14 and 3.57 t ha−1. CLM5 is simulating annual country scale yield accurately for two major Indian crops, and the CLM5 model can be used for future climate impact studies with high confidence at a regional scale.
The impact of management practices on yield is significant (Fig. 7). Irrigation has a significant impact on wheat yield. The average wheat yield simulated in the CTRL experiment over the period 2010–2014 is 2.74 t ha−1, while the simulation with no irrigation has an average yield of 0.64 t ha−1 for the same period. Similarly, the lack of nitrogen fertilization decreased the mean yield during the same period to 1.26 t ha−1. In the case of rice crops, fertilization has a more significant impact than irrigation. Therefore, for a wheat crop grown in cold and dry conditions, irrigation is the dominant factor, and for rice grown in warm and wet conditions, nitrogen fertilisation is the dominant management factor.
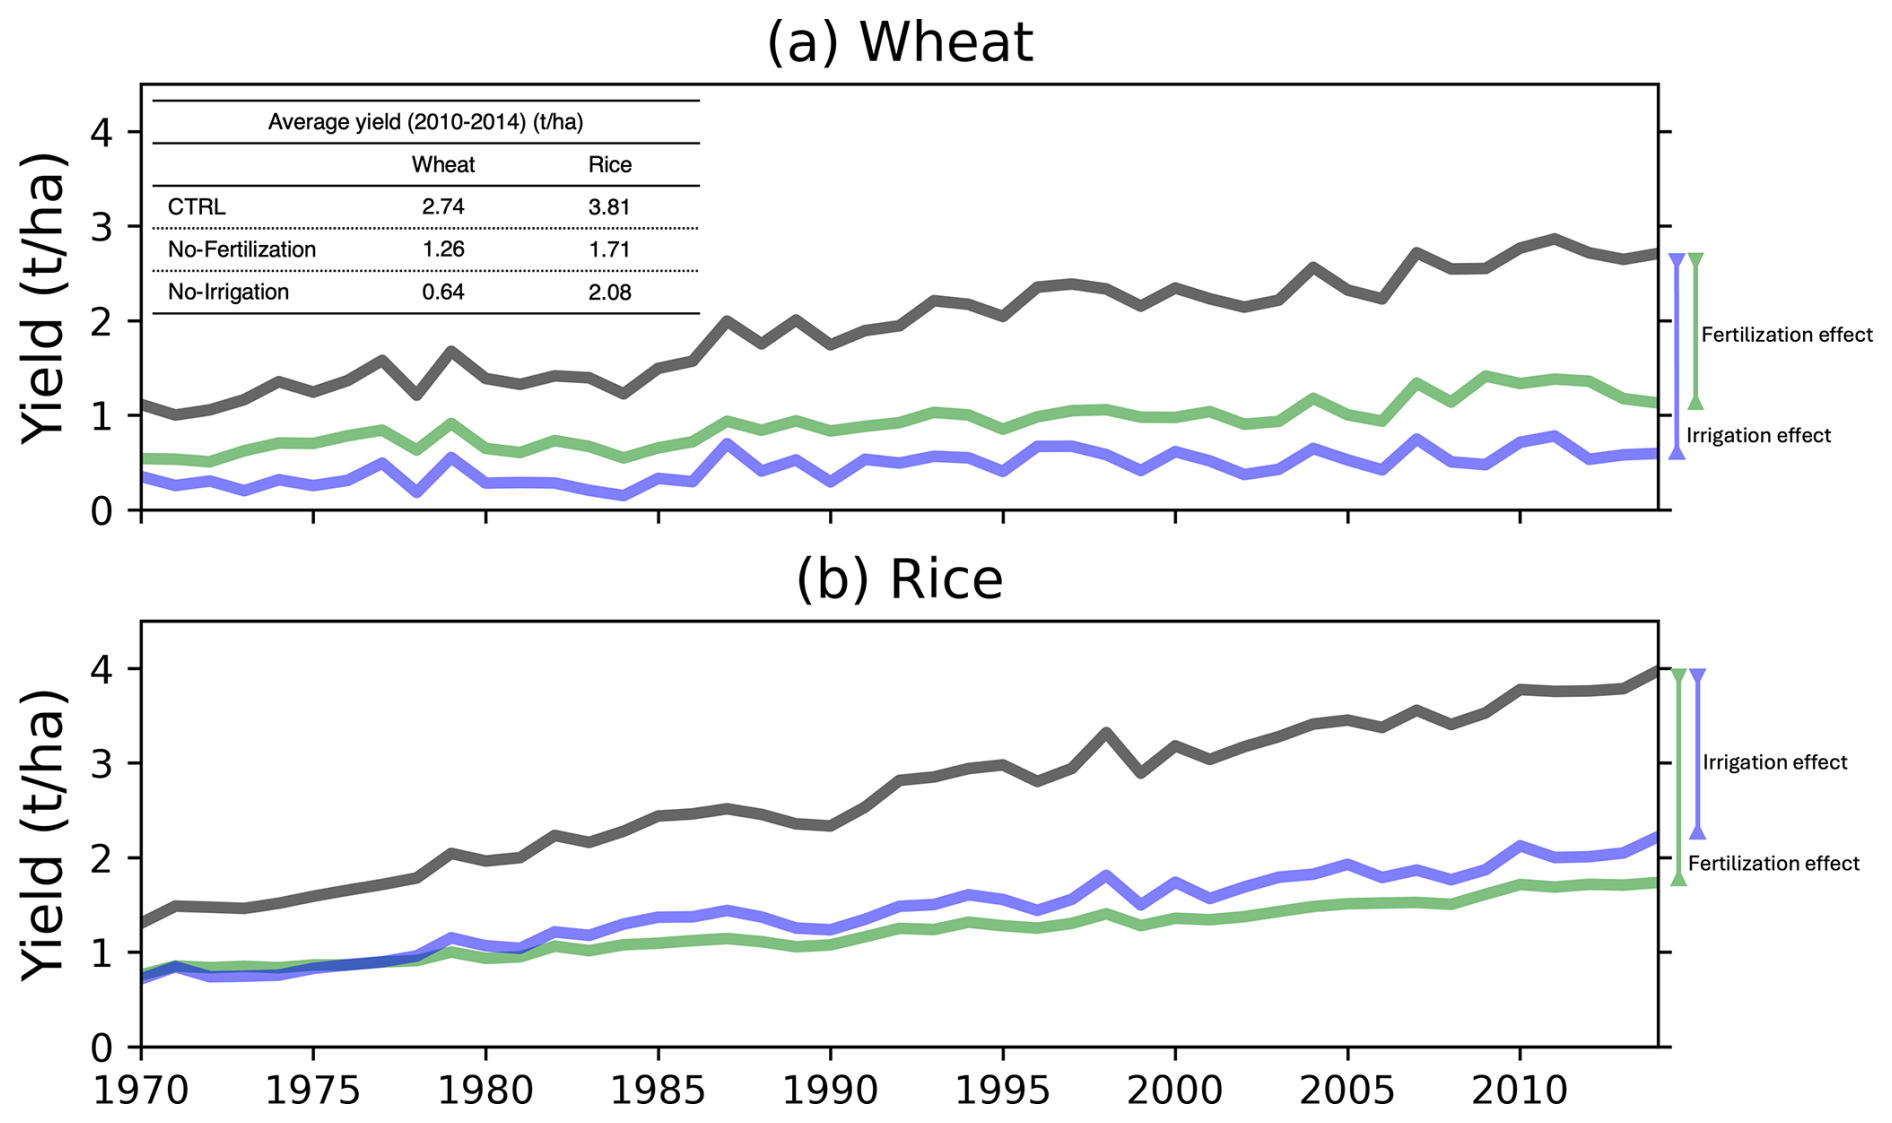
Figure 7Impact of management drivers on crop yield of (a) wheat and (b) rice. Inlet table shows the average yield in the period 2010–2014 for wheat and rice in the CLM5_CTRL simulation, CLM5_SNFert, and CLM5_SIrrig.
3.4 Comparing seasonal carbon fluxes against global studies
CLM5 simulated cumulative GPP for kharif rice from 2000 to 2014 is 1528.3 ± 561 g C m−2. This is comparable to other site scale observations (Table S1). For example, at a site in India (20°27′ N, 85°56′ E) GPP is 929 and 1221 g C m−2 (Bhattacharya et al., 2013), at a site in the Philippines (14°14′ N, 121°26′ E) it is 1192 and 1464 g C m−2 (Alberto et al., 2009), and Bangladesh (24°73′ N, 90°42′ E) is 1312 and 1574 g C m−2 (Hossen et al., 2011). A site in India (11°00′ N, 79°28′ E) is 2355 and 2598 g C m−2 for the three rice crop periods in a year (Oo et al., 2023). All studies mentioned above, except Oo et al. (2023), had two growing seasons: wet and dry. CLM5 simulations also include rainfed and irrigated rice crops, and therefore, the annual simulated GPP is in the same range as all other studies, while it is lower than the GPP estimates by Oo et al. (2023). Bhattacharya et al. (2013) studied the impact of fertilization on carbon fluxes over rice fields. They observed that fertilization usage had increased the GPP by 68.9 %. In comparison, our study simulates an increase in GPP by 68.4 % to 78.9 % from using nitrogen fertilization from 2000 to 2014.
CLM5 simulated cumulative GPP for rabi wheat from 2000 to 2014 is 862.6 ± 438.6 g C m−2. This is comparable with site scale observations. For example, rabi wheat cumulative GPP estimates at IARI (28°40′ N, 77°12′ E) is 949.68 6 g C m−2 (Reddy et al., 2023) and 888 g C m−2 (Kumar et al., 2021), at Saharanpur (29°52′ N and 77°34′ E) is 1024 g C m−2 (Patel et al., 2021). CLM5 simulates the cumulative GPP reasonably well during the growing season of wheat in Indian conditions (Table S1). The carbon fluxes over a wheat growing season in Germany (50°52′ N, 6°26′ E) are 1304 and 1067 g C m−2 (Schmidt et al., 2012), and in China (32°33′ N, 116°47′ E), are 987 and 966 g C m−2 (Chen et al., 2015). Higher seasonal cumulative fluxes in Germany and China are due to the longer growing seasons observed in these regions.
ARGPP ratio has reduced from 0.62 in the 1970–1975 period to 0.46 in 2010–2014. During the same period, nitrogen fertilization increased rapidly, leading to lower respiration losses, evident from impact of nitrogen fertilization on autotrophic respiration. CLM5 limits the maintenance respiration if high nitrogen is present in the leaves.
3.5 Comparing water and energy fluxes against global studies
The evapotranspiration simulated by CLM5 during the kharif season from 2000 to 2014 is 558.82 mm. The observations from a site in India (11°00′ N, 79°28′ E) during the kharif season are 529 and 392 mm (Oo et al., 2023). The lower evapotranspiration in the second year is due to the lack of data for the last 27 d of the rice growing season (Oo et al., 2023). A study by Hossen et al. (2011) focusing on rice crops in Bangladesh (24°43′ N, 90°25′ E) reported seasonal evapotranspiration of 370 and 307 mm when measured from transplanting to harvest. The lower evapotranspiration values are due to the consideration of transplanting to harvest instead of sowing to harvest. The CLM5 simulation of seasonal evapotranspiration is comparable to site-scale observations. The evapotranspiration simulated by CLM5 during the rabi season from 2000 to 2014 is 277.92 mm.
Irrigation in the wheat growing season (rabi season) has a significant impact on evapotranspiration. Since CLM5 is now performing well in estimating the water and energy fluxes and irrigation is having a significant impact, future studies should examine the impact of varying irrigation levels on the land-atmosphere feedback, similar to the study by Mathur and AchutaRao (2020).
The current study aimed to understand the trends in crop physiological parameters and terrestrial fluxes over major Indian agroecosystems spanning 45 years from 1970 to 2014. This study used the best performing CLM5 model from Reddy et al. (2025) to, first, evaluate the performance of CLM5 in simulating crop physiological parameters and various land fluxes (e.g., energy, carbon, and water fluxes) over two major Indian agroecosystems- wheat and rice. Reanalysis data and in-situ observations are used to perform a comprehensive evaluation of the model and investigate the biases. Later, numerical experiments are conducted to investigate the impact of two natural and two agricultural management drivers – atmospheric CO2, climate, nitrogen fertilization and irrigation.
CLM5 simulated the crop physiology and fluxes with realistic seasonality (Figs. S2 and S3 and Reddy et al., 2025) and low bias. Although a high bias in yield is observed at site scale in this study, the country scale estimates of crop yield against FAO data highlights that CLM5 captured the annual variability with a low bias (Sect. 3.1.1). Therefore, providing confidence in CLM5 for estimating climate impact on regional crop yields. CLM5 captures the seasonality in carbon fluxes well with a Pearsons correlation of 0.65. Regional scale carbon flux evaluation against the FLUXCOM data reveals that the carbon fluxes simulated during the kharif season (warm and wet conditions) exhibit a larger bias than the fluxes in rabi season (cold and dry conditions) (Sect. 3.1.2). Comparing the water and energy fluxes also reveals a similar trend, where high bias is observed in latent heat fluxes during the warm and wet seasons compared to those in the cold and dry season (Sect. 3.1.3). The contrasting simulation of carbon and energy fluxes in different seasons highlights the need to investigate the stomatal conductance module in CLM5. Sensitivity experiments can be conducted to understand the role of stomatal conductance in simulating a high bias in carbon, water, and energy fluxes during warm and wet seasons in the Indian region. Overall, the evaluation of terrestrial fluxes shows that while CLM5 captures the qualitative variability of carbon and energy fluxes, it exhibits systematic biases in respiration and surface energy partitioning, which propagate into errors in NEP and highlight remaining challenges in representing crop–atmosphere exchanges in the Indian biosphere.
The underestimation of GPP and overestimation of TER over the rice-growing regions during the kharif season mainly stems from shortcomings in land management practices for crops. Rice is grown in flooded fields which tend to have lower GPP and TER. CLM5 does not simulate rice in flooded conditions. Additionally, rice is grown multiple times in a year in India, especially in the central and southern regions of India, which is absent in CLM5 mainly due to the lack of crop maps that represent the multiple cropping followed in India. Although a few studies have reported multiple rice cropping maps (Zhao et al., 2024), they are limited to one or two years, and we do not have time varying maps to conduct transient model simulations. It is important that future research focuses on generating multiple-cropping maps for regions like India because rice, for example, grown in multiple seasons has a large impact on the terrestrial fluxes (Oo et al., 2023).
The vegetation physiology and phenology substantially affect the land surface processes and influences the local to global climates through interactions between the land and atmosphere. Although CLM5 has few limitations, it performs well in capturing the seasonal patterns and magnitude of carbon and water fluxes over the Indian agroecosystems. A future study can focus on estimating the terrestrial fluxes in the near future and end century climate in Indian agroecosystems using the reasonably well performing CLM5 model. The climate change impact is necessary to understand because the terrestrial ecosystems are taking up lower carbon in a warming climate (Liu et al., 2024; Ke et al., 2024) and it is essential to identify the tipping points of various ecosystems as these will have drastic impact on the world.
More modeling studies such as the current one are crucial in understanding and reducing the uncertainty in simulated terrestrial fluxes of various ecosystems using limited observation data. Increasingly, studies are identifying lower carbon uptake by terrestrial ecosystems using observations. Models are failing to replicate the same and to worsen the situation, models are simulating with large uncertainties (Friedlingstein et al., 2023). Studies such as the current one will help in identifying the regions and processes responsible for model uncertainty. Adaptation of recent developments in terrestrial ecosystem representations in land models such as Eco-Evolutionary Optimality theory (Harrison et al., 2021; Zou et al., 2023) should be investigated and implemented in various land models such as CLM5. The adaptation of new theories might reduce the high biases in water, energy and carbon fluxes observed in different seasons. The shift to new theories is necessary as they use a smaller number of parameters for simulating terrestrial fluxes and are less sensitive to uncertainties in input data (Zou et al., 2023).
The site-scale data used in the study are available in Varma et al. (2024, https://doi.org/10.1594/PANGAEA.964634). The model output data for various experiments of the study and the observational data are available at https://doi.org/10.5281/zenodo.15291023 (Reddy and Baidya Roy, 2025). Python codes used to produce the figures in the manuscript are also available in the Zenodo repository.
The supplement related to this article is available online at https://doi.org/10.5194/bg-23-1365-2026-supplement.
KNR and SBR conceptualised the study. KNR did the model simulations and the analysis. KNR wrote the manuscript. SBR reviewed and edited the manuscript.
The contact author has declared that neither of the authors has any competing interests.
Publisher's note: Copernicus Publications remains neutral with regard to jurisdictional claims made in the text, published maps, institutional affiliations, or any other geographical representation in this paper. The authors bear the ultimate responsibility for providing appropriate place names. Views expressed in the text are those of the authors and do not necessarily reflect the views of the publisher.
The authors thank the IIT Delhi HPC facility for computational resources. Scientific color maps (Crameri, 2018) are used in this study to prevent visual distortion of the data and exclusion of readers with color-vision deficiencies (Crameri et al., 2020).
This paper was edited by Akihiko Ito and reviewed by two anonymous referees.
Alberto, M. C. R., Wassmann, R., Hirano, T., Miyata, A., Kumar, A., Padre, A., and Amante, M.: CO2/heat fluxes in rice fields: Comparative assessment of flooded and non-flooded fields in the Philippines, Agr. Forest Meteorol., 149, 1737–1750, https://doi.org/10.1016/j.agrformet.2009.06.003, 2009.
ASG-2023: Agricultural Statistics at a Glance 2023, Division of Economics, Statistics and Evaluation, Department of Agriculture and Farmers Welfare, Ministry of Agriculture and Farmers Welfare, Government of India, https://github.com/KNR8070/Biogeosciences_manuscript-/blob/main/Agricultural-Statistics-at-a-Glance-2023.pdf (last access: February 2026), 2024.
Badger, A. M. and Dirmeyer, P. A.: Climate response to Amazon forest replacement by heterogeneous crop cover, Hydrol. Earth Syst. Sci., 19, 4547–4557, https://doi.org/10.5194/hess-19-4547-2015, 2015.
Bhattacharya, P., Neogi, S., Roy, K. S., Dash, P. K., Tripathi, R., and Rao, K. S.: Net ecosystem CO2 exchange and carbon cycling in tropical lowland flooded rice ecosystem, Nutr. Cycl. Agroecosyst., 95, 133–144, https://doi.org/10.1007/s10705-013-9553-1, 2013.
Boas, T., Bogena, H., Grünwald, T., Heinesch, B., Ryu, D., Schmidt, M., Vereecken, H., Western, A., and Hendricks Franssen, H.-J.: Improving the representation of cropland sites in the Community Land Model (CLM) version 5.0, Geosci. Model Dev., 14, 573–601, https://doi.org/10.5194/gmd-14-573-2021, 2021.
Boas, T., Bogena, H. R., Ryu, D., Vereecken, H., Western, A., and Hendricks Franssen, H.-J.: Seasonal soil moisture and crop yield prediction with fifth-generation seasonal forecasting system (SEAS5) long-range meteorological forecasts in a land surface modelling approach, Hydrol. Earth Syst. Sci., 27, 3143–3167, https://doi.org/10.5194/hess-27-3143-2023, 2023.
Bonan, G. B. and Doney, S. C.: Climate, ecosystems, and planetary futures: The challenge to predict life in Earth system models, Science, 359, eaam8328, https://doi.org/10.1126/science.aam8328, 2018.
Chen, C., Dan, L. I., Zhiqiu, G., Tang, J., Xiaofeng, G., Linlin, W., and Bingcheng, W.: Seasonal and interannual variations of carbon exchange over a rice-wheat rotation system on the north china plain, Advan. Atmos. Sci., 32, 1365–1380, https://doi.org/10.1007/s00376-015-4253-1, 2015.
Cheng, Y., Huang, M., Zhu, B., Bisht, G., Zhou, T., Liu, Y., Song, F., and He, X.: Validation of the Community Land Model Version 5 Over the Contiguous United States (CONUS) Using In-Situ and Remote Sensing Data Sets, J. Geophys. Res.-Atmos., 126, 1–27, https://doi.org/10.1029/2020JD033539, 2021.
Chenu, K., Porter, J. R., Martre, P., Basso, B., Chapman, S. C., Ewert, F., Bindi, M., and Asseng, S.: Contribution of crop models to adaptation in wheat, Trends Plant Sci., 22, 472–490, https://doi.org/10.1016/j.tplants.2017.02.003, 2017.
Collier, N., Hoffman, F. M., Lawrence, D. M., Keppel-Aleks, G., Koven, C. D., Riley, W. J., Mu, M., and Randerson, J. T.: The International Land Model Benchmarking (ILAMB) System: Design, Theory, and Implementation, J. Adv. Model. Earth Sy., 10, 2731–2754, https://doi.org/10.1029/2018MS001354, 2018.
Crameri, F.: Scientific color maps, Zenodo, https://doi.org/10.5281/zenodo.1243862, 2018.
Crameri, F., Shephard, G. E., and Heron, P. J.: The misuse of color in science communication, Nat. Commun., 11, 5444, https://doi.org/10.1038/s41467-020-19160-7, 2020.
Denager, T., Sonnenborg, T. O., Looms, M. C., Bogena, H., and Jensen, K. H.: Point-scale multi-objective calibration of the Community Land Model (version 5.0) using in situ observations of water and energy fluxes and variables, Hydrol. Earth Syst. Sci., 27, 2827–2845, https://doi.org/10.5194/hess-27-2827-2023, 2023.
FAO: FAOSTAT statistical database: Production, https://www.fao.org/faostat/en/#data (last access: 20 October 2024), 2022.
Fisher, R. A. and Koven, C. D.: Perspectives on the Future of Land Surface Models and the Challenges of Representing Complex Terrestrial Systems, J. Adv. Model. Earth Sy., 12, e2018MS001453, https://doi.org/10.1029/2018ms001453, 2020.
Friedlingstein, P., O'Sullivan, M., Jones, M. W., Andrew, R. M., Bakker, D. C. E., Hauck, J., Landschützer, P., Le Quéré, C., Luijkx, I. T., Peters, G. P., Peters, W., Pongratz, J., Schwingshackl, C., Sitch, S., Canadell, J. G., Ciais, P., Jackson, R. B., Alin, S. R., Anthoni, P., Barbero, L., Bates, N. R., Becker, M., Bellouin, N., Decharme, B., Bopp, L., Brasika, I. B. M., Cadule, P., Chamberlain, M. A., Chandra, N., Chau, T.-T.-T., Chevallier, F., Chini, L. P., Cronin, M., Dou, X., Enyo, K., Evans, W., Falk, S., Feely, R. A., Feng, L., Ford, D. J., Gasser, T., Ghattas, J., Gkritzalis, T., Grassi, G., Gregor, L., Gruber, N., Gürses, Ö., Harris, I., Hefner, M., Heinke, J., Houghton, R. A., Hurtt, G. C., Iida, Y., Ilyina, T., Jacobson, A. R., Jain, A., Jarníková, T., Jersild, A., Jiang, F., Jin, Z., Joos, F., Kato, E., Keeling, R. F., Kennedy, D., Klein Goldewijk, K., Knauer, J., Korsbakken, J. I., Körtzinger, A., Lan, X., Lefèvre, N., Li, H., Liu, J., Liu, Z., Ma, L., Marland, G., Mayot, N., McGuire, P. C., McKinley, G. A., Meyer, G., Morgan, E. J., Munro, D. R., Nakaoka, S.-I., Niwa, Y., O'Brien, K. M., Olsen, A., Omar, A. M., Ono, T., Paulsen, M., Pierrot, D., Pocock, K., Poulter, B., Powis, C. M., Rehder, G., Resplandy, L., Robertson, E., Rödenbeck, C., Rosan, T. M., Schwinger, J., Séférian, R., Smallman, T. L., Smith, S. M., Sospedra-Alfonso, R., Sun, Q., Sutton, A. J., Sweeney, C., Takao, S., Tans, P. P., Tian, H., Tilbrook, B., Tsujino, H., Tubiello, F., van der Werf, G. R., van Ooijen, E., Wanninkhof, R., Watanabe, M., Wimart-Rousseau, C., Yang, D., Yang, X., Yuan, W., Yue, X., Zaehle, S., Zeng, J., and Zheng, B.: Global Carbon Budget 2023, Earth Syst. Sci. Data, 15, 5301–5369, https://doi.org/10.5194/essd-15-5301-2023, 2023.
Gahlot, S., Lin, T.-S., Jain, A. K., Baidya Roy, S., Sehgal, V. K., and Dhakar, R.: Impact of environmental changes and land management practices on wheat production in India, Earth Syst. Dynam., 11, 641–652, https://doi.org/10.5194/esd-11-641-2020, 2020.
Harrison, S. P., Cramer, W., Franklin, O., Prentice, I. C., Wang, H., Brännström, Å., de Boer, H., Dieckmann, U., Joshi, J., Keenan, T. F., Lavergne, A., Manzoni, S., Mengoli, G., Morfopoulos, C., Peñuelas, J., Pietsch, S., Rebel, K. T., Ryu, Y., Smith, N. G., Stocker, B. D., and Wright, I. J.: Eco-evolutionary optimality as a means to improve vegetation and land-surface models, New Phytol., 231, 2125–2141, https://doi.org/10.1111/nph.17558, 2021.
Hossen, M. S., Mano, M., Miyata, A., Baten, M. A., and Hiyama, T.: Seasonality of ecosystem respiration in a double-cropping paddy field in Bangladesh, Biogeosciences Discuss., 8, 8693–8721, https://doi.org/10.5194/bgd-8-8693-2011, 2011.
Hussain, M. M. and Mahmud, I.: pyMannKendall: a python package for non-parametric Mann Kendall family of trend tests, J. Open Source Softw., 4, 1556, https://doi.org/10.21105/joss.01556, 2019.
Ingwersen, J., Högy, P., Wizemann, H. D., Warrach-Sagi, K., and Streck, T.: Coupling the land surface model Noah-MP with the generic crop growth model Gecros: Model description, calibration and validation, Agr. Forest Meteorol., 262, 322–339, https://doi.org/10.1016/j.agrformet.2018.06.023, 2018.
Jung, M., Koirala, S., Weber, U., Ichii, K., Gans, F., Camps-Valls, G., Papale, D., Schwalm, C., Tramontana, G., and Reichstein, M.: The FLUXCOM ensemble of global land-atmosphere energy fluxes, Sci. Data, 6, https://doi.org/10.1038/s41597-019-0076-8, 2019.
Ke, P., Ciais, P., Sitch, S., Li, W., Bastos, A., Liu, Z., Xu, Y., Gui, X., Bian, J., Goll, D. S., Xi, Y., Li, W., O'Sullivan, M., de Souza, J. G., Friedlingstein, P., and Chevallier, F.: Low latency carbon budget analysis reveals a large decline of the land carbon sink in 2023, Atmospheric and Oceanic Physics, https://doi.org/10.48550/arXiv.2407.12447, 2024.
Kumar, A., Bhatia, A., Sehgal, V. K., Tomer, R., Jain, N., and Pathak, H.: Net Ecosystem Exchange of Carbon Dioxide in Rice-Spring Wheat System of Northwestern Indo-Gangetic Plains, Land, 10, 701, https://doi.org/10.3390/land10070701, 2021.
Lawrence, D. M., Hurtt, G. C., Arneth, A., Brovkin, V., Calvin, K. V., Jones, A. D., Jones, C. D., Lawrence, P. J., de Noblet-Ducoudré, N., Pongratz, J., Seneviratne, S. I., and Shevliakova, E.: The Land Use Model Intercomparison Project (LUMIP) contribution to CMIP6: rationale and experimental design, Geosci. Model Dev., 9, 2973–2998, https://doi.org/10.5194/gmd-9-2973-2016, 2016.
Lawrence, D. M., Fisher, R., Koven, C., Oleson, K., Svenson, S., Vertenstein, M. (coordinating lead authors), Andre, B., Bonan, G., Ghimire, B., van Kampenhout, L., Kennedy, D., Kluzek, E., Knox, R., Lawrence, P., Li, F., Li, H., Lombardozzi, D., Lu, Y., Perket, J., Riley, W., Sacks, W., Shi, M., Wieder, W., Xu, C. (lead authors), Ali, A., Badger, A., Bisht, G., Broxton, P., Brunke, M., Buzan, J., Clark, M., Craig, T., Dahlin, K., Drewniak, B., Emmons, L., Fisher, J., Flanner, M., Gentine, P., Lenaerts, J., Levis, S., Leung, L. R., Lipscomb, W., Pelletier, J., Ricciuto, D., M., Sanderson, B., Shuman, J., Slater, A., Subin, Z., Tang, J., Tawfik, A., Thomas, Q., Tilmes, S., Vitt, F., and Zeng, X.: Technical Description of version 5.0 of the Community Land Model (CLM), Natl. Cent. Atmospheric Res. (NCAR), http://www.cesm.ucar.edu/models/cesm2/land/CLM50_Tech_Note.pdf (last access: 8 July 2024), 2018.
Lawrence, P., Lawrence, D. M., Hurtt, G. C., and Calvin, K. V.: Advancing our understanding of the impacts of historic and projected land use in the Earth System: The Land Use Model Intercomparison Project (LUMIP), AGU Fall Meeting 2019, San Francisco, USA, 9–13 December 2019, abstract: GC23B-01, https://ui.adsabs.harvard.edu/abs/2019AGUFMGC23B..01L/abstract (last access: 18 February 2026), 2019.
Levis, S., Badger, A., Drewniak, B., Nevison, C., and Ren, X.: CLMcrop yields and water requirements: avoided impacts by choosing RCP 4.5 over 8.5, Clim. Change, 146, 501–515, https://doi.org/10.1007/s10584-016-1654-9, 2016.
Liu, J., Baker, D., Basu, S., Bowman, K., Byrne, B., Chevallier, F., He, W., Jiang, F., Johnson, M. S., Kubar, T. L., and Li, X.: The reduced net carbon uptake over Northern Hemisphere land causes the close-to-normal CO2 growth rate in 2021 La Niña, Science Advances, 10, eadl2201, https://doi.org/10.1126/sciadv.adl2201, 2024.
Liu, W., Yang, H., Folberth, C., Wang, X., Luo, Q., and Schulin, R.: Global investigation of impacts of PET methods on simulating crop-water relations for maize, Agr. Forest Meteorol., 221, 164–175, https://doi.org/10.1016/j.agrformet.2016.02.017, 2016.
Liu, Y., Wan, K. Y., Tao, Y., Li, Z. G., Zhang, G. S., Li, S. L., and Chen, F.: Carbon dioxide flux from rice paddy soils in central China: effects of intermittent flooding and draining cycles, Plos one, 8, e56562, https://doi.org/10.1371/journal.pone.0056562, 2013.
Lokupitiya, E., Denning, A. S., Schaefer, K., Ricciuto, D., Anderson, R., Arain, M. A., Baker, I., Barr, A. G., Chen, G., Chen, J. M., Ciais, P., Cook, D. R., Dietze, M. C., El Maayar, M., Fischer, M., Grant, R., Hollinger, D., Izaurralde, C., Jain, A., Kucharik, C. J., Li, Z., Liu, S., Li, L., Matamala, R., Peylin, P., Price, D., Running, S. W., Sahoo, A., Sprintsin, M., Suyker, A. E., Tian, H., Tonitto, C., Torn, M. S., Verbeeck, H., Verma, S. B., and Xue, Y.: Carbon and energy fluxes in cropland ecosystems: a model-data comparison, Biogeochemistry, 129, 53–76, https://doi.org/10.1007/s10533-016-0219-3, 2016.
Lombardozzi, D. L., Lu, Y., Lawrence, P. J., Lawrence, D. M., Swenson, S., Oleson, K. W., Wieder, W. R., and Ainsworth, E. A.: Simulating Agriculture in the Community Land Model Version 5, J. Geophys. Res.-Biogeo., 125, e2019JG005529, https://doi.org/10.1029/2019JG005529, 2020.
Mathur, R. and AchutaRao, K.: A modelling exploration of the sensitivity of the India's climate to irrigation, Clim. Dynam., 54, 1851–1872, https://doi.org/10.1007/s00382-019-05090-8, 2020.
Migliavacca, M., Musavi, T., Mahecha, M. D., Nelson, J. A., Knauer, J., Baldocchi, D. D., Perez-Priego, O., Christiansen, R., Peters, J., Anderson, K., Bahn, M., Black, T. A., Blanken, P. D., Bonal, D., Buchmann, N., Caldararu, S., Carrara, A., Carvalhais, N., Cescatti, A., Chen, J., Cleverly, J., Cremonese, E., Desai, A. R., El-Madany, T., Farella, M. M., Fernández-Martínez, M., Filippa, G., Forkel, M., Galvagno, M., Gomarasca, U., Gough, C., Göckede, M., Ibrom, A., Ikawa, H., Janssens, I., Jung, M., Kattge, J., Keenan, T., Knohl, A., Kobayashi, H., Kraemer, G., Law, B. E., Liddell, M., Ma, X., Mammarella, I., Martini, D., Macfarlane, C., Matteucci, G., Montagnani, L., Pabon-Moreno, D., Panigada, C., Papale, D., Pendall, E., Penuelas, J., Phillips, R. P., Reich, P. B., Rossini, M., Rotenberg, E., Scott, R., Stahl, C., Weber, U., Wohlfahrt, G., Wolf, S., Wright, I., Yakir, D., Zaehle, S., and Reichstein, M.: The three major axes of terrestrial ecosystem function, Nature, 598, 468–472, https://doi.org/10.1038/s41586-021-03939-9, 2021.
Oo, A. Z., Yamamoto, A., Ono, K., Umamageswari, C., Mano, M., Vanitha, K., Elayakumar, P., Matsuura, S., Bama, K. S., Raju, M., and Inubushi, K.: Ecosystem carbon dioxide exchange and water use efficiency in a triple-cropping rice paddy in Southern India: A two-year field observation, Sci. Total Environ., 854, 158541, https://doi.org/10.1016/j.scitotenv.2022.158541, 2023.
Ozdogan, M.: Exploring the potential contribution of irrigation to global agricultural primary productivity, Global Biogeochem. Cy., 25, GB3016, https://doi.org/10.1029/2009GB003720, 2011.
Patel, N. R., Dadhwal, V. K., and Saha, S. K.: Measurement and Scaling of Carbon Dioxide (CO2) Exchanges in Wheat Using Flux-Tower and Remote Sensing, J. Indian Soc. Remote, 39, 383–391, https://doi.org/10.1007/s12524-011-0107-1, 2011.
Patel, N. R., Pokhariyal, S., Chauhan, P., and Dadhwal, V. K.: Dynamics of CO2 fluxes and controlling environmental factors in sugarcane (C4)–wheat (C3) ecosystem of dry sub-humid region in India, Int. J. Biometeorol., 65, 1069–1084, https://doi.org/10.1007/s00484-021-02088-y, 2021.
PlotDigitizer: Version 3.1.6, https://plotdigitizer.com, last access: April 2025.
Portmann, F. T., Siebert, S., and Döll, P.: Mirca2000 – global monthly irrigated and rainfed crop areas around the year 2000: A new high-resolution data set for agricultural and hydrological modelling, Global Biogeochem. Cy., 24, GB1011, https://doi.org/10.1029/2008GB003435, 2010.
Raczka, B., Hoar, T. J., Duarte, H. F., Fox, A. M., Anderson, J. L., Bowling, D. R., and Lin, J. C.: Improving CLM5.0 biomass and carbon exchange across the Western United States using a data assimilation system, J. Adv. Model. Earth Sy., 13, e2020MS002421, https://doi.org/10.1029/2020MS002421, 2021.
Reddy, K. N., and Baidya Roy, S.: Dataset for manuscript – Phenology, fluxes, and their drivers in major Indian agroecosystems: A modeling study using the Community Land Model (CLM5), Zenodo [data set, code], https://doi.org/10.5281/zenodo.15291023, 2025.
Reddy, K. N., Gahlot, S., Baidya Roy, S., Varma, G. V., Sehgal, V. K., and Vangala, G.: Carbon fluxes in spring wheat agroecosystem in India, Earth Syst. Dynam., 14, 915–930, https://doi.org/10.5194/esd-14-915-2023, 2023.
Reddy, K. N., Baidya Roy, S., Rabin, S. S., Lombardozzi, D. L., Varma, G. V., Biswas, R., and Naik, D. C.: Improving the representation of major Indian crops in the Community Land Model version 5.0 (CLM5) using site-scale crop data, Geosci. Model Dev., 18, 763–785, https://doi.org/10.5194/gmd-18-763-2025, 2025.
Saito, M., Miyata, A., Nagai, H., and Yamada, T.: Seasonal variation of carbon dioxide exchange in rice paddy field in Japan, Agric. For. Meteorol., 135, 93–109, https://doi.org/10.1016/j.agrformet.2005.10.007, 2005.
Schmidt, M., Reichenau, T. G., Fiener, P., and Schneider, K.: The carbon budget of a winter wheat field: An eddy covariance analysis of seasonal and inter-annual variability, Agric. For. Meteorol., 165, 114–126, https://doi.org/10.1016/j.agrformet.2012.05.012, 2012.
Seo, H. and Kim, Y.: Forcing the Global Fire Emissions Database burned-area dataset into the Community Land Model version 5.0: impacts on carbon and water fluxes at high latitudes, Geosci. Model Dev., 16, 4699–4713, https://doi.org/10.5194/gmd-16-4699-2023, 2023.
Song, J., Miller, G. R., Cahill, A. T., Aparecido, L. M. T., and Moore, G. W.: Modeling land surface processes over a mountainous rainforest in Costa Rica using CLM4.5 and CLM5, Geosci. Model Dev., 13, 5147–5173, https://doi.org/10.5194/gmd-13-5147-2020, 2020.
Varma, G. V., Reddy, K. N., Baidya Roy, S., Yadav, R., Vangala, G., and Biswas, R.: Indian cereal crops (wheat and rice) phenology and agricultural management data across Indian croplands from 1960s to 2020, PANGAEA [data set], https://doi.org/10.1594/PANGAEA.964634, 2024.
Wagle, P., Gowda, P. H., Northup, B. K., Neel, J. P., Starks, P. J., Turner, K. E., Moriasi, D. N., Xiao, X., and Steiner, J. L.: Carbon dioxide and water vapor fluxes of multi-purpose winter wheat production systems in the US Southern Great Plains, Agric. For. Meteorol., 310, 108631, https://doi.org/10.1016/j.agrformet.2021.108631, 2021.
Wang, K. and Dickinson, R. E.: A review of global terrestrial evapotranspiration: Observation, modeling, climatology, and climatic variability, Rev. Geophys., 50, RG2005, https://doi.org/10.1029/2011RG000373, 2012.
Yin, D., Yan, J., Li, F., and Song, T.: Evaluation of global gridded crop models in simulating sugarcane yield in China, Atmos. Ocean. Sci. Lett., 16, 100329, https://doi.org/10.1016/j.aosl.2023.100329, 2023.
Yu, G. R., Chen, Z., and Wang, Y. P.: Carbon, water and energy fluxes of terrestrial ecosystems in China, Agric. For. Meteorol., 109890, https://doi.org/10.1016/j.agrformet.2024.109890, 2024.
Zanaga, D., Van De Kerchove, R., Daems, D., De Keersmaecker, W., Brockmann, C., Kirches, G., Wevers, J., Cartus, O., Santoro, M., Fritz, S., Lesiv, M., Herold, M., Tsendbazar, N.-E., Xu, P., Ramoino, F., and Arino, O.: ESA WorldCover 10 m 2021 v200, Zenodo [data set], https://doi.org/10.5281/zenodo.7254221, 2022.
Zhao, Z., Dong, J., Zhang, G., Yang, J., Liu, R., Wu, B., and Xiao, X.: Improved phenology-based rice mapping algorithm by integrating optical and radar data, Remote Sens. Environ., 315, 114460, https://doi.org/10.1016/j.rse.2024.114460, 2024.
Zou, M., Yang, K., Lu, H., Ren, Y., Sun, J., Wang, H., Tan, S., and Zhao, L.: Integrating eco-evolutionary optimality principle and land processes for evapotranspiration estimation, J. Hydrol., 616, 128855, https://doi.org/10.1016/j.jhydrol.2022.128855, 2023.