the Creative Commons Attribution 4.0 License.
the Creative Commons Attribution 4.0 License.
 | 08 Jan 2026
Carbon fixation of a temperate plankton community in response to calcium- and silicate-based Ocean Alkalinity Enhancement using air-sea gas exchange measurements
Ulf Riebesell
Charly André Moras
Laura Marín-Samper
Leila Richards Kittu
Joaquín Ortíz-Cortes
Ocean Alkalinity Enhancement (OAE) is a carbon dioxide removal strategy that aims to chemically sequester atmospheric CO2 in the ocean while potentially alleviating localized effects of ocean acidification. Depending on the implementation approach, OAE can considerably alter seawater carbonate chemistry, resulting in temporarily reduced CO2 partial pressure (pCO2) and elevated pH before re-equilibration with the atmosphere or mixing with unperturbed waters. To investigate the effects of OAE on biogeochemical processes and organisms under close-to-natural conditions, a large-scale mesocosm experiment was conducted in a temperate fjord ecosystem near Bergen, Norway, during late spring. A non-CO2-equilibrated OAE approach was chosen, simulating OAE with calcium- and silicate-based minerals. A gradient of five OAE levels was achieved by increasing total alkalinity (TA) by 0–600 µmol kg−1. The added TA remained relatively stable over the 47 d experiment and measured CO2 gas exchange rates reached up to −15 mmol C m−2 d−1. We estimated that full equilibration (95 %) by air-sea gas exchange for a ΔTA of 600 µmol kg−1 would take ∼1050 d. Furthermore, various mineral-type and/or pCO2 pH effects were found. Coccolithophore calcification followed an optimum curve response along the pCO2 gradient, consistent with findings from single-species laboratory cultures. In contrast, in-situ net community production (NCP) was higher in the silicate-based treatments, but was not modified by changes in pCO2. Zooplankton respiration, estimated from in-situ NCP and in-vitro NCP incubations, was lower for the silicate-based treatments and negatively correlated with pCO2. These complex findings suggest both direct and indirect effects of mineral type and OAE level and provide a valuable foundation for designing future OAE field trials. For a safe application of OAE, non-equilibrated alkalinity additions must balance efficiency and environmental impact.
- Article
(1716 KB) - Full-text XML
-
Supplement
(1845 KB) - BibTeX
- EndNote


The rapid increase in atmospheric carbon dioxide (CO2) concentration over the last 250 years has been identified as a major cause of global warming, with current modelling projections for 2100 exceeding 2 °C above pre-industrial levels (Peters, 2016; Rogelj et al., 2016). This is a critical threshold associated with the onset of extreme weather events (Schellnhuber et al., 2016). However, decreasing CO2 emissions will not be sufficient to achieve a net-zero target towards the end of this century (Ho, 2023), which would be required to stay below the 2 °C threshold (Rogelj et al., 2018). Therefore, it is paramount to explore the potential of active atmospheric CO2 removal (CDR) strategies (IPCC, 2021; Van Vuuren et al., 2018). Ocean alkalinity enhancement (OAE) is a marine CDR approach with significant potential, that relies on speeding up the natural process of rock weathering via the addition of alkaline solutions/minerals. By adding alkaline feedstocks to seawater (Kheshgi, 1995), the subsequent increase in alkalinity and pH lowers surface water CO2 concentrations, creating a CO2 sink or reducing a CO2 source if the water is naturally oversaturated (Caserini et al., 2021; Denman, 2008; Feng et al., 2016; Hartmann et al., 2013; Köhler et al., 2010; National Academies of Sciences, 2022; Sabine and Tanhua, 2010). The localized increase in total alkalinity (TA) and pH simultaneously mitigates ocean acidification (OA), even after eventual CO2 equilibration with the atmosphere (Moras et al., 2022). Modelling studies suggest that the CO2 uptake potential of OAE ranges between 14 and 41 Gt per year (Oschlies et al., 2023). Such large range is the result of different modelling scenarios, e.g., amount and frequency of additions. However, there is also a significant knowledge gap between modelled predictions and real-world conditions, regarding potential changes to marine communities, which needs to be acknowledged and addressed (Henderson et al., 2008).
There are two very distinct approaches to performing OAE additions: CO2-equilibrated, which involves equilibrating the high TA seawater with atmospheric CO2 prior to release, and non-CO2-equilibrated, which relies on natural air-sea gas exchange to achieve equilibration over time. For the latter process to happen, it is crucial that the alkalized water remains in the surface ocean in contact with the atmosphere. Since gas exchange can take months to years (He and Tyka, 2023) and depends heavily on the degree of dilution of the high-TA water with the surrounding seawater, marine organisms might be exposed to CO2 depleted conditions and relatively high pH levels, which could be detrimental to planktonic communities (Doney et al., 2020; Kroeker et al., 2010). However, experimental data on potential biological OAE effects are scarce (National Academies of Sciences, 2022), and thresholds of applicability not yet fully understood. For instance, recent studies have identified the potential risks of runaway calcium carbonate (CaCO3) precipitation beyond certain pH thresholds, which should be avoided because it reduces the CDR potential of OAE (Fuhr et al., 2022; Hartmann et al., 2023; Moras et al., 2022; Paul et al., 2025; Suitner et al., 2024).
A number of potentially suitable OAE feedstocks have been previously suggested (Hartmann et al., 2013; Renforth and Henderson, 2017), including quick or hydrated lime (calcium-based), brucite (magnesium-based), and olivine (silicate-based), all of which release soluble products that impact (positively or negatively) marine organisms (Montserrat et al., 2017; Moras et al., 2024). Bach et al. (2019) proposed the “white vs. green ocean” hypothesis, which suggests that different types of OAE materials may favor different groups of primary producers. Specifically, they hypothesized that the increase in calcium ions (Ca+2) together with DIC upon equilibration, could enhance calcification of key calcifiers such as coccolithophores, which are highly impacted by ocean acidification. In contrast, the release of silicic acid (Si(OH)4) could benefit diatoms, a group of primary producers which relies on silicate to build their exoskeletons. This hypothesis highlights the importance to assess the biological response of natural ecosystems to OAE with respect to the type and concentration of the alkaline material used. In this study, we aim to test the “white vs. green ocean” hypothesis by evaluating the differential effects of silicate and calcium-based OAE treatments on calcification, bulk phytoplankton production, zooplankton respiration, as well as overall ecosystem responses and atmospheric CO2 uptake potential.
This research presents the first data on the temporal dynamics of the carbonate system within large-scale mesocosms following deployment of silicate- and calcium-based OAE treatments ranging from 0 to 600 µmol kg−1 of added alkalinity. We conducted a 53 d in situ experiment using 10 pelagic mesocosms (Riebesell et al., 2013) in Bergen, Norway, during low-nutrient post-spring bloom conditions. Halfway through the experiment, dissolved inorganic nutrients were added to simulate a naturally occurring mixing/upwelling event, which has been found to enhance otherwise difficult to detect treatments effects at low biomass (Schulz et al., 2017). OAE release was in a non-pre-equilibrated way, that is, the ingassing of CO2 was left to occur naturally via air-sea gas exchange, which is believed to represent the most feasible deployment scenario from both technological and economical perspectives (Schulz et al., 2023). However, this approach can also lead to strong perturbations in seawater carbonate chemistry, namely high pH, low partial pressure of seawater CO2 (pCO2), and high seawater aragonite saturation states (ΩA). Here, we focused on assessing OAE-induced carbonate chemistry changes, the stability of alkalinity over time (including biogenic calcification), and deriving air-sea CO2 exchange rates from measurements, allowing us to also calculate net ecosystem primary productivity. Potential impacts on these processes need to be understood before large field deployments of OAE and are important for accompanying monitoring, reporting and verification.
2.1 Mesocosm deployments and experimental setup
Ten Kiel Off-Shore Mesocosms for Future Ocean Simulations (KOSMOS) were deployed by the research vessel ALKOR and moored in the Raunefjord, Norway, on 7 May 2022 (60.25° N, 5.2° E). The technical design of these seagoing mesocosms and procedures for water column manipulation are described in detail by Riebesell et al. (2013). Briefly, the 20 m long mesocosm bags were suspended in 8 m tall floating frames, and both ends were covered with a 3 mm mesh size net to exclude larger organisms during filling. The tops of the bags were then submerged 1 m below the sea surface and fully unfolded to enclose a waterbody containing the natural planktonic community. The bags were left submerged for 5 d to allow for sufficient seawater exchange to ensure similar starting conditions in all mesocosms. Next, the waterbodies within the mesocosm bags were isolated from the surroundings by attaching a 2 m-long, funnel-shaped sediment trap to the lower end of the bags and lifting the top end 1 m above the surface. The attachment of the sediment trap on 13 May marked the beginning (day 0) of the 53 d experiment. Right after closure, a 1 mm net was pulled from bottom to top to remove any heterogeneously distributed nekton (i.e., different amounts and sizes of nekton in different mesocosms). From days 1 to 3, daily sampling was conducted to monitor the initial conditions of the enclosed waters before OAE manipulation on day 6. Additionally, the mesocosms' volume was determined following Czerny et al. (2013), yielding an estimated average volume of m3.
All water column manipulations in the mesocosms were achieved using of a pumped injection device equipped with polycarbonate piping of various lengths (Riebesell et al., 2013), that was lowered and raised several times in each mesocosm during manipulations to ensure homogeneous distribution throughout the entire water column.
2.2 OAE manipulation
The alkalinity manipulation was performed on day 6. As direct mineral additions, such as lime or olivine powder, come with several caveats, such as triggering secondary calcium carbonate precipitation, and thereby removing added alkalinity (Moras et al., 2022), slow dissolution kinetics (Fuhr et al., 2022), or minerals containing a variety of potentially toxic trace elements, we simulated mineral dissolution using laboratory prepared alkaline solutions and alkalinity was added using sodium hydroxide (NaOH, Merck) solutions. To simulate the use of two alkaline feedstocks: hydrated lime (Ca(OH)2) and olivine (as forsterite, Mg2SiO4), NaOH additions were followed by the addition of the respective Ca2+ and Mg2+ rich solutions. The two solutions were prepared using reagent-grade calcium chloride (CaCl2) and magnesium chloride (MgCl2). Furthermore, to simulate the release of SiO, under the olivine scenario, a Si-rich solution was prepared using Na2SiO3 (Roth) and added in equal concentrations to all silicate-based treatments (75 µmol L−1), regardless of the targeted alkalinity increase (more details can be found in Goldenberg et al., 2024, and below). The reasoning behind this decision was to avoid colloid formation that occurs at high Si concentrations (up to 150 µmol L−1 would have to be added to the highest TA treatment to match the TA to silicate ratio of 4:1 in olivine), and to allow separation between silicate and TA effects. Ca2+ and Mg2+ were added in a 2:1 ratio to TA. All solutions were prepared by dissolving the corresponding salts in individual bottles filled with 20 L of deionized water (Milli-Q®, 18.2 ΩM), which were then added to the respective mesocosms. Each salt was weighed in and dissolved separately. In summary, stock solutions of NaOH and CaCl2 were added to the calcium-based treatments, and MgCl2, NaOH and Na2SiO3 to the silicate-based ones (since adding silicate inevitably increases total alkalinity (Gattuso et al., 2010), we compensated the silicate-induced rise by adding HCl to the respective control and by withholding NaOH in the ΔTA 150 µmol kg−1 treatment).
The increase in silicate and TA by NaOH was confirmed by direct measurements in the mesocosms right after the additions. However, Mg+2 and Ca+2 concentrations were not measured, as their expected change was considered minor (only a few percent compared to the large natural background concentrations, ∼49.8 and 9.6 mmol kg−1 at a salinity of 33, respectively). Concerning silicate additions, olivine dissolution would have resulted in an increase of silicate in relation to TA by 0.25, which would have been 37.5 µmol kg−1 at the lowest TA addition of 150 µmol kg−1. This is more than one order of magnitude larger than the concentrations considered limiting for diatom growth. However, to avoid confounding effects, it was decided to keep the silicate addition the same among respective mesocosms at 75 µmol kg−1, also avoiding unavoidable precipitation at even higher concentrations. Finally, only about 10 µmol kg−1 of silicate were taken up until the end of the experiment, meaning that silicate concentrations would have been non-limiting throughout the experiment in all mesocosms.
2.3 N2O spiking and nutrient addition
For air-sea gas exchange determination, nitrous oxide (N2O) additions were performed on day 14, following the procedure described in Czerny et al. (2013). One liter of a saturated stock solution was prepared by bubbling 0.2 µm filtered seawater for 2 d with N2O (Nippon Gases). The amount of stock solution to be added to each mesocosm was calculated using solubility constants by Weiss and Price (1980) and taking into consideration in situ salinities, temperatures and individual mesocosm volumes. The stock solution was then diluted with filtered seawater into 25 L carboys, and each mesocosm was spiked with one carboy.
Given the duration of the experiment and the low levels of inorganic nutrients in comparison to the surrounding coastal water, a nutrient addition was performed on day 26. Nitrate concentrations (NO) were targeted at 4 µmol L−1 and phosphate concentrations (PO) were enhanced following the N:P Redfield ratio of 16:1 (Redfield, 1934). Further detail on specific quantities can be found in Ferderer et al. (2024).
Calcium-based treatments also received a minor silicate (Si(OH)4) addition in a N:Si ratio of 4:1 to better mimic the natural conditions, without creating a Si-enrichment scenario. Nutrient concentrations were measured the day before nutrient addition and ∼2 h after addition, for quantification and to ensure that the targeted stoichiometry was achieved. It was then noted that the stoichiometry was not even across mesocosms due to underestimated nitrate additions. A successful nitrate amendment was performed on day 28.
2.4 Sampling procedures and CTD operations
Following the alkalinity manipulation, sampling in random order was carried out every second day in the morning hours (08:00–12:00 CEST). Depth-integrated (0–20 m) water samples were taken from the mesocosms and the surrounding coastal water (later referred to as “Fjord”) using a 5 L integrating water sampler (IWS, HYDRO-BIOS, Kiel).
Samples were collected from the IWS in decreasing order of sensitivity to gas exchange, i.e., N2O, followed by carbonate chemistry and inorganic nutrients. N2O samples were drawn with a Tygon tube directly into 20 mL caramel vials in triplicates. After ensuring that the vials were bubble-free, they were crimp-sealed immediately and kept at room temperature after fixation with 10 µL of a saturated mercury chloride solution (HgCl2). To minimize gas exchange during air transport and storage, two paraffin wax coats were applied to the crimp seals (Glatzel and Well, 2008; Kock et al., 2016). For carbonate chemistry parameters, such as pH and TA, 0.5 L of seawater were taken into air-tight glass flasks. Clean bottles were pre-rinsed with sample water immediately prior to filling (using pre-rinsed Tygon tubing). Finally, to minimize air–water gas exchange, filling was done gently from bottom to top with an overflow of ∼1.5 times the sampling volume (Dickson et al., 2007).
Nutrient subsamples were collected next into 250 mL acid-cleaned polypropylene bottles. All samples were kept in cool conditions and protected from direct sunlight until further analysis. Subsamples for NO, NO, PO, and Si(OH)4 were filtered using a PES syringe filter (0.45 µm Sterivex, Merck) and analyzed spectrophotometrically following Hansen and Koroleff (1999).
CTD casts were performed with a multiparameter logging probe (CTD60M, Sea & Sun Technology) directly after the main sampling (14:00–16:00), yielding depth profiles of salinity, temperature and pH.
2.5 Sample Analysis
2.5.1 Carbonate Chemistry
All carbonate chemistry analyses were performed in the same way, starting with sterile filtering the seawater samples through 0.2 µm syringe filters (Sartorius) using Tygon tubing connected to a peristaltic pump. The filtration process aimed at removing biomass and potential alkaline particles that may cause changes in seawater carbonate chemistry during analysis (Bockmon and Dickson, 2014). Water for gas-sensitive parameters was gently subsampled first, providing an overflow of ∼1.5 times the final sampling volume. Samples were then kept at room temperature and measured within 12 h.
TA was measured using open-cell potentiometric titration as described in Dickson et al. (2007). A 0.05 M HCl solution with an ionic strength of 0.72 mol kg−1 (corresponding to a salinity of 35 and adjusted by NaCl addition) was used as the titrant. Titrations were performed using a Metrohm Aquatrode Plus (Pt1000) connected to a 907 Titrando, with samples loaded onto an 862 Compact Titrosampler. The temperature was recorded during titration and varied between 20 and 25 °C, i.e., laboratory ambient temperature. 50 g of sample water were weighed into the titration beakers with a precision of 0.1 mg. For every run, the results were corrected against a certified reference material (CRM, batch 193, Dickson, 2010). Finally, TA was calculated using the titration curves and the “Calkulate” script within PyCO2SYS by Humphreys et al. (2022, 2024a). Each sample was measured in technical duplicates. The TA measurement precision was calculated by error propagation of the samples and CRM standard deviations and averaged ±1.9 µmol kg−1.
Seawater pH on the total scale (pHT) was determined spectrophotometrically using a VARIAN Cary 100 in a 10 cm thermostated cuvette at 25 °C using cresol purple as described by Dickson et al. (2007). Before measurement, samples were acclimated to 25 °C in a thermostated water bath. To minimize potential CO2 air–water gas exchange, a syringe pump (Tecan Cavro XLP) was used for sample and dye mixing and cuvette injection (see Schulz et al., 2017). A more detailed description of pHT corrections is provided in Sect. 2.6.3. The average pHT precision was estimated to be ±0.003 units.
DIC samples were taken only on day 9 of the experiment to cross-check the estimated DIC derived from TA and pHT measurements. Said samples were fixed with HgCl2 for later analysis, conducted on an Automated Infra-Red Inorganic Carbon Analyzer (AIRICA, Marianda), connected to a LI-COR LI-7000 (Gafar and Schulz, 2018). The samples were analyzed in triplicates, and the instrument uncertainty was estimated at ±1.5 µmol kg−1. The correction at the highest pH level of 8.5 is 0.03 pH units (see Fig. S2 in the Supplement) which, in turn, translates to a calculated DIC offset of about 25 µmol kg−1 (only ∼ 1.2 %).
2.5.2 N2O
Aquatic N2O concentrations were measured via gas chromatography (GC) with electron capture detection (ECD) (Hewlett Packard 5890 II), using a headspace static equilibration procedure (precision of ±1.8 %). The GC was equipped with a stainless steel column packed with a 5 Å molecular sieve (W. R. Grace & CO) and operated at a constant oven temperature of 190 °C using a argon–methane mixture (5.0, AirLiquide) as carrier gas. A 10 mL headspace was manually created in each sample vial with helium (5.0, AirLiquide), and the overflowing water was collected with a second syringe. Next, the vials were shaken vigorously for 20 seconds and left to settle for 2 h at room temperature. Subsamples of the equilibrated headspace were then injected into the sample loop of the GC. Certified gas mixtures of N2O in artificial air (Deuste Steininger GmbH) with mixing ratios of 330±0.2 and 994±0.2 ppb as well as 6:3 and 4:5 dilutions with helium were used to construct daily calibration curves with a minimum of three data points within the sample concentration range.
N2O concentrations were calculated according to Walter et al. (2006) using the solubility function of Weiss and Price (1980). The average precision, calculated as mean standard deviation from triplicate measurements, was 0.7 nM.
2.6 Data Analysis
The 53 d experiment was divided into three distinct phases. The pre-treatment phase (days 1 to 6), from here on referred to as phase 0 for simplicity, denotes the baseline state of the system before any alkalinity manipulation. This preliminary phase was an important step to confirm that the starting conditions in all mesocosms were similar. The reaction phase after OAE manipulation (days 7 to 28), phase I, corresponds to the period in-between alkalinity manipulation and the addition of dissolved inorganic nutrients. This post-treatment and pre-fertilization phase mainly consisted of the immediate response of the system to an increase in alkalinity levels in a post-bloom scenario. The last phase after nutrient addition is referred to as phase II. This post-fertilization period (days 29 to 53) is thought to capture the mid-term indirect responses to alkalinity addition of a biologically active ecosystem state.
Throughout the experiment, two carbonate chemistry parameters (TA and pHT) were measured and paired with corresponding daily averages of salinity and temperature (from CTD casts), as well as nutrient concentrations, to calculate the remaining carbonate system variables, such as DIC, ΩA and pCO2. To do so, the software PyCO2SYS version 1.8.2 (Humphreys et al., 2024b) was used with chosen constants for calculations as follows: K1 and K2 for carbonic acid from Sulpis et al. (2020), KHSO4 from Dickson (1990), KHF from Dickson and Riley (1979), [B]T from Uppström (1974) and the universal gas constant R.
Note that given the set-up of this experiment, pH and pCO2 are intimately correlated, with a quasi-linear relationship between proton concentration and pCO2. Either parameter could have been used to describe carbonate chemistry, but we chose to consistently report responses with respect to pCO2 as the one most relevant across all aspects of the manuscript.
2.6.1 CO2 flux estimates
To calculate the daily air-sea CO2 fluxes, N2O was used as a tracer following the approach described by Czerny et al. (2013) and using measured N2O to derive transfer velocities (Fig. S3). Fluxes across the water surface () were then calculated as follows:
where Iw1 and Iw2 are the fitted bulk water N2O inventories at time t1 and t2, respectively; A is the surface area of the mesocosms; and Δt is the time difference between t1 and t2. From here, first N2O, and then CO2 transfer velocities were calculated (see Czerny et al., 2013, for details, and note the typo in there, where for the calculation of chemical enhancement the boundary thickness layer z should read 0.02 cm), as shown in Eq. (2), which then allowed to estimate daily CO2 fluxes (), according to Eq. (3).
where is the transfer velocity of CO2, Scx are the corresponding Schmidt numbers, and and are the bulk-water CO2 concentration and the calculated equilibrium concentration with the atmosphere, respectively. Atmospheric pCO2 was estimated at 417 µatm (referenced to late spring 2022; Lan et al., 2025; NOAA/GML). Fluxes in this paper are shown as daily changes (mmol C m−2 d−1).
Previous mesocosm experiments (Czerny et al., 2013; Spilling et al., 2016) have already shown how CO2 fluxes can be greatly affected by chemical enhancement due to hydration reactions of CO2 and conversion to HCO and CO in the boundary layer, particularly under low turbulence conditions and high pH (Wanninkhof and Knox, 1996). Given the high concentration of OH− during this experiment, we applied the correction for chemical enhancement by Hoover and Berkshire (1969) with refitted hydration and hydroxylation rate constants by Schulz et al. (2006). The enhancement factor (α) was calculated following Eq. (4):
Where τ represents the chemical enhanced flux and Q (calculated as shown in Czerny et al., 2013) represents the enhanced flux, the hydration of CO2 and the diffusion coefficient. The average boundary layer thickness z (cm ± std) was calculated to be 0.017±0.003 cm and the overall enhancement ranged from 6 % to 20 % during this experiment.
2.6.2 Calcification and net community production estimates
Cumulative calcification rates (CALC, in µmol kg−1 seawater) were estimated following Eq. (5). For this, salinity normalized TA changes (salinity 33 normalized) were calculated, and the uptake of nitrate, i.e., NO, and phosphate, i.e., PO, – each of which increases TA by 1 mol per mol of nutrient uptake (Wolf-Gladrow et al., 2007) – was factored in. The cumulative sum of salinity-normalized and nutrient-uptake-corrected TA changes (divided by 2 due to the double contribution of CO to TA) was then used to gauge overall CaCO3 production in each treatment. Note that the decrease in TA by the uptake of growth-requiring conservative cations such as Mg2+, K+ and Ca2+ (other than that used for calcification) was ignored as being much smaller than the effect of nitrate uptake (Wolf-Gladrow and Klaas, 2024).
The CaCO3 production potential (CCPP), i.e., the amount of CaCO3 produced during coccolithophorid bloom (the main calcifier in our experiment, according to coccolithophore and zooplankton counts using individual cellular CaCO3 quotas), was estimated following Eq. (9) in Gafar et al. (2018). In situ temperature, carbonate chemistry speciation and light conditions at depth averaged values for each day and for each treatment were considered, i.e., light was 100 . Then, normalized CCPP was compared to normalized CALC.
It was also possible to estimate the biologically mediated change of net community production derived from the inorganic carbon fraction (NCPDIC) by accounting for the impact of cumulative in-gassed CO2 (cCO2) derived from the daily CO2 fluxes () on the cumulative DIC consumption (salinity 33 normalized) and factoring in the formation of CaCO3, as expressed below (Eq. 6):
Note that cCO2 is added to DIC in the equation because it has a negative sign by definition. By calculating the negative change in DIC, we define NCPDIC to be positive.
In addition to NCPDIC, we used an estimate of NCP that is based on O2 incubations measurements (Marín-Samper et al., 2024b). The comparison between NCPDIC and NCP allows us to compute zooplankton respiration (Sect. 4.5). For in-depth description of NCP calculations derived from O2 measurements, please refer to Marín-Samper et al. (2024a) of the same mesocosm experiment.
Coccolithophores (Fig. S5) were counted by Flowcytometry (Cytosense, Cytobuoy, Netherlands) and the presence of the species Emiliania huxleyi was identified by light microscopy. Although we acknowledge the most recent phylogenic findings that have renamed Emiliania huxleyi to Gephyrocapsa huxleyi (Mahdi Bendif et al., 2015), we will keep referring to E. huxleyi for the rest of the manuscript, as G. huxleyi has been further divided into three separate species and subspecies (Archontikis et al., 2023).
Lastly, data on biogenic silica (Fig. S6) was used as a proxy for diatom biomass (Schulz et al., 2013).
2.6.3 pH corrections
Calculations of pHT included corrections for changes due to dye addition. For that purpose, a batch of sterile filtered seawater (natural seawater filtered through a 0.2 µm filter) was prepared and used to achieve 5 different levels of pH by additions of a 1 M NaOH solution that would simulate the experimental increments in TA (steps of 0, 150, 300, 450 and 600 µmol kg−1). For each level, pHT was measured for 5 additions of increasing dye concentration, and the change in pHT per addition of dye was calculated. This allowed for the establishment of a calibration curve with a linear correlation between pHT level and pHT change due to dye addition (for details see Dickson et al., 2007). The change in absolute values was only 0.03 pH units at the highest measured pH of 8.5. Such pH offsets using unpurified dyes, even when trying to apply corrections, have been described previously (Douglas and Byrne, 2017).
The working range of m-cresol dye has been suggested to be one pH unit below and above the indicator's pK2 (Hudson-Heck et al., 2021), i.e., about 7–9 at 25 °C, which should have covered our experimental range. However, dye impurities can reduce the working range significantly (Schulz et al., 2023). And indeed, we found that above pK2, there were increasing deviations of measured versus calculated pHT (from measured DIC and TA on day 9). Hence, a linear correction was applied for those measurements (Fig. S2).
3.1 Alkalinity enhancement and carbonate system variability
During phase 0, conditions in all mesocosms were relatively similar, averaging 2213±3 for measured TA, 8.109±0.004 for pHT, 2030±4 for DIC, 339±3 µatm for pCO2, and 2.00±0.02 for ΩA (Fig. 1). After the alkalinity manipulation, on day 7, TA levels increased according to treatment, reaching a maximum of 2740.7 , pHT increased to a maximum of 8.767, and ΩA up to 7.66 in the two highest treatments, while pCO2 decreased to 61 µatm. In contrast, DIC was hardly affected by the manipulation and dropped in the initial days of the experiment consistently across all mesocosms independent from the addition of alkaline material (Fig. 1).
Overall, TA remained relatively stable throughout the rest of the experiment, regardless of the phase and the treatment (calcium- or silicate- based), with a maximum variability of ∼19 µmol kg−1. ΩA remained stable throughout phase I, but showed an increase ranging from ∼0.20 to ∼0.45 units in each treatment after nutrient addition, from day 35 onwards, consistent with a decrease in DIC and an increase in NCPDIC and Chl a (Figs. 1a, 1c, 4a, S1).
In contrast, changes in pHT and DIC were observed throughout the experiment. After an initial drop in DIC in all mesocosms (phase 0), subsequent DIC changes were less consistent among treatments over time, with increments of up to ∼8–28 µmol kg−1 in the treatments before the nutrient addition. About a week after the nutrient addition, DIC decreased in all mesocosms again, by ∼23–51 µmol kg−1, coinciding with average Chl a increase from 0.53±0.1 µL−1 up to 3.4±0.9 µL−1 during phase II (Fig. S1).
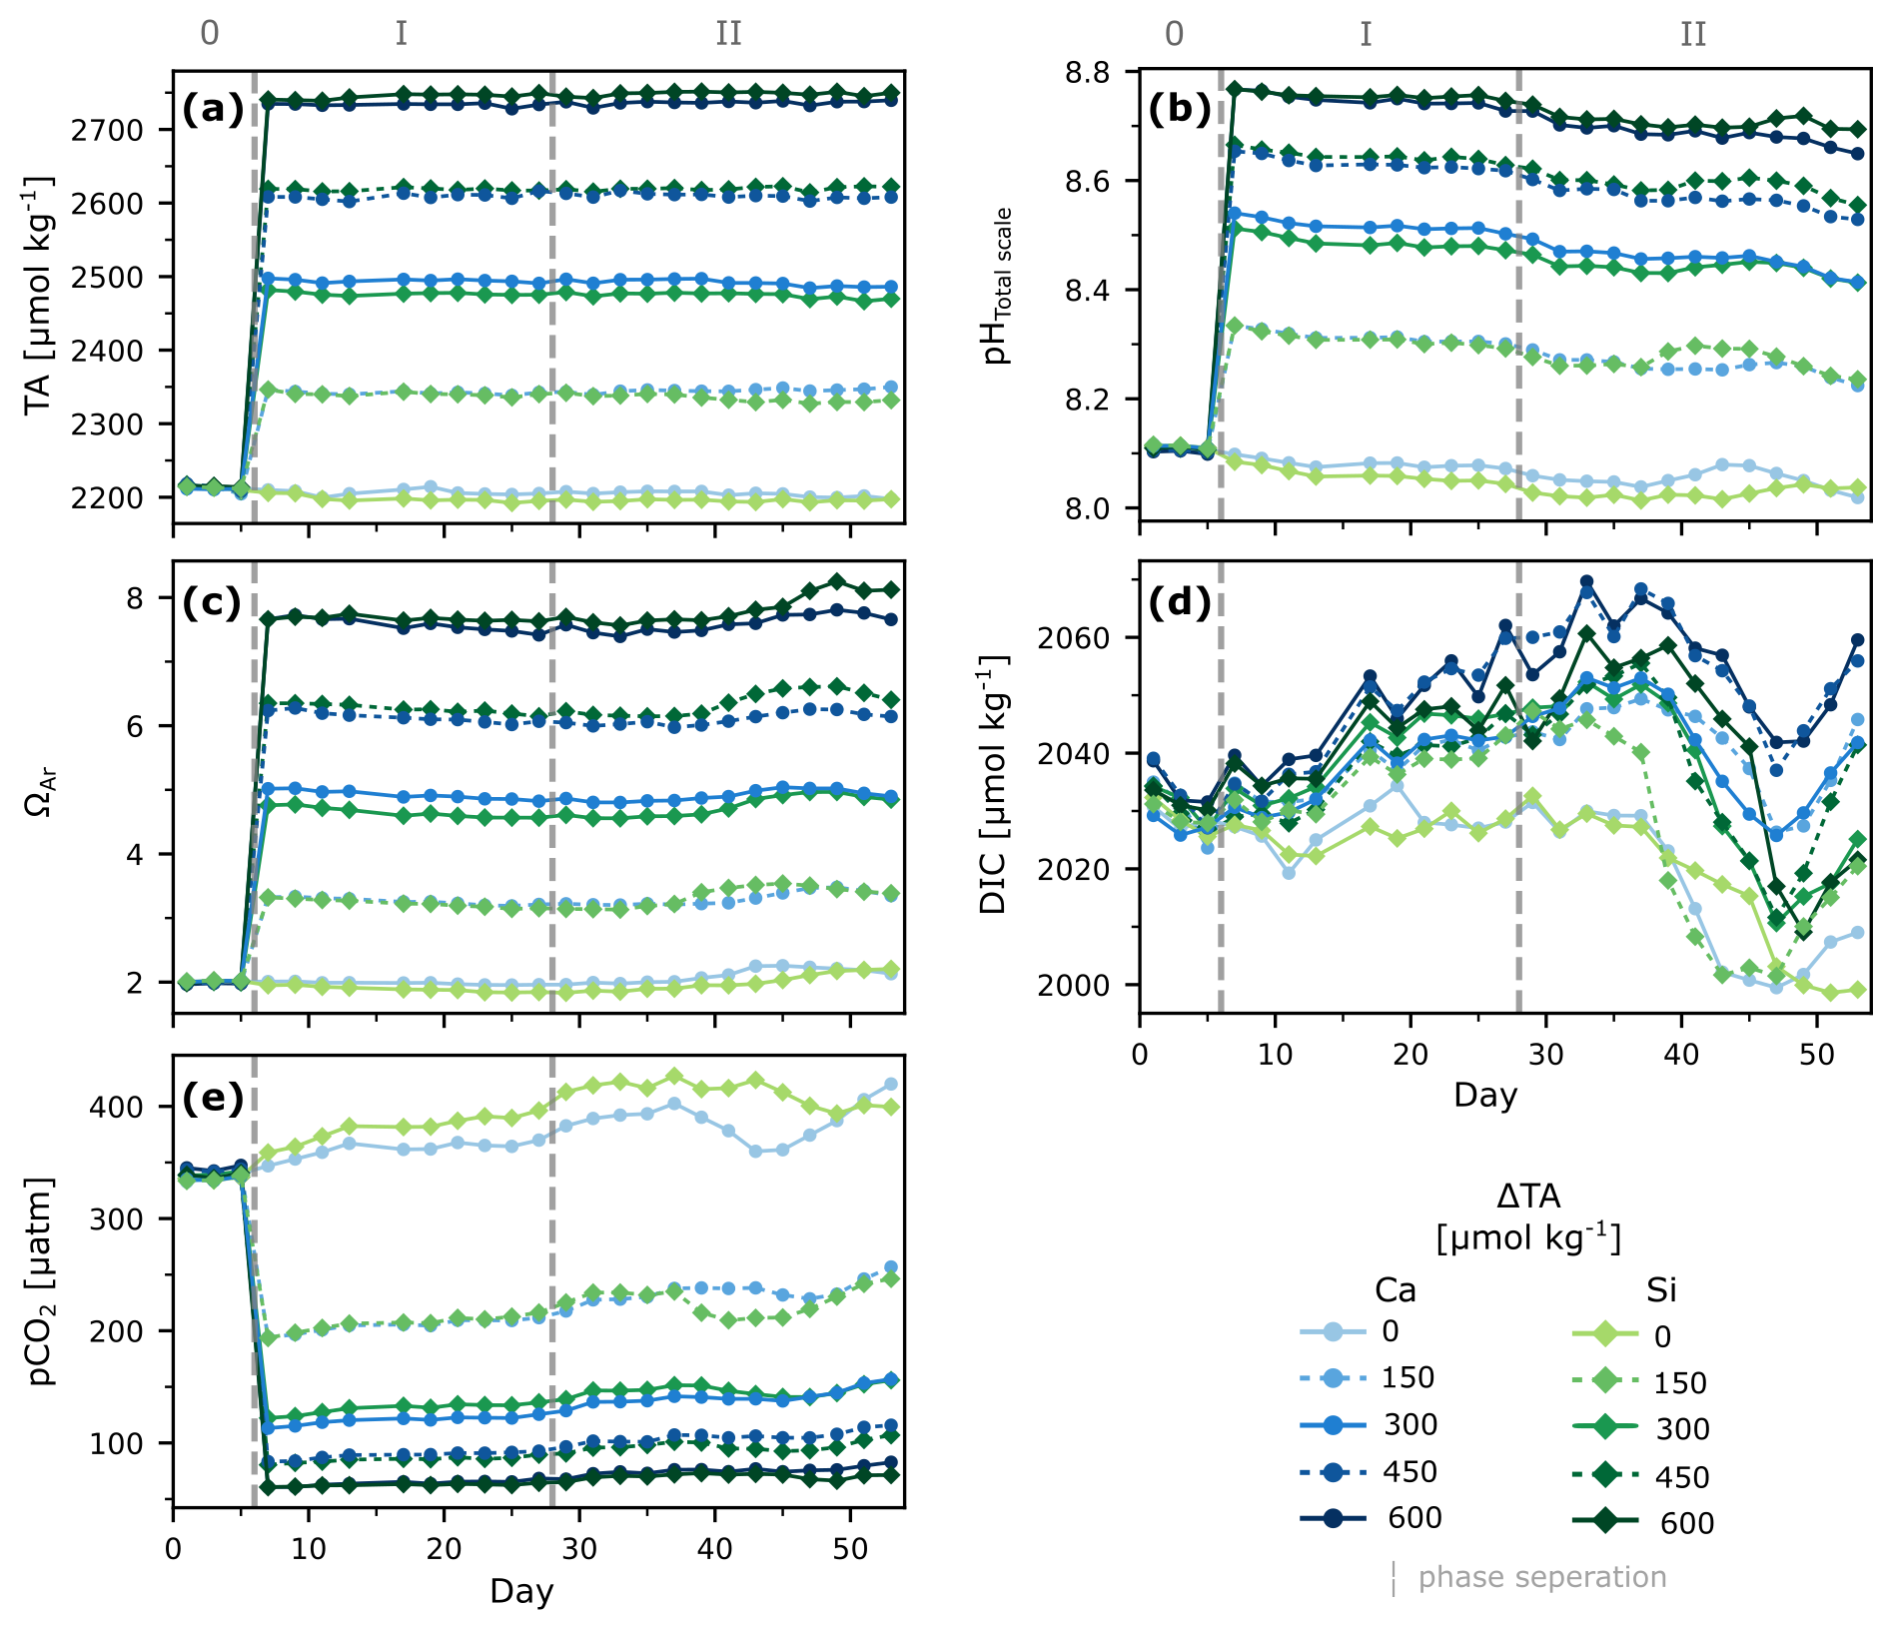
Figure 1Temporal development of carbonate chemistry parameters under different levels of non-CO2-equilibrated OAE. Depth-integrated measured TA (a), pHTotal scale at in-situ temperatures (b), and calculated aragonite saturation state (c), dissolved inorganic carbon (d), and partial pressure of carbon dioxide (e). Dashed lines and roman numbers denote the pre-treatment (0) phase and phases before (I) and after (II) nutrient addition.
3.2 Air-sea CO2 gas exchange
The experiment began with initial pCO2 below atmospheric levels, averaging 339±3 µatm across treatments (Fig. 1). During the initial phase (0), all treatments were taking up CO2, leading to a daily increase in DIC of ∼0.1 µmol kg−1. While CO2 ingassing (negative ) did not change significantly for the control treatments, more atmospheric CO2 was taken up with increasing ΔTA (and the corresponding lower seawater pCO2 (Fig. 2)). In the highest treatment, was five times lower than in the controls, meaning ingassing was 5 times higher. Interestingly, this increasing rate of CO2 ingassing (decreasing ) persisted in all treatments except for the controls, resulting in a 50 % increase towards the end of the experiment. The total cumulative net uptake of CO2 ranged from ∼16 to ∼30 µmol C kg−1 (Fig. S4) across treatments. Notably, no statistically significant differences in were observed between the different minerals.
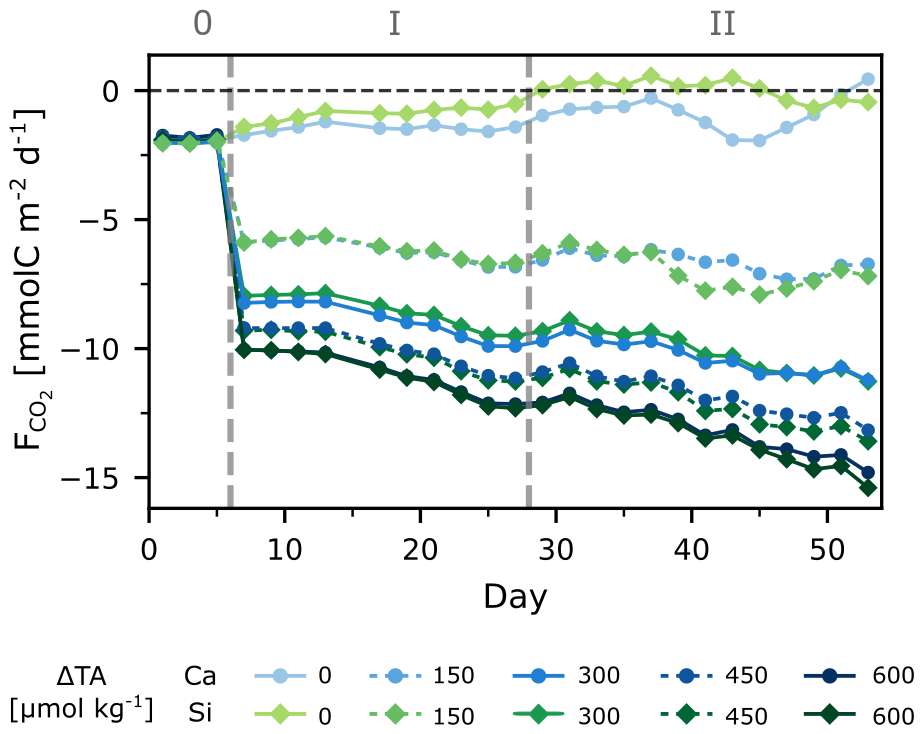
Figure 2Daily CO2 fluxes over time, with negative values indicating net influx (in-gassing), and positive values net outflux (out-gassing) to the atmosphere. See Sect. 2.6.1 for details. Dashed lines and roman numbers denote the different phases.
3.3 Estimated calcification rates and net community production
The response of normalized cumulative calcification (normalized CALC) to pCO2 was that of an optimum curve (fitting Eq. 9 from Gafar et al., 2018) for any given phase of the experiment (Fig. S7; Table 1). The calcium-based treatment with lowest TA addition (ΔTA 150 µmol kg−1) was deemed as an outlier (see Figs. S5a, S7) and thus excluded from analysis. A plateau was reached at about 250 µatm (Fig. 3a). The highest calculated CaCO3 production potential (CCPP) was observed at a pCO2 of about 200 µatm (Fig. S5). With up to 12 µmol kg−1 of CaCO3 produced, cumulative calcification was highest in low-to-intermediate TA treatments and close to zero in the two highest ones (Fig. S4a).
NCPDIC showed no significant differences between silicate- and calcium-based treatments during phase 1 (Figs. 4a, S7). The community responded to the nutrient addition, reaching a peak ∼10–15 d afterwards. NCPDIC in the silicate-based treatments reached about 52 µmol C kg−1, whereas in the calcium-based treatments the NCPDIC peaks were roughly half in magnitude. To better see potential differences during the bloom phase, we calculated the changes in daily NCPDIC relative to the mean NCPDIC values right after alkalinity manipulation to compare only phase 1 with both phases (1+2), as well as with phase 2, for which we used the mean NCPDIC values right after nutrient addition. The cumulative changes are plotted in Figs. 4b and S7. This gives a clearer perspective on how differently treatments reacted and the delays in bloom onset, if any. A general trend shows that silicate-based treatments reached higher bloom peaks than calcium-based ones, and higher alkalinity treatments took relatively longer to start blooming, assuming that the sampling resolution was high enough to capture all real bloom peaks.
To better assess whether a mineral or treatment effect influenced the NCPDIC responses, we proceeded to take the maximum production value during the bloom for each treatment and plotted it against the mean pCO2 value during the bloom period (Figs. 4c, S7). An ANCOVA analysis showed a pCO2 effect as maximum NCPDIC increased with decreasing pCO2/increasing alkalinity during phase 1, only a mineral effect during phase 2 and no pCO2 effect, but a clear mineral effect on production when both phases were considered together (Table 1).
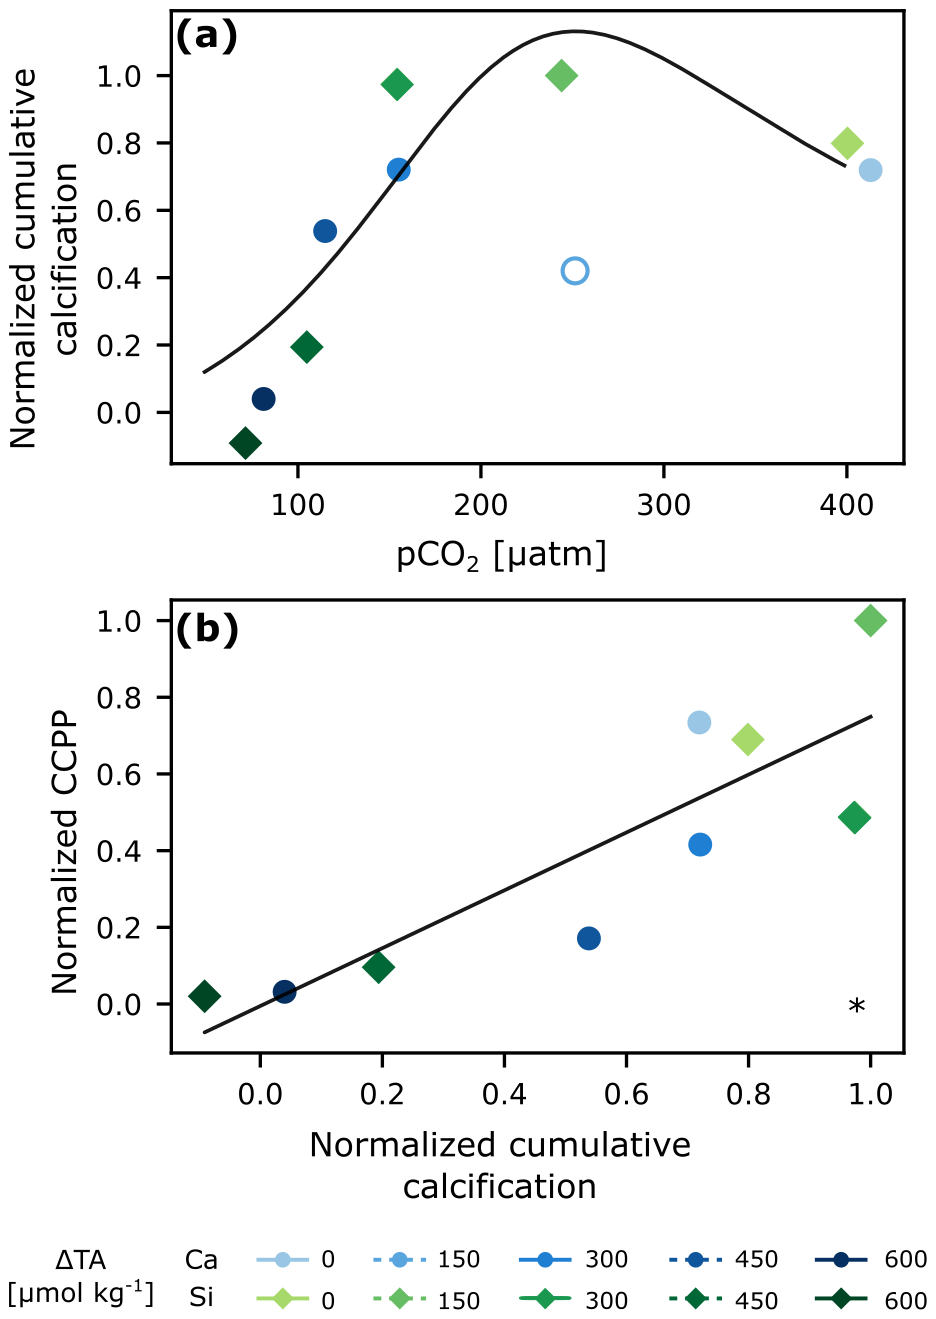
Figure 3Cumulative calcification (CALC) normalized (average of last 2 d) derived from carbonate chemistry parameters vs. pCO2 with optimum curve fitting (Eq. 9 in Gafar et al., 2018) (a), and normalized cumulative CaCO3 production potential (CCPP) vs normalized cumulative calcification (CALC) (b). The hollow circle was excluded from analysis. * p<0.05.
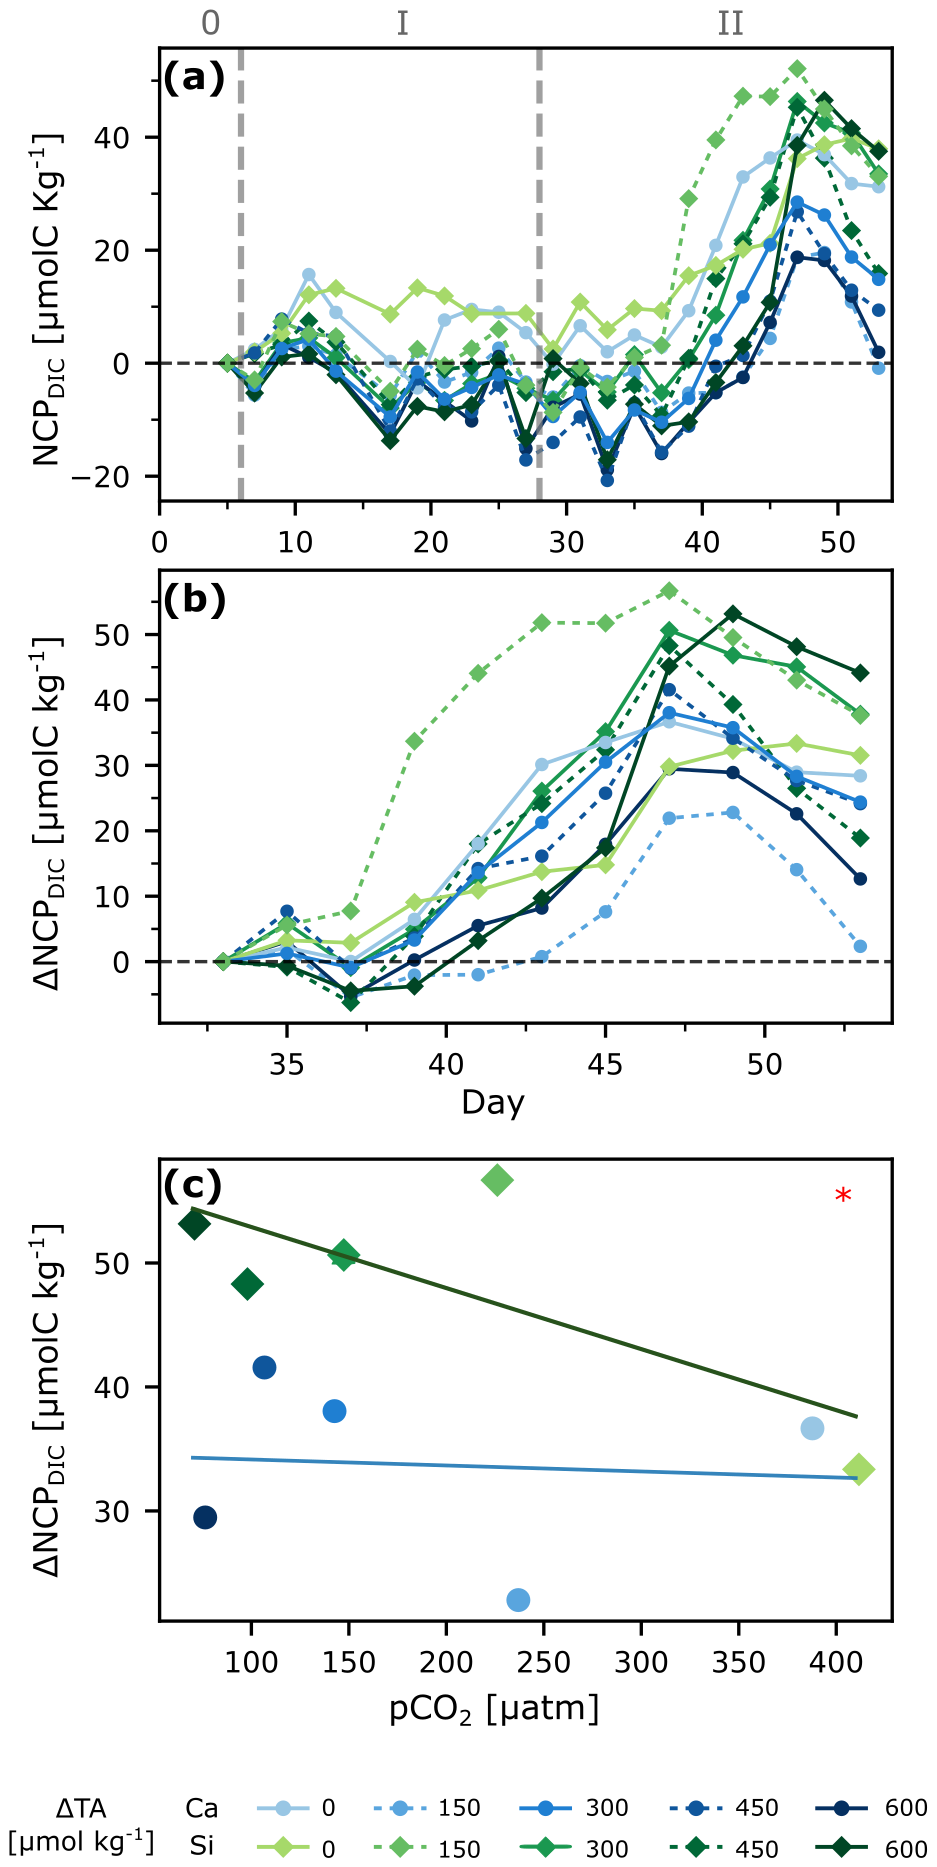
Figure 4Primary production under OAE. Net community production derived from changes in DIC (NCPDIC, see Sect. 2.6.2) over time (a), ΔNCPDIC relative to mean after nutrient addition for a better visualization of bloom peaks during phase 2 (b), and regression analysis of bloom peaks against pCO2 levels for phase 2 (c). ANCOVA revealed a significant mineral type effect in (c): p<0.05 (*).
To decouple air-sea gas exchange from biological DIC drawdown and to investigate the effects of silicate and calcium-based minerals on planktonic communities (in light of the proposed “white vs. green ocean” hypothesis), we simulated a non-CO2-equilibrated deployment of OAE and followed the development of the system over time. While significant mineral differences were observed for cumulative biogenic silica (diatom proxy), net community production derived from biological changes in DIC (NCPDIC) and for zooplankton respiration (RZ), no difference (or “mineral effect”) was detected for cumulative calcification and gas exchange. Additionally, some parameters were also affected by pCO2 in certain phases of the experiment (see Tables 1 and 2), and are further discussed in the following subsections.
Table 1Phase-specific responses of key variables to pCO2 gradients and mineral type under non-CO2-equilibrated OAE. Symbols denote the dominant effect, with arrows depicting the direction of response to decreasing pCO2/increasing TA addition.
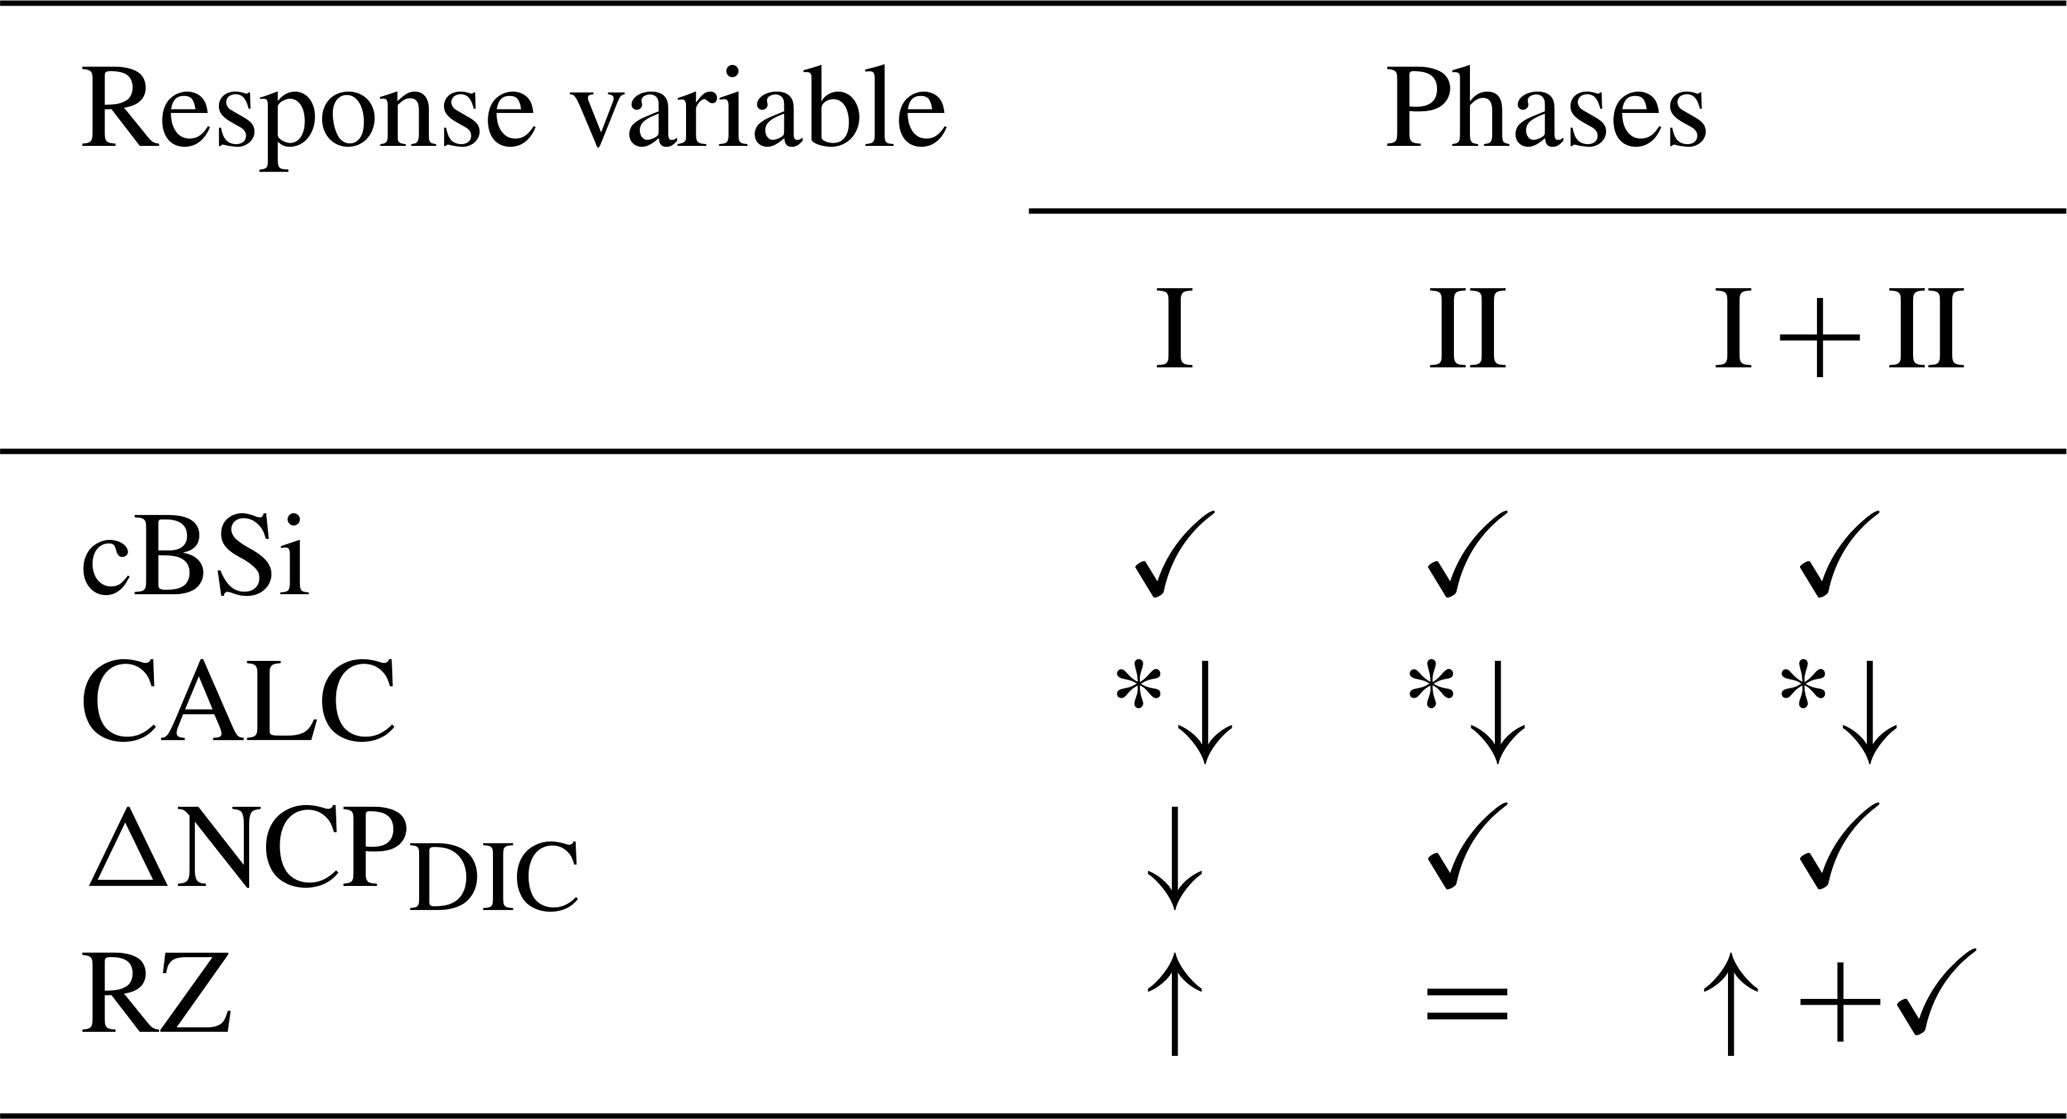
✓ Mineral effect; *↓ Optimum curve; = No effect; CO2; pCO2+ Mineral (no interaction)
4.1 The carbonate system
Manipulation of total alkalinity resulted in comparable treatment pairs in the calcium- and silicate-based treatments with a similar ΔTA, which remained relatively stable over time. This stability in TA suggests that the system stayed below the ΩA threshold for secondary CaCO3 precipitation. Based on calculations from (Marion et al., 2009), the threshold for spontaneous pseudo-homogeneous carbonate formation in the presence of organic colloids and particles, but in mineral-phase-free seawater, would be 11.1 for our average salinity and temperature of 32.6 and 11 °C respectively, which was indeed not reached (Fig. 1c). As expected for a non-CO2-equilibrated alkalinity addition, the TA manipulation induced predictable changes in carbonate chemistry speciation, i.e., increased pH and ΩA, and decreased pCO2, with no significant change to DIC (Fig. 1). The relative stability of DIC in the days following the TA addition, consistent with expectations for this oligotrophic phase of the experiment (phase I), supports the reliability of the DIC estimates derived from corrected pH measurements.
In the control treatments, DIC declined only slightly during the first 10 d, while remaining relatively stable thereafter. During the bloom in the second phase, slight increases in pH correlated with DIC decreases, suggesting a biological origin, i.e., primary production accompanied by nutrient uptake. DIC drawdown only began in phase II and was higher than expected from nitrate drawdown: 23–49 vs. 20 µmol kg−1 (Redfield C:N of 6.625⋅N). Higher values are commonly related to carbon overconsumption, which is known to happen in nutrient limited environments and with increasing temperature (Paul et al., 2016; Taucher et al., 2012). The pronounced DIC drawdown is difficult to detect in other carbonate chemistry parameters because they were either hardly affected (e.g., TA) or only slightly affected (e.g., pH and pCO2), with these small signals being obscured by the relatively large initial treatment differences compared to the more uniform DIC signal. Nevertheless, before drawing further conclusions on the biological or physical origin of these changes, CO2 uptake from air-sea gas exchange needs to be considered and is further addressed in the following sections.
4.2 Gas exchange
started at about −2 mmol m2 d−1, indicating that the system was already ingassing CO2 from the atmosphere during phase 0. This is related to the fact that the experiment was started during a post-bloom period, i.e., seawater pCO2 was lower than atmospheric levels, and the concentrations of dissolved inorganic nutrients were low. Furthermore, ingassing rates for the control treatments were within the range of natural air-sea flux estimates from the region (Aalto et al., 2021), indicating that the mesocosm setup did not hinder gas exchange during the experiment. After alkalinity addition, daily ingassing rates increased ( decreased) by a factor of 3–5 in the highest TA treatments (Fig. 2). The rates of daily ingassing continued to increase over time, even though the gradient between the atmosphere and seawater pCO2 would gradually decrease with atmospheric CO2 uptake.
Since the Schmidt number and the viscosity of gases are influenced by temperature, this is a relevant factor when it comes to diffusion of gases, which in this case may have played a major role. Throughout the experiment, temperature increased from ∼8.5 to ∼15.5 °C as we moved from late spring to early summer conditions (Fig. S1). Indeed, there was a statistically significant positive correlation of temperature and transfer velocity, and a fitting equation was derived to calculate transfer velocities [cm s−1] from in situ temperature [°C] (Eq. 7). While salinity is also an important factor impacting gas exchange, the relatively small changes throughout our experiment (∼0.1 units), were deemed non-significant for the fitting:
In contrast to a mesocosm setup, the most important factor influencing transfer velocity in open ocean settings is wind speed (ν). Though it is widely used to parameterize , it has an uncertainty of ∼20 % and is valid only for wind speeds in the range of 3 to 15 m s−1 (Wanninkhof, 2014). To investigate further, we estimated the wind speed according to Wanninkhof (1992) and Wanninkhof et al. (2009) using our derived transfer velocities. At our lowest measured temperature, ν was 1.16 m s−1, and, at our highest temperature, 1.92 m s−1. The mean ν obtained (at mean salinity and temperature) was 1.49 m s−1, differing from the mean wind speed near the area of about 3.5 m s−1 (Weather Underground, 2025). This is consistent with the use of the mesocosms, which provide some shelter to the enclosed waters in contrast to the surrounding fjord water, reflecting that wind speed alone does not drive gas exchange at low wind, but rather alters water surface texture. In this regard, Eq. (7) would be more suitable than wind speed to estimate under similar conditions, i.e., mesocosm setup and similar ranges of temperature and salinity.
Interestingly, daily rates of reached up to −15 mmol m2 d−1 for the highest treatments, which equaled to ∼30 µmol C kg−1 after a period of 47 d for a volume of 61.6 m3 (20 m mixed layer depth). Considering windspeeds of ∼ 1.5 m s−1 and a temperature of ∼15.5 °C, we simulated further ingassing until equilibration (95 %) of the mixed layer. We found it would take up to ∼1050 d to equilibrate. This timeframe is in line with the findings of He and Tyka (2023), who showed most locations to have an uptake efficiency plateau of 0.6–0.8 mol CO2 per mol of alkalinity after 3–4 years. While full equilibration spans several seasonal cycles, the timing of alkalinity addition can still influence uptake dynamics. The steepest pCO2 gradients and thus the largest fluxes occur soon after addition, with gas transfer velocity depending on temperature. Thus, in very cold waters there will likely be slower transfer velocities, not forgetting that windspeed and mixed layer depth would also modulate equilibration. Therefore, our results indicate that seasonality of natural systems should also be considered, in the timing and deployment site of OAE, as it will affect the short-term rate and efficiency of ingassing, even if long-term equilibration eventually dampens these effects.
4.3 Calcification
Because of the presence of the coccolithophore E. huxleyi, and some availability of inorganic nutrients right at the start of the experiment, there was an initial burst of calcification in all mesocosms (Fig. S4a), identified by a concomitant decrease in salinity-normalized TA. This initial calcification then quickly ceased due to nutrient limitation. After the addition of nutrients in phase II, calcification increased again, particularly in the lower TA treatments and controls (Fig. S4). When then overall cumulative calcification is related to pCO2 (Fig. 3), we find an optimum curve response as predicted in other lab studies for this CO2 range (Gafar et al., 2018). It is important to note, that having calcification (Fig. S4a) hovering around the zero line or being negative is most likely related to the inherent uncertainty stemming from a mass balance involving four measurements with their individual uncertainties (TA, salinity, nitrate and phosphate). Nevertheless, the consistent emergence of an optimum curve suggests that, despite these uncertainties, the overarching pattern is preserved across the whole experiment and within each phase (Fig. S7, Table 1). Specifically, mild alkalinity treatments (<ΔTA 300 µmol kg−1) enhanced calcification, while it was reduced and inhibited at ΔTA 450 and 600 µmol kg−1 respectively (pCO2<100 µatm tested here). These responses fall within the range of mean sensitivity responses to pCO2 for coccolithophores reported by Seifert et al. (2022). Intermediate pCO2 levels seem to provide an optimal balance of bicarbonate ions and H+ concentration, enhancing calcification rates.
Both Krug et al. (2011) and Bach et al. (2011) hypothesized that inhibition of calcification could be the result of substrate (CO2 and HCO) limitation on the one hand, and pH H+ inhibition on the other. The reason for external H+ constituting an inhibitor is that, during coccolithophorid calcification, H+ is internally being generated (e.g., Gafar et al., 2019; Suffrian et al., 2011; Taylor et al., 2011) and eventually needs to be channeled out of the cell to maintain pH homeostasis (Cyronak et al., 2016). Concerning substrate limitation for both calcification and photosynthesis, it does not matter which carbon species is actually being taken up into the cell, as at decreasing seawater pCO2, CO2 leakage out of the cytosol (pH ∼7, Anning et al., 1996) will increase due to the concentration gradient. Up to a certain level, this could be compensated for by boosting carbon concentration mechanisms such as active CO2 or HCO uptake, but this would come at increased metabolic costs (Badger and Price, 2003; Reinfelder, 2011).
Additionally, when cumulative TA-based calcification (CALC) is compared to cumulative coccolithophore abundance (based on flow-cytometric analysis), there is a linear, statistically significant relationship, suggesting that E. huxleyi was the dominant calcifier in our experiment, and showing that abundance can be some sort of measure for community calcification (Fig. S5). However, the fact that the difference between low and high TA addition in community calcification is about a factor of 10, while it is only a factor of 5 for abundance, indicates that not only cellular calcification rates were reduced at high TA additions, but also cellular CaCO3 quotas. A finding consistent with culture studies (e.g., Bach et al., 2011; Gafar et al., 2018; Gafar and Schulz, 2018).
While the cumulative calcification calculated here encompasses overall coccolithophore bloom dynamics, the response of calcification to changes in carbonate chemistry are typically described by changes in cellular rates. It is possible to link both by calculating the amount of CaCO3 that would be produced in a coccolithophore bloom using rates, derived from lab experiments, termed the CaCO3 production potential (CCPP, Gafar et al., 2018). Using the rates collected by Gafar and Schulz (2018) for the coccolithophore E. huxleyi, which are dependent on carbonate chemistry, light and temperature, and our average in-situ conditions, we estimated normalized CCPP and compared it to normalized cumulative calcification (Fig. 3b). The statistically significant linear correlation suggests that the overall bloom dynamics derived from changes in measured carbonate chemistry align with the behavior at the cellular level derived independently from rates specific to the coccolithophore E. huxleyi. In summary, there is enhanced calcification and CCPP at intermediate levels of pCO2 (∼250 µatm) following a non-CO2-equilibrated addition of alkalinity, but these are negatively impacted when going towards lower and higher levels of pCO2.
4.4 Net community production as a balance of photosynthesis and respiration
By accounting for the measured air-sea gas exchange, and factoring in the reductions caused by calcification, it is possible to isolate the change in DIC driven exclusively by biological activity such as photosynthesis and respiration (the NCPDIC). The in situ NCPDIC derived from cumulative changes in the DIC pool (Fig. 4a) encompasses autotrophic photosynthesis, decreasing DIC through the consumption of , and increasing DIC by both autotrophic and heterotrophic respiration. An increase in photosynthetic activity can be observed after the nutrient addition during phase II, as NCPDIC reached peak values, corroborated by the increase in Chl a (Fig. S1f). Furthermore, there appeared to be a general trend of silicate-based treatments reaching higher levels of NCPDIC than the calcium-based ones (Fig. 4c). This may be linked to the stoichiometry of inorganic nutrient availability. While in both treatments, nitrogen uptake was ∼3.6 µM in total. In the silicate-based treatments, silicate and nitrogen were consumed in a ratio of up to . In contrast, in the calcium-based treatments, the uptake ratio was reversed at , meaning that up to ∼10 times more silicate was drawn down in the silicate-based treatments within 20 d. This difference in uptake ratios was independent of the TA level, and thus likely driven by changes in diatom physiology and community composition, as discussed by Ferderer et al. (2024). Diatoms were likely Si-limited in phase 0, but could later allocate additional resources to growth (Inomura et al., 2023), potentially also explaining the higher measured NCP rates (Marín-Samper et al., 2024a) in the silicate-based treatments and, in turn, contributing to/causing the mineral effect detected here on NCPDIC.
It is also important to note that Ca2+ is already present in seawater at high background concentrations, and our additions only altered it by 0.8 %–3.1 %. In contrast, silicate was increased by several orders of magnitude, directly affecting a limiting macronutrient for diatoms. Hence, Si is the more plausible driver of the observed mineral effect on NCPDIC. Although no direct diatom counts were available, biogenic silica (BSi) measurements (Fig. S6) provide a useful proxy to corroborate this.
Phase-specific analysis showed only the pCO2 effect as statistically significant on NCPDIC during phase 1 (Fig. S7). However, this effect was small compared to the mineral-type effect observed in phase 2. When considering both phases together, only the mineral-type effect prevailed, suggesting that differences according to mineral-type might have been harder to detect under nutrient-limited conditions.
In summary, it appears that while there was no negative overall effect of the pCO2 level on NCPDIC, there was a positive effect of the silicate amendment. This is in line with the hypothesis of the green ocean suggested by Bach et al. (2019), though the white ocean enhanced by added calcium was not observed here. One reason could be the relatively low abundances of coccolithophores at the onset of the experiment, another the fact that only increased calcium concentrations paired with increased DIC upon full CO2 equilibration have been hypothesized to promote coccolithophorid calcification and growth (compare Bach, 2015; Bach et al., 2019). However, given the slow equilibration time on the order of years, and the fact that during this time the TA-treated waters are likely subject to substantial dilution (significantly reducing TA and hence the DIC increase upon full equilibration), a “white ocean” might not be something to expect.
Furthermore, since NCPDIC calculations are based on relative change over time, they are robust to potential offsets in pH-derived DIC estimates in the higher TA treatments. Thus, the mineral-type effects observed in NCPDIC would not change even if all values are skewed.
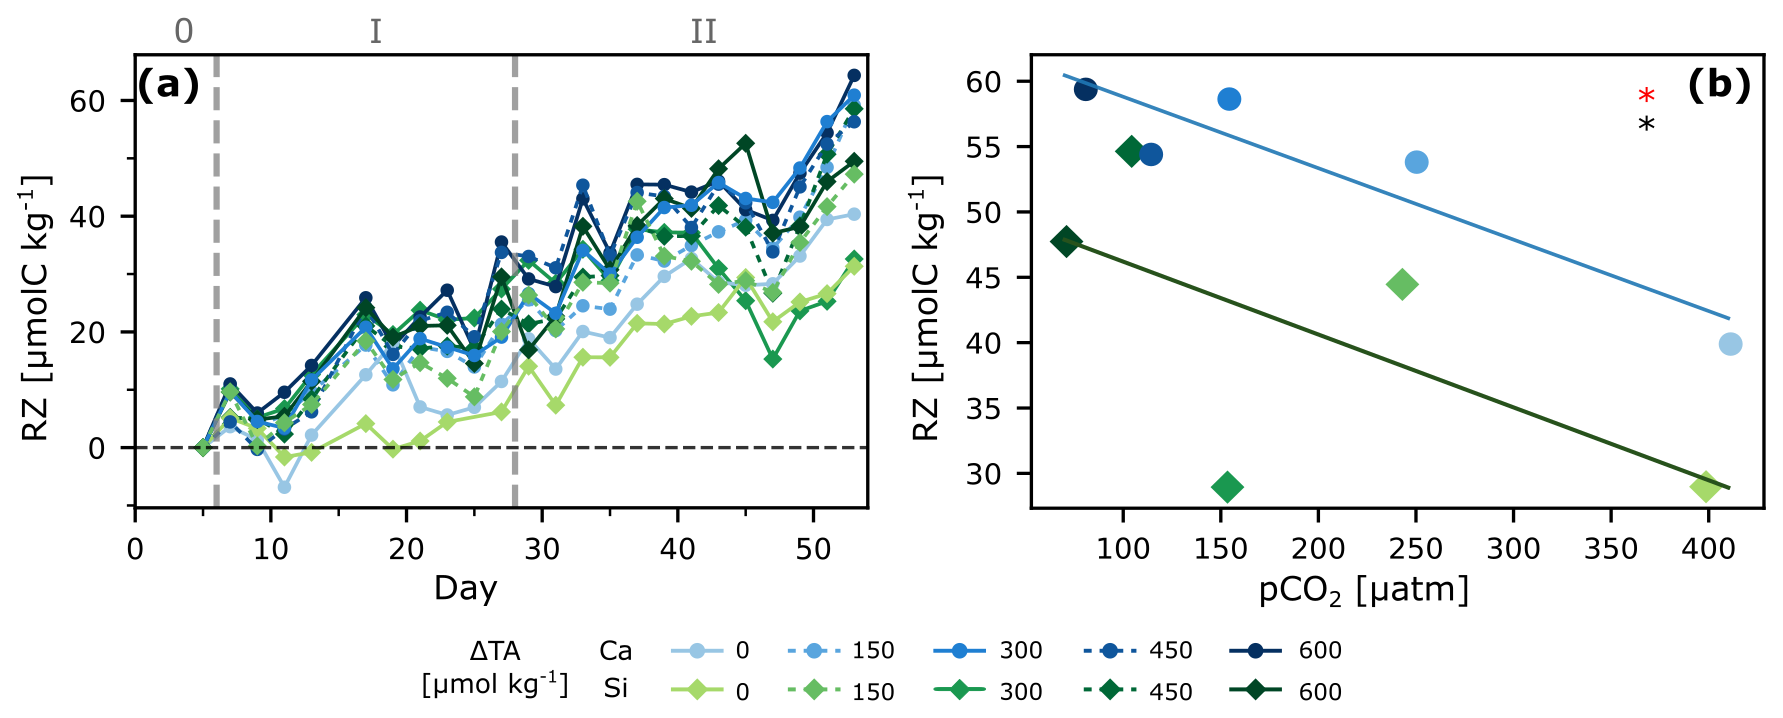
Figure 5Zooplankton under OAE. Respiration of Zooplankton and larger grazers (RZ) over time (a), and regression analysis of the entire span of the experiment as the last 2 d of cumulative change (averaged) vs. pCO2 (b). ANCOVA results: pCO2 (OAE treatment) effect: p<0.05 (black star), and mineral type effect: p<0.05 (red star).
The delay in bloom formation towards lower pCO2 observed here (Fig. 4b) was also reflected in in vitro oxygen production rates (Marín-Samper et al., 2024a) and was linked to both the mineral treatment and the TA level. These delays can be attributed to the previously reported, species-specific negative relationships between elevated pH low pCO2 levels and phytoplankton growth rates (Chen and Durbin, 1994; Hansen, 2002), as well as the aforementioned substrate/inhibitor concept, affecting growth rates (see Sect. 4.2). However, in terms of ecological significance, it is not clear if a phytoplankton bloom delay causes knock-on effects for higher trophic levels (e.g., mismatches with grazers). Hence, at this stage, it is difficult to draw clear conclusions or provide strong recommendations.
4.5 Zooplankton respiration
The main difference between the estimated in situ NCPDIC and NCP obtained from O2 measurements in separate incubations (see Marín-Samper et al., 2024a) is the exclusion of grazers (larger than 280 µm) in the latter since samples are filtered before incubation. Thus, comparing both approaches provides an estimate of the contribution of larger zooplankton and fish respiration to the carbon balance, calculated as (Eq. 8):
with RZ denoting cumulative zooplankton respiration (for simplicity, all larger grazers are encompassed here) and NCP the cumulative net community production derived from O2 incubation measurements, assuming a 1:1 O2:C conversion ratio. While this assumption provides a useful first-order estimate, it represents a simplification, since true respiratory and photosynthetic quotients can vary with community composition, nutrient availability, and metabolic pathways (Robinson, 2019).
Cumulative RZ ranged from 30 to 60 µmol kg−1 and was significantly correlated to pCO2 as well as to mineral treatment when considering the entire experiment (phases 1 + 2; Fig. 5). Interestingly, treatments with lower NCPDIC at higher TA addition (lower pCO2), showed higher RZ, particularly calcium-based treatments, suggesting enhanced top-down control on primary productivity. Possible explanations include direct effects of high pH at low pCO2 on zooplankton metabolism (Hessen and Nilssen, 1983; Pedersen and Hansen, 2003), if requiring more energy along the pCO2 gradient to maintain homeostasis under suboptimal conditions, as well as indirect effects via changes in phytoplankton community composition, influencing prey availability between the two mineral types. Furthermore, under low pCO2 conditions, phytoplankton can exhibit lower C:N ratios (Burkhardt et al., 1999), which increases their quality as food for zooplankton, likely leading to better growth and hence respiration rates.
Phase-specific analysis revealed that gradient effects dominated during the more oligotrophic phase 1, with respiration increasing towards lower pCO2 (Fig. S7, Table 1). However, the mineral-type effect was only statistically significant when both phases were combined, suggesting/supporting the hypothesis that shifts in community composition across phase, and their effects on prey availability, likely drove the cumulative pattern.
All this suggests that the response to carbonate chemistry perturbations might have resulted in an enhanced top-down control on primary productivity particularly in the higher TA addition treatments (which resulted in lower pCO2). Interestingly, Goldenberg et al. (2024), who investigated early life stages of fish during the same mesocosm experiment, showed that though fish abundance did not correlate to the treatment gradient, biomass did, and greater biomass could have a greater contribution to respiration. This aligns with our finding of higher respiration under lower pCO2 (corresponding to higher TA additions). Although no clear explanation could be found by the authors, it highlights the complex trophic interactions in pelagic ecosystems that require untangling. Finally, a recent study showed enhanced copepod grazing rates for certain OAE scenarios, although respiration rates did not seem to correlate with alkalinity addition (Bhaumik et al., 2025), again highlighting the lack of mechanistic understanding of the underlying processes.
Table 2Summary of main findings under non-CO2-equilibrated OAE for the whole experiment. “=” indicates no effect detected, while “✓” indicates a detected effect. The arrows depict the direction of the response to the pCO2 gradient (decreased: ↓; enhanced: ↑).
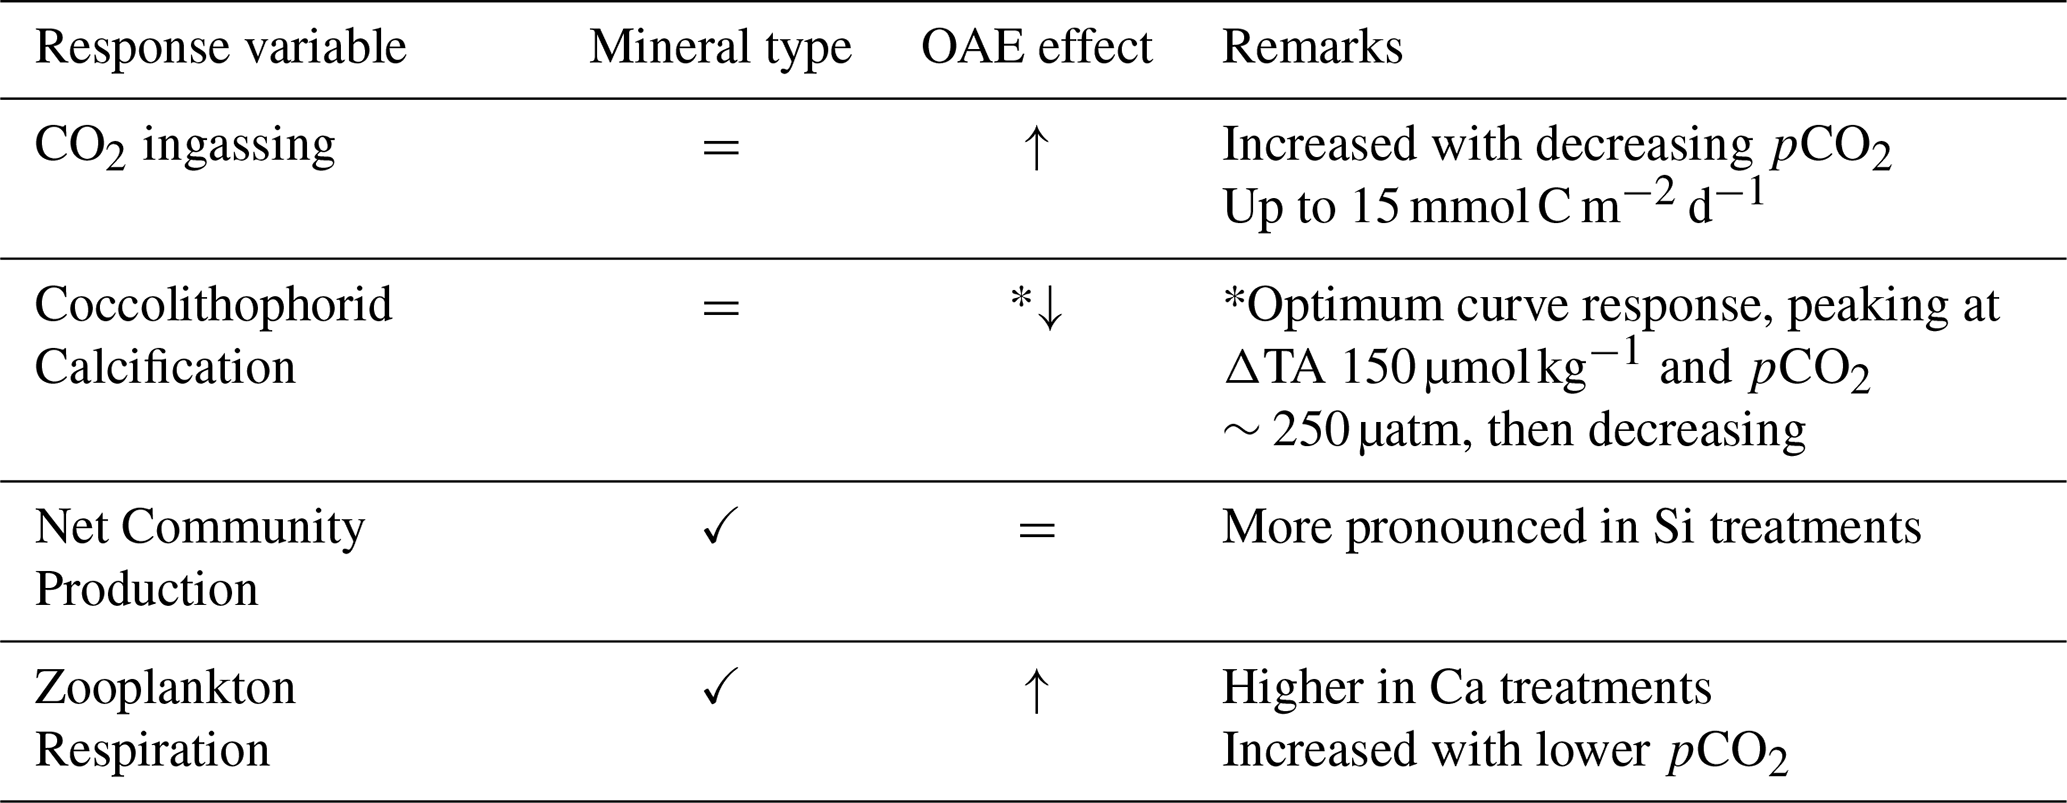
Our study shows that net CO2 ingassing can occur at rates of up to 15 mmol C m−2 per day after a non-CO2-equilibrated deployment of OAE. This equates to ∼30 µmol C kg−1 over 47 d for a 61.6 m3 volume under low wind conditions, with full equilibration projected after ∼ 1050 d. Furthermore, phytoplankton responses showed an optimum curve for coccolithophorid calcification with peaks at mild treatments (ΔTA 150 µmol kg−1, pCO2∼250 µatm), aligning with previous laboratory predictions. No significant effect on NCPDIC was observed with lowered pCO2, but a mineral effect was noted, with maximum NCPDIC being more pronounced in silicate-based treatments, potentially due to enhanced Si(OH)4 concentrations and the concomitant proliferation of diatoms, suggesting changes in community composition. Lastly, zooplankton respiration was lower in silicate-based treatments and increased with lower pCO2, indicating potentially enhanced top-down control on primary productivity. Based on our findings (Table 2), we conclude that under a “lime” scenario (without coinciding silicate addition), an OAE application would be unlikely to have a significant impact on the plankton community up to levels around ΔTA of 150 µmol kg−1. At higher levels of TA addition, in particular in a “olivine” scenario (that is in conjunction with added silicate), there might be complex interactions among multiple trophic levels, requiring further disentangling.
In summary, during this study we have gained insights into CO2 air-sea gas exchange dynamics, phytoplankton OAE responses, as well as more complex food web interactions, which highlight real-world deployment constraints. Future work should include longer-duration and/or field-scale trials (potentially along alkalinity gradients) that capture the broad multi-trophic community responses to establish clear ecological thresholds. Evaluation of a wider spectrum of alkalinity sources, including the use of particles, is also recommended to explore alternative deployment scenarios.
Data supporting this article can be found in the online repository PANGAEA: https://doi.org/10.1594/PANGAEA.983061 (Schneider et al., 2025). Dataset used for NCP: https://doi.org/10.1594/PANGAEA.972371 (Marín-Samper et al., 2024b).
The supplement related to this article is available online at https://doi.org/10.5194/bg-23-137-2026-supplement.
UR, KGS and LRK designed and conceptualized the mesocosm experiment. JS, KGS, CAM, LMS, LRK and JOC collected and analyzed samples in the laboratory. JS and KGS were responsible for data curation and formal analysis. JS, KGS, CAM and LMS interpreted results. JS prepared the original draft with particular input from KGS and contributions from all co-authors.
The research reported in the manuscript was conducted during academic activities, prior to the start of other employment. Julieta Schneider has been consulting for the start-up Planeteers GmbH, Germany, as a Geochemical Researcher since November 2024, and Joaquín Ortíz-Cortes is employed by Macrocarbon S.L., Spain, since October 2023.
Publisher's note: Copernicus Publications remains neutral with regard to jurisdictional claims made in the text, published maps, institutional affiliations, or any other geographical representation in this paper. The authors bear the ultimate responsibility for providing appropriate place names. Views expressed in the text are those of the authors and do not necessarily reflect the views of the publisher.
We would like to thank the University of Bergen, Marine Biological Station Espegrend, for the use of their facilities and help with logistics. This study involved huge team effort, so we are grateful to the staff and students from the KOSMOS team (GEOMAR) and all study participants for their contributions on site. In particular we thank: Andrea Ludwig and Jana Meyer for logistical support and coordination of on-site activities; Anton Theileis and Jan Hennke for mesocosm preparation, technical support and maintenance; Daniel Brüggemann, Philipp Süßle, Joaquin Ortiz, Nicolás Sánchez, Carsten Spisla and Michael Sswat for onsite scientific diving activities and maintenance. Extended thanks go to Juliane Tammen and Peter Fritzsche for the measurement of dissolved inorganic nutrients, to Nwafor Chukwudi for measurement of the N2O samples in Kiel, to Niels Suitner for the interesting discussions on data interpretation, and to Alex Leuschner for co-designing the key figure.
This study was funded by the OceanNETS project (“Ocean-based Negative Emissions Technologies – analyzing the feasibility, risks and co-benefits of ocean-based negative emission technologies for stabilizing the climate”, EU Horizon 2020 Research and Innovation Program, grant no. 869357), and the Helmholtz European Partnering project Ocean-CDR (“Ocean-based carbon dioxide removal strategies”, Project No.: PIE-0021). Huge support from the AQUACOSM-plus project (EU H2020-INFRAIA Project No. 871081, “AQUACOSM-plus: Network of Leading European AQUAtic MesoCOSM Facilities Connecting Rivers, Lakes, Estuaries and Oceans in Europe and beyond”) was provided as well.
The article processing charges for this open-access publication were covered by the GEOMAR Helmholtz Centre for Ocean Research Kiel.
This paper was edited by Perran Cook and reviewed by two anonymous referees.
Aalto, N. J., Campbell, K., Eilertsen, H. C., and Bernstein, H. C.: Drivers of Atmosphere-Ocean CO2 Flux in Northern Norwegian Fjords, Front. Mar. Sci., 8, 692093, https://doi.org/10.3389/FMARS.2021.692093, 2021.
Anning, T., Nimer, N., Merrett, M. J., and Brownlee, C.: Costs and benefits of calcification in coccolithophorids, Journal of Marine Systems, 9, 45–56, https://doi.org/10.1016/0924-7963(96)00015-2, 1996.
Archontikis, O. A., Probert, I., Beaufort, L., Rickaby, R. E. M., Filatov, D. A., Bendif, E. M., and Bendif, M.: Taxonomic and nomenclatural notes on the coccolithophore Gephyrocapsa huxleyi (Noelaerhabdaceae, Haptophyta) and related species, Notul. Algarum, 307, 1–9, 2023.
Bach, L. T.: Reconsidering the role of carbonate ion concentration in calcification by marine organisms, Biogeosciences, 12, 4939–4951, https://doi.org/10.5194/bg-12-4939-2015, 2015.
Bach, L. T., Riebesell, U., and Schulz, K. G.: Distinguishing between the effects of ocean acidification and ocean carbonation in the coccolithophore Emiliania huxleyi, Limnol. Oceanogr., 56, 2040–2050, https://doi.org/10.4319/lo.2011.56.6.2040, 2011.
Bach, L. T., Gill, S. J., Rickaby, R. E. M., Gore, S., and Renforth, P.: CO2 Removal With Enhanced Weathering and Ocean Alkalinity Enhancement: Potential Risks and Co-benefits for Marine Pelagic Ecosystems, Frontiers in Climate, 1, 7, https://doi.org/10.3389/fclim.2019.00007, 2019.
Badger, M. R. and Price, G. D.: CO2 concentrating mechanisms in cyanobacteria: molecular components, their diversity and evolution, J. Exp. Bot., 54, 609–622, https://doi.org/10.1093/jxb/erg076, 2003.
Bhaumik, A., Faucher, G., Henning, M., Meunier, C. L., and Boersma, M.: Prey dynamics as a buffer: Enhancing copepod resilience to Ocean Alkalinity Enhancement, Environmental Research Letters, 20, 024058, https://doi.org/10.1088/1748-9326/adaa8c, 2025.
Bockmon, E. E. and Dickson, A. G.: A seawater filtration method suitable for total dissolved inorganic carbon and pH analyses, Limnol. Oceanogr. Methods, 12, 191–195, https://doi.org/10.4319/LOM.2014.12.191, 2014.
Burkhardt, S., Zondervan, I., and Riebesell, U.: Effect of CO2 concentration on ratio in marine phytoplankton: A species comparison, Limnol. Oceanogr., 44, 683–690, https://doi.org/10.4319/lo.1999.44.3.0683, 1999.
Caserini, S., Pagano, D., Campo, F., Abbà, A., De Marco, S., Righi, D., Renforth, P., and Grosso, M.: Potential of Maritime Transport for Ocean Liming and Atmospheric CO2 Removal, Frontiers in Climate, 3, 1–18, https://doi.org/10.3389/fclim.2021.575900, 2021.
Chen, C. Y. and Durbin, E. G.: Effects of pH on the growth and carbon uptake of marine phytoplankton, Mar. Ecol. Prog. Ser., 109, 83–94, https://doi.org/10.3354/meps109083, 1994.
Cyronak, T., Schulz, K. G., and Jokiel, P. L.: The Omega myth: what really drives lower calcification rates in an acidifying ocean, ICES Journal of Marine Science, 73, 558–562, https://doi.org/10.1093/ICESJMS/FSV075, 2016.
Czerny, J., Schulz, K. G., Ludwig, A., and Riebesell, U.: Technical Note: A simple method for air–sea gas exchange measurements in mesocosms and its application in carbon budgeting, Biogeosciences, 10, 1379–1390, https://doi.org/10.5194/bg-10-1379-2013, 2013.
Denman, K. L.: Climate change, ocean processes and ocean iron fertilization, Mar. Ecol. Prog. Ser., 364, 219–225, https://doi.org/10.3354/meps07542, 2008.
Dickson, A. G.: Thermodynamics of the dissociation of boric acid in synthetic seawater from 273.15 to 318.15 K, Deep Sea Research Part A. Oceanographic Research Papers, 37, 755–766, https://doi.org/10.1016/0198-0149(90)90004-F, 1990.
Dickson, A. G.: Standards for Ocean Measurements, Oceanography, 23, 34–47, https://doi.org/10.5670/OCEANOG.2010.22, 2010.
Dickson, A. G. and Riley, J. P.: The estimation of acid dissociation constants in sea-water media from potentiometric titrations with strong base. II. The dissociation of phosphoric acid, Mar. Chem., 7, 101–109, https://doi.org/10.1016/0304-4203(79)90002-1, 1979.
Dickson, A. G., Sabine, C. L., and Christian, J. R. (Eds.): Guide to best practices for ocean CO2 measurements, IOCCP Rep. 8 North Pacific Marine Science Organization, 191 pp., Sidney, ISBN 1-897176-07-4, 2007.
Doney, S. C., Shallin Busch, D., Cooley, S. R., and Kroeker, K. J.: The Impacts of Ocean Acidification on Marine Ecosystems and Reliant Human Communities, Annu. Rev. Environ. Resour., 45, 83–112, https://doi.org/10.1146/annurev-environ-012320-083019, 2020.
Douglas, N. K. and Byrne, R. H.: Achieving accurate spectrophotometric pH measurements using unpurified meta-cresol purple, Mar. Chem., 190, 66–72, https://doi.org/10.1016/J.MARCHEM.2017.02.004, 2017.
Feng, E. Y., Keller, D. P., Koeve, W., and Oschlies, A.: Could artificial ocean alkalinization protect tropical coral ecosystems from ocean acidification?, Environmental Research Letters, 11, 074008, https://doi.org/10.1088/1748-9326/11/7/074008, 2016.
Ferderer, A., Schulz, K. G., Riebesell, U., Baker, K. G., Chase, Z., and Bach, L. T.: Investigating the effect of silicate- and calcium-based ocean alkalinity enhancement on diatom silicification, Biogeosciences, 21, 2777–2794, https://doi.org/10.5194/bg-21-2777-2024, 2024.
Fuhr, M., Geilert, S., Schmidt, M., Liebetrau, V., Vogt, C., Ledwig, B., and Wallmann, K.: Kinetics of Olivine Weathering in Seawater: An Experimental Study, Frontiers in Climate, 4, 831587, https://doi.org/10.3389/fclim.2022.831587, 2022.
Gafar, N. A. and Schulz, K. G.: A three-dimensional niche comparison of Emiliania huxleyi and Gephyrocapsa oceanica: reconciling observations with projections, Biogeosciences, 15, 3541–3560, https://doi.org/10.5194/bg-15-3541-2018, 2018.
Gafar, N. A., Eyre, B. D., and Schulz, K. G.: A conceptual model for projecting coccolithophorid growth, calcification and photosynthetic carbon fixation rates in response to global ocean change, Front. Mar. Sci., 4, https://doi.org/10.3389/FMARS.2017.00433, 2018.
Gafar, N. A., Eyre, B. D., and Schulz, K. G.: Particulate inorganic to organic carbon production as a predictor for coccolithophorid sensitivity to ongoing ocean acidification, Limnol. Oceanogr. Lett., 4, 62–70, https://doi.org/10.1002/LOL2.10105, 2019.
Gattuso, J.-P., Gao, K., Lee, K., Rost, B., and Schulz, K. G.: Approaches and tools to manipulate the carbonate chemistry (Chapter 2), in: Guide to best practices for cean acidification research and data reporting, Publications Office of the European Union, 41–52, https://doi.org/10.2777/66906, 2010.
Glatzel, S. and Well, R.: Evaluation of septum-capped vials for storage of gas samples during air transport, Environ. Monit. Assess., 136, 307–311, https://doi.org/10.1007/S10661-007-9686-2, 2008.
Goldenberg, S. U., Riebesell, U., Brüggemann, D., Börner, G., Sswat, M., Folkvord, A., Couret, M., Spjelkavik, S., Sánchez, N., Jaspers, C., and Moyano, M.: Early life stages of fish under ocean alkalinity enhancement in coastal plankton communities, Biogeosciences, 21, 4521–4532, https://doi.org/10.5194/bg-21-4521-2024, 2024.
Hansen, H. P. and Koroleff, F.: Determination of nutrients, in: Methods of Seawater Analysis, John Wiley & Sons, Ltd, 159–228, https://doi.org/10.1002/9783527613984.ch10, 1999.
Hansen, P. J.: Effect of high pH on the growth and survival of marine phytoplankton: implications for species succession, Aquatic Microbial Ecology, 28, 279–288, 2002.
Hartmann, J., West, A. J., Renforth, P., Köhler, P., De La Rocha, C. L., Wolf-Gladrow, D. A., Dürr, H. H., and Scheffran, J.: Enhanced chemical weathering as a geoengineering strategy to reduce atmospheric carbon dioxide, supply nutrients, and mitigate ocean acidification, Reviews of Geophysics, 51, 113–149, https://doi.org/10.1002/ROG.20004, 2013.
Hartmann, J., Suitner, N., Lim, C., Schneider, J., Marín-Samper, L., Arístegui, J., Renforth, P., Taucher, J., and Riebesell, U.: Stability of alkalinity in ocean alkalinity enhancement (OAE) approaches – consequences for durability of CO2 storage, Biogeosciences, 20, 781–802, https://doi.org/10.5194/bg-20-781-2023, 2023.
He, J. and Tyka, M. D.: Limits and CO2 equilibration of near-coast alkalinity enhancement, Biogeosciences, 20, 27–43, https://doi.org/10.5194/bg-20-27-2023, 2023.
Henderson, G. M., Rickaby, R. E. M., and Bouman, H.: Decreasing atmosphere CO2 by increasing ocean alkalinity, University of Oxford, Oxford, UK, https://www.earth.ox.ac.uk/~gideonh/reports/Cquestrate_report.pdf (last access: 20 January 2025), 2008.
Hessen, D. O. and Nilssen, J. P.: High pH and the abundances of two commonly co-ocurring freshwater copepods (Copepoda, Cyclopida), Ann. Limnol., 19, 195–201, https://doi.org/10.1051/limn/1983022, 1983.
Ho, D. T.: Carbon dioxide removal is an ineffective time machine, Nature, 616, 9, https://doi.org/10.1038/D41586-023-00953-X, 2023.
Hoover, T. E. and Berkshire, D. C.: Effects of hydration on carbon dioxide exchange across an air-water interface, J. Geophys. Res., 74, 456–464, https://doi.org/10.1029/jb074i002p00456, 1969.
Hudson-Heck, E., Liu, X., and Byrne, R. H.: Purification and Physical–Chemical Characterization of Bromocresol Purple for Carbon System Measurements in Freshwaters, Estuaries, and Oceans, ACS Omega, 6, 17941–17951, https://doi.org/10.1021/acsomega.1c01579, 2021.
Humphreys, M. P., Lewis, E. R., Sharp, J. D., and Pierrot, D.: PyCO2SYS v1.8: marine carbonate system calculations in Python, Geosci. Model Dev., 15, 15–43, https://doi.org/10.5194/gmd-15-15-2022, 2022.
Humphreys, M. P. and Matthews, R. S.: Calkulate: total alkalinity from titration data in Python, Zenodo [code], https://doi.org/10.5281/zenodo.2634304, 2024a.
Humphreys, M. P., Schiller, A. J., Sandborn, D., Gregor, L., Pierrot, D., van Heuven, S. M. A. C., Lewis, E. R., and Wallace, D. W. R.: PyCO2SYS: marine carbonate system calculations in Python, Zenodo [code], https://doi.org/10.5281/ZENODO.14506565, 2024b.
Inomura, K., José, J., Karlusich, P., Dutkiewicz, S., Deutsch, C., Harrison, P. J., and Bowler, C.: High Growth Rate of Diatoms Explained by Reduced Carbon Requirement and Low Energy Cost of Silica Deposition, Microbiol. Spectr., 11, e0331122, https://doi.org/10.1128/SPECTRUM.03311-22, 2023.
IPCC: Summary for Policymakers, in: Climate Change 2021: The Physical Science Basis. Contribution of Working Group I to the Sixth Assessment Report of the Intergovernmental Panel on Climate Change, edited by: Masson-Delmotte, V., Zhai, P., Pirani, A., Connors, S. L., Péan, C., Berger, S., Caud, N., C. L., Goldfarb, M. I., Gomis, M., Huang, K., Leitzell, E. L. J. B. R., Matthews, Y., Maycock, T. K., Waterfield, T., Yelekçi, O., Yu, R., and Zhou, B., Cambridge University Press, Cambridge, https://doi.org/10.1017/9781009157896.001, 2021.
Kheshgi, H. S.: Sequestering atmospheric carbon dioxide by increasing ocean alkalinity, Energy, 20, 915–922, https://doi.org/10.1016/0360-5442(95)00035-F, 1995.
Kock, A., Arévalo-Martínez, D. L., Löscher, C. R., and Bange, H. W.: Extreme N2O accumulation in the coastal oxygen minimum zone off Peru, Biogeosciences, 13, 827–840, https://doi.org/10.5194/bg-13-827-2016, 2016.
Köhler, P., Hartmann, J., and Wolf-Gladrow, D. A.: Geoengineering potential of artificially enhanced silicate weathering of olivine, P. Natl. Acad. Sci. USA, 107, 20228–20233, https://doi.org/10.1073/pnas.1000545107, 2010.
Kroeker, K. J., Kordas, R. L., Crim, R. N., and Singh, G. G.: Meta-analysis reveals negative yet variable effects of ocean acidification on marine organisms, Ecol. Lett., 13, 1419–1434, https://doi.org/10.1111/j.1461-0248.2010.01518.x, 2010.
Krug, S. A., Schulz, K. G., and Riebesell, U.: Effects of changes in carbonate chemistry speciation on Coccolithus braarudii: a discussion of coccolithophorid sensitivities, Biogeosciences, 8, 771–777, https://doi.org/10.5194/bg-8-771-2011, 2011.
Lan, X., Tans, P., and Thoning, K. W.: Trends in globally-averaged CO2 determined from NOAA Global Monitoring Laboratory measurements, NOAA GML, https://doi.org/10.15138/9N0H-ZH07, 2025.
Mahdi Bendif, E., Probert, I., Young, J. R., and Von Dassow, P.: Morphological and Phylogenetic Characterization of New Gephyrocapsa Isolates Suggests Introgressive Hybridization in the Emiliania/Gephyrocapsa Complex (Haptophyta), Protist, 166, 323–336, https://doi.org/10.1016/j.protis.2015.05.003, 2015.
Marín-Samper, L., Arístegui, J., Hernández-Hernández, N., and Riebesell, U.: Responses of microbial metabolic rates to non-equilibrated silicate- versus calcium-based ocean alkalinity enhancement, Biogeosciences, 21, 5707–5724, https://doi.org/10.5194/bg-21-5707-2024, 2024a.
Marín-Samper, L., Arístegui, J., Hernández-Hernández, N., and Riebesell, U.: KOSMOS 2022 Bergen mesocosm study on ocean alkalinity enhancement: phytoplankton metabolic rates, PANGAEA [data set], https://doi.org/10.1594/PANGAEA.972371, 2024b.
Marion, G. M., Millero, F. J., and Feistel, R.: Precipitation of solid phase calcium carbonates and their effect on application of seawater SA–T–P models, Ocean Sci., 5, 285–291, https://doi.org/10.5194/os-5-285-2009, 2009.
Montserrat, F., Renforth, P., Hartmann, J., Leermakers, M., Knops, P., and Meysman, F. J. R.: Olivine Dissolution in Seawater: Implications for CO2 Sequestration through Enhanced Weathering in Coastal Environments, Environmental Science & Technology, 51, 3960–3972, https://doi.org/10.1021/acs.est.6b05942, 2017.
Moras, C. A., Bach, L. T., Cyronak, T., Joannes-Boyau, R., and Schulz, K. G.: Ocean alkalinity enhancement – avoiding runaway CaCO3 precipitation during quick and hydrated lime dissolution, Biogeosciences, 19, 3537–3557, https://doi.org/10.5194/bg-19-3537-2022, 2022.
Moras, C. A., Cyronak, T., Bach, L. T., Joannes-Boyau, R., and Schulz, K. G.: Effects of grain size and seawater salinity on magnesium hydroxide dissolution and secondary calcium carbonate precipitation kinetics: implications for ocean alkalinity enhancement, Biogeosciences, 21, 3463–3475, https://doi.org/10.5194/bg-21-3463-2024, 2024.
National Academies of Sciences: A Research Strategy for Ocean-based Carbon Dioxide Removal and Sequestration, National Academies Press, Washington DC, 1–308 pp., https://doi.org/10.17226/26278, 2022.
Oschlies, A., Bach, L. T., Rickaby, R. E. M., Satterfield, T., Webb, R., and Gattuso, J.-P.: Climate targets, carbon dioxide removal, and the potential role of ocean alkalinity enhancement, in: Guide to Best Practices in Ocean Alkalinity Enhancement Research, edited by: Oschlies, A., Stevenson, A., Bach, L. T., Fennel, K., Rickaby, R. E. M., Satterfield, T., Webb, R., and Gattuso, J.-P., Copernicus Publications, State Planet, 2-oae2023, 1, https://doi.org/10.5194/sp-2-oae2023-1-2023, 2023.
Paul, A. J., Haunost, M., Goldenberg, S. U., Hartmann, J., Sánchez, N., Schneider, J., Suitner, N., and Riebesell, U.: Ocean alkalinity enhancement in an open-ocean ecosystem: biogeochemical responses and carbon storage durability, Biogeosciences, 22, 2749–2766, https://doi.org/10.5194/bg-22-2749-2025, 2025.
Paul, C., Sommer, U., Garzke, J., Moustaka-Gouni, M., Paul, A., and Matthiessen, B.: Effects of increased CO2 concentration on nutrient limited coastal summer plankton depend on temperature, Limnol. Oceanogr., 61, 853–868, https://doi.org/10.1002/LNO.10256, 2016.
Pedersen, M. F. and Hansen, P. J.: Effects of high pH on a natural marine planktonic community, Mar. Ecol. Prog. Ser., 260, https://doi.org/10.3354/meps260019, 2003.
Peters, G. P.: The “best available science” to inform 1.5 °C policy choices, Nat. Clim. Chang., 6, 646–649, https://doi.org/10.1038/nclimate3000, 2016.
Redfield, A. C.: On the proportions of organic derivatives in sea water and their relation to the composition of plankton, in: James Johnstone Memorial Volume, edited by: Daniel, R. J., University Press of Liverpool, Liverpool, UK, 176–192, 1934.
Reinfelder, J. R.: Carbon concentrating mechanisms in eukaryotic marine phytoplankton, Ann. Rev. Mar. Sci., 3, 291–315, https://doi.org/10.1146/ANNUREV-MARINE-120709-142720, 2011.
Renforth, P. and Henderson, G.: Assessing ocean alkalinity for carbon sequestration, Reviews of Geophysics, 55, 636–674, https://doi.org/10.1002/2016RG000533, 2017.
Riebesell, U., Czerny, J., von Bröckel, K., Boxhammer, T., Büdenbender, J., Deckelnick, M., Fischer, M., Hoffmann, D., Krug, S. A., Lentz, U., Ludwig, A., Muche, R., and Schulz, K. G.: Technical Note: A mobile sea-going mesocosm system – new opportunities for ocean change research, Biogeosciences, 10, 1835–1847, https://doi.org/10.5194/bg-10-1835-2013, 2013.
Robinson, C.: Microbial Respiration, the Engine of Ocean Deoxygenation, Front. Mar. Sci., 5, https://doi.org/10.3389/fmars.2018.00533, 2019.
Rogelj, J., Schaeffer, M., Friedlingstein, P., Gillett, N. P., Van Vuuren, D. P., Riahi, K., Allen, M., and Knutti, R.: Differences between carbon budget estimates unravelled, Nature Climate Change, 6, 245–252, https://doi.org/10.1038/nclimate2868, 2016.
Rogelj, J., Popp, A., Calvin, K. V., Luderer, G., Emmerling, J., Gernaat, D., Fujimori, S., Strefler, J., Hasegawa, T., Marangoni, G., Krey, V., Kriegler, E., Riahi, K., Van Vuuren, D. P., Doelman, J., Drouet, L., Edmonds, J., Fricko, O., Harmsen, M., Havlík, P., Humpenöder, F., Stehfest, E., and Tavoni, M.: Scenarios towards limiting global mean temperature increase below 1.5 °C, Nat. Clim. Chang., 8, 325–332, https://doi.org/10.1038/s41558-018-0091-3, 2018.
Sabine, C. L. and Tanhua, T.: Estimation of Anthropogenic CO2 Inventories in the Ocean, Annu. Rev. Marine. Sci, 2, 175–198, https://doi.org/10.1146/annurev-marine-120308-080947, 2010.
Schellnhuber, H. J., Rahmstorf, S., and Winkelmann, R.: Why the right climate target was agreed in Paris, Nat. Clim. Chang, 6, 649–653, https://doi.org/10.1038/nclimate3013, 2016.
Schneider, J., Riebesell, U., Moras, C., Marín-Samper, L., Kittu, L., Ortiz Cortes, J., and Schulz, K. G.: KOSMOS 2022 Bergen mesocosm study on ocean alkalinity enhancement: carbonate chemistry, CO2 flux data and calcification estimates, PANGAEA [data set], https://doi.org/10.1594/PANGAEA.983061, 2025.
Schulz, K. G., Riebesell, U., Rost, B., Thoms, S., and Zeebe, R. E.: Determination of the rate constants for the carbon dioxide to bicarbonate inter-conversion in pH-buffered seawater systems, Marine Chemistry, 100, 53–65, https://doi.org/10.1016/j.marchem.2005.11.001, 2006.
Schulz, K. G., Bellerby, R. G. J., Brussaard, C. P. D., Büdenbender, J., Czerny, J., Engel, A., Fischer, M., Koch-Klavsen, S., Krug, S. A., Lischka, S., Ludwig, A., Meyerhöfer, M., Nondal, G., Silyakova, A., Stuhr, A., and Riebesell, U.: Temporal biomass dynamics of an Arctic plankton bloom in response to increasing levels of atmospheric carbon dioxide, Biogeosciences, 10, 161–180, https://doi.org/10.5194/bg-10-161-2013, 2013.
Schulz, K. G., Bach, L. T., Bellerby, R. G. J., Bermúdez, R., Büdenbender, J., Boxhammer, T., Czerny, J., Engel, A., Ludwig, A., Meyerhöfer, M., Larsen, A., Paul, A. J., Sswat, M., and Riebesell, U.: Phytoplankton blooms at increasing levels of atmospheric carbon dioxide: Experimental evidence for negative effects on prymnesiophytes and positive on small picoeukaryotes, Front. Mar. Sci., 4, https://doi.org/10.3389/fmars.2017.00064, 2017.
Schulz, K. G., Bach, L. T., and Dickson, A. G.: Seawater carbonate chemistry considerations for ocean alkalinity enhancement research: theory, measurements, and calculations, in: Guide to Best Practices in Ocean Alkalinity Enhancement Research, edited by: Oschlies, A., Stevenson, A., Bach, L. T., Fennel, K., Rickaby, R. E. M., Satterfield, T., Webb, R., and Gattuso, J.-P., Copernicus Publications, State Planet, 2-oae2023, 2, https://doi.org/10.5194/sp-2-oae2023-2-2023, 2023.
Seifert, M., Nissen, C., Rost, B., and Hauck, J.: Cascading effects augment the direct impact of CO2 on phytoplankton growth in a biogeochemical model, Elementa: Science of the Anthropocene, 10, https://doi.org/10.1525/ELEMENTA.2021.00104, 2022.
Spilling, K., Schulz, K. G., Paul, A. J., Boxhammer, T., Achterberg, E. P., Hornick, T., Lischka, S., Stuhr, A., Bermúdez, R., Czerny, J., Crawfurd, K., Brussaard, C. P. D., Grossart, H.-P., and Riebesell, U.: Effects of ocean acidification on pelagic carbon fluxes in a mesocosm experiment, Biogeosciences, 13, 6081–6093, https://doi.org/10.5194/bg-13-6081-2016, 2016.
Suffrian, K., Schulz, K. G., Gutowska, M. A., Riebesell, U., and Bleich, M.: Cellular pH measurements in Emiliania huxleyi reveal pronounced membrane proton permeability, New Phytologist, 190, 595–608, https://doi.org/10.1111/J.1469-8137.2010.03633.X, 2011.
Suitner, N., Faucher, G., Lim, C., Schneider, J., Moras, C. A., Riebesell, U., and Hartmann, J.: Ocean alkalinity enhancement approaches and the predictability of runaway precipitation processes: results of an experimental study to determine critical alkalinity ranges for safe and sustainable application scenarios, Biogeosciences, 21, 4587–4604, https://doi.org/10.5194/bg-21-4587-2024, 2024.
Sulpis, O., Lauvset, S. K., and Hagens, M.: Current estimates of K1* and K2* appear inconsistent with measured CO2 system parameters in cold oceanic regions, Ocean Sci., 16, 847–862, https://doi.org/10.5194/os-16-847-2020, 2020.
Taucher, J., Schulz, K. G., Dittmar, T., Sommer, U., Oschlies, A., and Riebesell, U.: Enhanced carbon overconsumption in response to increasing temperatures during a mesocosm experiment, Biogeosciences, 9, 3531–3545, https://doi.org/10.5194/bg-9-3531-2012, 2012.
Taylor, A. R., Chrachri, A., Wheeler, G., Goddard, H., and Brownlee, C.: A voltage-gated H+ channel underlying pH homeostasis in calcifying coccolithophores, PLoS Biol, 9, e1001085, https://doi.org/10.1371/JOURNAL.PBIO.1001085, 2011.
Uppström, L. R.: The boron/chlorinity ratio of deep-sea water from the Pacific Ocean, Deep Sea Research and Oceanographic Abstracts, 21, 161–162, https://doi.org/10.1016/0011-7471(74)90074-6, 1974.
Van Vuuren, D. P., Stehfest, E., Gernaat, D. E. H. J., Van Den Berg, M., Bijl, D. L., De Boer, H. S., Daioglou, V., Doelman, J. C., Edelenbosch, O. Y., Harmsen, M., Hof, A. F., and Van Sluisveld, M. A. E.: Alternative pathways to the 1.5 °C target reduce the need for negative emission technologies, Nat. Clim. Chang., 8, 391–397, https://doi.org/10.1038/s41558-018-0119-8, 2018.
Walter, S., Bange, H. W., Breitenbach, U., and Wallace, D. W. R.: Nitrous oxide in the North Atlantic Ocean, Biogeosciences, 3, 607–619, https://doi.org/10.5194/bg-3-607-2006, 2006.
Wanninkhof, R.: Relationship between wind speed and gas exchange over the ocean, J. Geophys. Res.-Oceans, 97, 7373–7382, https://doi.org/10.1029/92JC00188, 1992.
Wanninkhof, R.: Relationship between wind speed and gas exchange over the ocean revisited, Limnol. Oceanogr. Methods, 12, 351–362, https://doi.org/10.4319/LOM.2014.12.351, 2014.
Wanninkhof, R. and Knox, M.: Chemical enhancement of CO2 exchange in natural waters, Limnol. Oceanogr., 41, 689–697, https://doi.org/10.4319/LO.1996.41.4.0689, 1996.
Wanninkhof, R., Asher, W. E., Ho, D. T., Sweeney, C., and McGillis, W. R.: Advances in quantifying air-sea gas exchange and environmental forcing, Ann. Rev. Mar. Sci., 1, 213–244, https://doi.org/10.1146/annurev.marine.010908.163742, 2009.
Weather Underground: Weather data for IHORDALA29, https://www.wunderground.com/dashboard/pws/IHORDALA29/graph/2022-07-20/2022-07-20/monthly, last access: 30 January 2025.
Weiss, R. F. and Price, B. A.: Nitrous oxide solubility in water and seawater, Mar. Chem., 8, 347–359, 1980.
Wolf-Gladrow, D. A. and Klaas, C.: Total alkalinity change: The perspective of phytoplankton stoichiometry, Limnol. Oceanogr., 69, 1900–504, https://doi.org/10.1002/lno.12597, 2024.
Wolf-Gladrow, D. A., Zeebe, R. E., Klaas, C., Körtzinger, A., and Dickson, A. G.: Total alkalinity: The explicit conservative expression and its application to biogeochemical processes, Mar. Chem., 106, 287–300, https://doi.org/10.1016/j.marchem.2007.01.006, 2007.