the Creative Commons Attribution 4.0 License.
the Creative Commons Attribution 4.0 License.
 | 03 Mar 2026
Meta-analytical insights into organic matter enrichment in the surface microlayer
Surandokht Nikzad
Theresa Barthelmeß
Anja Engel
Hartmut Herrmann
Manuela van Pinxteren
Kai Wirtz
Oliver Wurl
The surface microlayer (SML), the uppermost ∼ 1 mm water layer at the air-water interface, plays a critical role in mediating Earth system processes, yet current knowledge of its composition and organic matter enrichment remains scattered across disciplines. Here, we present the first known meta-analysis of SML studies that quantitatively assesses the distributional characteristics of selected organic compounds, including organic carbon and nitrogen, amino acids, fatty acids, transparent exopolymer particles, carbohydrates, lipids and proteins, through probability density estimates, central tendency metrics and correlation analyses. Our results confirm a preferential enrichment of nitrogen-enriched, particulate organic matter in the SML, while also highlighting the significance of surfactant-specific factors that govern selective enrichment in the SML. We find that enrichment patterns can vary systematically with environmental and methodological conditions, underscoring the need to account for such influences when interpreting observations and developing SML-based models. We provide the full range of typical EF values for the studied compounds, offering a clear reference for assessing whether new measurements are typical or extreme. While delving into the ability of EFs to reflect organic matter partitioning in the SML, we also critically examine their limitations in capturing trophic variability and suggest that EF-based assessments be complemented with metrics that remove background variability from underlying water concentrations, enabling more accurate interpretations of true SML enrichment and informing future modelling efforts. Additionally, our meta-analysis demonstrates that logarithmic data transformations and robust central tendency estimates outperform traditional linear-scale approaches, providing more accurate and reliable SML enrichment estimates.
- Article
(13904 KB) - Full-text XML
-
Supplement
(819 KB) - BibTeX
- EndNote


Approximately 70 % of the Earth's surface is covered by a hydrated gelatinous “skin” known as the surface microlayer (hereafter referred to as “SML”; note that while this term is commonly used to denote the sea surface microlayer, in this study it refers to the surface microlayer in both marine and freshwater systems), which has an operationally defined thickness typically ranging from 1–1000 µm, depending on the sampling method used (i.e., screen, plate, drum: Astrahan et al., 2016; Hunter, 1980; Liss and Duce, 1997; Wurl et al., 2009). Situated between the surface waters of all natural water bodies and the atmosphere, this uppermost multi-component layer (Astrahan et al., 2016; Carlucci et al., 1985; Cunliffe et al., 2013) creates a unique microhabitat, mainly consisting of neuston (i.e., living communities in the SML), a relatively enriched complex of organic compounds and strong physico-chemical gradients (Cunliffe et al., 2013; Dietz et al., 1976; Engel and Galgani, 2016; Hunter and Liss, 1977). The formation and the composition of the SML are governed by a number of biological, physical and chemical drivers that interact under varying complex environmental conditions and time scales. As a result, the SML dynamics play a pivotal role in a range of environmental processes such as air-water gas exchange, heat transfer across boundary layers, biogeochemical cycling, microbial interactions and distribution of pollutants (e.g., Engel et al., 2017; Frew, 1997; Liss and Duce, 1997; Upstill-Goddard, 2006). Therefore, continued investigation of the compositional heterogeneity of the SML and of the processes therein is crucial to gain deeper insights into its role in ocean biogeochemistry and its potential climate interactions.
The SML is shaped by physical forces: surface tension provides structural stability at the air-water interface (Liss and Duce, 1997), while diffusive fluxes, bubble scavenging and the upward transport of buoyant particles deliver material from underlying waters (hereafter referred to as “ULW”; Baastrup-Spohr and Staehr, 2009; Chen et al., 2016; Joux et al., 2006; Obernosterer et al., 2005). In addition, wet and dry atmospheric deposition as well as in situ production and degradation also lead to concentration changes in the SML (Astrahan et al., 2016; Kuznetsova et al., 2004; Milinković et al., 2022). Within the SML, biological and chemical processes continuously transform compounds between dissolved and particulate forms (Liss and Duce, 1997), further contributing to its characteristic enrichment relative to the ULW (e.g., Baastrup-Spohr and Staehr, 2009; Gao et al., 2012; Gašparović et al., 2007; Liss and Duce, 1997; Marty and Saliot, 1976; Yang, 1999).
Many compounds present in the SML are surface active and are collectively known as “surface-active agents” or “surfactants” (Maki and Hermansson, 2020; Wurl and Holmes, 2008). Surfactants tend to adsorb at the air-water interface (Wurl et al., 2009) due to their amphiphilic nature (i.e., presence of both hydrophobic and hydrophilic structural parts; e.g., Marty and Saliot, 1976) and form interfacial films. This leads to modifications of the physico-chemical characteristics of the sea surface, most notably surface tension, elasticity and viscosity, which alter momentum transfer, micro-scale wave breaking, damping of capillary waves, ultimately affecting air-sea gas exchange (McKenna and McGillis, 2004; Pereira et al., 2016). Selective enrichment of surfactants in the SML is strongly influenced by phytoneuston exudation and grazing processes (Kujawinski et al., 2002; Ẑutić et al., 1981), which release carbohydrates that constitute a major fraction of naturally occurring biosurfactants (Myklestad, 1995; Penna, 1999). Blooms facilitate the accumulation of large hydrophilic polysaccharides, which can bind to hydrophobic groups and thereby acquire surfactant properties (Wurl et al., 2011). Surfactant distribution is further shaped by microbial activity (Hunter and Liss, 1977; Kurata et al., 2016); Baceterioneuston is predominantly lipolytic and proteolytic, breaking down organic matter (OM) into lipids and proteins (polymers of amino acids; Carlucci et al., 1985; Kjelleberg et al., 1976; Sieburth et al., 1976), both of which represent abundant biosurfactant pools in the SML (Brinis et al., 2004; Marty and Saliot, 1976). However, carbohydrates and polysaccharides also constitute major, rapidly utilized substrates for heterotrophic bacteria in the SML (Harvey et al., 1995; Penezić et al., 2022).
Surfactants have been categorized according to their solubility into dry and wet surfactants, of which the more insoluble fraction tends to establish as a monolayer at the surface (e.g., phospholipid-like material; Frka et al., 2012), while the adsorption of the latter fraction (more soluble; e.g., proteins and carbohydrates) is governed by concentration-driven equilibria (Asmussen-Schäfer et al., 2026; Laß and Friedrichs, 2011). Nonetheless, the natural soluble surfactant pool frequently reaches a threshold beyond which monolayer-like surfactant coverage of the air–sea interface is observed (Asmussen-Schäfer et al., 2026). In addition to their chemical composition, surfactants also vary in their size: Colloidal and particulate organic matter accumulated in the SML further provide substrates to bacterioneuston, thereby helping to stabilize the surface films (Sieburth, 1983). The contribution from the particulate pool to the SML's surface activity is estimated to range from 10 % to 55 % (Gašparović and Ćosović, 2003). Furthermore, sticky microgels, like transparent exopolymer particles (TEP) that originate from bacteria and phytoplankton (Alldredge et al., 1993), are also found in the SML. Such gel-like particles can form through the coagulation of dissolved polysaccharides (Engel et al., 2004; Mari and Burd, 1998; Schartau et al., 2007), and are capable of incorporating other compounds into a cohesive matrix (Cunliffe et al., 2009; Sieburth, 1983; Wurl and Holmes, 2008), thereby enhancing the structural integrity of surface films (Cunliffe and Murrell, 2009). When the SML becomes highly concentrated in surfactants, these films transform into thick surface slicks that are visible to the naked eye (Liss and Duce, 1997). The extent to which OM-driven changes in SML surfactant composition alter air-sea gas exchange remains to be fully understood (Pogorzelski et al., 2006). In addition, inorganic ions, which do not preferentially adsorb at the air-water interface, can be also present in the SML due to passive upward transport (Knipping et al., 2000; Petersen et al., 2004).
Liss and Duce (1997) and Pereira et al. (2018) argue that the SML can restrict diffusive fluxes across the air-sea interface, substantially contributing to reduced rates of ocean-atmosphere gas exchange. Surfactants can impact air-sea gas exchange of greenhouse gases such as carbon dioxide (CO2), methane (CH4), nitrous oxide (N2O) and dimethyl sulfide (DMS) (Frew, 1997; Upstill-Goddard, 2006). Asher (1997), from laboratory measurements, and Tsai and Liu (2003), from global ocean observations, estimate a reduction of annual net CO2 flux by ∼ 20 %–50 % due to the presence of the SML, while Wurl et al. (2016), from in situ measurements, propose that this decrease can be ∼ 15 %. Barthelmeß et al. (2021) observed that, in a newly upwelled filament off Mauritania, surfactants can suppress CO2 gas exchange by 12%. Both lab- and field-based experiments find that natural slicks can reduce air-sea gas exchange by 50 %–60 % (Goldman et al., 1988; Salter et al., 2011; Mustaffa et al., 2020), causing the SML to drive an overall reduction of 19 % in the CO2 fluxes, as shown by in situ observations (Mustaffa et al., 2020). Supporting earlier findings of Springer and Pigford (1970), McKenna and McGillis (2004) and Sabbaghzadeh et al. (2017), who raised concerns about the impact of the SML's surfactants on uncertainties in air-sea gas exchange models, Mustaffa et al. (2020) further argue that conventional wind-based models miscalculate CO2 exchange up to 20 % in areas with high surfactant concentrations. Moreover, Kock et al. (2012) find that, in the eastern tropical North Atlantic region, offsets between air-sea and diapycnal N2O fluxes could be explained when surfactant effects were introduced to gas exchange models. Work of Goldman et al. (1988) find that surfactants in the SML can also suppress air-sea gas exchange of oxygen (O2). Disparities in these studies emphasize the significance of accurately assessing the characteristics of the SML and its processes, as well as integrating this knowledge into climate relevant ocean-atmosphere models (Milinković et al., 2022) in order to reduce uncertainties in global gas flux estimations, particularly given that SML is seldom included in gas exchange models (Cen-Lin and Tzung-May, 2013; Engel et al., 2017).
Although the composition and the concentration of compounds within the SML are thought to be strongly correlated with those of the ULW (Baastrup-Spohr and Staehr, 2009; Chen et al., 2016; Joux et al., 2006; Kuznetsova et al., 2004), certain substances are selectively accumulated at the air-water interface, leading to a pronounced enrichment in the SML. Several studies, including (Carlucci et al., 1985; Henrichs and Williams, 1985; Kuznetsova and Lee, 2002; Reinthaler et al., 2008), find stronger enrichment of particulate fractions and nitrogen-based compounds compared to dissolved organic carbon. The accumulation of these specific compounds in the SML relative to the ULW is often described by the “Enrichment Factor” (hereafter referred to as “EF”). The EF of a compound “x” is given by the following concentration ratio:
According to this equation, when the concentration of x is higher in the SML than in the ULW, the EF value rises above 1; when it is lower, the EF drops below 1, as discussed in Carlson (1983) and Garabetian et al. (1993). However, previous studies report substantial enrichment variability in the SML across environments, compound classes and spatio-temporal scales. For instance, non-slick areas where microbial degradation processes are dominant can also demonstrate higher EF values, resembling those found in slick conditions (e.g., Baastrup-Spohr and Staehr, 2009). In contrast, some lakes appear to exhibit weak SML enrichment even under eutrophic ULW conditions when the waters are concentrated by autochthonous OM (i.e., originate within the same ecosystem they are found) that show a lower affinity to the air-water interface (Hillbricht-Ilkowska and Kostrzewska-Szlakowska, 2004). Freshwater SML tends to be more enriched with organic carbon and nitrogen, total phosphorous, ammonia and phosphate ions (Knulst et al., 1997; Münster et al., 1998; Södergren, 1987), whereas in marine environments, carbohydrates, lipids, proteins and amino acids tend to be more enriched (Liss and Duce, 1997). Concentration variability of the SML can be significantly larger than that of the ULW (Reinthaler et al., 2008), although in some occasions, the two layers show similar variability (Carlson, 1983). Likewise, the extent to which SML composition mirrors the ULW also varies, with some studies observing tight coupling (e.g., Chen et al., 2016; Joux et al., 2006) and others reporting marked decoupling linked to different mineralization rates or adsorption dynamics (e.g., Kuznetsova et al., 2004). Differing surface activities (i.e., tendency of a substance to accumulate at the interface) of organic compounds is considered a major driver of these transfer dynamics between the SML and the ULW (Engel et al., 2017). Environmental factors further influence SML enrichment, yet their influence remains inconsistent and unresolved (e.g., Baastrup-Spohr and Staehr, 2009; Carlson, 1983; Reinthaler et al., 2008; Sabbaghzadeh et al., 2017). Collectively, these heterogenous findings highlight the complexity of SML enrichment processes and the need for systematic cross-study evaluations. These aspects and their implications are further discussed in the Discussion.
Overall, the diversity of reported findings highlights the need for a more holistic view of the applicability of EF as a valid and meaningful indicator of compounds enriched in the SML. To address this, we adopted a meta-analysis of existing SML studies, and conducted a comprehensive analysis to (1) assess OM enrichment in the SML, (2) review current EF estimates and (3) investigate the relevance of EF values as accurate indicators of OM enrichment. The data collection presented here covers mass concentrations of OM compounds and does not include measurements of surface activities or effects on the physico-chemical properties of the uppermost monolayer of the SML. The primary objective is to provide an overview and specific insights into OM compounds that can accumulate within the SML and potentially be linked to biogeochemical processes occurring in the ULW. Accordingly, surfactant measurements of surface activities that have been converted into equivalent surfactant concentrations, such as those expressed as Triton X-100 equivalents, are not considered here. Ultimately, this data compilation, together with the knowledge derived from its initial meta-analysis, is intended to establish a robust foundation for subsequent studies that may support future modelling efforts linking biological processes to functions of the SML and their implications for biogeochemistry and climate.
The work presented here synthesizes findings from multiple studies on the SML and employs a quantitative meta-analysis. Meta-analyses provide an essential means of extracting robust and generalizable conclusions by integrating results from fragmented bodies of literature. Such systematic reviews can provide a more precise and accurate understanding of overarching trends, even when individual studies report inconsistent results (Crocetti, 2016). Mengist et al. (2020) highlight the importance of meta-analyses by stating that “Systematic reviews with meta-analysis represent the gold standard for conducting reliable and transparent reviews of literature.” In fields such as SML research, where methodological diversity is high and environmental variability is inherent, meta-analytical approaches are invaluable in identifying coherent trends and key constraints.
2.1 Data collection and compilation
The primary dataset consists of 2055 data points, extracted from 31 peer-reviewed publications (hereafter referred to as “reference studies”) identified through a comprehensive and systematic literature search of scholarly articles published between 1967 and 2022. These studies were identified through a structured Google Scholar search conducted between February 2025 to April 2025. Search terms included combinations of descriptors related to the surface microlayer (e.g., “sea surface microlayer”, “SML”), enrichment terminology (e.g., “enrichment”, “enrichment factor”), and compound specific keywords (e.g., “surfactants”, “organic carbon”, “organic nitrogen”, “TEP”, “Amino acids”, and other organic matter classes). Additional relevant publications were identified through reference lists of retrieved papers. Only datasets providing extractable numerical values were retained.
From these studies, directly measured mass concentration data were extracted from simultaneously collected SML and ULW samples (hereafter referred to as “[C]SML” and “[C]ULW”, respectively) for twelve different observational types of organic compounds (hereafter known as `target compounds'): total organic carbon (TOC expressed in mg L−1), particulate organic carbon (POC in mg L−1), dissolved organic carbon (DOC in mg L−1), total organic nitrogen (TON in mg L−1), particulate organic nitrogen (PON in mg L−1), dissolved organic nitrogen (DON in mg L−1), amino acids (AA in µmol L−1), fatty acids (FA in µg L−1), transparent exopolymer particles (TEP in µg Xeq L−1), carbohydrates (CHO in µmol L−1), lipids (in µmol L−1) and proteins (in µmol L−1). TOC pool includes all forms of organic carbon, thus comprising both POC and DOC. Similarly, the TON pool combines both PON and DON. In general, the particulate pool constitutes a minor fraction of the total pool. The major classes of biopolymers are proteins, CHO and lipids, with AA serving as the monomers of proteins. Depending on the elemental composition of these biopolymers, they contribute to both, the organic carbon and/or organic nitrogen pool. While the ratio of these biopolymers is higher in the particulate pool, it usually declines to only a few percent in the dissolved pool. TEP is composed of polysaccharides (i.e., CHO) with a major fraction contributing to POC, while a minor fraction exists at the interface between the dissolved and particulate phases (Verdugo et al., 2004). These compounds were selected as they represent major carbon and nitrogen pools in the SML, are widely reported across marine and freshwater systems, and are sufficiently represented in the literature to support a robust meta-analytical assessment.
The EF values for these target compounds were systematically calculated from corresponding [C]SML–[C]ULW pairs, using Eq. (1). In this study, [C]SML, [C]ULW and EF data are collectively referred to as “primary data”. Auxiliary information associated with the primary data (i.e., sampling factors and environmental variables) was also extracted when reported and is referred to as “secondary data”. All analyses were performed using the complete primary data set, independent of whether secondary data were available. The secondary data were summarized only to illustrate existing research gaps in SML studies. All the data were collected either (1) directly from the source when presented, or else (2) through digitization of graphs and plots using PlotDigitizer (https://plotdigitizer.com, last access: 13 January 2026) and GraphClick v3.0 (https://graphclick.en.softonic.com/mac, last access: 13 January 2026). To estimate digitization uncertainty, TOC data (40 datapoints) from Baastrup-Spohr and Staehr (2009) were digitized five times (200 values in total). The standard deviation of repeated measurements was calculated for each point and expressed relative to its average. Across all points, the median relative uncertainty was 0.3 %, indicating that digitization introduced minimal error. The resulting compiled database is herein referred to as “Surface Microlayer Organic Matter Global Data Collection” (SML-OM). Table S1 in the Supplement provides an overview of the reference studies on which the SML-OM is based.
2.2 Statistical analyses
Given that the SML-OM ranges over several orders of magnitude, when the dataset is handled in linear-space (i.e. in its original form), higher values dominate and overshadow the features associated with lower values (Feenstra, 2006). These potential limitations of linear scaling were reduced by transforming our primary data into their logarithmic (log10) counterparts. Hereafter, the term “linear” refers to the original, untransformed data, while the term “log” stands for their logarithmic equivalents. The following sections describe the subsequent analyses conducted in our work.
2.2.1 Probability distributions
Making inferences based on ratios such as EF values requires careful consideration, as changes in the numerator and the denominator often affect these ratios asymmetrically (Keene, 1995). In the context of this study, while reductions in [C]ULW can lead to unusually high EF values that can approach infinity (i.e., stretched towards higher values), increases in [C]ULW may produce EFs decreasing down to 0 (i.e., compressed towards lower values). This results in distributions that significantly deviate from Gaussian (i.e. normally distributed) shape. Therefore, distributional characteristics of the primary data were examined through probability distributions.
Probability density functions (hereafter referred to as “PDF”) of the EF values were examined by applying non-parametric Kernel Density Estimates (hereafter referred to as “KDE”; Parzen, 1962; Silverman, 2018; Wegman, 1972). KDE employs a normalized weighting function – known as “Gaussian kernel” – which is centered at each datapoint. The sum of these kernels produces a smooth and continuous PDF that fits the underlying data. Selection of the width of a kernel – known as “bandwidth” – is an integral part of the KDE approach, as bandwidths too small or too large lead to overfitting and underfitting of data, respectively, failing to capture the true patterns in distributions. Following this, optimal bandwidths for linear KDEs were computed based on Härdle et al. (2004). For log KDEs, a fixed bandwidth was applied. Log transformations, unlike the linear scale, produce similar distributions with comparable spreads across variables, allowing a single fixed bandwidth to produce stable and consistent smoothing for all data.
Robustness of the KDE method decreases at low sample size. Since the SML-OM contains variables with sample sizes as low as 16 (for proteins), a bootstrap resampling approach was adopted where 67 % of the original data (i.e., of the sample) were randomly subsampled. This proportion balances the need for sufficient data to generate stable KDEs while still introducing variability for robustness testing. By allowing consistent treatment across all data types, this approach maintains comparable KDE bandwidth behavior among subsamples. An individual KDE was generated at each iteration. The process was repeated 1000 times, each time with a different random subsample, generating a set of KDEs. These were then averaged to produce an ensemble mean, from which the final PDFs were derived. Additionally, cumulative distribution functions (hereafter referred to as “CDF”) were determined for [C]SML and [C]ULW from the ensemble means of the bootstrapped KDEs. Appendix A provides further information on the KDE method.
2.2.2 Summarization, comparison and correlation estimates of distributions
For describing, comparing and relating the resulting PDFs and CDFs, we used standard statistical measures. Their mathematical expressions are given in Appendix B.
-
To describe the central tendencies, mode (hereafter referred to as “xm”), median (hereafter referred to as “”), arithmetic mean (hereafter referred to as “”) and geometric mean (hereafter referred to as “”), were computed.
-
The values at 5th and 95th percentiles of each distribution (hereafter referred to as “upper threshold: UT” and “lower threshold: LT”, respectively) were also estimated in order to determine their central 90 % range (i.e., degree of spread).
-
To numerically compare the [C]SML and [C]ULW, Integrated Quadratic Distance (Hereafter known as “IQD”) values of their CDFs were approximated based on Eq. (B3), which measure how different the two distributions are with regard to symmetry and multimodality.
-
To investigate and quantify potential relationships between [C]SML and [C]ULW of each target compound, their linear correlation was analyzed by employing both parametric Pearson and non-parametric Spearman's tests (both methods were applied for cross-validation purposes; agreement between the two correlation coefficient values increases the confidence in the robustness of the observed relationship).
Unless otherwise stated, all analyses were performed on log scale. Nevertheless, to avoid potential misinterpretation of log scales in data presentation, primarily due to their limited readability among non-expert audiences (e.g., Menge et al., 2018), all results are presented on linear scale.
3.1 Characterizing EF distributions
Figure 1 compares the KDE-derived PDFs of the EF values for the carbon-enriched (in blue) and nitrogen-enriched (in orange) organic compounds (Hereafter known as “PDFC” and “PDFN”, respectively). PDFC was derived from EF values for TOC, DOC, POC, FA, TEP and CHO. The remaining target compounds derive PDFN. In their linear version (Fig. 1a), both PDFs demonstrate positive skewness (i.e., right-skewness) with the two xm values being 1.10 and 1.15, respectively. Nevertheless, the peak probability density of the PDFC (i.e., the height of the PDF = ∼ 1) is more than twice that of the PDFN (∼ 0.4). of the two PDFs vary substantially, with PDFC and PDFN yielding values of 1.25 and 1.75, respectively. The values for (2.60 and 5.39, respectively) and (1.51 and 2.34, respectively) further reflect this divergence. In contrast, their log-transformed versions (Fig. 1b) approximate normal distributions, with PDFC estimating the (exponentials of) xm= 1.11; 1.24 and 1.51. The PDFN yields corresponding values of 1.33, 1.76 and 2.34. Their peak probability densities also reflect that the PDFC (∼ 2.6) is twice as high as that of PDFN (∼ 1.5).
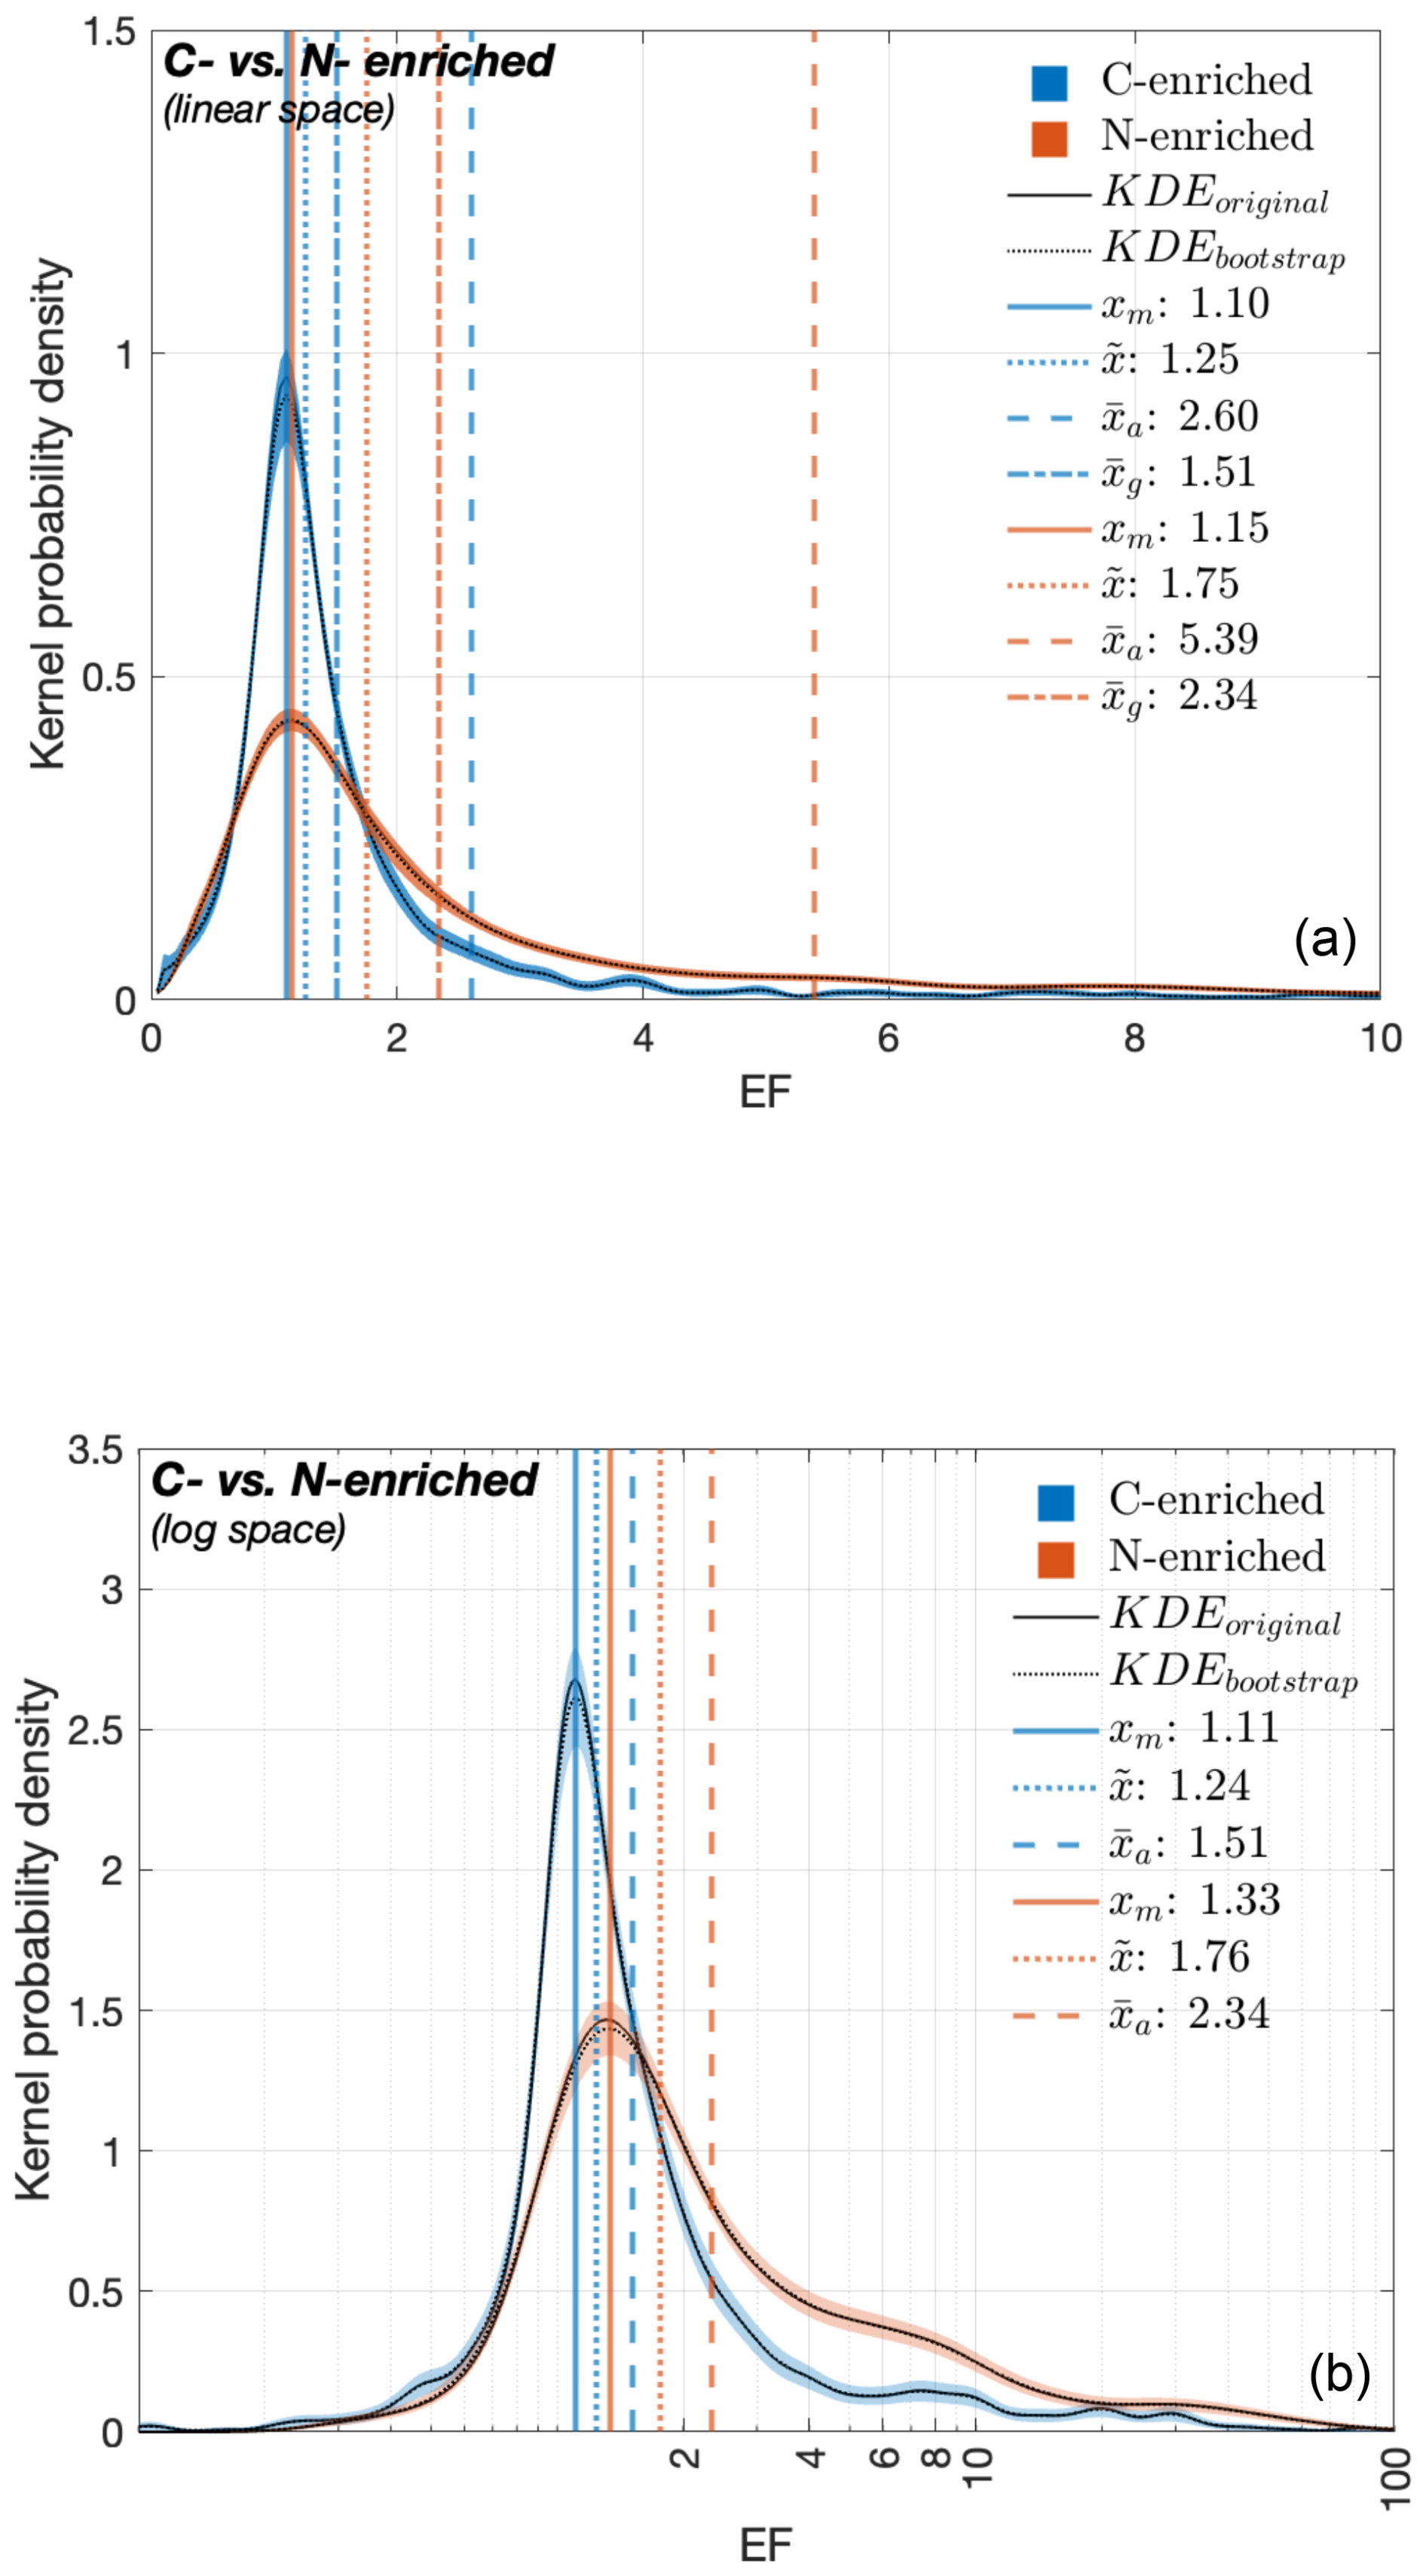
Figure 1PDFs of the EF values for carbon-enriched (blue) and nitrogen-enriched (orange) compounds. PDFs of the (a) untransformed (i.e., linear) and (b) log-transformed EF values. The solid black line indicates the KDEs derived from original data while the dashed black line represents the ensemble mean of bootstrapped KDEs. Central tendency metrics (mode [xm], median [], arithmetic mean [], geometric mean []) given in panel (b) are the exponentials of the corresponding estimates on the log scale.
We also compared EF-based PDFs (Fig. 2) for dissolved (PDFD, in purple) and particulate (PDFP, in green) OM where we refer to a filter size of 0.22 µm (Gao et al., 2012). At a linear scale (Fig. 2a), the PDFs are again right-skewed for the two clusters, with characteristics: (1) 1.20 (both PDFD and PDFP) for xm; (2) 1.50 and 2.25 for ; (3) 4.39 and 4.41 for and, (4) 1.91 and 2.53 for , respectively. The peak probability density of the PDFD (∼ 0.6) exceeds that of the PDFP (∼ 0.3) by nearly a factor of two. The log PDFD and PDFP (Fig. 2b) approximate normal distributions alongside the following exponentiated central values, respectively: (1) xm= 1.20 and 1.88; (2) 1.48 and 2.29; (3) 1.91 and 2.53. Their peak probabilities compare between ∼ 1.8 (for PDFD) and ∼ 1.0 (for PDFP).
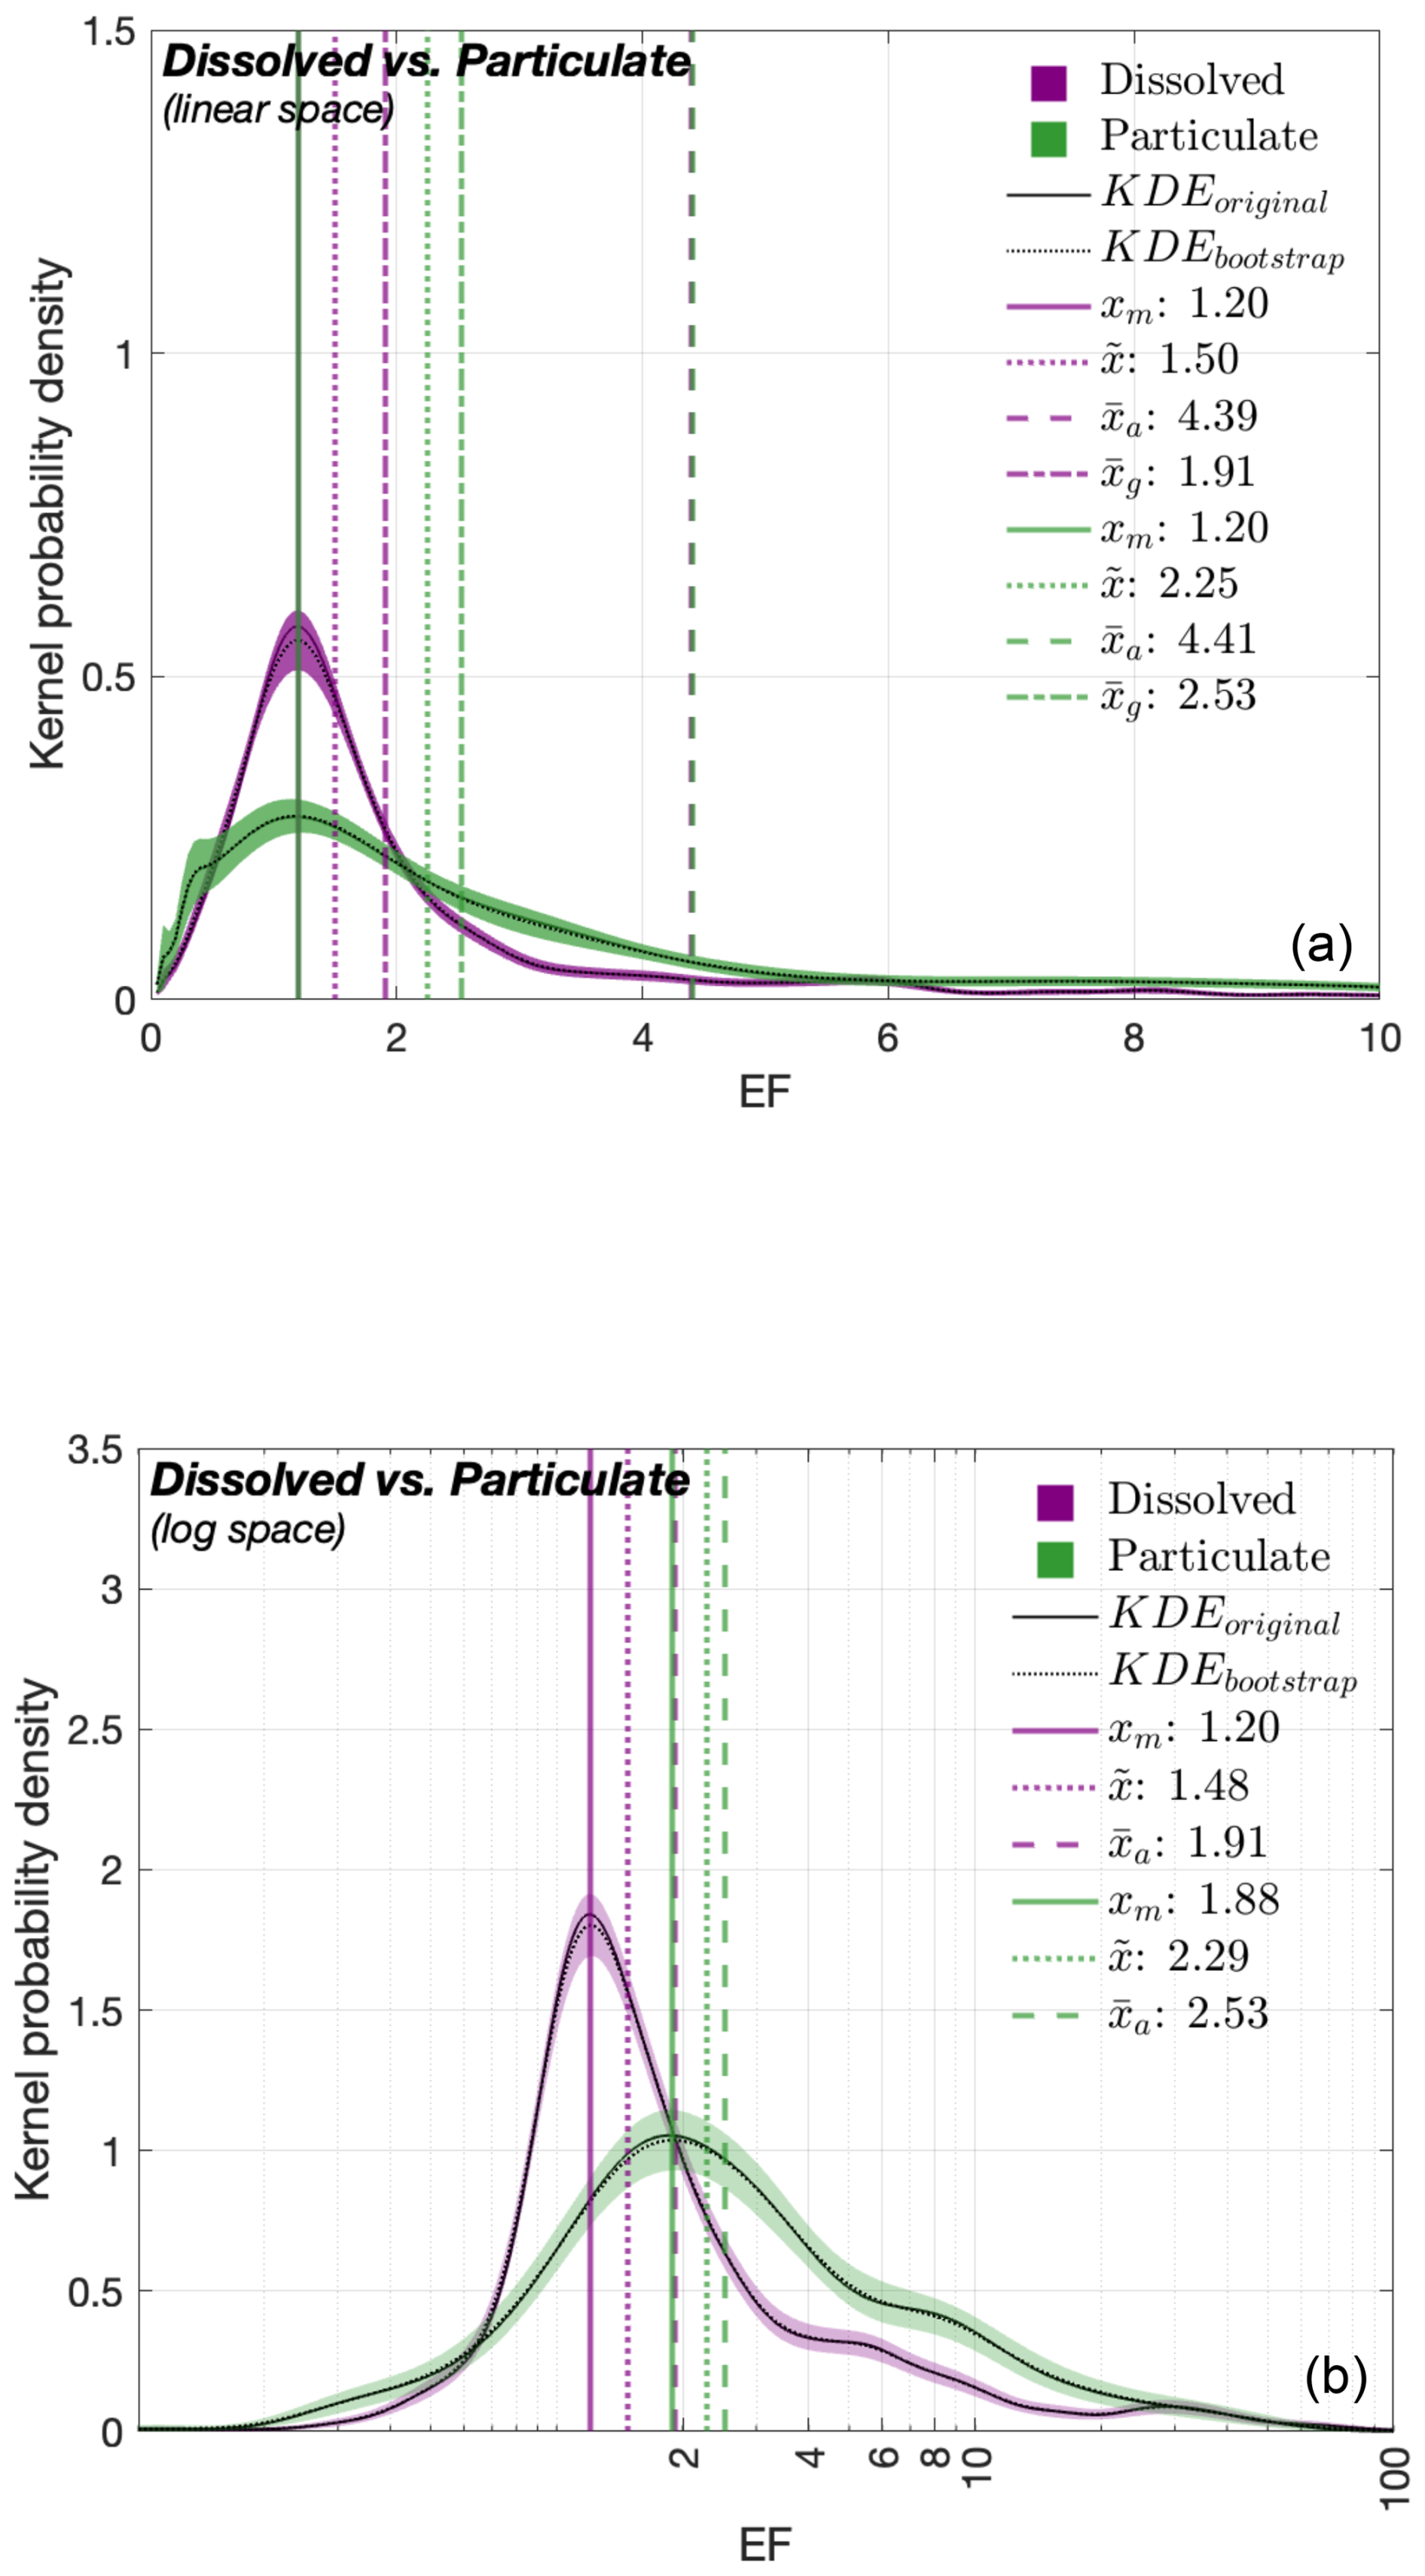
Figure 2PDFs of the EF values for dissolved (purple) and particulate (green) compounds. PDFs of (a) linear and (b) log EF values. See Fig. 1 caption for details on KDEs and central tendency metrics.
Figure 3 displays the PDFs of the EF values for the target compounds. All the distributions exhibit nearly log-normal characteristics, nevertheless they vary in their degrees of spread. Here, only and values estimate the central tendency of each distribution (the rationale for this approach is discussed in Sect. 4.2). The values of (dotted pink line) and (dashed pink line) are closely aligned in magnitude. According to these derived estimates, median and geometric mean EFs are largest for POC (Fig. 3b: 3.09; 3.22) across all the target compounds, with PON (Fig. 3e) and DON (Fig. 3f) following closely, each exhibiting and values > 2. Although proteins (Fig. 3l) also show higher central tendency estimates, it should be noted that they have the smallest sample size (= 16), followed by lipids (sample size = 20). Therefore, the results of these two compounds should be interpreted with caution due to their lower statistical robustness. A comparison of threshold metrics (i.e., LT and UT; see Sect. 2.2.2) reveals that the EF distributions for FA (Fig. 3h) and POC (Fig. 3b) exhibit the highest UT values (14.5 and 13.3, respectively) along with the greatest distributional variability. TOC (Fig. 3a) and TON (Fig. 3d) show the least variability among all target compounds. While some compounds exhibit well-defined unimodal EF distributions (e.g., POC, PON), few others (e.g., TON, AA) display polymodal patterns.
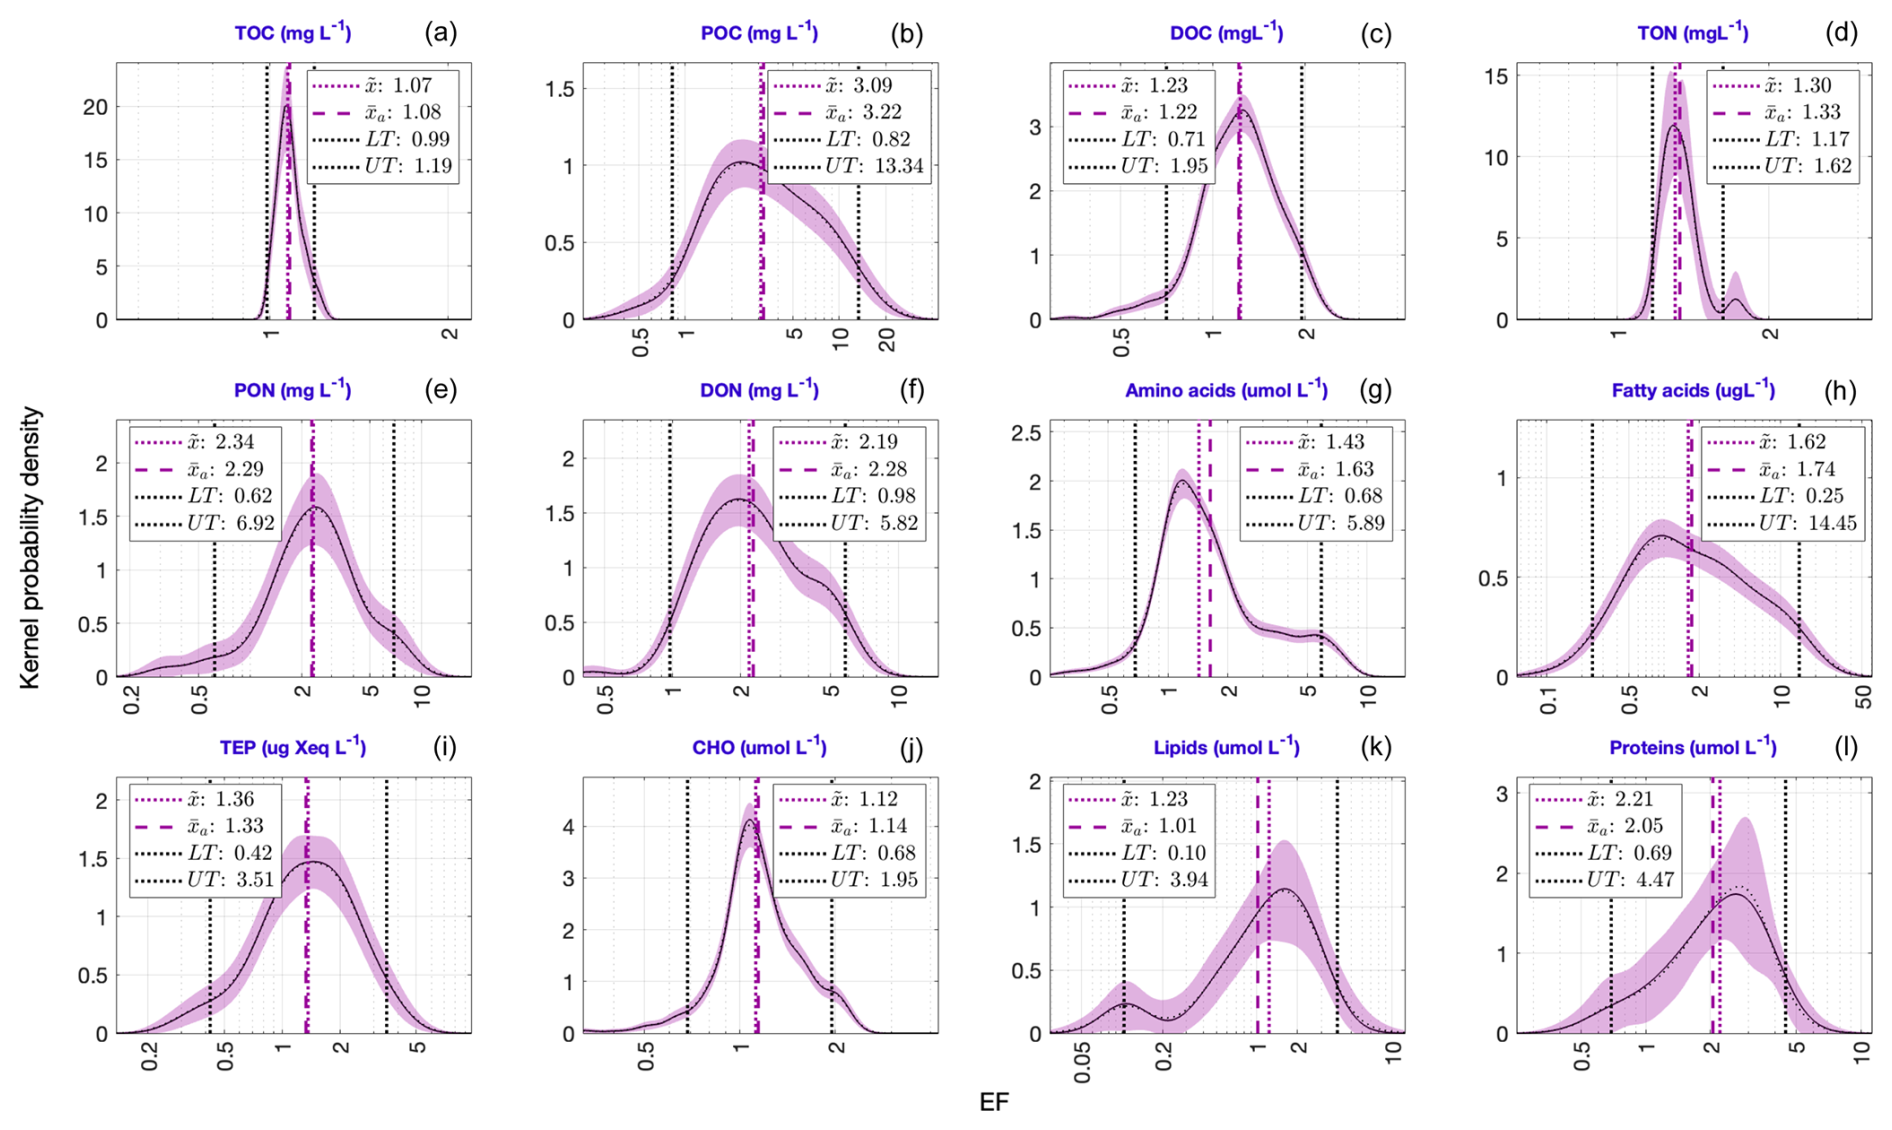
Figure 3PDFs of the EF values for the twelve target compounds. The lower and upper thresholds of each distribution (dashed black lines) are defined by 5th and 95th percentiles of each PDF (see Sect. 2.2.2). The values of these thresholds, along with the central tendency metrics given in each panel, are the exponentials of the corresponding estimates in the log space.
3.2 Comparing SML and ULW concentrations
Figure 4 presents the CDFs of the ULW (in red) and SML (in blue) concentrations for the target compounds. A CDF exhibits how probability accumulates across a range of values (in the current context, [C]SML and [C]ULW data). All CDFs (both [C]ULW and [C]SML) exhibit a characteristic sigmoidal shape: a slow initial rise (i.e., lag phase), followed by a steep rise (i.e., exponential phase), eventually reaching a plateau (i.e., stationary phase). CDFs for TOC display two distinctive plateaus indicating bimodal concentration distributions for both SML and ULW.
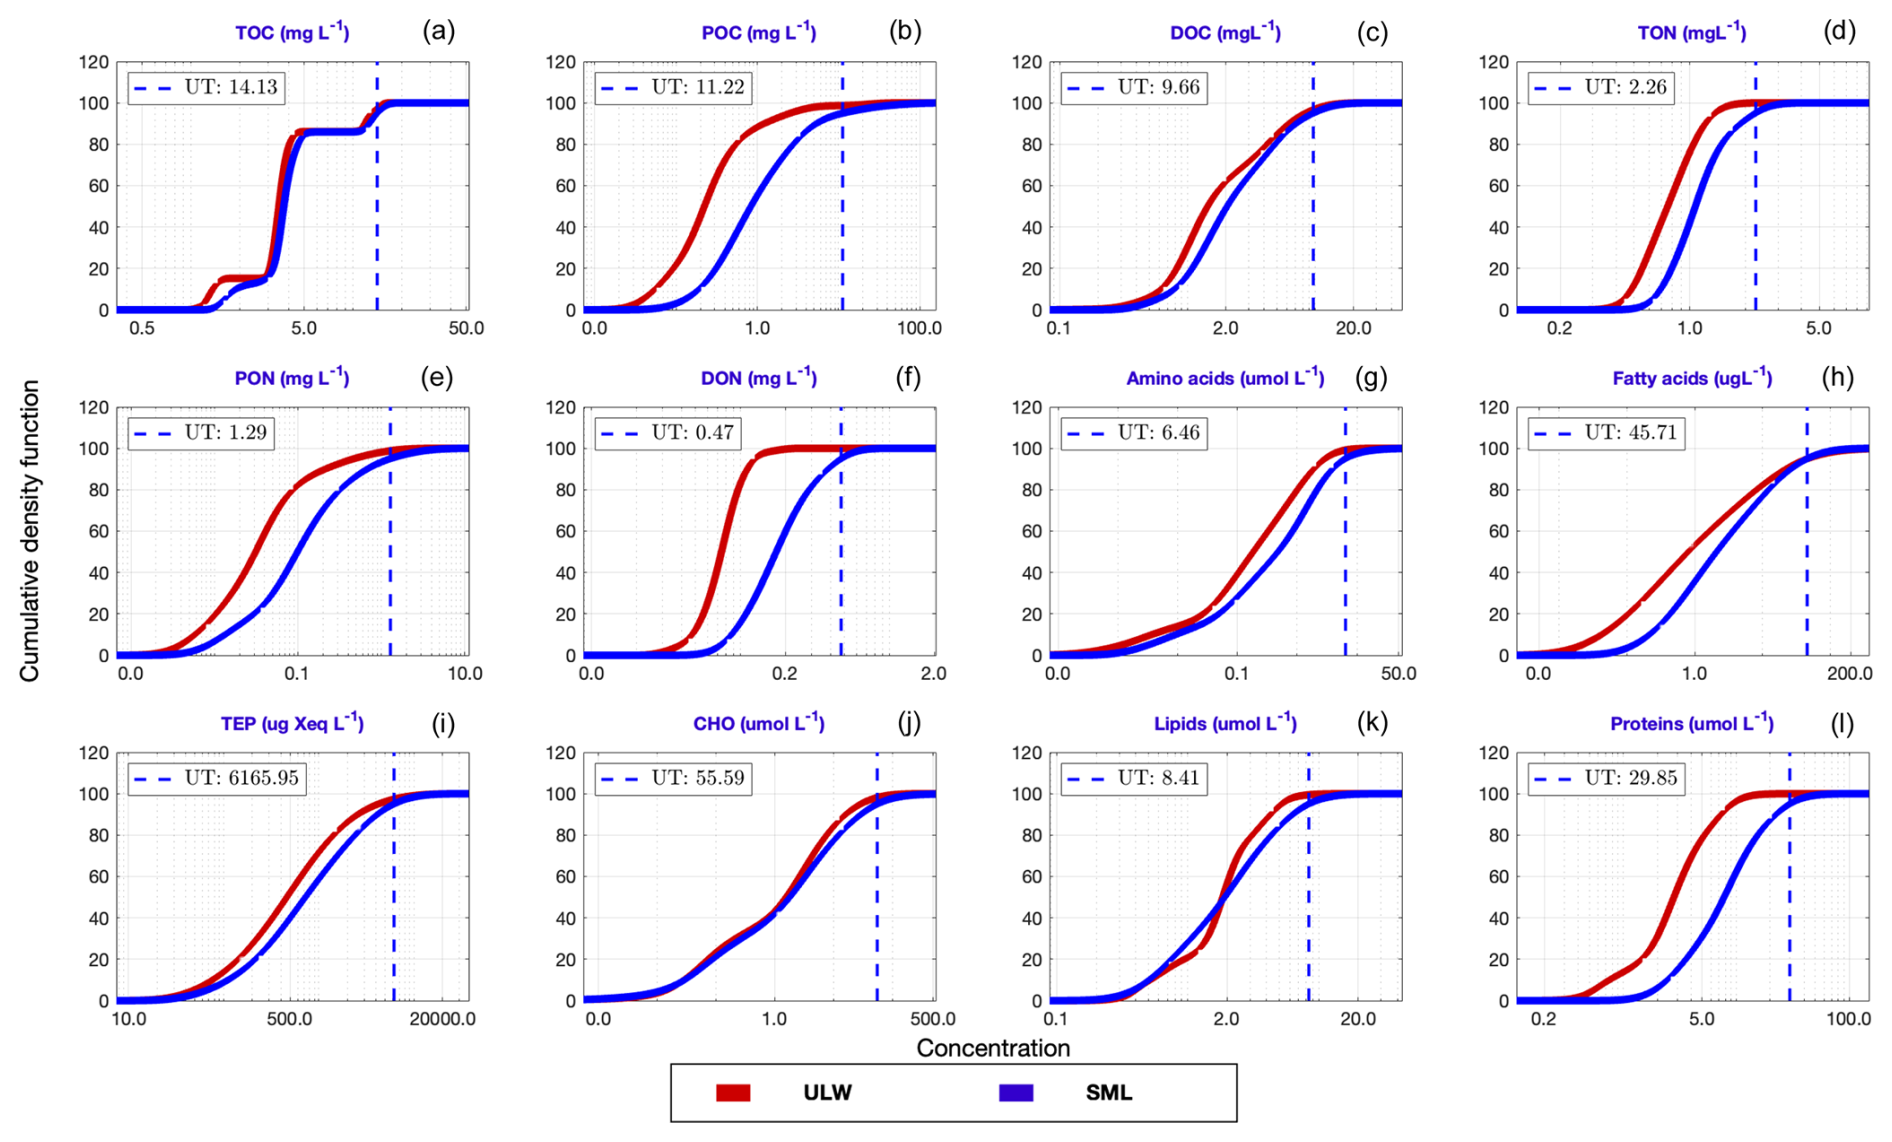
Figure 4CDFs of the ULW (red) and SML (blue) concentrations for the target compounds. The upper thresholds for [C]SML (UT; given by blue dashed lines) are defined by 95th percentiles of the corresponding CDF. The values of these thresholds are the exponentials of the corresponding estimates in the log space. Their corresponding IQDs are given in Fig. 5.
Additionally, despite the homogeneity in the general shape and trend of these CDFs, their corresponding IQDs (Fig. 5) reveal that the magnitudes of the offsets between [C]ULW and [C]SML distributions vary substantially across the target compounds. Lower IQD values indicate greater similarities between the CDFs, while higher values document clear distinguishability and thus also document a more robust enrichment signal. The lowest IQD is reported for the CDFs of TOC and CHO (0.005) while that of DON yields the highest in value (0.184). In addition, lower CDFs (i.e. IQD < 0.05) are observed for lipids (0.008), DOC (0.012), TEP (0.018), AA (0.039) and TON (0.041), whereas POC (0.18) and proteins (0.15) exhibit a greater divergence (i.e. IQD > 0.15) between [C]ULW and [C]SML. The color intensity of each bar reflects the sample size (n) of each target compound (i.e., smaller the sample, lighter the color).
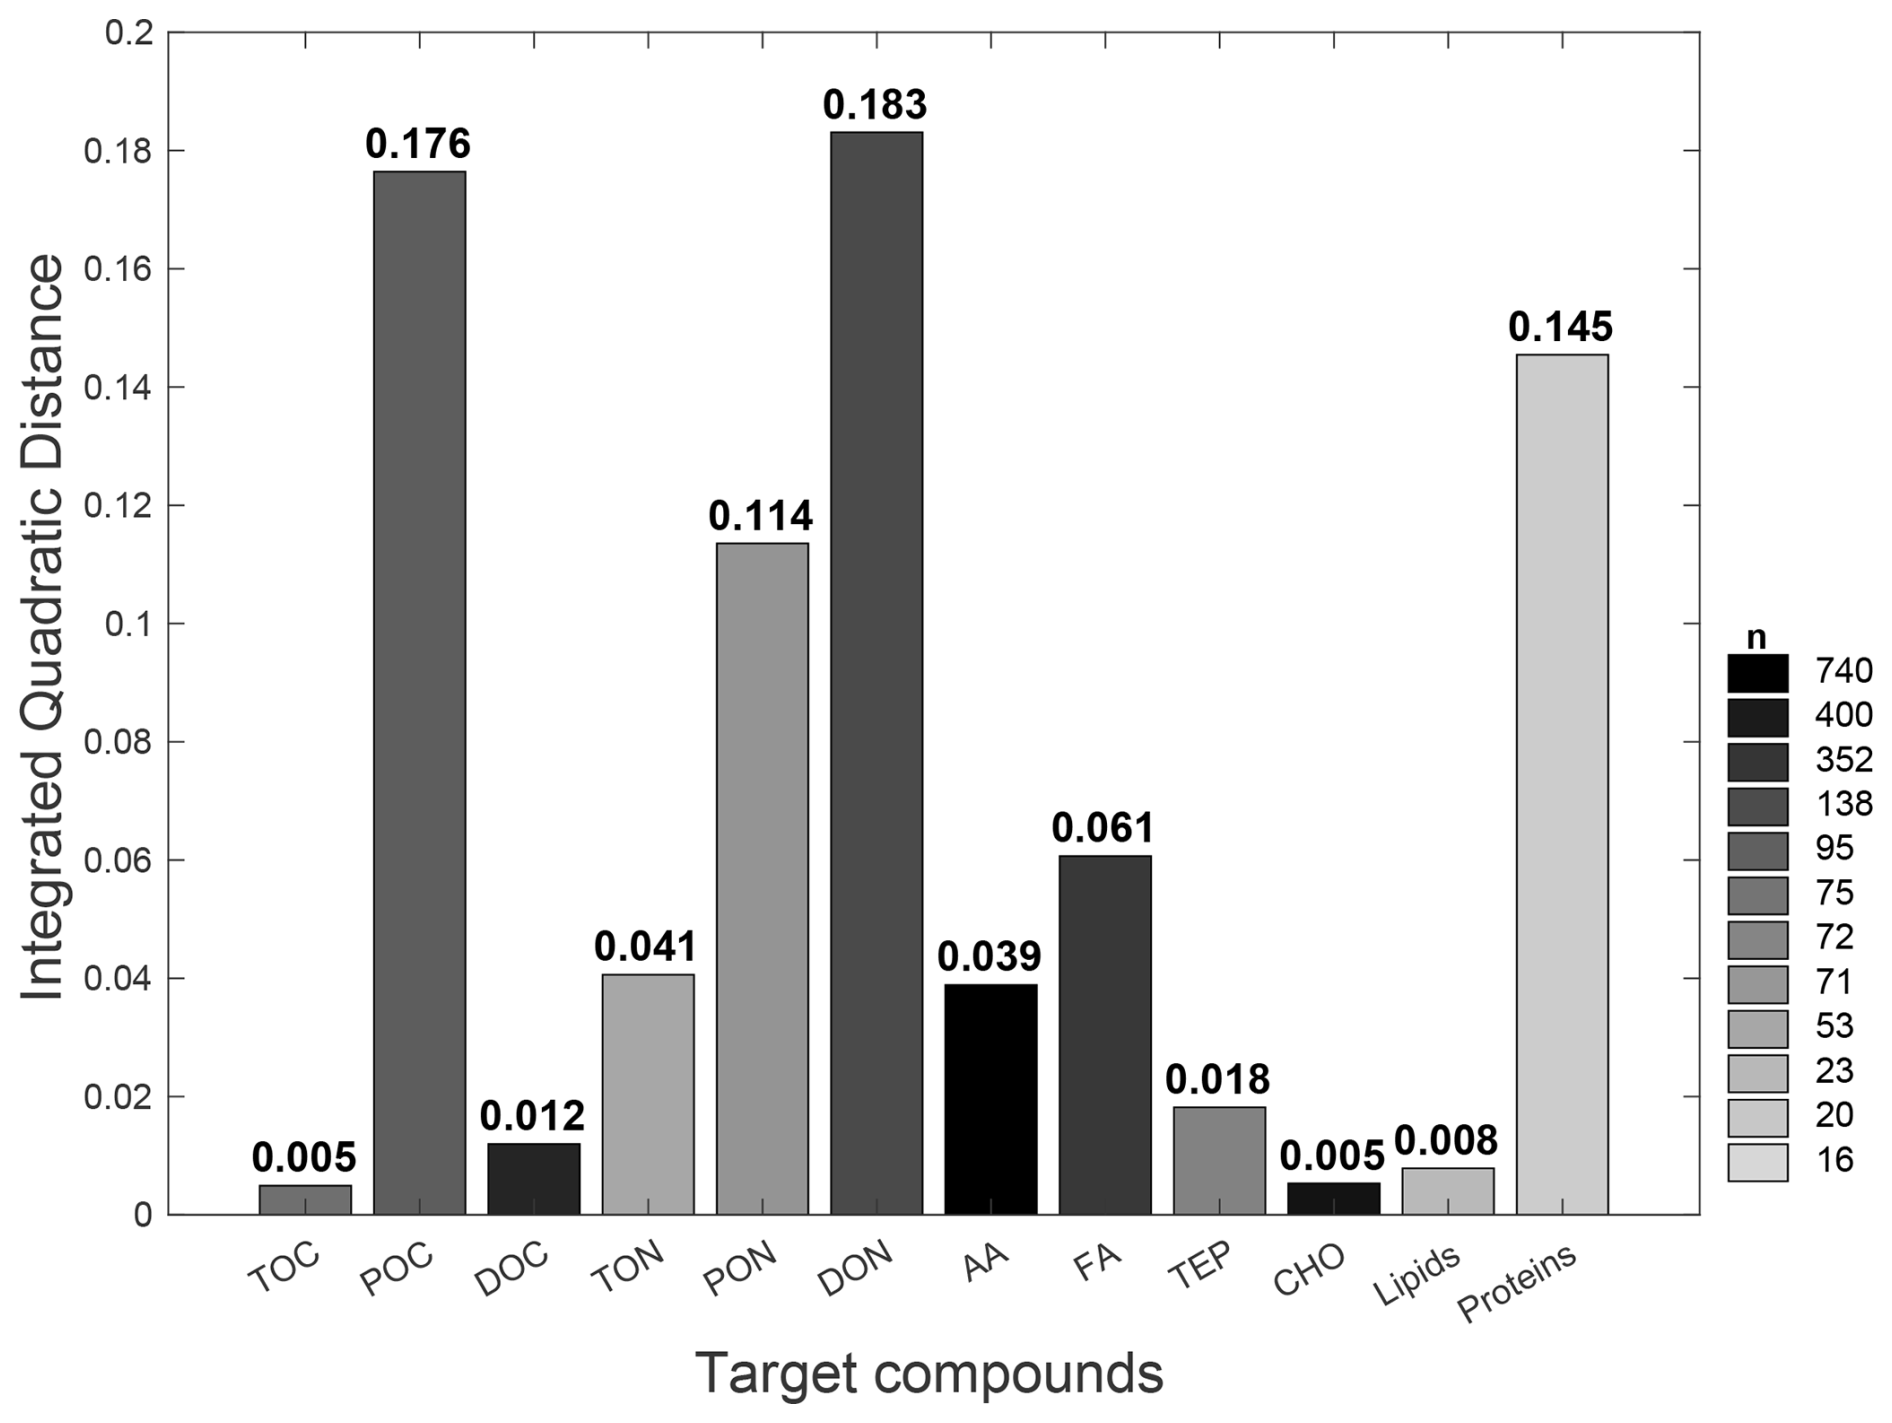
Figure 5IQD values quantifying the divergence between ULW and SML concentrations for each target compound. The IQD represents the squared difference between ULW- and SML-based CDFs shown in Fig. 4. Higher IQD indicates greater divergence between the two distributions and vice versa. Bar color intensity corresponds with the sample sizes.
Correlations between [C]ULW and [C]SML of the target compounds were statistically estimated using liner correlation, as presented in Fig. 6. The coefficients “ρ” and “r” stand for the correlation values derived from non-parametric Spearman's and parametric Pearson correlation tests, respectively. For all target compounds, except for DON, lipids and proteins, we found strong correlations between their SML and ULW concentrations (ρ and r>0.5) with robust positive relationships. Individual datapoints for TOC, DOC and CHO (Fig. 6a, c and j) closely fall on the 1:1 reference line where [C]SML = [C]ULW (dashed black line). In contrast, those for POC, TON, AA and FA are notably shifted towards the y axis, suggesting higher [C]SML values relative to [C]ULW that correspond to potentially enriched (depleted) SML (ULW) concentrations against ULW (SML) concentrations (see inset plot in Fig. 6a). Although TEP shows a slight enrichment in the SML, the effect is not particularly pronounced (Fig. 6i). In addition, all the datapoints (regardless of whether they display copulation or not) were further color-coded according to their respective EFs. The results reveal an overall consistency in EFs across concentration ranges irrespective of their magnitudes. For example, in Fig. 6c, EF values remain below 5, both when [C]ULW and [C]SML are < 0.5 and > 5 mg L−1. This pattern holds across nearly all the target compounds.
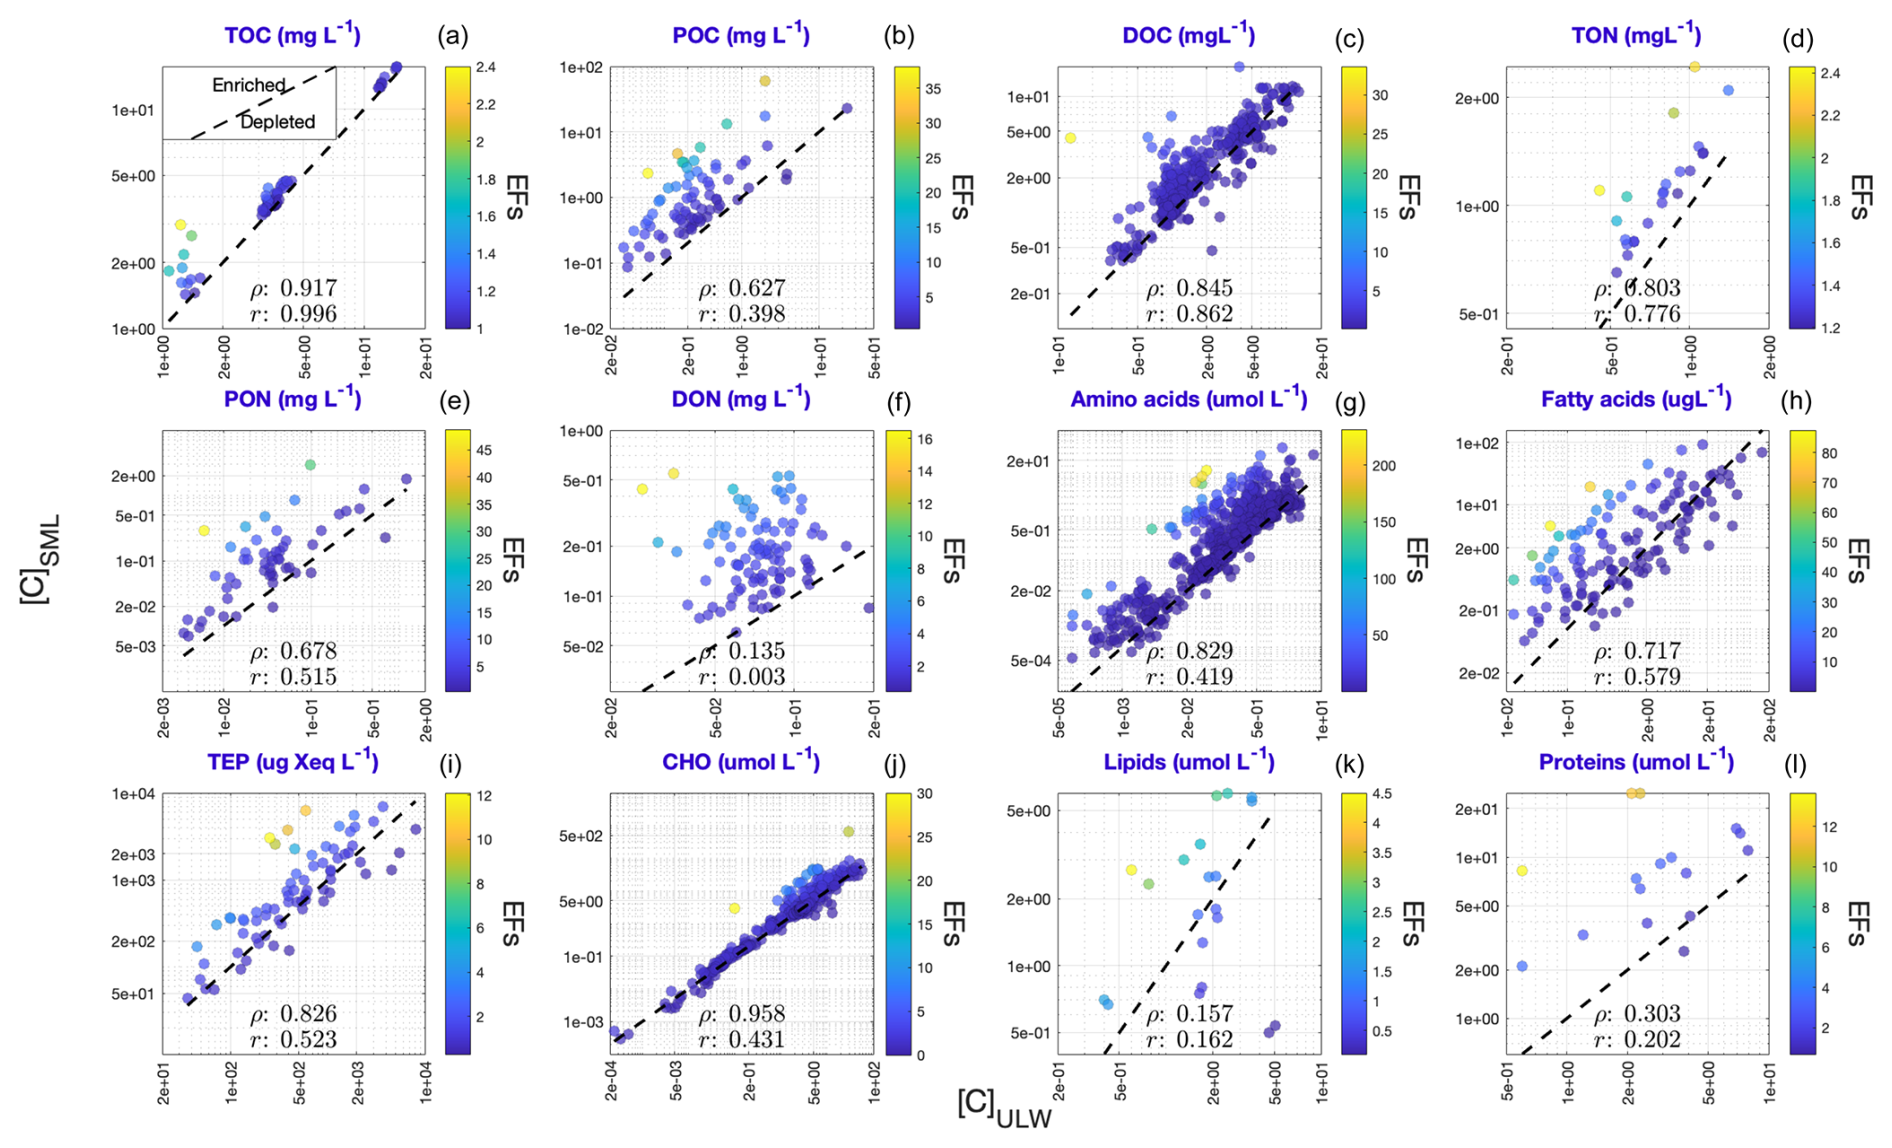
Figure 6Linear correlation between [C]ULW and [C]SML for the target compounds. The datapoints are color-coded based on their corresponding EFs. Dashed black line indicates 1:1 line when [C]ULW (x axis) = [C]SML (y axis). Inset plot in panel (a) exhibits the relevant implications of the figure: Correlations above the 1:1 line corresponds to selective SML enrichment and vice versa. The values of “ρ” and “r” give Spearman's and Pearson correlation coefficients, respectively.
3.3 Investigating concentration-dependent enrichment dynamics
Informed by the observations drawn from Fig. 6, Fig. 7 presents a more detailed investigation into the interrelationships among [C]SML, [C]ULW and EFs in the environment. The analysis is restricted to [C]SML values (x axis) that exceed the (i.e., median) of their respective distributions (median is the most stable central tendency metric of a distribution. Discussed further in Sect. 4.2). These elevated [C]SML are compared against the corresponding [C]ULW (color scale) and EF (y axis) values. The results reveal following covariation trends:
- i.
TOC reports a generally low range of EF values comparable at both low and high concentrations of SML and ULW (Fig. 7a).
- ii.
DOC displays relatively consistent EF values regardless the magnitudes of [C]SML and [C]ULW (Fig. 7c), but also slightly points towards higher EF values in association with low [C]ULW.
- iii.
DON presents an ascending EF gradient, positively correlated with [C]SML (Fig. 7f), revealing more enrichment to be well reflected in the concentrations found in the SML.
- iv.
AA shows a similar correlation dependence to that of DON, but also reveals a much clearer trend toward higher EF values to be found at lower [C]ULW concentrations (Fig. 7g).
FA (Fig. 7h), despite their larger sample sizes, exhibit no clear trend in the [C]SML− [C]ULW− EF triad.
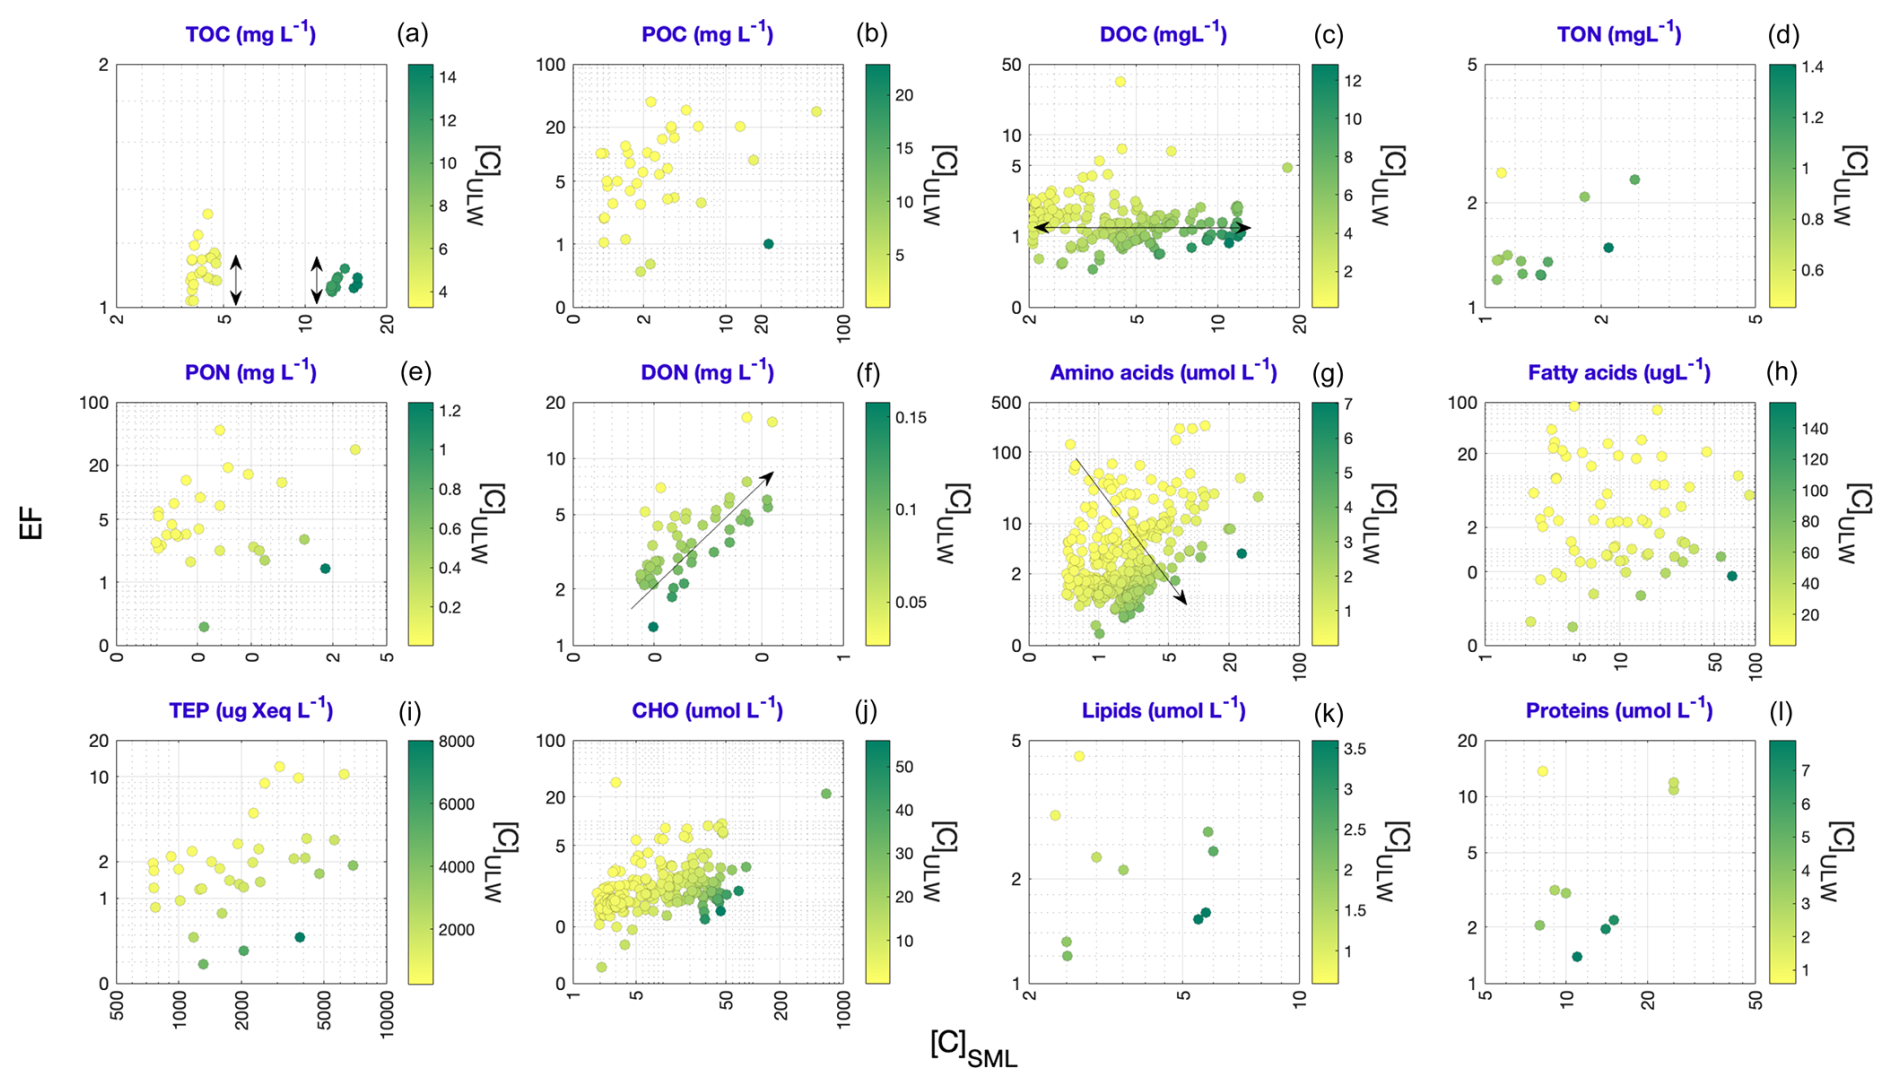
Figure 7Interdependent relationship of [C]SML values with the corresponding [C]ULW and EF values. The analysis is restricted to [C]SML values that exceed the corresponding values. The x axes give the observed [C]SML values against their corresponding EF values on y axes. Datapoints are color-coded based on corresponding [C]ULW values. The black arrows indicate identified enrichment patterns.
A major strength of the SML-OM dataset is its broad coverage of OM concentrations, whereas individual studies are typically restricted to a narrow range of similar ULW conditions. By employing a meta-analytical approach, our study presents the first comprehensive overview of the enrichment dynamics in the SML, based on existing literature. Meta-analytical studies offer a rigorous framework to synthesize evidence across diverse datasets thereby improving the reliability of scientific conclusions. By statistically integrating outcomes from independent investigations, meta-analyses increase overall analytical power, reduce the influence of small-sample variability and, uncover true environmental signals from study-specific biases (i.e., sampling strategies, analytical techniques, spatial scales and seasonality). This not only enhances the generalizability of findings but also exposes gaps and inconsistencies in the existing literature, guiding the development of more robust future studies.
In this context, conducting a quantitative assessment of how the reference studies (i.e., those on which the SML-OM is based) are distributed across key domains of SML research provides insights into the most frequently studied aspects (Fig. S1), thereby explicitly quantifying metadata coverage; research on the SML has increased from about 15 publications per year in the early 2000s to approximately 50 per year by 2016 (Engel et al., 2017). However, our work highlights the potential understudied areas in SML research that call for more in-depth analysis. For instance, majority of the reference studies has been conducted in oceanic and coastal regions (∼ 76 % of data) and predominantly during warmer months (∼ 77 % of data) with a significant mismatch observed for data collected under low and high wind regimes (∼ 81 % vs. 19 %, respectively). In light of these research gaps, the following sections interpret the main findings revealed by our analysis and discuss their implications for understanding SML enrichment.
4.1 Overarching trends in SML enrichment
4.1.1 Generalized enrichment patterns
Comparison of KDE-derived PDFs for the EF values of (1) carbon-enriched vs. nitrogen-enriched organic compounds (Fig. 1) and (2) dissolved vs. particulate organic compounds (Fig. 2) yield the following key implications:
All the estimated original (i.e., linear scale) PDFs (Figs. 1a and 2a) display higher probability densities for lower EF values and extended tails towards higher EF values (i.e., right-skewness), suggesting that under natural conditions, modest SML enrichment is far more common in general, while extreme enrichment events are rare
Variations in the peak probability densities among the PDFs indicate that extreme SML enrichment events are relatively more frequent in nitrogen-enriched compounds (Fig. 1: orange PDF) and particulate forms (Fig. 2: green PDF), compared to carbon-enriched compounds (Fig. 1: blue PDF) and dissolved forms (Fig. 2: purple PDF)
Nitrogen-enriched compounds and particulate forms exhibit a broader EF variability (i.e., higher mode, median, mean values) compared to carbon-enriched compounds and dissolved forms with a relatively more consistent spread (i.e., lower central tendency metrics)
These differences in peaks and central tendency metrics persist in log-transformed PDFs as well (Figs. 1b and 2b). This validates that these variations are not caused by statistical artifacts but reflect real, natural variability in enrichment behavior. Overall, these findings from our meta-analysis indicate that the OM accumulation in the SML is more effective for (1) nitrogen-enriched than for carbon-enriched compounds and (2) particulate than for dissolved forms. These enrichment patterns likely reflect the combined influence of biological, chemical and physical mechanisms acting on the SML: Frka et al. (2012) outlined the complex, multicomponent behaviour of the SML, suggesting competitive adsorption of more insoluble surfactants (e.g., lipid-like material) during highly productive seasons. Selective enrichment of certain polar amino acids (e.g., arginine and glutamic acid) relative to others has been hypothesized (Barthelmeß and Engel, 2022). However, these mechanisms are not yet fully resolved. The molecular structure of N-enriched compounds also promotes aggregation into colloids or microgel particles (Dietz et al., 1976), a process further enhanced by bubble scavenging and low-turbulence trapping (Mopper et al., 1995). In contrast, carbon-rich compounds such as polysaccharides are generally more soluble and tend to remain largely distributed in the bulk water, resulting in comparatively lower surface activity and enrichment at the interface (Ćosović and Vojvodić, 1989; Laß et al., 2013). Similarly, particulate OM exists as discrete, larger units, that can be trapped at the interface due to surface tension and by bubble-mediated processes (Robinson et al., 2019). However, some particles, such as TEP ballasted with mineral dust or phytoplankton shells, may sink rather than rise, highlighting the complex balance of forces controlling surface accumulation (Mari et al., 2017). While bubble scavenging represents a process which can lead to the aggregation of dissolved components (for example, at the rear of rising bubbles; Dukhin et al., 2015; Zhou et al., 1998), a large fraction of dissolved OM, potentially exhibiting reduced overall surface activity, passes through these processes without accumulating at the air–water interface. Transient enrichment of dissolved OM can nonetheless occur. Overall, surface-associated processes such as bubble scavenging and aggregation can enhance the enrichment of particulate compounds in the SML relative to dissolved forms.
Our findings contradict some earlier works (Baastrup-Spohr and Staehr, 2009; Liss and Duce, 1997; Yang, 1999), who suggest that the SML is similarly enriched for both particulate and dissolved organic (and inorganic) compounds, but align with other studies that report opposing results: Dietz et al. (1976) provide evidence for enhanced accumulations of particulate matter in the SML through particle aggregation at the surface. The work further links high abundances of living bacteria in the near-surface to higher availability of POC in the SML. Studies of Carlucci et al. (1985), Henrichs and Williams (1985), Kuznetsova et al. (2004), Kuznetsova and Lee (2002) and Reinthaler et al. (2008) report that POC and PON tend to be more enriched in the SML than DOC. Engel et al. (2017) state that the SML has been shown to be enriched in particulate organic matter, particularly in proteinaceous compounds. Together, these findings and our meta-analytical synthesis, indicate that nitrogen-enriched compounds may interfere more critically with interfacial properties. Whether incorporating these nitrogen-based metrics can improve the precision of traditional carbon-only parameterizations of gas exchange suppression (e.g., Barthelmeß et al., 2021; Li et al., 2024) remains an important question for future work.
Although nitrogen-enriched compounds seem to exert a strong influence on the SML's interfacial properties at the bulk scale, a compound-specific comparison of three biosurfactants data – AA (Fig. 3g), FA (Fig. 3h) and CHO (Fig. 3j) – reveals a more complex picture (Fig. 8): AA, despite their high nitrogen content, do not exhibit the highest enrichment. Instead, their EF values (0.3–10) fall between those of CHO (lower end: 0.3–2.5) and FA (upper end: 0.1–60). Our results are consistent with earlier reports on their natural EF ranges: Polysaccharides can be enriched in the SML up to three-fold compared to the ULW (Williams et al., 1986; Wurl and Holmes, 2008). Enrichment of AA can vary between 0.3 to 201, depending on their species-specificity (Cunliffe et al., 2013). This EF hierarchy likely reflects the intermediate surface activity of these three compounds: Barthelmeß and Engel (2022), referring to Ćosović and Vojvodić (1998) state that “Lipid-like surfactants exhibit stronger surface activity, while protein-like, followed by carbohydrate-like, surfactants decrease in activity”. FA dominate competitive adsorption due to their strong amphiphilic character (i.e., a long hydrophobic tail and small polar head), allowing them to readily form stable monolayers at the interface. In contrast, proteins are moderately surface-active, while highly soluble CHO largely remain in the bulk water (Ćosović and Vojvodić, 1998; Laß et al., 2013; Laß and Friedrichs, 2011). Consequently, these patterns suggest that compound-specific enrichment in the SML is driven more by the surfactant properties of individual compounds than their elemental composition alone. While this hierarchy holds for single-component systems, interactions in natural SML mixtures are complex, and the structural properties of the nanolayer are influenced by both rare insoluble lipid-like and abundant soluble carbohydrate-like material. Nevertheless, we do not extend this analysis further as biosurfactant measurements (1) primarily quantify surface activity rather than enrichment and (2) are subjected to methodological inconsistencies that limit cross-study comparability. We further acknowledge that the mechanistic links between surfactants, their behavior and associated ecosystem processes remain incompletely understood.
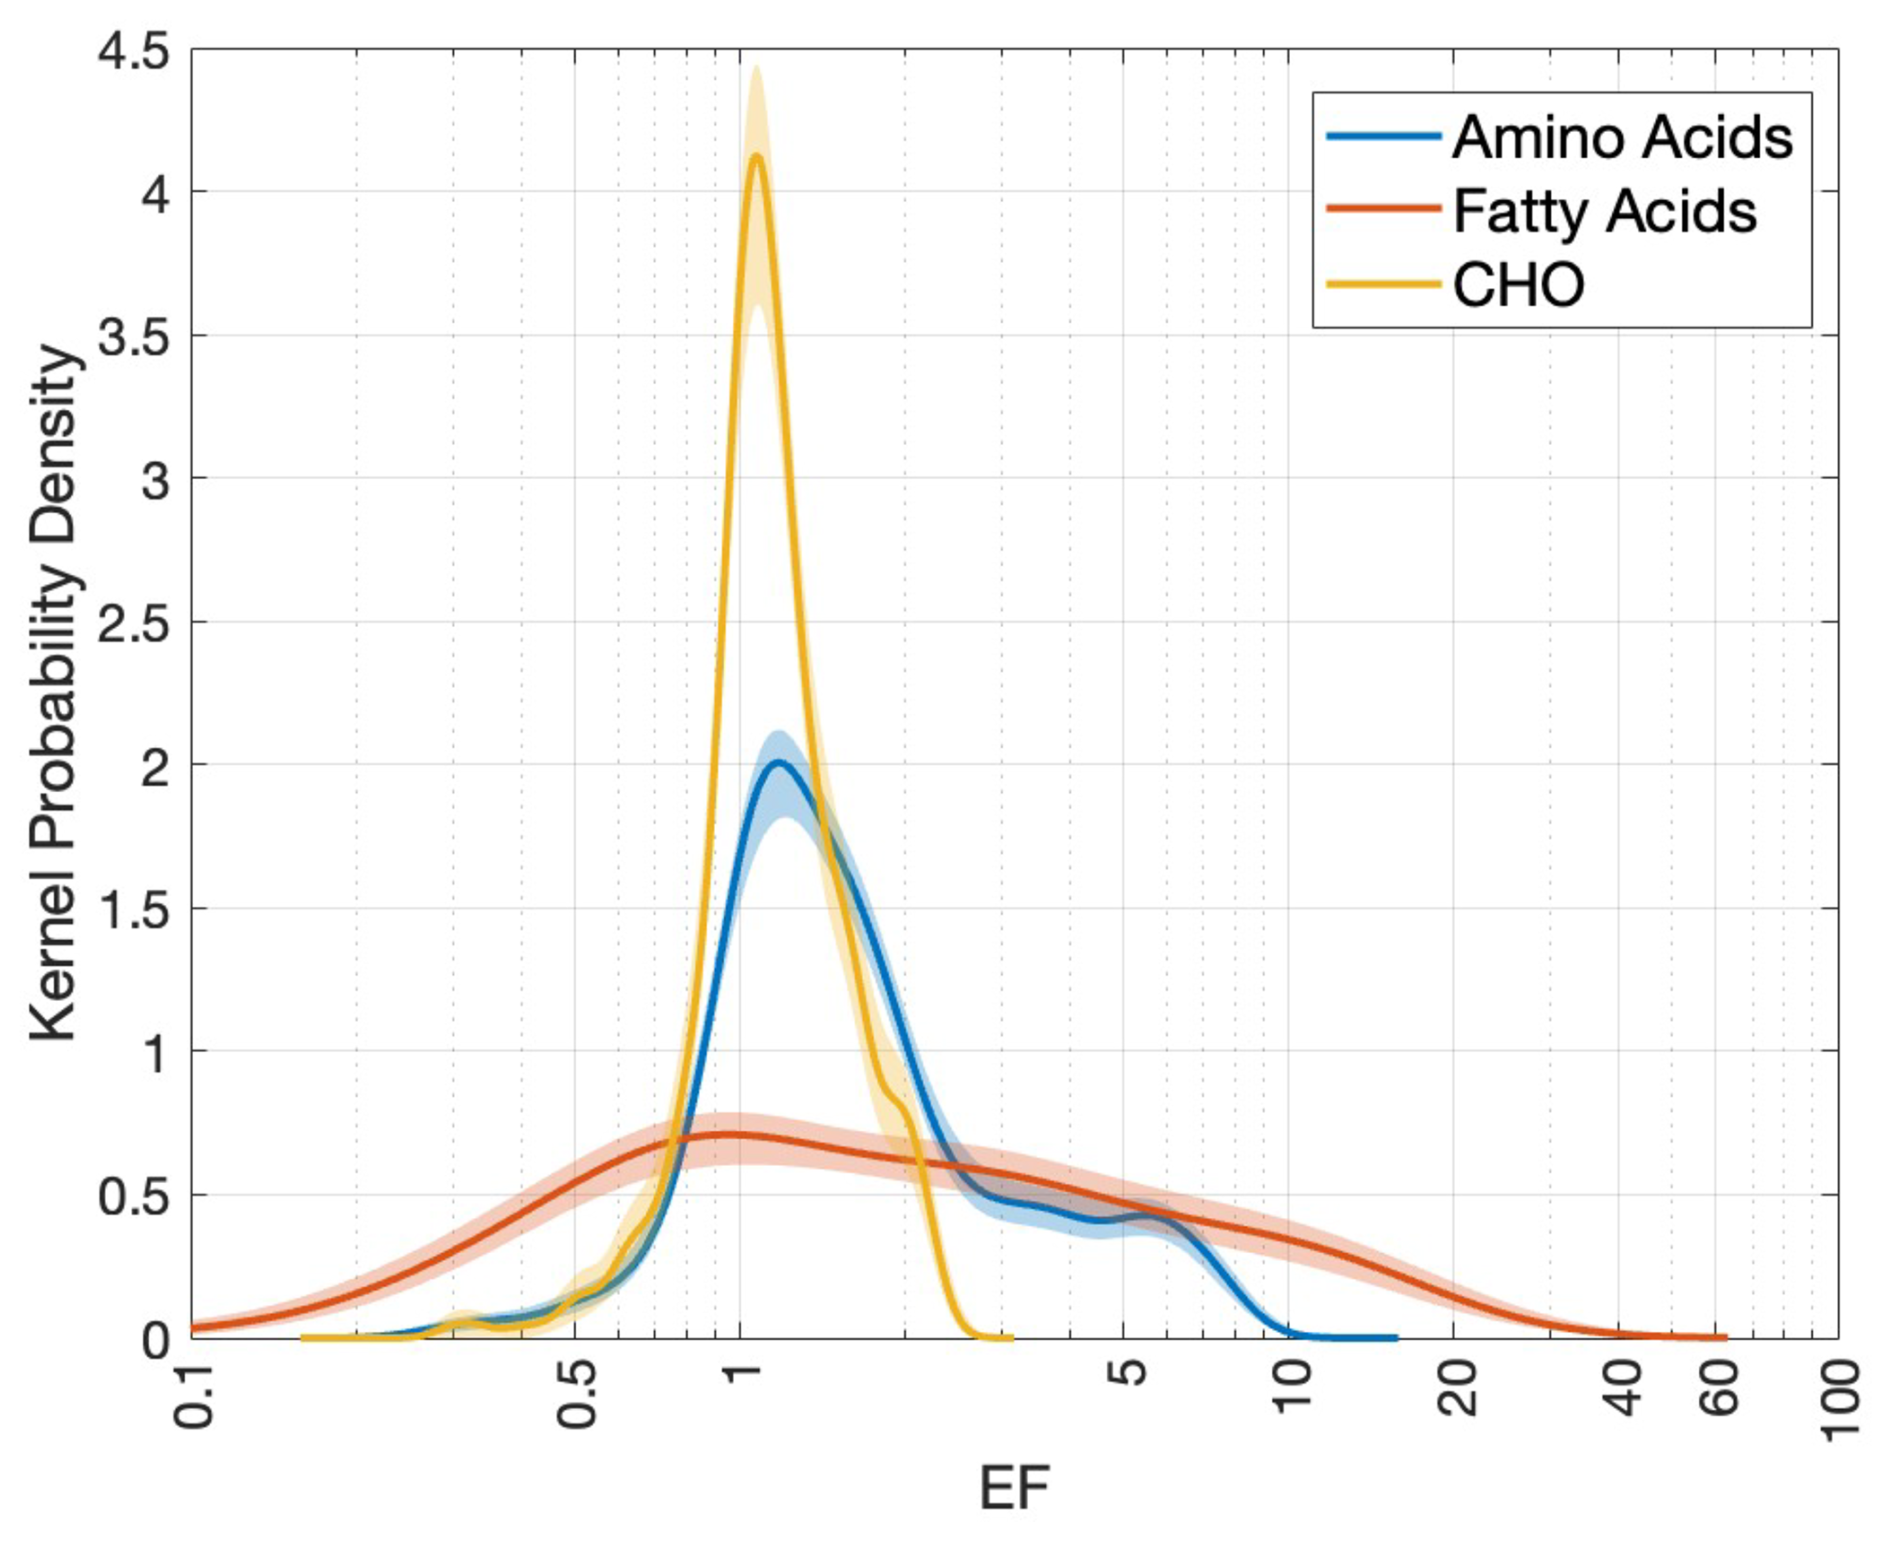
Figure 8Comparison of PDFs of the EF values for three biosurfactants: Amino acids (blue), fatty acids (orange) and carbohydrates (yellow). The figure synthesizes the KDEs given in Fig. 3g, h and j.
Overall, these overarching trends of SML enrichment underscore the importance of resolving compound-specific accumulation in the SML, while distinguishing between selective and non-selective enrichment. Cumulative probability comparison results for the [C]ULW and [C]SML (Figs. 4 and 5) and their corresponding linear correlations (Fig. 6) provide a meta-analytical perspective on how compounds are distributed and accumulated between the two compartments. Here, results concerning lipids and proteins are excluded due to apparent randomness in their distributions, potentially caused by smaller sample sizes.
4.1.2 Compound-specific enrichment patterns
Significant correlations between [C]ULW and [C]SML of nearly all the target compounds (ρ and r>0.5) are consistent with the overall understanding that the SML's composition is linked to the availability of material in the underlying sub-surface waters (Chen et al., 2016; Joux et al., 2006). Contrary to this general pattern, Kuznetsova et al. (2004) suggest that certain OM fractions in the SML and ULW may show lack of correlation, potentially due to constraints such as varying mineralization rates between the two layers and surface adsorption processes. Consistent with this view, linear correlation results for DON indicate such decoupling (Fig. 6f), though the underlying causes remain unexplored in this study. Early works also suggested that the variations in the SML concentrations are typically larger than those in the ULW (Reinthaler et al., 2008). In agreement, CDFs of the [C]ULW and [C]SML demonstrate faster probability accumulation for ULW than SML (Fig. 4), implying generally smaller magnitudes and lower variability in ULW concentrations compared to SML concentrations. Conversely, Carlson (1983) argues that, in certain occasions, OM variability in the SML and ULW may not significantly differ across temporal and spatial scales. The CDFs for TOC, DOC, TEP and CHO which exhibit the lowest IQD values (Fig. 5) support this but is contradicted by those of the other compounds, with higher IQD values (indicating substantial differences between the two concentrations).
Works of Hunter and Liss (1977) and Kurata et al. (2016) discuss the selective enrichment of surfactants in the SML, mainly driven by microbial processes. Hydrophobic compounds tend to show more affinity to the surface compared to hydrophilic substances (Marty and Saliot, 1976). In agreement, our linear correlation results reveal preferential accumulation of the biosurfactants, AA (Fig. 6g) and FA (Fig. 6h), in the SML. Linear correlation results shown in Fig. 6i provide evidence to the view that TEP is generally enriched in the SML compared to the ULW (Cunliffe et al., 2009; Cunliffe and Murrell, 2009; Wurl and Holmes, 2008), although this enrichment is not strongly pronounced in our dataset. Additionally, the nearly overlapping CDFs for TEP in SML and ULW (Fig. 4i) along with its low IQD value (= 0.081; Fig. 5) indicate a surprisingly weak enrichment, contrary to expectations. Nevertheless, concentration trend of TEP observed in our data closely aligns with that of CHO (Figs. 4j and 5), supporting the prevailing hypothesis that TEP is formed through coagulation of dissolved polysaccharides (Passow, 2000). Thornton et al. (2016) observe that TEP and dissolved polysaccharides do not always exhibit significant enrichment in the SML as anticipated.
POC and PON correlation patterns (Fig. 6b and e, respectively) where [C]SML significantly exceeds [C]ULW, and that of DOC (Fig. 6c) where [C]SML is nearly equal to [C]ULW, provide strong meta-analytical evidence to earlier works that discuss the selective enrichment of POC and PON in the SML over DOC (e.g., Henrichs and Williams, 1985; Kuznetsova et al., 2004; Kuznetsova and Lee, 2002; Reinthaler et al., 2008). Carlson (1983) suggests that the distribution of some organic fractions between the SML and the ULW may be governed by specific partitioning processes. For instance, while Chen et al. (2016) point out the significant role of the ULW in DOC and CHO accumulation in the SML, Dietz et al. (1976) observe fairly consistent abundances for these compounds between the two layers. Our experiments also show strong 1:1 correlation for DOC (Fig. 6c) and CHO (Fig. 6j), suggesting an absence of preferential affinity towards the SML (unlike surfactants), which further indicates that their enrichment is predominantly controlled by the ULW. Although CHO, AA and FA are identified to be the key constituents of the organic carbon pool (Hedges et al., 1994), our correlation results reveal that their partitioning between the SML and the ULW and, their eventual enrichment patterns, may not be consistent (Fig. 6), as also suggested by Fig. 8.
4.1.3 Influencing factors and current uncertainties
Baier et al. (1974), Hunter and Liss (1981) and MacIntyre (1974) argue that the compositional diversity of the SML prevents single compounds from fully representing the dissolved OM class, which further emphasizes the importance of assessing compound-specific accumulation in the SML. Such investigations could shed light on selective and non-selective enrichment dynamics of OM. An analysis of EF-based PDFs for various AA fractions (Fig. 9a) – Total AA (TAA), Dissolved Free AA (DFAA), Dissolved Combined AA (DCAA) and Particulate AA (PAA) – revealed notable heterogeneity within this compound class, reflecting the chemical diversity and complexity of OM enrichment in the SML: Relatively lower enrichment in DFAA may indicate its limited accumulation in the SML, potentially due to its high solubility and rapid turnover (Jørgensen et al., 1993). In contrast, DCAA, which comprises combined amino acids, might exhibit stronger surface activity and a greater tendency to form aggregates, leading to higher enrichment across a broader range. The bimodal EF distribution observed for PAA could reflect differences in particle composition, size and hydrophobicity, whereby denser particles sink rapidly while buoyant, organic-rich particles preferentially accumulate at the surface. TAA, which integrates all these molecular states, may dampen these extremes and yields more moderate enrichment. These interpretations remain as hypotheses, as very little is known about the behavior of AA embedded in highly complex structures in natural SML.
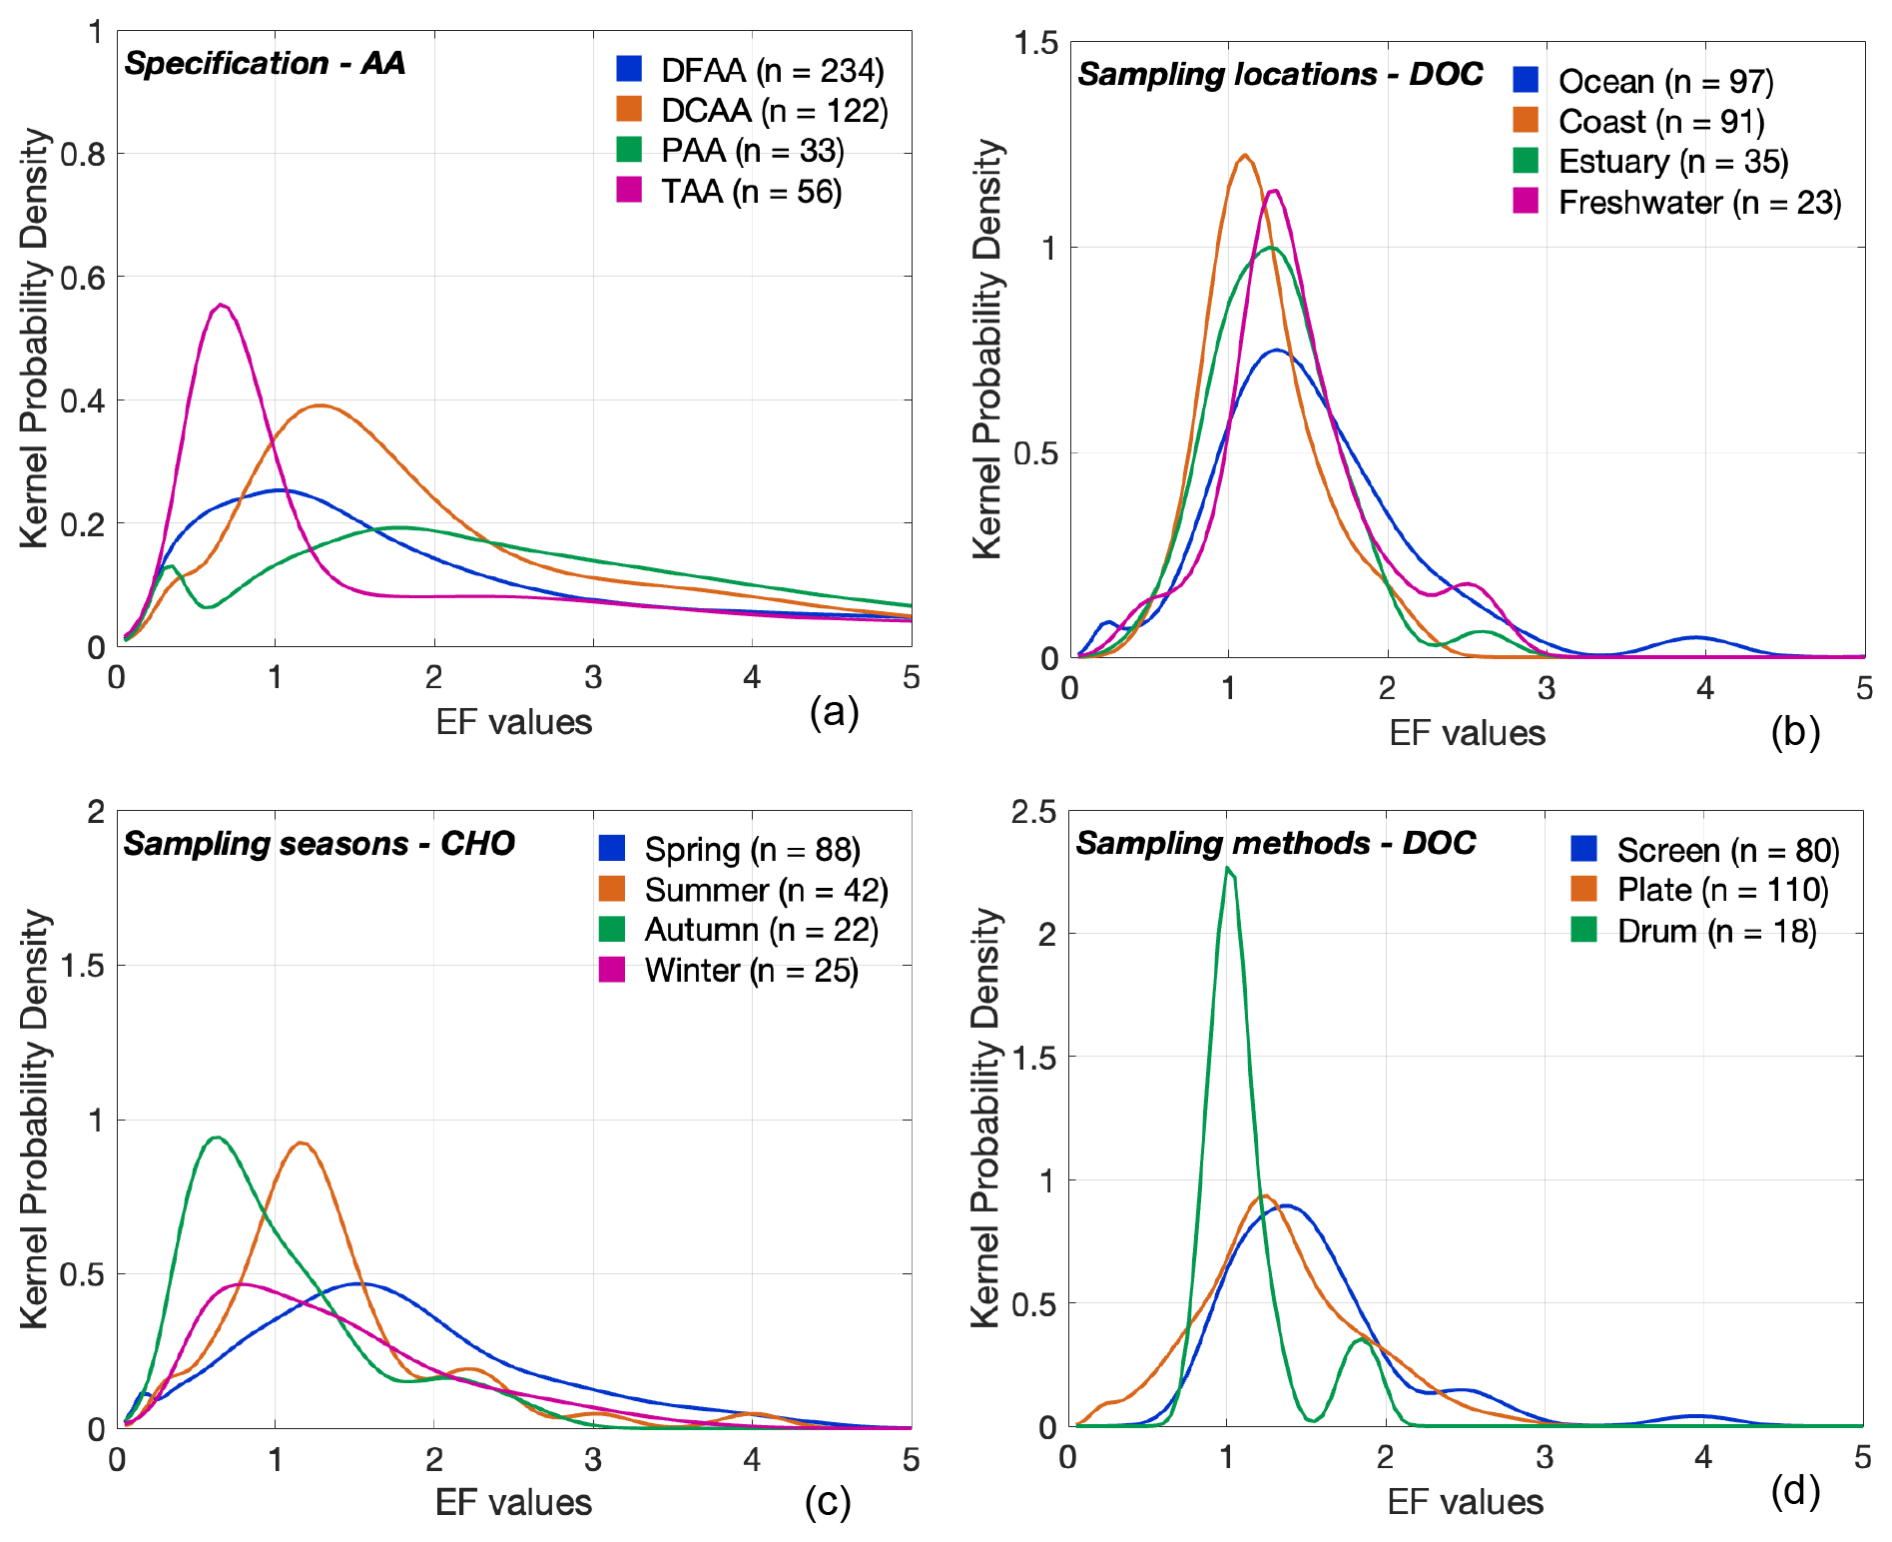
Figure 9Factor-specific enrichment variability in the SML. PDFs illustrating varying enrichment patterns for (a) AA across chemical forms, (b) DOC across sampling locations, (c) CHO across sampling seasons and (d) DOC across sampling methods. “n” gives the sample size of each category. Table S1 summarizes different sampling locations, sampling seasons and sampling methods observed for the investigated target compounds.
Additionally, consistent with previous studies that investigated the influence on environmental drivers on the enrichment dynamics in the SML (e.g., Asher, 1997; Barthelmeß et al., 2021; Knulst et al., 1997; Kuznetsova et al., 2004; Liu and Dickhut, 1998; Obernosterer et al., 2008; Reinthaler et al., 2008; Tsai and Liu, 2003), our analysis demonstrates that factors such as sampling location (for DOC), sampling season (for CHO) and sampling method (for DOC) (Fig. 9b–d) play key roles in modulating the enrichment variability of the OM. It should be noted that these specific target compounds are chosen as representative examples because they span all subcategories of secondary data considered in the study (see Table S1), and therefore enable a more robust comparison among different settings.
Comparison of DOC enrichment across four sampling locations (Fig. 9b) reveals relatively reduced coastal enrichment (as also seen by Carlson, 1983). This pattern may result from enhanced mixing and shorter surface residence times due to stronger wave action, tidal influence, or nearshore turbulence. Alternatively, the limited two-dimensional space at the air-sea interface in combination with a highly saturated underlying water layer could also contribute to reduced enrichment. At the same time, broader EF variability displayed by oceanic sites likely stems from the greater heterogeneity of open-ocean conditions including varying biological productivity and OM sources (Carlson, 1983). In contrast, estuarine and freshwater systems, which often have more constrained physical regimes and relatively consistent OM inputs, tend to exhibit narrower EF ranges (Hillbricht-Ilkowska and Kostrzewska-Szlakowska, 2004). Observations by Barthelmeß et al. (2021) and Mustaffa et al. (2018) suggest that changes in EF in these systems are driven more by variations in the ULW than by the SML itself, consistent with the idea that the surface layer in high-OM regimes is already saturated and thus less responsive to additional inputs. Moreover, bimodal CDFs of TOC for the SML and ULW concentrations (Fig. 4a) along with the distinct separation of three data clusters in their correlation patterns (Fig. 6a), further highlight the significant role of spatial factors in shaping SML composition. The origins of TOC data used in this study illustrate this variability: Data from (1) a heavily polluted urban lake (concentration range: 12–16 mg L−1; Baastrup-Spohr and Staehr, 2009), (2) a forested lake (concentration range: 3–5 mg L−1; Baastrup-Spohr and Staehr, 2009), (3) the Arctic Ocean (concentration range: 1–3 mg L−1; Gao et al., 2012) and (4) an upwelling filament (concentration range: 3–4 mg L−1; Barthelmeß et al., 2021).
Seasonal comparison of the EF values for CHO (Fig. 9c) likely reflects temporal differences in biological drivers (Gas¢parović and Ćosović, 2001, 2003) in the SML (i.e., depletion in cold months, while warm months show relatively higher and consistent enrichment with broader variability). Additionally, stronger wind conditions typical of winter may disturb the SML and reduce particle residence time, counteracting surface accumulation (Sun et al., 2018). However, the influence on wind speed on SML enrichment remains ambiguous; our comparison of EF values under calm (< 6.6 m s−1; Reinthaler et al., 2008) and rough (> 6.6 m s−1) wind conditions yield inconclusive results (Fig. S2) with wind speed appearing to have little/no effect on the SML enrichment (e.g., Baastrup-Spohr and Staehr, 2009; Sabbaghzadeh et al., 2017) or with enrichment persisting even under rough sea conditions (e.g., Kuznetsova et al., 2004; Reinthaler et al., 2008), opposing the general understanding that turbulent conditions may reduce the concentration in the SML (e.g., Carlson, 1983).
Nevertheless, it is important to note that imbalanced sampling efforts among these categories (Fig. S1), especially with regards to wind speed (Fig. S2; see the sample sizes), may compromise the robustness and validity of these findings. This is also evident in the comparison of sampling techniques for the EF values of DOC (Fig. 9d), where the drum method, with a sample size of only 17, shows limited variability compared to the screen and plate methods (sample sizes of 80 and 110, respectively). This likely reflects a bias due to sampling effort rather than a true difference in enrichment behavior. Collectively, these findings highlight the need for future SML research and SML-based model development to systematically account for wind and sea-state conditions, and to explore how enrichment patterns may vary under different environmental regimes and methodological settings.
Another major source of uncertainty arises from the variability in sampling depths of the ULW (Table S1), which can affect the comparability of different data across multiple studies that would eventually introduce bias into the interpretation of overarching trends. Additional biases which are beyond the scope of this study include the potential influence of diurnal cycles (López-Puertas et al., 2025); OM can be rapidly removed from the SML through photochemical degradation (Obernosterer et al., 2008) and also be affected by reduced bacterial metabolism due to solar radiation (Dietz et al., 1976). Therefore, taken together, our meta-data analysis suggests that, investigating SML enrichment without accounting for these influencing factors may mask true enrichment patterns, limiting the ability to derive meaningful insights. In light of these considerations, our work highlights the need for conducting species-specific and condition-dependent analyses in future SML research that also focus on subsequent environmental parameters, as also proposed by Pereira et al. (2018).
4.2 Scale-related biases in EF estimates
Accurate data interpretation is essential to gain precise insights and arrive at substantiated conclusions (Isles, 2020; Menge et al., 2018). This is particularly true for meta-analyses involving continuous environmental data where values may vary by several orders of magnitude (e.g., Vitousek, 2004). In our study, when the PDFC vs. PDFN (Fig. 1) and PDFD vs. PDFP (Fig. 2) are evaluated on a linear scale (panel a), they exhibit right-skewness, whereas their log-transformed versions approximate normal distributions (panel b). Comparisons between highly skewed distributions raise uncertainties as their offsets are often dominated by extreme values/outliers. In contrast, when log transformation is applied, the distributions tend to exhibit more symmetric, normalized patterns which enable direct comparisons in shape and spread across different categories (Zuur et al., 2007). Therefore the normality assumption for EF is inappropriate and the computation of an arithmetic mean, a conventional practice adopted in many earlier works (e.g., Gao et al., 2012; Gas¢parović and Ćosović, 2001; Kuznetsova et al., 2005; Williams et al., 1986; Wurl et al., 2009; Wurl and Holmes, 2008), can be misleading, likely providing a biased general picture of OM enrichment in the SML.
The here constructed PDFs given in Figs. 1 and 2 reveal that both mode (xm; shown by solid straight lines) and arithmetic mean (; shown by dashed straight lines) differ between the two scales: The mode reflects the peak of a distribution and is sensitive to the shape of its respective density curve. It varies depending on whether a dataset is in “skewed” linear space or “normalized” log space and becomes ambiguous in polymodal distributions (regardless of the scale: e.g. Fig. 3). As a consequence, the mode in general provides an unreliable measure of central tendency. While the linear-arithmetic mean, which is influenced by outliers, result in biases that exaggerate the corresponding central tendency, the log-arithmetic mean prevents the extreme values from being dominant through balanced averaging and hence provides a reliable estimation of central tendency. Nevertheless, geometric mean in linear space ( straight lines with alternating dots and dashes) is a meaningful measure given that it is equivalent to the exponential of the arithmetic mean in logarithmic space (see Eqs. B1 and B2). Median (; dotted straight lines), on the other hand, remains relatively consistent across both scales as it is a rank-based measure of central tendency that is unaffected by the magnitude of outliers. Accordingly, we suggest that future SML enrichment studies employ a logarithmic scale for data analyses, and adopt either geometric mean and/or median on linear scale or arithmetic mean and/or median on logarithmic scale for reliable trend analysis.
Based on these new insights on scale transformations and central tendency metric considerations, we have redefined the typical EF values of the studied target compounds and their degrees of spread from a meta-analytical perspective, from the estimated and thresholds (i.e. UT and LT) of their PDFs (Fig. 3). To re-establish these EF ranges as generally observed estimates under common conditions, the box plot method (Tukey, 1977) was applied to the data to detect and remove potentially extreme EF values that rarely occur in nature. By providing these systematically derived ranges, our analysis offers a robust and comprehensive reference framework, enabling future SML-based studies to consistently evaluate newly obtained EF measurements, assess their position relative to typical distributions, and identify deviations that may indicate unusual environmental conditions or methodological inconsistencies.
4.3 Role of EF in reflecting SML enrichment
While the metric of EF offers a convenient way to assess the accumulation trends in the SML and therefore serves as the basis for many established insights and inferences in existing SML research (see Introduction), its ability to accurately and robustly express the “true” enrichment nature of the SML has constantly been a question of interest (e.g., Baastrup-Spohr and Staehr, 2009; Hillbricht-Ilkowska and Kostrzewska-Szlakowska, 2004; Knulst et al., 1997; Kuznetsova et al., 2004; Liss and Duce, 1997; Münster et al., 1998; Södergren, 1987). The EF is a ratio that expresses the “relative” changes in [C]SML with respect to [C]ULW (Eq. 1), and hence is sensitive to the variations in either layer. Ideally, to effectively reflect conditions of growing SML enrichment, EF values should gradually rise in response to increasing [C]SML and decreasing [C]ULW, which can be visibly observed for DON (Fig. 7f), AA (Fig. 7g) and CHO (Fig. 7j). Nevertheless, our meta-analysis highlights several inconsistencies that challenge the relevance of the EF values as indicators of “true” SML enrichment. For instance, on one hand, similar EF values can be observed for both oligotrophic and eutrophic environments (referring to the EFs of TOC: Fig. 7a), which limits the ability to distinguish the differences in their trophic status (i.e., nutrient/productivity characteristic of the water body), despite them being conspicuous in TOC's absolute concentration range (bimodal CDFs; Fig. 4a). On the other hand, high (low) EF values may occur under oligotrophic (eutrophic) conditions leading to over- (under-) estimation of ecological setting (i.e., biological and environmental context under which SML samples were collected; Fig. 7g). Furthermore, symmetrical changes in SML and ULW yield near-constant EF values across a wide range of concentrations (Fig. 7c), which could cause misinterpretations in key ecosystem shifts. We have also observed consistent EF values, even when SML and ULW concentrations vary over several orders of magnitudes (Fig. 6g–j), which further raise concerns over the metric's robustness. Therefore, although widely used, EF values should be interpreted with caution and, combined with additional parameters that provide more accurate information about the true enrichment behaviour of the SML.
A complementary parameter would be the typical upper limit of a [C]SML distribution which may reflect the maximum concentration capacity of the SML. Such a measure can serve as a robust concentration estimate of such maximum capacity if approximated from a meta-data derived distribution that includes observations across all diverse environmental conditions. Table 1 summarizes the upper [C]SML threshold estimates (i.e., UT; at 95th percentile) for the target compounds, based on their CDFs (Fig. 4). Although the robustness of these values largely depends on the quality and the scope of the underlying metadata, our bootstrapping approach addresses these potential limitations. Nevertheless, we acknowledge that these estimates remain data-constrained and therefore can improve with the inclusion of more comprehensive, high-resolution datasets across diverse environmental conditions. Measured concentrations beyond these thresholds must be considered exceptionally high and warrant closer investigation to determine whether they reflect specific compounds or environmental conditions, such as biogeochemical, oceanographic and weather-related factors. High concentrations of CHO (> 50 µmol L−1) were reported by Milinković et al. (2022), which affect the outcome of the UT estimate. In contrast, typical CHO concentrations in the SML reported in other studies remain well below the 50 µmol L−1. Since these differences cannot be resolved here, our UT estimate for CHO should therefore be treated with caution.
Table 1A summary of estimated UT values (upper threshold; concentration at 95th percentile) for [C]SML distributions of the target compounds. This metric represents the maximum accumulation capacity of a certain compound in the SML. The values are rounded to the nearest whole number.

Considering absolute changes in the SML concentrations (rather than relative changes) – calculated as the magnitude difference between corresponding SML and ULW concentrations (i.e., [C]SML− [C]ULW) – provides complementary insights into the SML's enrichment dynamics. When this metric is compared against the EF values for DOC data where EF (= 1.2), resulting Spearman's correlation coefficients (ρ) reveal a stronger relationship (Fig. 10c; ρ= 0.32) relative to EF vs. [C]SML (Fig. 10a; ρ= 0.08) and EF vs. [C]ULW (Fig. 10b; ρ= −0.12) correlations. This implies that although the EFs may have a limited capacity to represent the absolute concentrations of either SML or ULW, they are more responsive to the absolute concentration “changes” in the two compartments. This analysis reveals that although “enrichment factor” obscures accurately interpreting the trophic status or the actual enrichment in the SML, it may still hold value as a proxy that reflects the degree of partitioning between the surface microlayer and underlying waters.
Furthermore, normalization of [C]SML− [C]ULW metric to the corresponding [C]SML values (i.e., ) ultimately yields an EF-based metric: . This expresses how much of the SML concentration is above the ULW baseline, effectively providing a measure of fractional enrichment that overlooks background variability in the ULW. Unlike conventional EF values, only ranges between 0 and 1. It rescales compound-specific variability in EF and is therefore better suited for comparison across all the different observational types; normalization of EF onto a common scale allows direct evaluations without bias from different units, magnitudes or concentration ranges. This metric better captures true trends, rather than artifacts/effects of scale, while enhancing visualization and communication of results. In addition, when compared against the absolute changes, this metric exhibits stronger correlation (ρ= 0.52; Fig. 10d), likely due to increased robustness to concentration variability obtained through its scale-dependent nature. As a result, when incorporated into modelling efforts, the normalized EF metric can offer distinct advantages such as integration of heterogenous datasets, consistent parameterization, easier comparisons of model predictions and robust sensitivity analyses. Together, these benefits contribute to more reliable and generalizable models of SML processes.
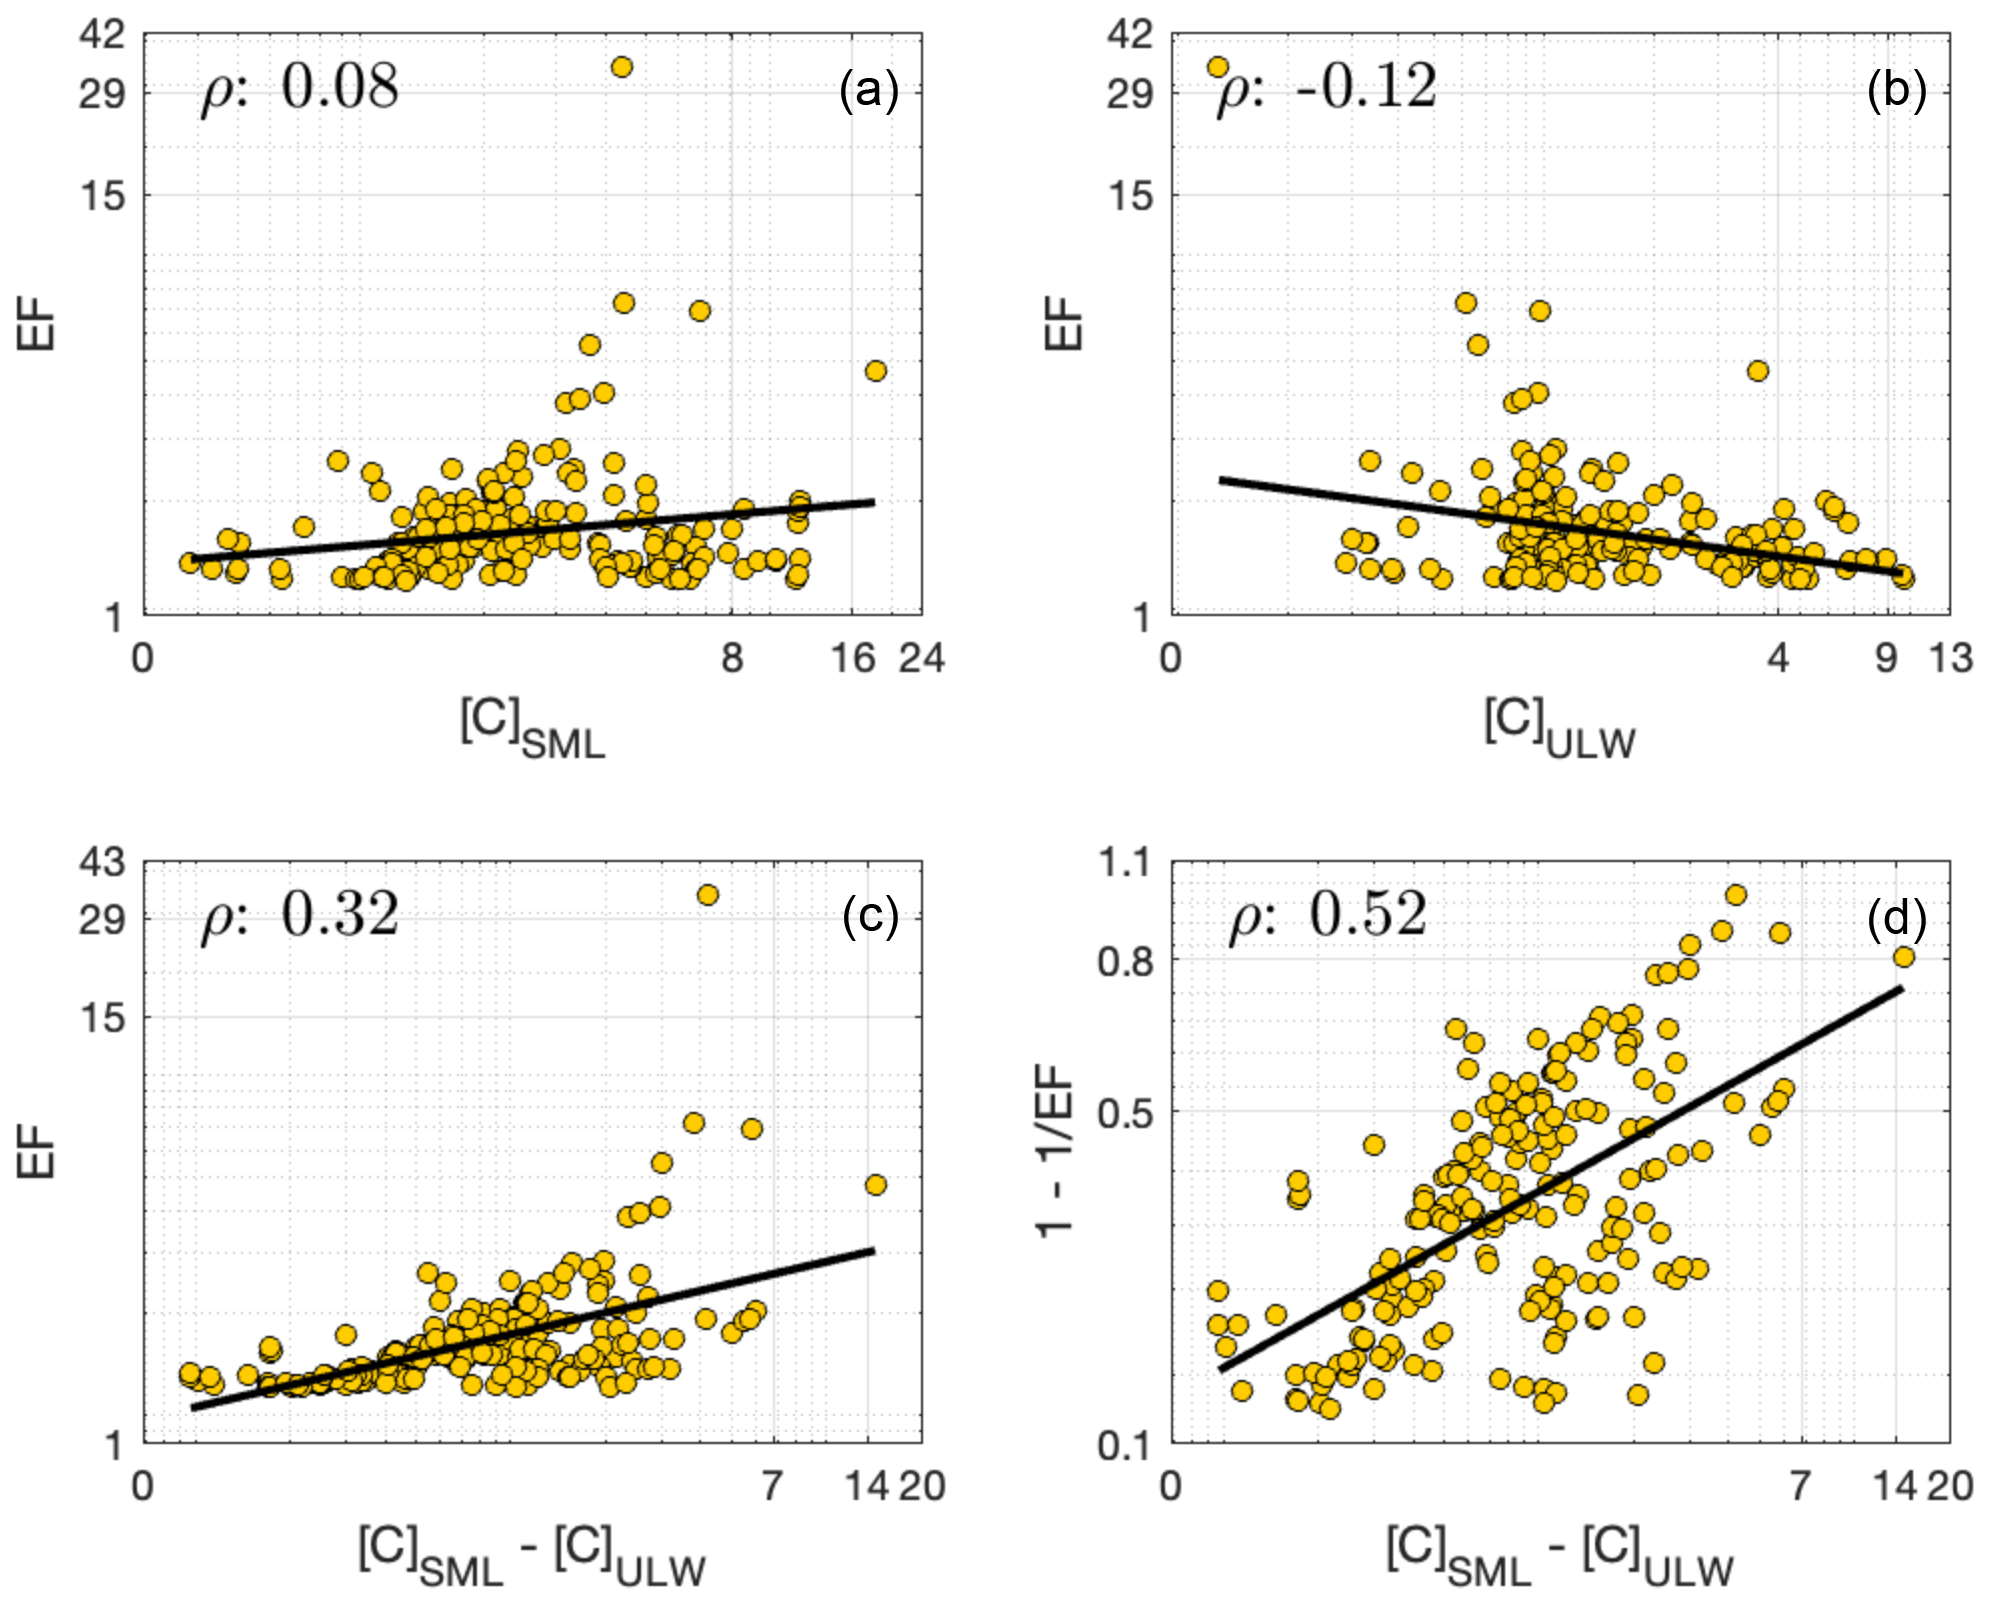
Figure 10Correlations between EF and (a) [C]SML, (b) [C]ULW, (c) [C]SML− [C]ULW and, (d) correlation between 1 − 1/EF and [C]SML− [C]ULW. These plots were generated for DOC data, in order to investigate the observed lack of correlation among EF − [C]SML− [C]ULW, as shown by Fig. 7c.
This study presents the first known meta-analysis of the SML, integrating a broad dataset of [C]SML and [C]ULW measurements to resolve methodological inconsistencies and establish a consensus-based understanding of SML enrichment dynamics. By meeting the statistical requirements for combining EF data and applying KDE as a robust analytical framework, we provide reliable distributional estimates and redefine typical EF ranges for 12 organic compounds, offering a comprehensive reference for assessing whether new observations fall within expected conditions or reflect unusual enrichment. Our results indicate that nitrogen-rich compounds and particulate OM exhibit stronger enrichment than carbon-rich and dissolved compounds. Nevertheless, the differing enrichment behavior of individual surfactants highlights that their surface-active properties, rather than elemental composition alone, govern overall SML enrichment. Amongst these, the fatty acids clearly show the greatest potential for high enrichment in the SML. This emphasizes the need to consider compound-specific chemistry as well as environmental and methodological variability when interpreting SML processes, assessing their role in global gas flux estimates and, developing models. Our assessment also inquired into the suitability of EF values as indicators of true SML enrichment and suggests that, while EFs capture relative partitioning between the SML and ULW, they fall short in resolving trophic variability. This study proposes complementary metrics (i.e., absolute concentration differences, SML concentration capacities and fractional enrichment) that isolate true SML enrichment and support improved SML modelling. Finally, we demonstrate that logarithmic transformations and robust central tendency metrics substantially improve statistical reliability and data comparability over traditional linear-scale approaches, providing essential methodological guidance for future SML research and its application to global air-sea exchange studies.
Although the most basic non-parametric method to derive a probability distribution is histograms, they present two key limitations for comparative studies: (1) unequal sample sizes across comparative groups restrict the use of uniform binning and, (2) imposing uniform bin sizes potentially mask important distributional characteristics. In contrast, KDE circumvents these issues by accounting a datapoint's exact value rather than assigning it to a particular bin of a certain width. This describes the true underlying distribution of the data and allows more consistent and detailed comparisons of distributions. In this analysis, we use Gaussian kernels – smooth, bell-shaped functions based on normal distribution – that weight observations based on their distance. Chen (2017) and the references therein provide a comprehensive review of the KDE and its recent advances.
In Gaussian kernels, bandwidth is analogous to standard deviation. In this study, the bandwidths for the linear KDEs were computed based on an approach that includes a bias-variance trade-off. Briefly, the bias-variance trade-off represents kernels that have a bandwidth that avoids too much variance in the estimates (i.e., bandwidths are not too small) while it does not introduce too much bias for ranges that actually exhibit no data points (i.e., bandwidths are not too large). Calculations of optimal bandwidth applied herein and an example of a bias-variance trade-off are described in Schartau et al. (2010). Nevertheless, in log-space, unlike in linear-space, data are more evenly distributed and hence fixed bandwidths avoid over-smoothing of low values and under-smoothing of high values.
The selection of an optimal bandwidth for KDEs is influenced by sample size; smaller sample sizes lead to sparse and noisy distributions which require more smoothing and therefore larger bandwidths. Excessively large bandwidths can result in underfitting. In contrast, larger sample sizes may allow excessively smaller bandwidths that can lead to overfitting. Bootstrap resampling addresses these potential uncertainties in our analysis and, ensures the robustness and precision of the estimated density distributions. Deviations between the bootstrapped KDEs and their ensemble mean were found to approximate a normal distribution (consistent with Central Limit Theorem). Therefore, these ensemble means can be regarded as reliable representations of the underlying data, supporting valid comparisons of probability distributions across different groups or clusters.
If a dataset contains values of “xi” with a sample size of “n”, mode (xm) is the most frequently occurring value in the dataset and therefore, the point where a PDF reaches its highest density. A distribution appears to be the most concentrated at xm. Median () returns the value at the 50th percentile of an ascending dataset. It divides the area under a PDF into two equal halves. The arithmetic mean (), is the average of a distribution, given by the following equation:
gives the point where weighted sum of a PDF is balanced. However, in the case of datasets that range over several orders of magnitude, the geometric mean (hereafter referred to as “”) is the more preferred central tendency estimate, as it accounts for the relative proportions of values (as opposed to their absolute magnitudes as is the case in ) and hence, is less sensitive to outliers. is calculated by the following equation:
of a linear distribution is mathematically equal to the exponentiated of the log-transformed version of the same distribution.
In addition, the following equation, which accounts for the squared differences across all the datapoints of the corresponding CDFs, estimates the discrete form of the integrated quadratic distance (IQD, explained in Sect. 2.2.2), with :
A higher IQD value implies that the divergence is greater and therefore the corresponding CDFs are more different.
Computational codes used in this study are available at OceanRep GEOMAR (https://oceanrep.geomar.de/id/eprint/63615/, last access: 19 February 2026). The repository includes the implementation of the KDE method, representative example scripts demonstrating its application for generating probability density functions and cumulative density functions, and a script to reproduce the correlation plots presented.
All data used in this study were extracted from previously published peer-reviewed sources and are publicly available through the PANGAEA data repository (https://doi.pangaea.de/10.1594/PANGAEA.990017, Silva and Schartau, 2026). Full citations for all the datasets are provided in the Supplement. No new data were generated for this study.
The supplement related to this article is available online at https://doi.org/10.5194/bg-23-1697-2026-supplement.
AS – Data Curation, Conceptualization, Methodology, Formal Analysis, Visualization, Writing – Original Draft, Writing – Review & Editing, SN – Data Curation, Writing – Review & Editing, TB – Data Provision, Writing – Review & Editing, AE – Funding Acquisition, Data Provision, Writing – Review & Editing, HH – Data Provision, Writing – Review & Editing, MP – Data Provision, Writing – Review & Editing, KW – Methodology, Writing – Review & Editing, OW – Funding Acquisition, Data Provision, Writing – Review & Editing, MS – Conceptualization, Methodology, Formal Analysis, Visualization, Funding Acquisition, Supervision, Writing – Review & Editing.
Authors AS, TB, AE and MS are affiliated with the same institution as Hermann Bange, who serves as an overseeing editor for the special issue “Biogeochemical processes and air-sea exchange in the sea-surface microlayer”. Authors AS, TB, AE, HH, MP, OW and MS are collaborators with Hermann Bange on an ongoing research project. These potential competing interests have been fully disclosed to the journal. The authors declare no other competing interests relevant to the submitted work.
Publisher's note: Copernicus Publications remains neutral with regard to jurisdictional claims made in the text, published maps, institutional affiliations, or any other geographical representation in this paper. The authors bear the ultimate responsibility for providing appropriate place names. Views expressed in the text are those of the authors and do not necessarily reflect the views of the publisher.
This article is part of the special issue “Biogeochemical processes and Air–sea exchange in the Sea-Surface microlayer (BG/OS inter-journal SI)”. It is not associated with a conference.
The authors gratefully acknowledge the support and collaboration of colleagues and institutions involved in this work. We also acknowledge the valuable contributions of the authors of previously published datasets that were used in this study. Their work provided essential input for our analysis. This study was conducted as part of the project “Biogeochemical processes and air-sea exchange in the sea-surface microlayer (BASS)”, and we thank all project partners for their support and scientific exchange.
This work is supported by the project “Biogeochemical processes and air-sea exchange in the sea-surface microlayer (BASS)”, which is funded by the German Research Foundation (DFG) under grant no. 451574234: SCHA 2123/1-1. Data compilation had been initiated through the large integrated project “Surface Ocean Processes in the Anthropocene (SOPRAN, 03F0662A)”, funded by the German Federal Ministry of Education and Research (BMBF). Research contributions from MS, AE, and KW were supported through the Research Program “Changing Earth – Sustaining our Future” of the Helmholtz Association.
The article processing charges for this open-access publication were covered by the GEOMAR Helmholtz Centre for Ocean Research Kiel.
This paper was edited by Peter S. Liss and reviewed by two anonymous referees.
Alldredge, A. L., Passow, U., and Logan, B. E.: The abundance and significance of a class of large, transparent organic particles in the ocean, Deep Sea Res. Part Oceanogr. Res. Pap., 40, 1131–1140, https://doi.org/10.1016/0967-0637(93)90129-Q, 1993.
Asher, W.: The sea-surface microlayer and its effect on global air–sea gas transfer, in: The Sea Surface and Global Change, edited by: Liss, P. S. and Duce, R. A., Cambridge University Press, 251–286, https://doi.org/10.1017/CBO9780511525025.009, 1997.
Asmussen-Schäfer, F., Ribas-Ribas, M., Wurl, O., and Friedrichs, G.: Linking surface coverage with surfactant activity to refine the role of surfactants for air-sea gas exchange, EGUsphere [preprint], https://doi.org/10.5194/egusphere-2025-5276, 2026.
Astrahan, P., Herut, B., Paytan, A., and Rahav, E.: The Impact of Dry Atmospheric Deposition on the Sea-Surface Microlayer in the SE Mediterranean Sea: An Experimental Approach, Front. Mar. Sci., 3, https://doi.org/10.3389/fmars.2016.00222, 2016.
Baastrup-Spohr, L. and Staehr, P. A.: Surface microlayers on temperate lowland lakes, Hydrobiologia, 625, 43–59, https://doi.org/10.1007/s10750-008-9695-3, 2009.
Baier, R., DW, G., Perlmutter, S., and King, R.: Dominant chemical composition of sea-surface films, natural slicks, and foams, Journal de Recherches Atmosphériques, 8, 571–600, 1974.
Barthelmeß, T. and Engel, A.: How biogenic polymers control surfactant dynamics in the surface microlayer: insights from a coastal Baltic Sea study, Biogeosciences, 19, 4965–4992, https://doi.org/10.5194/bg-19-4965-2022, 2022.
Barthelmeß, T., Schütte, F., and Engel, A.: Variability of the Sea Surface Microlayer Across a Filament's Edge and Potential Influences on Gas Exchange, Front. Mar. Sci., 8, 718384, https://doi.org/10.3389/fmars.2021.718384, 2021.
Brinis, A., Méjanelle, L., Momzikoff, A., Gondry, G., Fillaux, J., Point, V., and Saliot, A.: Phospholipid ester-linked fatty acids composition of size-fractionated particles at the top ocean surface, Org. Geochem., 35, 1275–1287, https://doi.org/10.1016/j.orggeochem.2004.04.009, 2004.
Carlson, D. J.: Dissolved organic materials in surface microlayers: Temporal and spatial variability and relation to sea state, Limnol. Oceanogr., 28, 415–431, https://doi.org/10.4319/lo.1983.28.3.0415, 1983.
Carlucci, A. F., Craven, D. B., and Henrichs, S. M.: Surface-film microheterotrophs: amino acid metabolism and solar radiation effects on their activities, Mar. Biol., 85, 13–22, https://doi.org/10.1007/BF00396410, 1985.
Cen-Lin, H. and Tzung-May, F.: Air-Sea Exchange of Volatile Organic Compounds: A New Model with Microlayer Effects, Atmos. Ocean. Sci. Lett., 6, 97–102, https://doi.org/10.1080/16742834.2013.11447063, 2013.
Chen, Y., Yang, G.-P., Xia, Q.-Y., and Wu, G.-W.: Enrichment and characterization of dissolved organic matter in the surface microlayer and subsurface water of the South Yellow Sea, Mar. Chem., 182, 1–13, https://doi.org/10.1016/j.marchem.2016.04.001, 2016.
Chen, Y.-C.: A tutorial on kernel density estimation and recent advances, Biostat. Epidemiol., 1, 161–187, https://doi.org/10.1080/24709360.2017.1396742, 2017.
Ćosović, B. and Vojvodić, V.: Adsorption behaviour of the hydrophobic fraction of organic matter in natural waters, Mar. Chem., 28, 183–198, https://doi.org/10.1016/0304-4203(89)90194-1, 1989.
Ćosović, B. and Vojvodić, V.: Voltammetric Analysis of Surface Active Substances in Natural Seawater, Electroanalysis, 10, 429–434, https://analyticalsciencejournals.onlinelibrary.wiley.com/doi/pdf/10.1002/%28SICI%291521-4109%28199805%2910%3A6%3C429%3A%3AAID-ELAN429%3E3.0.CO%3B2-7?casa_token=unCVE6HtYJoAAAAA:Z6IlTscpxDPKrkO4-_dq7xGQJIrExkFYTk_Ffr6pyOiA87a2h7-5CDjUsoiR_4YlTywcd1HLo6OyNmR4 (last access: 20 February 2026), 1998.
Crocetti, E.: Systematic Reviews With Meta-Analysis: Why, When, and How?, Emerg. Adulthood, 4, 3–18, https://doi.org/10.1177/2167696815617076, 2016.
Cunliffe, M. and Murrell, J. C.: The sea-surface microlayer is a gelatinous biofilm, ISME J., 3, 1001–1003, https://doi.org/10.1038/ismej.2009.69, 2009.
Cunliffe, M., Salter, M., Mann, P. J., Whiteley, A. S., Upstill-Goddard, R. C., and Murrell, J. C.: Dissolved organic carbon and bacterial populations in the gelatinous surface microlayer of a Norwegian fjord mesocosm, FEMS Microbiol. Lett., 299, 248–254, https://doi.org/10.1111/j.1574-6968.2009.01751.x, 2009.
Cunliffe, M., Engel, A., Frka, S., Gašparović, B., Guitart, C., Murrell, J. C., Salter, M., Stolle, C., Upstill-Goddard, R., and Wurl, O.: Sea surface microlayers: A unified physicochemical and biological perspective of the air–ocean interface, Prog. Oceanogr., 109, 104–116, https://doi.org/10.1016/j.pocean.2012.08.004, 2013.
Dietz, A. S., Albright, L. J., and Tuominen, T.: Heterotrophic activities of bacterioneuston and bacterioplankton, Can. J. Microbiol., 22, 1699–1709, https://doi.org/10.1139/m76-251, 1976.
Dukhin, S. S., Kovalchuk, V. I., Gochev, G. G., Lotfi, M., Krzan, M., Malysa, K., and Miller, R.: Dynamics of Rear Stagnant Cap formation at the surface of spherical bubbles rising in surfactant solutions at large Reynolds numbers under conditions of small Marangoni number and slow sorption kinetics, Adv. Colloid Interface Sci., 222, 260–274, https://doi.org/10.1016/j.cis.2014.10.002, 2015.
Engel, A. and Galgani, L.: The organic sea-surface microlayer in the upwelling region off the coast of Peru and potential implications for air–sea exchange processes, Biogeosciences, 13, 989–1007, https://doi.org/10.5194/bg-13-989-2016, 2016.
Engel, A., Thoms, S., Riebesell, U., Rochelle-Newall, E., and Zondervan, I.: Polysaccharide aggregation as a potential sink of marine dissolved organic carbon, Nature, 428, 929–932, https://doi.org/10.1038/nature02453, 2004.
Engel, A., Bange, H. W., Cunliffe, M., Burrows, S. M., Friedrichs, G., Galgani, L., Herrmann, H., Hertkorn, N., Johnson, M., Liss, P. S., Quinn, P. K., Schartau, M., Soloviev, A., Stolle, C., Upstill-Goddard, R. C., Van Pinxteren, M., and Zäncker, B.: The Ocean's Vital Skin: Toward an Integrated Understanding of the Sea Surface Microlayer, Front. Mar. Sci., 4, 165, https://doi.org/10.3389/fmars.2017.00165, 2017.
Feenstra, S.: Use of Logarithmic-Scale Correlation Plots to Represent Contaminant Ratios for Evaluation of Subsurface Environmental Data, Environ. Forensics, 7, 175–185, https://doi.org/10.1080/15275920600667153, 2006.
Frew, N. M.: The role of organic films in air–sea gas exchange, in: The Sea Surface and Global Change, edited by: Liss, P. S. and Duce, R. A., Cambridge University Press, Cambridge, 121–172, https://doi.org/10.1017/CBO9780511525025.006, 1997.
Frka, S., Pogorzelski, S., Kozarac, Z., and Ćosović, B.: Physicochemical Signatures of Natural Sea Films from Middle Adriatic Stations, J. Phys. Chem. A, 116, 6552–6559, https://doi.org/10.1021/jp212430a, 2012.
Gao, Q., Leck, C., Rauschenberg, C., and Matrai, P. A.: On the chemical dynamics of extracellular polysaccharides in the high Arctic surface microlayer, Ocean Sci., 8, 401–418, https://doi.org/10.5194/os-8-401-2012, 2012.
Garabetian, F., Romano, J.-C., Paul, R., and Sigoillot, J.-C.: Organic matter composition and pollutant enrichment of sea surface microlayer inside and outside slicks, Mar. Environ. Res., 35, 323–339, https://doi.org/10.1016/0141-1136(93)90100-E, 1993.
Gas̆parović, B. and Ćosović, B.: Distribution of surface-active substances in the northern Adriatic Sea, Mar. Chem., 75, 301–313, https://doi.org/10.1016/S0304-4203(01)00044-5, 2001.
Gašparović, B. and Ćosović, B.: Surface-active properties of organic matter in the North Adriatic Sea, Estuar. Coast. Shelf Sci., 58, 555–566, https://doi.org/10.1016/S0272-7714(03)00133-1, 2003.
Gašparović, B., Plavšić, M., Ćosović, B., and Saliot, A.: Organic matter characterization in the sea surface microlayers in the subarctic Norwegian fjords region, Mar. Chem., 105, 1–14, https://doi.org/10.1016/j.marchem.2006.12.010, 2007.
Goldman, J. C., Dennett, M. R., and Frew, N. M.: Surfactant effects on air-sea gas exchange under turbulent conditions, Deep Sea Res. Part Oceanogr. Res. Pap., 35, 1953–1970, https://doi.org/10.1016/0198-0149(88)90119-7, 1988.
Härdle, W., Werwatz, A., Müller, M., and Sperlich, S.: Nonparametric and Semiparametric Models, Springer Berlin Heidelberg, Berlin, Heidelberg, https://doi.org/10.1007/978-3-642-17146-8, 2004.
Harvey, H. R., Tuttle, J. H., and Bell, J. T.: Kinetics of phytoplankton decay during simulated sedimentation: Changes in biochemical composition and microbial activity under oxic and anoxic conditions, Geochim. Cosmochim. Acta, 59, 3367–3377, https://doi.org/10.1016/0016-7037(95)00217-N, 1995.
Hedges, J. I., Cowie, G. L., Richey, J. E., Quay, P. D., Benner, R., Strom, M., and Forsberg, B. R.: Origins and processing of organic matter in the Amazon River as indicated by carbohydrates and amino acids, Limnol. Oceanogr., 39, 743–761, https://doi.org/10.4319/lo.1994.39.4.0743, 1994.
Henrichs, S. M. and Williams, P. M.: Dissolved and particulate amino acids and carbohydrates in the sea surface microlayer, Mar. Chem., 17, 141–163, https://doi.org/10.1016/0304-4203(85)90070-2, 1985.
Hillbricht-Ilkowska, A. and Kostrzewska-Szlakowska, I.: Surface microlayer in lakes of different trophic status: nutrients concentration and accumulation, Pol. J. Ecol., 52, 461–478, 2004.
Hunter, K. A.: Processes affecting particulate trace metals in the sea surface microlayer, Mar. Chem., 9, 49–70, https://doi.org/10.1016/0304-4203(80)90006-7, 1980.
Hunter, K. A. and Liss, P. S.: The input of organic material to the oceans: air–sea interactions and the organic chemical composition of the sea surface, Mar. Chem., 5, 361–379, https://doi.org/10.1016/0304-4203(77)90029-9, 1977.
Hunter, K. A. and Liss, P. S.: Chapter 9 Organic Sea Surface Films, in: Elsevier Oceanography Series, vol. 31, edited by: Duursma, E. K. and Dawson, R., Elsevier, 259–298, https://doi.org/10.1016/S0422-9894(08)70331-3, 1981.
Isles, P. D. F.: The misuse of ratios in ecological stoichiometry, Ecology, 101, e03153, https://doi.org/10.1002/ecy.3153, 2020.
Jørgensen, N., Kroer, N., Coffin, R., Yang, X.-H., and Lee, C.: Dissolved free amino acids, combined amino acids, and DNA as sources of carbon and nitrogen to marine bacteria, Mar. Ecol. Prog. Ser., 98, 135–148, https://doi.org/10.3354/meps098135, 1993.
Joux, F., Agogué, H., Obernosterer, I., Dupuy, C., Reinthaler, T., Herndl, G., and Lebaron, P.: Microbial community structure in the sea surface microlayer at two contrasting coastal sites in the northwestern Mediterranean Sea, Aquat. Microb. Ecol., 42, 91–104, https://doi.org/10.3354/ame042091, 2006.
Keene, O. N.: The log transformation is special, Stat. Med., 14, 811–819, https://doi.org/10.1002/sim.4780140810, 1995.
Kjelleberg, S., Norkrans, B., Löfgren, H., and Larsson, K.: Surface balance study of the interaction between microorganisms and lipid monolayer at the air/water interface, Appl. Environ. Microbiol., 31, 609–611, https://doi.org/10.1128/aem.31.4.609-611.1976, 1976.
Knipping, E. M., Lakin, M. J., Foster, K. L., Jungwirth, P., Tobias, D. J., Gerber, R. B., Dabdub, D., and Finlayson-Pitts, B. J.: Experiments and Simulations of Ion-Enhanced Interfacial Chemistry on Aqueous NaCl Aerosols, Science, 288, 301–306, https://doi.org/10.1126/science.288.5464.301, 2000.
Knulst, J. C., Backlund, P., Hessen, D. O., Riise, G., and Södergren, A.: Response of surface microlayers to artificial acid precipitation in a meso-humic lake in Norway, Water Res., 31, 2177–2186, https://doi.org/10.1016/S0043-1354(97)00061-4, 1997.
Kock, A., Schafstall, J., Dengler, M., Brandt, P., and Bange, H. W.: Sea-to-air and diapycnal nitrous oxide fluxes in the eastern tropical North Atlantic Ocean, Biogeosciences, 9, 957–964, https://doi.org/10.5194/bg-9-957-2012, 2012.
Kujawinski, E. B., Farrington, J. W., and Moffett, J. W.: Evidence for grazing-mediated production of dissolved surface-active material by marine protists, Mar. Chem., 77, 133–142, https://doi.org/10.1016/S0304-4203(01)00082-2, 2002.
Kurata, N., Vella, K., Hamilton, B., Shivji, M., Soloviev, A., Matt, S., Tartar, A., and Perrie, W.: Surfactant-associated bacteria in the near-surface layer of the ocean, Sci. Rep., 6, 19123, https://doi.org/10.1038/srep19123, 2016.
Kuznetsova, M. and Lee, C.: Dissolved free and combined amino acids in nearshore seawater, sea surface microlayers and foams: Influence of extracellular hydrolysis, Aquat. Sci., 64, 252–268, https://doi.org/10.1007/s00027-002-8070-0, 2002.
Kuznetsova, M., Lee, C., Aller, J., and Frew, N.: Enrichment of amino acids in the sea surface microlayer at coastal and open ocean sites in the North Atlantic Ocean, Limnol. Oceanogr., 49, 1605–1619, https://doi.org/10.4319/lo.2004.49.5.1605, 2004.
Kuznetsova, M., Lee, C., and Aller, J.: Characterization of the proteinaceous matter in marine aerosols, Mar. Chem., 96, 359–377, https://doi.org/10.1016/j.marchem.2005.03.007, 2005.
Laß, K. and Friedrichs, G.: Revealing structural properties of the marine nanolayer from vibrational sum frequency generation spectra, J. Geophys. Res., 116, C08042, https://doi.org/10.1029/2010JC006609, 2011.
Laß, K., Bange, H. W., and Friedrichs, G.: Seasonal signatures in SFG vibrational spectra of the sea surface nanolayer at Boknis Eck Time Series Station (SW Baltic Sea), Biogeosciences, 10, 5325–5334, https://doi.org/10.5194/bg-10-5325-2013, 2013.
Li, L., Wu, P., Zhang, P., Huang, S., and Zhang, Y.: An improved model for air–sea exchange of elemental mercury in MITgcm-ECCOv4-Hg: the role of surfactants and waves, Geosci. Model Dev., 17, 8683–8695, https://doi.org/10.5194/gmd-17-8683-2024, 2024.
Liss, P. S. and Duce, R. A.: The sea surface and global change, Cambridge University Press, 535 pp., https://doi.org/10.1017/CBO9780511525025, 1997.
Liu, K. and Dickhut, R. M.: Effects of wind speed and particulate matter source on surface microlayer characteristics and enrichment of organic matter in southern Chesapeake Bay, J. Geophys. Res.-Atmos., 103, 10571–10577, https://doi.org/10.1029/97JD03736, 1998.
López-Puertas, A., Wurl, O., Frka, S., and Ribas-Ribas, M.: Diel variability affects the inorganic carbon system in the sea-surface microlayer and influences air-sea CO2 flux estimates, Ocean Sci., 21, 3471–3485, https://doi.org/10.5194/os-21-3471-2025, 2025.
MacIntyre, F.: Chemical fractionation and sea-surface microlayer processes, The Sea, 5, 245–299, 1974.
Maki, J. S. and Hermansson, M.: The dynamics of surface microlayers in aquatic environment in: The Biology of Particles in Aquatic Systems, 2nd edn., CRC Press, 161–182, https://doi.org/10.1201/9781003070146, 2020.
Mari, X. and Burd, A.: Seasonal size spectra of transparent exopolymeric particles (TEP) in a coastal sea and comparison with those predicted using coagulation theory, Mar. Ecol. Prog. Ser., 163, 63–76, https://doi.org/10.3354/meps163063, 1998.
Mari, X., Passow, U., Migon, C., Burd, A. B., and Legendre, L.: Transparent exopolymer particles: Effects on carbon cycling in the ocean, Prog. Oceanogr., 151, 13–37, https://doi.org/10.1016/j.pocean.2016.11.002, 2017.
Marty, J. C. and Saliot, A.: Hydrocarbons (normal alkanes) in the surface microlayer of seawater, Deep Sea Res. Oceanogr. Abstr., 23, 863–873, https://doi.org/10.1016/0011-7471(76)90853-6, 1976.
McKenna, S. P. and McGillis, W. R.: The role of free-surface turbulence and surfactants in air–water gas transfer, Int. J. Heat Mass Transf., 47, 539–553, https://doi.org/10.1016/j.ijheatmasstransfer.2003.06.001, 2004.
Menge, D. N. L., MacPherson, A. C., Bytnerowicz, T. A., Quebbeman, A. W., Schwartz, N. B., Taylor, B. N., and Wolf, A. A.: Logarithmic scales in ecological data presentation may cause misinterpretation, Nat. Ecol. Evol., 2, 1393–1402, https://doi.org/10.1038/s41559-018-0610-7, 2018.
Mengist, W., Soromessa, T., and Legese, G.: Method for conducting systematic literature review and meta-analysis for environmental science research, MethodsX, 7, 100777, https://doi.org/10.1016/j.mex.2019.100777, 2020.
Milinković, A., Penezić, A., Kušan, A. C., Gluščić, V., Žužul, S., Skejić, S., Šantić, D., Godec, R., Pehnec, G., Omanović, D., Engel, A., and Frka, S.: Variabilities of biochemical properties of the sea surface microlayer: Insights to the atmospheric deposition impacts, Sci. Total Environ., 838, 156440, https://doi.org/10.1016/j.scitotenv.2022.156440, 2022.
Mopper, K., Zhou, J., Sri Ramana, K., Passow, U., Dam, H. G., and Drapeau, D. T.: The role of surface-active carbohydrates in the flocculation of a diatom bloom in a mesocosm, Deep Sea Res. Part II Top. Stud. Oceanogr., 42, 47–73, https://doi.org/10.1016/0967-0645(95)00004-A, 1995.
Münster, U., Heikkinen, E., and Knulst, J.: Nutrient composition, microbial biomass and activity at the air-water interface of small boreal forest lakes, in: Eutrophication in Planktonic Ecosystems: Food Web Dynamics and Elemental Cycling, edited by: Tamminen, T. and Kuosa, H., Springer Netherlands, Dordrecht, 261–270, https://doi.org/10.1007/978-94-017-1493-8_21, 1998.
Mustaffa, N. I. H., Badewien, T. H., Ribas-Ribas, M., and Wurl, O.: High-resolution observations on enrichment processes in the sea-surface microlayer, Sci. Rep., 8, 13122, https://doi.org/10.1038/s41598-018-31465-8, 2018.
Mustaffa, N. I. H., Ribas-Ribas, M., Banko-Kubis, H. M., and Wurl, O.: Global reduction of in situ CO2 transfer velocity by natural surfactants in the sea-surface microlayer, Proc. R. Soc. Math. Phys. Eng. Sci., 476, 20190763, https://doi.org/10.1098/rspa.2019.0763, 2020.
Myklestad, S. M.: Release of extracellular products by phytoplankton with special emphasis on polysaccharides, Sci. Total Environ., 165, 155–164, https://doi.org/10.1016/0048-9697(95)04549-G, 1995.
Obernosterer, I., Catala, P., Reinthaler, T., Herndl, G., and Lebaron, P.: Enhanced heterotrophic activity in the surface microlayer of the Mediterranean Sea, Aquat. Microb. Ecol., 39, 293–302, https://doi.org/10.3354/ame039293, 2005.
Obernosterer, I., Catala, P., Lami, R., Caparros, J., Ras, J., Bricaud, A., Dupuy, C., van Wambeke, F., and Lebaron, P.: Biochemical characteristics and bacterial community structure of the sea surface microlayer in the South Pacific Ocean, Biogeosciences, 5, 693–705, https://doi.org/10.5194/bg-5-693-2008, 2008.
Parzen, E.: On Estimation of a Probability Density Function and Mode, Ann. Math. Stat., 33, 1065–1076, 1962.
Passow, U.: Formation of transparent exopolymer particles, TEP, from dissolved precursor material, Mar. Ecol. Prog. Ser., 192, 1–11, https://doi.org/10.3354/meps192001, 2000.
Penezić, A., Drozdowska, V., Novak, T., and Gašparović, B.: Distribution and characterization of organic matter within the sea surface microlayer in the Gulf of Gdańsk, Oceanologia, 64, 631–650, https://doi.org/10.1016/j.oceano.2022.05.003, 2022.
Penna, A.: Influence of nutrient ratios on the in vitro extracellular polysaccharide production by marine diatoms from the Adriatic Sea, J. Plankton Res., 21, 1681–1690, https://doi.org/10.1093/plankt/21.9.1681, 1999.
Pereira, R., Schneider-Zapp, K., and Upstill-Goddard, R. C.: Surfactant control of gas transfer velocity along an offshore coastal transect: results from a laboratory gas exchange tank, Biogeosciences, 13, 3981–3989, https://doi.org/10.5194/bg-13-3981-2016, 2016.
Pereira, R., Ashton, I., Sabbaghzadeh, B., Shutler, J. D., and Upstill-Goddard, R. C.: Reduced air–sea CO2 exchange in the Atlantic Ocean due to biological surfactants, Nat. Geosci., 11, 492–496, https://doi.org/10.1038/s41561-018-0136-2, 2018.
Petersen, M. K., Iyengar, S. S., Day, T. J. F., and Voth, G. A.: The Hydrated Proton at the Water Liquid/Vapor Interface, J. Phys. Chem. B, 108, 14804–14806, https://doi.org/10.1021/jp046716o, 2004.
Pogorzelski, S. J., Kogut, A. D., and Mazurek, A. Z.: Surface Rheology Parameters of Source-Specific Surfactant Films as Indicators of Organic Matter Dynamics, Hydrobiologia, 554, 67–81, https://doi.org/10.1007/s10750-005-1007-6, 2006.
Reinthaler, T., Sintes, E., and Herndl, G. J.: Dissolved organic matter and bacterial production and respiration in the sea-surface microlayer of the open Atlantic and the western Mediterranean Sea, Limnol. Oceanogr., 53, 122–136, https://doi.org/10.4319/lo.2008.53.1.0122, 2008.
Robinson, T., Wurl, O., Bahlmann, E., Jürgens, K., and Stolle, C.: Rising bubbles enhance the gelatinous nature of the air–sea interface, Limnol. Oceanogr., 64, 2358–2372, https://doi.org/10.1002/lno.11188, 2019.
Sabbaghzadeh, B., Upstill-Goddard, R. C., Beale, R., Pereira, R., and Nightingale, P. D.: The Atlantic Ocean surface microlayer from 50° N to 50° S is ubiquitously enriched in surfactants at wind speeds up to 13 m s−1, Geophys. Res. Lett., 44, 2852–2858, https://doi.org/10.1002/2017GL072988, 2017.
Salter, M. E., Upstill-Goddard, R. C., Nightingale, P. D., Archer, S. D., Blomquist, B., Ho, D. T., Huebert, B., Schlosser, P., and Yang, M.: Impact of an artificial surfactant release on air-sea gas fluxes during Deep Ocean Gas Exchange Experiment II, J. Geophys. Res.-Oceans, 116, 2011JC007023, https://doi.org/10.1029/2011JC007023, 2011.
Schartau, M., Engel, A., Schröter, J., Thoms, S., Völker, C., and Wolf-Gladrow, D.: Modelling carbon overconsumption and the formation of extracellular particulate organic carbon, Biogeosciences, 4, 433–454, https://doi.org/10.5194/bg-4-433-2007, 2007.
Schartau, M., Landry, M. R., and Armstrong, R. A.: Density estimation of plankton size spectra: a reanalysis of IronEx II data, J. Plankton Res., 32, 1167–1184, https://doi.org/10.1093/plankt/fbq072, 2010.
Sieburth, J. M.: Microbiological and Organic-Chemical Processes in the Surface and Mixed Layers, in: Air-Sea Exchange of Gases and Particles, edited by: Liss, P. S. and Slinn, W. G. N., Springer Netherlands, Dordrecht, 121–172, https://doi.org/10.1007/978-94-009-7169-1_3, 1983.
Sieburth, J. McN., Willis, P.-J., Johnson, K. M., Burney, C. M., Lavoie, D. M., Hinga, K. R., Caron, D. A., French, F. W., Johnson, P. W., and Davis, P. G.: Dissolved Organic Matter and Heterotrophic Microneuston in the Surface Microlayers of the North Atlantic, Science, 194, 1415–1418, https://doi.org/10.1126/science.194.4272.1415, 1976.
Silva, D. A. N. and Schartau, M.: Global data collection of Surface Microlayer Organic Matter (SML-OM), PANGAEA [data set], https://doi.pangaea.de/10.1594/PANGAEA.990017 (last access: 20 February 2026), 2026.
Silverman, B. W.: Density Estimation for Statistics and Data Analysis, 1st edn., Routledge, https://doi.org/10.1201/9781315140919, 2018.
Södergren, A.: Origin and composition of surface slicks in lakes of differing trophic status1, Limnol. Oceanogr., 32, 1307–1316, https://doi.org/10.4319/lo.1987.32.6.1307, 1987.
Springer, T. G. and Pigford, R. L.: Influence of Surface Turbulence and Surfactants on Gas Transport through Liquid Interfaces, Ind. Eng. Chem. Fundam., 9, 458–465, https://doi.org/10.1021/i160035a025, 1970.
Sun, C.-C., Sperling, M., and Engel, A.: Effect of wind speed on the size distribution of gel particles in the sea surface microlayer: insights from a wind–wave channel experiment, Biogeosciences, 15, 3577–3589, https://doi.org/10.5194/bg-15-3577-2018, 2018.
Thornton, D. C. O., Brooks, S. D., and Chen, J.: Protein and Carbohydrate Exopolymer Particles in the Sea Surface Microlayer (SML), Front. Mar. Sci., 3, https://doi.org/10.3389/fmars.2016.00135, 2016.
Tsai, W. and Liu, K.: An assessment of the effect of sea surface surfactant on global atmosphere-ocean CO2 flux, J. Geophys. Res.-Oceans, 108, 2000JC000740, https://doi.org/10.1029/2000JC000740, 2003.
Tukey, J. W.: Exploratory data analysis, Springer, 1977.
Upstill-Goddard, R. C.: Air–sea gas exchange in the coastal zone, Estuar. Coast. Shelf Sci., 70, 388–404, https://doi.org/10.1016/j.ecss.2006.05.043, 2006.
Verdugo, P., Alldredge, A. L., Azam, F., Kirchman, D. L., Passow, U., and Santschi, P. H.: The oceanic gel phase: a bridge in the DOM–POM continuum, Mar. Chem., 92, 67–85, https://doi.org/10.1016/j.marchem.2004.06.017, 2004.
Vitousek, P. M.: Nutrient cycling and limitation: Hawai'i as a model system, Princeton University Press, Princeton, New Jersey; Oxford, p. 1, ISBN 9780691115801, 2004.
Wegman, E. J.: Nonparametric probability density estimation, J. Stat. Comput. Simul., 1, 225–245, https://doi.org/10.1080/00949657208810017, 1972.
Williams, P. M., Carlucci, A. F., Henrichs, S. M., Van Vleet, E. S., Horrigan, S. G., Reid, F. M. H., and Robertson, K. J.: Chemical and microbiological studies of sea-surface films in the Southern Gulf of California and off the West Coast of Baja California, Mar. Chem., 19, 17–98, https://doi.org/10.1016/0304-4203(86)90033-2, 1986.
Wurl, O. and Holmes, M.: The gelatinous nature of the sea-surface microlayer, Mar. Chem., 110, 89–97, https://doi.org/10.1016/j.marchem.2008.02.009, 2008.
Wurl, O., Miller, L., Röttgers, R., and Vagle, S.: The distribution and fate of surface-active substances in the sea-surface microlayer and water column, Mar. Chem., 115, 1–9, https://doi.org/10.1016/j.marchem.2009.04.007, 2009.
Wurl, O., Wurl, E., Miller, L., Johnson, K., and Vagle, S.: Formation and global distribution of sea-surface microlayers, Biogeosciences, 8, 121–135, https://doi.org/10.5194/bg-8-121-2011, 2011.
Wurl, O., Stolle, C., Van Thuoc, C., The Thu, P., and Mari, X.: Biofilm-like properties of the sea surface and predicted effects on air–sea CO2 exchange, Prog. Oceanogr., 144, 15–24, https://doi.org/10.1016/j.pocean.2016.03.002, 2016.
Yang, G.-P.: Dimethylsulfide enrichment in the surface microlayer of the South China Sea, Mar. Chem., 66, 215–224, https://doi.org/10.1016/S0304-4203(99)00042-0, 1999.
Zhou, J., Mopper, K., and Passow, U.: The role of surface-active carbohydrates in the formation of transparent exopolymer particles by bubble adsorption of seawater, Limnol. Oceanogr., 43, 1860–1871, https://doi.org/10.4319/lo.1998.43.8.1860, 1998.
Ẑutić, V., Ćosović, B., Marčenko, E., Bihari, N., and Kršinić, F.: Surfactant production by marine phytoplankton, Mar. Chem., 10, 505–520, https://doi.org/10.1016/0304-4203(81)90004-9, 1981.
Zuur, A. F., Ieno, E. N., and Smith, G. M. (Eds.): Linear regression, in: Analysing Ecological Data, Springer New York, New York, NY, 49–77, https://doi.org/10.1007/978-0-387-45972-1_5, 2007.
- Abstract
- Introduction
- Methodology
- Results
- Discussion
- Conclusion
- Appendix A: KDE method – additional information
- Appendix B: Mathematical expressions of distributional characteristics
- Code availability
- Data availability
- Author contributions
- Competing interests
- Disclaimer
- Special issue statement
- Acknowledgements
- Financial support
- Review statement
- References
- Supplement