the Creative Commons Attribution 4.0 License.
the Creative Commons Attribution 4.0 License.
 | 17 Mar 2026
The distribution and isotopomeric characterization of nitrous oxide in the Eastern Gotland Basin (central Baltic Sea)
Pratirupa Bardhan
Claudia Frey
Gregor Rehder
Hermann W. Bange
Nitrous oxide (N2O) is a greenhouse gas with a global warming potential ∼ 300 times that of carbon dioxide. Coastal areas are important sources of N2O to the atmosphere but the biogeochemical pathways of N2O production and consumption are not well understood. We measured the concentrations and nitrogen (N) and oxygen (O) stable isotopes (δ15N and δ18O) of N2O in the Baltic Sea to constrain the sources and sinks of N2O in this system. Further, we used the intramolecular 15N variation or the site preference (SP) as additional tracer. Samples were taken at 7 stations during a cruise with R/V Elisabeth Mann Borgese to the Eastern Gotland Basin (central Baltic Sea) in May/June 2019. The isotope signatures of N2O accumulation in the oxycline reflected production predominantly via ammonia oxidation. In the waters where hydrogen sulfide (H2S) was detected, active N2O consumption was implied by pronounced decrease in N2O levels in tandem with enrichments in δ15Nbulk, δ18O and SP. High site preference values of N2O observed in suboxic waters of the stations where H2S buildup was minimal to non-detectable point to the possibility of non-canonical denitrification pathways mediated by fungi or abiotically. A sedimentary source of N2O was observed in those stations, which resulted in a decoupling of the δ15Nbulk and δ18O of N2O. Our results reveal that transient oxygenation events have the potential to modify the N cycling within the oxic-anoxic interface even if for shorter time scales.
- Article
(3370 KB) - Full-text XML
-
Supplement
(599 KB) - BibTeX
- EndNote


Nitrous oxide (N2O) is an important climate-relevant atmospheric trace gas: in the troposphere it acts as a greenhouse gas (IPCC, 2021) and in the stratosphere it is one of the major precursors for ozone depletion (Ravishankara et al., 2009). Nitrous oxide has a global warming potential (GWP) which is ∼ 300 times larger than that of carbon dioxide (CO2) over a 100-year time scale (IPCC, 2021). Atmospheric N2O mole fractions have risen in the past 100 years due to increased anthropogenic influence (Ravishankara et al., 2009; Flückiger et al., 1999).
The ocean is a major (∼ 20 %) natural source of N2O, albeit poorly characterized (Tian et al., 2024; Yang et al., 2020). Within the marine environment, coastal seas, including estuaries, are considered important as sources of atmospheric N2O and play a major role in its global budget (Resplandy et al., 2024; Rosentreter et al., 2023). Thus, it is crucial to improve our knowledge and understanding of these systems. However, existing literature on the magnitude, distribution, seasonality and environmental controls of N2O production from these systems is still limited.
In the open and coastal oceans, N2O is produced via various pathways: In oxygenated waters, N2O is formed as a byproduct during nitrification (i.e. the stepwise microbial ammonia oxidation to nitrate) (Nevison et al., 2003; Yoshinari, 1976). The positive correlation between oversaturation of dissolved N2O (expressed as ΔN2O and representing the excess N2O relative to the concentration in equilibrium with the ambient atmosphere) and apparent oxygen utilization (AOU) is often used as indirect evidence of N2O production via nitrification in oxic waters (Yoshinari, 1976; Nevison et al., 2003). The largest oceanic N2O concentrations and atmospheric fluxes were found in coastal upwelling regions associated with the oxygen deficit zones (ODZs) of the Indian, Eastern Tropical North Pacific and Eastern Tropical South Pacific Oceans (Naqvi et al., 2000; Arévalo-Martínez et al., 2015; Suntharalingam and Sarmiento, 2000; Nevison et al., 1995). In these systems, denitrification, the stepwise microbial reduction of nitrate to dinitrogen gas (N2), produces N2O as an intermediate (Cohen and Gordon, 1979; Ward et al., 2009). During suboxic conditions, N2O is reduced to N2 in the last step of denitrification thus acting as a sink for N2O (Körner and Zumft, 1989). Under oxygen-deficient (i.e. suboxic or sulfidic) conditions, the linear relationship of ΔN2O: AOU, therefore, breaks down due to enhanced N2O yield by both nitrifiers (Lipschultz et al., 1981) and denitrifiers (Knowles et al., 1981) as well as consumption of N2O by denitrifiers. Thus, it is a challenging task to distinguish the pathways of N2O production in low-O2 waters where nitrifying and denitrifying microbes can co-exist (Ji et al., 2015).
The stable nitrogen and oxygen isotopes signatures of N2O (expressed as δ15N and δ18O respectively) serve as effective natural tracers for identifying the sources and sinks of N2O, because its isotopic composition provides valuable insights in at least three ways: (i) The bulk isotopic composition: The isotopic makeup of the initial substrate influences the bulk isotopic composition of N2O. For example, during ammonia oxidation by nitrifiers, the δ15N and δ18O of N2O are determined by the δ15N of the source ammonium (NH) and the δ18O of dissolved O2, respectively. In the case of nitrifier-denitrification (microbial ammonia oxidation to nitrite followed by stepwise reduction to N2) and denitrification, the δ15N and δ18O of N2O are influenced by the isotopic signature of the source nitrate (NO) or nitrite (NO) (Bourbonnais et al., 2017). (ii) The kinetic isotope effect (e): The process of isotopic fractionation i.e. where lighter isotopes (14N and 16O) are preferentially taken up during product formation, resulting in the substrate becoming enriched in the heavier isotopes (15N and 18O) which also affects the stable isotopic composition of N2O. Laboratory and field data report a wide range of values for N and O isotope effects during the production and consumption of N2O (Lewicka-Szczebak et al., 2015). (iii) The site-specific nitrogen isotopic signature: N2O has a linear and asymmetrical structure (Nβ= Nα-O) and the difference in δ15N values of the central (Nα) and outer (Nβ) positions is referred to as site preference (SP). Unlike the bulk δ15N and δ18O of N2O, SP is independent of the source substrate and is determined solely by the process involved (Frame and Casciotti, 2010). As a result, N2O produced through nitrifier-denitrification and denitrification exhibits low SP signatures (−11 ‰ to 0 ‰) while N2O generated from ammonia oxidation has high SP signatures (30 ‰ to 36 ‰). Strong reduction of N2O will also result in an enrichment of SP.
Studies on N2O isotope data are scarce, especially from fresh and brackish water systems. Ho et al. (2023) used a combination of N2O and NO isotopic data from the urbanized Scheldt estuary in Europe and observed denitrification to be the dominant pathway of N2O production. Ammonia oxidation, on the other hand, was the most important source of N2O in the eutrophic Pearl River Estuary in China (Zheng et al., 2024). The isotope ratios of N2O identified submarine groundwater discharge to deliver N2O-laden water to the shallow salt-wedge Werribee River estuary in Australia (Wong et al., 2020). Thus N2O isotopic data can shed light on pathways of production, consumption as well as sources of this trace gas.
The Baltic Sea waters can serve as a natural laboratory to study the biogeochemistry of N2O using a stable isotope approach. The first study on N2O concentrations from the Baltic Sea was conducted in the Western Gotland Basin (Rönner, 1983), and 1500 nM N2O was observed when the bottom water at one station turned anoxic (Rönner, 1983). This is one of the highest reported concentrations until today). Another study (Walter et al., 2006), extensively covering the southern and central Baltic Sea, reported buildup of N2O when the system became oxygenated after a prolonged sulfidic period. The authors attributed the onset of nitrification to cause this N2O buildup in the water column. More recently, this was confirmed after the last major inflow into the Baltic Sea in 2015 (Myllykangas et al., 2017). Short-term buildup of very high (> 500 nM) N2O concentrations was observed immediately before the bottom waters lost dissolved O2 again. Enhanced N2O production (Walter et al., 2006) has been observed during the transition from suboxic to oxic conditions due to the inflowing North Sea waters, which, when coupled with a simultaneous buildup of hydroxylamine (Schweiger et al., 2007), led to the conclusion that nitrification, specifically ammonia oxidation, is the predominant N2O source. Long term monitoring (Ma et al., 2019) at the Boknis Eck Time-Series Station (Eckernförde Bay, SW Baltic Sea) has also revealed the seasonality of N2O concentrations with high concentrations in winter and early spring and lower concentrations during the suboxic/sulfidic periods in autumn. Thus, the variability of N2O in the Baltic Sea is spatially and temporally complex. A first, albeit concise, data set of isotopic and isotopomeric ratios of N2O and N2O production by ammonia oxidation at Boknis Eck was presented in a method article by Ji and Grundle (2019).
The specific questions that we address here are: (1) What are the dominant pathways of N2O production and consumption in the oxic-anoxic transition zone of the Baltic Sea water column? (2) How to interpret N2O pathways using stable isotopic data, including site preference, as analytical tools?
2.1 Study site and sample collection
The Baltic Sea consists of several interconnected basins that vary widely in the extent of oxygen deficiency (Meier et al., 2017). The Gotland Basin is the largest basin with a maximum depth of 240 m. Due to limited water exchange and strong thermohaline water column stratification, the central and southern parts of the Baltic Sea are typically suboxic (Liblik et al., 2018) and even sulfidic (with high levels of hydrogen sulfide, H2S). Occasionally, the North Sea waters flow in over the sills and flush the deeper basins. These inflow events are known as MBIs (major Baltic inflow), and they bring oxygen-rich and saline waters to the deeper basins of the southern and central Baltic Sea. In the recent past, the MBIs have been occurring roughly once in a decade (Gräwe et al., 2015) although this statement has been questioned by Mohrholz (2018) who found a decadal variability of MBIs with a timescale of 25–30 years. The most recent MBI before our sampling campaign, which was also the third largest one in 60 years, occurred in December 2014 (Liblik et al., 2018; Dellwig et al., 2021). Walter et al. (2006) studied the N2O dynamics during the MBI event of 2003. These studies have visual representations depicting the flow of the North Sea waters into the deeper basins of the Baltic Sea. Our study was during a stagnant period. In addition, weaker inflows of saline waters can lead to intrusions in intermediate water depths of the major basins. Freshwater input occurs as well through large river runoff and the combined input of saline North Sea waters and the riverine freshwater renders the Baltic Sea to be a brackish water system, one of the largest of its kind (Weckström et al., 2017). The Baltic Sea is also vulnerable to eutrophication, and the oxygen deficiency in the deeper basins has intensified not only in volume and frequency but also in magnitude by spreading to the coastal areas (Voss et al., 2011; Meier et al., 2019). In 2019, the year of our sampling campaign, the area of the suboxic zone in the Baltic Sea of > 80 000 km2 was one of the three largest on record (Hansson et al., 2020).
Samples were collected onboard R/V Elisabeth Mann Borgese from 20 May to 5 June 2019 (Cruise EMB214) as part of the Baltic Sea project EU BONUS INTEGRAL. For this study, six stations were sampled along a transect in the Eastern Gotland Basin (Fig. 1). Station 25 is the deepest at 233 m, followed by Station 30 at 98 m depths. The remaining four stations (26, 27, 28 and 29) have depths ranging from 80 to 90 m. The basin is permanently stratified with the halocline extending from 50 to 100 m. The transect and sampling was specifically selected to cover the oxic-anoxic transition zone at high resolution, and to comprise stations where this transition zone interacts with the sediment, an area which is characterized by enhanced microbial turnover processes (Noffke et al., 2016). The seventh station is Station 32, outside the Gotland Basin, where the halocline (40 to 70 m) was quite steep and bottom waters were more saline (15–17) than the bottom waters of the other stations (11–13). This station was in the Bornholm Basin south of the Eastern Gotland Basin and chosen as reference station without H2S accumulation to understand the spatial changes in N2O isotopomer biogeochemistry within the Baltic Sea.
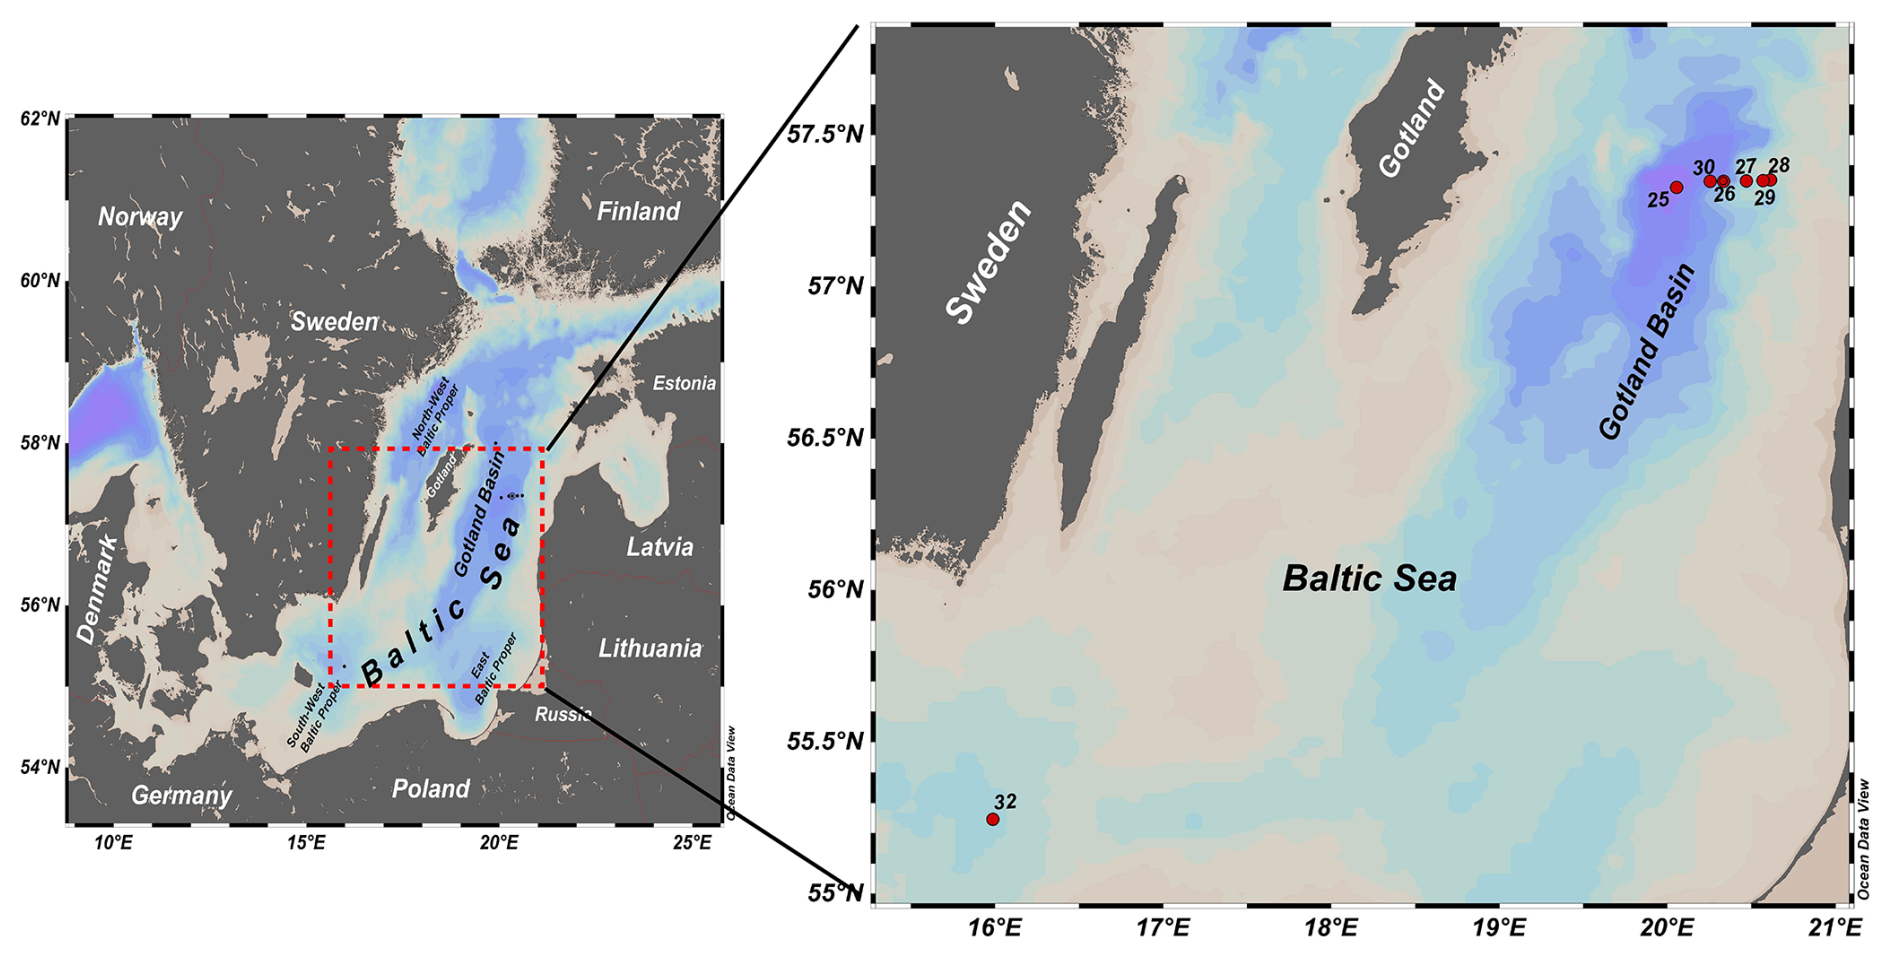
Figure 1Study sites in the Eastern Gotland Basin, central Baltic Sea, sampled during cruise 214 on RV Elisabeth Mann Borgese in May/June 2019 (Schlitzer, Reiner, Ocean Data View, https://odv.awi.de, 2021).
Water samples were collected in special 5L Free Flow water bottles, developed by IOW/HYDROBIOS for sampling in systems with strong vertical gradients, mounted on a rosette equipped with double sensor packages for conductivity, temperature and pressure (CTD) and oxygen sensors. Oxygen was analyzed by Winkler titration on enough samples to assure proper calibration of the oxygen sensors. The CTD SBE 43 oxygen sensors recorded oxygen concentrations that were validated frequently by Winkler titration results. Dissolved nutrients, including NO and NO, were measured onboard from filtered samples using standard photometric methods by means of an autoanalyser (Grasshoff et al., 1999). H2S was determined spectrophotometrically by the methylene blue reaction (Grasshoff et al., 1999).
Samples for dissolved N2O were taken in 125 mL glass septum vials with overflow and closed with gray butyl stoppers and aluminium crimps avoiding the introduction of bubbles. Samples were then treated with 100 µL saturated mercuric chloride solution to inhibit microbial activity until analysis. All N2O concentration data were directly measured on board within 36 h after sampling.
Single samples for dissolved N2O isotopes were collected into 160 mL glass serum bottles. A Tygon® tubing was attached to the Niskin bottle, and the serum bottles were filled and allowed to overflow twice taking care not to introduce bubbles. Samples were poisoned with 100 µL saturated mercury chloride (HgCl2) solution and then capped with gray butyl stoppers and aluminium crimps. They were shaken well and stored in the dark at 4 °C until analyses.
2.2 Dissolved N2O concentrations and atmospheric mole fractions
The dissolved N2O concentrations were determined using a dynamic headspace method, i.e. a purge and trap system linked to a gas chromatograph to allow for the simultaneous measurement of N2O and CH4. In brief, approximately 10 mL of the samples were transferred into a purge vessel using a calibrated air-tight syringe without contact to air (volume error < 0.5 %). The dissolved gases were stripped out of the sub-sample using an ultrapure helium purge stream, and cryo-focused. Through heating, the trapped gases were injected onto the gas chromatographic system, the N2O was isolated and measured on an electron capture detector. The method is described in detail in Wilson et al. (2018) and Sabbaghzadeh et al. (2021). The estimated precision was determined to be better than 2 % for N2O (Sabbaghzadeh et al., 2021).
The N2O saturations (%) were calculated as
where the N2Oequilibrium is the equilibrium concentration of N2O calculated according to Weiss and Price (1980) with the in-situ temperature, salinity and the mean monthly atmospheric mole fraction of N2O (332.9 ppb) for May and June 2019. The atmospheric mole fractions of N2O at the time of the sampling were taken from the NOAA/ESRL monitoring station in Mace Head (Ireland) (http://www.esrl.noaa.gov/gmd/, last access: 21 January 2024).
2.3 Stable isotope methods
Bulk N2O isotope and isotopomer analyses were conducted at the Department of Environmental Sciences, University of Basel, Basel, Switzerland. Using helium (He) as carrier gas, N2O was purged from the sample vials into a customized purge-and-trap system (McIlvin and Casciotti, 2011) and analyzed by continuous-flow IRMS (GC-IRMS, Thermo Delta V). Ratios of , , and were converted to δ15N-N2O (referenced to air), δ18O-N2O (referenced to Vienna Standard Mean Ocean Water, VSMOW), and site-specific δ15Nα and δ15Nβ-N2O (Frame and Casciotti, 2010; Mohn et al., 2014; Kelly et al., 2023) using three isotopic mixtures of N2O in synthetic air (CA06261: δ15N = −35.74 ‰, δ15N ‰, δ15N ‰, δ18O = 26.94 ‰; Fl.53504: δ15N = 48.09 ‰, δ15Nα= 1.71 ‰, δ15Nβ= 94.44 ‰, δ18O = 36.10 ‰; and CA08214: δ15N = 6.84 ‰, δ15Nα= 17.11 ‰, δ15N3.43 ‰, δ18O = 35.39 ‰; kindly provided by Joachim Mohn, EMPA, Switzerland). Standard deviations for triplicate measurements of our standards were ± 0.39 ‰ for δ15Nbulk-N2O, ± 0.56 ‰ for δ18O-N2O and ± 1.29 % for SP-N2O.
The surface layer (0–50 m) of the Eastern Gotland Basin was well oxygenated with O2 concentrations (> 300 µM) being near equilibrium with the atmosphere (Fig. 2). The oxycline extended from 50 to 70 m in most stations (up to 75 m in Stations 28 and 29). Below the oxycline, the waters gradually turned suboxic ([O2 < 20 µM). It is important to mention that at Station 25, we observed a second smaller layer of oxygenated water ([O2] = 29 µM) in a depth of 120 m. H2S concentrations did not exceed 0.5 µM at Stations 26, 27, 29 and 30 and were not detected at Stations 28 and 32. Station 25, which was also the deepest station, had the highest H2S concentration (4.7 µM) in the bottom waters. Based on a definition of the suboxic zone of [O2] < 20 µM (Paulmier and Ruiz-Pino, 2009), its thickness varied from only 4 m (Station 28) up to > 100 m (Station 25) (Fig. 2).
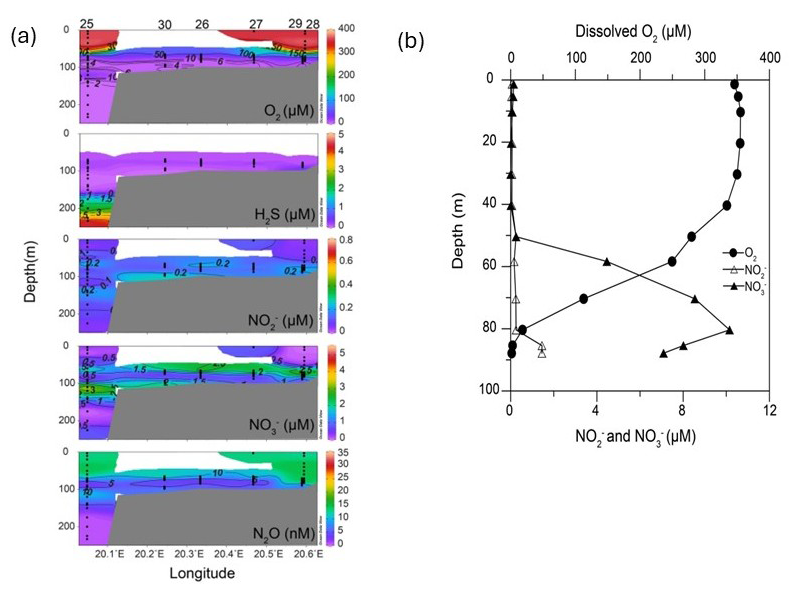
Figure 2Hydrographic transects of oxygen, nitrate, nitrite and hydrogen sulfide at Stations (a) 25, 30, 26, 27, 29, 28 and (b) profiles of these parameters at Station 32. Hydrogen sulfide was not detected at Station 32 and hence not depicted in (b) (a: Schlitzer, Reiner, Ocean Data View, https://odv.awi.de, 2021).
The surface waters were depleted in nitrate and nitrite with the highest concentrations being 0.84 and 0.12 µM respectively (Fig. 2). The nitrate maxima were observed at 70–75 m and highest nitrate concentrations ranged from 3.5–8.5 µM. Nitrate consumption was observed below the nitrate maxima. The bottom waters of Stations 25, 29, 28, 26, and 27 had nitrate concentrations below 1 µM. At Station 30, the nitrate levels dropped in the suboxic zone (O2 between 2–9 µM) before increasing up to ∼ 3 µM in the bottom depths (O2 < 3 µM). At Station 25 a second nitrate peak coincided with the O2 intrusion at 120 m. Nitrite moderately increased (0.5–1 µM) in the oxycline for all stations. At Station 32, the nitrate concentrations were higher (∼ 10 µM) at the nitrate maximum compared to other stations and at the time of sampling, the bottom depths had high concentrations of nitrate (7 µM) and nitrite (1.5 µM). An overlap of H2S and NO was present in 5 out of the 7 stations (25, 26, 27, 29, 30). In general, no distinct secondary nitrite maximum (SNM) was detected at all stations, similar to observations by Frey et al. (2014a).
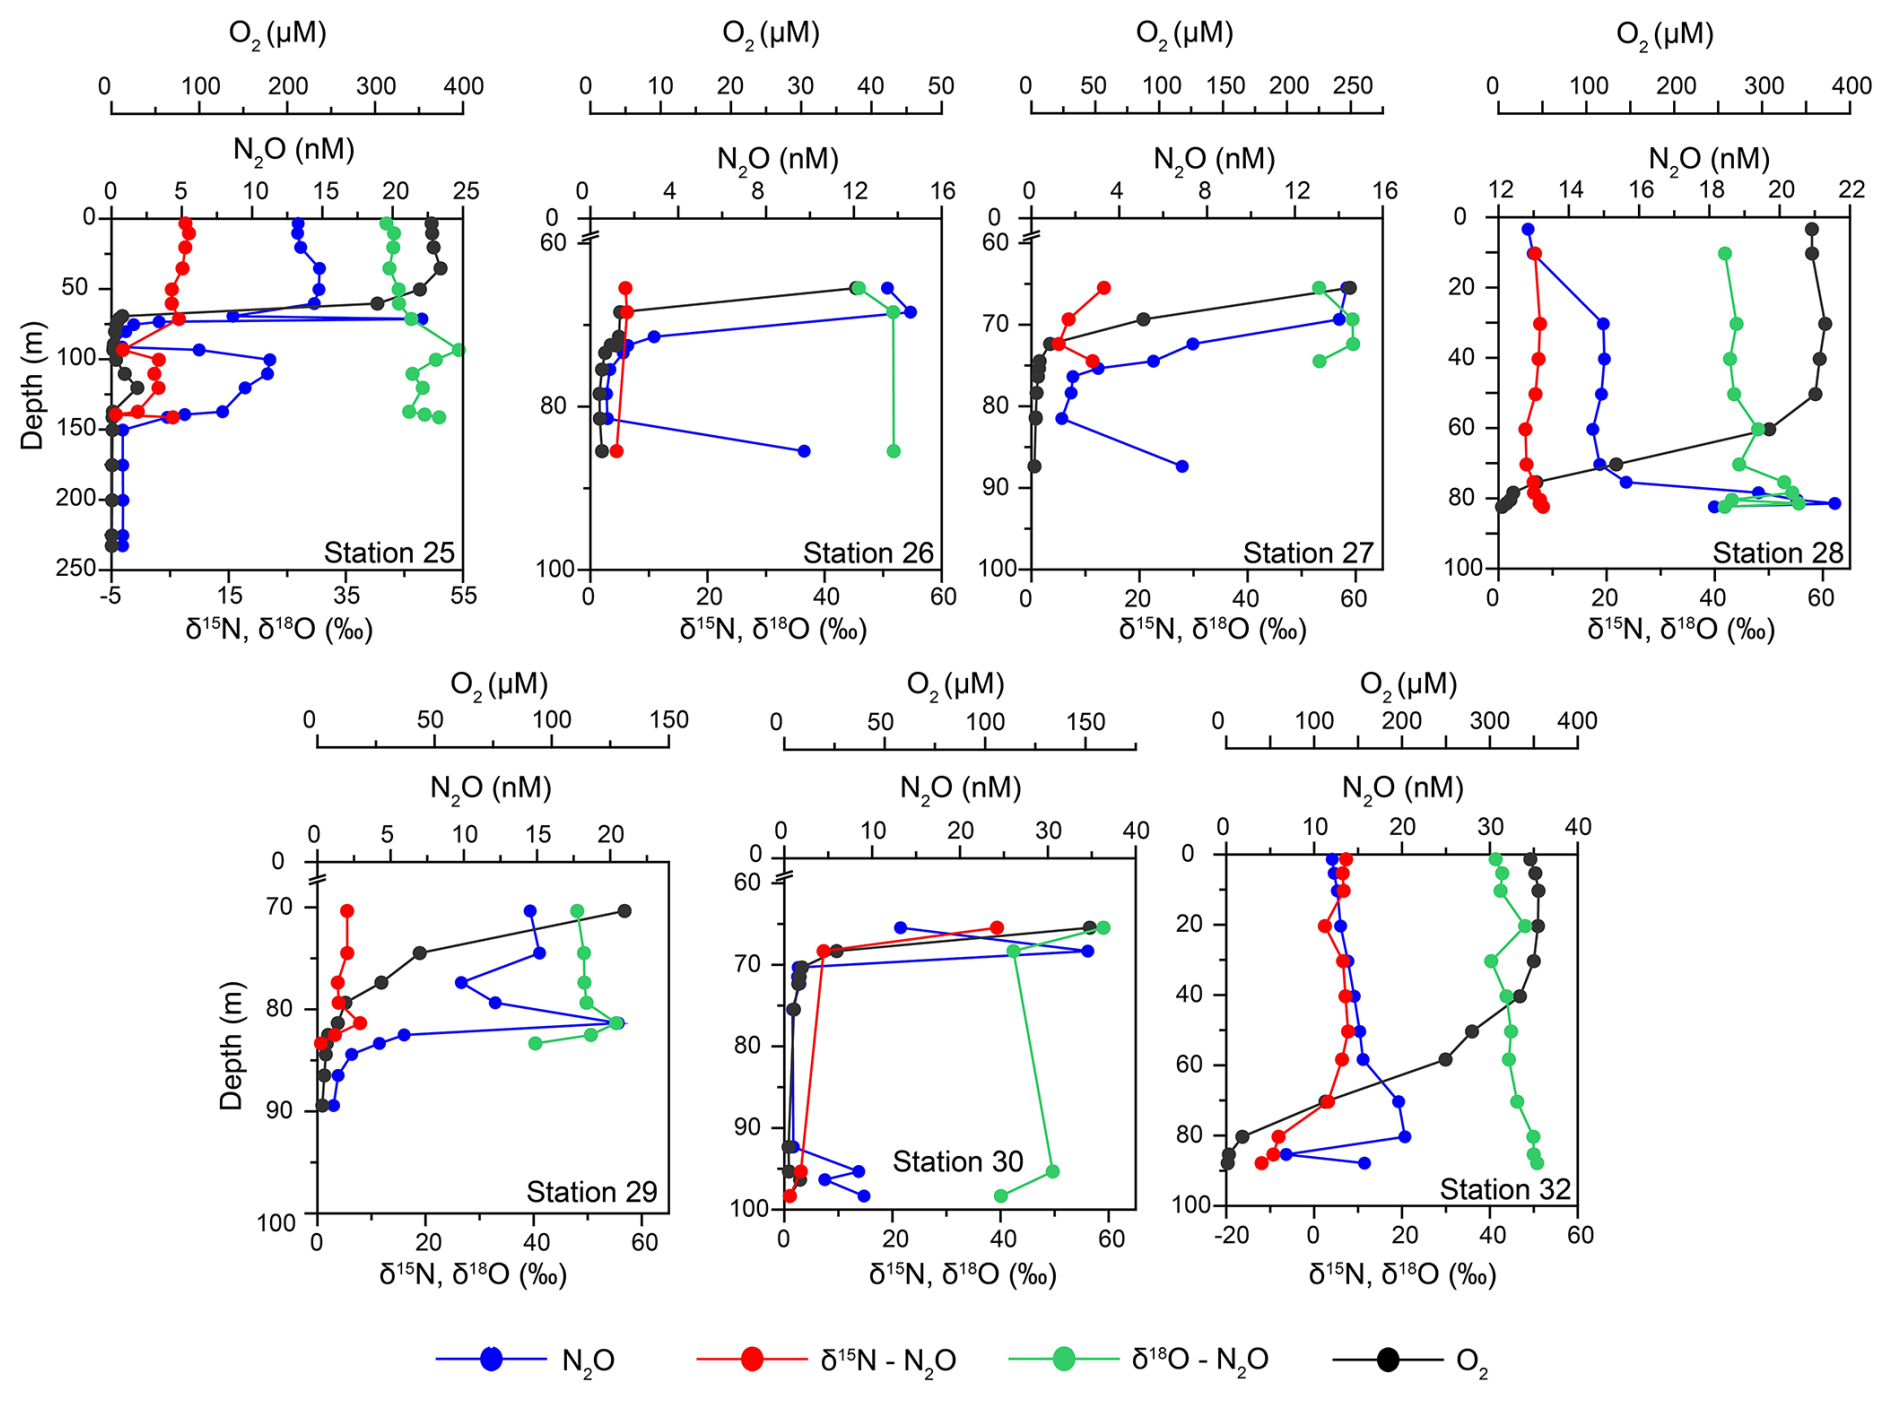
Figure 3Depth profiles of dissolved oxygen (DO) concentrations (in black), N2O concentrations (in blue) and its δ15Nbulk- (red) and δ18O (green) isotopes at Stations 25, 26, 27, 28, 29 30 and 32.
Surface water N2O concentrations ranged between 10–15 nM (Fig. 3). These waters were almost at atmospheric equilibrium (94 %–104 % saturation, Table S1). In the oxycline the N2O concentrations increased to 15–20 nM at the top of the ODZ. The N2O saturation remained in an almost similar range as surface water (98 %–105 % with respect to atmospheric N2O). Beyond the oxycline, at some stations (26, 27, 29 and 30), the N2O concentrations steadily declined to < 1 nM (N2O saturation < 10 % with respect to atmospheric N2O). An increase in N2O concentrations was recorded at the bottom depths at Stations 26, 27, and 30. At the deepest station, Station 25, the N2O concentration profiles demonstrated a second peak, coinciding with the intrusion of oxygenated water, and then decreased to < 1 nM in the bottom depths. In the near-bottom waters of Stations 28 and 32 the N2O concentrations were in the range of 16–22 nM (N2O saturation 125 %–150 % with respect to atmospheric N2O).
The mean δ15Nbulk (6.6 ± 1.8 ‰) and δ18O (43.1 ± 2.1 ‰) of N2O in surface waters were close to tropospheric N2O values (∼ 6.6 ‰ and 44.2 ‰, Toyoda et al., 2013) (Fig. 3). The former remained nearly the same (6.6 ± 1.9 ‰) in the oxycline as the N2O concentrations increased while the latter increased to 46.5 ± 4.6 ‰. Below the oxycline, the δ15Nbulk-N2O moderately increased to 7.1 ± 0.9 ‰ accompanied by a decrease in N2O. The mean δ18O-N2O also increased up to 49.6 ± 5.1 ‰ in the ODZ waters. At Station 32, extremely depleted δ15Nbulk up to −12 ‰ were recorded in the bottom waters. The average values of δ15Nbulk and δ18O at the maximum N2O concentration were 7.1 ± 0.6 ‰ and 51.5 ± 5.9 ‰ respectively.
In the surface waters, the mean SP was 18.1 ± 9.3 ‰ (Table S1). Like the δ18O-N2O, SP increased to 30.2 ± 7.5 ‰ in the oxycline (Table S1). Below the oxycline, the SP displayed a lot of variability. The SP values displayed maxima in the suboxic waters in general. The exception was Station 25 where the values dropped to less than 0 ‰. The mean δ15Nα was 14.8 ± 5.4 ‰ in the surface waters. It increased to 18.8 ± 4.9 ‰ in the oxycline. In the bottom waters, the δ15Nα increased to 30 ‰–50 ‰ with a few low values recorded at Station 25. The mean δ15Nβ values in the surface and the oxycline waters were −3.3 ± 4.6 ‰ and −6.7 ± 4.1 ‰ respectively. The values further decreased to −10 ‰ to −20 ‰ in the ODZ waters with the lowest value of −32.5 ‰ recorded in the bottom depths of Station 32 coincident with highly depleted δ15Nbulk-N2O.
In the suboxic waters of this transect in the Baltic Sea, the N2O profiles generally depicted a rapid decline concurrent with declining dissolved oxygen concentrations. This presented a methodological challenge as these low concentrations (∼ 1 nM N2O) were below the threshold for reliable isotopic measurements. In the limited set of datapoints that we could measure, these are the main trends that appeared: (1) A moderate enrichment in δ15Nbulk-N2O in all the stations except Station 32, with declining N2O concentrations. (2) A decoupling between δ18O and δ15Nbulk-values at Stations 28 and 32. (3) A peak in N2O concentrations in the bottom waters at Stations 26, 27, 30 and 32. (4) Highly depleted δ15Nbulk-values in suboxic depths at Station 32. We will address each trend and discuss these results in the following section.
4.1 N2O in oxic waters
Surface N2O saturations in the Eastern Gotland Basin ranged from 92 % to 104 % with a mean of 98.8 ± 3.7 % in the month of June 2019 which showed that surface waters were near equilibrium with the atmosphere and thus did not represent a source or sink of N2O to the atmosphere. The production of N2O through nitrification, along with decreasing dissolved oxygen concentrations, was indicated by increasing NO and N2O concentrations beneath the surface waters (between 65–70 m for Stations 26 and 27; and between 50–75 m for Stations 25, 28, 29 and 32). There was no linear relationship of ΔN2O and AOU in oxic waters which implies that nitrification rates were low and counterbalanced by the air-sea exchange of N2O (Fig. 4). The low ΔN2O at high AOU values were comparable to those typically found in not nitrifying suboxic or sulfidic waters of the Baltic Sea (see e.g. Walter et al., 2006) (Fig. 4).
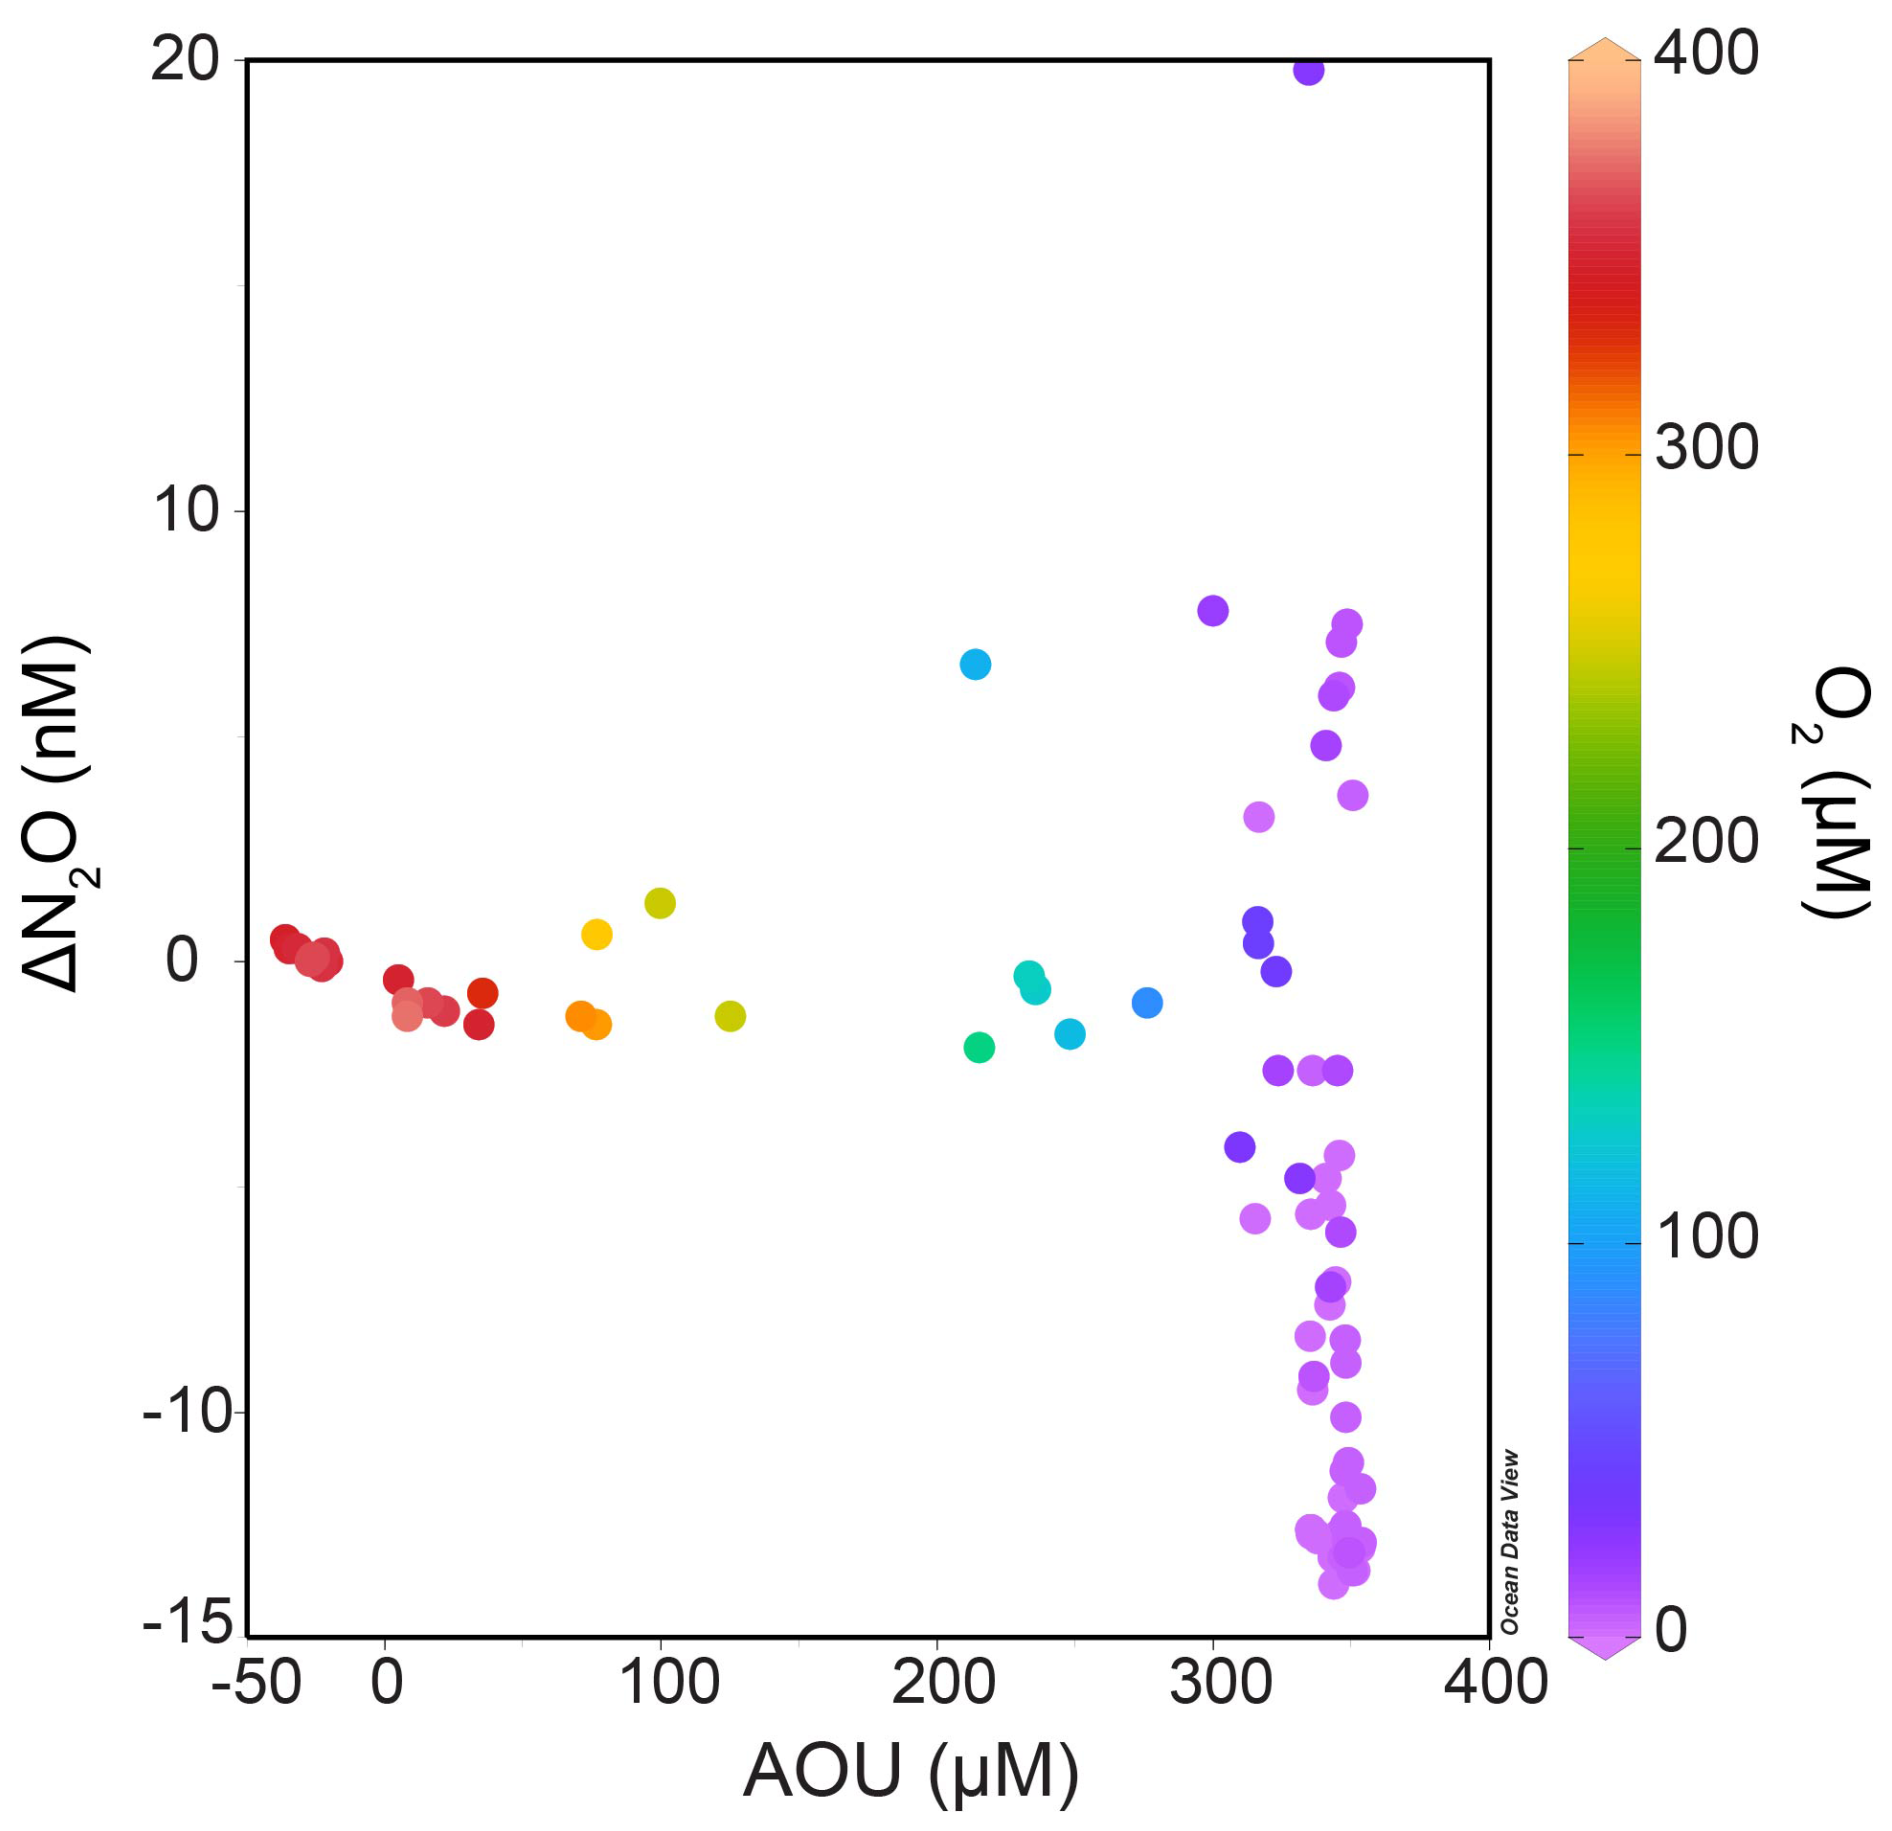
Figure 4ΔN2O AOU relationship from all the stations color-coded with dissolved nitrate concentrations (Schlitzer, Reiner, Ocean Data View, https://odv.awi.de, 2021).
The potential source of N2O in oxic waters can be determined from the intercepts of the linear regression between the inverse of the observed N2O concentration ( N2Oobserved) and the δ15Nbulk, δ18O or SP observations (Keeling, 1961; Fujii et al., 2013). We applied this approach known as the Keeling plot method to the surface (0–50 m) and the oxycline waters (50–70 m) (dissolved O2 concentrations > 20 µM in all samples), but no significant linear trend was visible for the three isotopes of N2O (Fig. 5). Most data points scatter around the isotopic composition of N2O in air rendering this as a dominant source in oxic waters. Note, that this method cannot be applied in suboxic waters, where consumption of N2O is dominating. The δ15Nbulk of N2Oproduced were higher in the surface waters (9.7 ‰) and closer to the atmospheric equilibrated value than in the oxycline (5.3 ‰). If nitrification is a source of N2O, then the δ15Nbulk-N2Oproduced should be lower to and similar to the δ15N of the NH substrate. Frey et al. (2014a) reported δ15N-NH values in the range of 6 ‰–10 ‰ in the upper suboxic zone and up to 22 ‰ at the redoxcline in the Gotland Basin. The kinetic isotope effect of ammonia oxidation to nitrite, the first step of nitrification, is 14 %–38 % (Casciotti et al., 2003). Considering the δ15N-NH of 22 ‰ (in the redoxcline) from Frey et al. (2014a) and the mean δ15Nbulk of N2Oproduced of 5.3 ‰), the kinetic isotope effect in this dataset falls in the range of 8 ‰–33 ‰ making nitrification a likely source.
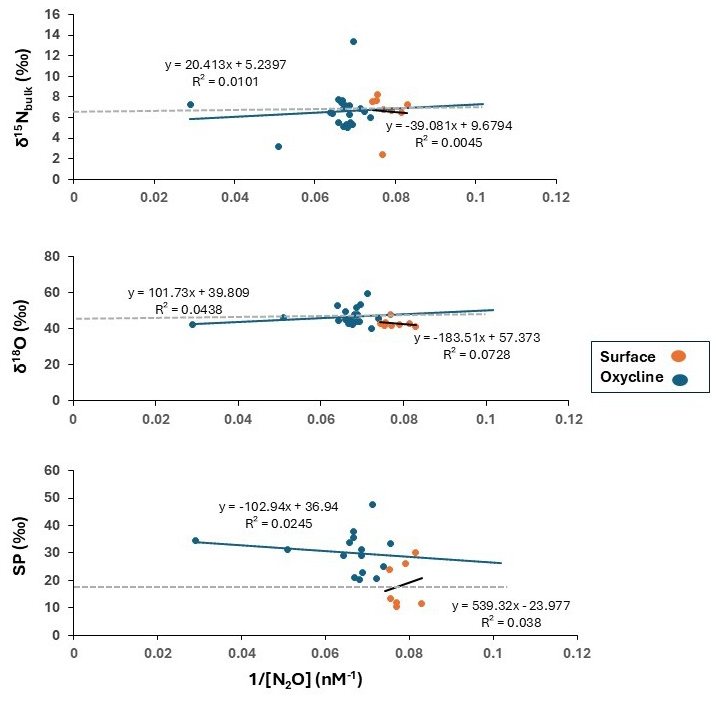
Figure 5Linear regressions of δ15Nbulk, δ18O and SP against (N2O concentration). Regressions were performed on two groups of data: surface (0–50 m) (represented by orange circles) and the oxycline (50–70 m) (represented by blue circles). Tropospheric N2O has been represented as a grey dashed line with values reported by Toyoda et al. (2013) (δ15Nbulk= ∼ 6.6 ‰, δ18O = ∼ 44 ‰, and SP = ∼ 18 ‰).
The δ18O of N2Oproduced was lower (39.8 ‰) in the oxycline than in the surface (57.4 ‰). The N2O molecule derives its oxygen from dissolved O2 and H2O molecules during nitrification and from nitrite or nitrate during denitrification (Ostrom et al., 2000). Moreover, the δ18O-N2O is also impacted by the isotopic fractionation during N2O production and O isotope equilibration (Frame and Casciotti, 2010; Casciotti and Buchwald, 2012). The δ18O-NOx and the δ18O-H2O in the central Baltic Sea were reported as ∼ 0.1 ± 1.8 ‰ and −6 ± 0.4 ‰ respectively (Frey et al., 2014a), so δ18O of N2Oproduced are higher than potential sources and are indicating a depleted 18O source during nitrification.
We observed an increase of SP from the surface to the oxycline. SP is process-dependent and substrate-independent. SP during production via nitrification is usually in the range 30 ‰–38 ‰ and during production via denitrification and nitrifier-denitrification is in the range −10 ‰–25 ‰ (Sutka et al., 2004; Frame and Casciotti, 2010). The mean SP of N2O in the atmosphere is 18.7 ± 2.5 ‰ (Toyoda et al., 2017), suggesting its predominance in surface waters. However, as depth increases, the observed rise in SP appears to be linked to the production by nitrification, because the mean SP values in the oxycline waters were closer to the SP values for ammonia oxidation as compared to nitrifier-denitrification. However, based solely on SP it is difficult to draw conclusions whether ammonia-oxidizing archaea (AOA, SP ∼ 30 ‰) or ammonia-oxidizing bacteria (AOB, SP ∼ 36 ‰; Santoro et al., 2011; Sutka et al., 2003) are dominating. Nonetheless, based on previous studies, which have found high-level expression of archaeal nitrification genes (Thaumarchaeota, related to the genus Nitrosopumilus) in the Baltic Sea above the redoxcline (Labrenz et al., 2007) as well as high activities (Berg et al., 2015), AOA may be potential contributors to N2O production. The AOA are probably more dominant due to their ability to cope with frequent exposure to sulfidic waters (Berg et al., 2015; Jäntii et al. 2018) as compared to the AOB, which are more prevalent in the nutrient rich coastal waters (Happel et al., 2018).
To sum it up, the δ15Nbulk- and δ18O of N2O in the oxic surface waters closely resembled those of tropospheric N2O. The increase in N2O concentrations in the subsurface waters along with decline of O2 concentrations and increase in the NO concentrations implies in-situ N2O production by bacterial or archaeal ammonia oxidation as indicated by the δ15Nbulk-, the δ18O and the SP of N2O. Our results align with those of Ji and Grundle (2019), who observed an increased yield of N2O due to increasing ammonia oxidation under decreasing O2 concentrations. The authors reported the highest rate of N2O production coincided with the lowest in-situ O2 concentration. The nitrifier-denitrification pathway seems to be of minor significance in this zone. The isotopic compositions were also quite similar between the surface and the oxycline which renders the possibility of exchange between these layers with a potential for supersaturation and high surface flux of N2O.
4.2 N2O in suboxic waters
Microbial denitrification proceeds by the stepwise reduction of NO to NO to NO to N2O and ultimately to N2. Thus, denitrification acts as both a source and sink for N2O. Chemolithoautotrophic and heterotrophic denitrification are the two dominant processes of fixed nitrogen (N) removal in the Baltic Sea redoxcline (Frey et al., 2014a; Hannig et al., 2007; Bonaglia et al., 2016; Dalsgaard et al., 2013). When H2S and NO coexist in this zone, fixed N removal is fueled through the chemolithoautotrophic mode. Heterotrophic denitrification can be the dominant mode of fixed N removal in the Baltic Sea especially when the sediment slope is steep, which increases the occurrence of internal waves (Bonaglia et al., 2016). H2S concentrations were quite low as compared to some of the studies conducted during the stagnant periods (Frey et al., 2014a). A few inflows were recorded in 2019 including one in June reaching the Eastern Gotland Basin (Hansson et al., 2020), which may have caused lower H2S accumulation. The recent intrusion of a layer of oxygenated water with its core at ∼ 110 m water depth is visible in our transect. Dalsgaard et al. (2013) performed a set of incubation experiments and observed N2O to be increasing during denitrification with increasing amounts of sulfide. In our study of natural samples, however, we did not find such a correlation because H2S concentrations were below 0.5 µM when co-existing with NO. However, both modes of denitrification can be incomplete and stop at N2O, whether one has higher N2O yields is not known. Additionally, the isotope fractionation effect on N2O production during incomplete chemoorganotroph and chemolithotrophic denitrifiaction or N2O consumption during complete denitrification must be considered. The N and O isotopic effect for N2O produced during canonical denitrification using nitrate or nitrite as substrate are 10 ‰ to 39 ‰ and −40 ‰ to −4 ‰ respectively (Casciotti et al., 2002; Toyoda et al., 2005; Sutka et al., 2006). The negative O isotope effect is due to the preference of the produced N2O to retain the 18O within the N2O bond and release the 16O instead. The N2O, when reduced to N2, causes an enrichment in δ15Nbulk- and δ18O-N2O values as well as an increase in SP signatures respectively (Ostrom et al., 2007; Yamagashi et al., 2007).
For ease of discussion, we can roughly divide the stations into two groups: at Stations 28 and 32, no detectable sulfide could be measured (Group A) and at Stations 25, 26, 27, 29 and 30, sulfide was detected and co-existent with nitrate below the oxycline (Group B). While there was variability in isotopomeric signatures within these stations, a common feature of the former group was the accumulation of N2O observed in the bottom waters. In the latter group, rapid consumption of N2O limited its isotopic measurements.
4.2.1 Group A: Stations with no detectable sulfide
Stations 32 and 28 comprise Group A. Station 32 is located outside the Eastern Gotland Basin (in the Bornholm Basin) and has greater proximity to the North Sea. It is possible that smaller inflows (Hansson et al., 2020) may have ventilated the deep water at this station. In general, anoxic conditions in the Bornholm Basin are known to be seasonal in nature and not as persistent as in the central Baltic Sea. A decoupling of the δ15Nbulk- and δ18O-N2O was observed in the bottom waters of Station 32. In the suboxic bottom waters (80–88 m), the 15Nbulk became more depleted and the 18O became more enriched with decreasing N2O concentrations (Fig. 7). These depths also recorded a pronounced buildup of nitrite (1.5 µM, Fig. 2b) that was not observed in the other stations.
To explain the depleted δ15Nbulk- values in Station 32, we look at the precursors of N2O. The δ15N of nitrate, the presumed precursor to N2O, were 8 ‰–10 ‰ (Supplement data, Fig. S2) at Station 32 and do not explain the unusually low values. The δ15N of ammonium, another possible precursor, was reported to be between 5 ‰ and 10 ‰ (Frey et al., 2014a). The dual isotope signatures of dissolved nitrate exhibited progressive enrichment concomitant with nitrate consumption which points to occurrence of denitrification (Fig. S2, Supplement).
As the consumption of N2O during denitrification involves breakage of only the Nα-O bond, the δ15Nα and the δ18O should increase while δ15Nβ should remain unchanged. In these waters, however, while δ15Nα exhibited a moderate increase, the δ15Nβ was observed to decrease (Fig. 6). The SP showed a positive correlation with the δ18O-N2O (with R2= 0.97) (deepest 3 data points in Fig. 6b) which suggests that the process that led to enrichment of δ18O also caused a depletion of δ15Nβ. Moreover, the correlations between δ18O-N2O and the δ15Nbulk-, δ15Nα and δ15Nβ were all negative thus suggesting co-occurrence of multiple processes at this station: one that consumes N2O rendering the δ18O more enriched while another introduces 15N depleted nitrogen into N2O. Toyoda et al. (2005) have observed differential isotopic fractionation of N incorporation into α and β positions in a particular strain of a denitrifying bacterium. Similar observations of declining δ15Nβ and increasing δ18O and SP have been reported from the sulfidic waters of the Black Sea (Westley et al., 2006), the eastern tropical North Pacific Ocean (Yamagishi et al., 2007) and the coastal surface waters of the monsoonal upwelling region of the Arabian Sea (Naqvi et al., 1998, 2006) and have been attributed to shifts from N2O consumption to net production.
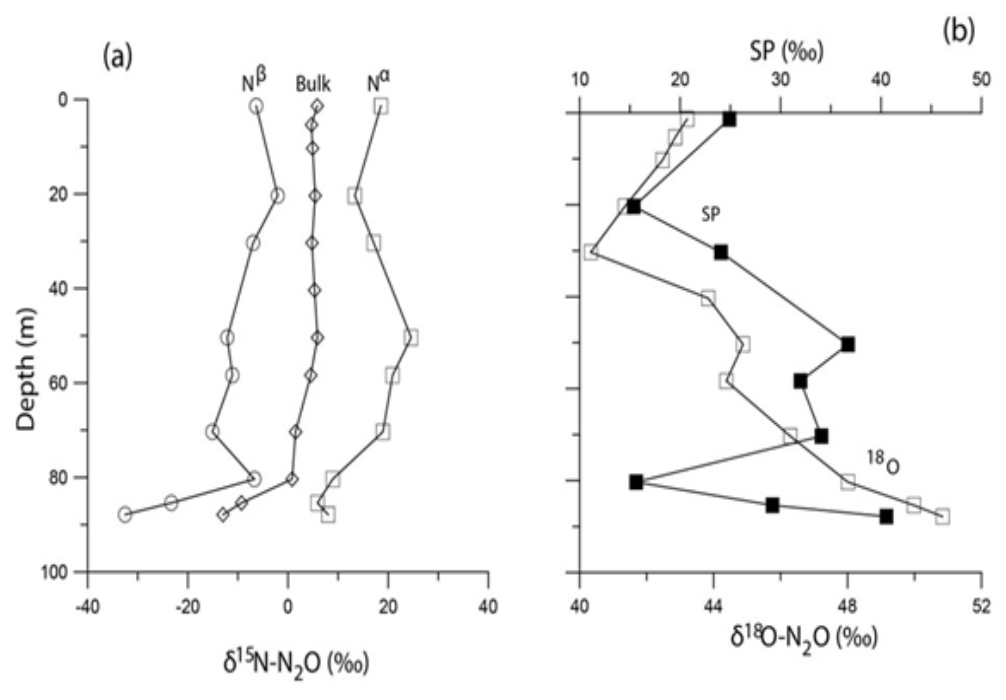
Figure 6The isotopomeric composition of N2O at Station 32. Panel (a) shows the depth profiles of δ15Nbulk-, δ15Nα and δ15Nβ, panel (b) shows the depth profile of δ18O and SP.
While the δ15Nbulk- and δ18O-N2O were significantly positively correlated with the δ15N- and δ18O-NO respectively, the slopes were significantly lower than 1, thus implying the co-occurrence of multiple processes. A close and immediate coupling of nitrification and denitrification in these waters was already suggested by Frey et al. (2014a).
At Station 28, N2O accumulated in the suboxic waters. While we do observe a decreasing trend of dissolved nitrate with depth, which could explain the production of N2O, no N2O consumption was observed. As the enzyme N2O reductase, responsible for reducing N2O to N2, is highly sensitive and may be inhibited by even nanomolar O2 concentrations (Dalsgaard et al., 2013), incomplete denitrification could cause an accumulation of N2O in these depths. A decoupling of the δ15Nbulk- and δ18O-N2O values was observed at this station as well. While the enrichment in δ15Nbulk- and δ15Nα values indicate N2O consumption, the depletion of δ18O and δ15Nβ values points towards production of N2O.
The SP values of the N2O in the suboxic depths of the Group A stations were in the range 26 ‰–40 ‰. Unlike bulk N2O isotopes, the SP values are independent of the precursor molecules. Fungal denitrification and iron-mediated chemodenitrification are noncanonical N2O production pathways that have unique SP signatures as compared to heterotrophic denitrification (SP = −11 ‰ to 0 ‰, Frame and Casciotti, 2010). The SP values of fungal denitrification and chemodenitrification have been reported to be in the range of 20 ‰–37 ‰ (Rohe et al., 2014) and 10 ‰–22 ‰ (Grabb et al., 2017) respectively. Fungal denitrification typically ends at N2O due to the missing N2O reductase (Nos) enzyme in most fungi (Shoun et al., 2012) and could explain the accumulation of N2O observed in the bottom waters. The higher SP values in this pathway are due to the enzyme involved in the reduction of NO to N2O, the P450NOR. In case of chemodenitrification, coastal and estuarine sediments are favourable hotspots because of their dynamic redox fluctuations due to the presence of active iron cycles (Wankel et al., 2017). 15 %–25 % of the total N2O production in the marine sediments from a coastal area of the Baltic Sea called the Norsminde Fjord in Denmark has been attributed to this process (Otte et al., 2019).
Also, in case of Stations 28 and 32, since these observations were recorded in the bottom waters, benthic N2O production may also play a significant role. The bottom waters were suboxic which means sedimentary nitrification and/or denitrification were possible N2O sources. Previous studies in the Eastern Gotland Basin (Hylén et al., 2022; Myllykangas et al., 2017) observed sedimentary efflux of N2O, which was attributed to incomplete denitrification. The authors observed that the large intrusion of oxygenated water during 2015 and several small inflows in the following years resulted in aeration of the previously long-term sulfidic sediments of the Eastern Gotland Basin. Further, algal aggregates were found to be hotspots for seafloor N2O production (Hylén et al., 2022). While the reason behind the spatial variability of N2O buildup in the bottom waters is not clear, it is evident that the microbial processes at the sediment-water interface should be considered in budget models for more accurate output.
4.2.2 Group B: Stations with detectable sulfide
As mentioned earlier, at Stations 25, 26, 27, 29 and 30, it was a challenge to characterize N2O isotopomerically due to rapidly declining concentrations, which we were not able to capture with our depth resolution. However, for the measured N2O, we observed increasing δ15Nbulk- and δ18O values concomitant with reduction in nitrate in the low-oxygen waters of these stations, indicating consumption of N2O via denitrification (heterotrophic/chemolithoautotrophic or both) as observed elsewhere (Farías et al., 2009; Casciotti et al., 2018). During denitrification, when N2O gets reduced to N2, the O-Nα bond breaks and both δ15Nα- and δ18O-N2O are expected to increase with an expected slope of 1.7–1.9 in their linear equation (Ostrom et al., 2007) while the bond-breakage is expected to have little effect on δ15Nβ. As a result, the SP is expected to increase too. However, in our dataset there was a negative trend of δ15Nα- vs. δ18O-N2O, the slope was 1 and correlation was significant (Fig. S1, Supplement) which may be explained by diffusion-induced 15N depletion in N2O prior to reduction (Lewicka-Szczebak et al., 2015) and/or N2O reduction and production occurring in close proximity within the same microsite (Ostrom et al., 2007). Due to concurrent production and consumption of N2O, we did not calculate kinetic isotope effects, but rather the apparent isotope effects (combining production and consumption) similar to Wenk et al. (2016). δ15Nbulk (ε15) and δ18O (ε18) were determined by performing linear regressions vs. −ln[N2O] assuming a closed system Rayleigh model (Fig. 7). While the closed-system Rayleigh approach has its limitations in field studies, we calculated the ε15 and ε18 were −4.48 ‰ (r = 0.36, p>0.1) and −9.34 ‰ (r = 0.11, p>0.1) respectively. The reported ε15 and ε18 values for N2O consumption are 4 ‰–13 ‰ and 11 ‰–31 ‰ (Barford et al., 1999; Ostrom et al., 2007; Yamagishi et al., 2007).
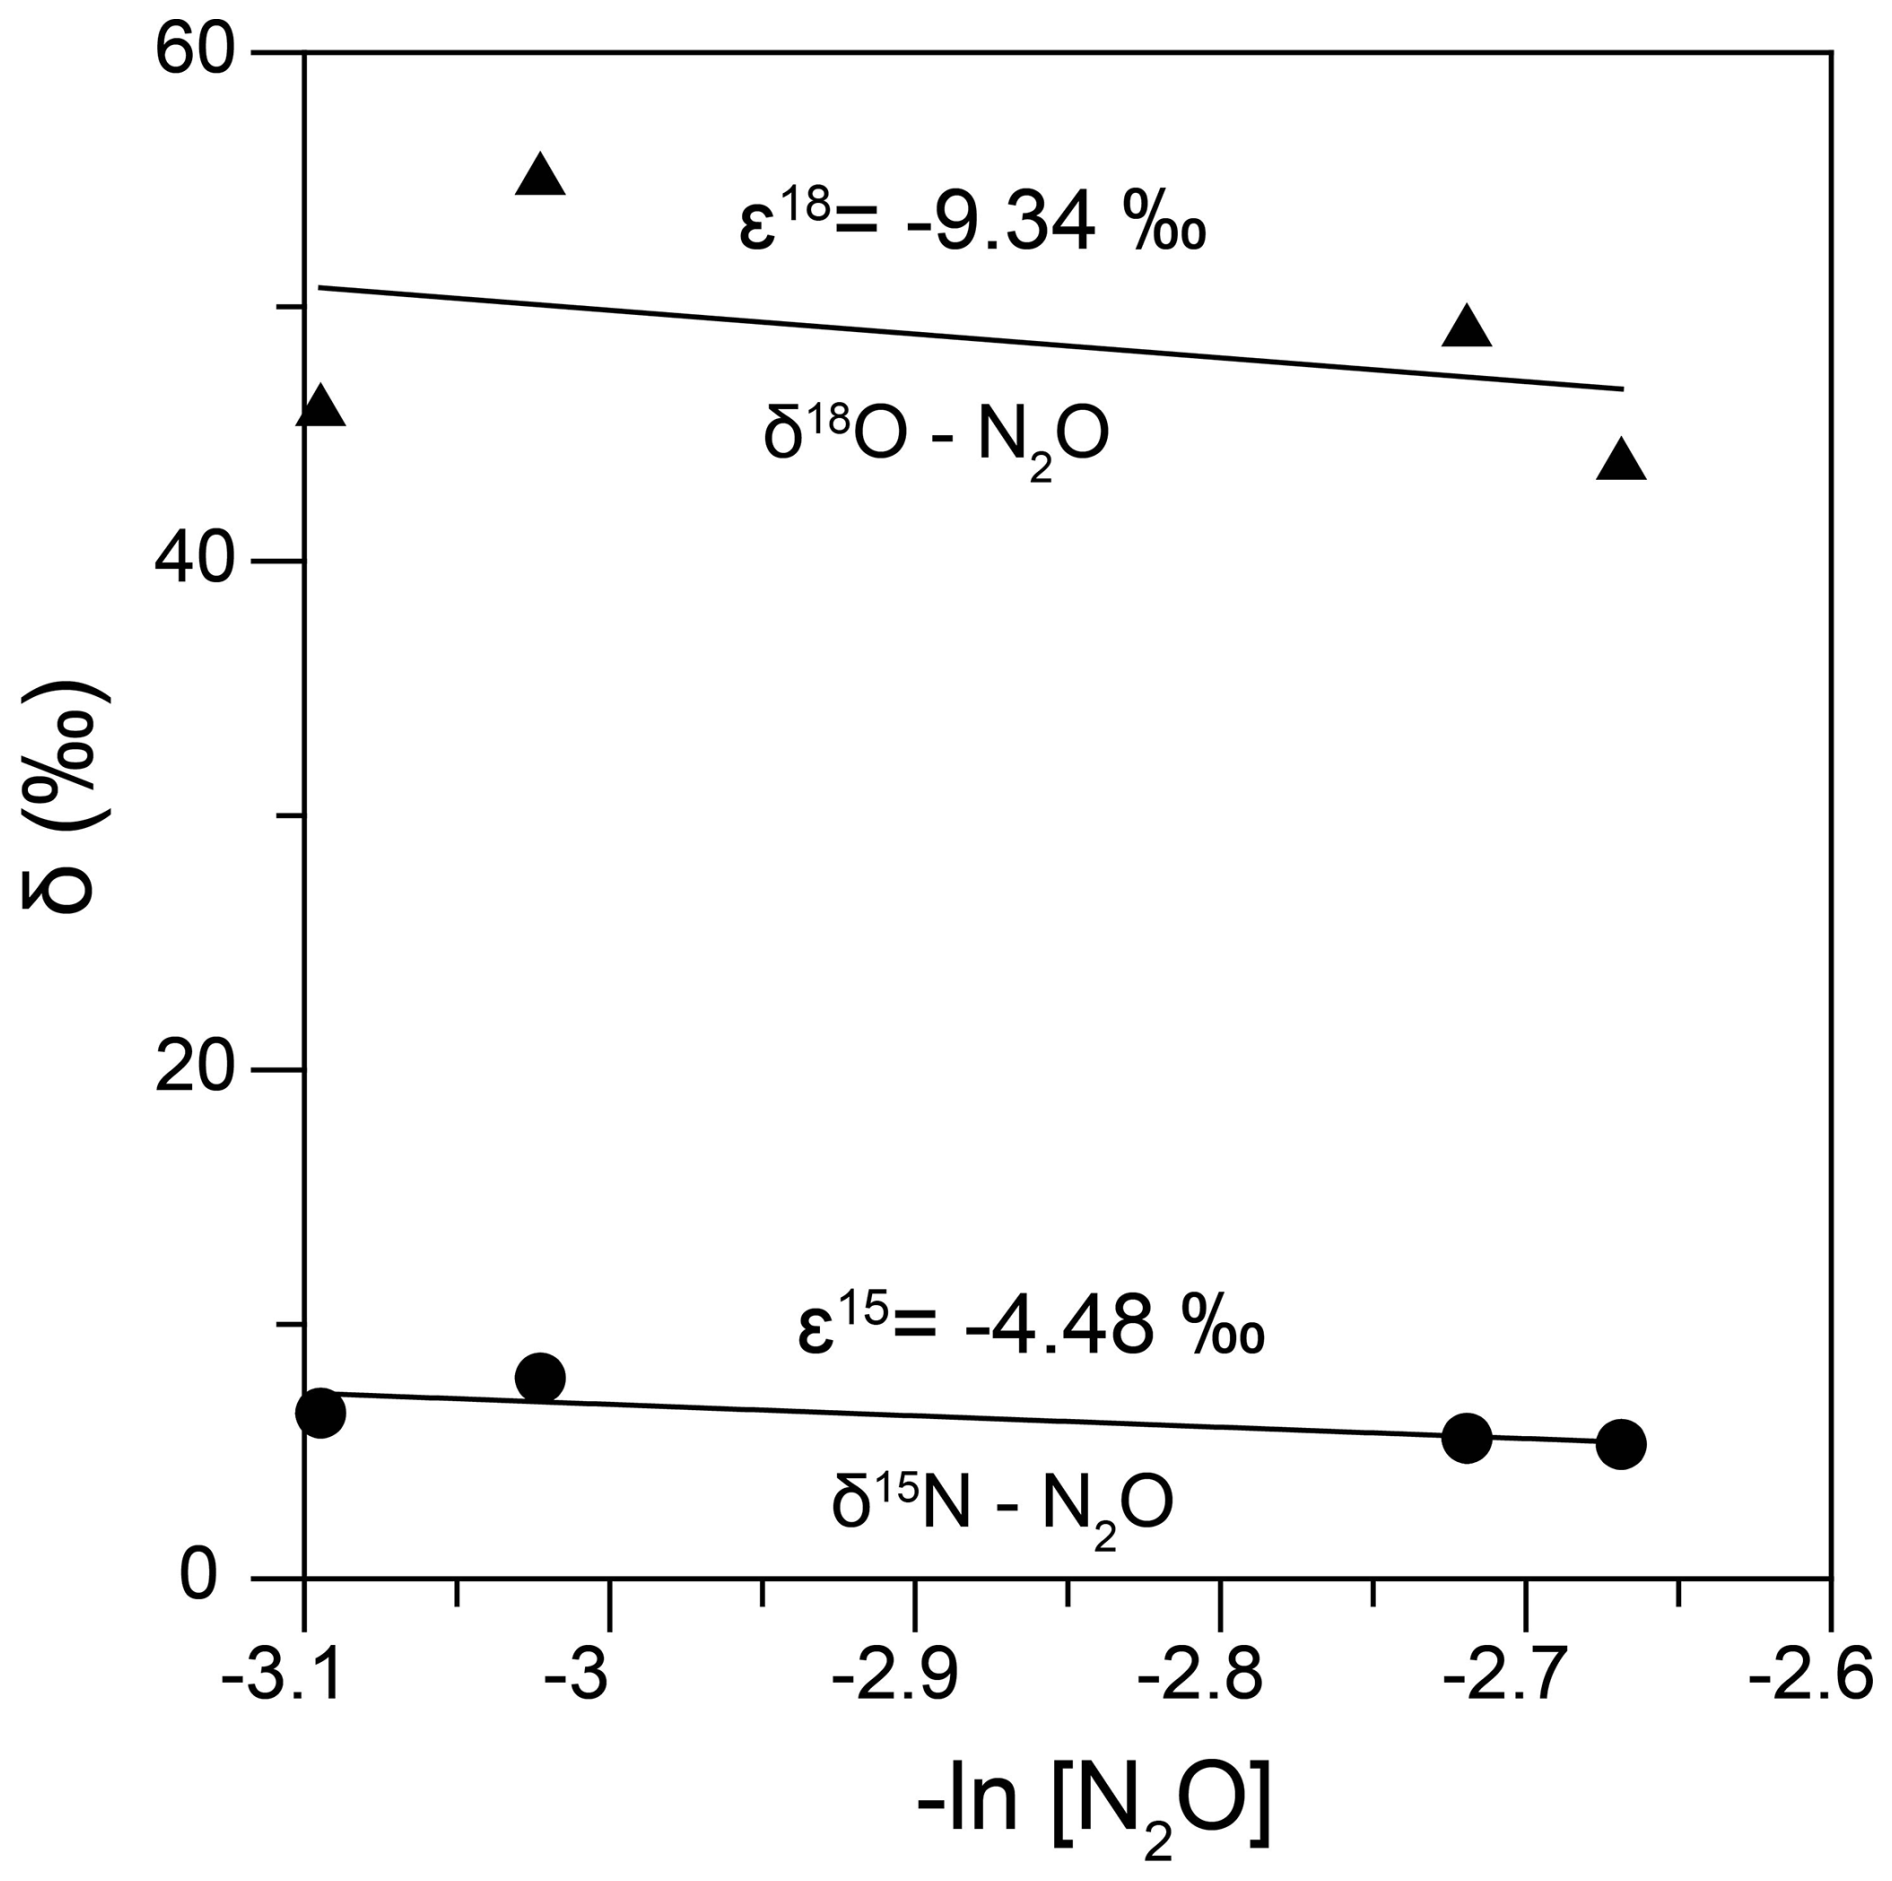
Figure 7The N and O isotope effects during N2O consumption at Stations 25, 26, 27, 29 and 30 obtained by plotting the δ15Nbulk- (filled circles) and δ18O (filled triangles) against −ln[N2O].
The ratio of N2O reduction during microbial denitrification has been observed to be ∼ 2.5 in a wide range of aquatic systems and irrespective of the metabolic mode (lithotrophic vs. heterotrophic) and a value ∼ 2.1 in our study is an indication of N2O reduction to be predominant at these stations (Wenk et al., 2016).
Moreover, the low isotope effect values could be an intrinsic feature of the Baltic Sea redoxcline due to diffusion limitation, which has been found for NO isotopes along the redoxcline previously (Frey et al. 2014a). In a culture study on a chemolithoautroph belonging to a group of the Epsilonproteobacteria, considered to be the major denitrifiers in the Baltic Sea redoxcline (Bruckner et al., 2013), the lower apparent N : O isotopic enrichment factor in nitrate was proposed to be caused the periplasmic nitrate reductase enzyme Nap (Frey et al., 2014b). The enzyme responsible for N2O reduction is known as N2O reductase (NosZ Clade I) which is also located in the bacterial periplasm like the Nap. This implies that diffusion limitation is a potential factor. Data on the N2O isotope systematics of marine chemolithoautotrophic denitrifiers are limited with only one published report available to the best of our knowledge (Li et al., 2024). In this study the authors reported a distinct SP signature (∼ 5.1 ‰) of the chemoautotrophic denitrification from a series of enrichment experiments from freshwater lakes.
Additional factors that can also impact N2O isotopic signatures but were beyond the scope of this study are activity of nosZ II genes, and other pathways. Microbes hosting the NosZ II Clade genes, known as N2O reducers, cannot produce N2O due to a lack of other denitrifying enzymes like nitrate and nitrite reductases, but they possess the NosZ Clade II enzyme to reduce N2O to N2 (Jones et al., 2013). Although previously reported in several soil-based studies, the Clade II genes were found to be more abundant than the Clade I types in the suboxic Chesapeake Bay waters (Tang et al., 2022), the Pearl River estuary (Ho et al., 2023) and the ODZ of the eastern tropical South Pacific Ocean (Sun et al., 2017). A comprehensive study on the abundance of NosZ Clade II in the Baltic Sea is currently unavailable. Additionally, the isotope effects for NosZ clade II are unknown. We have already mentioned fungal and chemodenitrification and their unique SP signatures during N2O production in the previous section. Dissimilatory nitrate reduction to ammonium (DNRA) may be another N2O source to be considered (Streminska et al., 2012). Bonaglia et al. (2016) found evidence of DNRA at the Eastern Gotland Basin redoxcline. The isotope effects and SP values of N2O produced via DNRA have recently been characterised by Xu et al. (2024).
Mitigating N2O emissions will depend on identifying microbial pathways of N2O production and their constraints. Sporadic intrusions of O2-enriched water masses into the deep basins of the central Baltic Sea bring about distinct transformations in the water column nitrogen cycling and the underlying processes. Isotopic tracer profiles of N2O provided insight into its origin and cycling in the Baltic Sea waters. Production of N2O occurred in the oxycline via nitrification (ammonia oxidation). Simultaneous production and consumption of N2O in the suboxic zone and bottom waters could be attributed to benthic incomplete denitrification. The isotope signature in N2O identified active N2O reduction but could not differentiate between chemolithoautotrophic and organotrophic denitrifiers. Our results demonstrated the spatial variability of the N-loss processes within our study area in the Baltic Sea. While this study provided some answers, it also raised several questions and directions for future research. Culture experiments of Baltic Sea chemolithoautotrophs to investigate their N2O isotope systematics will be a crucial next step. Further investigations on the impact of transient oxygenation events on the pelagic N loss should also be executed. We observed N2O production at the sediment-water interface in this area where the depth of the pelagic redoxcline is close to the sediment surface (i.e. coincides with the water depth). Future research should consider other biotic (e.g. fungal denitrification) and abiotic (e.g. chemodenitrification, chemical hydroxylamine oxidation) N2O formation processes. The results may be implemented in global and regional biogeochemical models to understand the response of N2O production and consumption pathways to various environmental stressors (e.g. eutrophication and deoxygenation).
All raw data used in the manuscript is attached in the Supplement. They are also deposited at the IOW Database under https://doi.org/10.12754/data-2026-0001 (Rehder et al., 2026) and are publicly available.
The supplement related to this article is available online at https://doi.org/10.5194/bg-23-1987-2026-supplement.
PB, GR and HWB designed the study. GR was the principal investigator during Cruise EMB214. GR performed the sample collection and data curation of water chemistry parameters including N2O concentrations. PB and CF performed the analysis of the nitrous oxide isotopomers. CF performed isotopomeric data correction. PB, GR and HWB contributed to the funding. PB wrote the manuscript and all authors contributed to the writing, review and editing.
At least one of the (co-)authors is a member of the editorial board of Biogeosciences. The peer-review process was guided by an independent editor, and the authors also have no other competing interests to declare.
Publisher's note: Copernicus Publications remains neutral with regard to jurisdictional claims made in the text, published maps, institutional affiliations, or any other geographical representation in this paper. The authors bear the ultimate responsibility for providing appropriate place names. Views expressed in the text are those of the authors and do not necessarily reflect the views of the publisher.
We thank the captain, the chief scientist and the crew onboard the R/V EMB214 cruise for their professional assistance at sea. Special thanks to Lars Kreuzer (IOW) for the nutrient, oxygen and H2S analyses, and to Stefan Otto and Sarah Velasco-Sobeck (IOW) for the N2O concentration measurements performed at sea. We are very grateful to Moritz Lehmann at the University of Basel for providing the opportunity to use his laboratories. CF was funded by Univ of Basel funds. Thomas Kuhn at University of Basel and Thomas Hansen at GEOMAR are gratefully acknowledged for their technical support.
This project was funded by the EU BONUS INTEGRAL project. It received funding from BONUS (Art. 185), funded jointly by the EU, the German Federal Ministry of Education and Research, the Swedish Research Council Formas, the Academy of Finland, the Polish National Centre for Research and Development, and the Estonian Research Council. PB thanks the Alexander von Humboldt Foundation for providing a postdoctoral fellowship (grant no. 1204748).
The article processing charges for this open-access publication were covered by the GEOMAR Helmholtz Centre for Ocean Research Kiel.
This paper was edited by Wei Wen Wong and reviewed by two anonymous referees.
Arévalo-Martínez, D. L., Kock, A., Löscher, C. R., Schmitz, R. A., and Bange, H. W.: Massive nitrous oxide emissions from the tropical South Pacific Ocean, Nat. Geosci., 8, 530–533, https://doi.org/10.1128/AEM.67.11.5343-5348.2001, 2015.
Barford, C. C., Montoya, J. P., Altabet, M. A., and Mitchell, R.: Steady-state nitrogen isotope effects of N2 and N2O production in Paracoccus denitrificans, Appl. Env. Microbiol., 65, 989–994, 1999.
Berg, C., Vandieken, V., Thamdrup, B., and Jürgens, K.: Significance of archaeal nitrification in hypoxic waters of the Baltic Sea, ISME J., 9, 1319–1332, https://doi.org/10.1038/ismej.2014.218, 2015.
Bonaglia, S., Klawonn, I., De Brabandere, L., Deutsch, B., Thamdrup, B. and Brüchert, V.: Denitrification and DNRA at the Baltic Sea oxic–anoxic interface: Substrate spectrum and kinetics, Limnol. Oceanogr., 61, 1900–1915, https://doi.org/10.1002/lno.10343, 2016.
Bourbonnais, A., Letscher, R., Bange, H., Echevin, V., Larkum, J., Mohn, J., Yoshida, N., and Altabet, M.: N2O production and consumption from stable isotopic and concentration data in the Peruvian coastal upwelling system, Global Biogeochem. Cy., 31, 678–698, https://doi.org/10.1002/2016GB005567, 2017.
Bruckner, C. G., Mammitzsch, K., Jost, G., Wendt, J., Labrenz, M., and Jürgens, K.: Chemolithoautotrophic denitrification of epsilonproteobacteria in marine pelagic redox gradients, Environ. Microbiol., 15, 1505–1513, 2013.
Casciotti, K. L. and Buchwald, C.: Insights on the marine microbial nitrogen cycle from isotopic approaches to nitrification, Front. Microbiol., 3, 356, https://doi.org/10.3389/fmicb.2012.00356, 2012.
Casciotti, K. L., Sigman, D. M., Hastings, M. G., Böhlke, J. K., and Hilkert, A.: Measurement of the oxygen isotopic composition of nitrate in seawater and freshwater using the denitrifier method, Anal. Chem., 74, 4905–4912, https://doi.org/10.1021/ac020113w, 2002.
Casciotti, K. L., Sigman, D. M., and Ward, B. B.: Linking diversity and stable isotope fractionation in ammonia-oxidizing bacteria, Geomicrobiol. J., 20, 335–353, https://doi.org/10.1080/01490450303895, 2003.
Casciotti, K. L., Forbes, M., Vedamati, J., Peters, B., Martin, T., and Mordy, C. W.: Nitrous oxide cycling in the Eastern Tropical South Pacific as inferred from isotopic and isotopomeric data, Deep-Sea Res. Pt. II, 156, 155–167, https://doi.org/10.1016/J.DSR2.2018.07.014, 2018.
Cohen Y. and Gordon L. I.: Nitrous Oxide Production in the Ocean, J. Geophys. Res.: Ocean, 84, 347–353, https://doi.org/10.1029/JC084iC01p00347, 1979.
Dalsgaard, T., De Brabandere, L., and Hall, P. O.: Denitrification in the water column of the central Baltic Sea, Geochim. Cosmochim. Ac., 106, 247–260, https://doi.org/10.1016/j.gca.2012.12.038, 2013.
Dellwig, O., Wegwerth, A., and Arz, H.W.: Anatomy of the Major Baltic Inflow in 2014: Impact of manganese and iron shuttling on phosphorus and trace metals in the Gotland Basin, Baltic Sea, Cont. Shelf Res., 223, 104449, https://doi.org/10.1016/j.csr.2021.104449, 2021.
Farías, L., Castro-González, M., Cornejo, M., Charpentier, J. J., Faúndez, J., Boontanon, N., and Yoshida, N.: Denitrification and nitrous oxide cycling within the upper oxycline of the eastern tropical South Pacific oxygen minimum zone, Limnol. Oceanogr., 54, 132–144, https://doi.org/10.4319/lo.2009.54.1.0132, 2009.
Flückiger, J., Dällenbach, A., Blunier, T., Stauffer, B., Stocker, T. F., Raynaud, D., and Barnola, J. M.: Variations in atmospheric N2O concentration during abrupt climatic changes, Science, 285, 227–230, 1999.
Frame, C. H. and Casciotti, K. L.: Biogeochemical controls and isotopic signatures of nitrous oxide production by a marine ammonia-oxidizing bacterium, Biogeosciences, 7, 2695–2709, https://doi.org/10.5194/bg-7-2695-2010, 2010.
Frey, C., Dippner, J. W., and Voss, M.: Close coupling of N-cycling processes expressed in stable isotope data at the redoxcline of the Baltic Sea, Global Biogeochem. Cy., 28, 974–991, https://doi.org/10.1002/2013GB004642, 2014a.
Frey, C., Hietanen, S., Jürgens, K., Labrenz, M., and Voss, M.: N and O Isotope Fractionation in Nitrate during Chemolithoautotrophic Denitrification by Sulfurimonas gotlandica, Environ. Sci. Technol., 48, 13229–13237, https://doi.org/10.1021/es503456g, 2014b.
Fujii A., Toyoda S., Yoshida O., Watanabe S., Sasaki K., and Yoshida N.: Distribution of nitrous oxide dissolved in water masses in the eastern subtropical North Pacific and its origin inferred from isotopomer analysis, J. Ocean., 69, 147–157, https://doi.org/10.1007/s10872-012-0162-4, 2013.
Grabb, K.C., Buchwald, C., Hansel, C. M., and Wankel, S. D.: A dual nitrite isotopic investigation of chemodenitrification by mineral-associated Fe (II) and its production of nitrous oxide, Geochim. Cosmochim. Acta, 196, 388–402, https://doi.org/10.1016/j.gca.2016.10.026, 2017.
Grasshoff, K., Kremling, K., and Ehrhardt, M.: Methods of seawater analysis, John Wiley & Sons, ISBN 9783527613984, https://doi.org/10.1002/9783527613984, 1999.
Gräwe, U., Naumann, M., Mohrholz, V., and Burchard, H.: Anatomizing one of the largest saltwater inflows into the Baltic Sea in December 2014, J. Geophys. Res.-Oceans, 120, 7676–7697, https://doi.org/10.1002/2015JC011269, 2015.
Hannig, M., Lavik, G., Kuypers, M. M. M., Woebken, D., Martens-Habbena, W., and Jürgens, K.: Shift from denitrification to anammox after inflow events in the central Baltic Sea, Limnol. Oceanogr., 52, 1336–1345, 2007.
Hansson, M., Viktorsson, L., and Andersson, L.: Oxygen survey in the Baltic Sea 2019 – Extent of Anoxia and Hypoxia 1960–2019, Report Oceanography No. 67, SMHI, Göteborg, Sweden, 88 pp., https://www.smhi.se/polopoly_fs/1.158362!/RO_67.pdf (last access: 25 March 2024), 2020.
Happel, E., Bartl, I., Voss, M., and Riemann, L.: Extensive nitrification and active ammonia oxidizers in two contrasting coastal systems of the Baltic Sea, Environ. Microbiol., 20, 2913–2926, https://doi.org/10.1111/1462-2920.14293, 2018.
Ho, L., Barthel, M., Harris, S., Vermuelen, K., Six, J., Bodé, S., Boeckx, P., and Goethals, P.: Unravelling spatiotemporal N2O dynamics in an urbanized estuary system using natural abundance isotopes, Water Research, 247, 120771, https://doi.org/10.1016/j.watres.2023.120771, 2023.
Hylén, A., Bonaglia, S., Robertson, E., Marzocchi, U., Kononets, M., and Hall, P. O. J.: Enhanced benthic nitrous oxide and ammonium production after natural oxygenation of long-term anoxic sediments, Limnol. Oceanogr., 67, 419–433, https://doi.org/10.1002/lno.12001, 2022.
IPCC, Masson-Delmotte, V., Zhai, P., Pirani, A., Connors, S. L., Péan, C., Berger, S., Caud, N., Chen, Y., Goldfarb, L., Gomis, M. I., Huang, M., Leitzell, K., Lonnoy, E., Matthews, J. B. R., Maycock, T. K., Waterfield, T., Yelekçi, O., Yu, R., and Zhou, B. (Eds.): Climate Change 2021: The Physical Science Basis. Contribution of Working Group I to the Sixth Assessment Report of the Intergovernmental Panel on Climate Change, Cambridge University Press, Cambridge, UK and New York, NY, USA, 2391 pp., https://doi.org/10.1017/9781009157896, 2021.
Jäntti, H., Ward, B. B., Dippner, J. W., and Hietanen, S.: Nitrification and the ammonia-oxidizing communities in the central Baltic Sea water column, Estuar. Coast. Shelf Sci., 202, 280–289, https://doi.org/10.1016/j.ecss.2018.01.019, 2018.
Ji, Q. and Grundle, D. S.: An automated, laser-based measurement system for nitrous oxide isotope and isotopomer ratios at nanomolar levels, Rapid Commun. Mass Sp., 33, 1553–1564, https://doi.org/10.1002/rcm.8502, 2019.
Ji, Q., Babbin, A. R., Jayakumar, A., Oleynik, S., and Ward, B. B.: Nitrous oxide production by nitrification and denitrification in the Eastern Tropical South Pacific oxygen minimum zone, Geophys. Res. Lett., 42, 10–755, 2015.
Jones, C. M., Graf, D. R., Bru, D., Philippot, L., and Hallin, S.: The unaccounted yet abundant nitrous oxide-reducing microbial community: a potential nitrous oxide sink, ISME J., 7, 417–426, 2013.
Keeling, C. D.: The concentration and isotopic abundance of carbon dioxide in rural and marine air. Geochim. Cosmochim. Ac., 24, 277–298, 1961.
Kelly, C. L., Manning, C., Frey, C., Kaiser, J., Gluschankoff, N., and Casciotti, K. L.: Pyisotopomer: A Python package for obtaining intramolecular isotope ratio differences from mass spectrometric analysis of nitrous oxide isotopocules, Rapid Commun. Mass Spectrom., 37, e9513, https://doi.org/10.1002/rcm.9513, 2023.
Knowles, R., Lean, D. R. S., and Chan, Y. K.: Nitrous oxide concentrations in lakes: variations with depth and time, Limnol. Oceanogr., 26, 855–866, 1981.
Körner, H. and Zumft, W. G.: Expression of denitrification enzymes in response to the dissolved oxygen level and respiratory substrate in continuous culture of Pseudomonas stutzeri, Appl. Environ. Microbiol., 55, 1670–1676, 1989.
Labrenz, M., Jost, G., and Jürgens, K.: Distribution of abundant prokaryotic organisms in the water column of the central Baltic Sea with an oxic–anoxic interface, Aquat. Microb. Ecol., 46, 177–190, 2007.
Lewicka-Szczebak, D., Well, R., Bol, R., Gregory, A. S., Matthews, G. P., Misselbrook, T., Whalley, W. R., and Cardenas, L. M.: Isotope fractionation factors controlling isotopocule signatures of soil-emitted N2O produced by denitrification processes of various rates, Rapid Commun. Mass Spectrom., 29, 269–282, 2015.
Li,S., Wang, S., Pang, Y., and Ji, G: Isotopic signature of N2O produced during sulfur- and thiosulfate-driven chemoautotrophic denitrification in freshwaters, Limnol. Oceanogr., 69, 2639–2650, 2024.
Liblik, T., Naumann, M., Alenius, P., Hannson, M., Lips, U., Nausch, G., Tuomi, L., Wesslander, K., Laanemets, J., and Viktorrsson, L.: Propagation of impact of the recent Major Baltic inflows from the Eastern Gotland Basin to the Gulf of Finland, Front. Mar. Sci., 5, 1–23, https://doi.org/10.3389/fmars.2018.00222 , 2018.
Lipschultz, F., Zafiriou, O. C., Wofsy, S. C., McElroy, M. B., Valois, F. W., and Watson, S. W.: Production of NO and N2O by soil nitrifying bacteria, Nature, 294, 641–643, 1981.
Ma, X., Lennartz, S. T., and Bange, H. W.: A multi-year observation of nitrous oxide at the Boknis Eck Time Series Station in the Eckernförde Bay (southwestern Baltic Sea), Biogeosciences, 16, 4097–4111, https://doi.org/10.5194/bg-16-4097-2019, 2019.
McIlvin, M. R. and Casciotti, K. L.: Fully automated system for stable isotopic analyses of dissolved nitrous oxide at natural abundance levels, Limnol. Oceanogr. Method., 8, 54–66, https://doi.org/10.4319/lom.2010.8.54, 2010.
McIlvin, M. R. and Casciotti, K. L.: Technical updates to the bacterial method for nitrate isotopic analyses, Anal. Chem., 83, 1850–1856, https://doi.org/10.1021/ac1028984, 2011.
Meier, H. E. M., Höglund, A., Eilola, K., and Almroth-Rosell, E.: Impact of accelerated future global mean sea level rise on hypoxia in the Baltic Sea, Clim. Dynam., 49, 163–172, https://doi.org/10.1007/s00382-016-3333-y, 2017.
Meier, H. E. M., Eilola, K., Almroth-Rosell, E., Schimanke, S., Kniebusch, M., Hoglund, A., Pemberton, P., Liu, Y., Vali, G., and Saraiva, S.: Disentangling the impact of nutrient load and climate changes on Baltic Sea hypoxia and eutrophication since 1850, Climate Dynam., 53, 1145–1166, https://doi.org/10.1007/s00382-018-4296-y, 2019.
Mohn, J., Wolf, B.,Toyoda, S., Lin, C-T., Liang, M-C., Brüggemann, N., Wissel, H., Steiker, A. E., Dyckmans, J., Szwec, L., Ostrom, N. E., Casciotti, K. L., Forbes, M., Giesemann, A., Well, R., Doucett, R. R., Yarnes, C. T., Ridley, A. R., Kaiser, J., and Yoshida, N : Interlaboratory assessment of nitrous oxide isotopomer analysis by isotope ratio mass spectrometry and laser spectroscopy: Current status and perspectives, Rapid Commun. Mass Spectrom., 28, 1995–2007, https://doi.org/10.1002/rcm.6982, 2014.
Mohrholz, V.: Major Baltic inflow statistics: revised, Front. Mar. Sci., 5, 384, https://doi.org/10.3389/fmars.2018.00384, 2018.
Myllykangas, J.-P., Jilbert, T., Jakobs, G., Rehder, G., Werner, J., and Hietanen, S.: Effects of the 2014 major Baltic inflow on methane and nitrous oxide dynamics in the water column of the central Baltic Sea, Earth Syst. Dynam., 8, 817–826, https://doi.org/10.5194/esd-8-817-2017, 2017.
Naqvi, S. W. A., Yoshinari, T., Jayakumar, D., Altabet, M. A., Narvekar, P. V., Devol, A. H., Brandes, J. A., and Codispoti, L. A.: Budgetary and biogeochemical implications of N2O isotope signatures in the Arabian Sea, Nature, 394, 462–464, https://doi.org/10.1038/28828, 1998.
Naqvi, S. W. A., Jayakumar, D. A., Narvekar, P. V., Naik, H., Sarma, V. V. S. S., D'Souza, W., Joseph, S., and George, M. D.: Increased marine production of N2O due to intensifying anoxia on the Indian continental shelf, Nature, 408, 346–349, 2000.
Naqvi, S. W. A., Naik, H., Jayakumar, D. A., Shailaja, M. S., and Narvekar, P. V.: Seasonal oxygen deficiency over the western continental shelf of India, in: Past and present water column anoxia, Springer, the Netherlands, 195–224, https://doi.org/10.1007/1-4020-4297-3_08, 2006.
Nevison, C., Butler, J. H., and Elkins, J. W.: Global distribution of N2O and ΔN2O-AOU yield in the subsurface ocean, Global Biogeochem. Cy., 17, 1119, https://doi.org/10.1029/2003GB002068, 2003.
Nevison, C. D., Weiss, R. F., and Erickson III, D. J.: Global oceanic emissions of nitrous oxide, J. Geophys. Res., 100, 15809–15820, https://doi.org/10.1029/95JC00684, 1995.
Noffke, A., Sommer, S., Dale, A.W., Hall, P.O. J., and Pfannkuche, O.: Benthic nutrient fluxes in the Eastern Gotland Basin (Baltic Sea) with particular focus on microbial mat ecosystems, J. Mar. Sys., 158, 1–12, https://doi.org/10.1016/j.jmarsys.2016.01.007, 2016.
Ostrom, N. E., Russ, M. E., Popp, B., Rust, T. M., and Karl, D. M.: Mechanisms of nitrous oxide production in the subtropical North Pacific based on determinations of the isotopic abundances of nitrous oxide and di-oxygen, Chemosphere, 2, 281–290, 2000.
Ostrom, N. E., Pitt, A., Sutka, R., Ostrom, P. H., Grandy, A. S., Huizinga, K. M., and Robertson, G. P.: Isotopologue effects during N2O reduction in soils and in pure cultures of denitrifiers, J. Geophys. Res.-Biogeo., 112, 2001–2012, 2007.
Otte, J. M., Blackwell, N., Ruser, R., Kappler, A., Kleindiesnt, S., and Schmidt, C.: N2O formation by nitrite-induced (chemo)denitrification in coastal marine sediment, Scientific Reports, 9, 10691, https://doi.org/10.1038/s41598-019-47172-x, 2019.
Paulmier, A. and Ruiz-Pino, D.: Oxygen minimum zones (OMZs) in the modern ocean, Prog. Oceanogr., 80, 113–128, 2009.
Ravishankara, A. R., Daniel, J. S., and Portmann, R. W.: Nitrous oxide (N2O): The dominant ozone-depleting substance emitted in the 21st Century, Science, 326, 123–125, 2009.
Rehder, G., Bardhan, P., Frey, C., and Bange, H. W.: The distribution and isotopomeric characterization of nitrous oxide in the Eastern Gotland Basin (central Baltic Sea), Leibniz Institute for Baltic Sea Research Warnemünde, https://doi.org/10.12754/data-2026-0001, 2026.
Resplandy, L., Hogikyan, A., Müller, J. D., Najjar, R. G., Bange, H. W., Bianchi, D., Weber, T., Cai, W.-J., Doney, S. C., Fennel, K., Gehlen, M., Hauck, J., Lacroix, F., Landschützer, P., Le Quéré, C., Roobaert, A., Schwinger, J., Berthet, S., Bopp, L., Chau, T. T. T., Dai, M., Gruber, N., Ilyina, T., Kock, A., Manizza, M., Lachkar, Z., Laruelle, G. G., Liao, E., Lima, I. D., Nissen, C., Rödenbeck, C., Séférian, R., Toyama, K., Tsujino, H., and Regnier, P.: A synthesis of global coastal ocean greenhouse gas fluxes, Global Biogeochem. Cy., 38, e2023GB007803, https://doi.org/10.1029/2023GB007803, 2024.
Ronner, U.: Distribution, production and consumption of nitrous oxide in the Baltic Sea, Geochim. Cosmochim. Ac., 47, 2179–2188, 1983.
Rosentreter, J. A., Laruelle, G. G., Bange, H. W., Bianchi, T. S., Busecke, J. J. M., Cai, W.-J., Eyre, B. D., Forbrich, I., Kwon, E. Y., Maavara, T., Moosdorf, N., Najjar, R. G., Sarma, V. V. S. S., Van Dam, B., and Regnier, P.: Coastal vegetation and estuaries are collectively a greenhouse gas sink, Nature Climate Change, 13, 579–587, https://doi.org/10.1038/s41558-023-01682-9, 2023.
Rohe, L., Anderson, T., Braker, G., Flessa, H., Giesemann, A., Lewicka-Szczebak, D., Wrage-Monnig, N., and Well, R.: Dual isotope and isotopomer signatures of nitrous oxide from fungal denitrification – a pure culture study, Rapid Commun. Mass Spectrom., 28, 1893–1903, https://doi.org/10.1002/rcm.6975, 2014.
Sabbaghzadeh, B., Arévalo-Martínez, D. L., Glockzin, M., Otto, S., and Rehder, G.: Meridional and Cross-Shelf Variability of N2O and CH4 in the Eastern-South Atlantic, J. Geophys. Res.-Oceans, 126, e2020JC016878, https://doi.org/10.1029/2020JC016878, 2021.
Santoro, A. E., Buchwald, C., McIlvin, M. R., and Casciotti, K. L.: Isotopic signature of N2O produced by marine ammonia-oxidizing archaea, Science, 333, 1282–1285, 2011.
Schweiger, B., Hansen, H. P., and Bange, H. W.: A time series of hydroxylamine (NH2OH) in the southwestern Baltic Sea, Geophys. Res. Lett., 34, L24608, https://doi.org/10.1029/2007GL031086, 2007.
Schlitzer, Reiner, Ocean Data View, https://odv.awi.de (last access: 5 December 2025), 2021.
Shoun, H., Fushinobu, S., Jiang, L., Kim, S. W., and Wakagi, T: Fungal denitrification and nitric oxide reductase cytochrome P450nor, Philos. Trans. Roy. Soc., 367, 1186, https://doi.org/10.1098/rstb.2011.0335, 2012.
Stremińska, M. A., Felgate, H., Rowley, G., Richardson, D. J., and Baggs, E. M.: Nitrous oxide production in soil isolates of nitrate-ammonifying bacteria, Environ. Microbiol. Rep., 4, 66–71, 2012.
Sun, X., Jayakumar, A., and Ward, B. B.: Community composition of nitrous oxide consuming bacteria in the oxygen minimum zone of the Eastern Tropical South Pacific, Front. Microbiol., 8, 1183, https://doi.org/10.3389/fmicb.2017.01183, 2017.
Suntharalingam, P. and Sarmiento, J. L.: Factors governing the oceanic nitrous oxide distribution: Simulations with an ocean general circulation model, Global Biogeochem. Cy., 14, 429–454, 2000.
Sutka, R. L., Ostrom, N. E., Ostrom, P. H., Gandhi, H., and Breznak, J. A.: Nitrogen isotopomer site preference of N2O produced by Nitrosomonas europaea and Methylococcus capsulatus Bath, Rapid Commun. Mass Sp., 17, 738–745, https://doi.org/10.1002/rcm.968, 2003.
Sutka, R. L., Ostrom, N. E., Ostrom, P. H., Gandhi, H., and Breznak, J. A.: Nitrogen isotopomer site preference of N2O produced by Nitrosomonas europaea and Methylococcus capsulatus Bath, Rapid Comm. Mass. Spec., 18, 1411–1412, https://doi.org/10.1002/rcm.1482, 2004.
Sutka, R. L., Ostrom, N. E., Ostrom, P. H., Breznak, J. A., Gandhi, H., Pitt, A. J., and Li, F.: Distinguishing nitrous oxide production from nitrification and denitrification on the basis of isotopomer abundances, Appl. Environ. Microbiol., 72, 638–644, https://doi.org/10.1128/AEM.72.1.638, 2006.
Tang, W., Tracey, J. C., Carroll, J., Wallace, E., Lee, J. A., Nathan, L., Sun, X., Jayakumar, A., and Ward, B. B.: Nitrous oxide production in the Chesapeake Bay, Limnol. Oceanogr., 67, 2101–2116, 2022.
Tian, H., Pan, N., Thompson, R. L., Canadell, J. G., Suntharalingam, P., Regnier, P., Davidson, E. A., Prather, M., Ciais, P., Muntean, M., Pan, S., Winiwarter, W., Zaehle, S., Zhou, F., Jackson, R. B., Bange, H. W., Berthet, S., Bian, Z., Bianchi, D., Bouwman, A. F., Buitenhuis, E. T., Dutton, G., Hu, M., Ito, A., Jain, A. K., JeltschThömmes, A., Joos, F., Kou-Giesbrecht, S., Krummel, P. B., Lan, X., Landolfi, A., Lauerwald, R., Li, Y., Lu, C., Maavara, T., Manizza, M., Millet, D. B., Mühle, J., Patra, P. K., Peters, G. P., Qin, X., Raymond, P., Resplandy, L., Rosentreter, J. A., Shi, H., Sun, Q., Tonina, D., Tubiello, F. N., van der Werf, G. R., Vuichard, N., Wang, J., Wells, K. C., Western, L. M., Wilson, C., Yang, J., Yao, Y., You, Y., and Zhu, Q.: Global nitrous oxide budget (1980–2020), Earth Syst. Sci. Data, 16, 2543–2604, https://doi.org/10.5194/essd-16-2543-2024, 2024.
Toyoda, S., Mutobe, H., Yamagishi, H., Yoshida, N., and Tanji, Y.: Fractionation of N2O isotopomers during production by denitrifier, Soil Biol. Biochem., 37, 1535–1545, https://doi.org/10.1016/j.soilbio.2005.01.009, 2005.
Toyoda, S., Yoshida, N., and Koba, K.: Isotopocule analysis of biologically produced nitrous oxide in various environments, Mass Spectrometry Reviews, 36, 135–160, https://doi.org/10.1002/mas.21459, 2017.
Voss, M., Dippner, J. W., Humborg, C., Hürdler, J., Korth, F., Neumann, T., Schernewski, G., and Venohr, M.: History and scenarios of future development of Baltic Sea eutrophication, Estuar. Coast. Shelf Sci., 92, 307–322, https://doi.org/10.1016/j.ecss.2010.12.037, 2011.
Walter, S., Breitenbach, U., Bange, H. W., Nausch, G., and Wallace, D. W. R.: Distribution of N2O in the Baltic Sea during transition from anoxic to oxic conditions, Biogeosciences, 3, 557–570, https://doi.org/10.5194/bg-3-557-2006, 2006.
Wankel, S., Ziebis, W., Buchwald, C., Charoenpong, C., de Beer, D., Dentinger, J., Xu, Z., and Zengler, K.: Evidence for fungal and chemodenitrification based N2O flux from nitrogen impacted coastal sediments, Nat. Commun., 8, 15595, https://doi.org/10.1038/ncomms15595, 2017.
Ward B. B., Devol A. H., Rich J. J., Chang B. X., Bulow S. E., Naik H., Pratihary, A., and Jayakumar, A.: Denitrification as the Dominant Nitrogen Loss Process in the Arabian Sea, Nature, 461, 78–81, https://doi.org/10.1038/nature08276, 2009.
Weckström, K., Lewis, J. P., Andrén, E., Ellegaard, M., Rasmussen, P., Ryves, D. V., and Telford, R.: Palaeoenvironmental History of the Baltic Sea: One of the Largest Brackish-Water Ecosystems in the World, in: Applications of Paleoenvironmental Techniques in Estuarine Studies. Developments in Paleoenvironmental Research, edited by: Weckström, K., Saunders, K., Gell, P., and Skilbeck, C., Springer, Dordrecht, Netherlands, 615–662, https://doi.org/10.1007/978-94-024-0990-1_24, 2017.
Weiss, R. F. and Price, B. A. Nitrous oxide solubility in water and seawater, Mar. Chem., 8, 347–359, 1980.
Wenk, C. B., Frame, C. H., Koba, K., Casciotti, K. L., Veronesi, M., Niemann, H., Schubert, C., Yoshida, N., Toyoda, S., Makabe, A., Zopfi, J., and Lehmann, M. F.: Differential N2O dynamics in two oxygen-deficient lake basins revealed by stable isotope and isotopomer distributions, Limnol. Oceanogr., 61, 135–1739, 2016.
Westley, M. B., Yamagishi, H., Popp, B, N., and Yoshida, N.: Nitrous oxide cycling in the Black Sea inferred from stable isotopic and isotopomer distibutions, Deep-Sea Res., 53, 1802, https://doi.org/10.1016/j.dsr2.2006.03.012, 2006.
Wilson, S. T., Bange, H. W., Arévalo-Martínez, D. L., Barnes, J., Borges, A. V., Brown, I., Bullister, J. L., Burgos, M., Capelle, D. W., Casso, M., de la Paz, M., Farías, L., Fenwick, L., Ferrón, S., Garcia, G., Glockzin, M., Karl, D. M., Kock, A., Laperriere, S., Law, C. S., Manning, C. C., Marriner, A., Myllykangas, J.-P., Pohlman, J. W., Rees, A. P., Santoro, A. E., Tortell, P. D., Upstill-Goddard, R. C., Wisegarver, D. P., Zhang, G.-L., and Rehder, G.: An intercomparison of oceanic methane and nitrous oxide measurements, Biogeosciences, 15, 5891–5907, https://doi.org/10.5194/bg-15-5891-2018, 2018.
Wong, W. W., Lehmann, M. F., Kuhn, T., Frame, C., Poh, S. C., Cartwright, I., and Cook, P. L.: Nitrogen and oxygen isotopomeric constraints on the sources of nitrous oxide and the role of submarine groundwater discharge in a temperate eutrophic salt-wedge estuary, Limnol. Oceanogr., 66, 1068–1082, 2020.
Xu, Z., Hattori, S., Masuda, Y., Toyoda, S., Koba, K., Yu, P., Yoshida, N., Du, Z. J., and Senoo, K.: Unprecedented N2O production by nitrate-ammonifying Geobacteraceae with distinctive N2O isotopocule signatures, MBio, 15, https://doi.org/10.1128/mbio.02540-24, 2024.
Yang, S., Chang, B. X., Warner, M. J., Weber, T. S., Bourbonnais, A. M., Santoro, A. E., Kock, A., Sonnerup, R. E., Bullister, J. L., Wilson, S. T., and Bianchi, D.: Global reconstruction reduces the uncertainty of oceanic nitrous oxide emissions and reveals a vigorous seasonal cycle, PNAS, 117, 11954–11960, https://doi.org/10.1073/pnas.1921914117, 2020.
Yamagishi, H., Westley, M. B., Popp, B. N., Toyoda, S., Yoshida, N., Watanabe, S., Koba, K., and Yamanaka, Y.: Role of nitrification and denitrification on the nitrous oxide cycle in the eastern tropical North Pacific and Gulf of California, J. Geophys. Res.-Biogeo., 112, G02015, https://doi.org/10.1029/2006JG000227, 2007.
Yoshinari, T.: Nitrous oxide in the sea, Mar. Chem., 4, 189–202, 1976.
Zheng, Y., Zhan, L., Ji, Q., and Ma, X.: Seasonal isotopic and isotopomeric signatures of nitrous oxide produced microbially in a eutrophic estuary, Marine Pollution Bulletin, 204, 116528, https://doi.org/10.1016/j.marpolbul.2024.116528, 2024.