the Creative Commons Attribution 4.0 License.
the Creative Commons Attribution 4.0 License.
 | 26 Mar 2026
Interpreting carbon-water trade-offs in Daisy crop model using Pareto-based calibration
Laura Delhez
Eric Laloy
Quentin Beauclaire
Bernard Longdoz
Improving the simulation of carbon and water exchanges is crucial for reliable crop modelling under changing climate conditions. Although model calibration is a key step, optimising multiple outputs can be challenging and often reveals trade-offs between calibration objectives. We applied a Pareto-based multi-objective calibration with the Speed-constrained Multi-objective Particle Swarm Optimisation (SMPSO) algorithm to the Daisy soil–plant–atmosphere model, targeting dry matter (DM), net ecosystem exchange (NEE) and latent heat flux (LE) of winter wheat crops.
The optimal parameter set provided satisfactory results for all objectives (RMSE =0.948 t ha−1 for DM, 1.49 gC m−2 d−1 for daily NEE and 30.7 W m−2 for daily LE) but revealed singular trade-offs. The strong compromise between dry matter and NEE likely suggests wrong parameterisation and/or measurement bias, while the trade-off between NEE and LE reflects equifinality issues from evapotranspiration partitioning. Lastly, this analysis also highlighted limitations in simulating stomatal regulation during heatwave conditions, supporting the decoupling between transpiration and carbon assimilation. These findings show that Pareto-based calibration can also serve as a diagnostic tool, identifying structural weaknesses and guiding targeted improvements in process representation for more robust crop model evaluation.
- Article
(4692 KB) - Full-text XML
- BibTeX
- EndNote


Crop models are essential tools for yield forecasting and decision-making, but also for assessing the impact of climate change and understanding the complex interactions within the soil–plant–atmosphere continuum (Asseng et al., 2019). Over recent decades, they have been actively developed to account for changing environmental conditions such as rising temperature and elevated atmospheric CO2 (Timlin et al., 2024). As a result, crop models now integrate more complex approaches and detailed processes, replacing, for instance, the tipping-bucket approach with Richard's equation for soil water dynamics, or using biochemical photosynthesis models (Farquhar et al., 2001) instead of radiation-use efficiency. Biochemical models are often coupled with stomatal conductance models to jointly simulate CO2 and water fluxes (Keenan et al., 2010). Such couplings are now implemented in advanced crop models such as GECROS (Yin and van Laar, 2005) and Daisy (Plauborg et al., 2010), as well as in most terrestrial biosphere models (e.g., SiB2, ORCHIDEE, IBIS, JULES, etc.). These biosphere models have also been combined with crop models in order to improve crop development and yield predictions while accurately simulating gas exchanges. Some examples are SiBcrop (Lokupitiya et al., 2009), ORCHIDEE–STICS (de Noblet-Ducoudré et al., 2004), Agro–IBIS (Kucharik, 2003) and JULES–SUCROS (Van den Hoof et al., 2011).
In these couplings, carbon and water fluxes between vegetation and atmosphere are assumed to only be regulated by stomatal behaviour. Widely used models of stomatal conductance gs can be generally expressed as:
where Anet is the net leaf CO2 assimilation rate, f(E) is a function of environmental influences such as Vapour Pressure Deficit (VPD), g0 and g1 are parameters. When water is not limiting, plants open their stomata to maximise their carbon uptake. Conversely, they reduce their stomatal aperture under water stressed conditions, compromising between carbon assimilation and water loss (Manzoni et al., 2011). This response is often represented by a decrease of the slope parameter g1 (Zhou et al., 2013; Liu et al., 2009). However, as stomatal behaviour is influenced by multiple drivers (soil water status, atmospheric dryness, leaf temperature, etc.) which often co-exist during extreme events such as droughts or heatwaves, plant responses may sometimes be contradictory (Grossiord et al., 2020). To date, these complex interactions remain poorly understood and insufficiently represented in models (Liu et al., 2024b; Sabot et al., 2022).
In this context, where stomatal behaviour controls both carbon assimilation and water loss, model calibration requires simultaneous assessment of different outputs. Calibrating against a single output (e.g., evapotranspiration) can result in compensating errors or masking structural deficiencies (Cameron et al., 2022). Multi-objective calibration therefore provides a well-suited framework, although it presents a significant challenge due to the high-dimensional parameter space of such models, the large computational cost of search algorithms and the potentially conflicting nature of targeted objectives. Extensively used in calibration of hydrological models (e.g., Efstratiadis and Koutsoyiannis, 2010; Jahandideh-Tehrani et al., 2020; Moges et al., 2020), Multi-Objective Optimisation (MOO) algorithms aim to optimise all objectives simultaneously and explicitly handle conflicting objectives by exploring trade-offs using a Pareto-based sampling approach (Sharma and Kumar, 2022). This method allows modellers to select any points on the Pareto front, i.e., select an optimal parameter set depending on the modeller's preference (Tang et al., 2018).
Beyond identifying optimal parameter sets, Pareto-based calibration can also provide valuable insights into model behaviour. It can help detect ill-posed models, revealing structural inadequacies, missing processes, or equifinality (i.e., when multiple parameter sets provide similar results; Kollat et al., 2012; Efstratiadis and Koutsoyiannis, 2010). Recently, Harvey et al. (2023) analysed the change of the Pareto front solutions between calibration and validation sets, revealing the influence of data type and model structure. Another study used Pareto-optimal solutions as informative prior distributions to guide posterior uncertainty estimation within a Bayesian framework (Tang et al., 2018).
In this case study, five growing seasons of winter wheat, cultivated on a Belgian site, were simulated using Daisy soil–plant–atmosphere model (Hansen et al., 2012). In addition to the stomatal coupling implemented with Farquhar biochemical model (Plauborg et al., 2010), this open-source model explicitly simulates the surface energy budget. Soil water movement is described by Richards' equation while accounting for drainage pipes, which are widely installed in agricultural fields. Together, these features make Daisy suitable for studying crop yield as well as coupled carbon and water flux dynamics under current and future conditions.
In a previous paper, we identified key parameters controlling crop yield, energy and carbon fluxes and discussed the implications of contrasting water conditions on sensitivity analysis results (Delhez et al., 2025). The objective of this follow-up study was twofold: to improve the simulation of biomass, carbon and water fluxes through calibration, and to explore the trade-offs between these outputs. To this end, we applied a swarm-based MOO algorithm called Speed-constrained Multi-objective Particle Swarm Optimisation (SMPSO) targeting dry matter of vegetation organs (DM), Net CO2 Ecosystem Exchange (NEE) and latent heat flux (LE). Accurate simulation of these variables is essential for food production assessments and for quantifying crop carbon and water budgets. Furthermore, analysing trade-offs, particularly between carbon (NEE) and water (LE) fluxes, could reveal potential limitations in their coupled representation within the model.
2.1 Case study
The study site is a 12 ha cropland located in Lonzée, Belgium, with a temperate maritime climate ( °C and annual precipitation of 716 mm). Cultivated for more than 85 years on a silt loam soil, this site has been equipped with an eddy covariance monitoring system and a micrometeorological station since 2004, as a part of the Fluxnet network. Since 2017, this monitoring site has integrated the ICOS network as a Level 2 station named BE-Lon (https://www.icos-cp.eu/, last access: 5 June 2025).
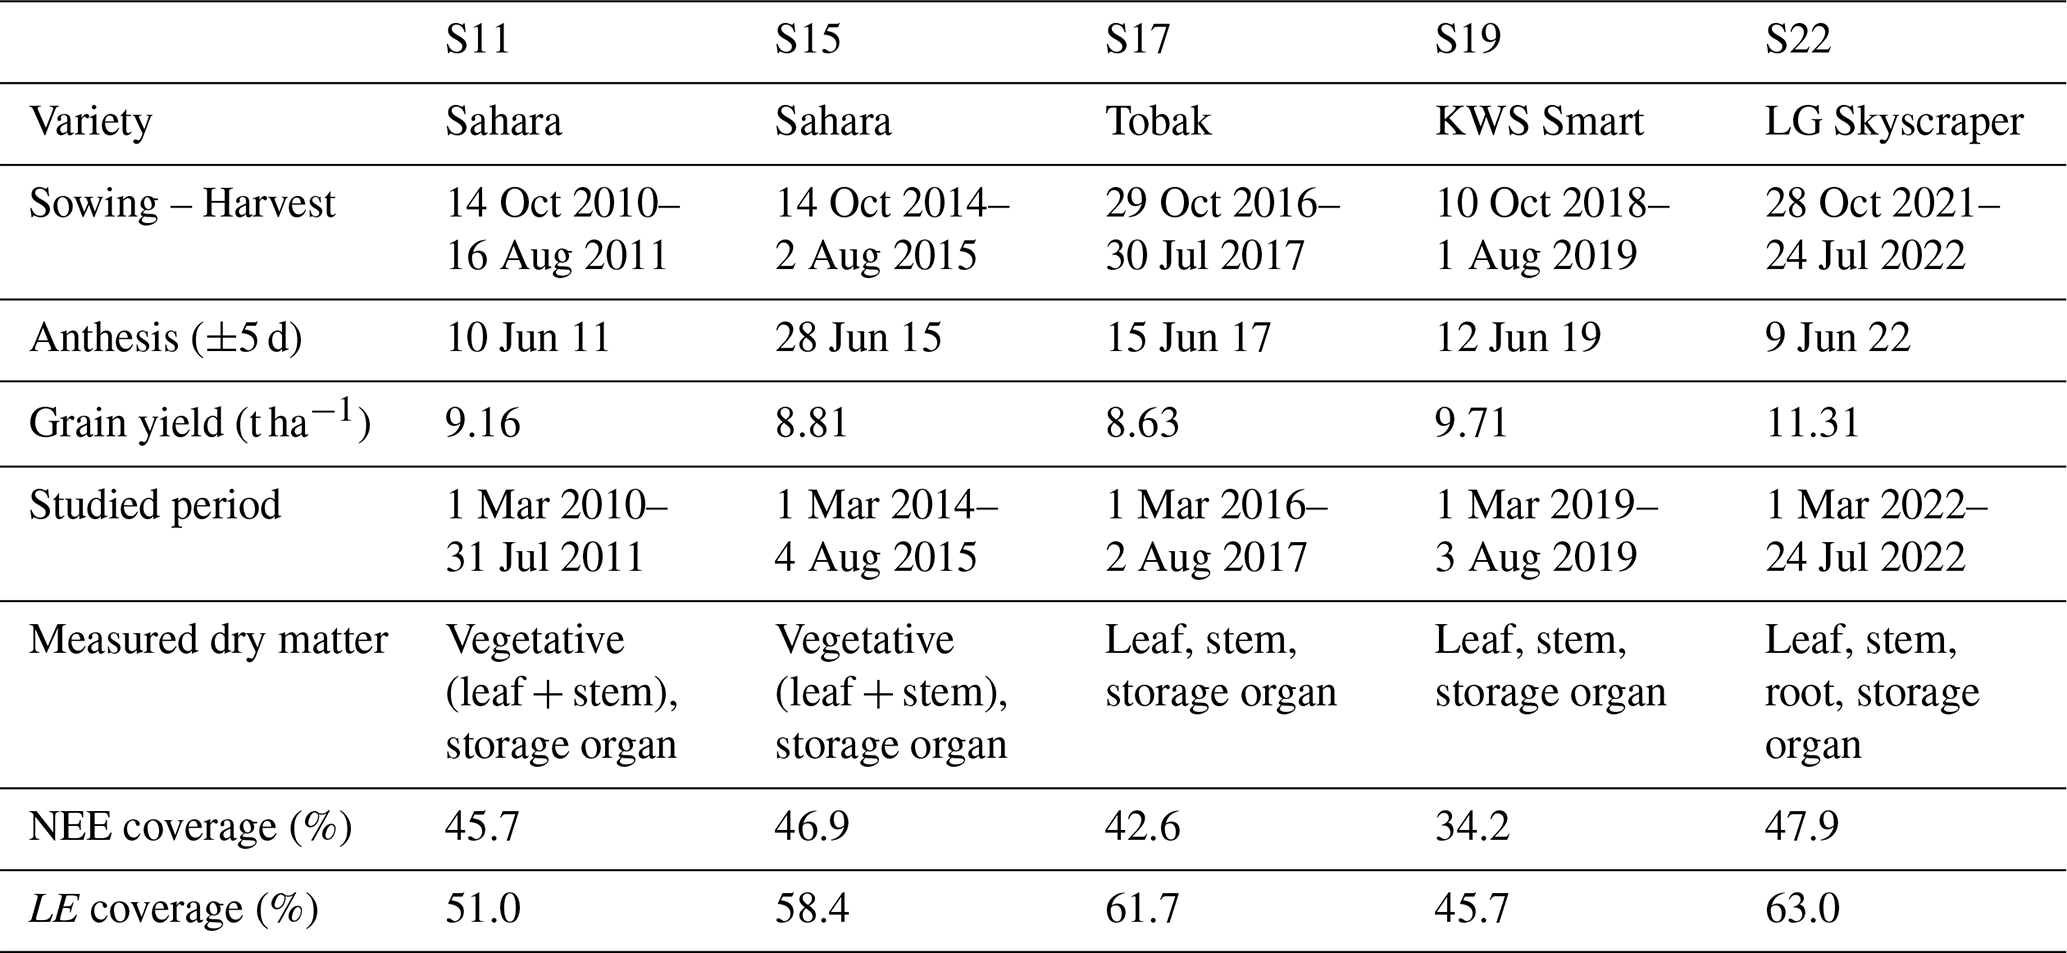
This study focuses on five growing seasons of winter wheat (Triticum aestivum L.) which are summarised in Table 1. Sown in late October, varieties from S17 and S22 are known to reach heading and maturity stages faster than Sahara and Smart cultivars (Meza et al., 2018, 2023). As the same cultivar was sown during S11 and S15, S11 was selected for the validation. During these five seasons, regular measurements of biomass were performed along with continuous measurements of NEE and LE. These flux data were corrected for frequency losses and filtered for low turbulence and nonstationary conditions, contributing to high-quality coverage detailed in Table 1. Flux data treatment is described in De Ligne et al. (2010) and Pastorello et al. (2020). Data collection (fluxes, biomass and soil) as well as additional information on the site, measurements, or management activities can be found in Delhez et al. (2025).
Table 1Summary of winter wheat crops in BE-Lon. Coverage of NEE and LE corresponds to the fraction of high-quality hourly data during the calibration period.
2.2 Daisy model
2.2.1 Model description and set-up
Daisy is a crop process-based model simulating carbon, nitrogen and water cycles of the soil–vegetation–atmosphere continuum. Initially published by Hansen et al. (1991), Daisy has since been extensively described (Abrahamsen and Hansen, 2000; Hansen et al., 2012), developed (Plauborg et al., 2010; Holbak et al., 2021), evaluated and compared (Palosuo et al., 2011; Tenreiro et al., 2020; Yin et al., 2020) in the literature. Different modelling options are included in Daisy and must be selected by the modeller depending on the objectives and data availability.
In the present study, the 1D version of Daisy was used with an hourly time resolution. Hourly measurements of air temperature, air vapour pressure, global radiation, wind strength and precipitation were provided as inputs. Water movement in unsaturated soil is described by Richard's equation and, for each soil layer, retention and conductivity curves have been established with the Mualem–van Genuchten model (Mualem, 1976; van Genuchten, 1980). Water drains, located at 70 cm depth in BE-Lon, were explicitly considered (Delhez et al., 2025). Below the soil profile, there is an aquitard layer (i.e., water blocking layer) and an aquifer whose pressure varies according to water table depth measurements also provided as inputs. Potential evapotranspiration is estimated with the FAO56 Penman-Monteith equation, using the reference evapotranspiration (ET0) adjusted to surface cover through bare soil and crop coefficients (Allen et al., 1998; 2006). Water can be evaporated from free water surfaces (canopy interception or ponding), from soil surface or transpired by plants. Actual soil evaporation is governed by the soil hydraulic conductivity, as soil water must be transported to the soil surface, and limited by the potential evaporation. As for the actual transpiration, it is computed together with the entire surface energy balance within the soil–vegetation–atmosphere transfer (SVAT) module (Plauborg et al., 2010). To numerically solve this energy balance, the SVAT module is coupled with the biochemical photosynthesis model of de Pury and Farquhar (1997) and a stomatal conductance empirical model (Eq. 1). In this version, the stomatal conductance gs is based on Leuning (1995) and adjusted to account for hydraulic signalling (Plauborg et al., 2010):
where Cs is the CO2 concentration at the leaf surface, Γ is the CO2 compensation point, VPD is the vapour pressure deficit at the leaf surface, ψc is the crown water potential (with the related parameter δ) and g0, g1 and D0 are Leuning parameters.
Compared to Daisy v7.0.7, several modifications related to the diffuse radiation, maintenance respiration and carbon reserve remobilisation were made (Appendix A) and later integrated into the latest version (v7.1.0).
2.2.2 Model parameters
In our global sensitivity analysis performed on yield, NEE and LE, we demonstrated the significant influence of about 25 parameters out of 200 (Delhez et al., 2025). However, some adjustments to our selection have been made for this present work. The influential parameters related to the phenology, the allocation and the diffuse fraction of solar radiation have already been estimated separately, as direct measurements are carried out at BE-Lon station. Additionally, the temperature scaling constant c_Vm and the leaf RuBisCO-N fraction were discarded and set to their default value because of their high correlation with other parameters. Conversely, some parameters were added as this study takes new processes into account, such as the photosynthetic contribution of stem and storage organs. Hence, there are 22 parameters included in this study, all described in Table 2. Half of these parameters were considered to be cultivar-specific, while the others are site-specific.
Table 2Model parameters used in this study and their acceptable range.
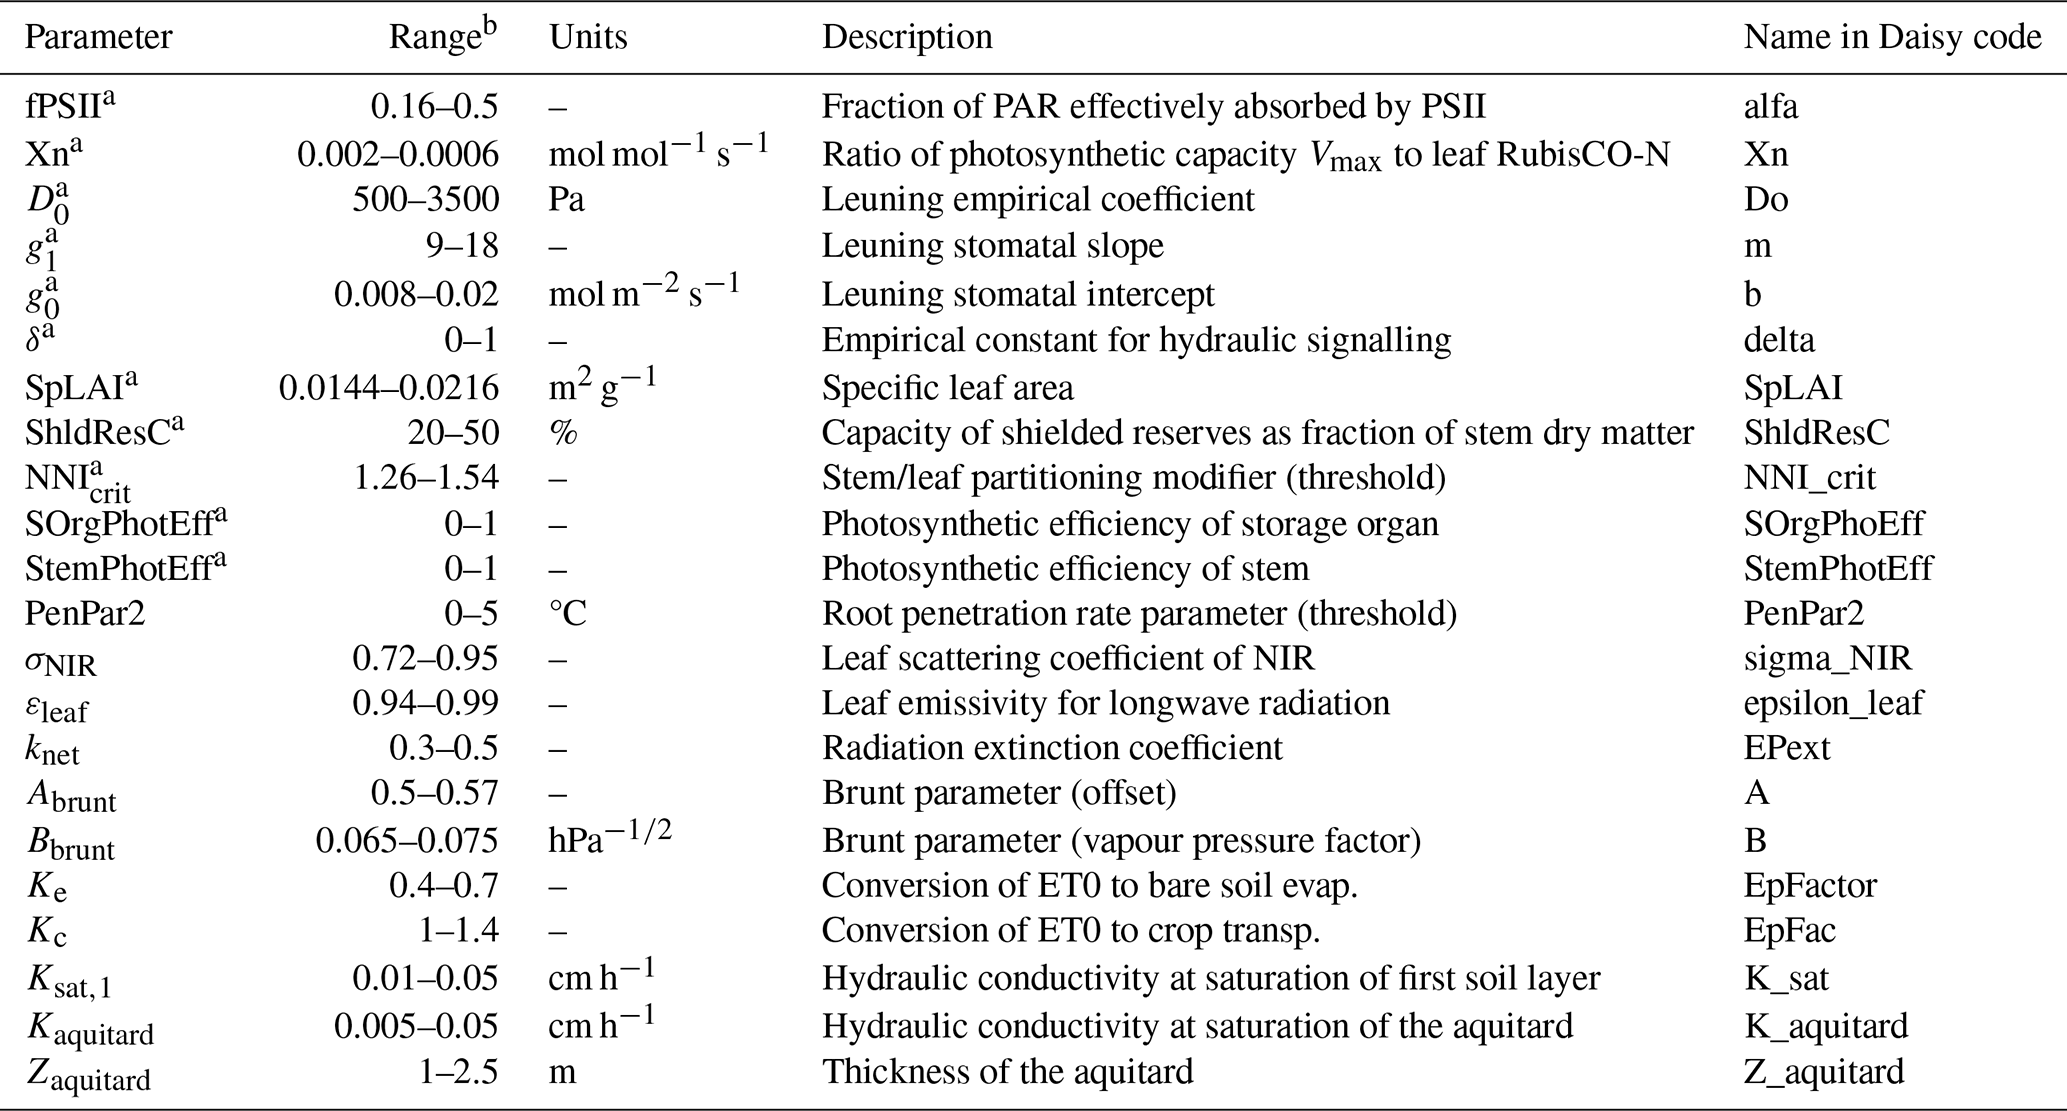
a Parameter estimated separately for each growing season (cultivar-specific). b The acceptable ranges were established from measurements, literature and the Daisy reference manual.
2.3 Multi-objective calibration
2.3.1 Key concepts
Calibrating model parameters while considering multiple objectives simultaneously can be formulated as a minimisation problem (Eq. 3):
where x is a vector of model parameters to be optimised and fi represents the objective functions. In this study, the objective functions correspond to the relative root mean square error (rRMSE) between modelled and observed values (Eq. 4):
Here, yk and dk denote the modelled and observed values at time step k for DM (i=1), NEE (i=2) and LE (i=3). Normalising the RMSE by the mean of observed data in Eq. (4) enables fair comparison across variables of different scales.
As these objectives can be conflicting, the minimisation problem defined in Eq. (3) typically results in a set of trade-off solutions known as the Pareto-optimal set, rather than a single solution (Deb, 2001). In this configuration, improving one objective cannot occur without degrading at least one of the others. For this reason, these solutions are also referred to as non-dominated solutions. Visualising these non-dominated solutions in the objective space, referred to as the Pareto front, helps to assess the relationship among objectives and identify model structural errors (Efstratiadis and Koutsoyiannis, 2010).
2.3.2 Search algorithm – SMPSO
Particle Swarm Optimisation (PSO) is a population-based optimisation technique inspired by the social behaviour of birds within a flock (Kennedy and Eberhart, 1995). Each potential solution, called a particle i, is characterised by its position and velocity, and a swarm is defined as the population of particles. Aiming to minimise the objective, the particle moves through the search space, balancing between personal exploration (local optimum) and social learning from the swarm (global optimum; Sharma and Kumar, 2022). The updated position of a particle is determined by Eq. (5):
where is the updated velocity which explicitly expresses the balance between personal and social learning:
In Eq. (6), is the best position that particle i has visited, is the best position that the entire swarm has visited (leader), w is the inertia weight controlling the influence of past velocities, r1 and r2 are random numbers drawn from the uniform distribution U(0,1), and c1 and c2 are learning factors determining the relative influence of personal and global experience.
In this study, we employed the Speed-constrained Multi-objective Particle Swarm Optimisation (SMPSO) algorithm, which is specifically designed for multi-objective problems (Nebro et al., 2009). Based on the OMOPSO algorithm (Sierra and Coello Coello, 2005), SMPSO also uses Pareto dominance (Sect. 2.3.1) and a crowding factor to identify non-dominated solutions. Moreover, it includes a velocity constriction mechanism to prevent the so-called swarm explosion effect, an external archive to store these non-dominated solutions, and the use of polynomial mutation. As suggested by Nebro et al. (2009), the learning factors c1 and c2 were drawn from the distribution U(1.5,2.5) and the mutation probability was set as the inverse of the problem's dimensionality.
2.3.3 Application
The Python-based framework for MOO called jMetalPy (Benítez-Hidalgo et al., 2019) includes the SMPSO algorithm and was used in combination with PyDaisy library. For each parameter set (i.e., potential solution) generated by SMPSO, the parameter values were transcribed into Daisy setup files. These include cultivar-specific parameters, with possibly different values for each season, and site-specific parameters that are shared (Table 2). Hence, the model was executed four times, specifically for S15, S17, S19 and S22. The three objective functions (rRMSE) were then computed from these four aggregated runs and passed back to the SMPSO algorithm. Throughout the optimisation process, the hypervolume indicator (referred to as the size of the dominated space) was estimated to evaluate the performance of SMPSO and check for convergence (Guerreiro et al., 2021; Shang et al., 2021). In total, 50 000 model simulations were performed with a swarm size of 200 particles.
2.4 Validation
As mentioned in Sect. 2.1, S11 was not used for this multi-objective calibration but kept for validation. Parameter sets were selected from the Pareto front established with the SMPSO algorithm, and cultivar-specific parameters were taken from S15 as the same cultivar was sown during both seasons. In order to evaluate the performance of Daisy model, four criteria were estimated: (i) the RMSE expressed in the same units as the variable of interest, (ii) the rRMSE for comparison within calibration results, (iii) the Normalised Mean Error (NME) revealing bias and (iv) the model efficiency (EF) which is a normalised metric. This last criterion is also known as Nash–Sutcliffe Efficiency coefficient (NSE) and is computed as follows:
In Eq. (7), yk and dk denote the modelled and observed values at time step k, and is the mean observed value. The model is perfect when EF = 1, while model predictions are as accurate as the mean of observations when EF = 0, which is easily interpreted. The validation results are considered acceptable if EF is greater than 0.5 (Dumont et al., 2014).
3.1 Pareto front
Non-dominated solutions based on the three objective functions are depicted in Fig. 1a. The red point indicates the most balanced compromise, defined as the non-dominated solution nearest to the point representing the lowest values across all objectives. The trade-off between DM and NEE is the most clearly defined, as shown in the 2D projection (Fig. 1b), where the curved Pareto front extends over a large part of the objective space. This 2D front portrays 29 % of the solutions from Fig. 1a, and the other solutions (grey crosses) mainly lie along it. Conversely, the LE–NEE front appears angular and narrower, particularly along the LE axis (Fig. 1c). Combined with the relatively high rRMSE, it highlights the difficulty in accurately simulating observed LE as well as the limited model responsiveness for this objective.
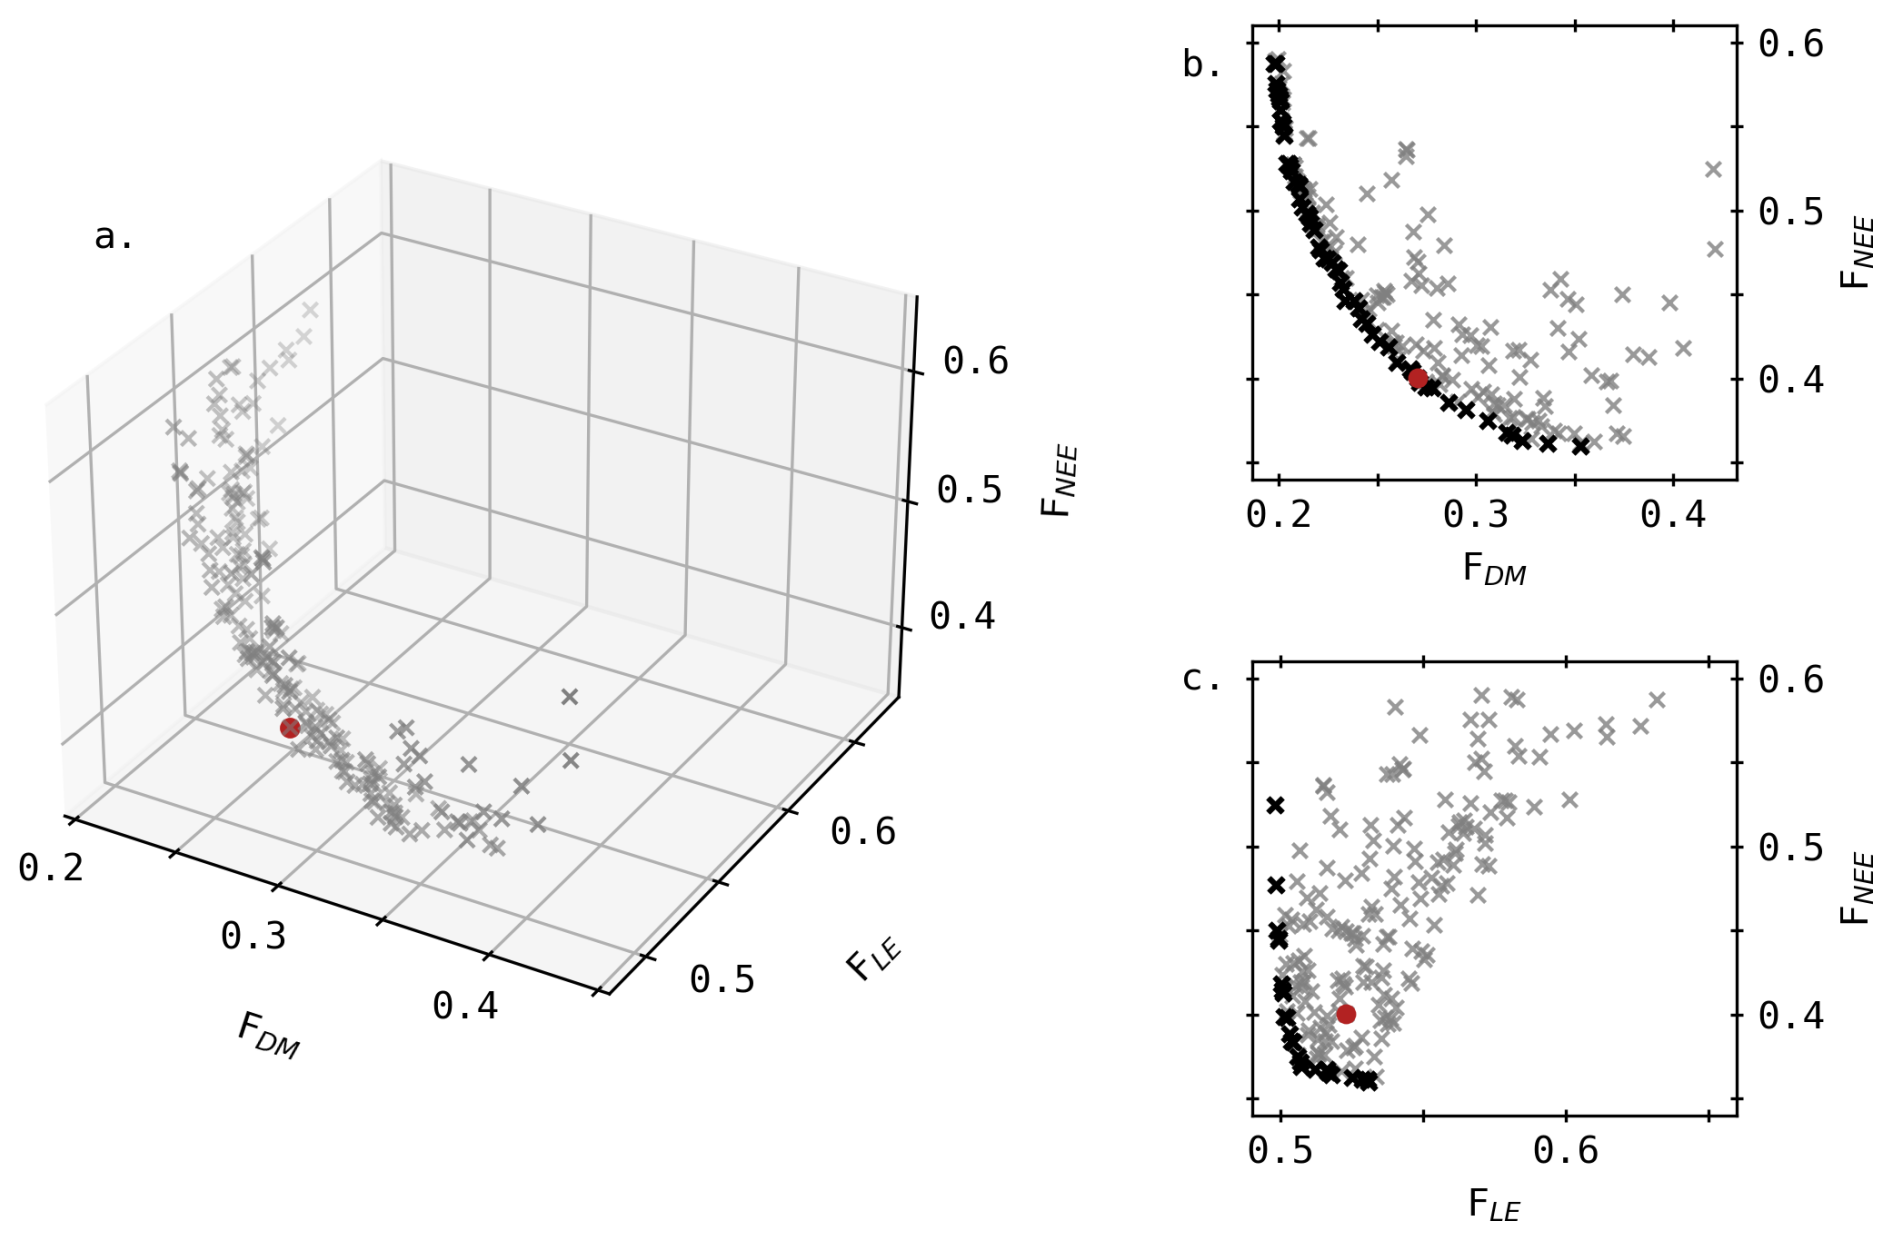
Figure 1Non-dominated solutions in the objective space: (a) 3D Pareto front according to the rRMSE of DM, LE and NEE, and 2D projection of these solutions considering (b) DM and NEE, (c) LE and NEE. Black dots indicate the Pareto front in 2D space, and the red point highlights the most balanced compromise.
Values of the most balanced parameter set (i.e., red point) can be found in Appendix B (Table B1) along with algorithm convergence indicator (Fig. B1). In Fig. 1a, the specific coordinates of this point are (0.27, 0.40, 0.52) which correspond to RMSE values of 0.948 t ha−1, 3.44 µmol m−2 s−1 and 62.7 W m−2 for DM, NEE and LE respectively, computed across all four growing seasons. In the following sections, the simulated outputs using this parameter set are compared to observed values in terms of dry matter as well as carbon and water fluxes.
3.2 Dry matter
In addition to the biomass of individual simulated organs (leaf, stem, storage organs (SOrg) and root), the aboveground vegetative biomass (leaf + stem) was also included in Fig. 2 as distinct measurements of these two organs were not systematic (Table 1). Overall, the simulated dry matter aligns relatively well with observations. Nevertheless, SOrg biomass is consistently underestimated at the end of all growing seasons, resulting in a lower simulated crop yield. Although not shown, predictions of Crop Area Index (CAI) follow a similar pattern, with greater underestimations near the end of the season.
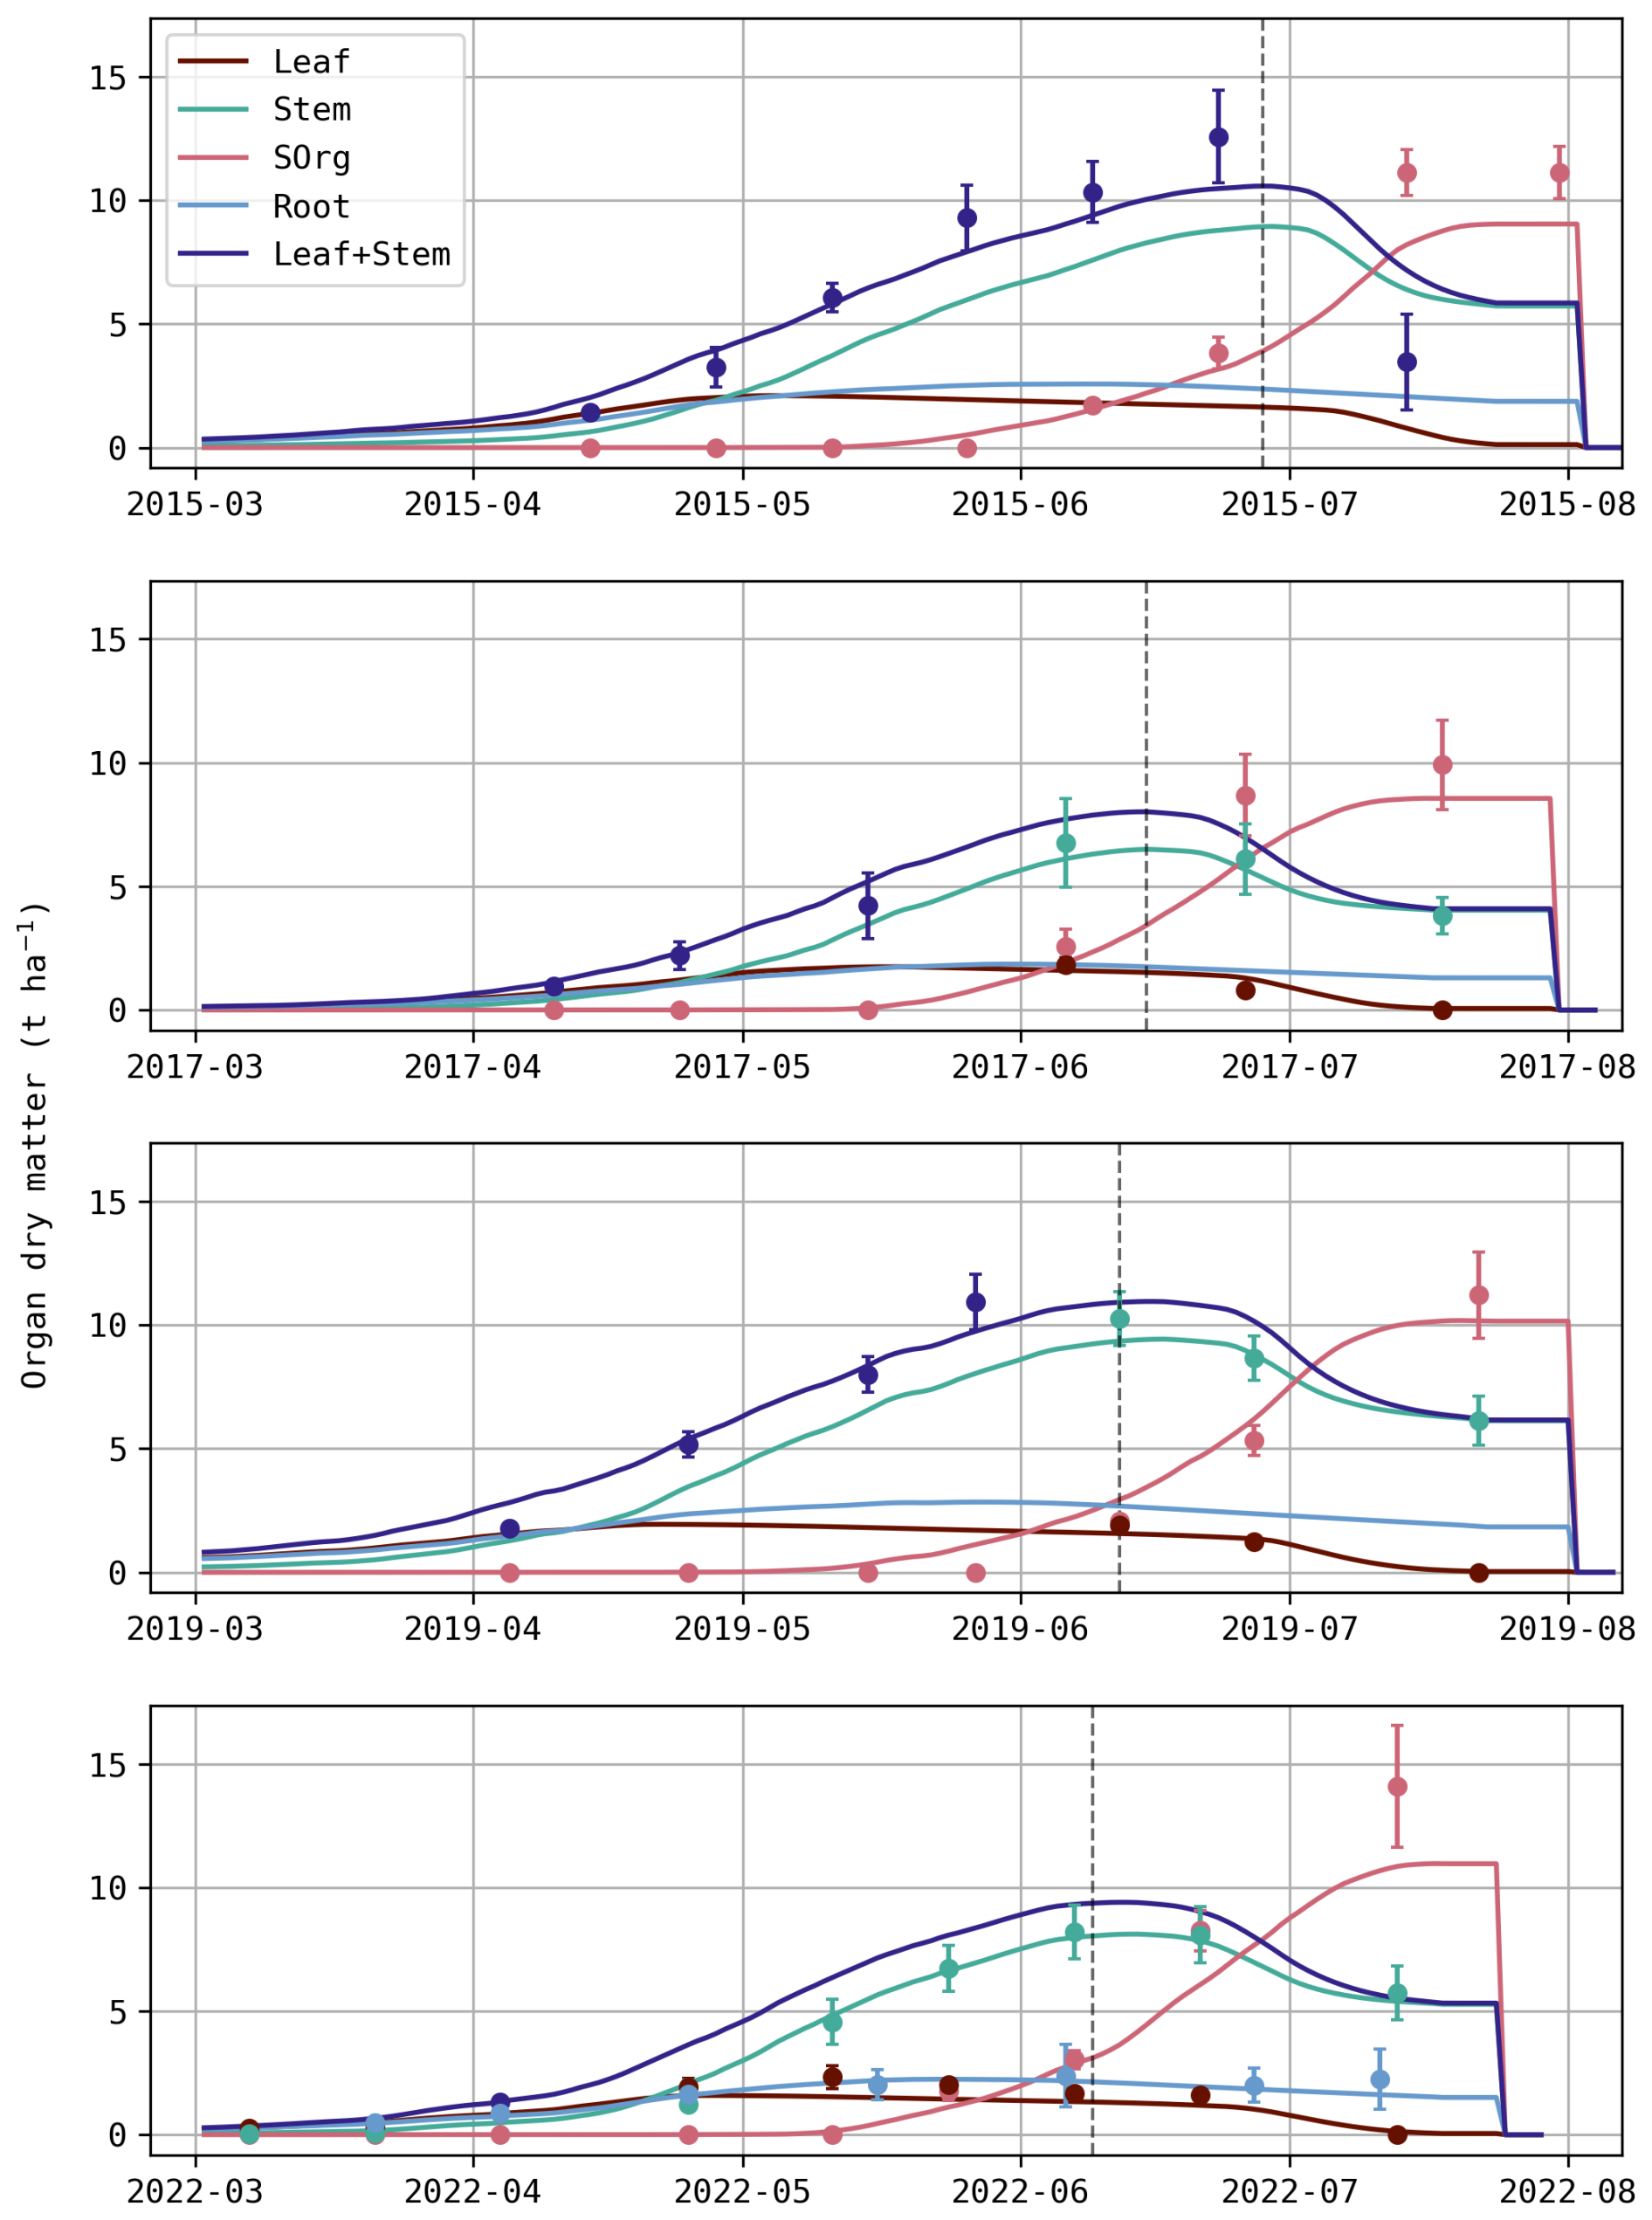
Figure 2Daily evolution of predicted (solid line) and observed (dot) dry matter for each organ (t ha−1). Error bars depicted for the observed dry matter represent the standard deviations and the dashed vertical line indicates the anthesis.
For S15, this underestimation may be attributed to insufficient remobilisation of stem reserves, as indicated by the high simulated stem biomass in July, even greater than the combined leaf and stem observations. However, this explanation does not hold for the other seasons, where stem biomass appears realistic. Beyond the capacity of remobilised reserves, parameters such as the efficiency of this remobilisation (considered fixed in Daisy) as well as contributions from stem and ear to photosynthesis (SOrgPhotEff and StemPhotEff) may also affect SOrg biomass during the reproductive stage (after anthesis).
3.3 Fluxes
As depicted in Fig. 3, simulated temporal variations follow observed trends, although predictions tend to be more negative (i.e., more CO2 uptake) during the vegetative stage. This underestimation is particularly evident for S17, also highlighted by the scatter plot, where the regression slope is significantly higher than 1 (β=1.14). This bias suggests an overestimation of photosynthesis and/or an underestimation of respiration. Despite this discrepancy, the model accurately simulates the biomass of vegetative organs during this stage. On the other hand, during the reproductive stage (when SOrg is underestimated; Fig. 2), NEE predictions no longer show a clear bias. This partly explains the observed trade-off between DM and NEE (Fig. 1b). For instance, increasing the remobilisation of stem reserves during S15 would likely result in a more accurate crop yield, but also in an undesirable increase in NEE as CO2 is released through this process.
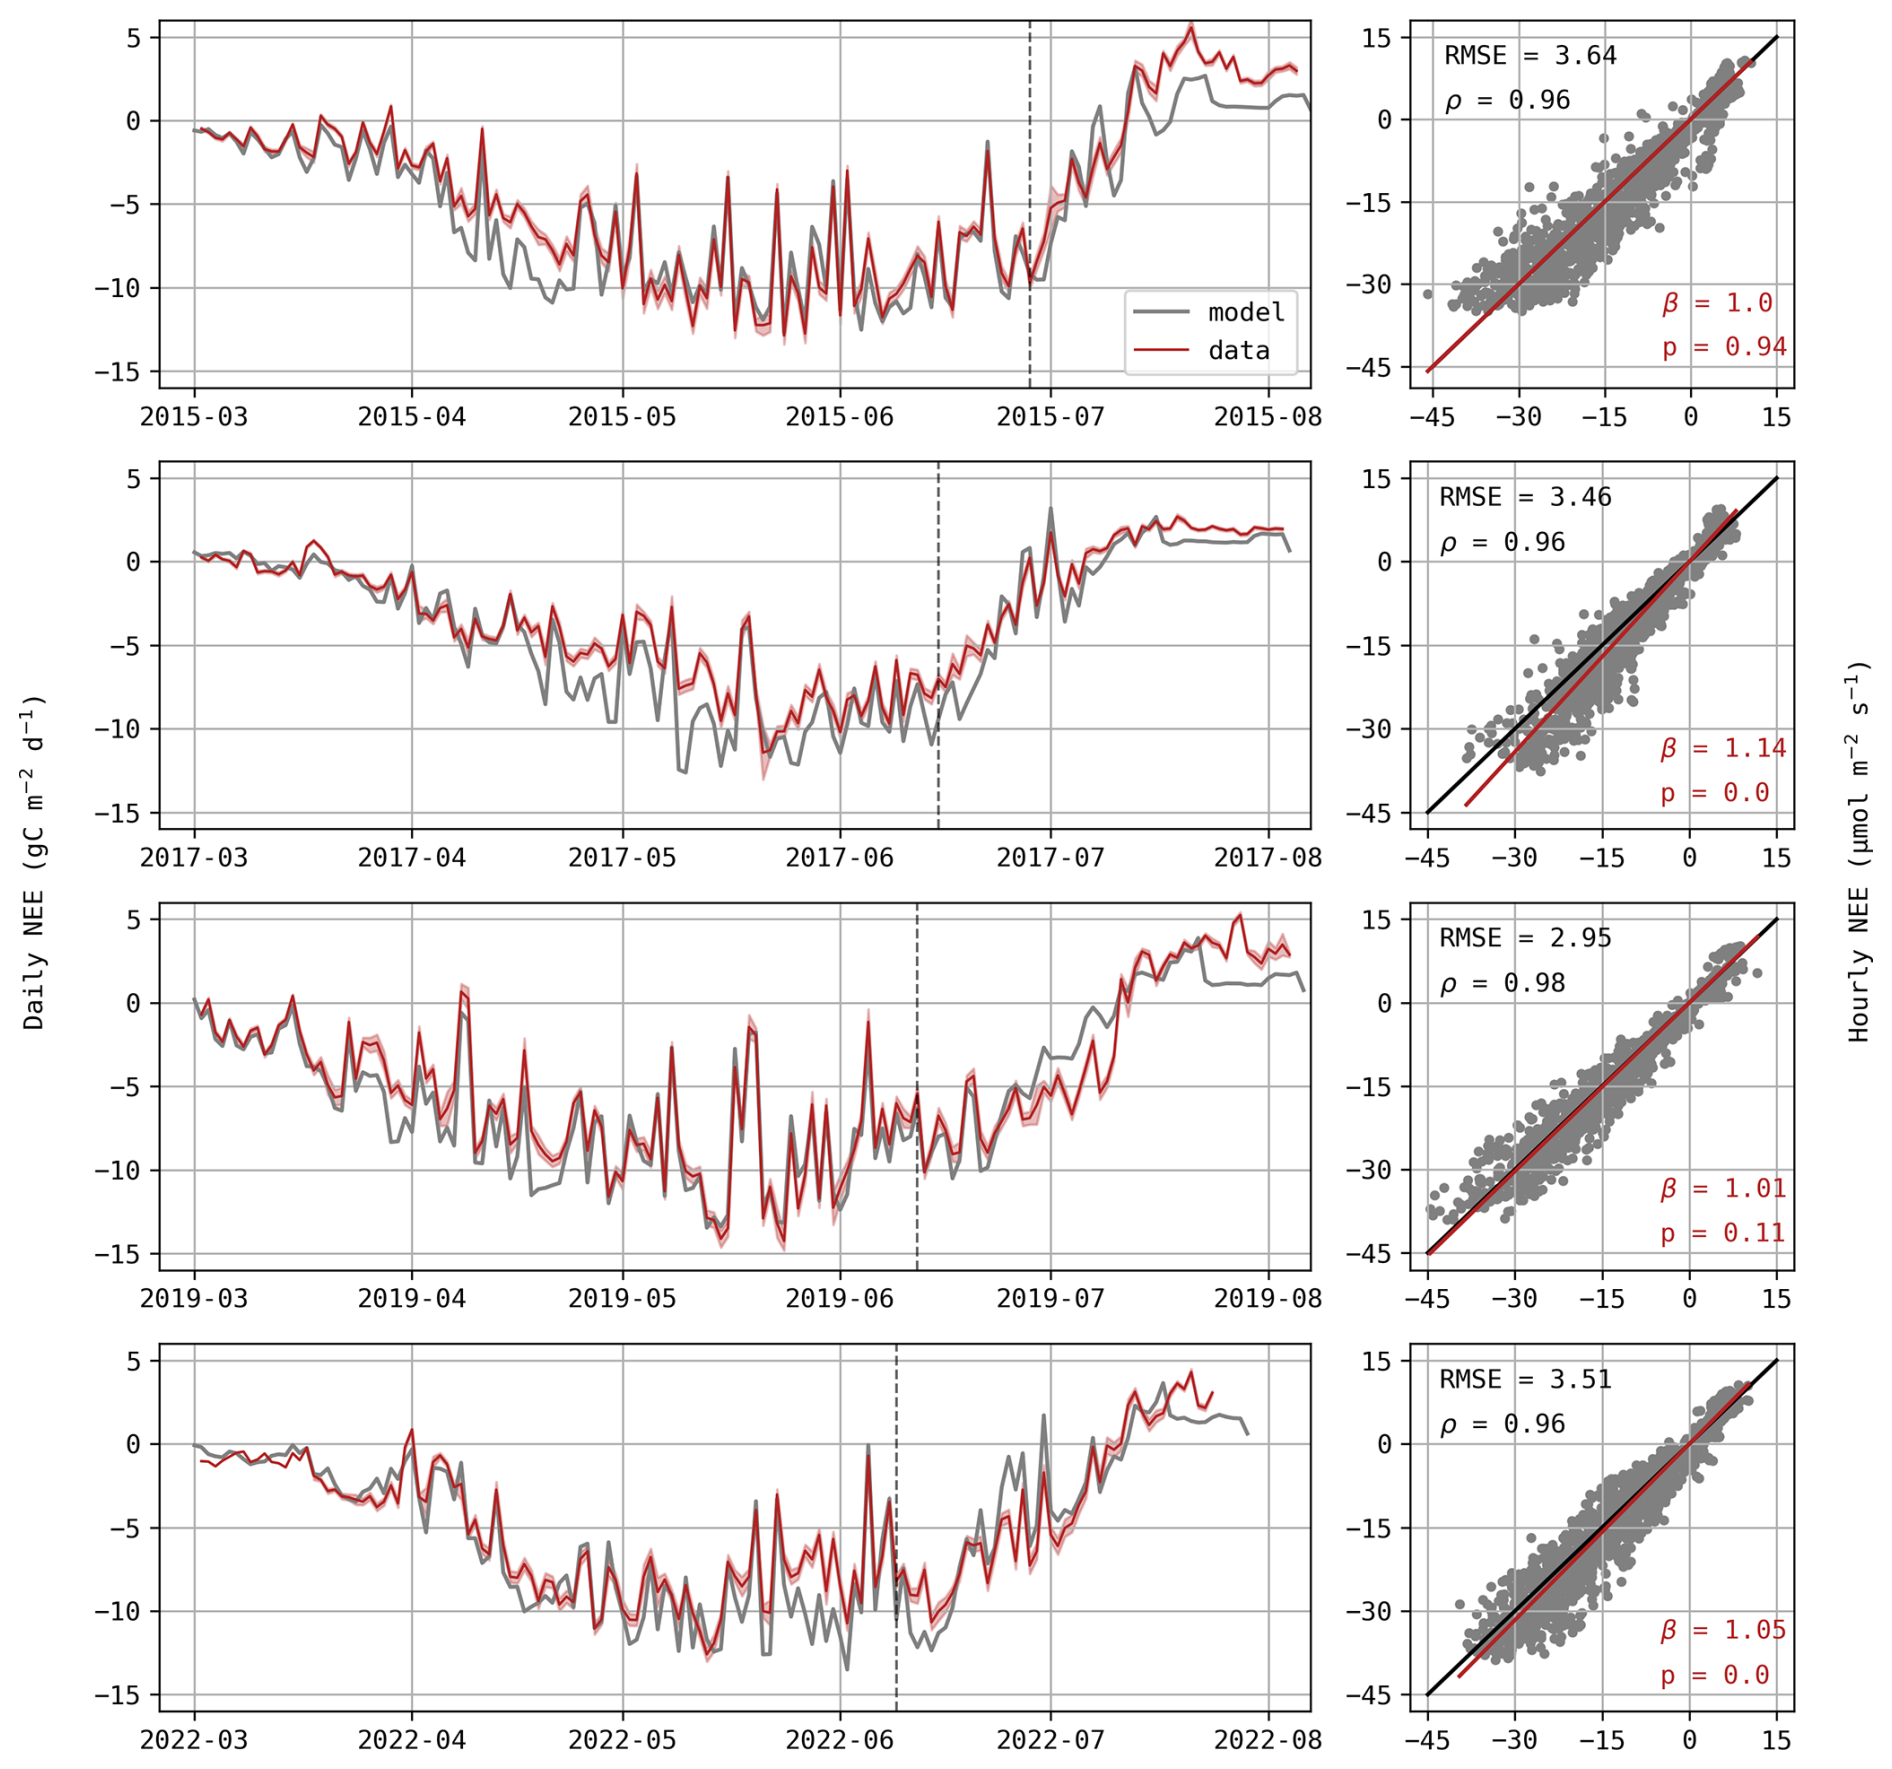
Figure 3Daily NEE (gC m−2 d−1) for each growing season (left) with the red shaded area representing standard deviations of observations. Hourly predictions against observed values of NEE (µmol m−2 s−1; right) where observed values are displayed on the x-axis. The p-value indicates if the regression slope β (red) is significantly different from the 1:1 line (black) and ρ is the Pearson correlation coefficient.
It is also worth noting that Daisy simulates a sudden decrease in NEE at the end of each season, which is not observed. When reaching maturity (DS = 2), plant processes are completely stopped, so is the autotrophic respiration. Actually, matured plants continue to respire and contribute to carbon fluxes until harvest.
As expected from the rRMSE values observed in Fig. 1, LE fluxes are not well captured by the model. Observed daily fluxes exhibit greater variations, frequently reaching high values or dropping below 50 W m−2 while simulated values remain relatively stable (Fig. 4). This is also illustrated in the scatter plots, where hourly observed data easily reach 600 W m−2, but simulated fluxes never exceed 500 W m−2, resulting in a poor linear agreement between observed and simulated fluxes as indicated by the low value of Pearson correlation coefficients ρ (Fig. 4). This disagreement is particularly visible in mid-April 2019, with an observed daily average around 150 W m−2 in comparison to a prediction of only ∼100 W m−2. During this period, simulated evapotranspiration equals potential evapotranspiration, suggesting that the plant was not water-limited and that the underestimation stems from deficiencies in energy partitioning rather than water availability.
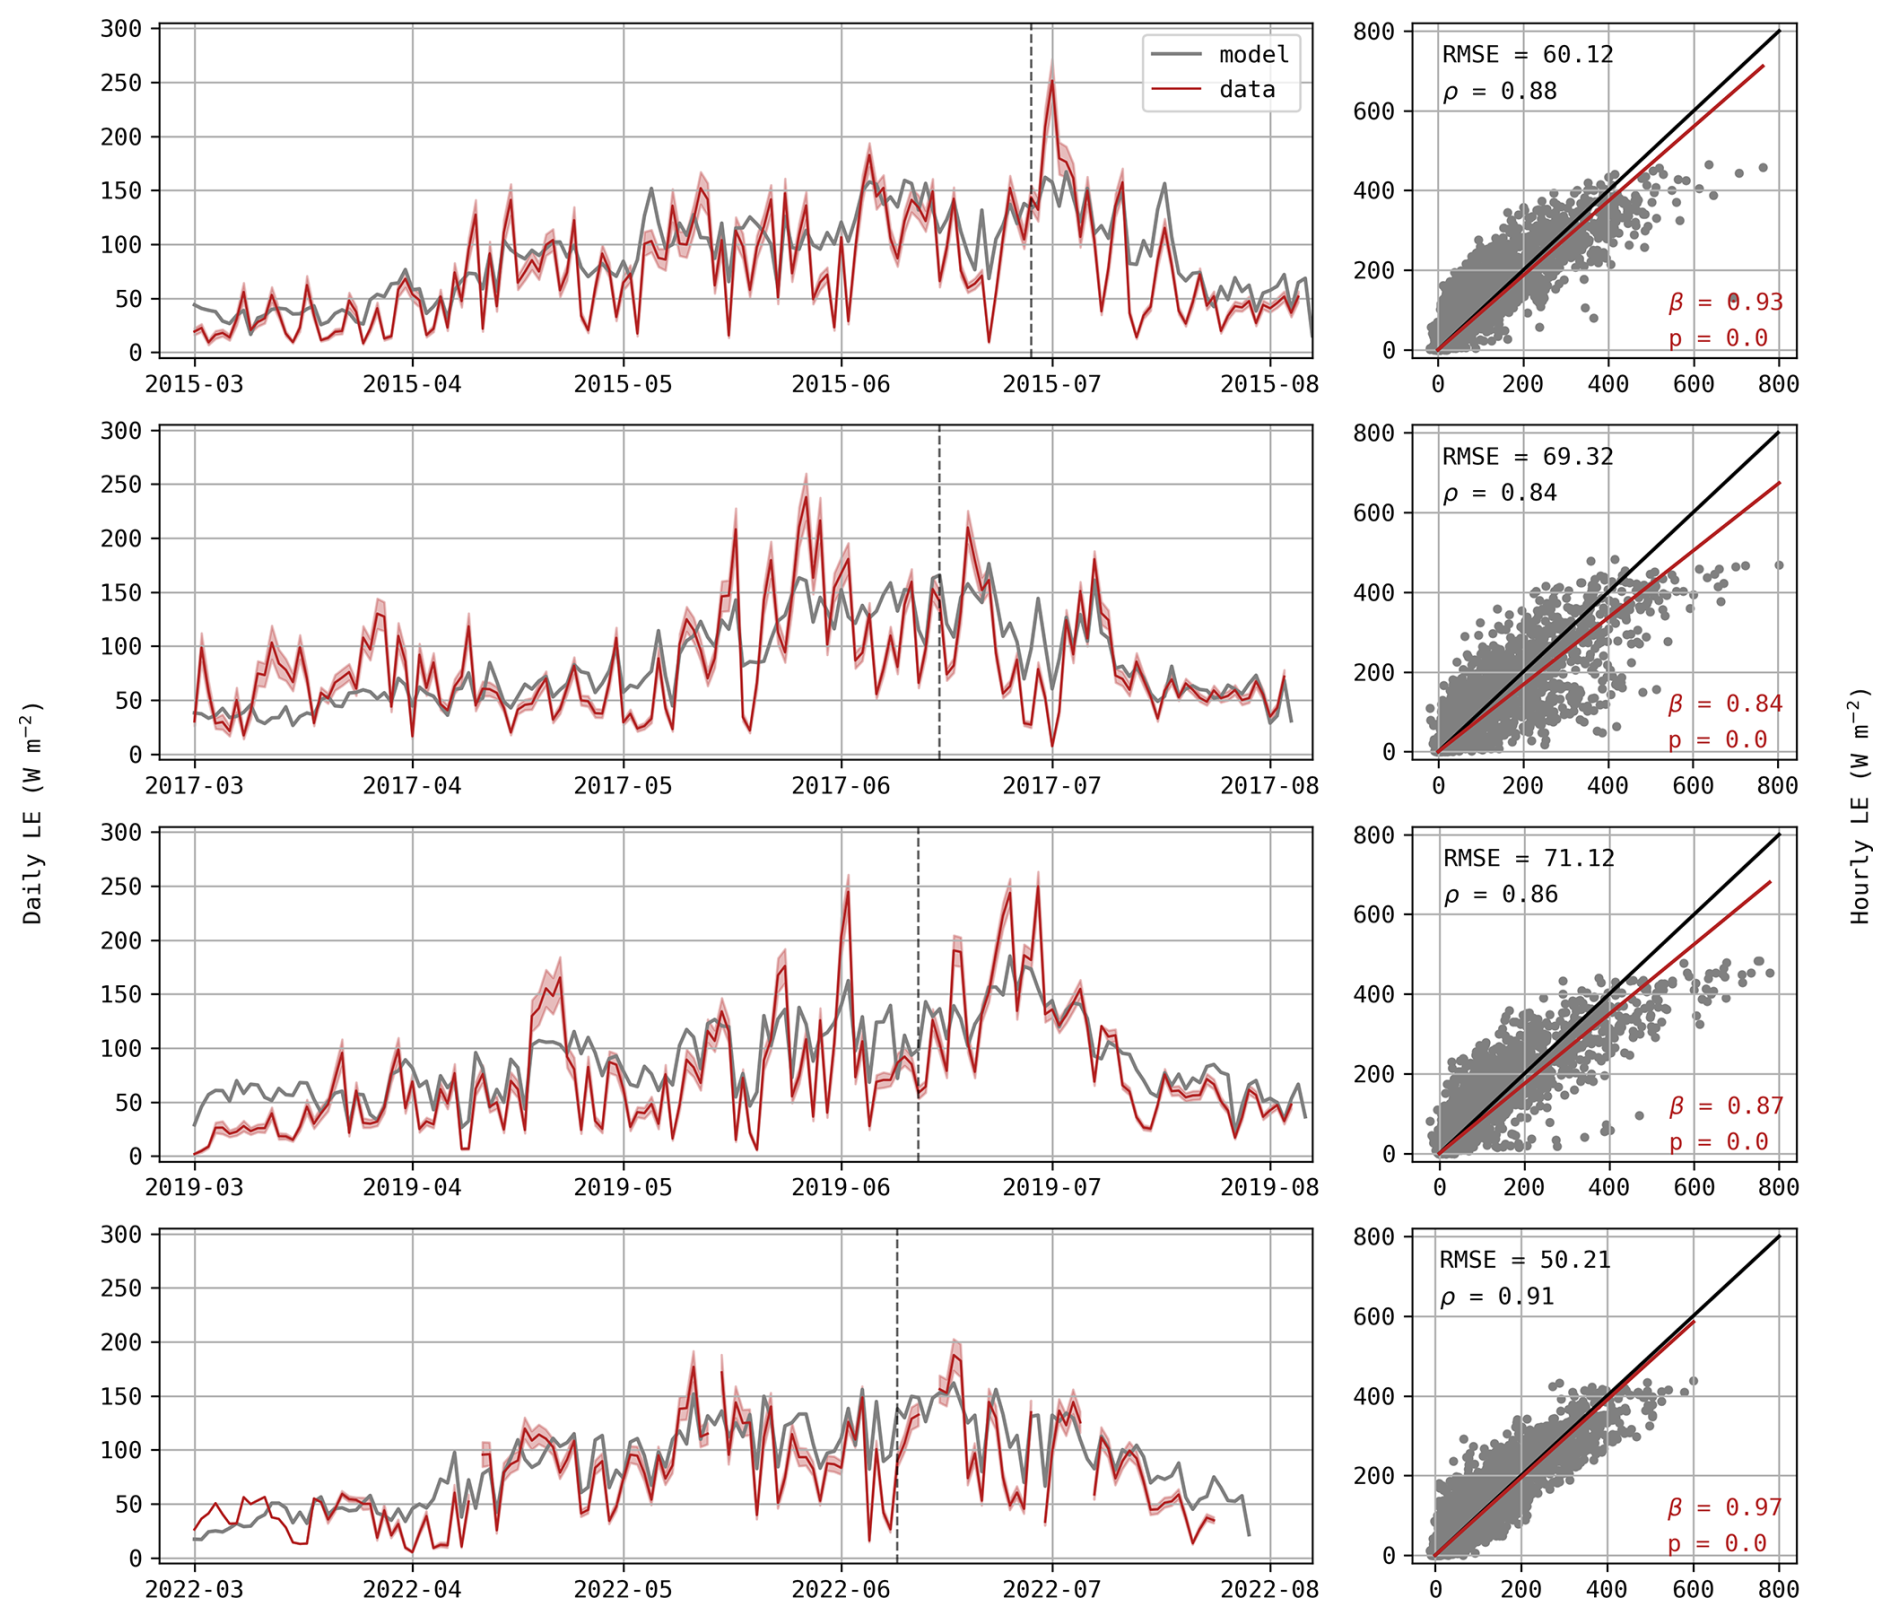
Figure 4Daily average of LE (W m−2) for each growing season (left) with the red shaded area representing standard deviations of observations. Hourly predictions against observed values of LE (right) where observed values are displayed on the x-axis. The p-value indicates if the regression slope β (red) is significantly different from the 1:1 line (black) and ρ is the Pearson correlation coefficient.
Even though there was no apparent soil water deficit, this period (18–22 April) was still characterised by elevated temperatures and a higher vapour pressure deficit (VPD) compared to preceding days. Weather data during this period are depicted in the Appendix C (Fig. C1). It does not meet the formal Belgian definition of a heatwave, but the daily mean temperatures were more than 5° C above the 1981–2010 averages. During this 5 d period, the observed stomatal conductance gs reached extremely high values (Fig. 5a), associated with an important increase in LE fluxes (Fig. 5c), while the magnitude of the carbon uptake (GPP) was not affected (Fig. 5b). These observations reveal a decrease in water use efficiency during this period, indicating that transpiration was intensified with no corresponding increase in carbon assimilation. This trend was not captured by the model, as simulated gs remained lower than 0.03 m s−1 (Fig. 5a). The slight increase in predicted gs during these five days can be explained by the minor increase in carbon uptake (Fig. 5b).
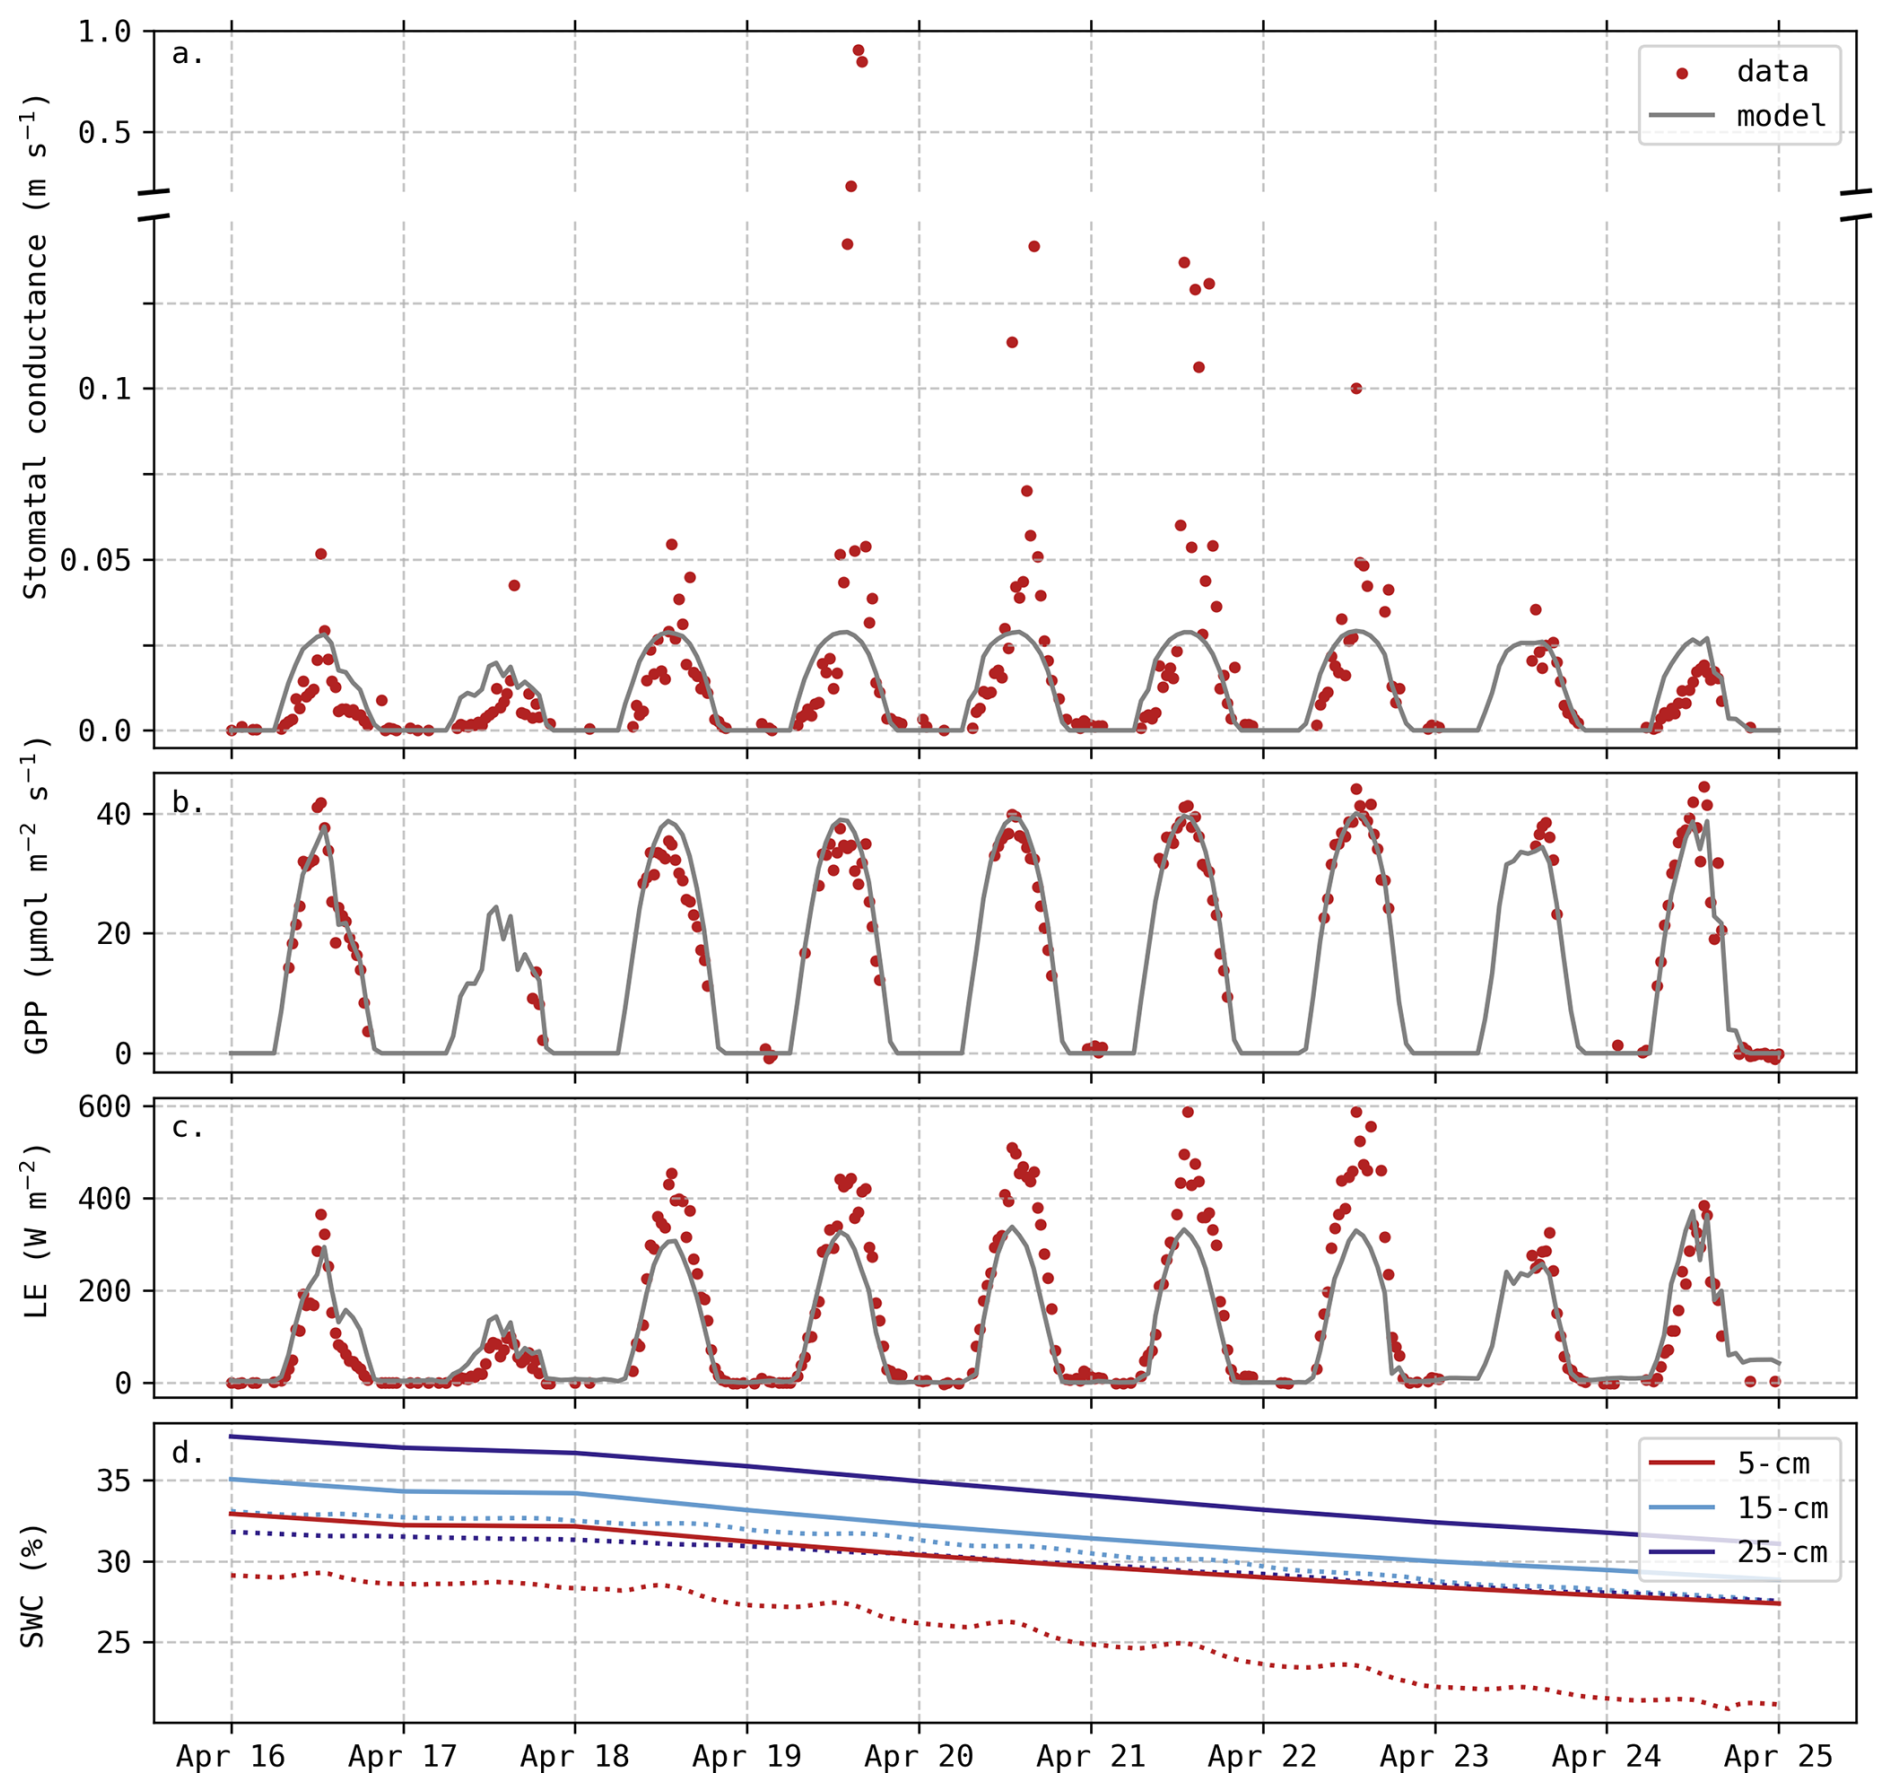
Figure 5Evolution of predicted and observed (a) stomatal conductance gs, (b) Gross Primary Productivity (GPP), (c) LE fluxes and (d) Soil Water Content (SWC) at three different depths. Solid lines are predictions. Observed gs was deduced from Penman–Monteith equation, measured fluxes and weather data (Appendix C). The axis break indicates different scales but does not imply omitted observations.
In addition to the insufficient simulated transpiration, soil evaporation may also be underestimated. During these five days, soil water content at the surface (5 cm depth) decreased by 6.2 % whereas the model predicted a decrease of 4.2 % (Fig. 5d). We assume that this difference (2 %) is mainly due to an underestimation of soil evaporation rather than drainage as it is limited to the surface layer and because of the particular meteorological conditions. Considering a surface layer from 0 to 10 cm, this is equivalent to a daily contribution of 10.4 W m−2. Hence, the underestimation of soil evaporation can partly explain the difference in LE fluxes observed in Fig. 4.
3.4 Validation
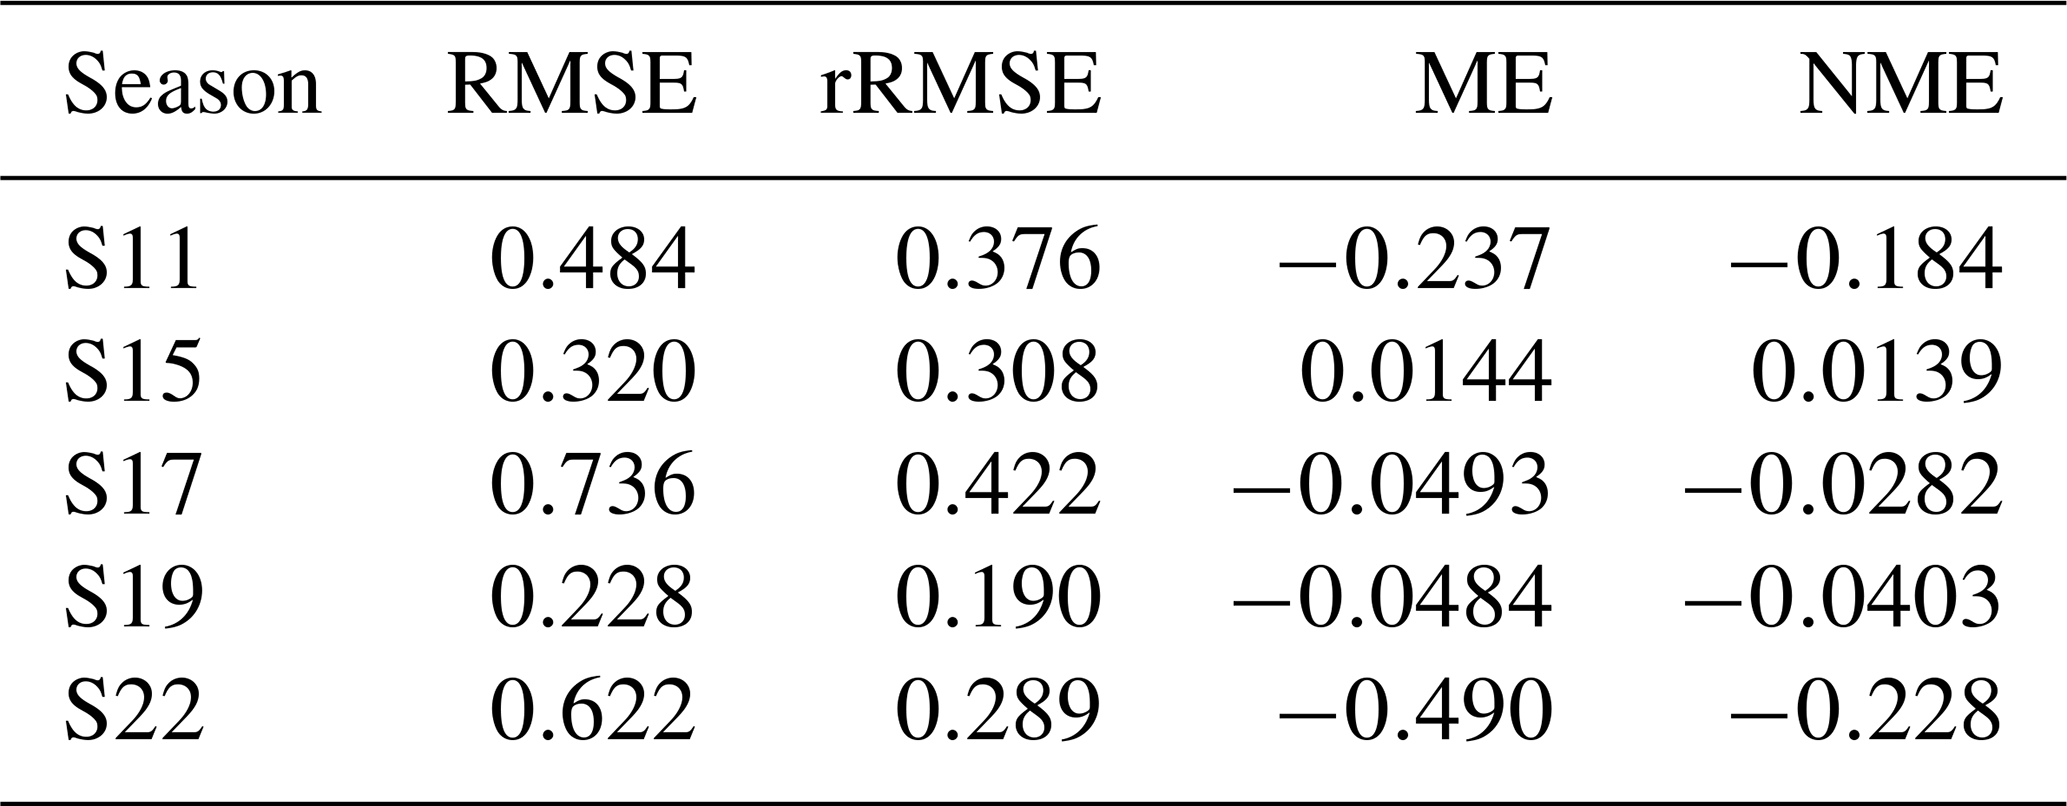
When using the most-balanced parameter set for S11, NEE is well reproduced by the model with EF greater than 0.8, rRMSE around 40 % and NME close to 0 for both time scales (Table 3a). Although rRMSE and EF also present acceptable results for DM, it is worth noting that there is an overall underestimation of this variable (NME ).
Table 3Evaluation criteria for S11 using (a) the most-balanced parameter set (red point) and (b) the parameter set minimising FLE. RMSE are expressed in W m−2 for LE, in µmol m−2 s−1 for hourly NEE, in gC m−2 d−1 for daily NEE and in t ha−1 for dry matter (DM). Other criteria have no units.
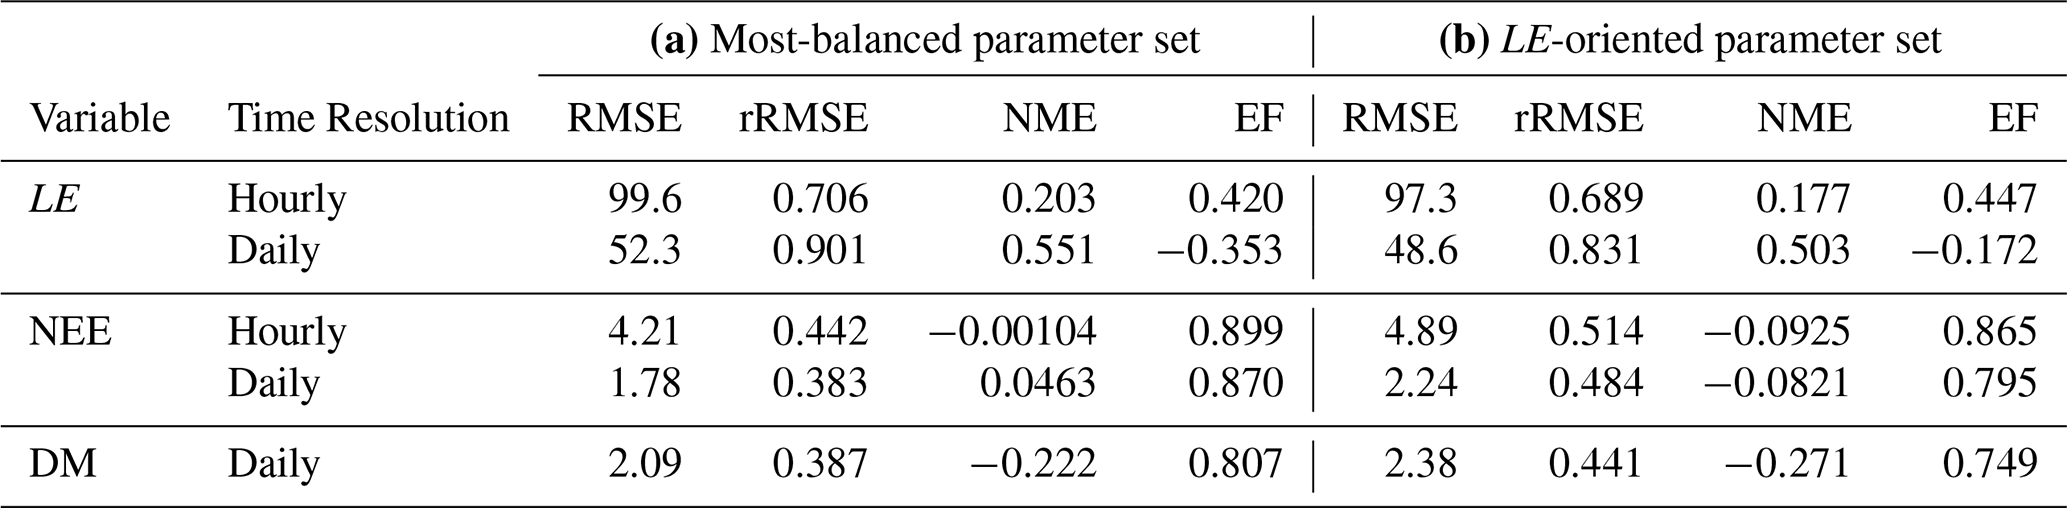
On the other hand, there is no good agreement between observed and predicted LE, especially when considering a daily time scale, as shown by the four indicators. Even when using the parameter set that minimises FLE (Fig. 1a), LE remains poorly captured by the model (Table 3b). As expected from the Pareto front, this slight improvement in LE predictions is accompanied by a degradation of NEE and DM predictions.
4.1 Pareto-based calibration
Considering all objectives, the chosen parameter set (red point in Fig. 1) shows satisfactory calibration results, with a total RMSE of 0.948 t ha−1, 3.44 µmol m−2 s−1 and 62.7 W m−2 for DM, NEE and LE, respectively. Compared with other models, calibrated RMSE values for total biomass are typically between 0.5 and 1.5 t ha−1 (Zhang et al., 2020; Dumont et al., 2014; Casanova and Judge, 2008). Regarding NEE, reported RMSE values for daily fluxes range from 1.3 to 1.9 gC m−2 d−1 (Revill et al., 2019; Senapati et al., 2018; Lehuger et al., 2010). In the present study, the RMSE computed from hourly NEE (3.44 µmol m−2 s−1) corresponds to a RMSE of 1.49 gC m−2 d−1 when using daily fluxes, which falls in the mentioned range. Casanova and Judge (2008) reported a RMSE of 62.45 W m−2 for hourly LE fluxes, and other studies presented values ranging from 24.65 to 48.5 W m−2 for daily fluxes (Wang et al., 2024; Liu et al., 2020a; Dutta et al., 2016), while we found 30.74 W m−2 using daily averages.
The calibrated parameters are all within the explored range, without relying on extreme values (Table B1), indicating a physically plausible solution. It is, however, worth noting that some cultivar-specific parameters have very different values between seasons, such as δ describing the hydraulic signalling for stomatal conductance or the photosynthetic efficiency of non-leaf organs (SOrgPhotEff and StemPhotEff). Such differences may reflect genotypic variability, but they may also be due to environmental factors not represented in the model. This is, for example, the case for the remobilisation reserve ShldResC which can be impacted by genotype and water stress (Ehdaie et al., 2006). The absence or misrepresentation of environmental factors in the model can be compensated by wider variations between cultivars. Depending on the modeller's objective, these parameters might be kept as cultivar-specific while investigating the environmental influences, or constrained across cultivars to improve model parsimony and robustness.
In addition to providing reliable solutions, Pareto-based multi-objective calibration also offers insights into internal model limitations (Kollat et al., 2012). As related by Schoups et al. (2005), the shape of the Pareto front is an indicator of model structural error. Angular fronts (e.g., NEE–LE front) suggest that different objectives can be simultaneously optimised whereas significant trade-offs (curved or linear fronts) may indicate a wrong parameterisation of the model (Wöhling et al., 2013; Efstratiadis and Koutsoyiannis, 2010). The following sections focus on the NEE–DM and NEE–LE trade-offs and discuss whether the disagreements between observations and model predictions come from uncertainty due to measurement errors or deeper structural issues.
4.2 Where does the carbon go?
As shown by the major trade-off in Fig. 1b, adjusting model parameters to fit NEE fluxes inevitably compromises the simulation of organ DM. The analysis in Sect. 3.2 and 3.3 reveals that this would specifically result in an underestimation of biomass. DM during the vegetative stage is well reproduced when simulated NEE is overly negative, and SOrg DM is underestimated when NEE predictions show less bias (Figs. 2 and 3). This was also observed in the validation results, with a consistent underestimation of DM while NEE showed neither over- nor underestimation. Several factors may contribute to this mismatch:
-
Underestimation of heterotrophic respiration. If so, as respiration is regarded as positive and photosynthesis as negative with the micro-meteorological sign convention, NEE predictions would be too negative (as observed). Improving heterotrophic respiration would affect NEE predictions but its influence on DM would be limited, which could weaken the trade-off between these variables. At this study site, Suleau et al. (2011) partitioned soil respiration into its heterotrophic and autotrophic components using soil chambers, from which they derived temperature functions. When comparing their fitted regression to simulated heterotrophic respiration, Daisy appears to underestimate both temperature sensitivity and baseline respiration rate for three growing seasons (Fig. D1), supporting this first assumption. It should be noted, however, that this regression depends solely on temperature, ignoring the seasonal variation in residue and fertilisation inputs that also affect soil respiration dynamics. Furthermore, heterotrophic respiration is most likely to be underestimated as, during the bare soil period before sowing, NEE (which only consists of soil respiration at that time) is mostly underestimated (Table D2). Adjusting soil parameters might reduce this trade-off, but it would require long-term simulations and respiration data from this study site.
-
Wrong modelling assumptions. Modelling real-world systems comes with simplifications. For instance, in this study, the partitioning schemes of assimilates were derived from S22, since root measurements were only made during that season, as well as early distinction between leaf and stem. These partitioning coefficients were also applied to the other cultivars, but they might be inadequate and partly contribute to this trade-off. If too much assimilated carbon is allocated to the roots at the expense of the stem, the model would underestimate stem DM, which is crucial for grain filling during the reproductive stage. Conversely, as leaves are not directly affected and are the major contributor to photosynthesis, the influence on NEE would be attenuated. Besides this example, many other assumptions could play a role in these results, such as the organ death rates depending only on development stages or the non-dynamic leaf abscission rate. However, accounting for these within the model would be, in most cases, ineffective as model users usually do not have enough data to support this level of complexity.
-
Uncertainties and errors in NEE observations. Eddy covariance (EC) data are affected by multiple factors, including instrumental noise, frequency losses and turbulence conditions (Aubinet et al., 2012). To select only high-quality data, they are thoroughly filtered, resulting in low data coverage, as in Table 1. Moreover, turbulence conditions are accounted for in the uncertainty estimation rather than affecting the data itself, with an uncertainty related to the friction velocity, an indicator of turbulence strength (Pastorello et al., 2020). However, an additional source of errors has been discussed in relation to the energy balance closure problem (Gao et al., 2019). EC systems show a systematic underestimation of energy fluxes (sensible and latent heat) ranging from 15 % to 20 %, which is generally attributed to sub-mesoscale organised structures, generated in the daytime convective layer and enhanced by underlying surface heterogeneities (Mauder et al., 2020; Aubinet et al., 2012). While a standard correction method exists for energy fluxes (Pastorello et al., 2020), its application to CO2 fluxes remains under active research (Mauder et al., 2024). Some studies suggest that CO2 fluxes may also be underestimated (Gao et al., 2019; Mauder et al., 2010), though Liu et al. (2024a) found that the bias rather depends on soil water conditions. At BE-Lon, this potential underestimation of NEE is supported by the crop carbon budget previously estimated (Buysse et al., 2017). When combining NEE and field measurements (harvest, residues and inputs), they found that the study site continuously loses an unexpectedly large amount of carbon, depleting the soil much faster than recently observed (Dumont et al., 2025). This highlights that, beyond random error estimates, systematic biases in NEE measurements may propagate into model calibration and interpretation. As Beven (2019) emphasises, observational datasets should not be treated as absolute truth, and acknowledging these uncertainties is important when designing calibration frameworks or interpreting model evaluations.
4.3 Structural limitations in simulating LE
When there is no evaporation from free water surfaces, the surface water balance in Daisy can be summarised as:
-
computation of potential evapotranspiration (PET) using the FAO56 equation
-
partitioning of PET between potential soil evaporation and plant transpiration according to canopy cover
-
computation of actual soil evaporation, depending on potential soil evaporation and soil water availability
-
numerical resolution of Farquhar–Leuning models simultaneously with the SVAT module (surface energy balance) to obtain actual transpiration, surface temperatures and carbon assimilation.
Model limitations may arise from this workflow in two ways. First, the evapotranspiration (ET) is constrained by FAO56 PET which assumes a fixed stomatal conductance (Allen et al., 2006). Although it is widely used in crop modelling, this simplification can reduce the accuracy of ET estimations (Liu et al., 2023; Ghiat et al., 2021). By considering a constant gs for PET, simulated ET can be severely limited when stomata are actually wide open. Conversely, when stomata are closed, PET is overestimated and can therefore lead to higher soil evaporation than observed. This may partly explain the lack of temporal variation observed in Fig. 4 and the high values of rRMSE (Fig. 1c).
Second, soil evaporation (Esoil) is computed outside the iteration loop that couples the SVAT module with the Farquhar–Leuning models. It is constrained either by soil water availability or by the potential evaporative demand, depending on which is limiting. By contrast, fully coupled models such as the CLM model calculate resistance-based Esoil simultaneously with transpiration and sensible heat fluxes (Swenson and Lawrence, 2014). This ensures that Esoil is driven by microclimate conditions (e.g., canopy air vapour pressure) and reinforces the mechanistic coupling between the surface energy and water balances. However, the appropriate formulation of resistance-based Esoil remains an active research area, as recent studies continue to refine its parameterisation and physical basis (Schulz and Vogel, 2020; Lehmann et al., 2018).
Beside these workflow aspects, the relatively narrow Pareto shape (Fig. 1c) suggests the presence of equifinality, i.e., multiple parameter sets produce equally good results (Her and Seong, 2018). This likely reflects compensatory interactions between soil evaporation and plant transpiration. Since PET is partitioned by canopy cover, parameter changes that alter canopy development can redistribute PET between the two components while leaving total PET unaffected. Under non-stressed water conditions, the ecosystem would meet this evaporative demand, and total ET (i.e., LE outputs) would remain unchanged as well. This masking effect underscores the well-known challenge of ET partitioning in ecosystem modelling, further complicated as eddy covariance systems do not distinguish between soil evaporation and transpiration (Berg and Sheffield, 2019; Stoy et al., 2019; Scott and Biederman, 2017). Recent methods, such as flux mapping, have been developed to better understand model internal fluxes leading to equifinality (Khatami et al., 2019).
As depicted by Fig. 5, discrepancies in LE predictions were especially evident under elevated temperatures and high VPD. While these may partly stem from limitations mentioned above, they also point to deeper issues in the coupling between Farquhar and Leuning models and particularly in how it responds to atmospheric drivers.
4.4 Coupling of carbon and water exchanges
Stomatal behaviour plays a central role in plant regulation of water loss and carbon uptake, and has therefore been extensively studied (Damour et al., 2010). While it is well established that mild edaphic drought induces a decrease in carbon assimilation by reducing the stomatal aperture (Beauclaire et al., 2024), plant responses to heatwaves and high atmospheric demand are less evident. Most studies report reduced gs under high VPD (Grossiord et al., 2020; Bourbia and Brodribb, 2024), aligning with the theoretical predictions of stomatal models (Sabot et al., 2022). On the other hand, high temperatures seem to trigger stomatal opening to promote transpiration cooling (Urban et al., 2017), but reported results vary greatly among species (Wang et al., 2026; Moore et al., 2021). Under the combined effect of high temperature and VPD, Marchin et al. (2022) observed a significant increase in gs for two well-watered species, interpreting this as a strategy to prevent leaf overheating via enhanced LE loss without any increase in carbon assimilation. They later confirmed that this behaviour, referred to as stomatal decoupling, is not restricted to well-watered species (Marchin et al., 2023).
This stomatal decoupling aligns with ecophysiological studies, highlighting the role of non-stomatal factors during photosynthesis. Inside the leaf, CO2 diffuses through air spaces and membranes to reach the sites of carboxylation inside chloroplasts, whereas H2O moves from the xylem network to the stomata (Flexas et al., 2012; Sack and Holbrook, 2006). These different pathways can be affected independently, where carbon assimilation can be restricted by non-stomatal factors, often dominated by mesophyll conductance (Flexas et al., 2012). Over the last decade, these non-stomatal limitations have received increased attention, especially under water-stressed conditions (Nadal and Flexas, 2018; Gago et al., 2020). Based on leaf gas exchange measurements, experimental studies proved that these limitations should be considered in leaf models linking photosynthesis and transpiration (Yang et al., 2019; Beauclaire et al., 2024; Chen et al., 2025). Despite that, these complex processes are still not fully understood, and hence barely integrated into crop or terrestrial models (Vidale et al., 2021). As an example, an empirical equation for the mesophyll conductance was implemented in the land surface model JSBACH (Knauer et al., 2019). The authors extensively discussed the environmental drivers, the modelling implications, as well as the effects on the predicted fluxes in a subsequent paper (Knauer et al., 2020).
These non-stomatal limitations, or stomatal decoupling, are not modelled in Daisy. Based on stomatal coupling (Eq. 2), the increase in VPD reduced the predicted slope between carbon assimilation and gs. Consequently, the model tended to underestimate gs and LE fluxes and overestimated sensible heat, leading to a misrepresentation of energy partitioning under such conditions. On the other hand, observations show that plants likely opened their stomata, promoting water loss, while carbon assimilation did not increase accordingly. This stomatal decoupling was particularly visible in April 2019, as the heatwave lasted several days, but also appeared during shorter warm periods, suggesting a recurrent plant strategy. Future work should (i) continue the effort in better understanding the mechanisms of non-stomatal limitations affecting carbon assimilation and (ii) incorporate these mechanisms in process-based models, particularly under such conditions.
In this study, we employed a Pareto-based multi-objective calibration approach to optimise the Daisy soil–plant–atmosphere model, focusing on three key objectives (DM, NEE and LE). The SMPSO algorithm successfully identified parameter sets that balanced these objectives within realistic bounds. Furthermore, this methodology also offered valuable insights into model behaviour and inherent limitations, as particular trade-offs between the objectives were revealed. Notably, the strong compromise between DM and NEE suggests possible wrong parameterisations of the model and/or biases in observational EC data. Moreover, the LE–NEE trade-off indicates issues of equifinality, which underlines the challenging partitioning of evapotranspiration. The inaccuracy of LE predictions was also discussed, underscoring the oversimplification of the FAO56 Penman-Monteith method.
Additionally, the model struggled to reproduce observed increases in transpiration during heatwave conditions, highlighting deficiencies in simulating stomatal responses and in the coupling between carbon and water fluxes. These limitations are particularly relevant given the increasing frequency and intensity of heatwaves under climate change, which can significantly impact ecosystem dynamics. The influence of heatwaves and underlying mechanisms of stomatal decoupling need to be further investigated to improve the simulation of carbon and energy fluxes.
Overall, this work illustrates how multi-objective calibration can go beyond parameter estimation to critically assess model assumptions and guide future improvements. Addressing the structural limitations identified here – particularly in ET partitioning and (non-)stomatal regulation – could strengthen the ability of Daisy and similar crop models to capture ecosystem responses under changing climate conditions.
-
Diffuse fraction. The diffuse fraction of global radiation fd was estimated using the optical air mass and assuming a cloudless sky (Appendix 1 of de Pury and Farquhar, 1997). A second modelling option for estimating fd, adapted for cloudy skies, was implemented. Based on Ridley et al. (2010), fd depends on the hourly and daily clearness index (resp. kt and Kt), the apparent solar time (AST) and the solar angle α:
As both diffuse and global radiation are measured at BE-Lon, the five β parameters have been estimated with the Nelder–Mead method, considering the RMSE metric as an objective function. This method has been applied to 10 years of measurements (2014–2023), covering the entire duration of the case study. The resulting parameters (β0, β1, β2, β3, β4) are respectively equal to −4.8094, 5.4735, 0.020702, 0.099970 and 1.3944 (RMSE for fd= 0.164).
-
Maintenance respiration. Respiration required to maintain existing biomass is defined as maintenance respiration. In Daisy, the maintenance respiration of an organ is proportional to its dry weight Worg:
where is the maintenance respiration coefficient of the organ and f(T) is a temperature function. In addition to temperature dependence, it was demonstrated that mature or senescing tissues required lower maintenance respiration than younger tissues (Boote et al., 2013). Maintenance respiration declines near the end of the growing season due to a significant fraction of dead cells and metabolically inactive long-term storage (Amthor, 2025). To account for this, a second dependency f(DS) was added into Eq. (A2) and is a user-defined function of development stage. This more realistic dependence was added to verify whether its consideration impacted the trade-off between DM and NEE, which was not the case.
-
Remobilisation. After anthesis, carbon reserves stored in the stem can be mobilised to support grain filling. The remobilisation equations in Daisy were modified to account for both remobilisation efficiency and the temporal dynamics of the remobilisation rate. This rate peaks around 20 d after anthesis before declining, resulting in a sigmoid-shaped depletion of stem reserves (Liu et al., 2020b; Ehdaie et al., 2008). Similarly, this process was also modified to better match observations and verify whether it impacted the trade-off between DM and NEE, which was not the case.
Table B1Most balanced parameter set among non-dominated solutions (red point in Fig. 1).
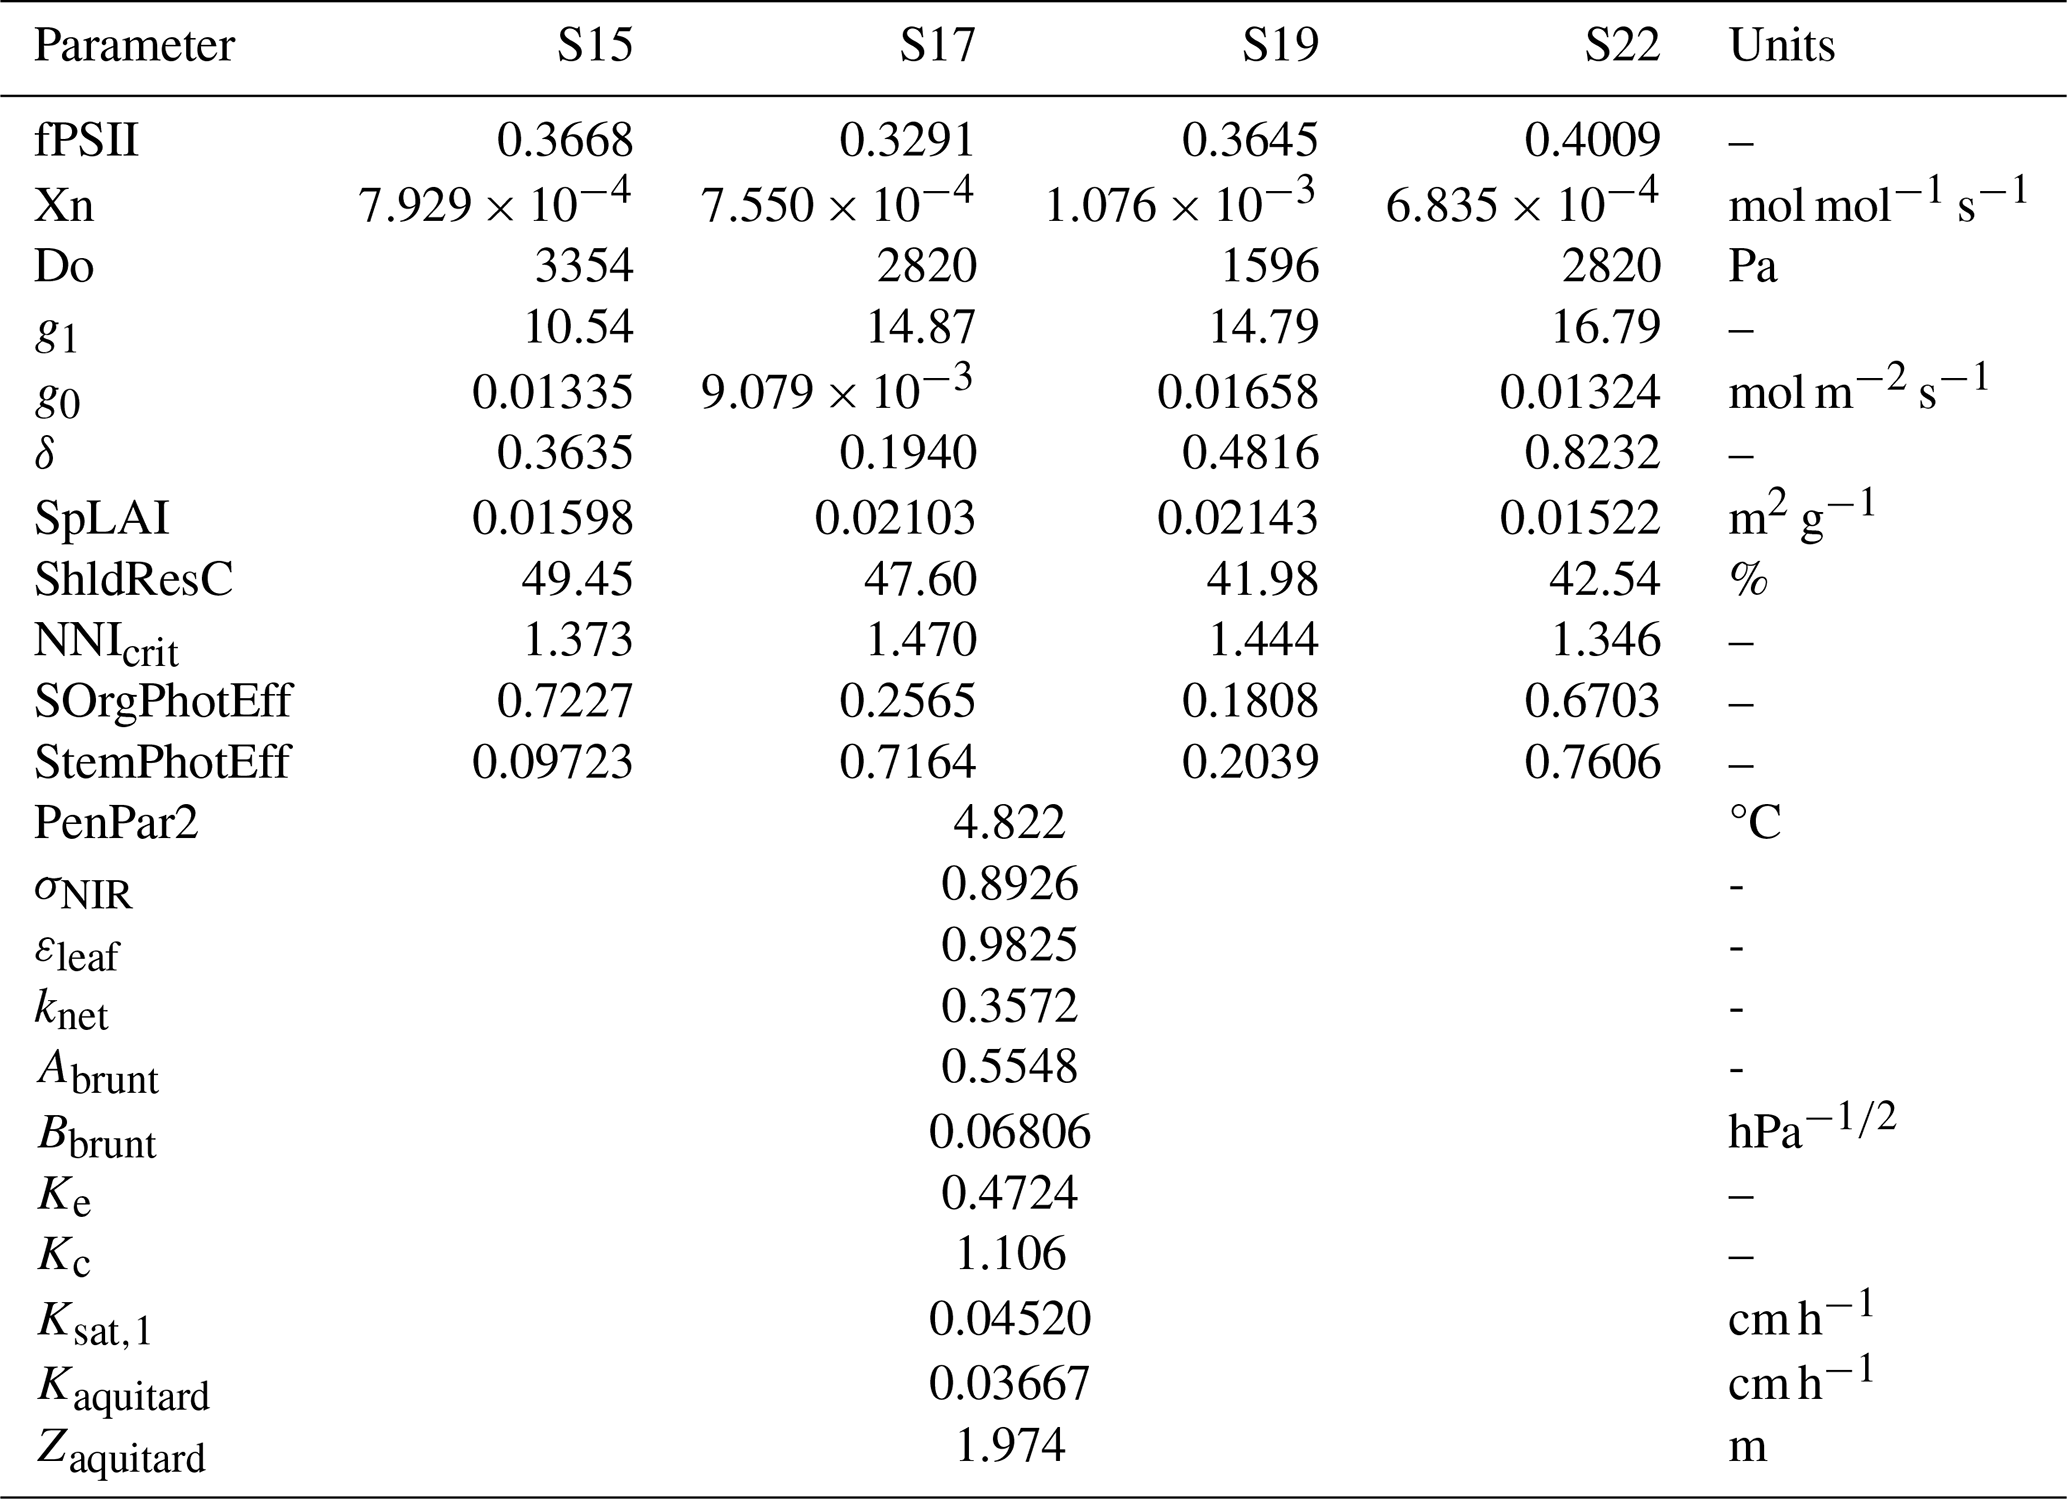
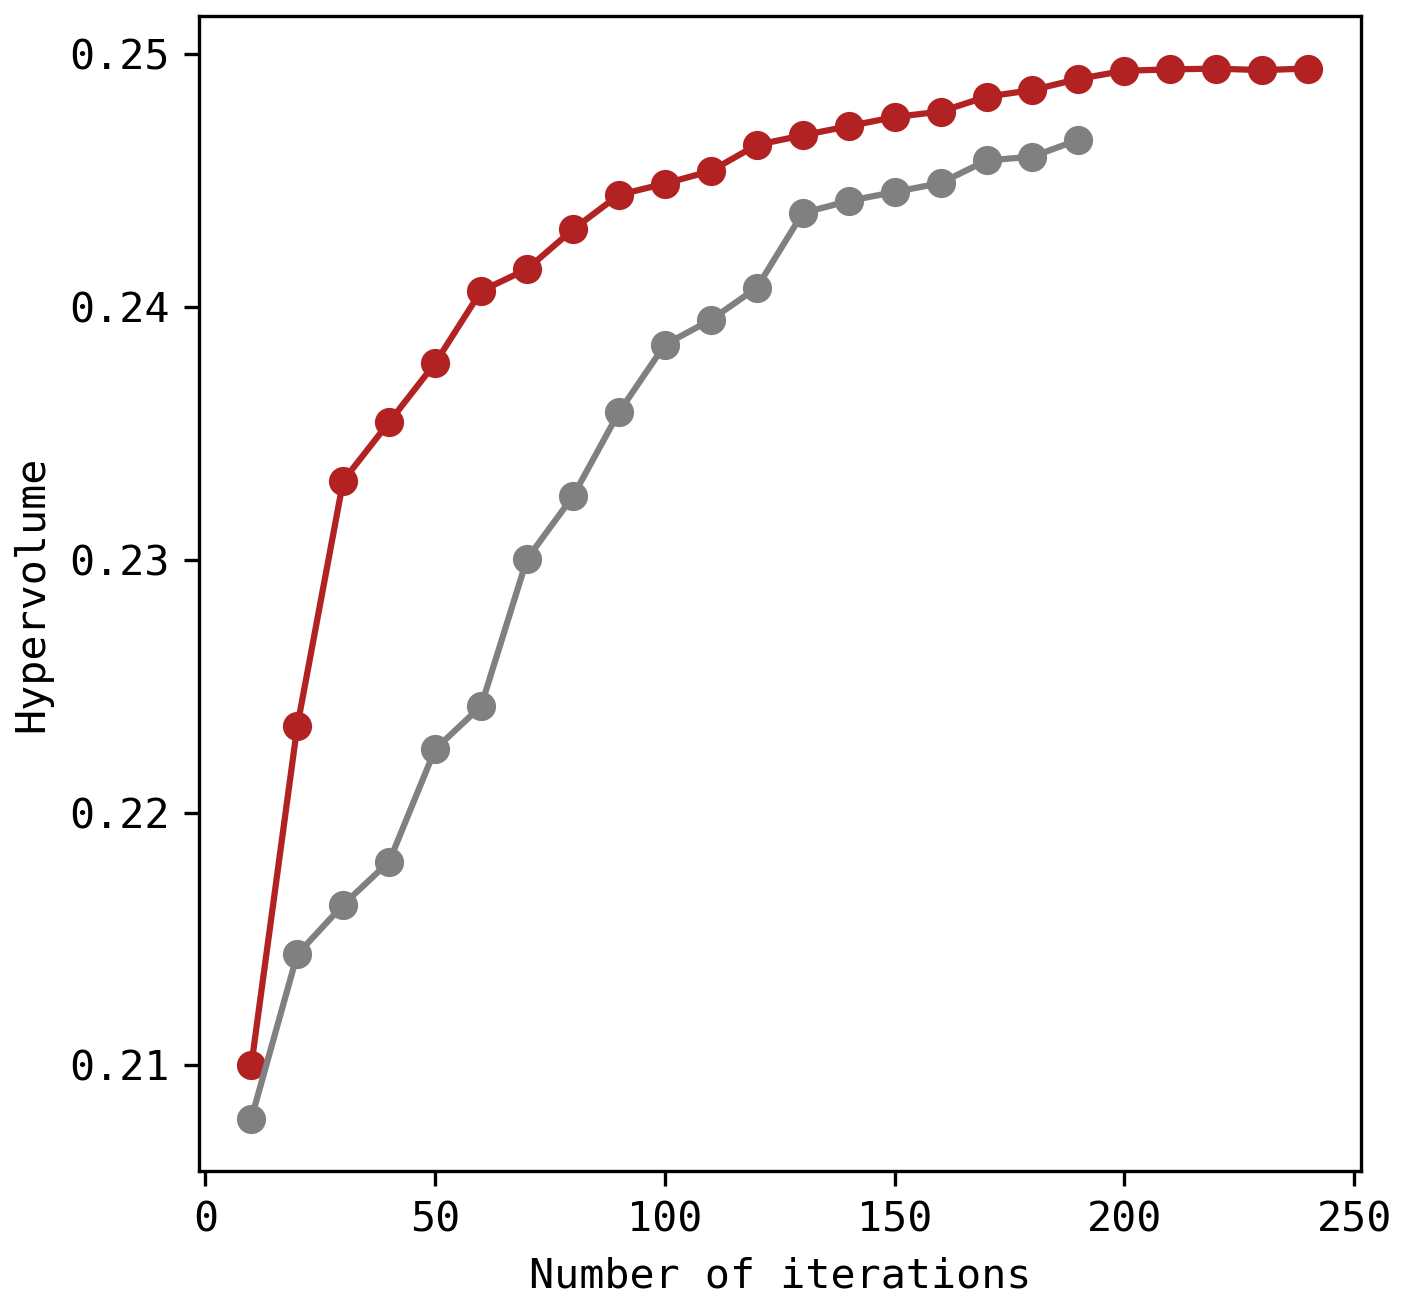
Figure B1Hypervolume indicator with increasing iterations. The red line corresponds to the solutions presented in this study and the grey line is a previous attempt with less iterations (200 iterations, hence 40 000 simulations).
According to the Penman–Monteith equation, the latent heat flux (LE) can be expressed as follows:
where Rn is the net irradiance (W m−2), G is the ground heat flux (W m−2), VPD is the Vapour Pressure Deficit (Pa), ρa is the dry air density (equal to 1.22 kg m−3), cp is the specific heat capacity of air (equal to 1013 J kg−1 °C−1) and rs is the stomatal resistance (. The slope of the saturation vapour pressure with temperature Δ can be estimated based on vapour pressure at saturation e∗(Tair):
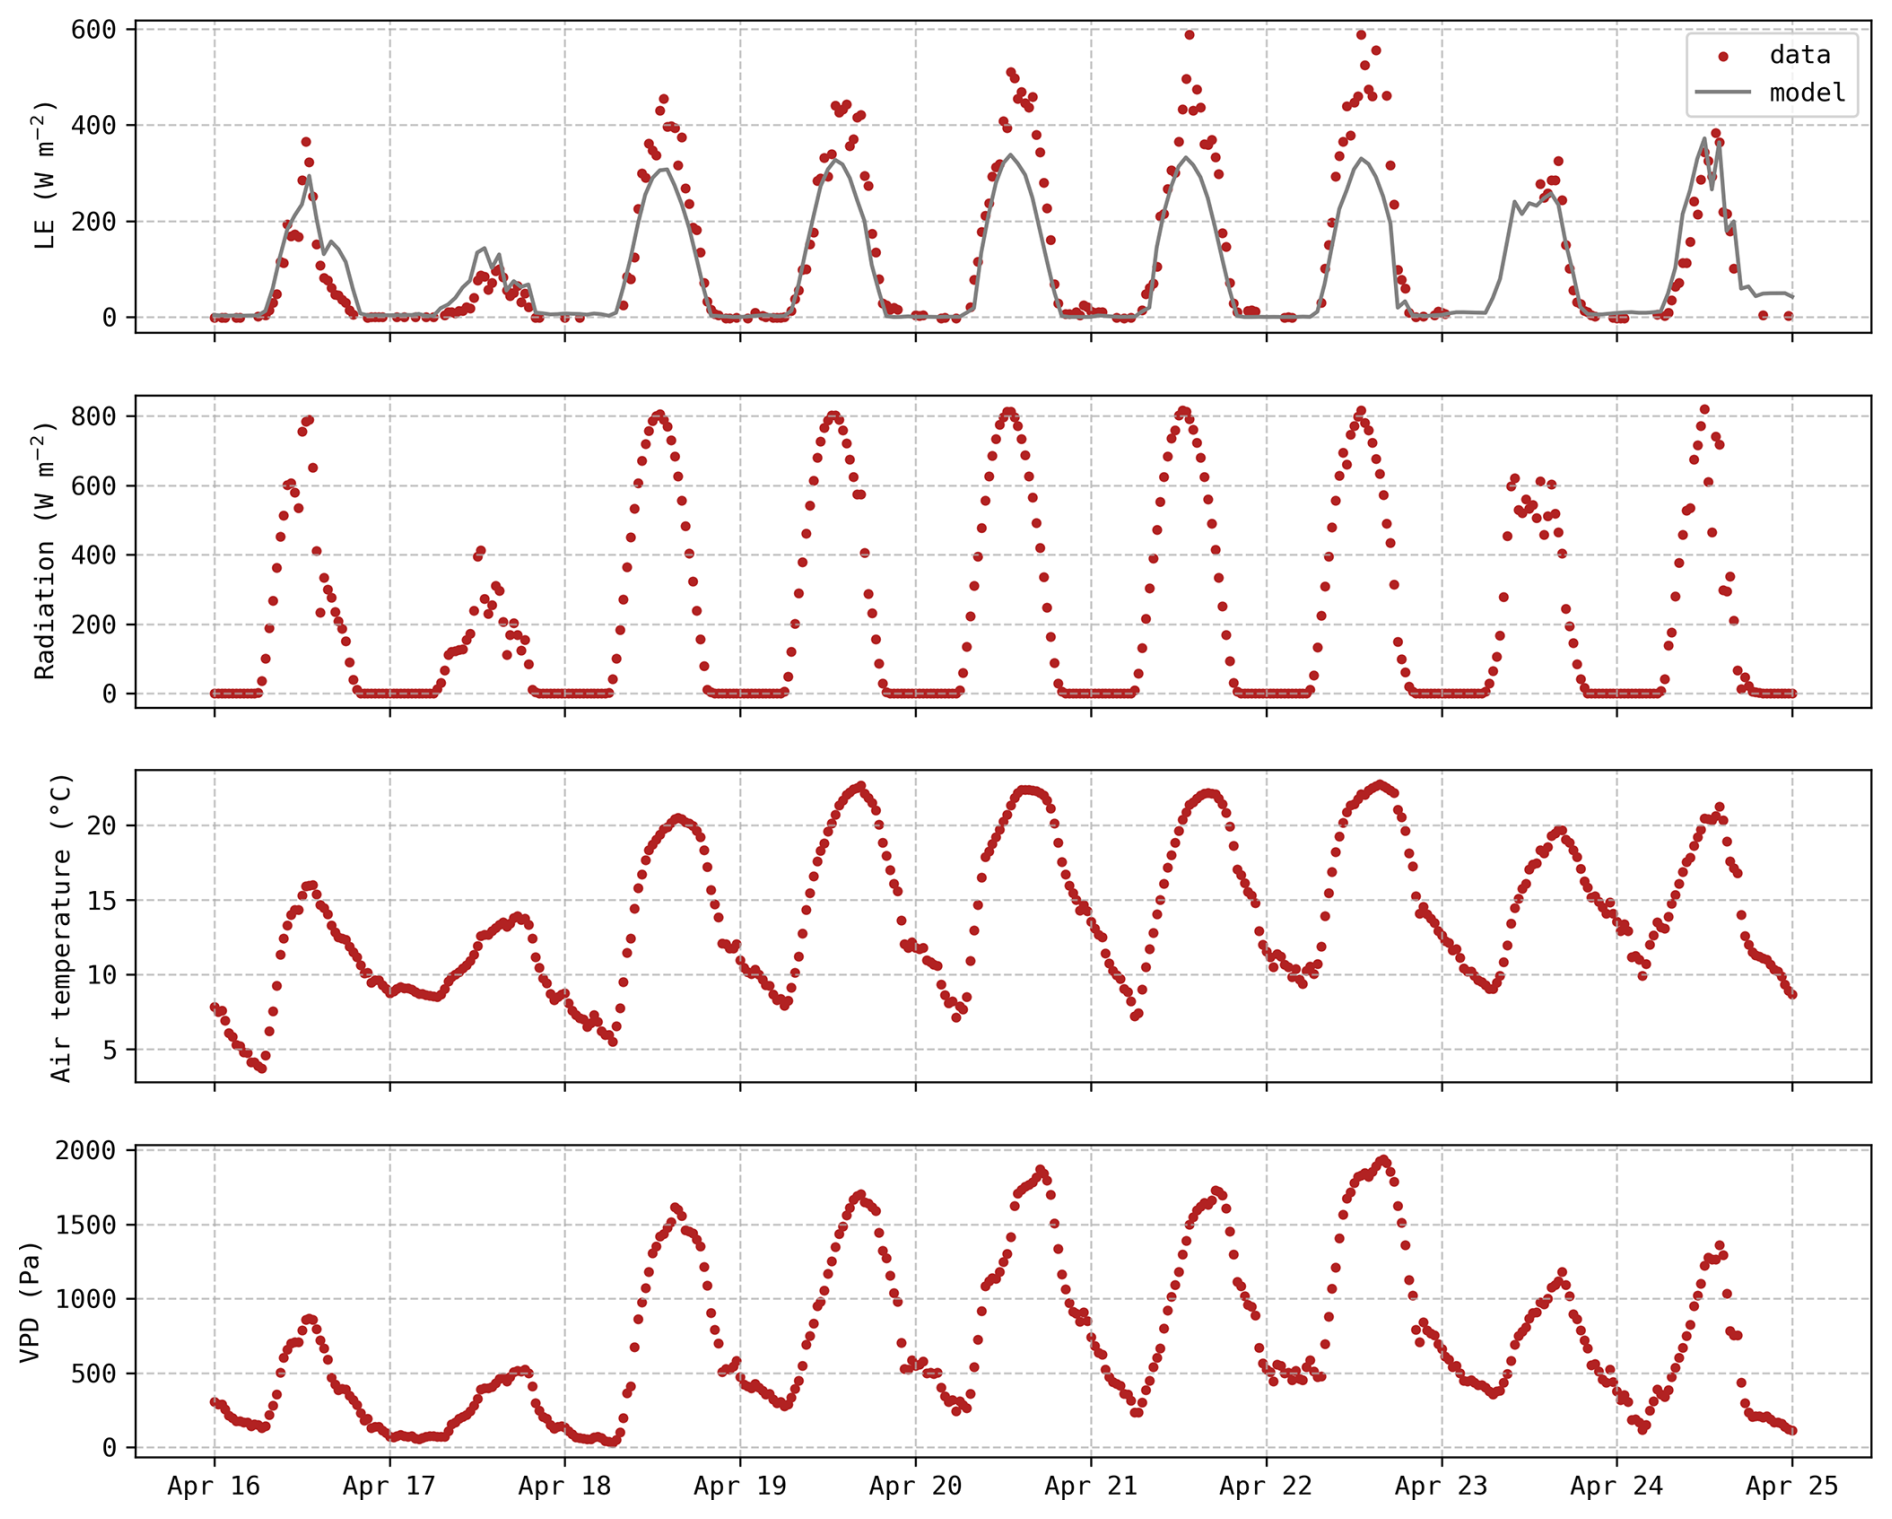
Figure C1Hourly evolution of latent heat flux predictions (grey) and observations (red) along with meteorological data (incoming shortwave radiation, air temperature and VPD).
The psychometric constant γ is a function of atmospheric pressure P:
And finally, the atmospheric resistance ra is composed of the aerodynamic and boundary layer resistances:
As LE, G, Rn, VPD, the air temperature Tair, P, the wind velocity u, the friction velocity u∗ are directly measured or at least computed within the ONEFlux pipeline (Pastorello et al., 2020), the stomatal resistance can be determined by combining Eqs. (C1)–(C4).
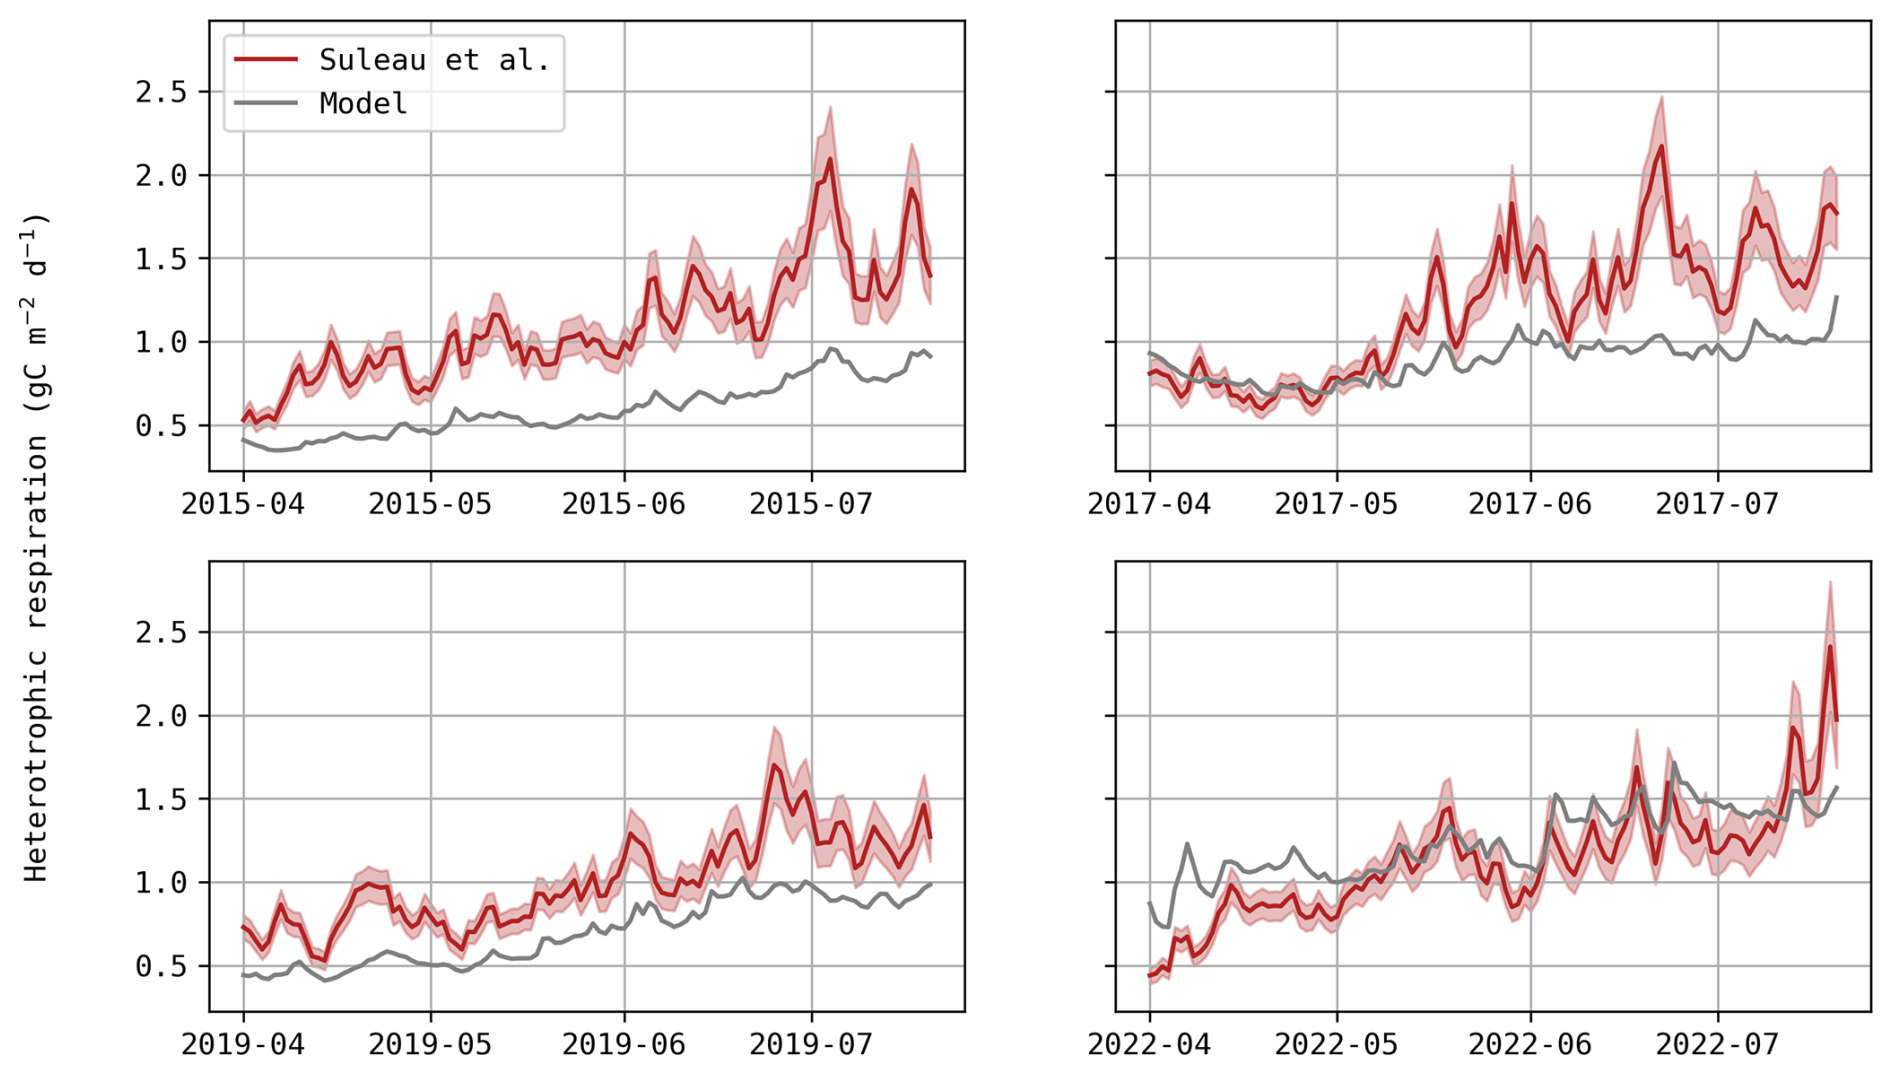
Figure D1Daily evolution of heterotrophic respiration (gC m−2 d−1) – model predictions (grey) and estimations based on the temperature function fitted by Suleau et al. (2011; red).
Table D1Evaluation criteria regarding daily NEE during the bare soil period before sowing. RMSE and ME are expressed in gC m−2 d−1 and other criteria have no units. S11 was simulated with the most-balanced parameter set, and cultivar-specific parameters were taken from S15.
Daisy is an open-source model developed by the Agrohydrology group at the University of Copenhagen, Denmark, and is available on GitHub (https://github.com/daisy-model/daisy, daisy-model, 2024). All Python scripts, as well as input and setup files used for running Daisy, are also accessible on GitHub (Delhez, 2025). Flux and meteorological data for BE-Lon can be downloaded directly from the ICOS Data Portal for the 2004–2020 period using https://doi.org/10.18160/46P3-WT1D (Heinesch et al., 2022). More recent (2021–2024) data using the same workflow have been submitted to the Ecosystem Thematic Centre (ETC) for official publication, but in the meantime can be accessed upon request.
EL, BL and LD designed the main conceptual ideas, EL and LD implemented the calibration method, LD made amendments to the model code, QB, BL and LD analysed the data, and LD prepared the manuscript with contributions from all co-authors.
The contact author has declared that none of the authors has any competing interests.
Publisher's note: Copernicus Publications remains neutral with regard to jurisdictional claims made in the text, published maps, institutional affiliations, or any other geographical representation in this paper. The authors bear the ultimate responsibility for providing appropriate place names. Views expressed in the text are those of the authors and do not necessarily reflect the views of the publisher.
We would like to thank Ariane Faurès and Bernard Heinesch (and all at ICOS Wallonia) for providing data and assistance, as well as the Daisy team for the useful discussions. This research is supported by the Federation Wallonie Bruxelles (FWB).
This paper was edited by Anja Rammig and reviewed by two anonymous referees.
Abrahamsen, P. and Hansen, S.: Daisy: an open soil-crop-atmosphere system model, Environ. Modell. Softw., 15, 313–330, https://doi.org/10.1016/S1364-8152(00)00003-7, 2000.
Allen, R. G., Pereira, L. S., Raes, D., and Smith, M.: Crop evapotranspiration: Guidelines for computing crop water requirements, edited by: Food and Agriculture Organization of the United Nations, Food and Agriculture Organization of the United Nations, Rome, 300 pp., ISBN 978-92-5-104219-9, 1998.
Allen, R. G., Pruitt, W. O., Wright, J. L., Howell, T. A., Ventura, F., Snyder, R., Itenfisu, D., Steduto, P., Berengena, J., Yrisarry, J. B., Smith, M., Pereira, L. S., Raes, D., Perrier, A., Alves, I., Walter, I., and Elliott, R.: A recommendation on standardized surface resistance for hourly calculation of reference ETo by the FAO56 Penman-Monteith method, Agr. Water Manage., 81, 1–22, https://doi.org/10.1016/j.agwat.2005.03.007, 2006.
Amthor, J. S.: After photosynthesis, what then: Importance of respiration to crop growth and yield, Field Crop. Res., 321, 109638, https://doi.org/10.1016/j.fcr.2024.109638, 2025.
Asseng, S., Martre, P., Maiorano, A., Rötter, R. P., O'Leary, G. J., Fitzgerald, G. J., Girousse, C., Motzo, R., Giunta, F., Babar, M. A., Reynolds, M. P., Kheir, A. M. S., Thorburn, P. J., Waha, K., Ruane, A. C., Aggarwal, P. K., Ahmed, M., Balkovič, J., Basso, B., Biernath, C., Bindi, M., Cammarano, D., Challinor, A. J., De Sanctis, G., Dumont, B., Eyshi Rezaei, E., Fereres, E., Ferrise, R., Garcia-Vila, M., Gayler, S., Gao, Y., Horan, H., Hoogenboom, G., Izaurralde, R. C., Jabloun, M., Jones, C. D., Kassie, B. T., Kersebaum, K.-C., Klein, C., Koehler, A., Liu, B., Minoli, S., Montesino San Martin, M., Müller, C., Naresh Kumar, S., Nendel, C., Olesen, J. E., Palosuo, T., Porter, J. R., Priesack, E., Ripoche, D., Semenov, M. A., Stöckle, C., Stratonovitch, P., Streck, T., Supit, I., Tao, F., Van Der Velde, M., Wallach, D., Wang, E., Webber, H., Wolf, J., Xiao, L., Zhang, Z., Zhao, Z., Zhu, Y., and Ewert, F.: Climate change impact and adaptation for wheat protein, Glob. Change Biol., 25, 155–173, https://doi.org/10.1111/gcb.14481, 2019.
Aubinet, M., Vesala, T., and Papale, D. (Eds.): Eddy Covariance: A Practical Guide to Measurement and Data Analysis, Springer Netherlands, Dordrecht, https://doi.org/10.1007/978-94-007-2351-1, 2012.
Beauclaire, Q., Vanden Brande, F., and Longdoz, B.: Key role played by mesophyll conductance in limiting carbon assimilation and transpiration of potato under soil water stress, Front. Plant Sci., 15, 1500624, https://doi.org/10.3389/fpls.2024.1500624, 2024.
Benítez-Hidalgo, A., Nebro, A. J., García-Nieto, J., Oregi, I., and Del Ser, J.: jMetalPy: A Python framework for multi-objective optimization with metaheuristics, Swarm Evol. Comput., 51, 100598, https://doi.org/10.1016/j.swevo.2019.100598, 2019.
Berg, A. and Sheffield, J.: Evapotranspiration Partitioning in CMIP5 Models: Uncertainties and Future Projections, J. Climate, 32, 2653–2671, https://doi.org/10.1175/JCLI-D-18-0583.1, 2019.
Beven, K.: Towards a methodology for testing models as hypotheses in the inexact sciences, Proc. R. Soc. A., 475, 20180862, https://doi.org/10.1098/rspa.2018.0862, 2019.
Boote, K. J., Jones, J. W., White, J. W., Asseng, S., and Lizaso, J. I.: Putting mechanisms into crop production models, Plant Cell Environ., 36, 1658–1672, https://doi.org/10.1111/pce.12119, 2013.
Bourbia, I. and Brodribb, T. J.: Stomatal response to VPD is not triggered by changes in soil–leaf hydraulic conductance in Arabidopsis or Callitris, New Phytol., 242, 444–452, https://doi.org/10.1111/nph.19607, 2024.
Buysse, P., Bodson, B., Debacq, A., De Ligne, A., Heinesch, B., Manise, T., Moureaux, C., and Aubinet, M.: Carbon budget measurement over 12 years at a crop production site in the silty-loam region in Belgium, Agr. Forest Meteorol., 246, 241–255, https://doi.org/10.1016/j.agrformet.2017.07.004, 2017.
Cameron, D., Hartig, F., Minnuno, F., Oberpriller, J., Reineking, B., Van Oijen, M., and Dietze, M.: Issues in calibrating models with multiple unbalanced constraints: the significance of systematic model and data errors, Meth. Ecol. Evol., 13, 2757–2770, https://doi.org/10.1111/2041-210X.14002, 2022.
Casanova, J. J. and Judge, J.: Estimation of energy and moisture fluxes for dynamic vegetation using coupled SVAT and crop-growth models, Water Resour. Res., 44, 2007WR006503, https://doi.org/10.1029/2007WR006503, 2008.
Chen, Y., Liang, K., Cui, B., Hou, J., Rosenqvist, E., Fang, L., and Liu, F.: Incorporating the temperature responses of stomatal and non-stomatal limitations to photosynthesis improves the predictability of the unified stomatal optimization model for wheat under heat stress, Agr. Forest Meteorol., 362, 110381, https://doi.org/10.1016/j.agrformet.2025.110381, 2025.
daisy-model: daisy, GitHub [code], https://github.com/daisy-model/daisy (last access: 23 March 2026), 2024.
Damour, G., Simonneau, T., Cochard, H., and Urban, L.: An overview of models of stomatal conductance at the leaf level: Models of stomatal conductance, Plant Cell Environ., https://doi.org/10.1111/j.1365-3040.2010.02181.x, 2010.
Deb, K.: Multi-objective optimization using evolutionary algorithms, Wiley, Chichester, New York, Weinheim, ISBN 978-0-471-87339-6, 2001.
Delhez, L.: LauraDelhez/Daisy_ParetoMOO: SMPSO-Daisy scripts and inputs, Zenodo [code], https://doi.org/10.5281/zenodo.16836123, 2025.
Delhez, L., Dumont, B., and Longdoz, B.: Leveraging temporal variability in global sensitivity analysis of the Daisy soil-plant-atmosphere model, Eur. J. Agron., 165, 127533, https://doi.org/10.1016/j.eja.2025.127533, 2025.
De Ligne, A., Heinesch, B., and Aubinet, M.: New Transfer Functions for Correcting Turbulent Water Vapour Fluxes, Bound.-Lay. Meteorol., 137, 205–221, https://doi.org/10.1007/s10546-010-9525-9, 2010.
de Noblet-Ducoudré, N., Gervois, S., Ciais, P., Viovy, N., Brisson, N., Seguin, B., and Perrier, A.: Coupling the Soil-Vegetation-Atmosphere-Transfer Scheme ORCHIDEE to the agronomy model STICS to study the influence of croplands on the European carbon and water budgets, Agronomie, 24, 397–407, https://doi.org/10.1051/agro:2004038, 2004.
de Pury, D. G. G. and Farquhar, G. D.: Simple scaling of photosynthesis from leaves to canopies without the errors of big-leaf models, Plant Cell Environ., 20, 537–557, https://doi.org/10.1111/j.1365-3040.1997.00094.x, 1997.
Dumont, B., Leemans, V., Mansouri, M., Bodson, B., Destain, J.-P., and Destain, M.-F.: Parameter identification of the STICS crop model, using an accelerated formal MCMC approach, Environ. Modell. Softw., 52, 121–135, https://doi.org/10.1016/j.envsoft.2013.10.022, 2014.
Dumont, B., Heinesch, B., Bodson, B., Bogaerts, G., Chopin, H., De Ligne, A., Demoulin, L., Douxfils, B., Engelmann, T., Faurès, A., Longdoz, B., Manise, T., Orgun, A., Piret, A., and Thyrion, T.: ETC L2 ARCHIVE from Lonzee, 2017–2024, Ecosystem Thematic Centre [data set], https://hdl.handle.net/11676/_1cSJaHszlKSAVAYBbp3VKzw (last access: 23 March 2026), 2025.
Dutta, B., Smith, W. N., Grant, B. B., Pattey, E., Desjardins, R. L., and Li, C.: Model development in DNDC for the prediction of evapotranspiration and water use in temperate field cropping systems, Environ. Modell. Softw., 80, 9–25, https://doi.org/10.1016/j.envsoft.2016.02.014, 2016.
Efstratiadis, A. and Koutsoyiannis, D.: One decade of multi-objective calibration approaches in hydrological modelling: a review, Hydrolog. Sci. J., 55, 58–78, https://doi.org/10.1080/02626660903526292, 2010.
Ehdaie, B., Alloush, G. A., Madore, M. A., and Waines, J. G.: Genotypic Variation for Stem Reserves and Mobilization in Wheat: II. Postanthesis Changes in Internode Water-Soluble Carbohydrates, Crop Sci., 46, 2093–2103, https://doi.org/10.2135/cropsci2006.01.0013, 2006.
Ehdaie, B., Alloush, G. A., and Waines, J. G.: Genotypic variation in linear rate of grain growth and contribution of stem reserves to grain yield in wheat, Field Crop. Res., 106, 34–43, https://doi.org/10.1016/j.fcr.2007.10.012, 2008.
Farquhar, G. D., Von Caemmerer, S., and Berry, J. A.: Models of Photosynthesis, Plant Physiol., 125, 42–45, https://doi.org/10.1104/pp.125.1.42, 2001.
Flexas, J., Barbour, M. M., Brendel, O., Cabrera, H. M., Carriquí, M., Díaz-Espejo, A., Douthe, C., Dreyer, E., Ferrio, J. P., Gago, J., Gallé, A., Galmés, J., Kodama, N., Medrano, H., Niinemets, Ü., Peguero-Pina, J. J., Pou, A., Ribas-Carbó, M., Tomás, M., Tosens, T., and Warren, C. R.: Mesophyll diffusion conductance to CO2: An unappreciated central player in photosynthesis, Plant Sci., 193–194, 70–84, https://doi.org/10.1016/j.plantsci.2012.05.009, 2012.
Gago, J., Daloso, D. M., Carriquí, M., Nadal, M., Morales, M., Araújo, W. L., Nunes-Nesi, A., and Flexas, J.: Mesophyll conductance: the leaf corridors for photosynthesis, Biochem. Soc. T., 48, 429–439, https://doi.org/10.1042/BST20190312, 2020.
Gao, Z., Liu, H., Missik, J. E. C., Yao, J., Huang, M., Chen, X., Arntzen, E., and Mcfarland, D. P.: Mechanistic links between underestimated CO2 fluxes and non-closure of the surface energy balance in a semi-arid sagebrush ecosystem, Environ. Res. Lett., 14, 044016, https://doi.org/10.1088/1748-9326/ab082d, 2019.
Ghiat, I., Mackey, H. R., and Al-Ansari, T.: A Review of Evapotranspiration Measurement Models, Techniques and Methods for Open and Closed Agricultural Field Applications, Water, 13, 2523, https://doi.org/10.3390/w13182523, 2021.
Grossiord, C., Buckley, T. N., Cernusak, L. A., Novick, K. A., Poulter, B., Siegwolf, R. T. W., Sperry, J. S., and McDowell, N. G.: Plant responses to rising vapor pressure deficit, New Phytol., 226, 1550–1566, https://doi.org/10.1111/nph.16485, 2020.
Guerreiro, A. P., Fonseca, C. M., and Paquete, L.: The Hypervolume Indicator: Computational Problems and Algorithms, ACM Comput. Surv., 54, 1–42, https://doi.org/10.1145/3453474, 2021.
Hansen, S., Jensen, H. E., Nielsen, N. E., and Svendsen, H.: Simulation of nitrogen dynamics and biomass production in winter wheat using the Danish simulation model DAISY, Fert. Res., 27, 245–259, https://doi.org/10.1007/BF01051131, 1991.
Hansen, S., Abrahamsen, P., Petersen, C. T., and Styczen, M.: Daisy: Model Use, Calibration, and Validation, T. ASABE, 55, 1317–1335, https://doi.org/10.13031/2013.42244, 2012.
Harvey, N., Marshall, L., and Vervoort, R. W.: Verifying model performance using validation of Pareto solutions, J. Hydrol., 621, 129594, https://doi.org/10.1016/j.jhydrol.2023.129594, 2023.
Heinesch, B., De Ligne, A., Manise, T., and Longdoz, B.: Warm winter 2020 ecosystem eddy covariance flux product from Lonzee, ICOS [data set], https://doi.org/10.18160/46P3-WT1D, 2022.
Her, Y. and Seong, C.: Responses of hydrological model equifinality, uncertainty, and performance to multi-objective parameter calibration, J. Hydroinform., 20, 864–885, https://doi.org/10.2166/hydro.2018.108, 2018.
Holbak, M., Abrahamsen, P., Hansen, S., and Diamantopoulos, E.: A Physically Based Model for Preferential Water Flow and Solute Transport in Drained Agricultural Fields, Water Resour. Res., 57, e2020WR027954, https://doi.org/10.1029/2020WR027954, 2021.
Jahandideh-Tehrani, M., Bozorg-Haddad, O., and Loáiciga, H. A.: Application of particle swarm optimization to water management: an introduction and overview, Environ. Monit. Assess., 192, 281, https://doi.org/10.1007/s10661-020-8228-z, 2020.
Keenan, T., Sabate, S., and Gracia, C.: Soil water stress and coupled photosynthesis–conductance models: Bridging the gap between conflicting reports on the relative roles of stomatal, mesophyll conductance and biochemical limitations to photosynthesis, Agr. Forest Meteorol., 150, 443–453, https://doi.org/10.1016/j.agrformet.2010.01.008, 2010.
Kennedy, J. and Eberhart, R.: Particle swarm optimization, in: Proceedings of ICNN'95 – International Conference on Neural Networks, ICNN'95 – International Conference on Neural Networks, Perth, WA, Australia, 1942–1948, https://doi.org/10.1109/ICNN.1995.488968, 1995.
Khatami, S., Peel, M. C., Peterson, T. J., and Western, A. W.: Equifinality and Flux Mapping: A New Approach to Model Evaluation and Process Representation Under Uncertainty, Water Resour. Res., 55, 8922–8941, https://doi.org/10.1029/2018WR023750, 2019.
Knauer, J., Zaehle, S., De Kauwe, M. G., Bahar, N. H. A., Evans, J. R., Medlyn, B. E., Reichstein, M., and Werner, C.: Effects of mesophyll conductance on vegetation responses to elevated CO2 concentrations in a land surface model, Glob. Change Biol., 25, 1820–1838, https://doi.org/10.1111/gcb.14604, 2019.
Knauer, J., Zaehle, S., De Kauwe, M. G., Haverd, V., Reichstein, M., and Sun, Y.: Mesophyll conductance in land surface models: effects on photosynthesis and transpiration, Plant J., 101, 858–873, https://doi.org/10.1111/tpj.14587, 2020.
Kollat, J. B., Reed, P. M., and Wagener, T.: When are multiobjective calibration trade-offs in hydrologic models meaningful?, Water Resour. Res., 48, 2011WR011534, https://doi.org/10.1029/2011WR011534, 2012.
Kucharik, C. J.: Evaluation of a Process-Based Agro-Ecosystem Model (Agro-IBIS) across the U.S. Corn Belt: Simulations of the Interannual Variability in Maize Yield, Earth Interact., 7, 1–33, https://doi.org/10.1175/1087-3562(2003)007<0001:EOAPAM>2.0.CO;2, 2003.
Lehmann, P., Merlin, O., Gentine, P., and Or, D.: Soil Texture Effects on Surface Resistance to Bare-Soil Evaporation, Geophys. Res. Lett., 45, https://doi.org/10.1029/2018GL078803, 2018.
Lehuger, S., Gabrielle, B., Cellier, P., Loubet, B., Roche, R., Béziat, P., Ceschia, E., and Wattenbach, M.: Predicting the net carbon exchanges of crop rotations in Europe with an agro-ecosystem model, Agr. Ecosyst. Environ., 139, 384–395, https://doi.org/10.1016/j.agee.2010.06.011, 2010.
Leuning, R.: A critical appraisal of a combined stomatal-photosynthesis model for C3 plants, Plant Cell Environ., 18, 339–355, https://doi.org/10.1111/j.1365-3040.1995.tb00370.x, 1995.
Liu, F., Andersen, M. N., and Jensen, C. R.: Capability of the `Ball-Berry' model for predicting stomatal conductance and water use efficiency of potato leaves under different irrigation regimes, Sci. Hortic., 122, 346–354, https://doi.org/10.1016/j.scienta.2009.05.026, 2009.
Liu, F., Ying, C., Dengpan, X., Huizi, B., Fulu, T., and Quansheng, G.: Modeling crop growth and land surface energy fluxes in wheat–maize double cropping system in the North China Plain, Theor. Appl. Climatol., 142, 959–970, https://doi.org/10.1007/s00704-020-03353-7, 2020a.
Liu, H., Liu, C., Huang, J., Desai, A. R., Zhang, Q., Ghannam, K., and Katul, G. G.: Scalar Flux Profiles in the Unstable Atmospheric Surface Layer Under the Influence of Large Eddies: Implications for Eddy Covariance Flux Measurements and the Non-Closure Problem, Geophys. Res. Lett., 51, e2023GL106649, https://doi.org/10.1029/2023GL106649, 2024a.
Liu, K., Wang, Y., Magney, T. S., and Frankenberg, C.: Non-steady-state stomatal conductance modeling and its implications: from leaf to ecosystem, Biogeosciences, 21, 1501–1516, https://doi.org/10.5194/bg-21-1501-2024, 2024b.
Liu, Y., Zhang, P., Li, M., Chang, L., Cheng, H., Chai, S., and Yang, D.: Dynamic responses of accumulation and remobilization of water soluble carbohydrates in wheat stem to drought stress, Plant Physiol. Bioch., 155, 262–270, https://doi.org/10.1016/j.plaphy.2020.07.024, 2020b.
Liu, Z., Wang, T., Li, C., Yang, W., and Yang, H.: A physically-based potential evapotranspiration model for global water availability projections, J. Hydrol., 622, 129767, https://doi.org/10.1016/j.jhydrol.2023.129767, 2023.
Lokupitiya, E., Denning, S., Paustian, K., Baker, I., Schaefer, K., Verma, S., Meyers, T., Bernacchi, C. J., Suyker, A., and Fischer, M.: Incorporation of crop phenology in Simple Biosphere Model (SiBcrop) to improve land-atmosphere carbon exchanges from croplands, Biogeosciences, 6, 969–986, https://doi.org/10.5194/bg-6-969-2009, 2009.
Manzoni, S., Vico, G., Katul, G., Fay, P. A., Polley, W., Palmroth, S., and Porporato, A.: Optimizing stomatal conductance for maximum carbon gain under water stress: a meta-analysis across plant functional types and climates: Optimal leaf gas exchange under water stress, Funct. Ecol., 25, 456–467, https://doi.org/10.1111/j.1365-2435.2010.01822.x, 2011.
Marchin, R. M., Backes, D., Ossola, A., Leishman, M. R., Tjoelker, M. G., and Ellsworth, D. S.: Extreme heat increases stomatal conductance and drought-induced mortality risk in vulnerable plant species, Glob. Change Biol., 28, 1133–1146, https://doi.org/10.1111/gcb.15976, 2022.
Marchin, R. M., Medlyn, B. E., Tjoelker, M. G., and Ellsworth, D. S.: Decoupling between stomatal conductance and photosynthesis occurs under extreme heat in broadleaf tree species regardless of water access, Glob. Change Biol., 29, 6319–6335, https://doi.org/10.1111/gcb.16929, 2023.
Mauder, M., Desjardins, R. L., Pattey, E., and Worth, D.: An Attempt to Close the Daytime Surface Energy Balance Using Spatially-Averaged Flux Measurements, Bound.-Lay. Meteorol., 136, 175–191, https://doi.org/10.1007/s10546-010-9497-9, 2010.
Mauder, M., Foken, T., and Cuxart, J.: Surface-Energy-Balance Closure over Land: A Review, Bound.-Lay. Meteorol., 177, 395–426, https://doi.org/10.1007/s10546-020-00529-6, 2020.
Mauder, M., Jung, M., Stoy, P., Nelson, J., and Wanner, L.: Energy balance closure at FLUXNET sites revisited, Agr. Forest Meteorol., 358, 110235, https://doi.org/10.1016/j.agrformet.2024.110235, 2024.
Meza, R., Jacquemin, G., Dumont, B., Bacchetta, R., Heens, B., Mahieu, O., Blanchard, R., Monfort, B., Chavalle, S., De Proft, M., Gofflot, S., Van Remoortel, V., Sinnaeve, G., and Bodson, B.: Variétés, in: Live Blanc “Céréales”, Gembloux Agro Bio Tech, Gembloux, Belgique, https://hdl.handle.net/2268/228404 (last access: 23 March 2026), 2018.
Meza, R., Crevits, C., Eylenbosch, D., Mahieu, O., Bonnave, M., Blanchard, R., Van der Verren, B., Godin, B., Faux, A.-M., Legrand, J., and Heens, B.: Variétés en froment d'hiver, in: Livre Blanc “Céréales”, https://livre-blanc-cereales.be/category/2023/ (last access: 23 March 2026). 2023.
Moges, E., Demissie, Y., Larsen, L., and Yassin, F.: Review: Sources of Hydrological Model Uncertainties and Advances in Their Analysis, Water, 13, 28, https://doi.org/10.3390/w13010028, 2020.
Moore, C. E., Meacham-Hensold, K., Lemonnier, P., Slattery, R. A., Benjamin, C., Bernacchi, C. J., Lawson, T., and Cavanagh, A. P.: The effect of increasing temperature on crop photosynthesis: from enzymes to ecosystems, J. Exp. Bot., 72, 2822–2844, https://doi.org/10.1093/jxb/erab090, 2021.
Mualem, Y.: A new model for predicting the hydraulic conductivity of unsaturated porous media, Water Resour. Res., 12, 513–522, https://doi.org/10.1029/WR012i003p00513, 1976.
Nadal, M. and Flexas, J.: Mesophyll Conductance to CO2 Diffusion: Effects of Drought and Opportunities for Improvement, in: Water Scarcity and Sustainable Agriculture in Semiarid Environment, Elsevier, 403–438, https://doi.org/10.1016/B978-0-12-813164-0.00017-X, 2018.
Nebro, A. J., Durillo, J. J., Garcia-Nieto, J., Coello Coello, C. A., Luna, F., and Alba, E.: SMPSO: A new PSO-based metaheuristic for multi-objective optimization, in: 2009 IEEE Symposium on Computational Intelligence in Multi-Criteria Decision-Making (MCDM), 2009 IEEE Symposium on Computational Intelligence in Multi-Criteria Decision-Making (MCDM), Nashville, TN, USA, 66–73, https://doi.org/10.1109/MCDM.2009.4938830, 2009.
Palosuo, T., Kersebaum, K. C., Angulo, C., Hlavinka, P., Moriondo, M., Olesen, J. E., Patil, R. H., Ruget, F., Rumbaur, C., Takáč, J., Trnka, M., Bindi, M., Çaldağ, B., Ewert, F., Ferrise, R., Mirschel, W., Şaylan, L., Šiška, B., and Rötter, R.: Simulation of winter wheat yield and its variability in different climates of Europe: A comparison of eight crop growth models, Eur. J. Agron., 35, 103–114, https://doi.org/10.1016/j.eja.2011.05.001, 2011.
Pastorello, G., Trotta, C., Canfora, E., Chu, H., Christianson, D., Cheah, Y.-W., Poindexter, C., Chen, J., Elbashandy, A., Humphrey, M., Isaac, P., Polidori, D., Reichstein, M., Ribeca, A., van Ingen, C., Vuichard, N., Zhang, L., Amiro, B., Ammann, C., Arain, M. A., Ardö, J., Arkebauer, T., Arndt, S. K., Arriga, N., Aubinet, M., Aurela, M., Baldocchi, D., Barr, A., Beamesderfer, E., Marchesini, L. B., Bergeron, O., Beringer, J., Bernhofer, C., Berveiller, D., Billesbach, D., Black, T. A., Blanken, P. D., Bohrer, G., Boike, J., Bolstad, P. V., Bonal, D., Bonnefond, J.-M., Bowling, D. R., Bracho, R., Brodeur, J., Brümmer, C., Buchmann, N., Burban, B., Burns, S. P., Buysse, P., Cale, P., Cavagna, M., Cellier, P., Chen, S., Chini, I., Christensen, T. R., Cleverly, J., Collalti, A., Consalvo, C., Cook, B. D., Cook, D., Coursolle, C., Cremonese, E., Curtis, P. S., D'Andrea, E., da Rocha, H., Dai, X., Davis, K. J., Cinti, B. D., Grandcourt, A. de, Ligne, A. D., De Oliveira, R. C., Delpierre, N., Desai, A. R., Di Bella, C. M., Tommasi, P. di, Dolman, H., Domingo, F., Dong, G., Dore, S., Duce, P., Dufrêne, E., Dunn, A., Dušek, J., Eamus, D., Eichelmann, U., ElKhidir, H. A. M., Eugster, W., Ewenz, C. M., Ewers, B., Famulari, D., Fares, S., Feigenwinter, I., Feitz, A., Fensholt, R., Filippa, G., Fischer, M., Frank, J., Galvagno, M., Gharun, M., Gianelle, D., Gielen, B., Gioli, B., Gitelson, A., Goded, I., Goeckede, M., Goldstein, A. H., Gough, C. M., Goulden, M. L., Graf, A., Griebel, A., Gruening, C., Grünwald, T., Hammerle, A., Han, S., Han, X., Hansen, B. U., Hanson, C., Hatakka, J., He, Y., Hehn, M., Heinesch, B., Hinko-Najera, N., Hörtnagl, L., Hutley, L., Ibrom, A., Ikawa, H., JackowiczKorczynski, M., Janouš, D., Jans, W., Jassal, R., Jiang, S., Kato, T., Khomik, M., Klatt, J., Knohl, A., Knox, S., Kobayashi, H., Koerber, G., Kolle, O., Kosugi, Y., Kotani, A., Kowalski, A., Kruijt, B., Kurbatova, J., Kutsch, W. L., Kwon, H., Launiainen, S., Laurila, T., Law, B., Leuning, R., Li, Y., Liddell, M., Limousin, J.-M., Lion, M., Liska A. J., Lohila, A., López-Ballesteros A., López-Blanco, E., Loubet, B., Loustau, D., Lucas-Moffat, A., Lüers, J., Ma, S., Macfarlane, C., Magliulo, V., Maier, R., Mammarella, I., Manca, G., Marcolla, B., Margolis, H. A., Marras, S., Massman, W., Mastepanov, M., Matamala, R., Matthes, J. H., Mazzenga, F., Mccaughey, H., McHugh, I., McMillan, A. M. S., Merbold, L., Meyer, W., Meyers, T., Miller, S. D., Minerbi, S., Moderow, U., Monson, R. K., Montagnani, L., Moore, C.E., Moors, E., Moreaux, V., Moureaux, C., Munger, J. W., Nakai, T., Neirynck, J., Nesic, Z., Nicolini, G., Noormets, A., Northwood, M., Nosetto, M., Nouvellon, Y., Novick, K., Oechel, W., Olesen, J. E., Ourcival, J.-M., Papuga, S. A., Parmentier, F.-J., Paul-Limoges, E., Pavelka, M., Peichl, M., Pendall, E., Phillips, R. P., Pilegaard, K., Pirk, N., Posse, G., Powell, T., Prasse, H., Prober, S. M., Rambal, S., Rannik, U., Raz-Yaseef, N., Rebmann, C., Reed, D., Resco de Dios, V., Restrepo-Coupe, N., Reverter, B. R., Roland, M., Sabbatini, S., Sachs, T., Saleska, S. R., Sánchez-Cañete, E. P., Sanchez-Mejia, Z. M., Schmid, H. P., Schmidt, M., Schneider, K., Schrader, F., Schroder, I., Scott, R. L., Sedlák, P., Serrano-Ortíz, P., Shao, C., Shi, P., Shironya, I., Siebicke, L., Šigut, L., Silberstein, R., Sirca, C., Spano, D., Steinbrecher, R., Stevens, R. M., Sturtevant, C., Suyker, A., Tagesson, T., Takanashi, S., Tang, Y., Tapper, N., Thom, J., Tomassucci, M., Tuovinen, J.-P., Urbanski, S., Valentini, R., van der Molen, M., van Gorsel, E., van Huissteden, K., Varlagin, A., Verfaillie, J., Vesala, T., Vincke, C., Vitale, D., Vygodskaya, N., Walker, J. P., Walter-Shea, E., Wang, H., Weber, R., Westermann, S., Wille, C., Wofsy, S., Wohlfahrt, G., Wolf, S., Woodgate, W., Li, Y., Zampedri, R., Zhang, J, Zhou, G., Zona, D., Agarwal, D., Biraud, S., Torn, M., and Papale, D.: The FLUXNET2015 dataset and the ONEFlux processing pipeline for eddy covariance data, Sci. Data, 7, 225, https://doi.org/10.1038/s41597-020-0534-3, 2020.
Plauborg, F., Abrahamsen, P., Gjettermann, B., Mollerup, M., Iversen, B. V., Liu, F., Andersen, M. N., and Hansen, S.: Modelling of root ABA synthesis, stomatal conductance, transpiration and potato production under water saving irrigation regimes, Agr. Water Manage., 98, 425–439, https://doi.org/10.1016/j.agwat.2010.10.006, 2010.
Revill, A., Emmel, C., D'Odorico, P., Buchmann, N., Hörtnagl, L., and Eugster, W.: Estimating cropland carbon fluxes: A process-based model evaluation at a Swiss crop-rotation site, Field Crop. Res., 234, 95–106, https://doi.org/10.1016/j.fcr.2019.02.006, 2019.
Ridley, B., Boland, J., and Lauret, P.: Modelling of diffuse solar fraction with multiple predictors, Renew. Energ., 35, 478–483, https://doi.org/10.1016/j.renene.2009.07.018, 2010.
Sabot, M. E. B., De Kauwe, M. G., Pitman, A. J., Medlyn, B. E., Ellsworth, D. S., Martin-StPaul, N. K., Wu, J., Choat, B., Limousin, J., Mitchell, P. J., Rogers, A., and Serbin, S. P.: One Stomatal Model to Rule Them All? Toward Improved Representation of Carbon and Water Exchange in Global Models, J. Adv. Model Earth Sy., 14, e2021MS002761, https://doi.org/10.1029/2021MS002761, 2022.
Sack, L. and Holbrook, N. M.: Leaf Hydraulics, Annu. Rev. Plant Biol., 57, 361–381, https://doi.org/10.1146/annurev.arplant.56.032604.144141, 2006.
Schoups, G., Hopmans, J. W., Young, C. A., Vrugt, J. A., and Wallender, W. W.: Multi-criteria optimization of a regional spatially-distributed subsurface water flow model, J. Hydrol., 311, 20–48, https://doi.org/10.1016/j.jhydrol.2005.01.001, 2005.
Schulz, J.-P. and Vogel, G.: Improving the Processes in the Land Surface Scheme TERRA: Bare Soil Evaporation and Skin Temperature, Atmosphere, 11, 513, https://doi.org/10.3390/atmos11050513, 2020.
Scott, R. L. and Biederman, J. A.: Partitioning evapotranspiration using long-term carbon dioxide and water vapor fluxes, Geophys. Res. Lett., 44, 6833–6840, https://doi.org/10.1002/2017GL074324, 2017.
Senapati, N., Chabbi, A., and Smith, P.: Modelling daily to seasonal carbon fluxes and annual net ecosystem carbon balance of cereal grain-cropland using DailyDayCent: A model data comparison, Agr. Ecosyst. Environ., 252, 159–177, https://doi.org/10.1016/j.agee.2017.10.003, 2018.
Shang, K., Ishibuchi, H., He, L., and Pang, L. M.: A Survey on the Hypervolume Indicator in Evolutionary Multiobjective Optimization, IEEE T. Evol. Comput., 25, 1–20, https://doi.org/10.1109/TEVC.2020.3013290, 2021.
Sharma, S. and Kumar, V.: A Comprehensive Review on Multi-objective Optimization Techniques: Past, Present and Future, Arch. Comput. Meth. E., 29, 5605–5633, https://doi.org/10.1007/s11831-022-09778-9, 2022.
Sierra, M. R. and Coello Coello, C. A.: Improving PSO-Based Multi-objective Optimization Using Crowding, Mutation and ∈-Dominance, in: Evolutionary Multi-Criterion Optimization, vol. 3410, edited by: Coello Coello, C. A., Hernández Aguirre, A., and Zitzler, E., Springer Berlin Heidelberg, Berlin, Heidelberg, 505–519, https://doi.org/10.1007/978-3-540-31880-4_35, 2005.
Stoy, P. C., El-Madany, T. S., Fisher, J. B., Gentine, P., Gerken, T., Good, S. P., Klosterhalfen, A., Liu, S., Miralles, D. G., Perez-Priego, O., Rigden, A. J., Skaggs, T. H., Wohlfahrt, G., Anderson, R. G., Coenders-Gerrits, A. M. J., Jung, M., Maes, W. H., Mammarella, I., Mauder, M., Migliavacca, M., Nelson, J. A., Poyatos, R., Reichstein, M., Scott, R. L., and Wolf, S.: Reviews and syntheses: Turning the challenges of partitioning ecosystem evaporation and transpiration into opportunities, Biogeosciences, 16, 3747–3775, https://doi.org/10.5194/bg-16-3747-2019, 2019.
Suleau, M., Moureaux, C., Dufranne, D., Buysse, P., Bodson, B., Destain, J.-P., Heinesch, B., Debacq, A., and Aubinet, M.: Respiration of three Belgian crops: Partitioning of total ecosystem respiration in its heterotrophic, above- and below-ground autotrophic components, Agr. Forest Meteorol., 151, 633–643, https://doi.org/10.1016/j.agrformet.2011.01.012, 2011.
Swenson, S. C. and Lawrence, D. M.: Assessing a dry surface layer-based soil resistance parameterization for the Community Land Model using GRACE and FLUXNET-MTE data, J. Geophys. Res.-Atmos., 119, https://doi.org/10.1002/2014JD022314, 2014.
Tang, Y., Marshall, L., Sharma, A., and Ajami, H.: A Bayesian alternative for multi-objective ecohydrological model specification, J. Hydrol., 556, 25–38, https://doi.org/10.1016/j.jhydrol.2017.07.040, 2018.
Tenreiro, T. R., García-Vila, M., Gómez, J. A., Jimenez-Berni, J. A., and Fereres, E.: Water modelling approaches and opportunities to simulate spatial water variations at crop field level, Agr. Water Manage., 240, 106254, https://doi.org/10.1016/j.agwat.2020.106254, 2020.
Timlin, D., Paff, K., and Han, E.: The role of crop simulation modeling in assessing potential climate change impacts, Agr. Geosci. Env., 7, e20453, https://doi.org/10.1002/agg2.20453, 2024.
Urban, J., Ingwers, M., McGuire, M. A., and Teskey, R. O.: Stomatal conductance increases with rising temperature, Plant Signaling & Behavior, 12, e1356534, https://doi.org/10.1080/15592324.2017.1356534, 2017.
Van den Hoof, C., Hanert, E., and Vidale, P. L.: Simulating dynamic crop growth with an adapted land surface model – JULES-SUCROS: Model development and validation, Agr. Forest Meteorol., 151, 137–153, https://doi.org/10.1016/j.agrformet.2010.09.011, 2011.
van Genuchten, M. T.: A Closed-form Equation for Predicting the Hydraulic Conductivity of Unsaturated Soils, Soil Sci. Soc. Am. J., 44, 892–898, https://doi.org/10.2136/sssaj1980.03615995004400050002x, 1980.
Vidale, P. L., Egea, G., McGuire, P. C., Todt, M., Peters, W., Müller, O., Balan-Sarojini, B., and Verhoef, A.: On the Treatment of Soil Water Stress in GCM Simulations of Vegetation Physiology, Front. Environ. Sci., 9, 689301, https://doi.org/10.3389/fenvs.2021.689301, 2021.
Wang, B., Yan, H., Zheng, H., Wu, J., Tian, D., Zhang, C., Zhu, X., Wang, G., Lakhiar, I. A., and Liu, Y.: Estimation of latent heat flux of pasture and maize in arid region of Northwest China based on canopy resistance modeling, Front. Environ. Sci., 12, 1397704, https://doi.org/10.3389/fenvs.2024.1397704, 2024.
Wang, Z., Slot, M., and Wang, C.: Decoupling of stomatal conductance, transpiration and photosynthesis in terrestrial plants under elevated temperature: a meta-analysis, Nat. Commun., 17, 1528, https://doi.org/10.1038/s41467-025-68250-x, 2026.
Wöhling, T., Gayler, S., Priesack, E., Ingwersen, J., Wizemann, H.-D., Högy, P., Cuntz, M., Attinger, S., Wulfmeyer, V., and Streck, T.: Multiresponse, multiobjective calibration as a diagnostic tool to compare accuracy and structural limitations of five coupled soil-plant models and CLM3.5: MULTIOBJECTIVE CALIBRATION AS DIAGNOSTIC TOOL, Water Resour. Res., 49, 8200–8221, https://doi.org/10.1002/2013WR014536, 2013.
Yang, J., Duursma, R. A., De Kauwe, M. G., Kumarathunge, D., Jiang, M., Mahmud, K., Gimeno, T. E., Crous, K. Y., Ellsworth, D. S., Peters, J., Choat, B., Eamus, D., and Medlyn, B. E.: Incorporating non-stomatal limitation improves the performance of leaf and canopy models at high vapour pressure deficit, Tree Physiol., tpz103, https://doi.org/10.1093/treephys/tpz103, 2019.
Yin, X. and van Laar, H. H.: Crop Systems Dynamics: An ecophysiological simulation model of genotype-by-environment interactions, Brill | Wageningen Academic, https://doi.org/10.3920/978-90-8686-539-0, 2005.
Yin, X., Kersebaum, K.-C., Beaudoin, N., Constantin, J., Chen, F., Louarn, G., Manevski, K., Hoffmann, M., Kollas, C., Armas-Herrera, C. M., Baby, S., Bindi, M., Dibari, C., Ferchaud, F., Ferrise, R., De Cortazar-Atauri, I. G., Launay, M., Mary, B., Moriondo, M., Öztürk, I., Ruget, F., Sharif, B., Wachter-Ripoche, D., and Olesen, J. E.: Uncertainties in simulating N uptake, net N mineralization, soil mineral N and N leaching in European crop rotations using process-based models, Field Crop. Res., 255, 107863, https://doi.org/10.1016/j.fcr.2020.107863, 2020.
Zhang, Y., Arabi, M., and Paustian, K.: Analysis of parameter uncertainty in model simulations of irrigated and rainfed agroecosystems, Environ. Modell. Softw., 126, 104642, https://doi.org/10.1016/j.envsoft.2020.104642, 2020.
Zhou, S., Duursma, R. A., Medlyn, B. E., Kelly, J. W. G., and Prentice, I. C.: How should we model plant responses to drought? An analysis of stomatal and non-stomatal responses to water stress, Agr. Forest Meteorol., 182–183, 204–214, https://doi.org/10.1016/j.agrformet.2013.05.009, 2013.
- Abstract
- Introduction
- Materials and methods
- Results
- Discussion
- Conclusion
- Appendix A: Daisy modifications
- Appendix B: SMPSO results
- Appendix C: Determination of stomatal conductance
- Appendix D: Heterotrophic respiration
- Code and data availability
- Author contributions
- Competing interests
- Disclaimer
- Acknowledgements
- Review statement
- References