the Creative Commons Attribution 4.0 License.
the Creative Commons Attribution 4.0 License.
 | 15 Apr 2026
Worms and storms: shedding light on bioturbation and physical mixing on an intertidal flat by combining multiple tracers
Tjitske J. Kooistra
Anna-Maartje de Boer
Tjeerd J. Bouma
Natascia Pannozzo
Stuart G. Pearson
Ad van der Spek
Henko de Stigter
Jakob Wallinga
Rob Witbaard
Karline Soetaert
Sediment transport and seabed composition can both be influenced by bioturbation and hydrodynamically driven sediment mixing and deposition. In a dynamic intertidal environment, it is challenging to distinguish the relative contribution of both processes. We aim to unravel their relative importance by combining several tracers, each having its own specific timescale and target particle size. We combined (1) 210Pb that quantifies long-term (years–decades) mixing of fine sediment fractions with (2) Chlorophyll a and (3) luminophores that both quantify short-term mixing of fine sediment fractions (days–weeks), and (4) multi-grain quartz and single-grain feldspar luminescence dating, which use the bleaching of sand grains' inherent luminescence signal by light to assess mixing of sand and thereby quantifies long-term mixing. Single grain feldspar luminescence is here for the first time applied in the intertidal environment. We compare results for a sandy and a muddy intertidal flat at the island of Texel (Wadden Sea, the Netherlands), each with their own characteristic benthic community. Recent bioturbation became apparent from Chlorophyll a and luminophore profiles: particles were rapidly reworked to a depth of decimetres. 210Pb also suggested mixing and non-local exchange of particles by bioturbation. The combination of luminescence signals suggested that after deposition, not all sand grains did resurface repeatedly and for longer time periods through bioturbation. Coarse- and fine-grained tracer profiles show the differential behaviour and reworking of the mud and sand fraction within the sediment matrix: as expected with particle-selective bioturbation, mud is preferentially bioturbated and infiltrates passively, while sand grains have a higher ability to conserve layering. Single-grain feldspar luminescence is a promising technique to demonstrate the long-term reworking of sand grains, however, in young and dynamic environments, a combination of tracers remains necessary to inform on the origin of mixing.
- Article
(8008 KB) - Full-text XML
- BibTeX
- EndNote


In dynamic, soft-sediment seafloors, such as intertidal flats, sediment grain size is influenced by physical and ecological processes. The grain size composition of sediments determines sediment stability and erosion thresholds (Staudt et al., 2019). This, in turn, impacts daily sediment dynamics, and morphology on a larger spatial and temporal scale (Belliard et al., 2019). Sediment composition is also a crucial ecological factor, as it shapes the benthic community (e.g., Compton et al., 2013; Gray, 1974; Kooistra et al., 2025). It is therefore important to understand the drivers of grain-size distribution on intertidal flats. However, obtaining such knowledge is complicated, as the relevant interacting physical and ecological processes can act on different timescales.
Benthic animals e.g. like worms and bivalves can influence their sedimentary habitats by bioturbation (Davison 1891; Kristensen et al. 2012; Meysman et al. 2006; Richter 1952). With their burrowing, feeding and ventilating behaviour, they can influence the composition, stability, and density of the sediment (Jumars and Nowell 1984; Rhoads and Boyer 1982; Widdows and Brinsley 2002). This bioturbation has implications for biochemical cycling and carbon storage by remineralisation and burial of organic matter (Aller, 1982; Snelgrove et al., 2018). The mode of bioturbation differs per species: some randomly displace sediments over short distances (diffusive mixing), while others convey sediment upwards or downwards (advective transport) (François et al., 1997; Queirós et al., 2013). Moreover, bioturbators can be selective for particle size and type (Jumars et al. 1982; Taghon 1982).
Physical sediment deposition and reworking is dependent on periodic hydrodynamics, such as tidal currents, as well as waves and currents induced by meteorological conditions. During calm atmospheric conditions, spring- and neap tide periodicity can create layered bedding (Deloffre et al., 2007; Zhou et al., 2021), and tidal currents and wave forcing can result in a dynamic morphological equilibrium with bed level changes of 5–10 cm d−1 in macrotidal systems (Grandjean et al., 2023; Hu et al., 2018). In such systems, reworking by tidal current forcing is dominant at lower intertidal flats, while waves, generated by wind, are a major driver in the high intertidal (Belliard et al., 2019). High-energy events, such as storms, can transport large amounts of sediment over a short time span (de Vet et al., 2018). A storm can result in sediment relocations equivalent to at least months–years of sediment displacements under calm conditions, reworking sediment down to 15 cm depth (Fan et al., 2006; Hu et al., 2018; de Vet et al., 2020). Such intense meteorological events can deposit a coarse sand layer on a tidal flat (Zhou et al., 2022), or increase mud deposition by increasing inundation time and suspended sediment concentration as well as creating accommodation space by erosion (Colosimo et al., 2023; Gao, 2018; Grandjean et al., 2023). Storm events can therefore be recognised in layering of the sediment bedding, where the timing relative to the spring-neap tidal cycle and storm chronology determines the storm layer grain size composition (Wang and Cheng, 2016; Zhou et al., 2022). This stratification can however largely be smoothed out by daily bioturbation, thereby erasing the signals of episodic deposition (Wheatcroft, 1990).
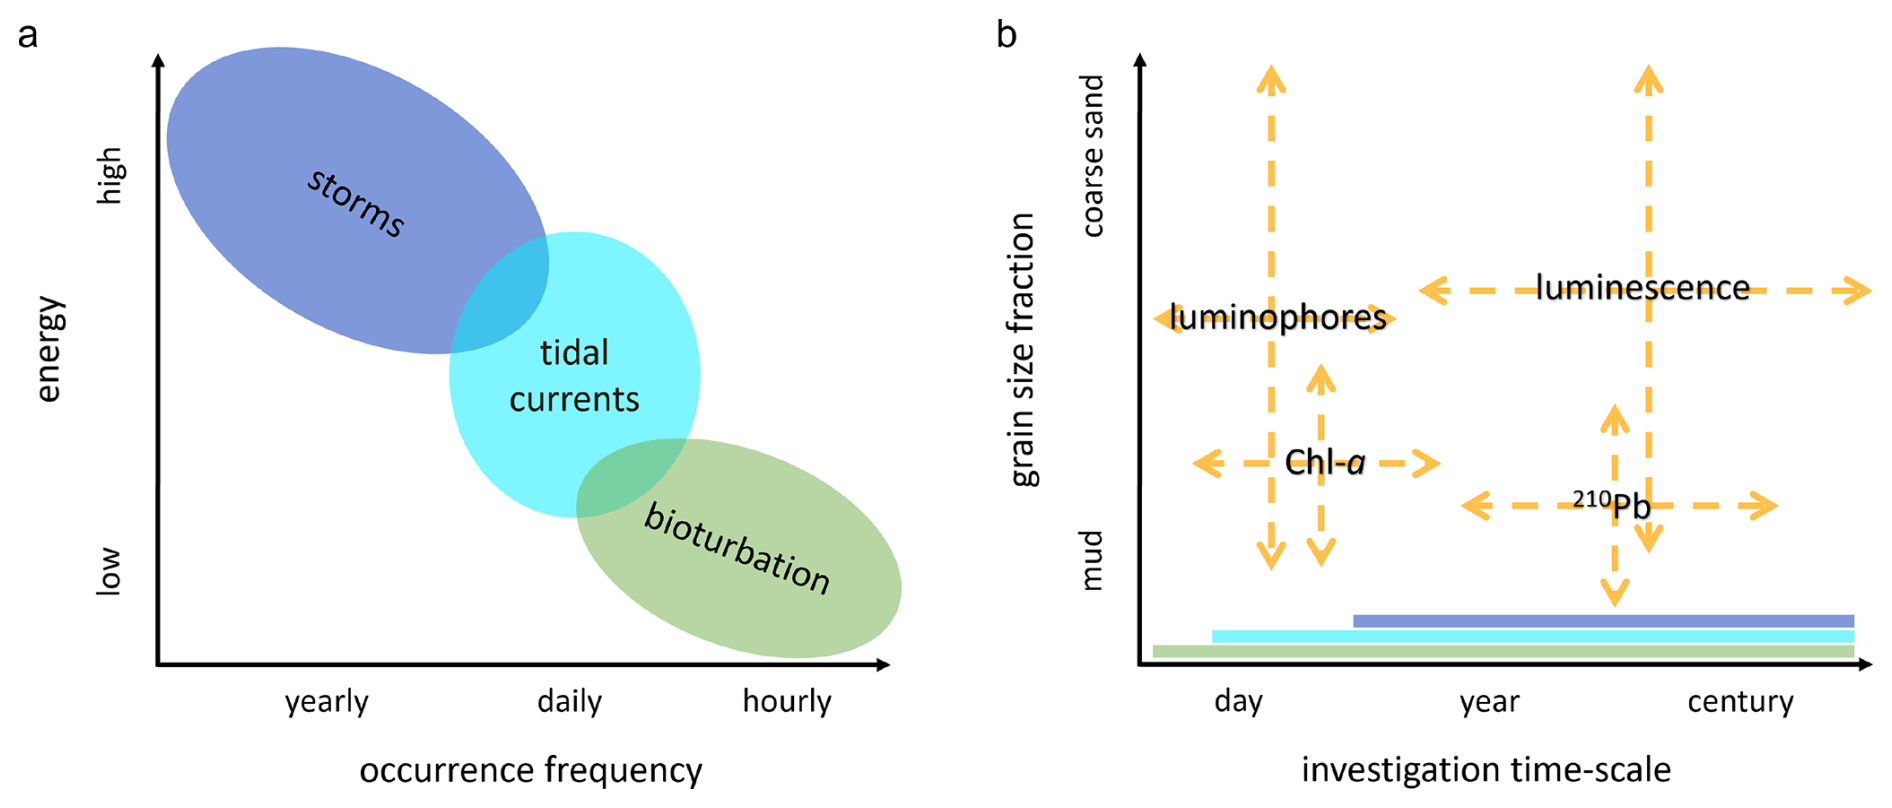
Figure 1(a) mixing processes with their occurrence frequency and energy; (b) sediment tracers with their relevant investigation timescales and potential target sediment fraction. The mixing processes that are recorded in the tracer distributions, depending on the moment and period of sampling, are indicated as bands along the x-axis.
It is challenging to disentangle the biological from the physical control on sediment composition, i.e. to determine the extent to which “(per)turbation” is actually “bio”. While on short timescales (days–weeks) and in controlled experiments, grains reworked by bioturbation can be clearly isolated from those reworked by hydrodynamics, on longer timescales (years–centuries) and in dynamic natural environments, this is nearly impossible. Furthermore, the relative magnitude of these processes is highly site-specific. To obtain insight in the reworking processes in intertidal environments, acting at different frequencies and energy levels, we need tracers that gather information on short- and long-term reworking of different sediment fractions (Fig. 1). A short-term tracer needs to be exposed to a sufficient number of mixing events relative to its timescale, therefore the spatial and temporal scale of sampling should match mixing intensity (Meysman et al., 2010). Long-term tracers may instead provide a more integrated result than short-term tracers, reflecting both long-term sediment dynamics, as well as recent reworking. Vertical profiles can then inform on the short- and long-term reworking and deposition history. A strongly stratified profile might point to episodic deposition events, while a homogeneous signal over depth might indicate intense mixing by biota or hydrodynamics. Bioturbation might also cause sub-surface supply of young material through advective vertical transport (Meysman et al. 2003; Richter et al. 1996). Thus, combining signals can shed light on the origin of mixing processes acting in dynamic coastal sediments.
Table 1Tracers used in this study with their target grain size fraction, half-life time (Chl a and 210Pb) or bleaching time (luminescence signals). For the tracers with a half-life time, investigation timescales are 5× the tracer half-life (Lecroart et al., 2010; Meysman et al., 2008). Subaerial estimated bleaching times for luminescence signals are shown (Colarossi et al., 2015; Godfrey-Smith et al., 1988; Smedley et al., 2015).
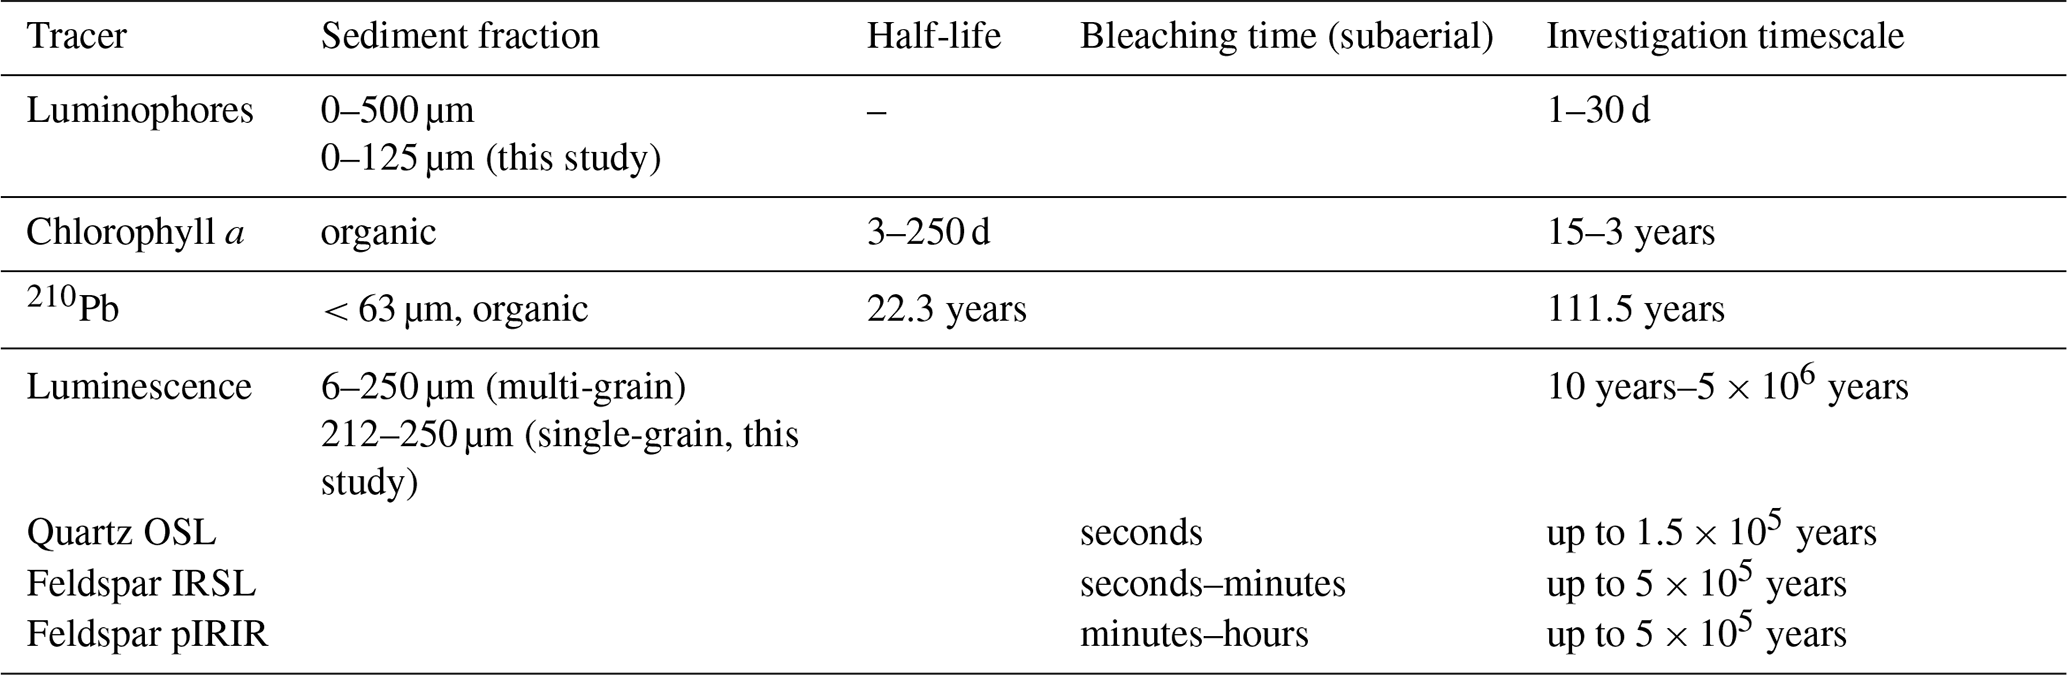
The relevant timescale and grain size fraction is specific for each tracer type (Table 1). Tracers that are commonly used for studying bioturbation in dynamic marine sediments have been previously reviewed by Maire et al. (2008). Here we highlight several commonly used tracers in the context of timescale and grain size. Tracers that give information on recent bioturbation are Chlorophyll a (Chl a) and luminophores. Due to its wide occurrence, Chl a is often used as a non-conservative short term tracer for bioturbation. Drawbacks are that the decay time varies with environmental conditions (Sun et al., 1993), and herbivorous biota may actively select for Chl a (Taghon, 1982). Luminophores are fluorescent coated particles that are commonly used to describe bioturbation over timescales of days to months to study particle size-specific and species- or community-specific mixing (Gerino et al., 1998; Montserrat et al., 2011; Wintle, 2008). For longer-term sediment bioturbation, radioisotopes, with known half-lives, are commonly used in marine environments. One example is lead-210 (210Pb), which is produced in the atmosphere and water column in the naturally occurring uranium decay chain and is deposited on the seafloor. After burial, 210Pb activity decays until it reaches background levels. 210Pb has been used to determine deposition and mixing of sediments, from the deep sea to estuarine and intertidal environments (Benninger et al., 1979; Richter et al., 1996).
Currently, tracers that allow to study mixing of sand-sized particles over long timescales in intertidal flats are lacking. One inherent characteristic of sand grains is their luminescence signal (Madsen and Murray, 2009). This is a latent light signal that builds up in minerals in response to exposure to ionizing radiation from the natural environment. The luminescence signals are reset upon exposure to light and thereby provide an estimate of the last light exposure of these minerals (i.e. the time grains were last at the surface). The light exposure needed to fully reset luminescence signals varies for minerals and the luminescence signal used. For quartz OSL a few tenths of seconds of direct sunlight is sufficient for resetting (Lindvall et al., 2017) while feldspar post IR IRSL signals reset much slower (de Boer et al., 2026b). Moreover, ambient light levels vary in time and space as they are affected wide range of aspects including time of day, latitude and inundation (de Boer et al., 2026b).
Multi-grain quartz optically stimulated luminescence (OSL) has been applied for dating intertidal flat sediments (de Boer et al., 2024a; Madsen et al., 2005, 2007, 2011; Mauz et al., 2010; Mauz and Bungenstock, 2007). In the terrestrial environment, luminescence methods are increasingly used to shed light on sediment mixing processes (Heimsath et al., 2002; Kristensen et al., 2015; van der Meij et al., 2025; Reimann et al., 2017; Stockmann et al., 2013; Zhang et al., 2025). Madsen et al. (2011) estimated sedimentation and bioturbation rates on an intertidal sandflat using large-aliquot quartz OSL on the grainsize 90–250 µm. However, this tracer only gives the average age of all luminescing grains in a subsample (often referred to as aliquot), which may be biased by a few older grains (Kristensen et al., 2015; Wallinga, 2002; Wallinga et al., 2019). Small-aliquot quartz OSL and single-grain feldspar luminescence advances the applicability of luminescence for studying mixing. Measuring the signal on individual grain level produces more meaningful results regarding mixing, as it also shows the fraction of reworked grains, and therefore the effectiveness or reworking (Reimann et al., 2017; Wallinga et al., 2019). Single grain luminescence has been successfully applied in terrestrial systems to determine effective bioturbation rates (Román-Sánchez et al., 2019) and has potential to quantify mixing by different bioturbation modes (van der Meij et al., 2025). Feldspar infrared stimulated luminescence (IRSL) or post-infra-red IRSL (pIRIR) measured at varying temperatures are commonly used single-grain signals. As these signals are less light sensitive than quartz OSL: they need longer light exposure to be fully reset and can therefore hold additional information on the transport and deposition history (de Boer et al., 2026b, a; Choi et al., 2024; Guyez et al., 2023).
Measuring single-grain luminescence signals with differential bleaching rates can inform about the light exposure duration and whether bleaching occurred under water (de Boer et al., 2026b). They can therefore be used to identify intertidal storm deposits (Pannozzo et al., 2023), or to infer whether bleaching occurred during subaqueous transport or during subaerial exposure on the tidal flat. Bleaching potential is low during storms and strong hydrodynamic conditions, due to high turbidity and low light exposure, while biotic mixing also takes place during calm conditions and intensifies in the summer season, when light and thus bleaching potential is higher. Moreover, biotic mixing also occurs in the moist tidal flat during low tide, when the flat is subaerially exposed (Cadee, 1976).
The goal of this case study is twofold: firstly we aim to unravel the relative contributions of bioturbation and physical dynamics to sediment mixing in a (micro)tidal flat environment, using tracers that act on different timescales and on different sediment fractions. Secondly, we test the application of single-grain luminescence to study sand grain reworking in the intertidal environment, and compare tracer profiles with traditional short-term (Chl a, luminophores) and long-term (210Pb) tracers. We aim to answer the questions: (i) how do short- and long-term tracers aid in distinguishing bioturbation from physical mixing? And (ii) can single-grain luminescence be meaningfully applied as a bioturbation tracer in such dynamic environments? We hypothesise that, if biotic mixing dominates, we will observe tracer-dependent mixing and, depending on the benthic community, diffusive or advective transport. With intense bioturbation, the slow-to-bleach luminescence signals will also be more fully bleached. If physical dynamics, such as wind and tidal reworking, are responsible for the deposition and sediment mixing, we expect a clearer stratification. Slow-to-bleach luminescence signals will be poorly bleached. We compare two adjacent intertidal locations: a sandy and a muddy flat in the Dutch Wadden Sea.
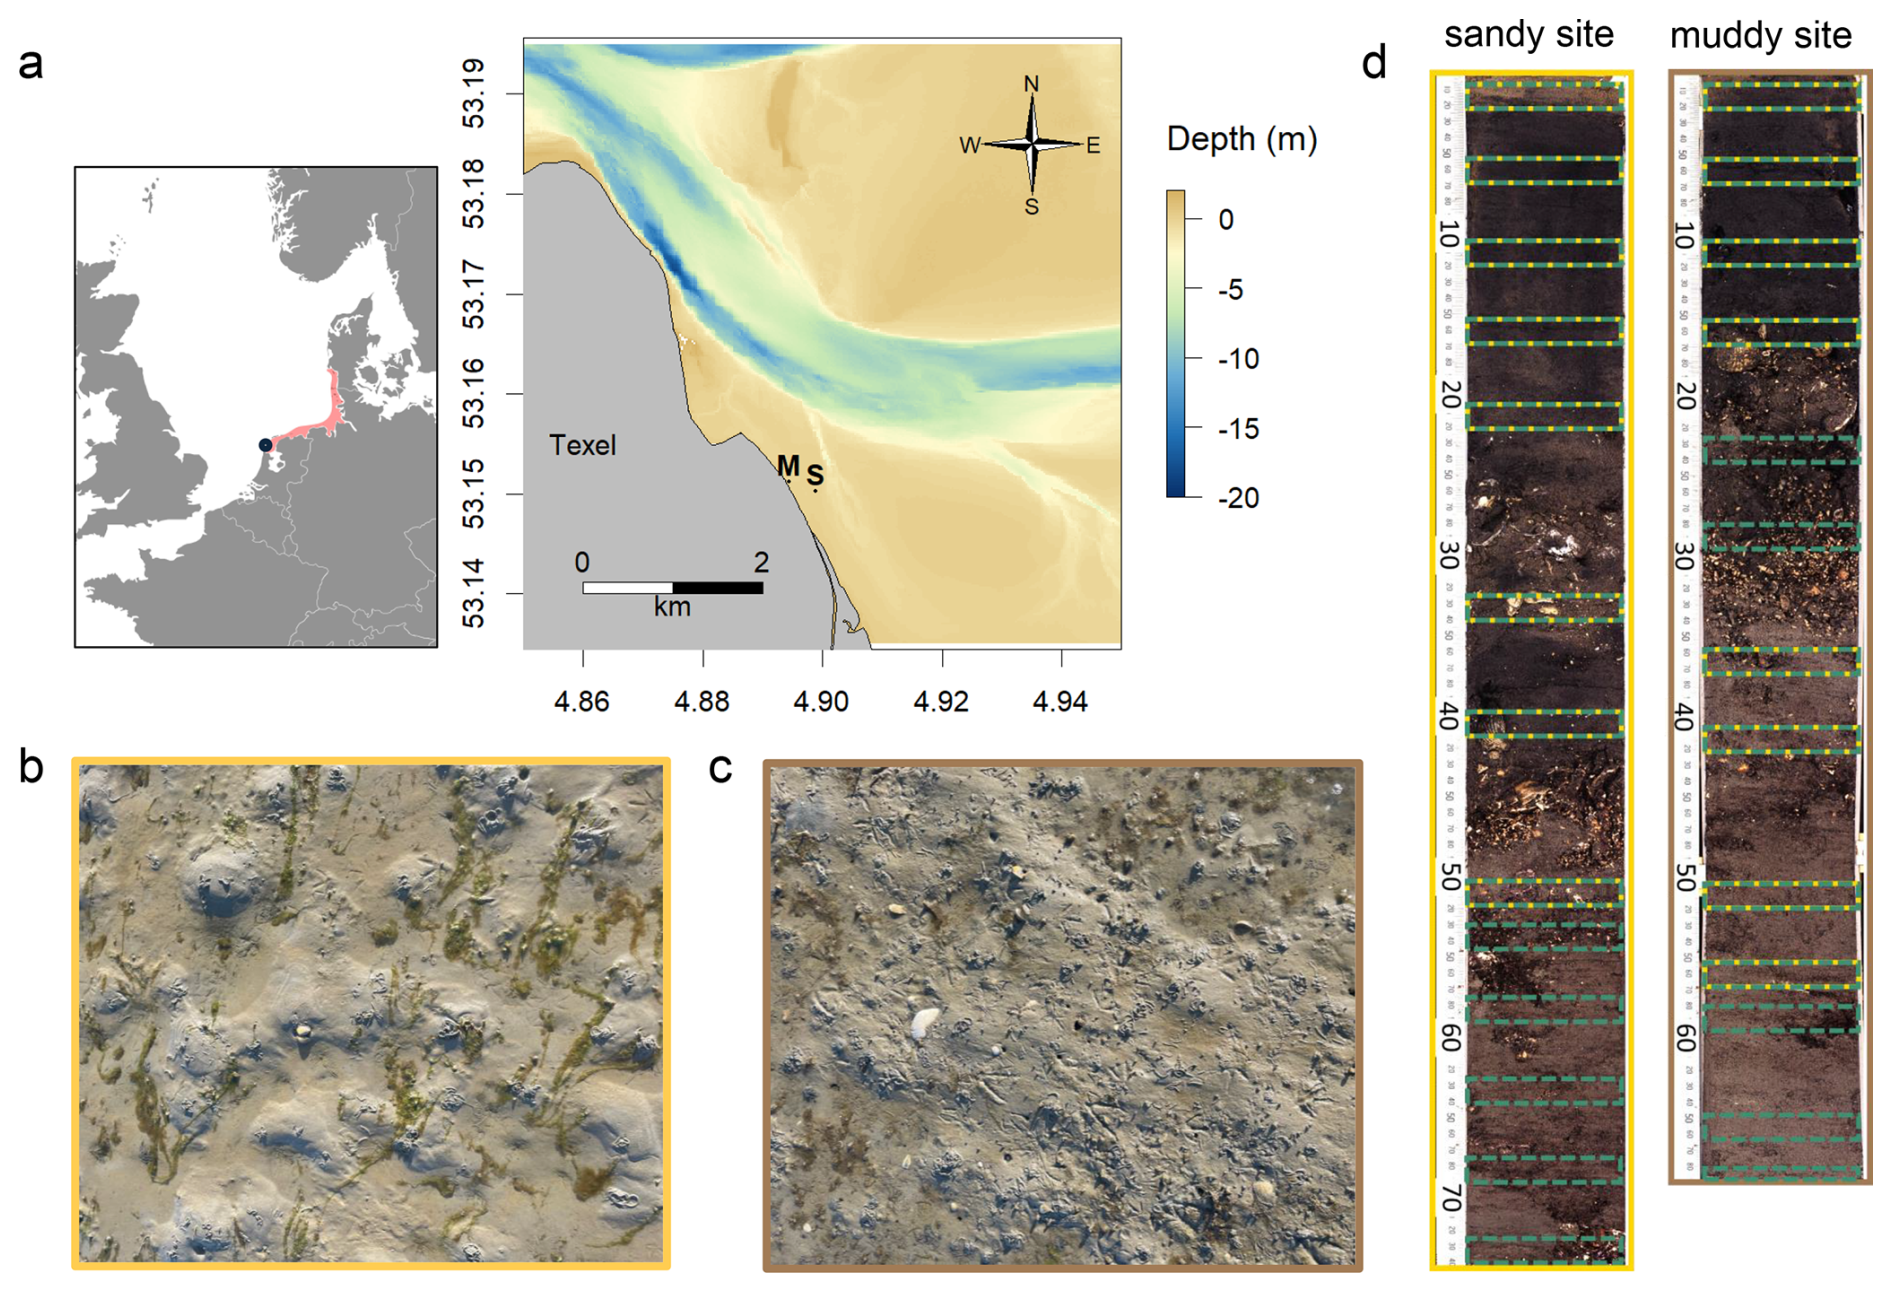
Figure 2(a) Map and bathymetry of the study area, located north-east off the island of Texel Wadden Sea (Netherlands), with muddy (M) and sandy (S) sampling locations indicated. The inset shows the location of the Wadden Sea (red) in western Europe, and the location of the study site (blue dot); picture of sediment surface at the sandy site (b – yellow) and muddy site (c – brown); (d) core scan from long cores from both sites, with the sampling intervals for 210Pb (green) and luminescence (yellow) samples indicated.
2.1 Site description
The sampling site is located in the western Dutch Wadden Sea, near the northern tip the island of Texel (Fig. 2). We selected two adjacent intertidal locations: a muddy site (53°9.074′ N, 4°53.67′ E; −0.055 m relative to Dutch ordinance datum (NAP) – approximately mean sea level), with visible benthic activity (small cast mounds, burrows), and a sandy site (53°9.013′ N, 4°53.931′ E; 0.004 m), with presence of large lugworms (large cast mounds and depressions). The sites are microtidal, with a mean tidal range of 1.43 m at the nearest measurement station (Oudeschild). This implies that during high tide the maximum water depth is 0.7 m (0.8 m during spring tides). The sites are located approximately 5 km south-eastwards of the tidal inlet and are relatively sheltered from the prevailing south-westerly winds. Our findings apply therefore to similar microtidal sites.
2.2 Benthic community sampling and analysis
To describe the benthic community, we sampled both sites using a hand corer (surface area of 0.0177 m2), which was pushed into the sediment until encountering the first shell layer (depth approximately 0.25 m). The core sample was sieved over 1 mm mesh size and the remaining coarse fraction including biota was conserved in 4 % formaldehyde, buffered with borax and stained with Rose Bengal (CAS Number: 4159-77-7). In the laboratory, samples were sorted and biota were identified. Next, dry weight (DW) was measured after drying at 60 °C for 2–3 d and ash free dry weight (AFDW) was measured after combustion at 560 °C for 5 h, to yield biomass per taxon. Due to the limited area and depth of our samples and the lower density of larger Arenicola marina individuals, we did not capture this species in our samples. From the field observations of large A. marina casts at the sandy location, we expected this species to dominate bioturbation. Therefore, we also derived A. marina density based on cast counts from pictures from both locations (4 pictures per site). To estimate individual biomass, we actively collected A. marina from both sites with a spade (N=17), which were dried in the same way as the benthic community samples. We derived bioturbation traits and living depth from a trait database (Beauchard et al., 2023) and calculated the total biomass per trait group.
2.3 Sampling of long cores
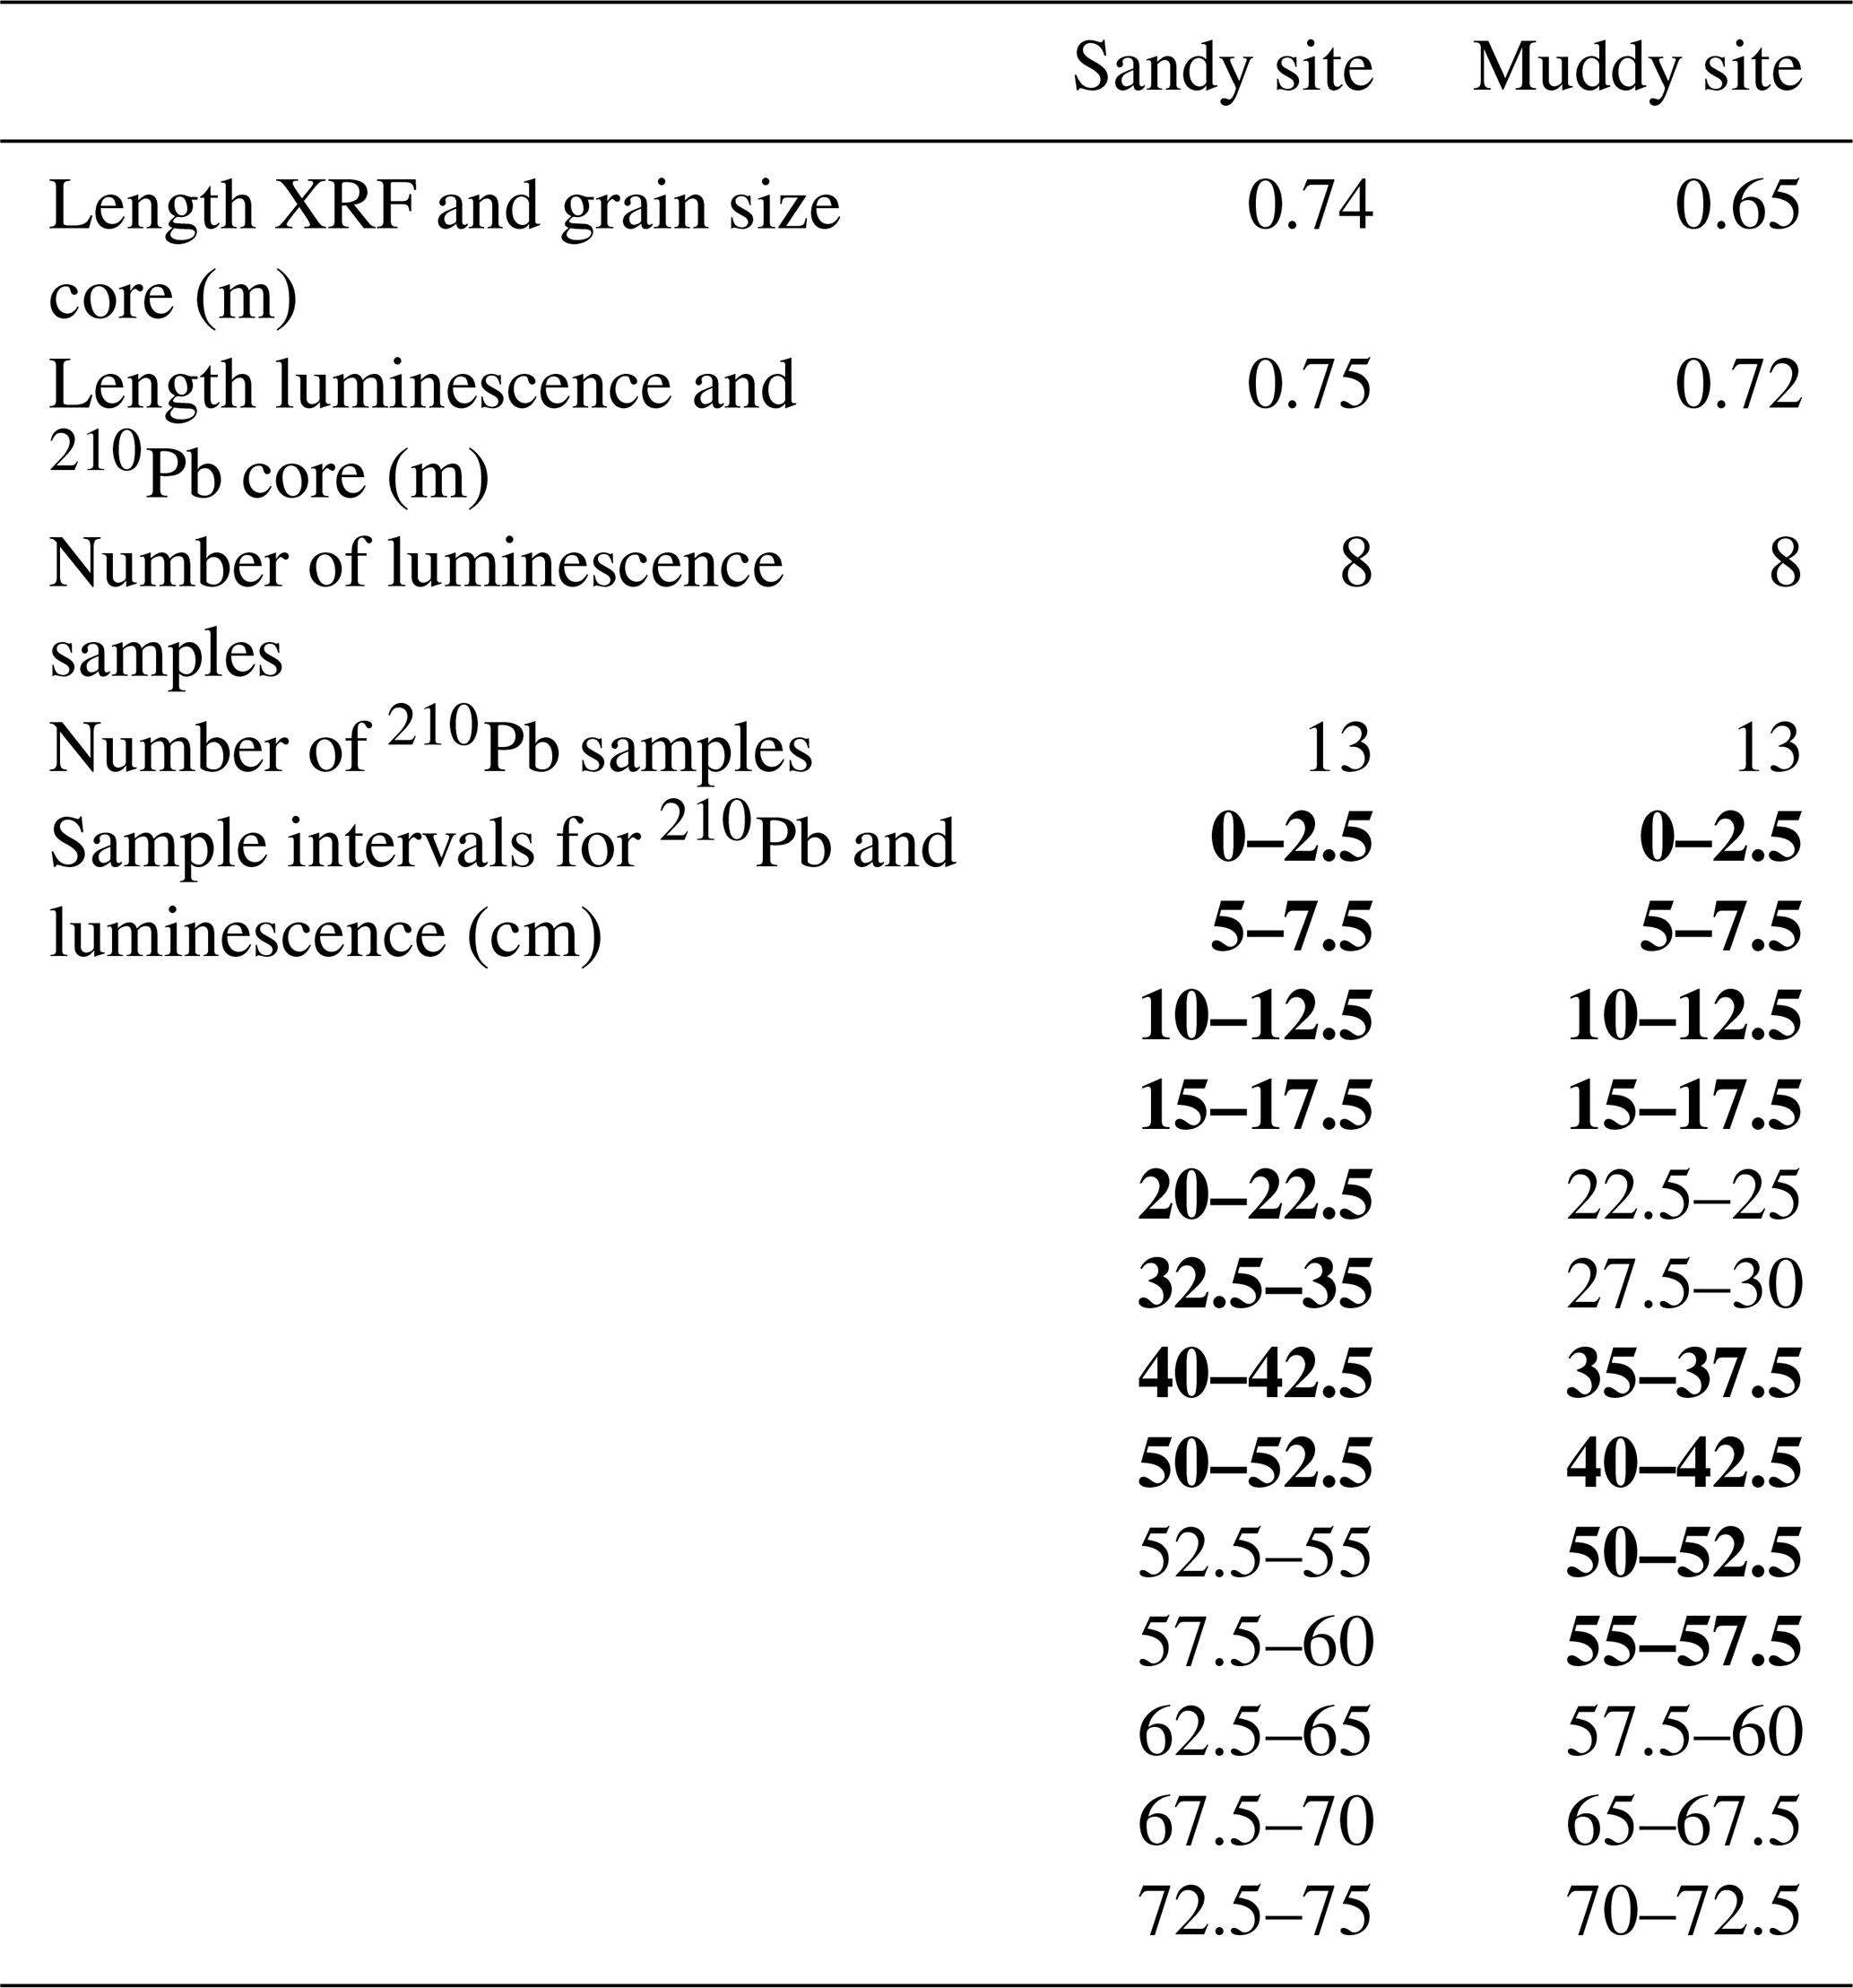
Two replicate sediment cores were collected at each site in August 2023 for grain size analysis, geochemical composition (X-ray fluorescence, XRF), 210Pb and luminescence analysis. The cores were obtained by hammering two PVC tubes (inner diameter 96 mm) side by side vertically into the tidal flat deposits. After extraction from the tidal flat, the cores were sealed and transported to a dark container where under subdued amber-light conditions a core slicer was used to split each core into two halves. One of the cores halves was kept for luminescence and 210Pb sampling, the other was kept for XRF scanning and sediment composition. We subsampled luminescence and 210Pb samples by cutting 25 mm thick slices from the top to the bottom of each core, of which we selected eight per core for luminescence analysis (see Fig. 2 and Table A1 for intervals). The inner portion of each slice was used for luminescence equivalent dose (De, Sect. 2.6.1) estimation and 210Pb analysis, while the outer material was reserved for determining the environmental dose rate (D⋅, Sect. 2.6.2). The sediment was wet-sieved in a dark room environment to separate the grain-size range of 212–250 µm, used for luminescence analysis, from the fraction smaller than 63 µm, used for 210Pb analysis. We measured 210Pb for five additional samples of each core, amounting to a total of 13 210Pb samples per core.
2.4 Sediment composition: grain size and X-ray fluorescence (XRF)
For grain size distribution, half of each long core was subsampled in 25 mm slices. These samples were freeze-dried, sieved over 1000 µm and measured by laser diffraction (Mastersizer 2000, Malvern Instruments). We determined the volumetric content of sediment size fractions from mud to coarse sand, and the median grain size (d50), and 10th and 90th percentile of the grain size distribution (d10 and d50).
We measured bulk elemental composition over the entire depth of the long cores at 10 mm resolution by X-ray fluorescence, using an AvaaTech XRF core scanner at the Royal Netherlands Institute for Sea Research (NIOZ) (Richter et al., 2006). Each section was exposed for 10 s with a power supply of 10 kV/0.60 mA, or 30 kV/1.6 mA. This yielded bulk elemental composition as element intensities in total counts or counts per second. We selected the following elements and ratios as environmental proxies: Si:K (sand indicator), Cl:Fe (saline pore water indicator, thus proxy of porosity); Ca:Fe (shell content indicator; Croudace et al., 2006), Rb (silt/clay mineral indicator; Guyard et al. (2007); note that the XRF detector window contains rubidium crystals, explaining high counts for this element); and Br (organic content indicator; Ziegler et al., 2008).
Table 2Luminescence measurement protocols: Single-Aliquot Regenerative-dose protocol (SAR) for multi-grain quartz measurements and multiple-elevated-temperature (MET) pIRIR measurements for single-grain feldspar.
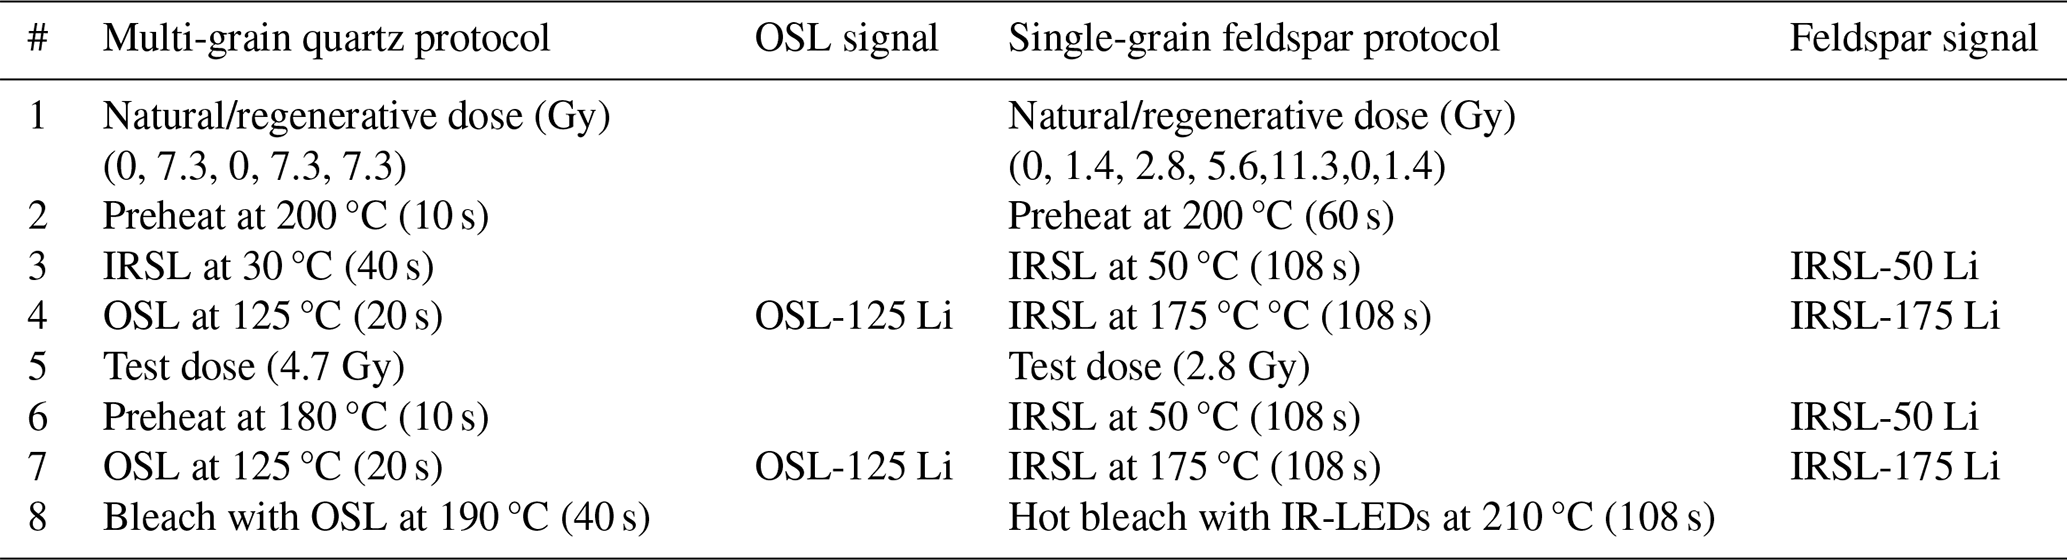
∗ Only in the last regenerative run to check for feldspar contamination
2.5 210Pb measurement via alpha spectrometry
The downcore distribution of 210Pb in the mud fraction (< 63 µm) of the sediment was determined indirectly through alpha spectrometry measurement of its grandchild isotope polonium-210 (210Po) (de Stigter et al., 2011). To this end, 0.5 g of dried and homogenized mud, wet sieved from the bulk sediment sample, was spiked with 1 mL of a standard solution of 209Po in 2 M HCl, and then leached for 6 h in 10 mL of concentrated HCl, heated in a hotblock to 85 °C. After diluting the fluid with 45 mL of Milli-Q water and adding 5 mL of an aqueous solution of ascorbic acid (40 g L−1), natural 210Po and added 209Po were collected from the fluid by spontaneous electrochemical deposition on silver plates, with the fluid kept at 75 °C in a hotblock for 16 h. For subsequent alpha-spectrometry, Canberra Passivated implanted Planar Silicon detectors were used. 210Pb activity was calculated from the measured 210Po activity, assuming secular equilibrium and correcting for the time elapsed since collection of the samples.
2.6 Luminescence measurements
The luminescence samples were prepared at the Netherlands Centre for Luminescence Dating (NCL) under amber light conditions.
2.6.1 Equivalent dose (De) measurements
Quartz and feldspar luminescence samples were prepared following a standardised protocol (Appendix A2.1). The multi-grain quartz aliquots (48 per sample) were measured using an automated Risø TL/OSL DA-15 reader, following a Single-Aliquot Regenerative-dose protocol (SAR) (Table 2). The single-grain feldspar measurements were performed using an automated Risø TL/OSL DA-20 reader with an automated detection and stimulation head (DASH) and an EMCCD camera (Kook et al., 2015). A multiple-elevated-temperature (MET) pIRIR measurement protocol was used (Table 2) (de Boer et al., 2024b; Li and Li, 2011). Three single-grain discs per sample were used, resulting in approximately 250 grains measured per sample. For more details on the measurement procedure, see Appendix A2.1.
2.6.2 Dose rate (D⋅) measurements
Environmental dose rates, the natural amount of natural ionizing radiation absorbed by a sample per unit of time, were determined with gamma-ray spectrometry (Appendix A2.2). Results are combined with information on burial history, water and organic content history, and the measured grain-size fraction to calculate the effective external beta and gamma dose rates (Cunningham et al., 2022). For cosmic dose rate calculation (Prescott et al., 1994), we assumed gradual burial of the samples to the present depth. This is a crude assumption given the episodic nature of deposition and potential reworking of grains after deposition in this environment. However, the effects of this assumption are minor as the cosmic dose constitutes a minor fraction of the total dose rate experienced by the grains (< 25 % even for samples closest to the surface). Per core, the average water content over all samples was used, yielding gravimetric water content of 28.5 % (muddy core) and 25.5 % (sandy core), with a relative uncertainty of 25 % to account for variations over time. The organic content per sample was used to account for attenuation. We included an internal alpha dose of 0.010 ± 0.005 Gy ka−1 for quartz (Vandenberghe et al., 2008) and 0.050 ± 0.025 Gy ka−1 for feldspar (Kars et al., 2012). An internal K-content of 12.5 % was assumed for the K-feldspar grains. As gamma-rays penetrate 20–30 cm in the deposits, contributions from adjacent layers are accounted for following the approach of Wallinga et al. (2010).
2.6.3 Data analysis
The sample age is calculated by dividing the equivalent dose value by the mean dose rate: age (years) = De (Gy)/D⋅ (Gy yr−1) (Rhodes, 2011). To interpret the quartz OSL single-aliquot (multi-grain) and feldspar IRSL and pIRIR single-grain age distributions, we used several approaches. Firstly, a mean was calculated after iterative removal of datapoints that deviate more than two standard deviations from the mean. This iterative approach aims to identify the mean age, while minimising bias due to outliers that may be caused due to poor bleaching or recent input of young (bleached) grains. Secondly, a logged version of the Central Age Model (CAM) (Galbraith et al., 1999) was used to quantify the overdispersion and obtain a mean burial age for samples that are relatively well-bleached. Finally, the logged bootstrapped Minimum Age Model (bMAM) (Cunningham and Wallinga, 2012; Galbraith et al., 1999) with a sigma-b of 0.25 ± 0.05 was used to determine the absorbed dose of the youngest population of grains. Lastly, we determined the interquartile range (IQR) of the age distribution of each signal, as a direct metric of the width of the distribution for each signal (van der Meij et al., 2025). All analyses were performed in R (R Core Team, 2024) with use of the Luminescence package (Kreutzer et al., 2025).
2.7 Luminophore tracer experiment
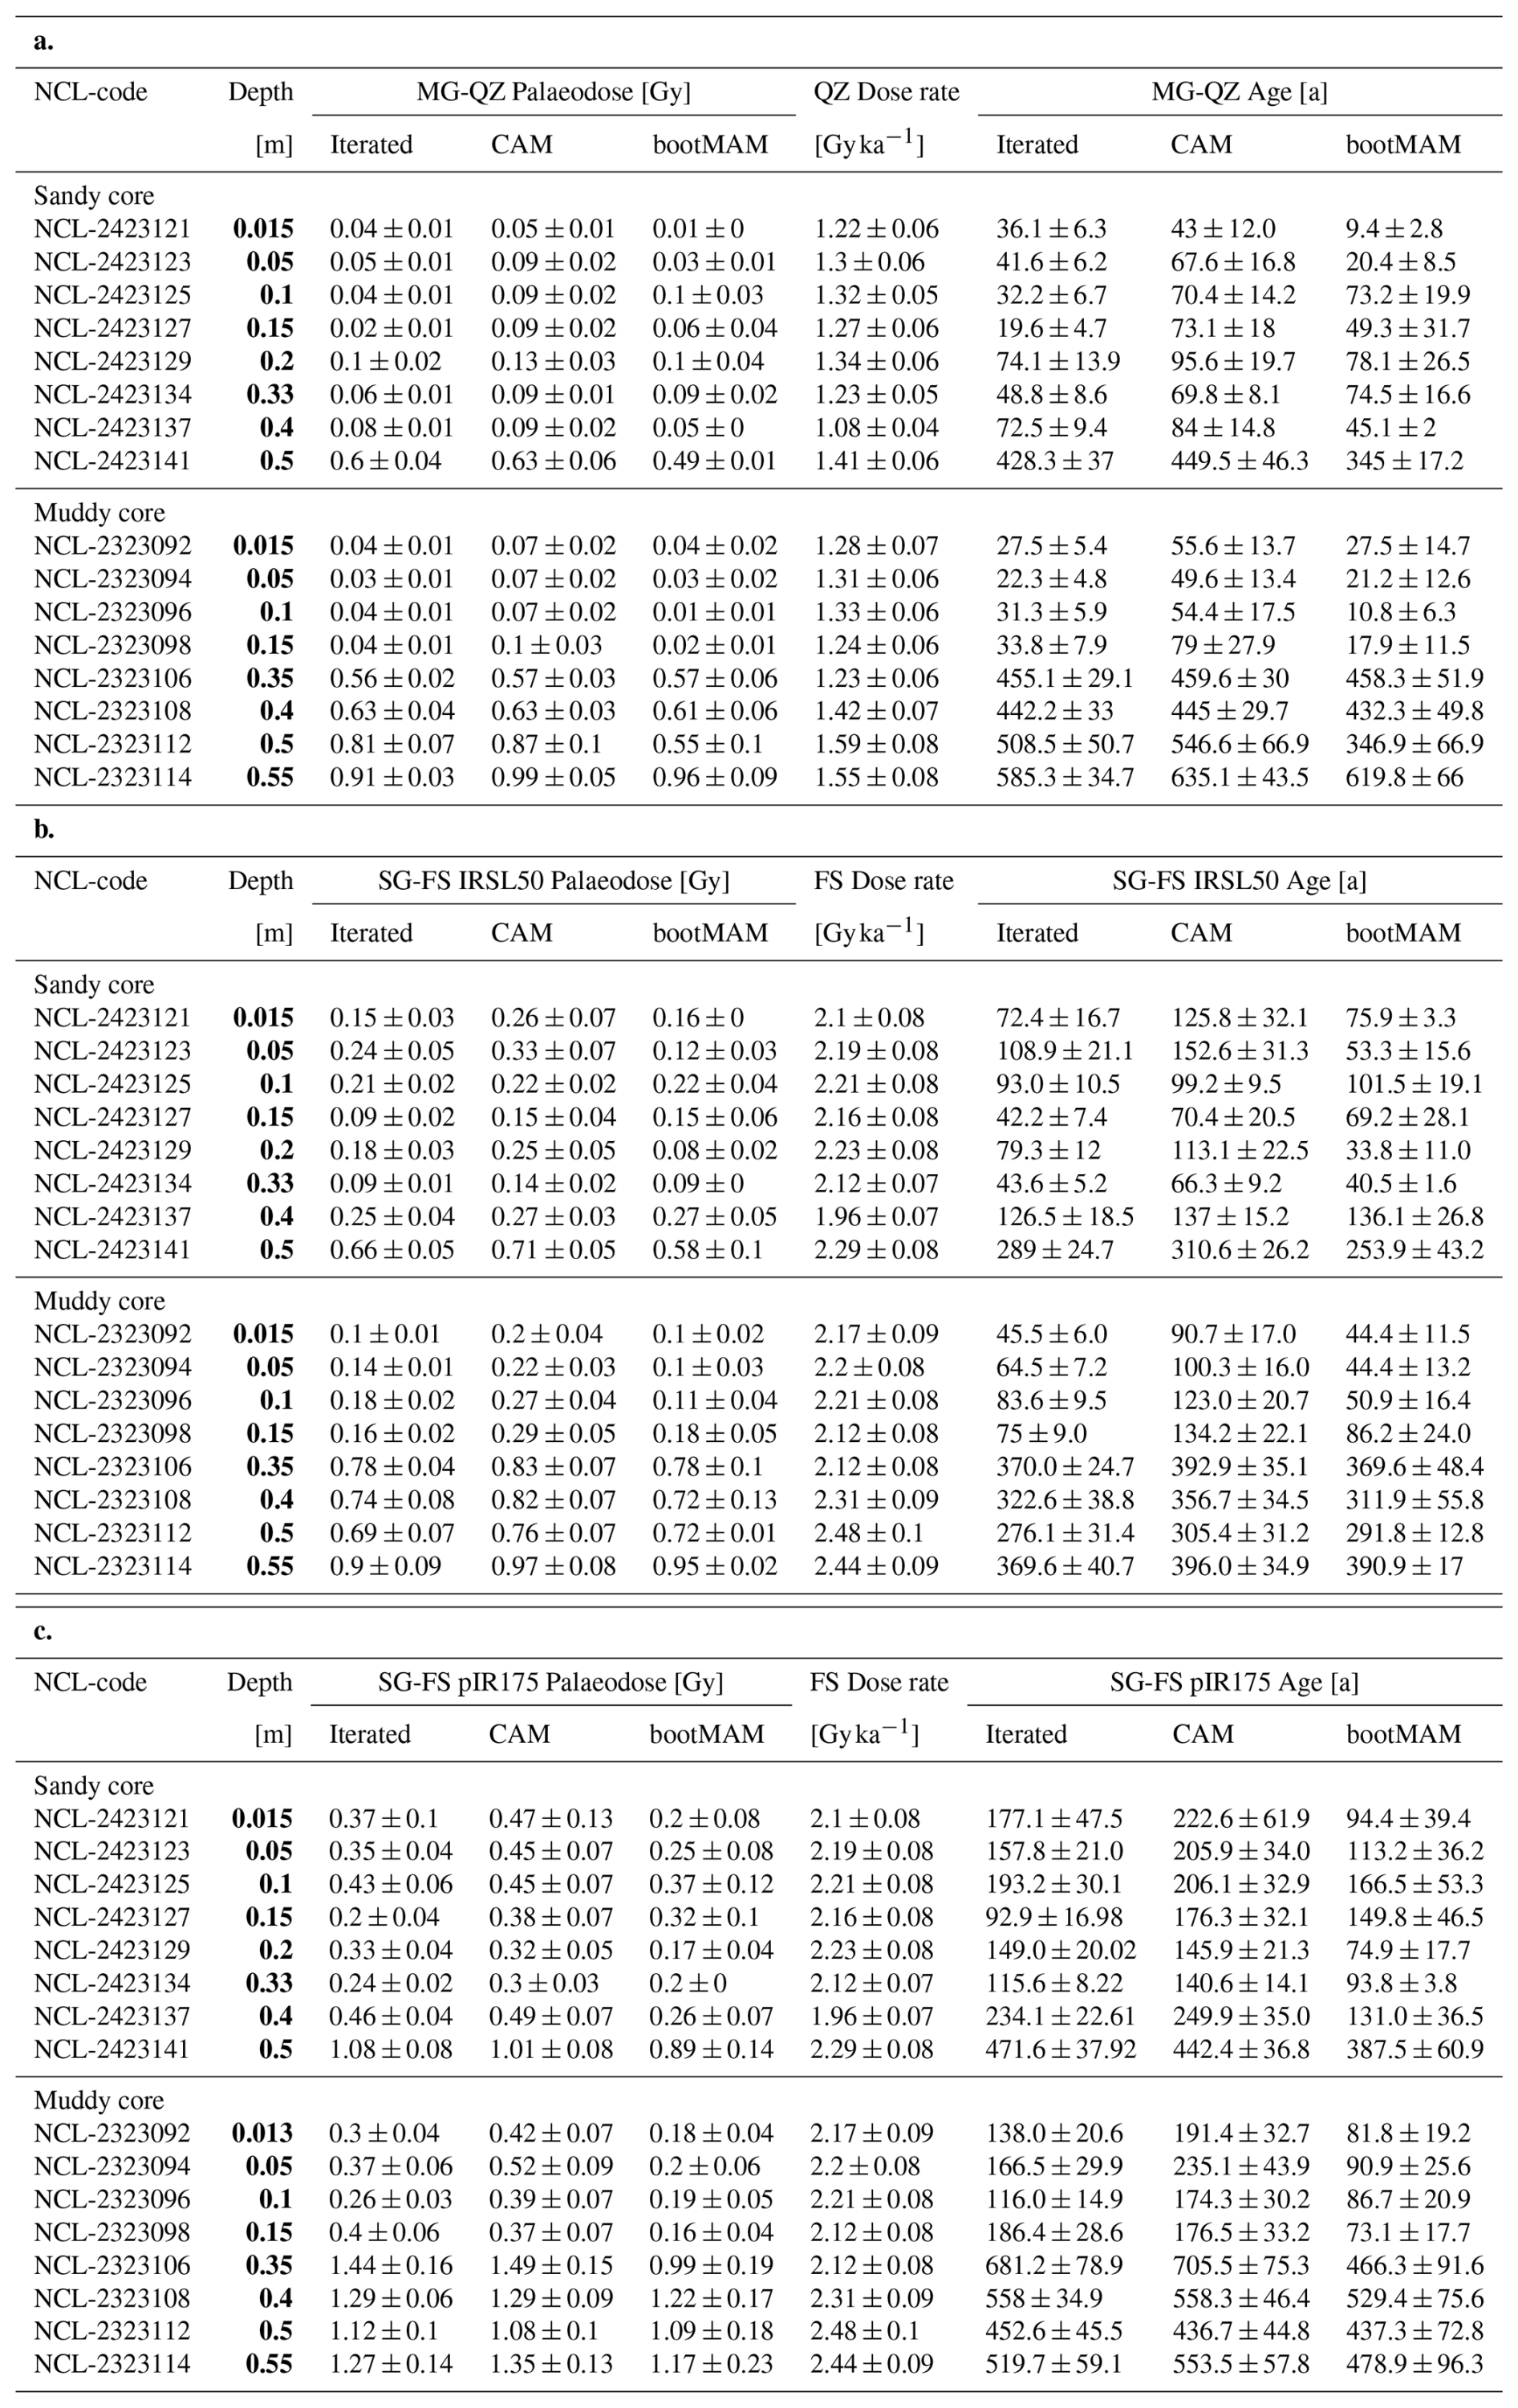
Simultaneous to the long core sampling, we started a luminophore tracer experiment adjacent to both sampling locations. Fluorescent coated luminophores (red/pink tracer, size range: 0–125 µm) were mixed with sieved native sediment from each site (ratio 1:10 for the muddy sediment and 1:17 for the sandy sediment) and applied to the sediment surface as 15 cm × 15 cm × 0.5 cm frozen tiles. Per site, three experimental plots were created by aligning four of these tiles – thus each covering a total area of 30 cm × 30 cm. These were sampled on day 2, 16 and 30 by pushing a PVC tube (diameter 36 mm) at least 20 cm deep into the sediment. The resulting sediment cores (one per plot) were frozen upright. In order to find evidence of recent bioturbation of the fine particles, the frozen cores were sliced in length direction with a tile saw. The cutting surface was scraped clean in lateral direction until the still frozen sediment was reached. If cutting had resulted in visible artefacts in the sediment (cavities or disturbed sediment surface), the damaged core or half core was excluded from analysis, leaving two replicate cores per site per time point. Next, both halves of the core were photographed in a dark room under ultraviolet light, with a ruler for scale reference. The images were processed using ImageJ (Schneider et al., 2012): first, we adjusted the display settings Level ≈ 50 and Window ≈ 100. Red and orange pixels were then identified per 2 cm depth slice by extracting RGB values of each pixel, and applying thresholds (R > 150, G > 40, G < R–30, B < 100). The total count of pixels meeting these criteria was recorded as the red–orange pixel count. The average number of pixels per depth interval were averaged over both core halves.
2.8 Chlorophyll a sampling and measurements
Chlorophyll a cores were collected next to the luminophore tracer experiment. Cores (inner diameter 36 mm) were collected on 22 August and 5 October 2023 (day 1 and day 45 of the luminophore experiment, respectively 2 and 3 cores per site). The cores were pushed into the sediment as deep as possible, or at least 15 cm deep. We sliced the cores every 0.5 cm down to 3 cm depth, then every 1 cm down to 15 cm depth. The samples were stored at −80 °C and freeze-dried for 72 h before analysis. Next, we homogenised and weighed an aliquot of the sediment (approximately 1000–1500 mg for the sandy site samples and 300–500 mg for the muddy site samples). We extracted Chl a by adding 5 mL 90 % acetone in 50 mL centrifuge tubes and running them in a bullet blender (BB50-AUCE, Next Advance) for 15 min, after which 5 mL 90 % acetone was added again and extraction was repeated for another 15 min. The extracts were measured in a spectrophotometer (Specord 210, Analytik Jena) at 630, 647, 664, 665 and 750 nm. From the measured extinction values, we calculated Chl a concentration following Ritchie (2006).
3.1 Benthic community
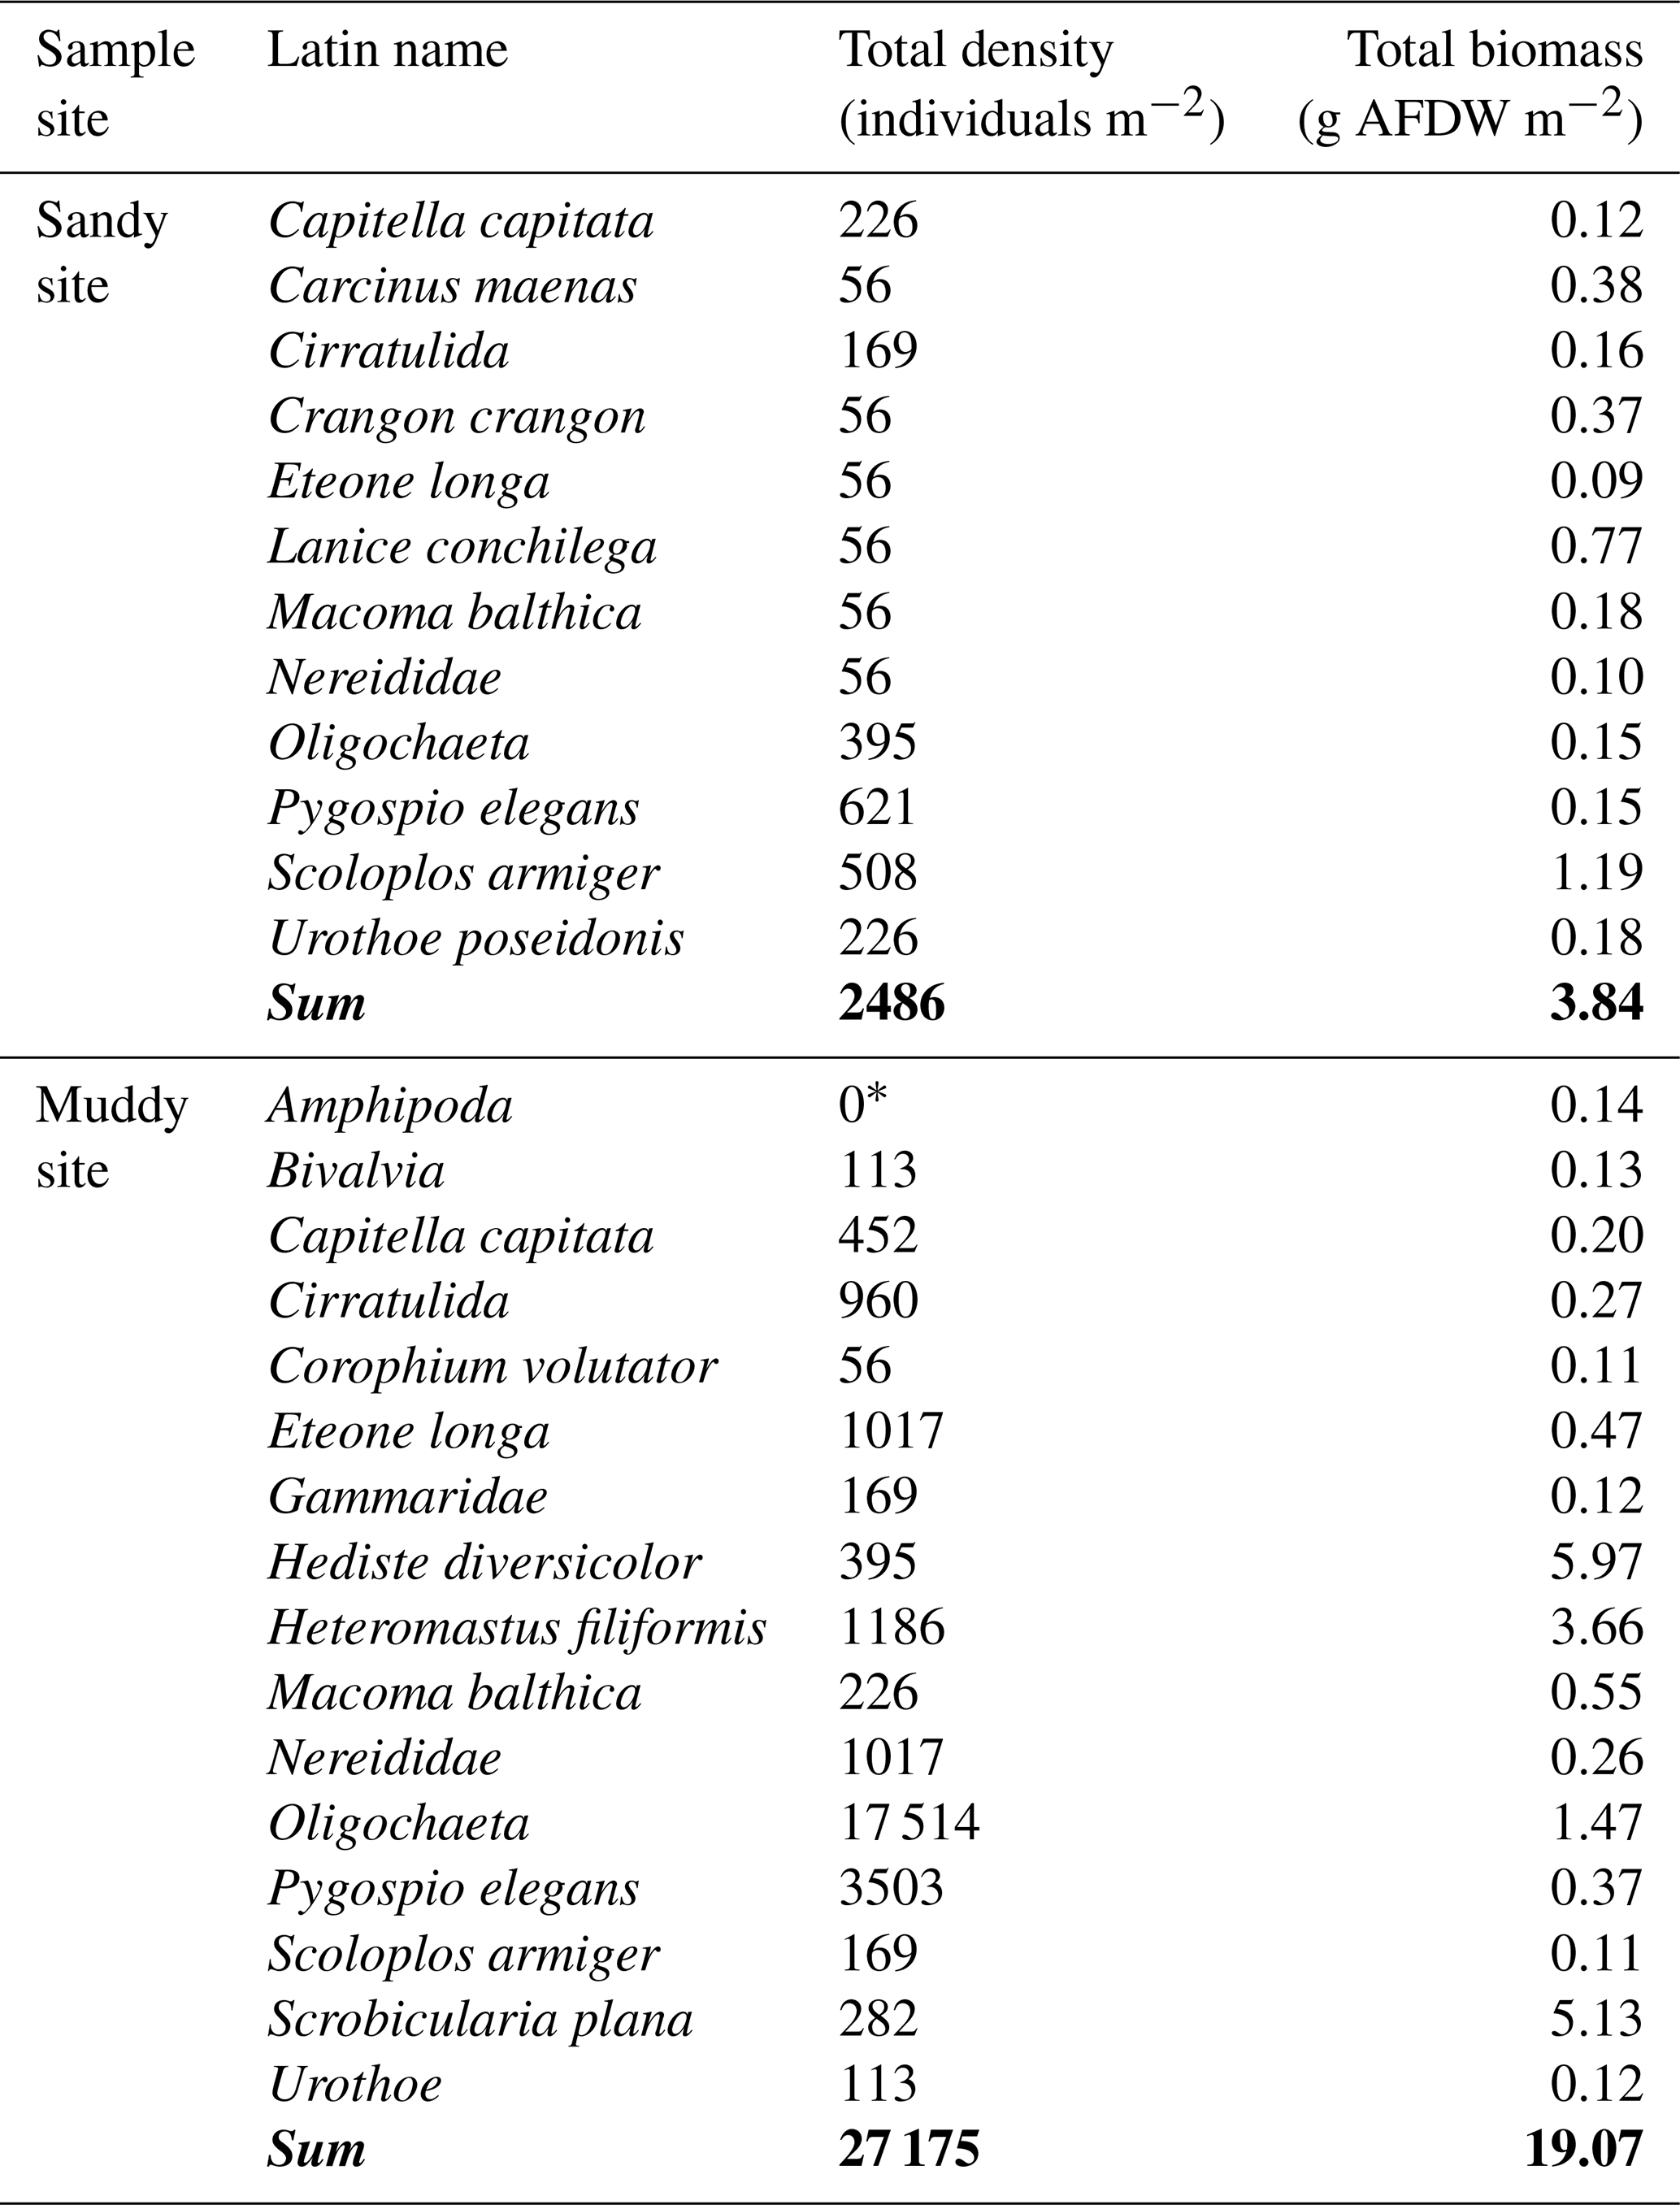
Macrozoobenthic community biomass and abundance (excluding Arenicola marina) were higher on the muddy site (approximately 19 g AFDW m−2) than on the sandy site (3.8 g m−2; Appendix A3, Table A2). Both locations contained a large fraction of taxa which could be classified as biodiffusers (Appendix A3, Fig. A1). The sandy site contained a larger fraction of downward conveyors, while more upward conveyors inhabited the muddy site. Density of downward conveying lugworms (A. marina) was higher on the muddy site (98 ± 42 individuals m−2 versus 44 ± 11 individuals m−2 on the sandy site), while worms were larger on the sandy site (0.16 g individual−1 versus 0.05 g individual−1 on the muddy site). We estimate total A. marina biomass therefore to be slightly higher on the sandy site (6.9 g AFDW m−2 versus 5.1 g AFDW m−2), and to form a substantial part (approximately 60 %) of the total biomass at the sandy site, compared to 20 % at the muddy site.
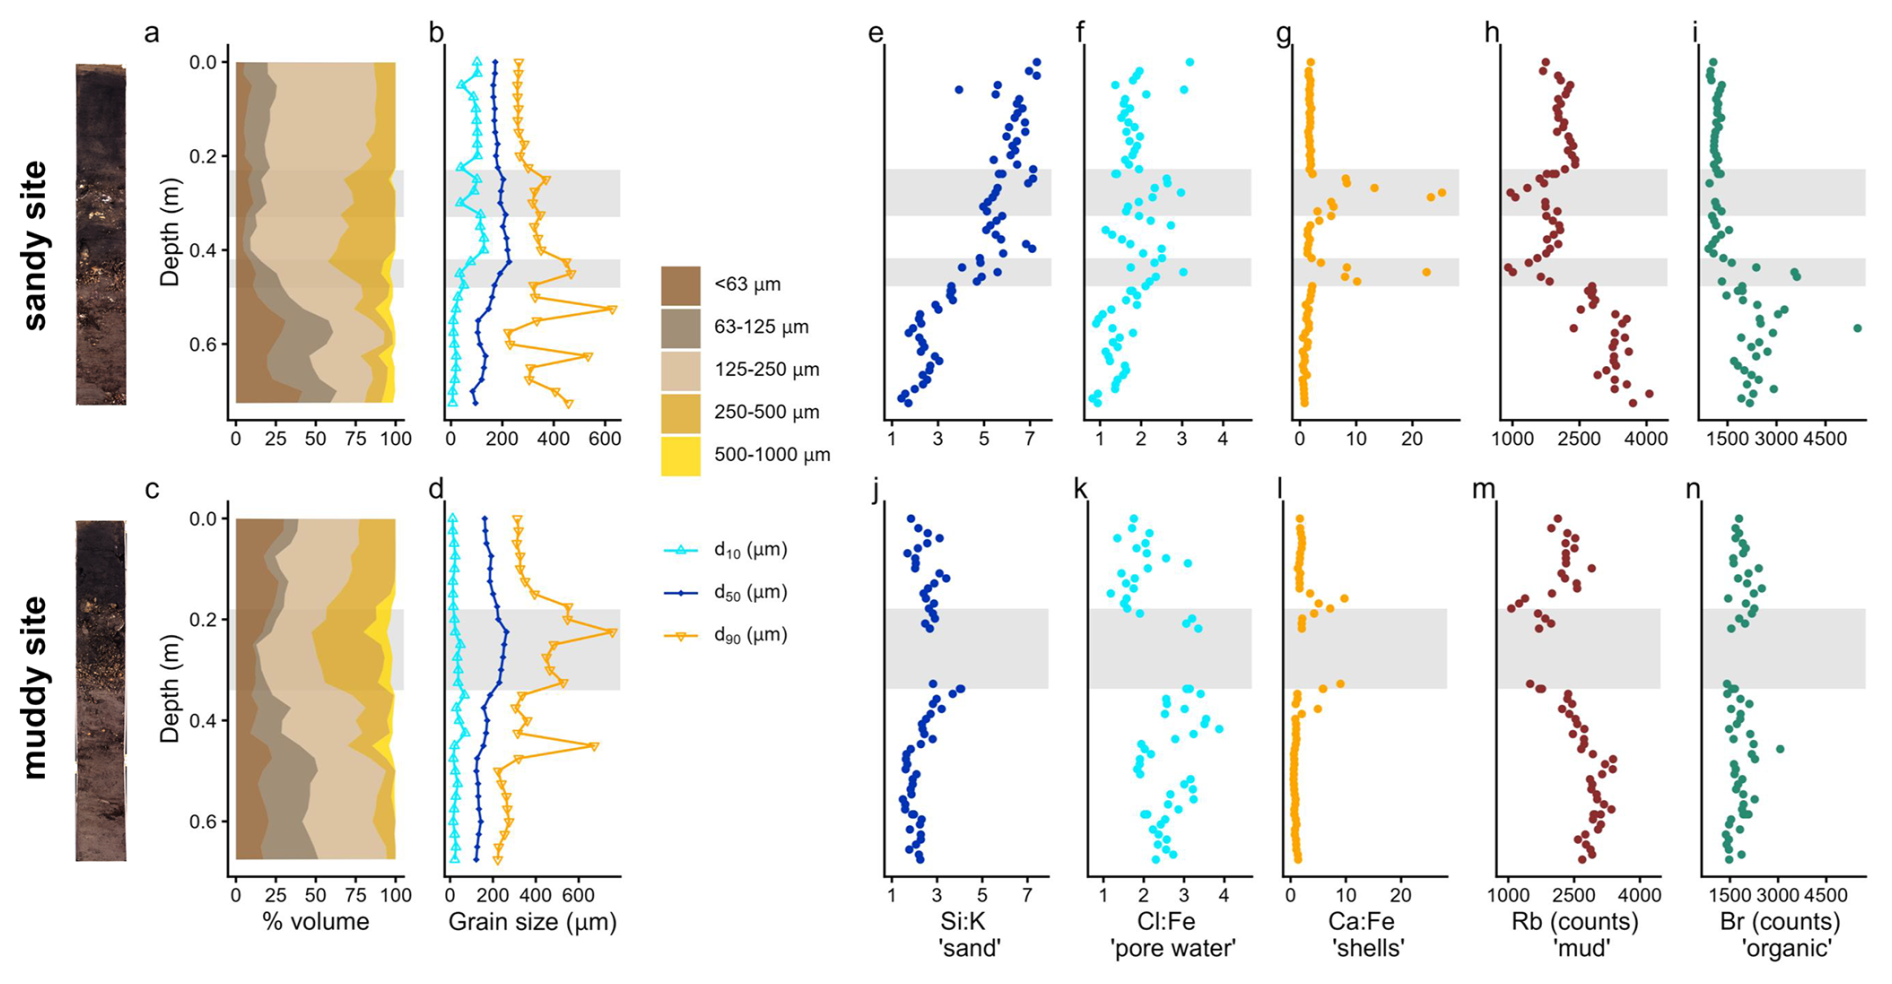
Figure 3Sediment composition at the sandy site (top) and muddy site (bottom): stacked grain size fractions (a, c); d10, d50 and d90 (b, d); elemental composition (e–n): Si:K, higher ratios indicate sand; Cl:Fe, higher ratios indicate marine pore water; Ca:Fe, higher ratios indicate shells; Rb counts representative of silt and clay, and Br counts, representative of organic matter. Note that the cumulative grain size fractions (a, c) do not amount to 100 % when coarse > 1000 µm material was present. The data gap in the mud cores (j–n) resulted from a scanning failure due to the presence of a brick. Grey bands show the shell layers. The core scans are shown left of the figure.
3.2 Sediment composition and grain size
On the sandy site, the top ∼ 0.3 m of the sediment consists mainly of fine sand, with a mud content under 10 % (Fig. 3a). From here, the coarse sand fraction gradually increases to ∼ 40 % at a depth of 0.45 m. Below 0.45 m, the sediment is less well-sorted, containing both a 20 %–40 % mud fraction, as well as coarse and very coarse sand and a variable d90 (Fig. 3b) We observed shell layers between 0.27–0.29 and 0.44–0.47 m, also reflected in increased Ca:Fe ratios from the XRF measurements. Below the second shell layer, the marine pore water (Cl:Fe) decreases and organic matter content (based on the Br indicator) increases (Fig. 3e–i).
At the muddy site, the top 0.15–0.20 m of the sediment is less well sorted: a large mud fraction (10 %–25 %), as well as a substantial fine and medium sand fraction are present (Fig. 3c and d). A shell layer was present between 0.18–0.34 m. Between 0.2–0.45 m, some layers contain coarse particles (500–1000 µm), which is also reflected in peaks in d90. The amount of marine pore water (Cl:Fe) slightly increases downcore, whereas sand content (Si:K), mud content (Rb) and organic matter (Br) remain relatively constant (Fig. 3j–n). A brick present in the shell layer gives evidence of anthropogenic influence and suggests a relatively young deposit.
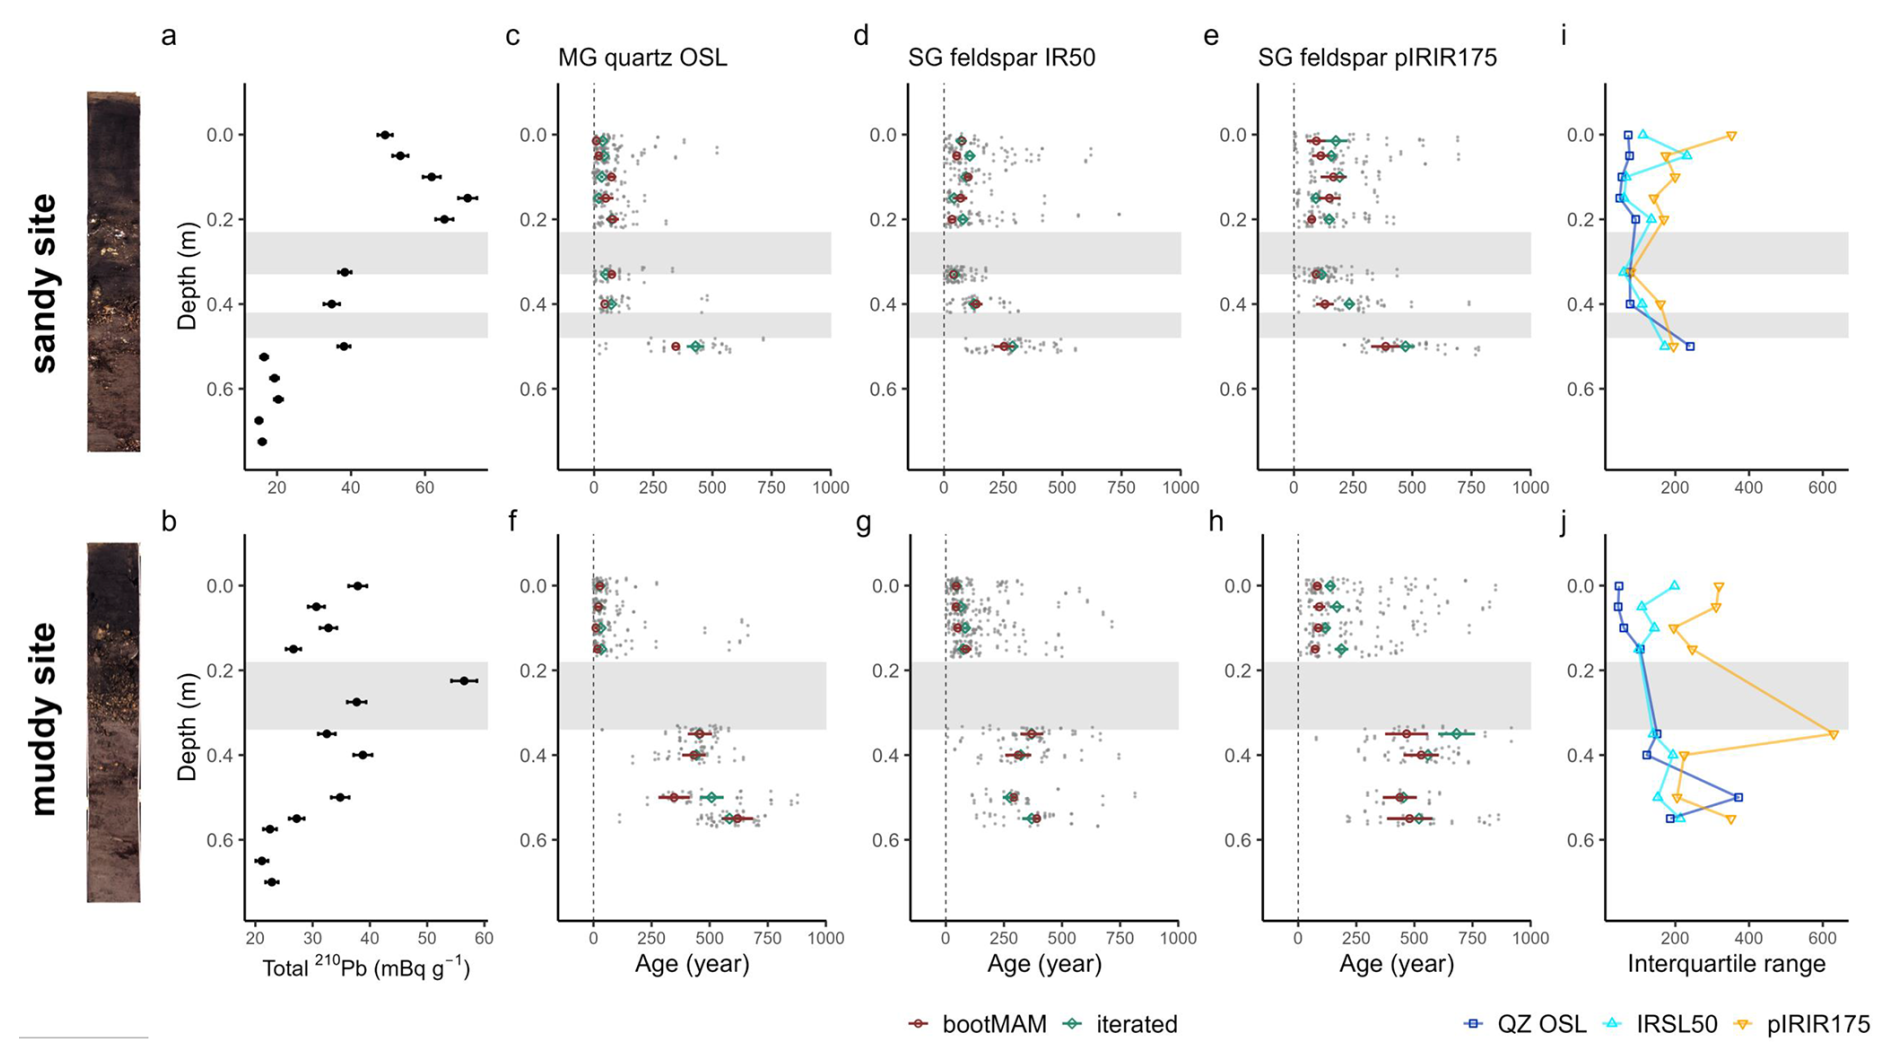
Figure 4Tracer profiles from 210Pb (a, b) and luminescence signals, with the single-aliquot or single-grain data jittered in grey and green and red markers indicating the modelled iterated or bootMAM age with standard error (c–h); interquartile range of luminescence age distribution (i, j) for the sandy (top) and muddy site (bottom). Grey bands indicate the shell layers. The core scans are shown left of the figure.
3.3 Long-term tracers: 210Pb and luminescence profiles
Above the first shell layer at the sandy site, 210Pb activity was lowest in the surface slice (0–0.025 m depth), and increased to a subsurface peak at 0.15 m (Fig. 4a). Below the first shell layer (< 0.29 m), activity decreased, to a nearly constant level below 0.5 m. At the muddy site, 210Pb activity slightly decreases down to 0.15 m, peaked in the first shell layer at 0.225 m (Fig. 4b). Until down to 0.4 m, below the second shell layer, 210Pb activity remained high. Activity then decreased to an apparently constant level of ∼ 22 mBq g−1 between 0.5–0.6 m.
In discussing the luminescence ages, we focus on the quartz OSL ages obtained through the iterated age model; given that quartz OSL resets most rapidly upon light exposure this provides the best estimate of the last light exposure of the majority of the grains. Quartz bootMAM ages indicate the last time of introduction of light exposed grains through bioturbation. For feldspar, heterogeneous bleaching is to be expected due to slower resetting of the luminescence signals and therefore we focus on the interquartile range of the age distribution and bootMAM derived ages to infer information on light exposure and thus process information.
The quartz OSL iterated ages suggest last light exposure well within the past 100 years for sediments within the top 0.4 m at the sandy site (Fig. 4c) and 0.15 at the muddy site (Fig. 3i) (Appendix A4, Table A3a). A jump in age is observed between the samples at 0.4 and 0.5 depth at the sandy site, with an age of 430 ± 40 years for the latter according to the iterated model. For the muddy site, older ages (440 ± 30 to 640 ± 40 years) were obtained for the part below the shell layer.
The feldspar IR50 and especially the pIRIR175 signals were not fully bleached in a large fraction of the grains in the top 0.2 m of both cores. At the sandy site, grains with a low pIRIR175 age were only present at 0, 0.15 and 0.325 m; at the muddy site such young grains could be identified at 0.05 and 0.15 m. The ages obtained using the bootMAM approach on the IR50 signal tend to be a few decades older than those obtained through quartz OSL iterated mean, while bootMAM derived pIRIR175 ages are significantly older (typically by a few centuries, Table A3b and c). An exception is formed by the samples from the deeper parts, where IR50 results tend to be younger than quartz OSL, while pIRIR175 agree with quartz OSL. The single-grain age distributions obtained on both feldspar signals are also broader than those obtained through quartz OSL.
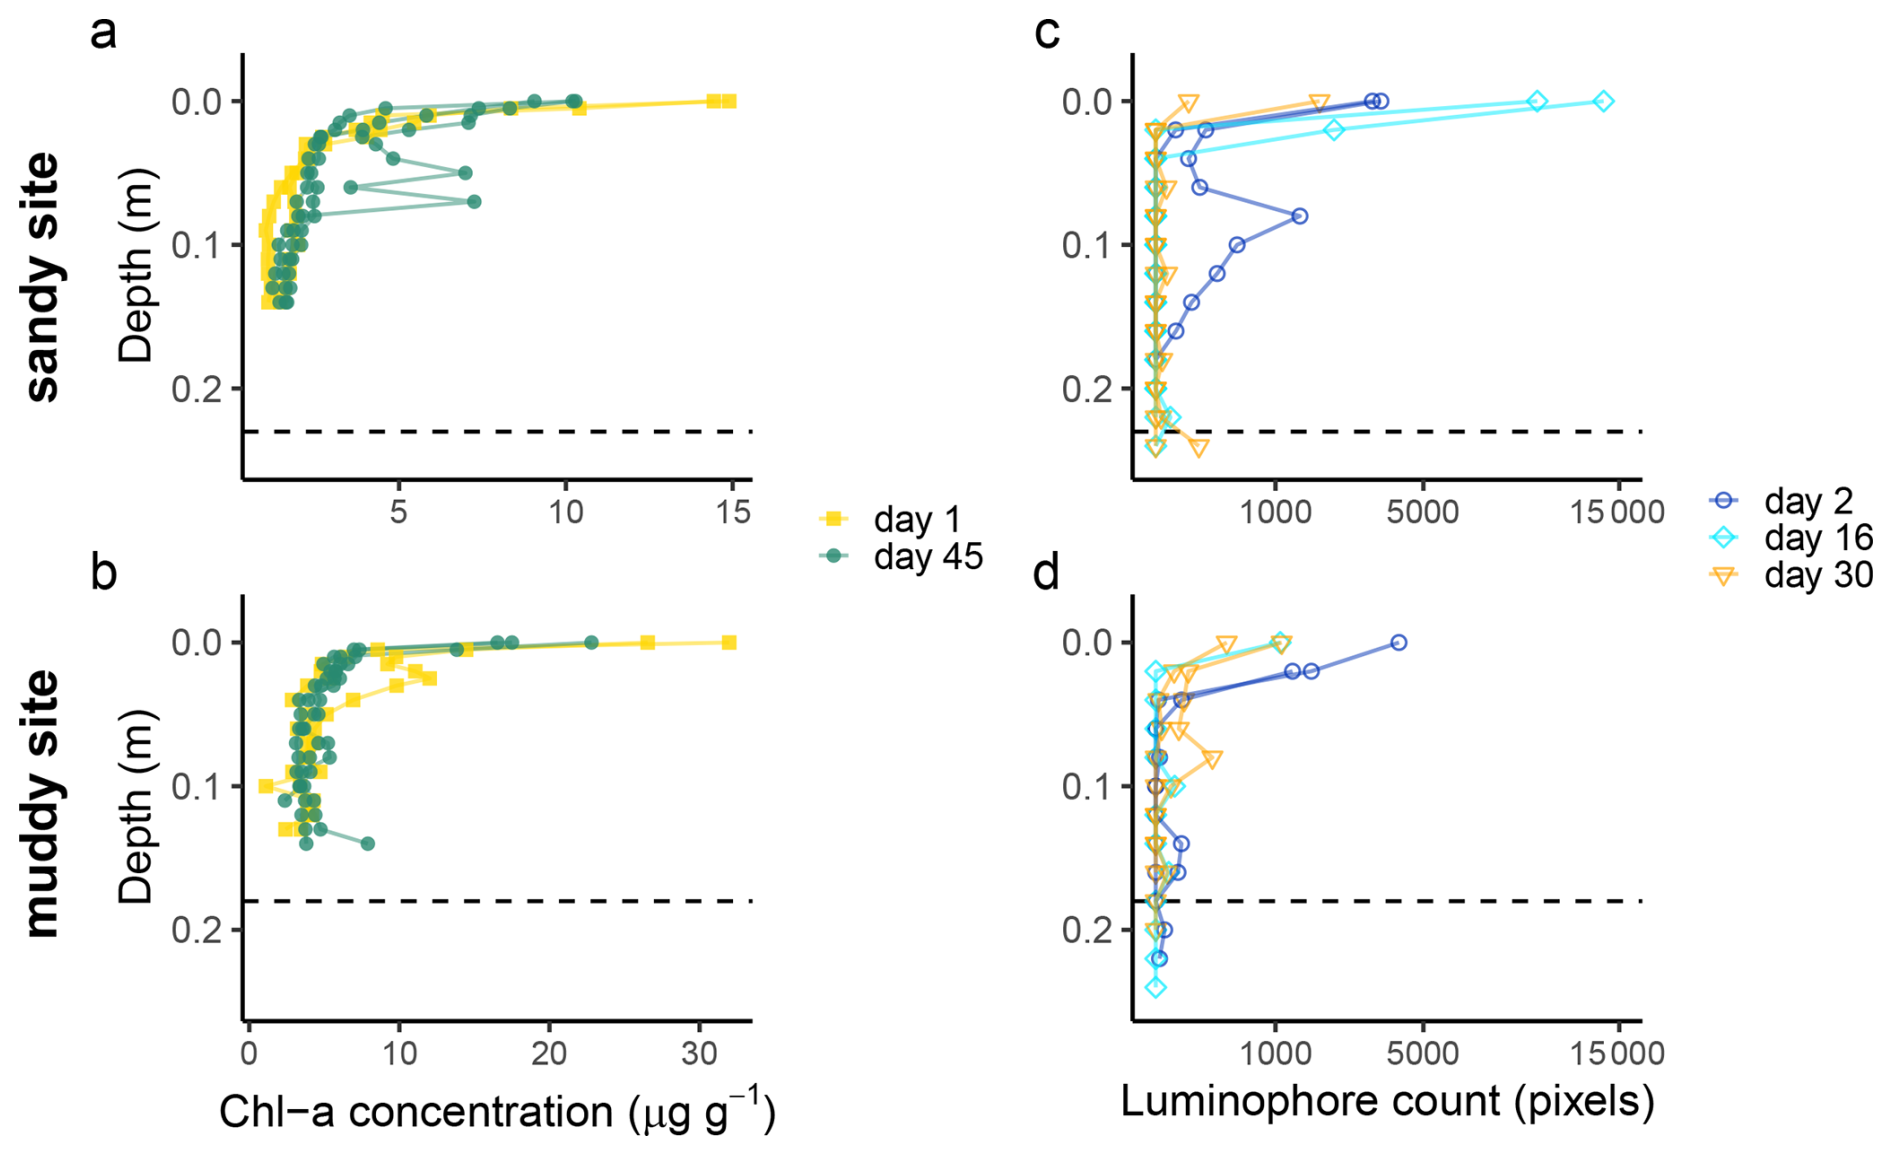
Figure 5Chlorophyll a (a, b) and luminophore (c, d) profiles from the sandy site (top) and muddy site (bottom), sampled at different time points (day, starting from 21 August 2023). Note that the x-axis of the luminophore plots was square-root-transformed to increase the visibility of low pixel counts. The dashed line indicates the depth of the top of the shell layer, as determined from the deep cores.
3.4 Short-term tracers: Chlorophyll a and luminophore profiles
Both short-term tracers show a high spatial variability. Whereas two muddy cores and one sandy core contained sub-surface maxima of Chl a concentration (Fig. 5a and b; at 3, 15 and 6–8 cm depth, respectively), in the other cores the Chl a concentration showed a more exponential decrease with depth. At the bottom of the cores in all sites, still some Chl a was present above the analytical detection limit (0.2 µg g−1), which could indicate the supply of Chl a younger less than 3 months ago, or reflect Chl a adsorption to sediment.
Some luminophore particles were already worked down to 18 cm (sandy site) and 20 cm (muddy site) within 2 d (36 h) after initiation of the experiment (Fig. 5c and d). In these cores, the reworking could be clearly linked to bioturbation, as two bivalves were found in the cores with increased luminophore concentration around their burrows (Appendix A5, Fig. A2; Scrobicularia plana at 12–15 cm depth at the sandy site and Cerastoderma edule at 0–3 cm depth at the muddy site). Similar high subsurface luminophore concentrations were not observed in the cores collected at later time points, although some luminophores could be found at greater depths. We saw similar between-core and thus spatial variability as in the Chl a measurement.
The signal-depth profiles were tracer-dependent. We observed subsurface maxima of Chl a and luminophores on both the sandy and the muddy site down to a depth of 0.15–0.25 m. This rapid translocation of young particles to depths of 0.15–0.25 m also showed in the 210Pb profiles and to some extent in the feldspar pIR175 luminescence profiles. The quartz and feldspar IR50 luminescence results rather suggested that at least the top 0.15–0.2 m of the sediment was deposited recently, hampering identification of even younger sand grains mixed in through bioturbation. The slow-to-bleach feldspar signals were not fully reset in the top layer, although some input of young grains to deeper layers could be identified. This suggests episodic deposition of the top layers, or insufficient mixing to expose all grains long enough to unfiltered light. In what follows, we will provide a combined interpretation of what these results tell about deposition and mixing processes in dynamic intertidal environments.
4.1 Worms or storms?
In the sediment composition, we did not observe any clear layering in the top decimetres of sediment at both sites which could be attributed to storm deposition. This may be due to an overly coarse vertical sampling resolution, even though our resolution of 25 mm should have been sufficient to capture storm deposited layers, which can have a thickness of centimetres (Zhou et al., 2022). At the sandy site the top of the profile was relatively homogeneous. The top decimetres of the sandy core also appeared to be better sorted than the top part of the muddy core (Fig. 3a–d). Generally, hydrodynamic reworking would be expected to result in more uniformly sorted sediment, whereas biota can create localised patches of finer or coarser material (Aller and Cochran, 2019; Bentley and Nittrouer, 2012) thus resulting in variable sorting of individual sediment samples (Rhoads and Stanley, 1965). Furthermore, the presence of shell layers may indicate biotic influence, since bioturbators such as A. marina are unable to ingest coarse particles like shells, which then remain at the feeding depth (Reise, 2002; van Straaten, 1952), while the ingested sand will be deposited on the sediment surface and subsequently mixed into the sediment.
The tracers targeting the fine-grained sediment fraction showed clear signs of bioturbation. During the luminophore experiment, no storms or strong winds occurred, therefore vertical luminophore displacements can solely be attributed to bioturbation. Both the short-term (luminophores and Chl a) and the long-term (210Pb) tracers showed sub-surface peaks, illustrating that advective vertical transport of particles occurred. This is coherent with the observed macrozoobenthic species that are known non-local mixers (see Sect. 4.3). In addition, the gradual vertical gradients of 210Pb, and of Chl a till 0.15–0.2 m point to substantial diffusive bioturbation in the top decimetres of the sediment, or rapid deposition within the previous months.
The luminescence data gives more details on the deposition and reworking of sand grains. The narrow age distributions obtained through quartz OSL indicate that this signal was well-bleached. The bootMAM and iterated age estimates are very similar, both likely reflecting the time of deposition. The narrow distributions in the top layer (0.4 m at the sandy site and 0.15 m at the muddy site) imply that the vast majority of grains were recently (within the past few decades) exposed to sufficient light to fully reset quartz OSL signals. However, the older ages obtained through feldspar IRSL, even for the relatively fast bleaching IR50 signal, indicate that for a large fraction of grains, full light exposure during and after deposition was limited. Especially old (> 500 years) pIRIR175 measurements in the top 0.10 m at both sites indicate that light exposure prior to burial was insufficient to bleach this signal. It is less likely that these grains are worked upwards by bioturbators from deeper deposits, as other grains of this age were only found below the shell layer at 0.35–0.5 m depth. Both feldspar signals from the top decimetres were not as homogeneously bleached as would be expected with intensive reworking. We conclude that the luminescence ages primarily reflect the time of deposition, rather than the time of bioturbation. This conclusions holds for all luminescence signals used. However, quartz OSL ages provide most reliable depositional ages while the feldspar IRSL and pIRIR results overestimate the burial age due to incomplete resetting of these signals upon deposition and burial.
The luminescence signals gave a few hints of bioturbation as well. Firstly, at both sites, young grains with nearly fully bleached pIRIR175 signals are present at larger depths. At the sandy site, such young grains can be found at 0.15 m, coinciding with the subsurface 210Pb peak. At the muddy site, the young grains are only present above the shell layer, at 0.05 and 0.15 m. This could point at the advective transport of young sand grains to this depth, or good bleaching conditions during deposition of these layers. Given the combination of bioturbation evidence from the other tracers, and the lack of sedimentary structures, we deem bioturbation to be the most likely process. Secondly, feldspar signals in the very top layer (0–0.05 m) at both sites were less well bleached and had wider distributions than those at 0.1–0.2 m deep. Possibly, grains that are recently deposited under low bleaching conditions and are buried close to the surface, are not always directly resurfaced by bioturbators. These grains require a longer period of bioturbation to be bleached further. This hypothesis is supported by Bentley et al. (2014), who described a shallow (1–4 cm) stratified top layer, which was not yet bioturbated, above a more intensely bioturbated zone in a muddy intertidal environment. Secondly, the luminescence data provides some evidence for exchange of grains between stratigraphic layers of different depositional age. Some grains in the luminescence age distribution had ages similar to those of the underlying deposit, even if a shell layer is present in between. At the muddy site, a high level of 210Pb was also present in and below the shell layer. From these observations combined, we conclude that transport of fine particles can sometimes extend beyond the shell layer.
Madsen et al. (2011) also reported quartz OSL profiles on an intertidal flat and attributed a change in apparent sedimentation rate to bioturbation. Their site was not very dynamic, and bioturbation was more likely to be the main mixing process present. The combined evidence of small aliquot quartz OSL and single grain feldspar IRSL50 and pIRIR175 suggests that deposition at our site was episodic and that bioturbation was less efficient in bleaching these signals by resurfacing the grains. Furthermore, given that deposition was recent, it is not possible to clearly differentiate bioturbated grains from those grains that were last light-exposed prior to deposition as is done in terrestrial soils (e.g., Reimann et al., 2017). Hence, we cannot deduce bioturbation rates from our data using approaches as suggested by van der Meij et al. (2025).
4.2 Age gaps and sedimentation rates
We could not derive sediment accumulation rates, because our combined signals pointed to a combination of sediment mixing and episodic deposition. Therefore, assuming the age-depth profiles to be the result of gradual sedimentation alone would be incorrect in this dynamic environment. Quartz OSL showed a hiatus in age between the top and the middle part of the core at the muddy site but not at the sandy site, while 210Pb also indicated a hiatus in activity at the muddy site only (Fig. 4a). Such age gaps can be caused by erosion followed by rapid accumulation, mounding by bioturbators (Kristensen et al., 2015; van der Meij et al., 2025), or switching between a depositional and an erosional regime with bioturbation penetrating the older deposits (Madsen et al., 2011). The opposing gaps of the radionuclide and luminescence tracer profiles could be an effect of an age underestimation of 210Pb compared to OSL of older sediments (Madsen et al., 2007). However, the 210Pb activity just below the shell layer in the muddy site is too high to be fully explained by such an inaccuracy. Instead, we expect differential transport of fine and coarse particles through the shell layer to play a role.
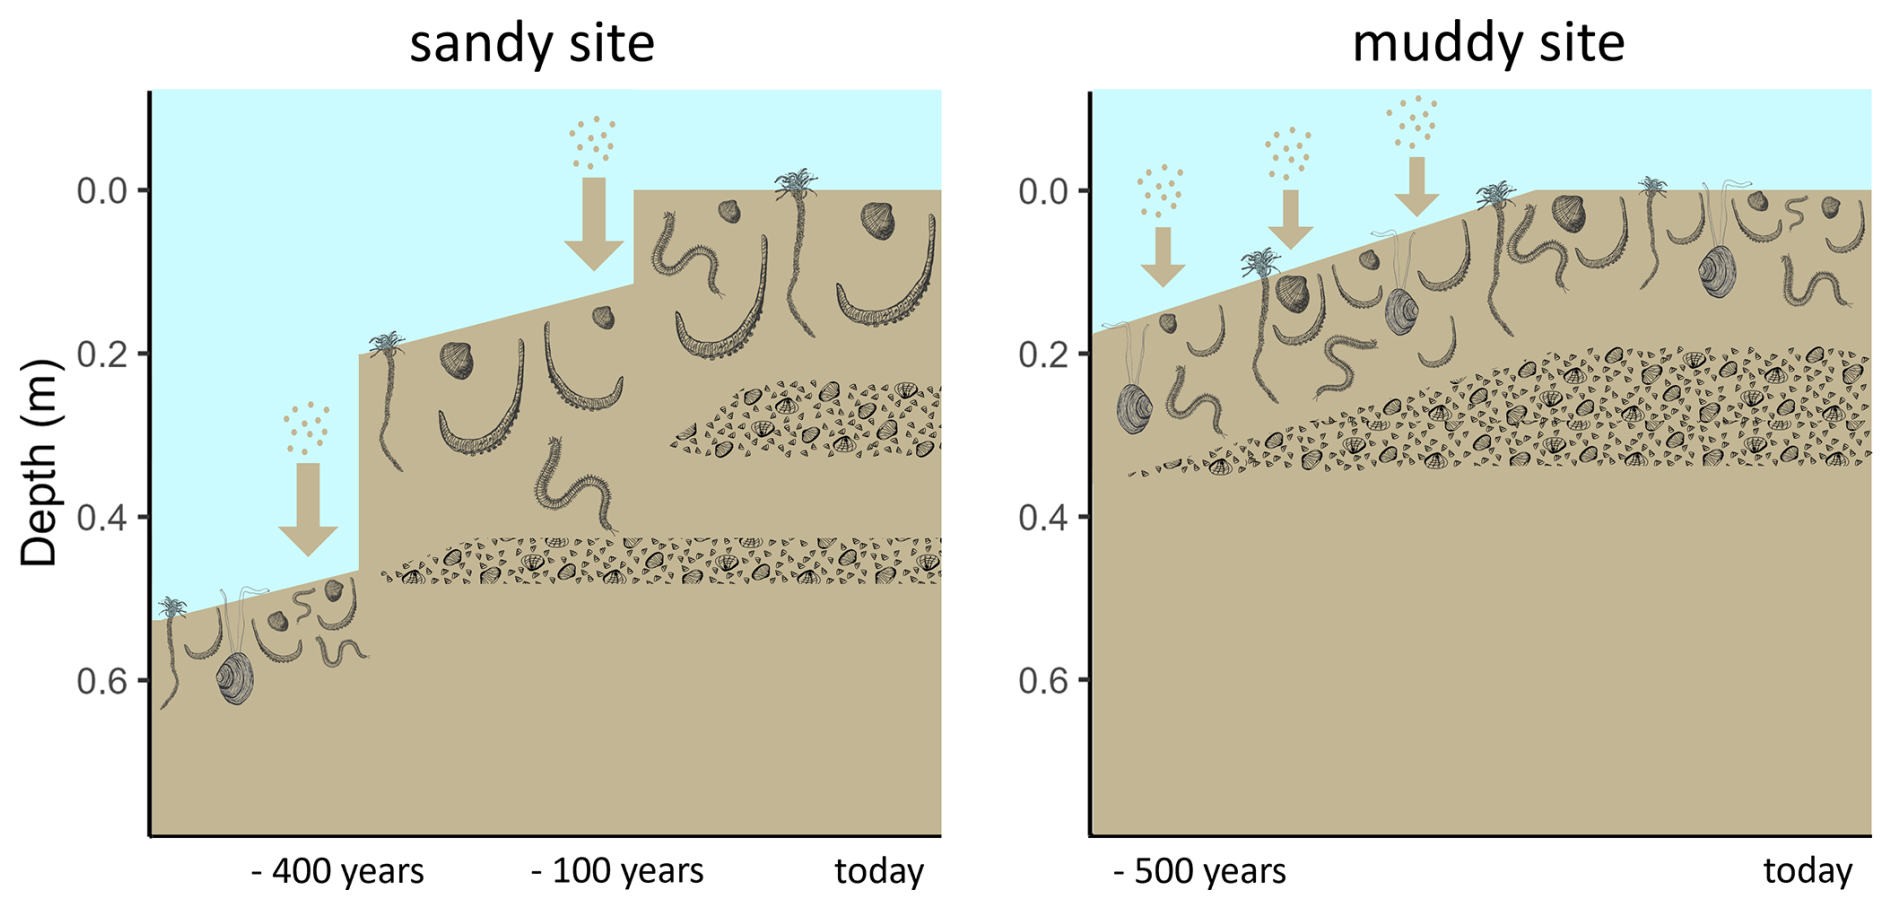
Figure 6Conceptual diagram of sedimentation history scenarios of the sandy (left) and muddy (right) site. Larger arrows represent more rapid sedimentation. The depth represents the current depth in the cores. Shell layers and benthic community are represented schematically with a lower species abundance and biomass, but larger lugworms (Arenicola marina) on the sandy compared to the muddy site.
Combining the information from luminescence signals, deposit composition and 210Pb, we propose the following possible scenarios for sedimentation history (Fig. 6):
-
On the sandy site, rapid sediment deposition took place approximately 400 years ago. The original sediment surface was covered with a new thick layer of sand, and the benthic fauna recolonised the new layer. The quartz signals in this new deposit were then uniformly bleached by bioturbation and physical resuspension and deposition, although incidentally some grains were still exchanged with the bottom layer. Through bioturbation, also the first shell layer was formed. Recently (< 100 years ago) another large, rapid deposition event happened. This shifted the bioturbation depth upwards, forming a new shell layer higher up. Still some fines (210Pb) moved downward through the shell layers, but most accumulated on feeding depth of bioturbators.
-
On the muddy site, the top 0.2 m of sediment were gradually deposited, starting approximately 500 years ago. The layer that is now at 0.35 m then fell below the bioturbation depth and was not any longer exposed to light. The sediment has then slowly been accumulating with bioturbation resulting in bleached OSL signals and the formation of a gradually thickening shell layer. Elevated 210Pb activity below the shell layer could be due to passive infiltration of fines through the porous shell layer. The strong break in luminescence age suggests little exchange of sand grains through the shell layer, and thus differential displacement of coarse and fine particles.
4.3 Differences between sites: hydrodynamics and community type?
The sandy site was relatively more exposed to energetic hydrodynamic conditions than the muddy site. This may have caused the surprisingly low surface 210Pb activity, as waves and tidal currents may resuspend and wash away the recently settled 210Pb-rich material at each tide. The Chl a concentrations were also lower at the sandy site than on the muddy site, but this might be due to differences in degradation rates of Chl a (Sun et al., 1993). The bleaching potential of the luminescence signals could differ between the muddy and sandy tidal flats (Pannozzo et al., 2023). When submerged, higher loads of suspended sediment will decrease subaqueous light penetration during transport and (re)deposition on the muddy site (de Boer et al., 2026b). The sandy site is more elevated and therefore slightly more often exposed to subaerial bleaching than the muddy site due to its lower inundation times. These differences in bleaching potential and probability may have resulted in the lesser bleaching and wider distributions (Fig. 4j) of the luminescence signals on the muddy site.
The sandy and muddy site also differed with respect to the density, biomass and composition of the benthic community. The muddy site contained a relatively higher abundance and biomass of taxa that could be classified as biodiffusers and surficial modifiers. This leads to a higher contribution of diffusive mixing and could also partly explain the larger interquartile ranges of the luminescence signals at the muddy site, compared to more effective bleaching through advective vertical bioturbation at the sandy site (van der Meij et al., 2025). Subsurface maxima of fine-grained tracers, pointing to advective transport, were more pronounced in the sandy site. One of the main likely bioturbating agents was conveyor-belt reworking polychaete A. marina. While the muddy site contained a higher density of small individuals, this species comprised only a fifth of the biomass here. The sandy site was inhibited by fewer, but larger lugworms, so that this species was dominant in biomass here. Such large individuals live in 0.2–0.4 m deep burrows and often dominate sedimentary processes at sandy intertidal flats. Their presence leads to 4–400 times more likely particle reworking rates and an estimated full overturning of a 0.1–0.6 m layer of sediment per year (Cadee, 1976; Riisgård and Banta, 1998; Volkenborn et al., 2007b). These lugworms were probably responsible for the subsurface accumulations of 210Pb at feeding depth, as the 210Pb-rich organic material is filtered from the ingested sand (Longbottom, 1970).
Other bioturbators might also have contributed to non-local transport of fine tracers at both sites, either by active particle transport or through passive processes such as burrow infiltration. Ragworms (family Nereididae), such as Hediste diversicolor, were present at both sites. These worms build a gallery network and can cause diffusive mixing of the surface layer, and advective downward transport, accumulating particles at the lower end of the gallery network due to passive sloping, burrow infilling and during rapid retraction (Foster-Smith, 1978; Herringshaw et al., 2010; Ouellette et al., 2004). Another group that we deem responsible for non-local transport of fines are tentaculate polychaetes, which enhance fine particle transport from the water column into the sediment (Frithsen and Doering, 1986). Pygospio elegans, a tube-building worm present in high densities at both sites, constructs tubes 0.15 m into the sediment, and enhance transport of fine particles down to 3–5 cm depth (Bolam and Fernandes, 2003). Lanice conchilega feeds on organic particles from the sediment surface or the water column and builds long tubes, down to 0.3–0.4 m into the sediment (Carey, 1987). Although this species was only present in the benthos core sample at the muddy site, we observed their tube endings, indicating their presence, on the sediment surface at both locations (Fig. 2b and c).
Scrobicularia plana is described as a surficial modifier in trait databases (Queirós et al., 2013). We however observed that this species also contributes to non-local mixing, as suggested by luminophores that had moved rapidly to the living depth of this bivalve (Fig. A2). Similar discrepancies between “theoretical” bioturbation traits and field observations were reported by (Morys et al., 2017). Therefore, a single trait-based community index for bioturbation (such as BPc), could potentially be informative on larger spatial scales when a more extensive dataset is available, but such an index may be less relevant for a local study.
4.4 Why are results tracer-dependent?
The differences between tracers are likely the result of particle size-specific physical and biological sorting mechanisms. Fine particles are more easily eroded and transported from the sediment surface by currents and waves. They are therefore less prone to remain on the surface for a prolonged period, whereas coarser sand grains are more stable on the sediment surface. Fines are also more likely to move down into the sediment matrix by passive as well as active processes. In sandy, permeable sediments, fine particles can infiltrate with pore water flux (reviewed by Huettel et al., 2014). Above that, fine and organic particles are more often selected by bioturbators, after which they may accumulate in deeper layers of the deposit. This particle selectivity is common among benthic taxa (Self and Jumars, 1988).
Although the grain size range we selected for luminescence measurements (212–250 µm) falls outside of the feeding range of many polychaetes (Jumars et al., 2015), A. marina, expected to be a dominant bioturbator especially on our sandy site, does feed non-selectively on sediment particles below a size of 1000 µm (Baumfalk, 1979). Bioturbation of this species was shown to still result in accumulations of finer (130 µm) as well as coarser (500–1000 µm) particles at its feeding depth (0.1–0.14 m) (Gebhardt and Forster, 2018). Bivalves can also exhibit size- and particle-type specific selection, but this usually takes place post-capture (reviewed by Ward and Shumway, 2004). Their burrowing movements rather than their feeding activity may thus vertically displace sand grains. A. marina as well as bivalves are therefore expected to have reworked sand grains and affected the luminescence tracer profiles.
It has been demonstrated that benthic fauna select for particle quality as well and prefer organic over inorganic particles (Taghon, 1982). Although we saw some advective transport of luminophores (Fig. 5c, d and A2), we did indeed not observe large sub-surface accumulation over time. One explanation might be that these inorganic particles do not accumulate at the organism's feeding depth in the same way as the organic matter-associated tracers that are retained in the digestive system. This is contrary to Gerino et al. (1998), who observed subsurface peaks of luminophores after 15 d, and additionally modelled Chl a subsurface mixing rates to be in the same order of magnitude as the mixing of non-organic particles in a shallow, muddy environment. In our dynamic intertidal environment, luminophores might have more easily eroded from the sediment surface, resulting in a decrease in surface supply over time, which possibly underlies the lack of later subsurface accumulations (Fig. A3).
A tracer can give meaningful information on mixing processes when the timescale of a tracer (e.g., radionuclide decay rate) matches the timescale of the mixing rate: the longer the tracer timescale, the more particle displacements will have contributed to the signal distribution (Meysman et al., 2003). The luminescence signal is of a different nature than that of radionuclides, as it builds up after burial but resets at each sufficiently long or intense light exposure, rather than gradually declining over a known time. Signals that are more difficult to bleach (e.g. feldspar pIRIR175) require more light exposure to be reset compared to fast bleaching signals (e.g. quartz OSL). They thus require a higher frequency of reworking events to be fully bleached. If sediments are however too young or intensely mixed, no recently reworked grains can be distinguished, as the sediment will be uniformly bleached. Under the conditions at our intertidal study sites, only the feldspar IR50 and pIRIR175 bleached slowly enough to be not fully reset during deposition or by bioturbation. Therefore, these signals can show subsurface supply of young sand grains (Fig. 4e and h) and incomplete bleaching during deposition (Fig. 4d, e, g, and h). In this relatively young and more intensely reworked sediment, where no “old”, never-mixed, sediment fraction appeared to be present, single-grain level measurements cannot be used for determining the bioturbation effectiveness (Reimann et al., 2017). Spatial scale also plays a role, especially for the short-term tracers. The small sampling surface of the Chl a and luminophore cores and the patchy distribution of macrozoobenthos resulted in high variability between cores, and a higher number core replicates may therefore have increased consistency of tracers profiles for these short-term tracers. For the long-term tracers, the number of replicates was lower, however because the distribution of these tracers captures the integrated activity of the macrozoobenthic community over a longer time period, we would expect similar results even if we had used a higher number of replicates.
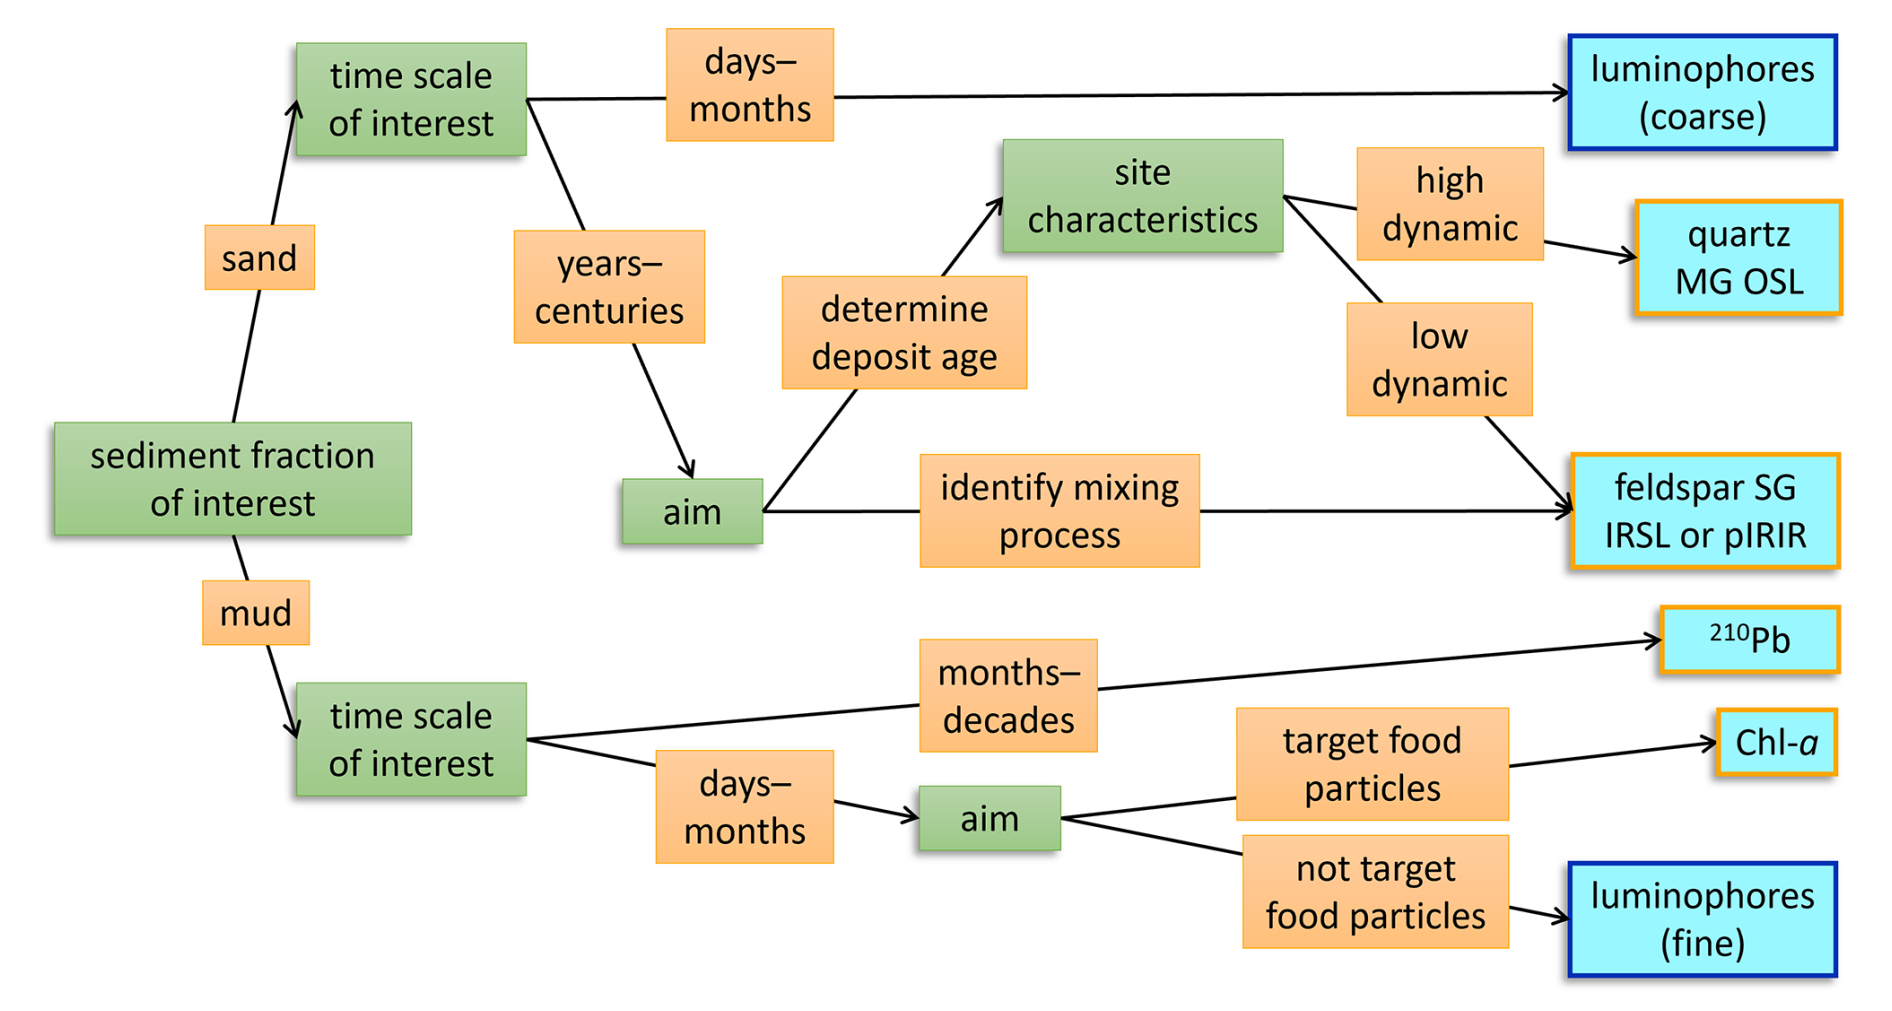
Figure 7A decision tree for choosing the appropriate tracer type to identifying sediment reworking in intertidal environments. Green boxes indicate the attributes of the research question at hand that should be considered and orange boxes show the possible responses, ultimately leading to the most suitable tracer (light blue boxes). The blue-outlined tracers are particles that actively need to be introduced in a natural system, while the orange-outlined tracers are native in intertidal sediments.
4.5 Which tracer to use when?
Although our findings on sediment reworking are site-specific, the tracers used here are more broadly applicable, provided that the limitations of each tracer are considered. A combination of tracers best represents the intricate reality of physical and biotic sediment mixing processes. This corroborates Gerino et al. (1998), who showed that to accurately model bioturbation modes, measurements of multiple tracers with different characteristics are required. A multi-tracer experiment is however time- and resource intensive, and aligning tracer sampling protocols to improve intercomparison is not always feasible. Therefore, we propose a framework for deciding on the type of tracer to use, depending on the research question at hand (Fig. 7). The process timescale, grain size fraction of interest and spatial density need to be considered. Depending on the rate and dominant mode of bioturbation, a short- or long-term tracer may be more appropriate (Lecroart et al., 2010; Meysman et al., 2010). Also, the potential targeting of organic food particles (e.g., Chl a, 210Pb) may be considered. Furthermore, the physical conditions at the field site determine the suitability of a tracer. If the field site is erosive or exposed to higher dynamics, fine luminophores might not be representative over a longer period. With low reworking or light exposure (e.g., long inundation and turbid water), hard-to-bleach luminescence signals are less likely to be bleached by bioturbation.
4.6 Outlook and implication
Feldspar single-grain luminescence is a promising tracer for deposition and mixing processes in intertidal environments. Even though luminescence signals at our study sites pointed to high dynamics and rapid deposition, rather than being all fully bleached by bioturbation, they did give more information on long-term deposition and reworking of sand grains than other existing tracers can. We recommend testing this method in a less dynamic setting, where bioturbation dominates reworking, to improve interpretation of luminescence profiles and further explain the limited feldspar bleaching that we observed. The aim of this research was a qualitative rather than a quantitative description of mixing processes. Given the young age of the sediments and the dynamics of the environment, a quantification of bioturbation as attempted by van der Meij et al. (2025) may be challenging. Nevertheless, single-grain and slow-to-bleach luminescence signals are a promising tool to further test and develop, for ultimately deriving bioturbation rates of sand grains in intertidal settings.
Our results highlight differences between the behaviour and bioturbation of sand and mud within the sediment matrix. This distinction matters for stratigraphy: fines are more mobile within the sediment column, while sand grains have greater potential to preserve layered bedding. Although bioturbation is often assumed to homogenise stratigraphic records (Wheatcroft, 1990), our feldspar results suggest that the sand fraction is not intensively reworked by the present bioturbating community. We also observed exchange of particles through the shell layer, suggesting that such layers do not necessarily form a hard boundary for bioturbators. Furthermore, the grain size-specific reworking can inform process-based sediment transport models that quantify the mixing of specific sediment fractions within the bed (Armanini, 1995). Bioturbation increases the exchange of particles between the active (transportable) and substrate layer of the sediment, with higher exchange probability for small than for large particles.
These findings also bear ecological implications. Fine, organic-rich tracers were rapidly carried below the aerobic zone and accumulated at depth, whereas young sand grains were not. This indicates that bioturbation affects reactive compounds more strongly than coarse particles. Its influence on sand transport may thus be smaller than its role in sediment biogeochemistry and carbon storage. By modifying sediment mud content, bioturbators can modify their own habitat conditions. In sandy sediments, preferential reworking of fines can increase subsurface mud content. Such “muddification” by cockles was demonstrated in a flume experiment (Soissons et al., 2019) and by Ensis leei in a field experiment (Witbaard et al., 2017). On the other hand, resurfaced fines may be mobilised from muddy sediments, decreasing the sediment mud content (Montserrat et al., 2009; Volkenborn et al., 2007a; Wendelboe et al., 2013). These two-way processes affect large-scale intertidal flat morphology and sediment composition (Brückner et al., 2021; Le Hir et al., 2007). Finally, the integrated contribution of bioturbation and storms may be comparable when event energy and frequency are considered together. Whereas bioturbation is a continuous process of small particle displacements, storms are infrequent, but high energy events (Fig. 1b). In effect, benthic animals influence daily sediment properties, while storm events “reset” the system. Because most species have a relatively wide sediment tolerance (Kooistra et al., 2025), such episodic resetting does not necessarily result in a major community shift, and during calmer periods, bioturbators can once again modify sediments at smaller scales, potentially enhancing their own habitat suitability.
The aim of this study was to distinguish physical from biological mixing over timescales, using tracers that target different grain size fractions. We did not observe clear layering in sediment composition that would point to unbioturbated storm deposits. We showed that sand fractions and mud fractions are mixed differently: fine tracers showed clear signs of bioturbation, while the sand fraction appeared to be less intensely bioturbated than we expected. In conclusion, mud is more mobile within the sediment matrix, due to its higher likelihood to be mixed by bioturbation and physical processes. Sand grains are overall more static and have a higher potential to conserve layering, although single-grain feldspar luminescence signals also showed signs of bioturbation. Over long (decadal) timescales and in dynamic or young environments, it remains impossible to distinguish sediment grains mixed by storms from those reworked by bioturbation with full certainty. Nevertheless, the combination of luminescence signals with different bleaching characteristics can give a more complete picture of the deposition and reworking of sand grains. Multi-grain quartz luminescence was suitable for dating sand grains, while single-grain feldspar luminescence gave information on mixing processes. If applied in consideration of the local environmental conditions, the single-grain signals are a promising technique for tracing bioturbation, but this application needs to be tested further. Until then, a combination of short- and long-term tracers is needed to draw robust conclusions on sediment mixing processes at dynamic intertidal sites.
A1 Core samples
Table A1Length per core and analysed samples from long cores. The depths from which luminescence samples were analysed are indicated in bold.
A2 Luminescence analysis
A2.1 Equivalent dose measurements
The luminescence samples were prepared at the Netherlands Centre for Luminescence Dating (NCL) under amber light conditions. After obtaining the 212–250 µm grain size fraction by wet sieving, carbonates were removed by treating the material with a 10 % HCl solution, followed by the removal of organic matter using a 10 % H2O2 solution. Magnetic particles were removed by using a Frantz magnetic separator at a current of 1.4 A on the magnet and under an angle of 10° (Porat, 2006). A K-feldspar-rich fraction was extracted through density separation using a separating funnel and LST Fastfloat© with a density of 2.58 g cm−3 and washed with demineralized water. A quartz-rich fraction was subsequently isolated from the heavy fraction by performing an additional density separation with LST of 2.70 g cm−3. The quartz fraction was then rinsed with a 10 % HF solution, followed by treatment with a 40 % HF solution to dissolve feldspar and/or other contaminants and etch the outer skin of quartz grains. Afterward, the material was rinsed with HCl, demineralized water, dried, and sieved.
Each multi-grain quartz sample was measured using an automated Risø TL/OSL DA-15 reader with a calibrated beta source. Blue (∼ 470 nm) light emitting diodes (LEDs) were used for optical stimulation. The quartz OSL signals were detected through a 7.5 mm Hoya U-340 filter with a UV detection window. A Single-Aliquot Regenerative-dose protocol (SAR) (Table 2) was used: 1000 datapoints were read out during 20 s of stimulation at 125 °C (0.020 s per datapoint). Channels 1 up to 25 (0.5 s) were taken as initial integration interval; the background interval was set at channel 26 up to 88 (1.24 s). A linear fit was used for dose-response curve fitting, and the curve was forced through the origin. Rejection criteria (recycling ratio, recuperation rate, and test dose error) were set at 15 %. The recuperation rate was taken relative to the first regenerative dose point.
All single-grain feldspar measurements were conducted using an automated Risø TL/OSL DA-20 reader with an automated detection and stimulation head (DASH) and an EMCCD camera (Kook et al., 2015). The system is equipped with a calibrated beta source, delivering a dose rate of approximately 0.0707 to the feldspar grains on a single-grain disc. To target the 410 nm peak emission of K-feldspar, a blue filter package, BG-3+BG-39 (3.0 + 4.0 mm) was used. A fading test was not conducted. Using a multiple-elevated-temperature (MET) pIRIR measurement protocol was used (de Boer et al., 2024b; Li and Li, 2011), a total of 270 datapoints were recorded in 108 s (0.400 s per datapoint), with 250 datapoints collected during stimulation. For each sample, three single-grain discs were measured, which would correspond to 300 grains if all positions were filled. However, visual inspection revealed that some positions were unoccupied, resulting in an estimated total of approximately 250 grains measured per sample. Channels 11 up to 15 (2 s) were taken as initial integration interval; the background interval was set at channel 226 up to 250 (9.6 s). A linear fit was used for dose-response curve fitting, and the curve was forced through the origin. Rejection criteria (recycling ratio, recuperation rate, and test dose error) were set at 20 %. The recuperation rate was taken relative to the fourth regenerative dose point.
A2.2 Dose rate measurements
To prepare samples for gamma spectrometry samples were first dried and ashed, documenting weight loss to determine water and organic content. Then the samples were grinded and mixed with wax to create a puck of fixed geometry and retain Radon. Activity concentrations of 40 K and several nuclides from the Uranium and Thorium decay chains are measured using a high-resolution gamma ray spectrometer.
A3 Benthic community
Table A2Benthic community composition at sandy and muddy site and biomass () per taxon. Note that this table does not include Arenicola marina, since this species was not present in the benthic core samples
∗ As the number of individuals is determined by headcount, when only body parts without head are present, the individuals are identified to the lowest taxonomic level and only analysed for biomass.
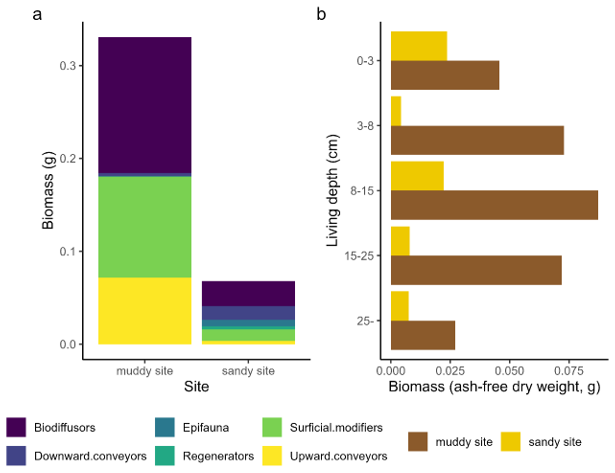
Figure A1Bioturbation and depth traits from the benthic community, comparing both sites. Relative trait scores for bioturbation mode (a) and living depth (b) are multiplied with total biomass per taxon. Note that this figure does not include Arenicola marina, since this species was not present in the benthic core samples.
A4 Luminescence modelled palaeodose, dose rate and modelled age
Table A3(a) Multi-grain quartz luminescence results. (b) Single-grain IRSL50 luminescence results. (c) Single-grain pIR175 luminescence results. Sample depths are indicated in bold.
A5 Luminophore observations
Figure A2Cores taken 36 h after luminophore application, indicating observations of downward particle transport reworking by S. plana at sandy site (top) and C. edule at muddy site (bottom).
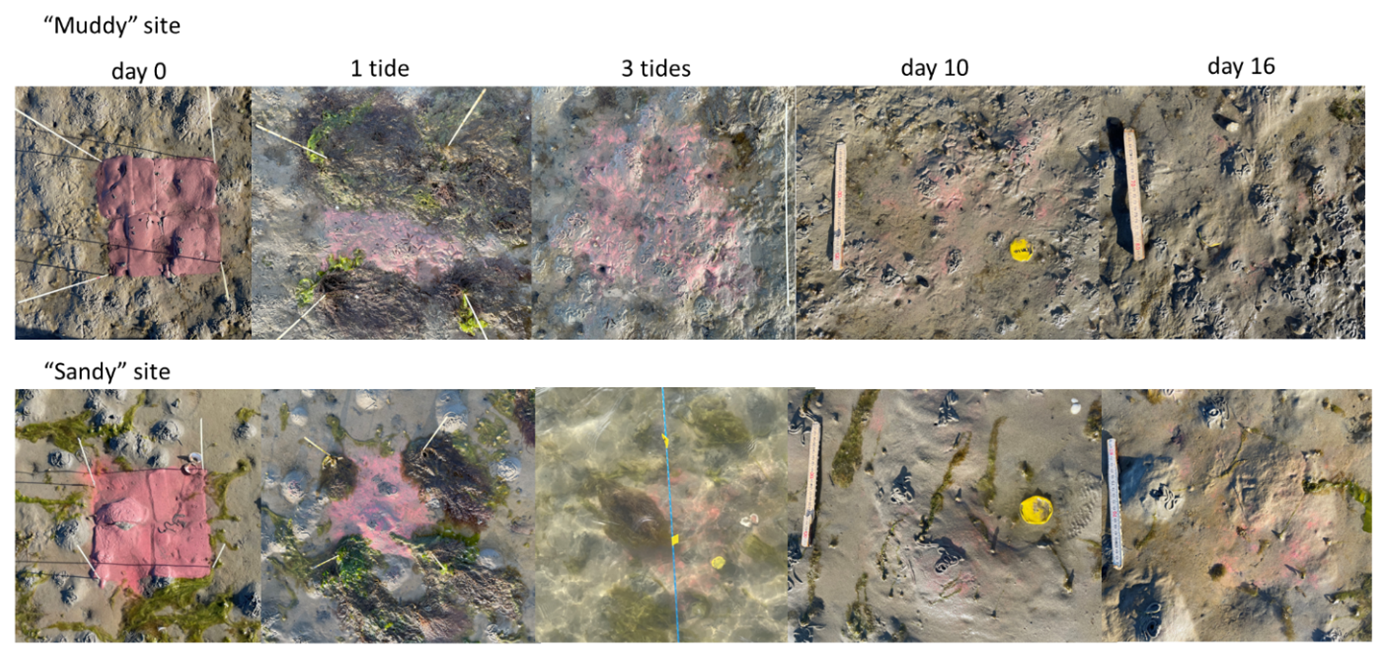
Figure A3Observations of luminophores on the sediment surface. Note the decrease in luminophores visible on the surface. The sticks placed at the start of the experiment were removed after 1 tide, as they were observed to trap algae.
Data and code used for the analysis in this study are openly available through https://doi.org/10.25850/nioz/7b.b.ak (Kooistra et al., 2026).
All authors: Conceptualisation, Writing – review and editing; TJK, AMdB, NP, JW and RW: Investigation, Methodology; TJK, AMdB: Writing – original draft, Visualization, Software, Formal analysis, Data curation; TJB, SGP, JW, RW and KS: Supervision; SGP, AvdS, JW, RW: Funding acquisition; HdS, JW: Resources; TJK, RW: Project administration.
The contact author has declared that none of the authors has any competing interests.
Publisher's note: Copernicus Publications remains neutral with regard to jurisdictional claims made in the text, published maps, institutional affiliations, or any other geographical representation in this paper. The authors bear the ultimate responsibility for providing appropriate place names. Views expressed in the text are those of the authors and do not necessarily reflect the views of the publisher.
We would like to thank Erna van de Hengel-Voskuilen, Bartel Komin, Birte Leutelt, Bram Parmentier, Eva Lansu, Carlijn Lammers, Paula de la Barra and Sarah Manni for help with field sampling; Erna van de Hengel-Voskuilen and Alice Versendaal for help with luminescence laboratory analysis and preparation of data; Piet van Gaever and Jeroen Kooijman for XRF and 210Pb analysis and preparation of data; Peter van Breugel for grain size analysis; Jurian Brasser for assistance with Chl a analysis; and Lennart van IJzerloo and Birte Leutelt for help with luminophore analysis.
This research has been supported by the Nederlandse Organisatie voor Wetenschappelijk Onderzoek (grant nos. grant no. 17600: “Tracking Ameland Inlet Living Lab Sediment (TRAILS)” and grant no. 21026: “Revealing Hidden Networks of Coastal Sediment Pathways”).
This paper was edited by Mark Lever and reviewed by two anonymous referees.
Aller, R. C.: The Effects of Macrobenthos on Chemical Properties of Marine Sediment and Overlying Water, in: Animal-sediment relations: the biogenic alteration of sediments, vol. 100, edited by: McCall, P. L. and Tevesz, M. J. S., Springer, Boston, MA, 53–102, https://doi.org/10.1007/978-1-4757-1317-6_2, 1982.
Aller, R. C. and Cochran, J. K.: The Critical Role of Bioturbation for Particle Dynamics, Priming Potential, and Organic C Remineralization in Marine Sediments: Local and Basin Scales, Front. Earth Sci. (Lausanne), 7, 459885, https://doi.org/10.3389/feart.2019.00157, 2019.
Armanini, A.: Non-uniform sediment transport: dynamics of the active layer, J. Hydraul. Res., 33, 611–622, https://doi.org/10.1080/00221689509498560, 1995.
Baumfalk, Y. A.: Heterogeneous grain size distribution in tidal flat sediment caused by bioturbation activity of Arenicola marina (polychaeta), Neth. J. Sea Res., 13, 428–440, https://doi.org/10.1016/0077-7579(79)90016-4, 1979.
Beauchard, O., Bradshaw, C., Bolam, S., Tiano, J., Garcia, C., De Borger, E., Laffargue, P., Blomqvist, M., Tsikopoulou, I., Papadopoulou, N. K., Smith, C. J., Claes, J., Soetaert, K., and Sciberras, M.: Trawling-induced change in benthic effect trait composition – A multiple case study, Front. Mar. Sci., 10, 1303909, https://doi.org/10.3389/fmars.2023.1303909, 2023.
Belliard, J. P., Silinski, A., Meire, D., Kolokythas, G., Levy, Y., Van Braeckel, A., Bouma, T. J., and Temmerman, S.: High-resolution bed level changes in relation to tidal and wave forcing on a narrow fringing macrotidal flat: Bridging intra-tidal, daily and seasonal sediment dynamics, Mar. Geol., 412, 123–138, https://doi.org/10.1016/j.margeo.2019.03.001, 2019.
Benninger, L. K., Aller, R. C., Cochran, J. K., and Turekian, K. K.: Effects of biological sediment mixing on the 210Pb chronology and trace metal distribution in a Long Island Sound sediment core, Earth Planet. Sc. Lett., 43, 241–259, https://doi.org/10.1016/0012-821X(79)90208-5, 1979.
Bentley, S. J. and Nittrouer, C. A.: Accumulation and intense bioturbation of bioclastic muds along a carbonate-platform margin: Dry Tortugas, Florida, Mar. Geol., 315–318, 44–57, https://doi.org/10.1016/j.margeo.2012.05.002, 2012.
Bentley, S. J., Swales, A., Pyenson, B., and Dawe, J.: Sedimentation, bioturbation, and sedimentary fabric evolution on a modern mesotidal mudflat: A multi-tracer study of processes, rates, and scales, Estuar. Coast. Shelf S., 141, 58–68, https://doi.org/10.1016/j.ecss.2014.02.004, 2014.
Bolam, S. G. and Fernandes, T. F.: Dense aggregations of Pygospio elegans (Claparède): Effect on macrofaunal community structure and sediments, J. Sea Res., 49, 171–185, https://doi.org/10.1016/S1385-1101(03)00007-8, 2003.
Brückner, M. Z. M., Schwarz, C., Coco, G., Baar, A., Boechat Albernaz, M., and Kleinhans, M. G.: Benthic species as mud patrol – modelled effects of bioturbators and biofilms on large-scale estuarine mud and morphology, Earth Surf. Proc. Land., 46, 1128–1144, https://doi.org/10.1002/esp.5080, 2021.
Cadee, G. C.: Sediment reworking by Arenicola marina on tidal flats in the Dutch Wadden Sea, Neth. J. Sea Res., 10, 440–460, 1976.
Carey, D. A.: Sedimentological effects and palaeoecological implications of the tube-building polychaete Lanice conchilega Pallas, Sedimentology, 34, 49–66, https://doi.org/10.1111/j.1365-3091.1987.tb00559.x, 1987.
Choi, J., van Beek, R., Chamberlain, E. L., Reimann, T., Smeenge, H., van Oorschot, A., and Wallinga, J.: Luminescence dating approaches to reconstruct the formation of plaggic anthrosols, SOIL, 10, 567–586, https://doi.org/10.5194/soil-10-567-2024, 2024.
Colarossi, D., Duller, G. A. T., Roberts, H. M., Tooth, S., and Lyons, R.: Comparison of paired quartz OSL and feldspar post-IR IRSL dose distributions in poorly bleached fluvial sediments from South Africa, Quat. Geochronol., 30, 233–238, https://doi.org/10.1016/j.quageo.2015.02.015, 2015.
Colosimo, I., van Maren, D. S., de Vet, P. L. M., Winterwerp, J. C., and van Prooijen, B. C.: Winds of opportunity: The effects of wind on intertidal flat accretion, Geomorphology, 439, 108840, https://doi.org/10.1016/j.geomorph.2023.108840, 2023.
Compton, T. J., Holthuijsen, S., Koolhaas, A., Dekinga, A., Smith, J., Galama, Y., Brugge, M., Van Der Wal, D., and Van Der Meer, J.: Distinctly variable mudscapes: Distribution gradients of intertidal macrofauna across the Dutch Wadden Sea, J. Sea Res., 82, 103–116, https://doi.org/10.1016/j.seares.2013.02.002, 2013.
Croudace, I. W., Rindby, A., and Rothwell, R. G.: ITRAX: Description and evaluation of a new multi-function X-ray core scanner, Geol. Soc. Spec. Publ., 267, 51–63, https://doi.org/10.1144/GSL.SP.2006.267.01.04, 2006.
Cunningham, A. C. and Wallinga, J.: Realizing the potential of fluvial archives using robust OSL chronologies, Quat. Geochronol., 12, 98–106, https://doi.org/10.1016/j.quageo.2012.05.007, 2012.
Cunningham, A. C., Buylaert, J.-P., and Murray, A. S.: Attenuation of beta radiation in granular matrices: implications for trapped-charge dating, Geochronology, 4, 517–531, https://doi.org/10.5194/gchron-4-517-2022, 2022.
Davison, C.: IV.—On the amount of sand brought up by Lobworms to the surface, Geol. Mag., 8, 489–493, https://doi.org/10.1017/S0016756800187497, 1891.
de Boer, A. M., Seebregts, M., Wallinga, J., and Chamberlain, E.: A one-day experiment quantifying subaqueous bleaching of K-feldspar luminescence signals in the Wadden Sea, the Netherlands, Neth. J. Geosci., 103, e22, https://doi.org/10.1017/njg.2024.18, 2024a.
de Boer, A. M., Kook, M., and Wallinga, J.: Testing the performance of an EMCCD camera in measuring single-grain feldspar (thermo)luminescence in comparison to a laser-based single-grain system, Radiat. Meas., 175, 107168, https://doi.org/10.1016/j.radmeas.2024.107168, 2024b.
de Boer, A. M., Pearson, S., van der Spek, A., van Prooijen, B., and Wallinga, J.: Luminescence as a tool to reconstruct sediment transport pathways in a tidal inlet, Mar. Geol., 107749, https://doi.org/10.1016/j.margeo.2026.107749, 2026a.
de Boer, A. M., Pannozzo, N., Pearson, S. G., Kooistra, T. J., van Prooijen, B. C., and Wallinga, J.: Resetting of quartz and feldspar luminescence signals under water, Sci. Rep., in press, https://doi.org/10.1038/s41598-026-44245-6, 2026b.
de Stigter, H. C., Jesus, C. C., Boer, W., Richter, T. O., Costa, A., and van Weering, T. C. E.: Recent sediment transport and deposition in the Lisbon-Setúbal and Cascais submarine canyons, Portuguese continental margin, Deep-Sea Res. Pt. II, 58, 2321–2344, https://doi.org/10.1016/j.dsr2.2011.04.001, 2011.
de Vet, P. L. M., van Prooijen, B. C., Schrijvershof, R. A., van der Werf, J. J., Ysebaert, T., Schrijver, M. C., and Wang, Z. B.: The Importance of Combined Tidal and Meteorological Forces for the Flow and Sediment Transport on Intertidal Shoals, J. Geophys. Res.-Earth, 123, 2464–2480, https://doi.org/10.1029/2018JF004605, 2018.
de Vet, P. L. M., van Prooijen, B. C., Colosimo, I., Steiner, N., Ysebaert, T., Herman, P. M. J., and Wang, Z. B.: Variations in storm-induced bed level dynamics across intertidal flats, Sci. Rep., 10, 1–15, https://doi.org/10.1038/s41598-020-69444-7, 2020.
Deloffre, J., Verney, R., Lafite, R., Lesueur, P., Lesourd, S., and Cundy, A. B.: Sedimentation on intertidal mudflats in the lower part of macrotidal estuaries: Sedimentation rhythms and their preservation, Mar. Geol., 241, 19–32, https://doi.org/10.1016/j.margeo.2007.02.011, 2007.
Fan, D., Guo, Y., Wang, P., and Shi, J. Z.: Cross-shore variations in morphodynamic processes of an open-coast mudflat in the Changjiang Delta, China: With an emphasis on storm impacts, Cont. Shelf Res., 26, 517–538, https://doi.org/10.1016/j.csr.2005.12.011, 2006.
Foster-Smith, R. L.: An analysis of water flow in tube-living animals, J. Exp. Mar. Biol. Ecol., 34, 73–95, https://doi.org/10.1016/0022-0981(78)90058-8, 1978.
François, F., Poggiale, J. C., Durbec, J. P., and Stora, G.: A new approach for the modelling of sediment reworking induced by a macrobenthic community, Acta Biotheor., 45, 295–319, https://doi.org/10.1023/a:1000636109604, 1997.
Frithsen, J. B. and Doering, P. H.: Active enhancement of particle removal from the water column by tentaculate benthic polychaetes, Ophelia, 25, 169–182, https://doi.org/10.1080/00785326.1986.10429748, 1986.
Galbraith, R. F., Roberts, R. G., Laslett, G. M., Yoshida, H., and Olley, J. M.: Optical dating of single and multiple grains of quartz form Jinmium Rock Shelter, Northern Australia: Part I, experimental design and statistical models, Archaeometry, 41, 339–364, https://doi.org/10.1111/j.1475-4754.1999.tb00987.x, 1999.
Gao, S.: Geomorphology and sedimentology of tidal flats, in: Coastal Wetlands: An Integrated Ecosystem Approach, Elsevier, 359–381, https://doi.org/10.1016/B978-0-444-63893-9.00010-1, 2018.
Gebhardt, C. and Forster, S.: Size-selective feeding of Arenicola marina promotes long-term burial of microplastic particles in marine sediments, Environ. Pollut., 242, 1777–1786, https://doi.org/10.1016/j.envpol.2018.07.090, 2018.
Gerino, M., Aller, R. C., Lee, C., Cochran, J. K., Aller, J. Y., Green, M. A., and Hirschberg, D.: Comparison of different tracers and methods used to quantify bioturbation during a spring bloom: 234-thorium, luminophores and chlorophyll a, Estuar. Coast. Shelf S., 46, 531–547, https://doi.org/10.1006/ecss.1997.0298, 1998.
Godfrey-Smith, D. I., Huntley, D. J., and Chen, W. H.: Optical dating studies of quartz and feldspar sediment extracts, Quat. Sci. Rev., 7, 373–380, https://doi.org/10.1016/0277-3791(88)90032-7, 1988.
Grandjean, T. J., de Smit, J. C., van Belzen, J., Fivash, G. S., van Dalen, J., Ysebaert, T., and Bouma, T. J.: Morphodynamic signatures derived from daily surface elevation dynamics can explain the morphodynamic development of tidal flats, Water Science and Engineering, 16, 14–25, https://doi.org/10.1016/j.wse.2022.11.003, 2023.
Gray, J. S.: Animal-sediment relationships, Oceanogr. Mar. Biol. Ann. Rev., 12, 223–261, 1974.
Guyard, H., Chapron, E., St-Onge, G., Anselmetti, F. S., Arnaud, F., Magand, O., Francus, P., and Mélières, M. A.: High-altitude varve records of abrupt environmental changes and mining activity over the last 4000 years in the Western French Alps (Lake Bramant, Grandes Rousses Massif), Quat. Sci. Rev., 26, 2644–2660, https://doi.org/10.1016/j.quascirev.2007.07.007, 2007.
Guyez, A., Bonnet, S., Reimann, T., Carretier, S., and Wallinga, J.: A Novel Approach to Quantify Sediment Transfer and Storage in Rivers—Testing Feldspar Single-Grain pIRIR Analysis and Numerical Simulations, J. Geophys. Res.-Earth, 128, e2022JF006727, https://doi.org/10.1029/2022JF006727, 2023.
Heimsath, A. M., Chappell, J., Spooner, N. A., and Questiaux, D. G.: Creeping soil, Geology, 30, 111–114, https://doi.org/10.1130/0091-7613(2002)030<0111:CS>2.0.CO;2, 2002.
Herringshaw, L. G., Sherwood, O. A., and McIlroy, D.: Ecosystem engineering by bioturbating polychaetes in event bed microcosms, Palaios, 25, 46–58, https://doi.org/10.2110/palo.2009.p09-055r, 2010.
Hu, Z., van der Wal, D., Cai, H., van Belzen, J., and Bouma, T. J.: Dynamic equilibrium behaviour observed on two contrasting tidal flats from daily monitoring of bed-level changes, Geomorphology, 311, 114–126, https://doi.org/10.1016/j.geomorph.2018.03.025, 2018.
Huettel, M., Berg, P., and Kostka, J. E.: Benthic exchange and biogeochemical cycling in permeable sediments, Ann. Rev. Mar. Sci., 6, 23–51, https://doi.org/10.1146/annurev-marine-051413-012706, 2014.
Jumars, P. A. and Nowell, A. R. M.: Effects of benthos on sediment transport: difficulties with functional grouping, Cont. Shelf Res., 3, 115–130, https://doi.org/10.1016/0278-4343(84)90002-5, 1984.
Jumars, P. A., Self, R. F. l., and Nowell, A. R. M.: Mechanics of particle selection by tentaculate deposit-feeders, J. Exp. Mar. Biol. Ecol., 64, 47–70, https://doi.org/10.1016/0022-0981(82)90067-3, 1982.
Jumars, P. A., Dorgan, K. M., and Lindsay, S. M.: Diet of worms emended: An update of polychaete feeding guilds, Ann. Rev. Mar. Sci., 7, 497–520, https://doi.org/10.1146/annurev-marine-010814-020007, 2015.
Kars, R. H., Busschers, F. S., and Wallinga, J.: Validating post IR-IRSL dating on K-feldspars through comparison with quartz OSL ages, Quat. Geochronol., 12, 74–86, https://doi.org/10.1016/j.quageo.2012.05.001, 2012.
Kooistra, T. J., Witbaard, R., Bouma, T. J., Pearson, S. G., Bijleveld, A. I., van der Heide, T., Franken, O., and Soetaert, K.: Coarsening coasts: quantifying sensitivity of benthic communities to sandification, Estuar. Coast. Shelf S., 320, 109303, https://doi.org/10.1016/j.ecss.2025.109303, 2025.
Kooistra, T. J., de Boer, A.-M., Bouma, T. J., Pannozzo, N., Pearson, S. G., van der Spek, A., de Stigter, H., Wallinga, J., Witbaard, R., and Soetaert, K.: Worms and storms: shedding light on bioturbation and physical mixing on an intertidal flat by combining multiple tracers, NIOZ dataverse [data and code], 2026.
Kook, M., Lapp, T., Murray, A. S., Thomsen, K. J., and Jain, M.: A luminescence imaging system for the routine measurement of single-grain OSL dose distributions, Radiat. Meas., 81, 171–177, https://doi.org/10.1016/j.radmeas.2015.02.010, 2015.
Kreutzer, S., Burow, C., Dietze, M., Fuchs, M. C., Schmidt, C., Fischer, M., Friedrich, J., Mercier, N., Smedley, R., Christophe, C., Zink, A., Durcan, J. A., King, G. E., Philippe, A., Guérin, G., Riedesel, S., Autzen, M., Guibert, P., Mittelstraß, D., Gray, H. J., Galharret, J. M., and Fuchs, M.: Luminescence 1.X: Comprehensive Luminescence Dating Data Analysis, Zenodo [software], https://doi.org/10.5281/ZENODO.596252, 2025.
Kristensen, E., Penha-Lopes, G., Delefosse, M., Valdemarsen, T., Quintana, C. O., and Banta, G. T.: What is bioturbation? the need for a precise definition for fauna in aquatic sciences, Mar. Ecol. Prog. Ser., 446, 285–302, https://doi.org/10.3354/meps09506, 2012.
Kristensen, J. A., Thomsen, K. J., Murray, A. S., Buylaert, J. P., Jain, M., and Breuning-Madsen, H.: Quantification of termite bioturbation in a savannah ecosystem: Application of OSL dating, Quat. Geochronol., 30, 334–341, https://doi.org/10.1016/j.quageo.2015.02.026, 2015.
Le Hir, P., Monbet, Y., and Orvain, F.: Sediment erodability in sediment transport modelling: Can we account for biota effects?, Cont. Shelf Res., 27, 1116–1142, https://doi.org/10.1016/j.csr.2005.11.016, 2007.
Lecroart, P., Maire, O., Schmidt, S., Grémare, A., Anschutz, P., and Meysman, F. J. R.: Bioturbation, short-lived radioisotopes, and the tracer-dependence of biodiffusion coefficients, Geochim. Cosmochim. Ac., 74, 6049–6063, https://doi.org/10.1016/j.gca.2010.06.010, 2010.
Li, B. and Li, S. H.: Luminescence dating of K-feldspar from sediments: A protocol without anomalous fading correction, Quat. Geochronol., 6, 468–479, https://doi.org/10.1016/j.quageo.2011.05.001, 2011.
Lindvall, A., Stjern, R., and Alexanderson, H.: Bleaching of quartz OSL signals under natural and laboratory light conditions, Ancient TL, 35, 12–20, https://doi.org/10.26034/la.atl.2017.514, 2017.
Longbottom, M. R.: The distribution of Arenicola marina (L.) with particular reference to the effects of particle size and organic matter of the sediments, J. Exp. Mar. Biol. Ecol., 5, 138–157, https://doi.org/10.1016/0022-0981(70)90013-4, 1970.
Madsen, A. T. and Murray, A. S.: Optically stimulated luminescence dating of young sediments: A review, Geomorphology, 109, 3–16, https://doi.org/10.1016/j.geomorph.2008.08.020, 2009.
Madsen, A. T., Murray, A. S., Andersen, T. J., Pejrup, M., and Breuning-Madsen, H.: Optically stimulated luminescence dating of young estuarine sediments: A comparison with 210Pb and 137Cs dating, Mar. Geol., 214, 251–268, https://doi.org/10.1016/j.margeo.2004.10.034, 2005.
Madsen, A. T., Murray, A. S., Andersen, T. J., and Pejrup, M.: Temporal changes of accretion rates on an estuarine salt marsh during the late Holocene – Reflection of local sea level changes? The Wadden Sea, Denmark, Mar. Geol., 242, 221–233, https://doi.org/10.1016/j.margeo.2007.03.001, 2007.
Madsen, A. T., Murray, A. S., Jain, M., Andersen, T. J., and Pejrup, M.: A new method for measuring bioturbation rates in sandy tidal flat sediments based on luminescence dating, Estuar. Coast. Shelf S., 92, 464–471, https://doi.org/10.1016/j.ecss.2011.02.004, 2011.
Maire, O., Lecroart, P., Meysman, F. J. R., Rosenberg, R., Duchêne, J. C., and Grémare, A.: Quantification of sediment reworking rates in bioturbation research: A review, Aquat. Biol., 2, 219–238, https://doi.org/10.3354/ab00053, 2008.
Mauz, B. and Bungenstock, F.: How to reconstruct trends of late Holocene relative sea level: A new approach using tidal flat clastic sediments and optical dating, Mar. Geol., 237, 225–237, https://doi.org/10.1016/j.margeo.2006.12.001, 2007.
Mauz, B., Baeteman, C., Bungenstock, F., and Plater, A. J.: Optical dating of tidal sediments: Potentials and limits inferred from the North Sea coast, Quat. Geochronol., 5, 667–678, https://doi.org/10.1016/j.quageo.2010.05.004, 2010.
Meysman, F. J. R., Boudreau, B., and Middelburg, J.: Relations between local, nonlocal, discrete and continuous models of bioturbation, J. Mar. Res., 61, 391–410, https://elischolar.library.yale.edu/journal_of_marine_research/15/ (last access: 13 April 2026), 2003.
Meysman, F. J. R., Middelburg, J. J., and Heip, C. H. R.: Bioturbation: a fresh look at Darwin's last idea, Trends Ecol. Evol., 21, 688–695, https://doi.org/10.1016/j.tree.2006.08.002, 2006.
Meysman, F. J. R., Malyuga, V. S., Boudreau, B. P., and Middelburg, J. J.: A generalized stochastic approach to particle dispersal in soils and sediments, Geochim. Cosmochim. Ac., 72, 3460–3478, https://doi.org/10.1016/j.gca.2008.04.023, 2008.
Meysman, F. J. R., Boudreau, B., and Middelburg, J.: When and why does bioturbation lead to diffusive mixing?, J. Mar. Res., 68, 881–920, https://elischolar.library.yale.edu/journal_of_marine_research/292/ (last access: 13 April 2026), 2010.
Montserrat, F., Van Colen, C., Provoost, P., Milla, M., Ponti, M., Van den Meersche, K., Ysebaert, T., and Herman, P. M. J.: Sediment segregation by biodiffusing bivalves, Estuar. Coast. Shelf S., 83, 379–391, https://doi.org/10.1016/j.ecss.2009.04.010, 2009.
Montserrat, F., Suykerbuyk, W., Al-Busaidi, R., Bouma, T. J., van der Wal, D., and Herman, P. M. J.: Effects of mud sedimentation on lugworm ecosystem engineering, J. Sea Res., 65, 170–181, https://doi.org/10.1016/j.seares.2010.09.003, 2011.
Morys, C., Powilleit, M., and Forster, S.: Bioturbation in relation to the depth distribution of macrozoobenthos in the southwestern Baltic Sea, Mar. Ecol. Prog. Ser., 579, 19–36, https://doi.org/10.3354/meps12236, 2017.
Ouellette, D., Desrosiers, G., Gagne, J., Gilbert, F., Poggiale, J., Blier, P., and Stora, G.: Effects of temperature on in vitro sediment reworking processes by a gallery biodiffusor, the polychaete Neanthes virens, Mar. Ecol. Prog. Ser., 266, 185–193, https://doi.org/10.3354/meps266185, 2004.
Pannozzo, N., Smedley, R. K., Plater, A. J., Carnacina, I., and Leonardi, N.: Novel luminescence diagnosis of storm deposition across intertidal environments, Sci. Total Environ., 867, 161461, https://doi.org/10.1016/j.scitotenv.2023.161461, 2023.
Porat: Use of magnetic separation for purifying quartz for luminescence dating, Ancient TL, 24, 33–36, 2006.
Prescott, J. R., Fox, P. J., Robertson, G. B., and Hutton, J. T.: Three-dimensional spectral studies of the bleaching of the thermoluminescence of feldspars, Radiat. Meas., 23, 367–375, https://doi.org/10.1016/1350-4487(94)90066-3, 1994.
Queirós, A. M., Birchenough, S. N. R., Bremner, J., Godbold, J. A., Parker, R. E., Romero-Ramirez, A., Reiss, H., Solan, M., Somerfield, P. J., Van Colen, C., Van Hoey, G., and Widdicombe, S.: A bioturbation classification of European marine infaunal invertebrates, Ecol. Evol., 3, 3958–3985, https://doi.org/10.1002/ECE3.769, 2013.
R Core Team: R: A Language and Environment for Statistical Computing, R Foundation for Statistical Computing, Vienna, Austria, 2024.
Reimann, T., Román-Sánchez, A., Vanwalleghem, T., and Wallinga, J.: Getting a grip on soil reworking – Single-grain feldspar luminescence as a novel tool to quantify soil reworking rates, Quat. Geochronol., 42, 1–14, https://doi.org/10.1016/j.quageo.2017.07.002, 2017.
Reise, K.: Sediment mediated species interactions in coastal waters, J. Sea Res., 48, 127–141, https://doi.org/10.1016/S1385-1101(02)00150-8, 2002.
Rhoads, D. C. and Boyer, L. F.: The Effects of Marine Benthos on Physical Properties of Sediments, Springer, Boston, MA, 3–52, https://doi.org/10.1007/978-1-4757-1317-6_1, 1982.
Rhoads, D. C. and Stanley, D. J.: Biogenic Graded Bedding, J. Sediment. Res., 35, 956–963, https://doi.org/10.1306/74d713bb-2b21-11d7-8648000102c1865d, 1965.
Rhodes, E. J.: Optically stimulated luminescence dating of sediments over the past 200,000 years, Annu. Rev. Earth Pl. Sc., 39, 461–488, https://doi.org/10.1146/annurev-earth-040610-133425, 2011.
Richter, R.: Fluidal-Textur in Sediment-Gesteinen und über Sedifluktion überhaupt, Notizbl. Hess. Landesamtes Bodenforsch. Wiesbaden, 6, 67–81, 1952.
Richter, T. O., Van Der Gaast, S., Koster, B., Vaars, A., Gieles, R., De Stigter, H. C., De Haas, H., and Van Weering, T. C. E.: Modeling 210Pb-derived mixing activity in ocean margin sediments: Diffusive versus nonlocal mixing, J. Mar. Res., 54, 1207–1227, https://elischolar.library.yale.edu/journal_of_marine_research/2215/ (last access: 13 April 2026), 1996.
Richter, T. O., Van Der Gaast, S., Koster, B., Vaars, A., Gieles, R., De Stigter, H. C., De Haas, H., and Van Weering, T. C. E.: The Avaatech XRF Core Scanner: Technical description and applications to NE Atlantic sediments, Geol. Soc. Spec. Publ., 267, 39–50, https://doi.org/10.1144/GSL.SP.2006.267.01.03, 2006.
Riisgård, H. U. and Banta, G. T.: Irrigation and deposit feeding by the lugworm Arenicola marina, characteristics and secondary effects on the environment. A review of current knowledge, Vie Milieu, 48, 243–257, 1998.
Ritchie, R. J.: Consistent sets of spectrophotometric chlorophyll equations for acetone, methanol and ethanol solvents, Photosynth. Res., 89, 27–41, https://doi.org/10.1007/s11120-006-9065-9, 2006.
Román-Sánchez, A., Reimann, T., Wallinga, J., and Vanwalleghem, T.: Bioturbation and erosion rates along the soil-hillslope conveyor belt, part 1: Insights from single-grain feldspar luminescence, Earth Surf. Proc. Land., 44, 2051–2065, https://doi.org/10.1002/esp.4628, 2019.
Schneider, C. A., Rasband, W. S., and Eliceiri, K. W.: NIH Image to ImageJ: 25 years of image analysis, Nat. Methods, 9, 671–675, https://doi.org/10.1038/nmeth.2089, 2012.
Self, R. and Jumars, P.: Cross-phyletic patterns of particle selection by deposit feeders, J. Mar. Res., 46, 119–143, https://elischolar.library.yale.edu/journal_of_marine_research/1884/ (last access: 13 April 2026), 1988.
Smedley, R. K., Duller, G. A. T., and Roberts, H. M.: Bleaching of the post-IR IRSL signal from individual grains of K-feldspar: Implications for single-grain dating, Radiat. Meas., 79, 33–42, https://doi.org/10.1016/j.radmeas.2015.06.003, 2015.
Snelgrove, P. V. R., Soetaert, K., Solan, M., Thrush, S., Wei, C. L., Danovaro, R., Fulweiler, R. W., Kitazato, H., Ingole, B., Norkko, A., Parkes, R. J., and Volkenborn, N.: Global Carbon Cycling on a Heterogeneous Seafloor, Trends Ecol. Evol., 33, 96–105, https://doi.org/10.1016/j.tree.2017.11.004, 2018.
Soissons, L. M., Gomes da Conceiçâo, T., Bastiaan, J., van Dalen, J., Ysebaert, T., Herman, P. M. J., Cozzoli, F., and Bouma, T. J.: Sandification vs. muddification of tidal flats by benthic organisms: A flume study, Estuar. Coast. Shelf S., 228, https://doi.org/10.1016/j.ecss.2019.106355, 2019.
Staudt, F., Mullarney, J. C., Pilditch, C. A., and Huhn, K.: Effects of grain-size distribution and shape on sediment bed stability, near-bed flow and bed microstructure, Earth Surf. Proc. Land., 44, 1100–1116, https://doi.org/10.1002/esp.4559, 2019.
Stockmann, U., Minasny, B., Pietsch, T. J., and McBratney, A. B.: Quantifying processes of pedogenesis using optically stimulated luminescence, Eur. J. Soil Sci., 64, 145–160, https://doi.org/10.1111/ejss.12012, 2013.
Sun, M.-Y., Lee, C., and Aller, R. C.: Laboratory studies of oxic and anoxic degradation of chlorophyll-a in Long Island Sound sediments, Geochim. Cosmochim. Ac., 57, 147–157, https://doi.org/10.1016/0016-7037(93)90475-C, 1993.
Taghon, G. L.: Optimal foraging by deposit-feeding invertebrates: Roles of particle size and organic coating, Oecologia, 52, 295–304, https://doi.org/10.1007/BF00367951, 1982.
van der Meij, W. M., Riedesel, S., and Reimann, T.: Mixed Signals: interpreting mixing patterns of different soil bioturbation processes through luminescence and numerical modelling, SOIL, 11, 51–66, https://doi.org/10.5194/soil-11-51-2025, 2025.
van Straaten, L. M. J. U.: Biogene textures and the formation of shell beds in the Dutch Wadden Sea I, Proc. Koninkl. Ned. Akad. Wetenschap, 55, 1952.
Vandenberghe, D., De Corte, F., Buylaert, J. P., Kučera, J., and Van den Haute, P.: On the internal radioactivity in quartz, Radiat. Meas., 43, 771–775, https://doi.org/10.1016/j.radmeas.2008.01.016, 2008.
Volkenborn, N., Polerecky, L., Hedtkamp, S. I. C., van Beusekom, J. E. E., and de Beer, D.: Bioturbation and bioirrigation extend the open exchange regions in permeable sediments, Limnol. Oceanogr., 52, 1898–1909, https://doi.org/10.4319/lo.2007.52.5.1898, 2007a.
Volkenborn, N., Hedtkamp, S. I. C., van Beusekom, J. E. E., and Reise, K.: Effects of bioturbation and bioirrigation by lugworms (Arenicola marina) on physical and chemical sediment properties and implications for intertidal habitat succession, Estuar. Coast. Shelf S., 74, 331–343, https://doi.org/10.1016/j.ecss.2007.05.001, 2007b.
Wallinga, J.: On the detection of OSL age overestimation using single-aliquot techniques, Geochronometria, 21, 17–26, 2002.
Wallinga, J., Hobo, N., Cunningham, A. C., Versendaal, A. J., Makaske, B., and Middelkoop, H.: Sedimentation rates on embanked floodplains determined through quartz optical dating, Quat. Geochronol., 5, 170–175, https://doi.org/10.1016/j.quageo.2009.01.002, 2010.
Wallinga, J., Sevink, J., Van Mourik, J. M., and Reimann, T.: Luminescence dating of soil archives, in: Developments in Quaternary Sciences, Reading the soil archives: unraveling the geoecological code of palaeosols and sediment cores, edited by: van Mourik, J. and van der Meer, J., Elsevier, Amsterdam, 115–162, https://doi.org/10.1016/B978-0-444-64108-3.00004-5, 2019.
Wang, P. and Cheng, J.: Storm Impacts on the Morphology and Sedimentology of Open-Coast Tidal Flats, in: Coastal Storms: Processes and Impacts, Wiley Blackwell, 81–98, https://doi.org/10.1002/9781118937099.ch5, 2016.
Ward, J. E. and Shumway, S. E.: Separating the grain from the chaff: Particle selection in suspension- and deposit-feeding bivalves, J. Exp. Mar. Biol. Ecol., 300, 83–130, https://doi.org/10.1016/j.jembe.2004.03.002, 2004.
Wendelboe, K., Egelund, J. T., Flindt, M. R., and Valdemarsen, T.: Impact of lugworms (Arenicola marina) on mobilization and transport of fine particles and organic matter in marine sediments, J. Sea Res., 76, 31–38, https://doi.org/10.1016/j.seares.2012.10.013, 2013.
Wheatcroft, R. A.: Preservation potential of sedimentary event layers, Geology, 18, 843–845, https://doi.org/10.1130/0091-7613(1990)018<0843:PPOSEL>2.3.CO;2, 1990.
Widdows, J. and Brinsley, M.: Impact of biotic and abiotic processes on sediment dynamics and the consequences to the structure and functioning of the intertidal zone, J. Sea Res., 48, 143–156, https://doi.org/10.1016/S1385-1101(02)00148-X, 2002.
Wintle, A. G.: Luminescence dating: Where it has been and where it is going, Boreas, 37, 471–482, https://doi.org/10.1111/j.1502-3885.2008.00059.x, 2008.
Witbaard, R., Bergman, M. J. N., van Weerlee, E., and Duineveld, G. C. A.: An estimation of the effects of Ensis directus on the transport and burial of silt in the near-shore Dutch coastal zone of the North Sea, J. Sea Res., 127, 95–104, https://doi.org/10.1016/j.seares.2016.12.001, 2017.
Zhang, A., Long, H., Yang, F., Zhang, J., Peng, J., and Zhang, G.: Luminescence dating illuminates soil evolution, Earth. Sci. Rev., 265, 105103, https://doi.org/10.1016/j.earscirev.2025.105103, 2025.
Zhou, Z., Liu, Q., Fan, D., Coco, G., Gong, Z., Möller, I., Xu, F., Townend, I., and Zhang, C.: Simulating the role of tides and sediment characteristics on tidal flat sorting and bedding dynamics, Earth Surf. Proc. Land., 46, 2163–2176, https://doi.org/10.1002/esp.5166, 2021.
Zhou, Z., Wu, Y., Fan, D., Wu, G., Luo, F., Yao, P., Gong, Z., and Coco, G.: Sediment sorting and bedding dynamics of tidal flat wetlands: Modeling the signature of storms, J. Hydrol. (Amst)., 610, 127913, https://doi.org/10.1016/j.jhydrol.2022.127913, 2022.
Ziegler, M., Jilbert, T., de Lange, G. J., Lourens, L. J., and Reichart, G.: Bromine counts from XRF scanning as an estimate of the marine organic carbon content of sediment cores, Geochem. Geophy. Geosy., 9, https://doi.org/10.1029/2007GC001932, 2008.