the Creative Commons Attribution 4.0 License.
the Creative Commons Attribution 4.0 License.
 | 17 Apr 2026
Disentangling the drivers of soil CO2 ventilation in a Mediterranean dryland using in situ and remote sensing techniques
Irene Tovar
Enrique Echeverría-Martín
Juana Andújar-Maqueda
Pablo Ortiz-Amezcua
Germán Cabrera-Carrillo
Penélope Serrano-Ortiz
Francisco Domingo
Lucas Alados-Arboledas
Andrew S. Kowalski
Enrique P. Sánchez-Cañete
Juan Luis Guerrero-Rascado
Subterranean CO2 concentrations are driven by complex interactions between biological and physical processes. In semiarid ecosystems, atmospheric processes can play a relevant role in modulating soil CO2 storage and release. In the current study, a multi-instrumental dataset, collected in a Mediterranean shrubland in southern Spain, was analyzed, and the main atmospheric drivers controlling soil CO2 and radon (Rn) dynamics were investigated. Based on a precise methodology, 10 significant ventilation events were detected, and the Spearman correlation coefficients between the soil CO2 and Rn concentrations and the different atmospheric variables were calculated.
The results identified surface atmospheric pressure as the most consistent and independent driver across the events, exhibiting strong negative correlations with the subterranean CO2 and Rn concentrations. Surface-level friction velocity (u∗), boundary-layer turbulent kinetic energy dissipation rate (ϵ) and wind shear (sh) showed significant positive correlations. However, their independence was not consistent when compared with diluting ventilation events, when u∗ was more relevant, with enriching ventilation periods, that were more influenced by boundary-layer ϵ and sh. In contrast, at lower altitudes ϵ, sh, atmospheric boundary layer height and mixing layer height were less strongly correlated with soil CO2 and Rn concentration changes.
These findings provide new insights into the mechanisms that promote soil-atmosphere transport in drylands, especially those regarding the carbon cycle, and highlight the need to incorporate such mechanisms into Earth system models to improve carbon cycle predictions under future climate scenarios.
- Article
(1200 KB) - Full-text XML
- BibTeX
- EndNote


The current context of climate change and increasing CO2 concentrations in the atmosphere (IPCC, 2021; WMO, 2024) highlights the importance of characterizing CO2 emission and sequestration mechanisms between ecosystems and the atmosphere, since CO2 is the second most important greenhouse gas after water vapor (GHG; Schimel, 1995). Terrestrial ecosystems were found to be significant CO2 net sinks, with increasing CO2 uptake in recent decades (e.g., Piao et al., 2018). Additionally, terrestrial uptake is the main driver of interannual variability of atmospheric CO2 (IPCC, 2021), especially in semiarid ecosystems (e.g., Ahlström et al., 2015) where the contribution to interannual variability is larger. The eddy covariance (EC) technique has emerged as a powerful tool to track CO2 exchanges, identifying and quantifying the mechanisms involved (e.g., Baldocchi, 2014). CO2 fluxes obtained with the EC technique have been traditionally associated with biological processes, such as respiration and photosynthesis (e.g., Pastorello et al., 2020), while abiotic geochemical and mechanical processes (e.g., Brantley et al., 2008; Serrano-Ortiz et al., 2010; Moya et al., 2022) were traditionally neglected. However, the importance of these mechanisms in the carbon cycle has been proven over carbonate terrains (Sánchez-Cañete et al., 2011; López-Ballesteros et al., 2017).
Carbonate-rich substrates are commonly found in dryland regions and represent the world's largest carbon reservoir (Liu and Zhao, 2000), while they are filled with pores and even cavities across the subterrain. These cavities are formed by the infiltration of water from the surface through weathering processes (Brantley et al., 2008), particularly after rain events, which dissolves inorganic carbon present in the surface, transporting it deeper. At depth, the dissolved inorganic carbon may precipitate, releasing CO2 into the soil atmosphere (Spötl et al., 2005), and thereby increasing CO2 levels and creating significant underground soil carbon pools in the vadose zone. In addition, biotic processes such as root respiration and microbial activity, along with abiotic influences such as geological CO2 sources and the downward movement of dense, CO2-rich air masses (Sánchez-Cañete et al., 2013), contribute to elevated subsurface CO2 levels. The combined effect of these processes produces increases of underground CO2 storage at concentrations 10 to 100 times greater than in the atmosphere (e.g., Faimon et al., 2020).
Once stored, CO2 is transported within the soil or emitted to the atmosphere through two main processes: diffusion and ventilation. Mixing by random motions causes CO2 transport down the gradient from enriched soil to the more diluted atmosphere through molecular and turbulent diffusion. However, CO2 can be aerodynamically controlled and vented through mechanical airflow, normally during dry periods (Kowalski et al., 2008, Sánchez-Cañete et al., 2011), when the soil pores are not saturated by water. Subterranean ventilation is known to occur mainly over drylands (Moya et al., 2022), impacting CO2 levels in the atmosphere and modifying the net ecosystem carbon balance (NECB) at significant levels both in the short term (e.g., Serrano-Ortiz et al., 2010; Sánchez-Cañete et al., 2011, 2013) and in the long term (e.g., López-Ballesteros et al., 2017). These processes can pump fresh atmospheric air into the pores and cavities, displacing the subterrain CO2-rich air masses and producing subsequent release of CO2 to the atmosphere, and consequently an increase in atmospheric CO2 concentrations (Sánchez-Cañete et al., 2011). The emission is measurable with the EC technique and has been related at different sites to high friction velocities (Sánchez-Cañete et al., 2011) and atmospheric pressure differences (Sánchez-Cañete et al., 2013; Moya et al., 2019). Soil and cavities structures, and consequently soil ventilation, are highly heterogeneous (Sánchez-Cañete et al., 2016) making the interaction between the soil and the atmosphere very complex to characterize. Additionally, diurnal fluctuations in subsurface CO2 concentrations have been identified (e.g., Moya et al., 2019). The amplitude of these fluctuations decreases with depth, indicating the diminishing influence of atmospheric processes (Sánchez-Cañete et al., 2013).
Ventilation events affect concentrations of numerous species. While molecules like CO2 or CH4 exhibit high interactivity with biological processes, others like 222Rn (hereinafter Rn) are mostly inert. Thus, CO2 levels are highly affected by biological processes, while Rn natural production process is exclusively radioactive decay from 226Ra present in the Earth's crust (Moed et al., 1988). However, the amount of Rn released into the pore air (emanation) can be influenced by soil moisture content (Zhuo et al. 2006). Thus, in poorly vented pores and cavities, Rn levels are expected to accumulate at a constant rate, while a forced change in its concentration will be caused by ventilation of the pores and cavities (Kowalski et al., 2008; Pla et al., 2023). Consequently, Rn is an adequate proxy to track natural CO2 ventilation events (e.g.,Sánchez-Cañete et al., 2011). In atmospheric studies, the Rn concentration is typically tracked by its radioactivity level (usually in Bq m−3) since they are directly proportional.
Worldwide networks have been established to track CO2 exchanges, such as FLUXNET (Pastorello et al., 2020), which also tracks water vapor and energy exchanges. In the case of CO2, the technique and instrumentation have been improved with time, while CO2 exchanges have been linked exclusively to biological processes. However, the coverage of this network is not homogeneous across the world, and some regions lack representativity (Villarreal et al., 2018). This might have influenced the fact that communities like FLUXNET have underestimated abiotic processes specific to carbonate terrains, such as carbonaceous rock dissolution and soil ventilation, as these processes might not be significant in the majority of the stations but should be considered for others. A proper characterization of the processes involved in soil CO2 ventilation should be conducted, in order to improve CO2 exchange models and produce reliable products.
The surface and the atmosphere interact constantly with each other, from daily boundary layer development due to surface irradiation to the exchanges of energy, molecules, or particle fluxes (Stull, 1988). Atmospheric dynamics play a crucial role in the dispersion of atmospheric constituents and the importance of its dynamics has been proven to be a driver of soil ventilation. The characterization of the atmospheric dynamics for turbulent exchange investigation has been traditionally measured with in-situ instrumentation, with sonic anemometers installed atop towers (e.g., Jones and Smith et al., 1977). Recently, new instrumentation based on the lidar technique has opened opportunities to characterize the upper atmosphere and the dynamics of its constituents (e.g., Ortiz-Amezcua et al., 2022a; Abril-Gago et al., 2023, Andújar-Maqueda et al., 2025). However, their implementation to the study of turbulent exchanges between the surface and the atmosphere is yet to be developed and standardized (e.g., Gibert et al., 2011).
Ventilation of underground CO2 is a well-known phenomenon occurring in Mediterranean drylands, specifically in Cabo de Gata-Níjar Natural Park, in Southeastern Spain, where atmospheric pressure and turbulence have been found to be its main drivers (e.g., Sánchez-Cañete et al., 2013; López-Ballesteros et al., 2017, 2018; Moya et al., 2019), typically during the long dry summer period or sufficiently after precipitation pulses. In the current study, carried out in Cabo de Gata-Níjar Natural Park, turbulence within the boundary layer is investigated for the first time using a range-resolved Doppler lidar as a potential driver of soil ventilation processes, together with the assessment of the importance of variables such as atmospheric pressure and friction velocity, whose impact is already known.
2.1 Station
This study focuses on the field campaign SCARCE (Synchronized Characterization of Aerosol, Radon and Carbon dioxide Exchanges in drylands), carried out between 18 July 2023 and 15 January 2024 at Balsa Blanca (36.94° N, 2.03° W, 205 m a.s.l., GHG-Europe site code: ES-Agu, referred to as Aguamarga in some studies) in Southeastern Spain. The station is located within the Cabo de Gata-Níjar Natural Park, a Mediterranean semiarid grassland of significant ecological importance at 6 km from the western coast of the Mediterranean Sea. The climate of the region is classified as dry subtropical semiarid, or BSh Köppen classification (El-Kenawy et al., 2022), coincident with the most arid region of Spain with a mean annual precipitation of around 220 mm and temperature of around 18 °C. Additionally, precipitation occurs in the form of rain pulses followed by long dry periods, with the most significant being the dry season from June to September/October (López-Ballesteros et al., 2016). These precipitation pulses trigger significant CO2 emissions mainly due to soil respiration caused by rapid reactivation of microbial and root activity in the ecosystem (López-Ballesteros et al., 2016). Winds exhibit two dominant patterns, northeast and southwest, aligned with the coastline and the local orography, corresponding to the easterly and westerly wind regimes of the Alborán Sea (Abril-Gago et al., 2025a).
The landscape is characterized by patches of vegetation and bare soil. The dominant vegetation species is Macrochloa tenacissima, strongly adapted to severe water stress, with other less common species including Chamaerops humilis, Rhamnus lycioides, Asparagus horridus, Olea europaea var. sylvestris, Pistacia lentiscus, and Rubia peregrina (Rey et al., 2011). The growing season occurs from late autumn to early spring, when vegetation is more active (Serrano-Ortiz et al., 2014) due to the availability of water resources (López-Ballesteros et al., 2016). This period is followed by a non-growing period, characterized by strong water stress, higher temperatures, and a lack of precipitation.
The station is located over quaternary conglomerates and Neogene-Quaternary sediments cemented by lime (caliche), in a flat alluvial fan of gentle slopes (2 % to 6 %; Rey et al., 2017). Typical soils correspond to Calcaric Lithic Leptosol soils, shallow (10 cm maximum) and alkaline (pH above 8), with petrocalcic horizons and saturated in carbonates. The texture of the soil is sandy loam, with sand (61 %), silt (23 %), and clay (16 %), with a bulk density of 1.25 g cm−3. Groundcover consists of gravel and rock bare soil (49 %) and vegetation (51 %; Rey et al., 2011).
2.2 Atmospheric instrumentation
The station centers on a flux tower equipped for eddy covariance measurements. The 3.5 m tower was equipped with an enclosed-path LI-7200RS (LI-COR, Lincoln, NE, USA) gas analyzer that measures CO2 and H2O densities and atmospheric pressure, synchronized with a Gill HS-100-3 (Gill Instruments Ltd, Lymington, UK) three-axis sonic anemometer, together with a HMP45C thermohygrometer (Campbell scientific, Logan, UT, USA; hereafter CSI). These data were recorded by a CR3000 (CSI) data logger at 10 Hz. Micrometeorological data were later processed with EddyPro (LI-COR) version 7.0.8 over 30 min intervals. Finally, quality flags provided by EddyPro (Mauder and Foken, 2006) were considered and only data with 0 or 1 flag values were labeled as valid and consequently included in the analysis. Additionally, an ARG100 (CSI) pluviometer provided 30 min precipitation data registered on a CR1000X (CSI) with a resolution of 0.2 mm per tip.
For the present analysis, atmospheric CO2 concentration (CO in ppm), CO2 flux (, in µmol m−2 s−1), atmospheric pressure (Pair, in kPa), relative humidity (RHair, in %) and temperature (Tair, in °C), horizontal wind speed (Vh, in m s−1) and direction (in degrees), and friction velocity (u∗, in m s−1) information was taken from the flux tower upon processing and filtering whereas precipitation data (in mm) were directly obtained from the pluviometer.
A HALO Photonics StreamLine XR Doppler lidar was deployed at Balsa Blanca to characterize boundary-layer winds and turbulence during the SCARCE campaign, from 18 July 2023 to 15 January 2024. The system emitted laser radiation at 1565 nm with a pulse repetition rate of 10 kHz and detected the backscattered signal using a heterodyne detector (Pentikäinen et al., 2020). The Doppler shift introduced by atmospheric constituents was then retrieved from the signal. For this purpose, the standardized software package “HALO lidar toolbox” (Manninen, 2019) was used, producing multiple products including 3D wind fields and turbulence parameters. The system operated at a 1 s pulse rate, although processed products were generated with various temporal resolutions, with a default vertical resolution of 30 m. The system's effective full-overlap height was estimated at 90 m above ground level, defining the lowest reliable altitude (the altitude of 105 m was used as a reference, corresponding to the center of the 30 m interval starting at 90 m). The maximum detectable altitude varied depending on atmospheric turbidity, found within the atmospheric boundary layer (Ortiz-Amezcua et al., 2022b). Details of the deployment during SCARCE were provided by Abril-Gago et al. (2025a).
In the current study, two different products from the Doppler lidar were used: the wind shear (sh), representing the vertical gradient of horizontal wind velocity and direction, used as an indicator of mechanical atmospheric mixing (Ortiz-Amezcua et al., 2022a; Andújar-Maqueda et al., 2025); and the turbulent kinetic energy (TKE) dissipation rate (ϵ), quantifying the rate at which the TKE was dissipated into internal thermal energy (O'Connor et al., 2010). Atmospheric turbulence was assumed to be wind-shear-driven when sh exceeded 0.03 s−1 (Manninen et al., 2018). Values of ϵ greater than 10−4 m2 s−3 were indicative of intense turbulent activity (e.g., O'Connor et al., 2010), often associated with convection (Manninen et al., 2018), while lower values corresponded to atmospheric stability and stratification. Values of ϵ were filtered based on the signal-to-noise ratio (SNR). Vertical intervals with SNR lower than 0.006 (or equivalently −22.2 dB) were excluded from the analysis (Manninen et al., 2018). Finally, the original 3 min resolution of the sh and ϵ profiles was averaged into 30 min intervals, while the 30 m vertical resolution was aggregated into three broader layers, encompassing the ranges up to 195 m (sh195 m, ϵ195 m), up to 495 m (sh495 m, ϵ495 m) and up to 1005 m (sh1005 m, ϵ1005 m). Additionally, the particle transport velocities (vt), directly related to upward and downward particle transport, calculated by Abril-Gago et al. (2025a) for the same location and period were incorporated into the statistical analysis.
A CHM15k-Nimbus ceilometer (Lufft, Fellbach, Germany), part of the ICENET network (Cazorla et al., 2017), was deployed alongside the Doppler lidar. This instrument operates by emitting laser pulses at a wavelength of 1064 nm with repetition rates between 5 and 7 kHz, and detecting the atmospheric backscatter using an avalanche photodiode. The device records the range-corrected signal (RCS) at a 1 min interval and 15 m vertical resolution. While full overlap of the laser beam with the receiver field of view occurs around 1500 m above ground level, a significant portion of the signal (approximately 90 %) is captured within the 555–885 m range. The RCS data were processed using the STRATfinder algorithm (Kotthaus et al., 2020) to retrieve the Mixing Layer Height (MLH), the convective mixing layer that develops during daytime due to surface heating, and the Atmospheric Boundary Layer Height (ABLH), which represents the top of the atmospheric boundary layer including the mixing layer and residual layers of previous days, marking the transition to the free troposphere (Kotthaus et al., 2023). To mitigate the impact of incomplete overlap at low altitudes, the RCS data were corrected using the overlap function provided by the manufacturer, providing reliable ABLH and MLH retrievals down to approximately 210–255 m (Kotthaus et al., 2020). Further methodological details related to the derivation of these layers during the present campaign are available in Abril-Gago et al. (2025a).
2.3 Vadose-zone instrumentation
The vadose zone of the station was monitored using a set of CO2 sensors, Rn radioactivity detectors, and volumetric water content (θ), temperature, and pressure sensors installed in a similar configuration at three depths: 15, 50 and 150 cm. A similar setup was installed in a borehole approximately 18 m deep, which did not intersect the groundwater table. The borehole was sealed at the surface with a cap and equipped with a casing 15 cm in diameter. The first meter of the borehole casing closer to the surface was ungrooved, followed by a slotted section extending to the bottom, allowing interaction between the surrounding soil and the borehole interior. The additional borehole setup provides an alternative perspective on subsurface gas dynamics, as the instruments sample air circulating within the borehole, which is less affected by soil porosity than sensors installed directly within the soil profile. Three GMP252 (Vaisala Inc., Vantaa, Finland) CO2 mole fraction probes were installed at the depths of 15, 50 and 150 cm (CO, CO and CO, respectively, in ppm), each paired with a CS655 (Campbell Scientific) water content reflectometer, providing temperature (T15 cm, T50 cm and T150 cm, in °C) and θ (θ15 cm, θ50 cm and θ150 cm, in m3 m−3) measurements. Additionally, the 50 cm depth included an AlphaE (Bertin Technologies, Montigny-le-Bretonneux, France) Rn radioactivity detector (Rn50 cm, in Bq m−3) which also provided pressure (P50 cm, in kPa) and humidity (RH50 cm, in %) measurements. Finally, the same configuration was applied in the borehole, with a GMP252, a HygroVUE5 (Campbell Scientific) temperature and relative humidity sensor and an AlphaE sensor were located within the first meter, providing CO2 concentration (CO), temperature (Tbh), relative humidity (RHbh), Rn activity (Rnbh) and pressure (Pbh). Every sensor was connected to a CR1000X (CSI) data logger and data were averaged and recorded with a 30 min temporal resolution.
3.1 Preprocessing
The raw 30 min series of every variable were detrended in order to remove the dominant diurnal cycle (24 h variations; Sánchez-Cañete et al., 2013). The resulting series reflected the underlying trends of the changes, which would highlight ventilation events not caused by daily patterns. A simple 24 h rolling average was applied to the series. Afterwards, the normality of the detrended series was refuted by Shapiro-Wilk and Anderson-Darling normality tests. Thus, non-parametric statistics had to be performed on the series. Additionally, an augmented Dickey-Fuller test confirmed the stationarity of the 30-min series, so no abrupt changes were present.
3.2 Event detection
The study's statistical analysis focused on specific selected periods (ventilation events) and not on the whole available data series. Therefore, a precise identification of the events was first performed. Each event would exhibit a sudden increase in Rn activity (from now on understood as Rn concentration) and CO2 concentration (enriching ventilation), followed by an equally fast decrease in the concentrations (diluting ventilation). However, some of these phenomena might be caused by precipitation, which triggers significant CO2 emissions from the soil (Vargas et al., 2018) to the ecosystem (López-Ballesteros et al., 2016) in the experimental site. Thus, periods during and up to one day after precipitation were not considered in this study, thereby reducing potential biases associated with soil moisture variability and its effect on Rn emanation (Zhuo et al., 2006). Additionally, based on previous studies (i.e., Sánchez-Cañete et al., 2013; Moya et al., 2019) the concentration increase had to coincide with an atmospheric pressure decrease, and equivalently a concentration decrease coincided with a pressure increase. Atmospheric pressure was used here exclusively as a physical criterion for event detection, while the subsequent analysis focused on the role of boundary layer dynamics in modulating the events through different meteorological variables. Furthermore, the soil humidity has also been identified as an important factor for CO2 ventilation, so a θ15 cm below 0.07 m3 m−3 was required, ensuring that the soil humidity was sufficiently low (Moya et al., 2022), allowing airflow through soil pores. Additionally, high-turbulence conditions were imposed, with a daily average u∗ threshold of 0.2 m s−1 at surface level, as established for different sites across the world by Moya et al. (2022). For this study, the high-turbulence condition was applied also to the Doppler lidar turbulence indicator, and the maximum ϵ value during the event should exceed 10−4 m2 s−3 (O'Connor et al., 2010). The high-turbulence conditions were met easily, with daily average u∗ exceeding 0.2 m s−1 for every potential event, and maximum ϵ values exceeding 10−2 m2 s−3 for the selected events. Furthermore, the whole event had to last more than one day.
The beginning of each event was defined as the onset of a sustained (minimum 8 h) and rapid increase in tracer concentrations, exceeding 90 Bq m−3 h−1 for Rn (Rn50 cm or Rnbh) or 80 ppm h−1 for CO2 (CO), the latter being the most variable CO2 series and most sensitive to the concentration changes. The end of the event corresponded to the completion of a similarly sustained and rapid decrease in concentrations during the diluting phase. Sensitivity tests using minimum event durations between 6 and 12 h showed no significant impact on the statistical results. Therefore, given the use of 30 min averaged data and events lasting longer than one day, small uncertainties in the exact start and end times are not expected to significantly affect the correlation analyses. The inter-event periods were not included in the analysis, since they are dominated by slow, steady CO2 production driven by biogeochemical processes (recharge, Sánchez-Cañete et al., 2013) rather than by mechanical processes linked to atmospheric phenomena. In the end, a total of 10 events were identified, encompassing 661 intervals of 30 min resolution, entailing 7.6 % of the available database.
3.3 Statistical analysis
Following standardization of the series and identification of enriching and diluting ventilation periods, bivariate Spearman correlation coefficients, ρS, were computed to assess the strength and direction of monotonic relationships between the study variables (Y variables) and the potential drivers (X variables). The study variables included CO2 and Rn concentrations (CO, CO, CO, CO, CO, Rn50 cm and Rnbh), as well as CO2 flux (). CO and were included among the study variables to initially assess their relationship with the potential drivers, but later the analysis focused on the soil CO2 and Rn concentrations. The potential drivers were surface atmospheric pressure (Pair) and the surface friction velocity (u∗) from the flux tower, the Doppler lidar's wind shear and turbulent kinetic energy dissipation rate at different height ranges (sh195 m, sh495 m, sh1005 m, ϵ195 m, ϵ495 m and ϵ1005 m) and the ceilometer's ABLH and MLH estimations. Rn concentration and CO2 fluxes were also included among the X variables to confirm their known relationship with CO2 concentrations, but they were not considered as potential drivers.
Once the importance of potential drivers was confirmed using ρS, different statistical procedures were conducted to investigate their role as real drivers of the soil CO2 and Rn dynamics.
A partial correlation analysis was performed. The Spearman correlation coefficients between the potential drivers and the soil CO2 and Rn concentrations were calculated, but separately controlling for each potential driver to be constant for the calculation. The way the ρS varies highlights the importance of each potential driver over soil CO2 and Rn levels and among them. For example, let us take A as a potential driver which shows a strong Spearman correlation with CO2 and Rn levels. If the ρS for A are invariant when the rest of drivers are forced to be constant, this would indicate that A is a real driver whose effect over the concentrations is independent of the other drivers. Similarly, if the ρS of other drivers were to reduce to zero when A is held constant, this would suggest that A could rule the other drivers. Equivalently, if the ρS of the other drivers were not to change when A is forced to be constant, this would indicate that A is not a real driver, but it is rather ruled by other real drivers. This partial correlation analysis was conducted taking as potential drivers: Pair, u∗, ϵ195 m, ϵ495 m, ϵ1005 m, sh195 m, sh495 m, sh1005 m, ABLH and MLH.
To justify the use of bivariate Spearman correlations, a multicollinearity assessment was performed by calculating the Variance Inflation Factors (VIFs) of the potential drivers, yielding values below the common threshold of 5. This result suggests that multicollinearity was not significant and that the partial correlation results reliably reflect the independent effects of the drivers. Notably, significant collinearity was observed only between ϵ and sh at different altitudes, as expected, whereas their collinearity with the remaining variables remained below the threshold.
Finally, temporal shifts of each detrended potential driver series were performed and the ρS were recalculated. Since drivers experience changes before the variables they govern, if correlations with the concentration improve by shifting the driver series a given interval, this suggests which drivers actuate the underlying mechanisms. Thus, time series of a subset of potential drivers were shifted by a time lag between 180 min before and 180 min after the origin, in 30 min intervals. For these 12 shifted series the ρS with the soil CO2 and Rn concentrations were recalculated. If the ρS increases for a series shifted by any interval after the origin (delayed in time), this suggests that the driver changes precede the concentration changes, and possibly its changes were affecting the concentrations. On the other hand, if the ρS increases for a series shifted by any interval before the origin (earlier in time), then the potential driver is experiencing changes later than the concentrations, suggesting that this is not a primary driver of the concentration's changes.
4.1 Case study
Figure 1 displays an example of two consecutive ventilation events that occurred between 1 and 5 November 2023. The diluting ventilation period of a previous event is also visible on 30 October 2023.
Figure 1a shows the atmospheric and vadose-zone CO2 concentration series at different depths. Shaded red areas indicate enriching ventilation periods, while blue areas indicate diluting ventilation periods. Note that the transition periods (no shading in Fig. 1) between enriching (red shaded) and diluting (blue shaded) ventilation periods, typically lasting around 12 h, were excluded from the statistical analysis, to ensure consistent tendencies among variables, since each concentration may respond to atmospheric changes at slightly different times. It can be observed that the deeper the sensor, the higher the measured concentration, especially during the maximum values recorded, with averages values ± standard deviation of 430 ± 4 ppm, 950 ± 180 ppm, 1800 ± 450 ppm, 1840 ± 760 ppm and 1100 ± 550 ppm for CO, CO, CO, CO, CO, respectively.
Figure 1b exhibits how CO2 and Rn concentrations behaved similarly throughout the process, confirming the usefulness of soil Rn as a proxy for soil CO2 concentration under mechanically driven, non-biological influences. Unfortunately, the Rn sensor at 50 cm depth failed during this interval. During enriching ventilation periods, soil concentrations increased significantly, indicating that CO2 and Rn from deeper layers were being transported upward, coinciding with a marked drop in Pair. In contrast, during diluting ventilation periods, concentrations decreased significantly, coinciding with a significant Pair increase, suggesting that atmospheric air (low in CO2 and Rn) was infiltrating soil pores. On 5 November 2023, Pair began a steady increase, remaining high until 8 November. During this period, soil concentrations remained low and nearly constant, indicating that negligible recharge of CO2 or Rn was possible during this period.
The borehole behaved differently, facilitating mixing from 0 to 18 m depth, although the CO instruments were located closer to the surface. After the enriching phase, CO approximated CO, while after the dilution it approached CO or even CO, indicating high permeability in the borehole that allowed both deep CO2-rich air and atmospheric air to move freely. Rnbh dropped to near-zero (atmospheric level) during diluting ventilation events, confirming that atmospheric air with low Rn concentrations was easily entering the borehole. In fact, the average Rn over this period was 750 ± 750 Bq m−3, with a variance coefficient (ratio between the standard deviation and the mean value) of 100 %, indicating that the Rn level varies between maxima values after enrichment and near zero concentrations after dilution.
Figure 1c shows u∗ from the sonic anemometer and the Doppler-lidar-derived wind shear at different atmospheric height ranges. Their behavior resembled the concentration series, with both turbulence and wind shear increasing during periods of decreasing Pair, and decreasing when Pair rose. Both u∗ and sh in the whole column remained low throughout the high-pressure period at the end of the series. Finally, Fig. 1d presents the Doppler lidar's ϵ. Two distinct behaviors were observed. ϵ195 m appeared unrelated to the other variables, while ϵ495 m and ϵ1005 m were more clearly connected. Specially, ϵ495 m and ϵ1005 m exhibited significant increases (note the logarithmic scale on the vertical axis) during enriching ventilation periods, and significant decreases during diluting ventilation, similar to the trends observed in Fig. 1a, b and c. It is noteworthy that the timing of u∗, sh and ϵ maxima and minima generally coincided with those of the CO2 and Rn concentrations, reinforcing the fact that these variables were synchronized by specific atmospheric drivers.
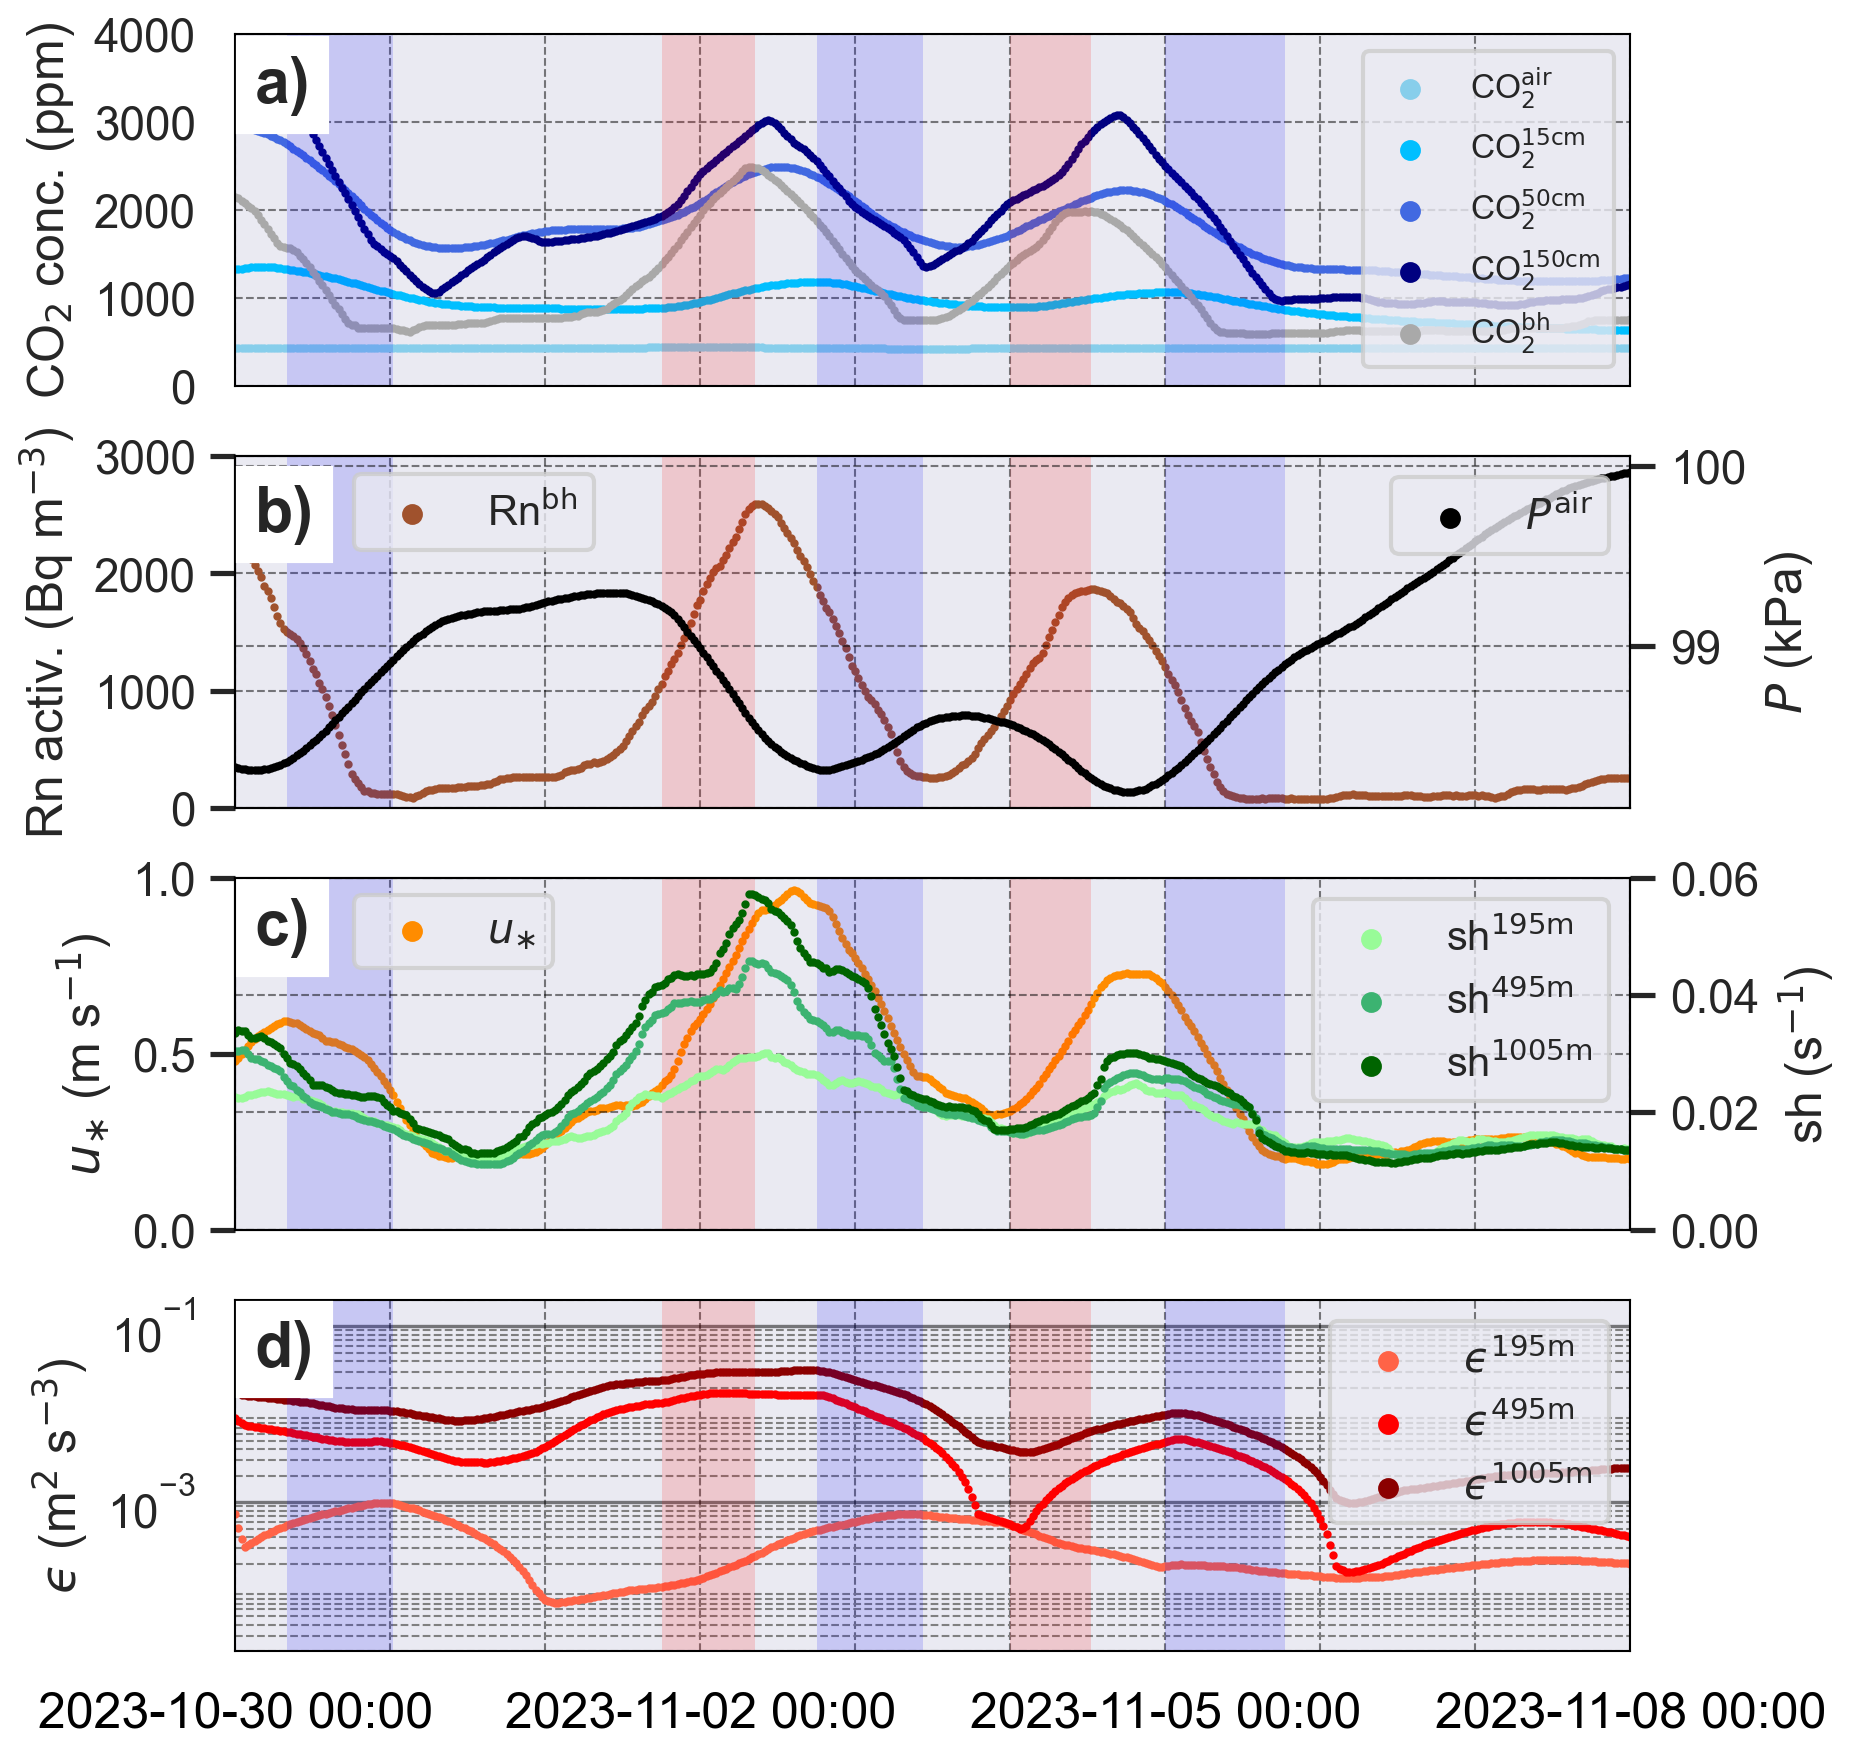
Figure 1Rolling-averaged temporal series of (a) CO2 concentration in the atmosphere (air), at different vadose-zone depths (15, 50 and 150 cm) and in the borehole (bh); (b) Rn concentration in the borehole (left axis) and atmospheric pressure (right axis); (c) surface friction velocity (left axis) and wind shear (right axis) at the selected atmospheric intervals; and (d) ϵ at the selected atmospheric height ranges. Blue and red shading indicate diluting and enriching ventilation periods, respectively.
4.2 Statistical analysis
This section gathers the calculation of the ρS for the different studied variables. A total of 10 events, encompassing 661 intervals of 30 min resolution, were detected and analyzed. Initially, all the variables mentioned in Sect. 2 were considered. However, some were omitted from the final analysis shown here to avoid repetition for the sake of readability. Temperature (Tair, T15 cm, T50 cm, T150 cm and Tbh), relative humidity (RHair, RH50 cm, and RHbh) and soil water content (θ15 cm, θ50 cm and θ150 cm) were correlated with the CO2 and Rn concentrations. While some of these correlations were statistically significant, they are not presented here, as none of these state variables could be considered dynamic drivers of the ventilation events; rather, they seem to vary as a consequence of ventilation or because of common external forcing. Additionally, P50 cm, and Pbh exhibited behavior similar to Pair and were also excluded from the correlation matrix figures.
Figure 2 displays the ρS matrix for the study variables (CO2 and Rn concentrations and CO2 flux) and the selected atmospheric variables, calculated with the selected 661 intervals of 30 min resolution. All ρS greater than 0.4 or less than −0.4 were statistically significant, with p-values below 0.05. Most ρS outside this range were also statistically significant. Figure 2a shows the ρS for the enriching ventilation periods, while Fig. 2b exhibits those for the diluting ventilation intervals. In both cases, soil CO2 and Rn concentrations showed a strong positive correlation, with an average ρS of 0.92 ± 0.04, confirming that these variables were closely linked. Since Rn is an inert species, this strong correlation confirmed that Rn is an ideal proxy for identifying soil CO2 ventilation events driven by atmospheric mechanisms (e.g., Kowalski et al., 2008; Sánchez-Cañete et al., 2011; Pla et al., 2023). In contrast, CO showed a lower but still significant correlation with soil CO2 and Rn concentrations (0.67 ± 0.20), suggesting that, although related, their drivers did not actuate equally. On the other hand, showed no correlation during enriching ventilation periods (−0.23 ± 0.11), but a significant negative correlation during diluting ventilation (−0.72 ± 0.04). This suggests that was not influenced by enriching mechanisms, while dilution of subterranean CO2 happens to the atmosphere, producing a significant emission of CO2 to the air (e.g., Sánchez-Cañete et al., 2011, 2013, 2016). As preconditioned, Pair showed a strong negative correlation in both periods (−0.94 ± 0.04); however, the importance of Pair as a potential driver is already known (e.g., Sánchez-Cañete et al., 2013; Moya et al., 2019). Additionally, u∗ correlated significantly and positively, especially during diluting ventilation (0.92 ± 0.03), supporting previous reports of its role in controlling CO2 and Rn dynamics in soils at nearby sites (e.g., Sánchez-Cañete et al., 2016). As observed in Fig. 1, Pair increases correspond to CO2 and Rn concentration and u∗ decreases, and vice versa.
Figure 2 also shows the ρS between sh and ϵ, and the soil CO2 and Rn concentrations. A consistent and significant positive correlation was observed for the wind shear and turbulence in the higher height ranges (0.85 ± 0.03, 0.87 ± 0.03, 0.84 ± 0.04, 0.83 ± 0.05, for sh495 m, sh1005 m, ϵ495 m and ϵ1005 m, respectively). However, low-altitude wind shear and turbulence (sh195 m, ϵ195 m) were only weakly correlated during enriching ventilation periods (0.64 ± 0.07 and 0.74 ± 0.06, respectively). sh195 m showed a significant positive correlation during diluting ventilation (0.83 ± 0.04), while ϵ195 m showed no correlation in that period (0.17 ± 0.15). Several considerations should be considered before interpreting these correlations. First, sh195 m and ϵ195 m were more affected by noise, due to the smaller vertical integration of the signal. Additionally, turbulence at these ranges was more sensitive to local heterogeneities and short-lived eddies, which may have different effects on the soil and atmosphere. In contrast, sh495 m, sh1005 m, ϵ495 m and ϵ1005 m represented averages over much deeper height ranges, typically covering the whole ABL in this location (Abril-Gago et al., 2025a), reducing noise and emphasizing large-scale eddies and synoptic-scale mechanisms. Therefore, boundary layer averaged wind shear and turbulence appeared to be better predictors of soil CO2 and Rn dynamics, versus the Doppler-derived turbulence at lower altitudes. As observed in Fig. 1, increases in CO2 and Rn concentrations were accompanied by increases in sh195 m, sh495 m, sh1005 m, ϵ495 m and ϵ1005 m. Although not shown here, a strong correlation was observed between u∗, sh and ϵ, only for the higher-altitude Doppler lidar ranges.
Finally, the relevance of ceilometer-derived ABLH and MLH was also explored. Negative correlations were found with CO2 and Rn concentrations, being the strongest for ABLH during diluting ventilation events (−0.77 ± 0.08). This indicates that a significant increase in ABLH coincided with periods of reduced CO2 and Rn levels.
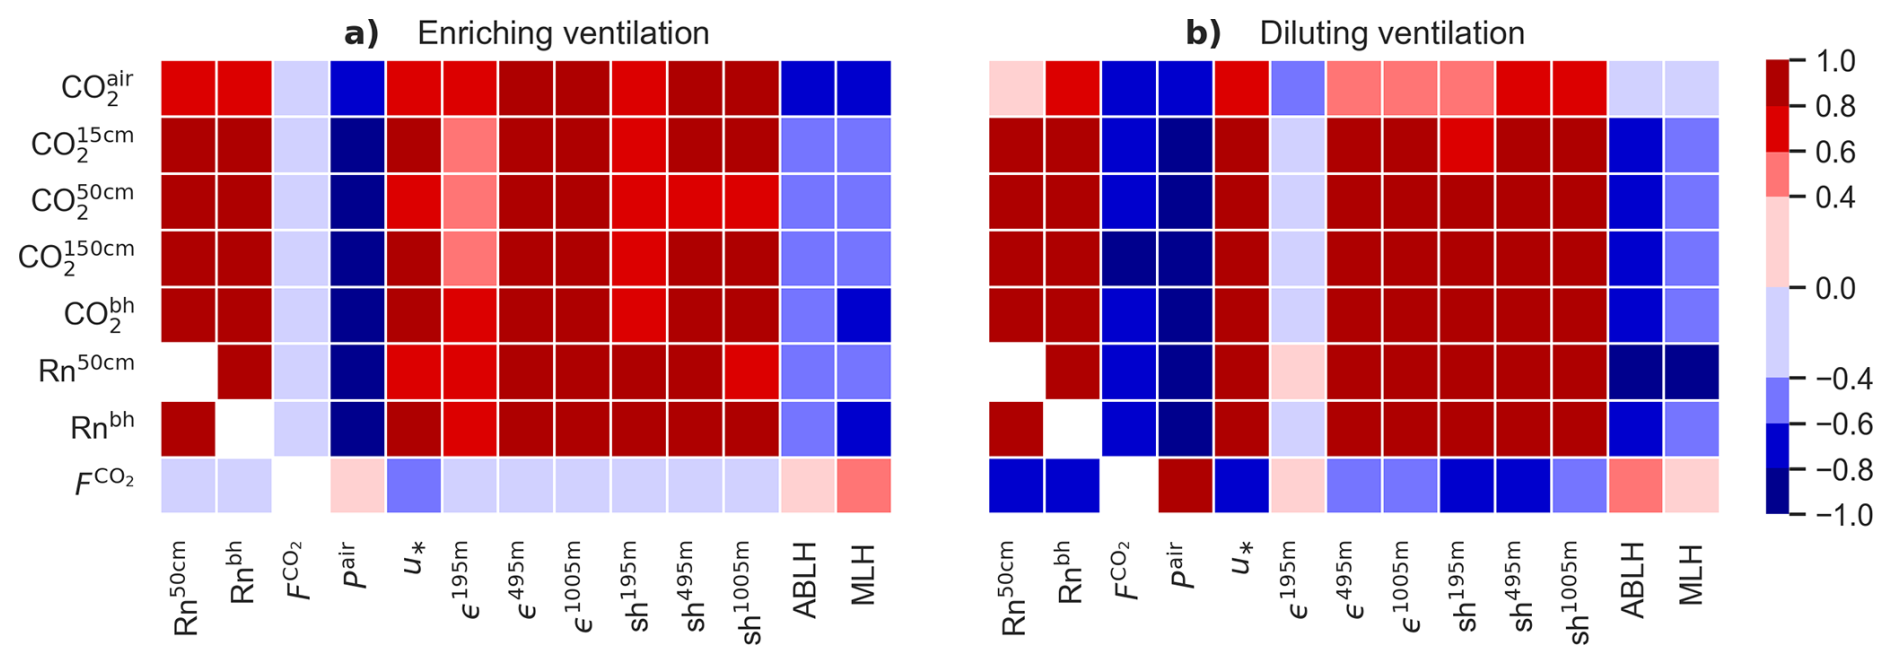
Figure 2ρS between CO2 and Rn concentrations and CO2 flux, and the selected atmospheric variables during (a) enriching and (b) diluting ventilation periods. Matching variable pairs have been indicated as blank cells.
Wind direction was not included in the correlation due to its circular nature. Nevertheless, it was consistently observed in every event, both enriching and diluting, that the wind blew from E or NE, indicating a preferred direction for their occurrence. This direction aligned with one of the two prevailing wind directions observed at the station (Abril-Gago et al., 2025a). Enriching ventilation periods began in the evening, between 18 and 00 UTC, and lasted until midday of the following day. Diluting ventilation periods started in the evening and continued until the afternoon of the next day. This pattern contrasts with observations at Llano de los Juanes (36.93° N, 2.75° W, 1600 m), located about 65 km west of Balsa Blanca, where nighttime ventilation is absent (Sánchez-Cañete et al., 2011), possibly due to site-specific differences in the dominant ventilation driver: Pair at Balsa Blanca versus u∗ at Llano de los Juanes. Ventilation periods also showed marked meteorological differences. Enriching periods were characterized by lower surface turbulence and ABLH, with an average ± standard deviation values of ± 0.13 m s−1 and ABLH = 490 ± 200 m. In contrast, diluting periods exhibited higher surface turbulence and ABLH, with ± 0.17 m s−1 and ABLH = 700 ± 470 m. Other meteorological variables did not show significant differences between these periods.
Enriching ventilation periods were also associated with reduced vertical particle transport in the atmosphere, with average ± 0.87 cm s−1, similar to days with low convective mixing (Abril-Gago et al., 2025a). Diluting ventilation periods corresponded to enhanced vertical particle transport, with ± 1.9 cm s−1, comparable to days characterized by strong turbulence, whether from convective or mechanical mixing. This value was higher than those reported by Abril-Gago et al. (2025a) in Tables 1 and 2 for this location (0.90 cm s−1 for the whole day and 1.56 cm s−1 for the daytime period), suggesting that vertical transport, and consequently convective or mechanical mixing, during the identified diluting ventilation periods was exceptionally intense, even during nighttime. These results further highlight the connection between soil CO2 and Rn dynamics and atmospheric particle exchanges, indicating that both were likely driven by similar atmospheric processes.
4.3 Driver analysis
Several atmospheric mechanisms have been proposed as potential drivers of soil CO2 and Rn concentrations. In this section, different statistical analyses were conducted to determine which of these variables function as real drivers, and which were merely correlated due to being influenced by common underlying processes. To that end, partial correlation coefficients were recomputed to evaluate how the ρS changed when a specific variable (i.e., potential driver) is held constant.
Figure 3 gathers the average ρS of the potential drivers with the soil CO2 and Rn concentrations, when each potential driver was independently held constant. A group of potential drivers was easily discarded, namely ϵ195 m, sh195 m, ABLH and MLH, as holding them constant did not meaningfully affect the ρS of the remaining variables. This suggested that these were not real drivers of the soil CO2 and Rn dynamics and they were consequently omitted from Fig. 3. The same applies to u∗, but only during enriching ventilation periods. During dilution ventilation events, average ρS were slightly reduced (in absolute terms) when ϵ495 m, ϵ1005 m, sh495 m and sh1005 m were individually held constant, implying that while these variables may influence the dynamics, they were unlikely to be the main drivers.
Among all potential drivers, Pair emerged as the most significant driver for both enriching and diluting ventilation periods. When held constant, it caused a notable decrease in the ρS of the other variables (0.20 ± 0.14), indicating its fundamental role as a determinant of ventilation. Moreover, its ρS changed the least when other variables were controlled (−0.75 ± 0.08), suggesting a strong independence. u∗ also played a significant role during diluting ventilation periods, while ϵ495 m, ϵ1005 m, sh495 m and sh1005 m appeared to be more relevant as an enriching ventilation mechanism, with ϵ495 m and ϵ1005 m showing the most consistent influence. The results were almost identical when calculating the average ρS separately for the correlations between the potential drivers and the soil CO2 at different depths, and for those between the potential drivers and soil Rn concentrations at different depths.
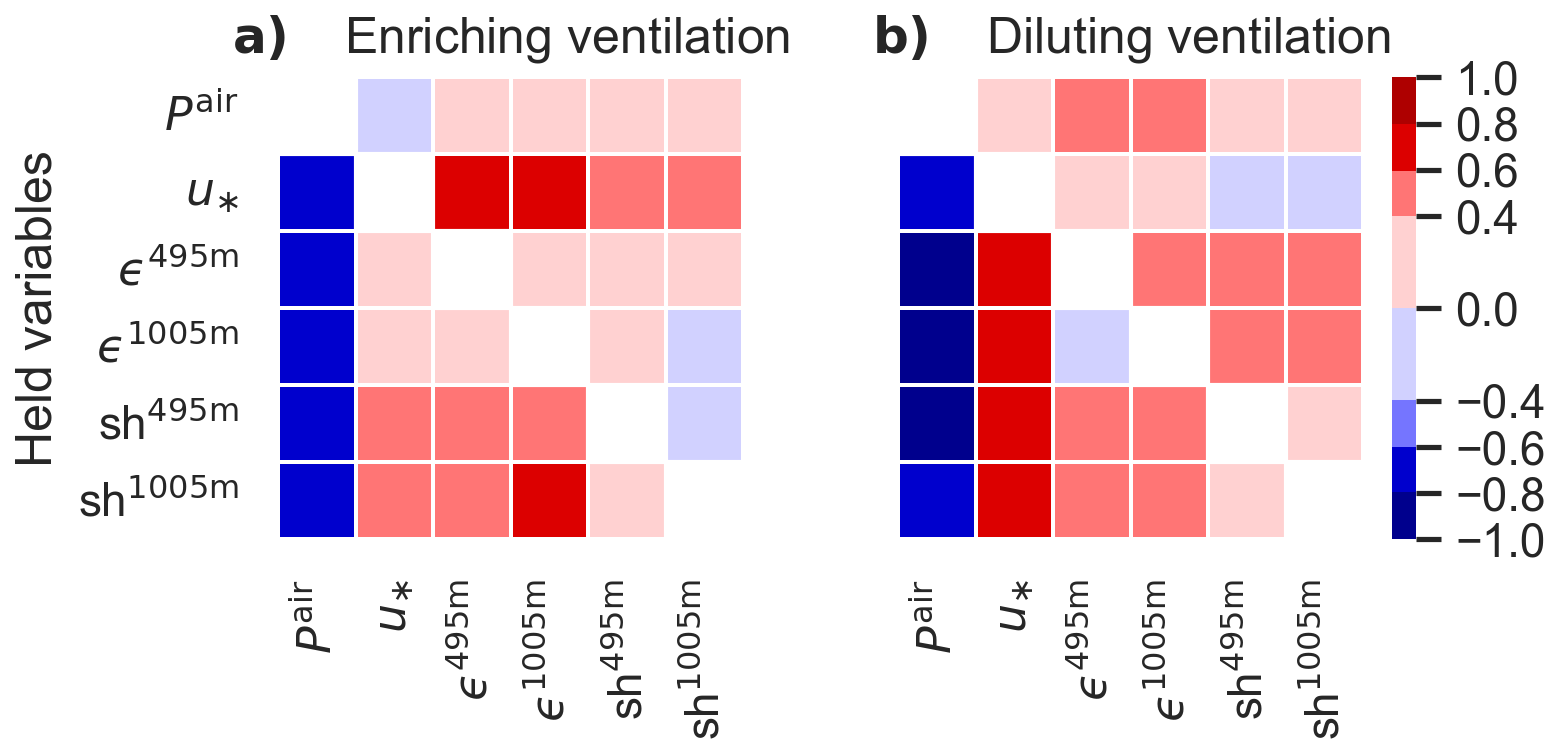
Figure 3Average ρS between the potential drivers (X axis) and the soil CO2 and Rn concentrations at different depths when a specific potential driver is held constant (Y axis), during (a) enriching and (b) diluting ventilation periods. Matching variable pairs have been indicated as blank cells.
The assessment of multicollinearity among the potential drivers was conducted, and the VIFs were all below the threshold of 5 (ranging from 1.9 to 4.2), indicating that each variable exhibited an acceptable level of independence. This suggests that the relationships identified between the drivers and the soil concentrations were not artificially influenced by redundant collinearity, and that the previous bivariate partial correlation results were reliable. As expected, ϵ495 m, ϵ1005 m, sh495 m and sh1005 m displayed a high degree of collinearity among themselves. This behavior is anticipated, as both ϵ and sh are derived from the same Doppler lidar signal, and measurements extending to higher altitudes also encapsulate information from lower height ranges.
A temporal shift of the series Pair, u∗, ϵ495 m, ϵ1005 m, sh495 m and sh1005 m was performed, and the ρS were recalculated to identify the primary driver of the soil CO2 and Rn concentrations.
For the periods and potential drivers considered in this study, the shifted correlations revealed that Pair maximized its ρS (increasing slightly by 2.2 %) during enriching ventilation intervals when shifted 30 min earlier, indicating that changes in Pair occurred after changes in CO2 and Rn concentrations. Conversely, during diluting ventilation events, the maximum ρS were observed with no temporal shift, suggesting that Pair changes occurred simultaneously with soil concentration changes. The opposite pattern was observed for u∗, with ρS maximizing (increasing slightly by 2.1 %) when shifted 30 min earlier for diluting ventilation events and maximizing during enriching ventilation periods with the unshifted series.
ϵ1005 m, sh495 m and sh1005 m reached their maximum ρS with the original series during diluting ventilation, while ϵ495 m maximized ρS (increasing significantly by 3.9 %) when the series was shifted 30 min later, indicating that changes in ϵ495 m occurred before dilution and suggesting its importance as primary driver. During enriching ventilation periods, ϵ495 m, ϵ1005 m, sh495 m and sh1005 m showed maximum ρS (increasing by 1.2 %, 0.6 %, 1.9 % and 1.6 %, respectively) when shifted 30, 30, 60 and 30 min later, respectively, suggesting their roles as primary drivers.
4.4 Phenomenological description
To summarize the previous findings, the following conceptual model of the ventilation phenomenon is proposed.
At the start of an enriching ventilation period (Fig. 4a), boundary layer ϵ and sh start to increase anomalously (in the afternoon, even after daytime convection has ceased). Shortly thereafter, soil CO2 and Rn concentrations begin to increase, accompanied by a drop in surface pressure and a rise in surface friction velocity. This state persists until noon of the following day, coinciding with a shallow ABLH. The combination of a poorly developed boundary layer, and elevated turbulence and wind shear suggests a situation of limited convection but enhanced mechanical mixing within the boundary layer. Consistently, CO2 fluxes remain relatively low during this phase (0.05 ± 0.11 µmol m−2 s−1), approximately half of those observed under non-ventilation conditions, supporting the interpretation that CO2 is being temporarily stored within the soil.
Then, in the afternoon, boundary-layer ϵ and sh begin to decrease notably (Fig. 4b), followed by a similar decrease in surface friction velocity and a rise in surface pressure, coinciding with the dilution of soil CO2 and Rn. This period extends into the next afternoon and coincides with a higher ABLH and enhanced vertical particle transport within the boundary layer. The increase in surface pressure suggests the pumping of atmospheric air poor in CO2 and Rn into the soil pores, compressing air within the soil and displacing CO2-rich soil air to the atmosphere producing a significant CO2 flux (0.30 ± 0.13 µmol m−2 s−1) up to three times that observed under non-ventilation conditions.
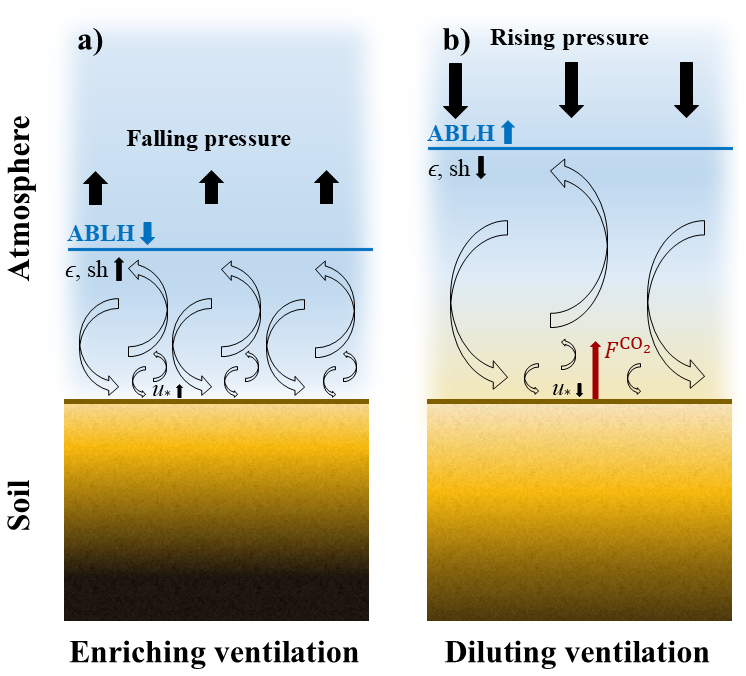
Figure 4Graphical depiction of the ventilation model proposed, considering the (a) enriching and (b) diluting ventilation phases. The color gradient from black to gold indicates the transition from high to low CO2 and Rn concentrations. Blue represents atmospheric concentration.
The present study advances our understanding of the CO2 cycle in semiarid ecosystems, improving the characterization of CO2 and Rn dynamics within the upper soil layers at a Mediterranean shrubland with carbonate soils, clarifying how their subsurface storage and release are governed by atmospheric processes. This work presents the first assessment of the role of above-surface atmospheric turbulence, across multiple atmospheric ranges, via remote sensing techniques, in driving subsurface CO2 and Rn ventilation. Over the SCARCE campaign, 10 ventilation events of subsurface CO2 and Rn, driven exclusively by abiotic mechanisms, were identified.
A set of meteorological variables were identified as potential drivers of subsurface ventilation, namely atmospheric pressure (Pair) and friction velocity (u∗) at surface level, along with turbulent kinetic energy dissipation rate (ϵ) and wind shear (sh) within the boundary layer (ϵ495 m, ϵ1005 m, sh495 m and sh1005 m). The Spearman correlation coefficients (ρS) revealed significantly strong correlations between these variables and soil CO2 and Rn concentrations at different depths, being negative for Pair and positive for the others, with slight differences between the absolute values of their ρS. Lower-height ϵ and sh (ϵ195 m, sh195 m), and also the atmospheric boundary layer height (ABLH) and mixing layer height (MLH) were discarded due to their weaker ρS.
Partial Spearman correlations confirmed that Pair was the most influential and independent factor during both enriching and diluting ventilation periods at the location. u∗ was also significantly relevant during diluting ventilation, and ϵ495 m, ϵ1005 m, sh495 m and sh1005 m were notably influential during enriching ventilation periods, particularly ϵ1005 m. This confirmed that these atmospheric parameters are actual drivers of air movement within the soil, thereby altering soil gas concentrations.
The temporal shifting analysis further supported these relationships. During diluting ventilation, most drivers maximized their ρS without temporal offset, except for ϵ495 m, whose variations preceded those of the soil concentrations, identifying it as a primary driver. In contrast, during enriching ventilation, ϵ495 m, ϵ1005 m, sh495 m and sh1005 m reached their maximum ρS when shifted forwards in time, suggesting that ϵ and sh function as primary drivers during these intervals, whereas changes in Pair were observed after those of concentration.
Turbulent fluxes show that the ecosystem is a net source of CO2. During enriching ventilation, CO2 emissions drop to about half the background non-ventilation fluxes, suggesting temporary underground storage of CO2. In contrast, diluting ventilation emissions increase by three times the background non-ventilation fluxes, suggesting the release to the atmosphere of stored CO2. These results emphasize the role of the soil ventilation as a transient mechanism, modulating CO2 emissions in semiarid ecosystems.
Overall, these findings enhance our understanding of the physical processes controlling soil-atmosphere gas exchanges in semiarid environments. In addition, this study reveals the potential of Doppler lidar observations, typically used for atmospheric characterization, for investigating complex soil–atmosphere interactions. Accounting for the impact of soil ventilation processes can therefore improve the representation of these exchanges in carbon cycle models, particularly in ecosystems where underground storage and release of CO2 occur under specific atmospheric conditions, reducing uncertainties in climate change projections.
The Doppler lidar and ceilometer data used in this study is available in the following Zenodo repository: https://doi.org/10.5281/zenodo.11085247 (Abril-Gago et al., 2024). Data from the meteorological and vadose-zone instrumentation is available at: https://doi.org/10.5281/zenodo.15881541 (Abril-Gago et al., 2025b). Readers may contact Jesús Abril-Gago (jabrilgago@ugr.es) and Juan Luis Guerrero-Rascado (rascado@ugr.es) before using the datasets.
JAG, IT, ASK, EPSC, JLGR carried out the conceptualization, methodology and formal analysis, while JAG, EEM, JAM, POA, GCC carried out the data curation. JAG wrote the original draft, while JAG, IT, EEM, JAM, POA, GCC, PSO, FD, LAA, ASK, EPSC, JLGR participated in the reviewing and editing.
The contact author has declared that none of the authors has any competing interests.
Publisher's note: Copernicus Publications remains neutral with regard to jurisdictional claims made in the text, published maps, institutional affiliations, or any other geographical representation in this paper. The authors bear the ultimate responsibility for providing appropriate place names. Views expressed in the text are those of the authors and do not necessarily reflect the views of the publisher.
The authors acknowledge the Horizon Europe program under the Marie Sklodowska-Curie Staff Exchange Actions with the project AERIS (grant agreement No 101236396), the Horizon 2020 – Research and Innovation Framework Programme IRISCC (HORIZON-INFRA-2023-SERV-01-01_RIA, Grant Agreement number 101131261) and the strategic network ACTRIS-España (RED2024-153821-E), by Junta de Andalucía through project MORADO (C-366-UGR23), and by University of Granada Plan Propio programs Visiting Scholars (PPVS2024-06), Excellence Research Unit Earth Science and Singular Laboratory AGORA (LS2022-1) and Project for Early-Career Researchers EMITE-EC (PPJIB-2024-12). Jesús Abril-Gago thanks the grants FPU21/01436 and EST24/00285 funded by MICIU/AEI/10.13039/501100011033. Juan Luis Guerrero-Rascado thanks the Spanish Ministry support under grant PRX23/00154.
This work was supported by the project NATURAL (grant no. PID2024-158786NB-C21) funded by MICIU/AEI/10.13039/501100011033 and by ERDF, EU.
This paper was edited by Bertrand Guenet and reviewed by two anonymous referees.
Abril-Gago, J., Ortiz-Amezcua, P., Bermejo-Pantaleón, D., Andújar-Maqueda, J., Bravo-Aranda, J. A., Granados-Muñoz, M. J., Navas-Guzmán, F., Alados-Arboledas, L., Foyo-Moreno, I., and Guerrero-Rascado, J. L.: Validation activities of Aeolus wind products on the southeastern Iberian Peninsula, Atmos. Chem. Phys., 23, 8453–8471, https://doi.org/10.5194/acp-23-8453-2023, 2023.
Abril-Gago, J., Andújar-Maqueda, J., Ortiz-Amezcua, P., and Guerrero-Rascado, J.L.: SCARCE Campaign – Remote Sensing Datasets, Zenodo [data set], https://doi.org/10.5281/zenodo.11085247, 2024
Abril-Gago, J., Ortiz-Amezcua, P., Kowalski, A. S., Bravo-Aranda, J. A., Granados-Muñoz, M. J., Andújar-Maqueda, J., Alados-Arboledas, L., and Guerrero-Rascado, J. L.: Quantifying turbulent coarse particle transport over drylands of Southeastern Iberia using a stand-alone Doppler lidar methodology, Atmos. Res., 325, 108236, https://doi.org/10.1016/j.atmosres.2025.108236, 2025a.
Abril-Gago, J., Echeverría-Martín, E., Cabrera-Carrillo, G., Serrano-Ortiz, P., Sánchez-Cañete, E. P., and Guerrero-Rascado, J. L.: SCARCE campaign – atmospheric and soil datasets, Zenodo [data set], https://doi.org/10.5281/zenodo.15881541, 2025b.
Ahlström, A., Raupach, M. R., Schurgers, G., Smith, B., Arneth, A., Jung, M., Reichstein, M., Canadell, J. G., Friedlingstein, P., Jain, A. K., Kato, E., Poulter, B., Sitch, S., Stocker, B. D., Viovy, N., Wang, Y. P., Wiltshire, A., Zaehle, S., and Zeng, N.: The dominant role of semi-arid ecosystems in the trend and variability of the land CO2 sink, Science, 348, 895–899, https://doi.org/10.1126/science.aaa1668, 2015.
Andújar-Maqueda, J., Ortiz-Amezcua, P. Cariñanos, P., Abril-Gago, J., De Linares, C., de Arruda Moreira, G., Bravo-Aranda, J. A., Granados-Muñoz, M. J., Alados-Arboledas, L., and Guerrero-Rascado, J. L.: The Role of Atmospheric Boundary Layer Wind and Turbulence on Surface Pollen Levels, Agr. Forest Meteorol., 371, 110584, https://doi.org/10.1016/j.agrformet.2025.110584, 2025.
Baldocchi, D.: Measuring fluxes of trace gases and energy between ecosystems and the atmosphere – The state and future of the eddy covariance method, Glob. Change Biol., 20, 3600–3609, https://doi.org/10.1111/gcb.12649, 2014.
Brantley, S. L., Kubicki, J. D., and White, A. F.: Kinetics of Water–Rock Interaction, Springer, New York, 833 pp., https://doi.org/10.1007/978-0-387-73563-4, 2008.
Cazorla, A., Casquero-Vera, J. A., Román, R., Guerrero-Rascado, J. L., Toledano, C., Cachorro, V. E., Orza, J. A. G., Cancillo, M. L., Serrano, A., Titos, G., Pandolfi, M., Alastuey, A., Hanrieder, N., and Alados-Arboledas, L.: Near-real-time processing of a ceilometer network assisted with sun-photometer data: monitoring a dust outbreak over the Iberian Peninsula, Atmos. Chem. Phys., 17, 11861–11876, https://doi.org/10.5194/acp-17-11861-2017, 2017.
El-Kenawy, E.-S. M., Zerouali, B., Bailek, N., Bouchouich, K., Hassan, M. A. Almorox, J., Kuriqi, A., Eid, M., and Ibrahim, A.: Improved weighted ensemble learning for predicting the daily reference evapotranspiration under the semi-arid climate conditions, Environ. Sci. Pollut. Res., 29, 81279–81299, https://doi.org/10.1007/s11356-022-21410-8, 2022.
Faimon, J., Lang, M., Geršl, M., Sracek, O., and Bábek, O.: The “breathing spots” in karst areas – The sites of advective exchange of gases between soils and adjacent underground cavities, Theor. Appl. Climatol., 142, 85–101, https://doi.org/10.1007/s00704-020-03280-7, 2020.
Gibert, F., Koch, G. J., Beyon, J. Y., Hilton, T. W., Davis, K. J., Andrews, A., Flamant, P. H., and Singh, U. N.: Can CO2 Turbulent Flux Be Measured by Lidar? A Preliminary Study, J. Atmos. Oceanic Technol., 28, 365–377, https://doi.org/10.1175/2010JTECHA1446.1, 2011.
IPCC: Climate Change 2021: The Physical Science Basis. Contribution of Working Group I to the Sixth Assessment Report of the Intergovernmental Panel on Climate Change, edited by: Masson-Delmotte, V., Zhai, P., Pirani, A., Connors, S. L., Péan, C., Berger, S., Caud, N., Chen, Y., Goldfarb, L., Gomis, M. I., Huang, M., Leitzell, K., Lonnoy, E., Matthews, J. B. R., Maycock, T. K., Waterfield, T., Yelekçi, O., Yu, R., and Zhou, B., Cambridge University Press, Cambridge, United Kingdom and New York, NY, USA, 2391 pp., https://doi.org/10.1017/9781009157896, 2021.
Jones, E. P. and Smith, S. D.: A first measurement of sea-air CO2 flux by eddy correlation, J. Geophys. Res., 82, 5990–5992, https://doi.org/10.1029/JC082i037p05990, 1977.
Kotthaus, S., Haeffelin, M., Drouin, M.-A., Dupont, J.-C., Grimmond, S., Haefele, A., Hervo, M., Poltera, Y., and Wiegner, M.: Tailored Algorithms for the Detection of the Atmospheric Boundary Layer Height from Common Automatic Lidars and Ceilometers (ALC), Remote Sens., 12, 3259, https://doi.org/10.3390/rs12193259, 2020.
Kotthaus, S., Bravo-Aranda, J. A., Collaud Coen, M., Guerrero-Rascado, J. L., Costa, M. J., Cimini, D., O'Connor, E. J., Hervo, M., Alados-Arboledas, L., Jiménez-Portaz, M., Mona, L., Ruffieux, D., Illingworth, A., and Haeffelin, M.: Atmospheric boundary layer height from ground-based remote sensing: a review of capabilities and limitations, Atmos. Meas. Tech., 16, 433–479, https://doi.org/10.5194/amt-16-433-2023, 2023.
Kowalski, A. S., Serrano-Ortiz, P., Janssens, I. A., Sanchez-Moral, S., Cuezva, S., Domingo, F., Were, A., and Alados-Arboledas, L.: Can flux tower research neglect geochemical CO2 exchange?, Agr. Forest Meteorol., 148, 1045–1054, https://doi.org/10.1016/j.agrformet.2008.02.004, 2008.
Liu, Z. and Zhao, J.: Contribution of carbonate rock weathering to the atmospheric CO2 sink, Environ. Geol., 39, 1053–1058, https://doi.org/10.1007/s002549900072, 2000.
López-Ballesteros, A.,. Serrano-Ortiz, P., Sánchez-Cañete, E. P., Oyonarte, C., Kowalski, A. S., Pérez-Priego, Ó., and Domingo, F.: Enhancement of the net CO2 release of a semiarid grassland in SE Spain by rain pulses, J. Geophys. Res.-Biogeo., 121, 52–66, https://doi.org/10.1002/2015JG003091, 2016.
López-Ballesteros, A., Serrano-Ortiz, P., Kowalski, A. S., Sánchez-Canete, E. P., Scott, R. L., and Domingo, F.: Subterranean ventilation of allochthonous CO2 governs net CO2 exchange in a semiarid Mediterranean grassland, Agr. Forest Meteorol., 234, 115–126, https://doi.org/10.1016/j.agrformet.2016.12.021, 2017.
López-Ballesteros, A., Oyonarte, C., Kowalski, A. S., Serrano-Ortiz, P., Sánchez-Cañete, E. P., Moya, M. R., and Domingo, F.: Can land degradation drive differences in the C exchange of two similar semiarid ecosystems?, Biogeosciences, 15, 263–278, https://doi.org/10.5194/bg-15-263-2018, 2018.
Manninen, A. J.: Halo Lidar Toolbox, Github, https://github.com/manninenaj/HALO_lidar_toolbox (last access: 1 April 2026), 2019.
Manninen, A. J., Marke, T., Tuononen, M. J., and O'Connor, E. J.: Atmospheric boundary layer classification with Doppler lidar, J. Geophys. Res-Atmos., 123, 8172–8189, https://doi.org/10.1029/2017JD028169, 2018.
Mauder, M. and Foken T.: Impact of post-?eld data processing on eddy covariance ?ux estimates and energy balance closure, Meteorol. Z., 15, 597–609, 2006.
Moed, B. A., Nazaroff, W. W., and Sextro, R. G.: Soil as a source of indoor radon: generation, migration and entry, radon and its decay products in indoor air, in: Radon and its decay products in indoor air, edited by: Nazaroff, W. and Nero, A., Wiley, New York, 57–112, ISBN: 0-471-62810-7, 1988.
Moya, M. R., Sánchez-Cañete, E. P., Vargas, R., López-Ballesteros, A., Oyonarte, C., Kowalski, A. S., Serrano-Ortiz, P., and Domingo, F.: CO2 dynamics are strongly influenced by low frequency atmospheric pressure changes in semiarid grasslands, J. Geophys. Res. Geophys.-Biogeo., 124, 902–917, https://doi.org/10.1029/2018JG004961, 2019.
Moya, M. R., López-Ballesteros, A., Sánchez-Cañete, E. P., Serrano-Ortiz, P., Oyonarte, C., Domingo, F., and Kowalski, A. S.: Ecosystem CO2 release driven by wind occurs in drylands at global scale, Glob. Change Biol., 28, 5320–5333, https://doi.org/10.1111/gcb.16277, 2022.
O'Connor, E. J., Illingworth, A. J., Brooks, I. M., Westbrook, C. D., Hogan, R. J., Davies, F. and Brooks, B. J.: A Method for Estimating the Turbulent Kinetic Energy Dissipation Rate from a Vertically Pointing Doppler Lidar, and Independent Evaluation from Balloon-Borne In Situ Measurements, J. Atmos. Ocean.Technol., 27, 1652–1664, https://doi.org/10.1175/2010JTECHA1455.1, 2010.
Ortiz-Amezcua, P., Martínez-Herrera, A., Manninen, A. J., Pentikäinen, P. P., O'Connor, E. J., Guerrero-Rascado, J. L., and Alados-Arboledas, L.: Wind and Turbulence Statistics in the Urban Boundary Layer over a Mountain–Valley System in Granada, Spain, Remote Sens., 14, 2321, https://doi.org/10.3390/rs14102321, 2022a.
Ortiz-Amezcua, P., Andújar-Maqueda, J., Manninen, A. J., Pentikäinen, P., O'Connor, E. J., Stachlewska, I. S., de Arruda Moreira, G., Benavent-Oltra, J. A., Casquero-Vera, J. A., Poczta, P., Wang, D., Harenda, K. M., Chojnicki, B. H., Szczepanik, D. M., Janicka, Ł., Schüttemeyer, D., Alados-Arboledas, L., and Guerrero-Rascado, J. L.: Dynamics of the Atmospheric Boundary Layer over two middle-latitude rural sites with Doppler lidar, Atmos. Res., 280, 106434, https://doi.org/10.1016/j.atmosres.2022.106434, 2022b.
Pastorello, G., Trotta, C., Canfora, E., et al.: The FLUXNET2015 dataset and the ONEFlux processing pipeline for eddy covariance data, Scientific Data, 7, 225, https://doi.org/10.1038/s41597-020-0534-3, 2020.
Pentikäinen, P., O'Connor, E. J., Manninen, A. J., and Ortiz-Amezcua, P.: Methodology for deriving the telescope focus function and its uncertainty for a heterodyne pulsed Doppler lidar, Atmos. Meas. Tech., 13, 2849–2863, https://doi.org/10.5194/amt-13-2849-2020, 2020.
Piao, S., Huang, M., Liu, Z., Wang, X., Ciais, P., Canadell, J. G., Wang, K., Bastos, A., Friedlingstein, P., Houghton, R. A., Le Quéré, C., Liu, Y., Myneni, R. B., Peng, S., Pongratz, J., Sitch, S., Yan, T., Wang, Y., Zhu, Z., Wu, D., and Wang, T.: Lower land-use emissions responsible for increased net land carbon sink during the slow warming period, Nat. Geosci., 11, 739–743, https://doi.org/10.1038/s41561-018-0204-7, 2018.
Pla, C., Ruiz, M. C., Gil-Oncina, S., García-Martínez, N., Cañaveras, J. C., Cuezva, S., Fernández-Cortés, A., Sánchez-Moral, S., and Benavente, D.: 222Rn and CO2 monitoring in soil and indoor atmosphere to understand changes in the gaseous dynamics of Rull cave (Spain), Environ. Earth Sci., 82, 235, https://doi.org/10.1007/s12665-023-10885-4, 2023.
Rey, A., Pegoraro, E., Oyonarte, C., Were, A., Escribano, P., and Raimundo, J.: Impact of land degradation on soil respiration in a steppe (Stipa tenacissima L.) semi-arid ecosystem in the SE of Spain, Soil Biol. Biochem., 43, 393–403, https://doi.org/10.1016/j.soilbio.2010.11.007, 2011.
Rey, A., Oyonarte, C., Morán-López, T., Raimundo, J., and Pegoraro, E: Changes in soil moisture predict soil carbon losses upon rewetting in a perennial semiarid steppe in SE Spain, Geoderma, 287, 135–146, https://doi.org/10.1016/j.geoderma.2016.06.025, 2017.
Sanchez-Cañete, E. P., Serrano-Ortiz, P., Kowalski, A. S., Oyonarte, C., and Domingo, F.: Subterranean CO2 ventilation and its role in the net ecosystem carbon balance of a karstic shrubland, Geophys. Res. Lett., 38, L09802, https://doi.org/10.1029/2011GL047077, 2011.
Sánchez-Cañete, E. P., Kowalski, A. S., Serrano-Ortiz, P., Pérez-Priego, Ó., and Domingo, F.: Deep CO2 soil inhalation/exhalation induced by synoptic pressure changes and atmospheric tides in a carbonated semiarid steppe, Biogeosciences, 10, 6591–6600, https://doi.org/10.5194/bg-10-6591-2013, 2013.
Sánchez-Cañete, E. P., Oyonarte, C., Serrano-Ortiz, P., Curiel Yuste, J., Pérez-Priego, Ó., Domingo, F., and Kowalski, A. S.: Winds induce CO2 exchange with the atmosphere and vadose zone transport in a karstic ecosystem, J. Geophys. Res.-Biogeo., 121, 2049–2063, https://doi.org/10.1002/2016JG003500, 2016.
Schimel, D. S.: Terrestrial ecosystems and the carbon cycle, Glob. Change Biol., 1, 77–91, https://doi.org/10.1111/j.1365-2486.1995.tb00008.x, 1995.
Serrano-Ortiz, P., Roland, M., Sanchez-Moral, S., Janssens, I. A., Domingo, F., Godderis, Y., and Kowalski, A. S.: Hidden, abiotic CO2 flows and gaseous reservoirs in the terrestrial carbon cycle: Review and perspectives, Agr. Forest Meteorol., 150, 321–329, https://doi.org/10.1016/j.agrformet.2010.01.002, 2010.
Serrano-Ortiz, P., Oyonarte, C., Pérez-Priego, O., Reverter, B. R., Sánchez-Cañete, E. P., Were, A., Uclés, O., Morillas, L., and Domingo, F.: Ecological functioning in grass–shrub Mediterranean ecosystems measured by eddy covariance, Oecologia, 175, 1005–1017, https://doi.org/10.1007/s00442-014-2948-0, 2014.
Spötl, C., Fairchild, I. J., and Tooth, A. F.: Cave air control on dripwater geochemistry, Obir Caves (Austria): Implications for speleothem deposition in dynamically ventilated caves, Geochim. Cosmochim. Ac., 69, 2451–2468, https://doi.org/10.1016/j.gca.2004.12.009, 2005.
Stull, R. B.: An introduction to boundary layer meteorology, Springer, https://doi.org/10.1007/978-94-009-3027-8, 1988.
Vargas, R., Sánchez-Cañete, E.P., Serrano-Ortiz, P., Curiel Yuste, J., Domingo, F., López-Ballesteros, A., and Oyonarte, C.: Hot-moments of CO2 eflux in a water-limited grassland, Soil Syst., 2, 47, https://doi.org/10.3390/soilsystems2030047, 2018
Villarreal, S., Guevara, M., Alcaraz-Segura, D., Brunsell, N. A., Hayes, D., Loescher, H. W., and Vargas, R.: Ecosystem functional diversity and the representativeness of environmental networks across the conterminous United States, Agr. Forest Meteorol., 262, 423–433, https://doi.org/10.1016/j.agrformet.2018.07.016, 2018.
WMO (World Meteorological Organization): WMO Greenhouse Gas Bulletin No. 20 – 28 October 2024, World Meteorological Organization, Geneva, Switzerland, https://library.wmo.int/idurl/4/69057 (last access: 10 April 2026), 2024.
Zhuo, W., Iida, T., and Furukawa, M.: Modeling Radon Flux Density from the Earth's Surface, J. Nucl. Sci. Technol., 43, 479–482, https://doi.org/10.1080/18811248.2006.9711127, 2006.