the Creative Commons Attribution 4.0 License.
the Creative Commons Attribution 4.0 License.
 | 08 May 2026
Linking surface coverage with surfactant activity to refine the role of surfactants for air-sea gas exchange
Falko Asmussen-Schäfer
Mariana Ribas-Ribas
Oliver Wurl
Gernot Friedrichs
The sea surface microlayer (SML) is enriched with organic matter. Surface-active molecules (surfactants) assemble right at the air-water interface to form a molecular layer of nanometer thickness that lowers the surface tension. At elevated surface concentrations of surfactants and substantial surface coverage, the nanolayer suppresses the formation of capillary waves and effectively decreases turbulent air-sea gas exchange mechanisms. This study provides a physico-chemical framework to evaluate the SML surfactant surface coverage. A non-linear surface sensitive laser spectroscopic method, vibrational sum-frequency generation spectroscopy (VSFG), has been employed in combination with tensiometric measurements and AC voltammetry to investigate the formation of organic molecular films. Integral VSFG signal intensity in the spectral range of C−H stretch vibrations has been used to operationally define a surfactant surface coverage parameter, sc, where two model surfactants have been investigated as laboratory reference compounds, namely the phospholipid DPPC (1,2-dipalmitoylphosphatidylcholine) as a monolayer-forming insoluble (dry) surfactant and Triton-X 100 (TX-100) as a soluble (wet) surfactant in bulk-interface adsorption equilibrium. A comparison with natural SML samples from (i) the SURF mesocosm campaign (Wilhelmshaven, Germany, May/June 2023), which investigated the formation of the SML during a phytoplankton bloom in North Sea water, and (ii) a cruise near Helgoland (Germany, North Sea, July/August 2024) targeting the differences of SML characteristics in slick- and non-slick covered areas yielded a consistent picture with regard to the quantification of surfactant surface coverage. A 100 % surface coverage resulting from the complex mixture of biosurfactants in natural SML samples is comparable to DPPC monolayers in their liquid-expanded 2D phase state. Finally, by combining available literature data, a first Langmuir-type adsorption correlation between the more common AC voltammetry based surfactant activity measure, cTeq (in TX-100 equivalents, Teq), and VSFG based surface coverage has been established: , with and . First-level estimated global surfactant activity and surfactant surface coverage maps were generated based on satellite-derived primary productivity data, revealing that the surfactant pool in mesotrophic and eutrophic marine environments holds the potential for high surfactant surface coverages. This supports the frequently suggested significant role of biosurfactants in modulating air-sea gas exchange.
- Article
(2375 KB) - Full-text XML
-
Supplement
(1737 KB) - BibTeX
- EndNote


The sea surface microlayer (SML) is typically defined as the uppermost water column of the ocean with a variable depth range of 1–1000 µm. It is associated with the accumulation of surface-active material such as lipoid classes of carbohydrates and proteins, transparent exopolymer particles (TEP), and fatty acids (Cunliffe et al., 2013; Engel et al., 2017; Wurl et al., 2017). Surface-active molecules (surfactants) can inhibit gas exchange, in particular by altering the viscoelastic properties of the interface resulting in turbulence reduction and damping of capillary waves (Asher, 1997, 2019). A mere nanometer-thick monolayer of surfactants directly at the air-water interface is sufficient to significantly reduce air-sea gas transfer. For instance, early wind-wave tunnel studies by Broecker et al. (1978) have shown that the air-sea gas transfer velocity of CO2 was reduced by up to 80 % in the presence of a fully developed monolayer of the surfactant oleyl alcohol. Oleyl alcohol molecules have a very high interface preference and often served as a proxy surfactant belonging to the class of insoluble (or dry) surfactants, such as long-chain fatty acids or phospholipids.
Insoluble surfactants need to be distinguished from the environmentally more important soluble (or wet) surfactant classes, such as lipopolysaccharides (LPS) or proteins. Soluble surfactant molecules are in a bulk-interface equilibrium, which is most simply conceptualized by a Langmuir-type adsorption behavior. A Langmuir isotherm describes soluble surfactant molecules that accumulate at the surface, forming a monolayer, which asymptotically approach saturation as bulk concentration increase. Soluble surfactants with a high surface preference can exert a strong influence on air-sea gas exchange as well.
For instance, solutions of non-ionic soluble polyethyleneoxide surfactants such as Triton-X 100 (in short TX-100, see Fig. 1) showed up to 60 %–90 % reduction of the air-sea gas transfer velocity for O2 (Frew, 1997; Bock et al., 1999). Similar findings have been reported for artificial surfactant release with up to a 55 % reduction in a dual tracer experiment with oleyl alcohol in an open ocean experiment (Salter et al., 2011). Experiments with natural SML surfactants focusing on CO2 gas transfer showed reductions of up to 54 % at wind speeds of 8.5 m s−1 in a wind–wave tank experiment (Ribas-Ribas et al., 2018). Under oceanic conditions, a mean reduction of 23 % was observed, with values reaching up to 62 % during an in-situ experiment investigating natural slicks (Mustaffa et al., 2020). All these studies indicate that the presence and extent of the accumulation of biosurfactants in the SML could likely explain a significant part of the observed variability of reported air-sea gas transfer coefficients in natural marine systems (Jähne and Haußecker, 1998; Wanninkhof et al., 2009).
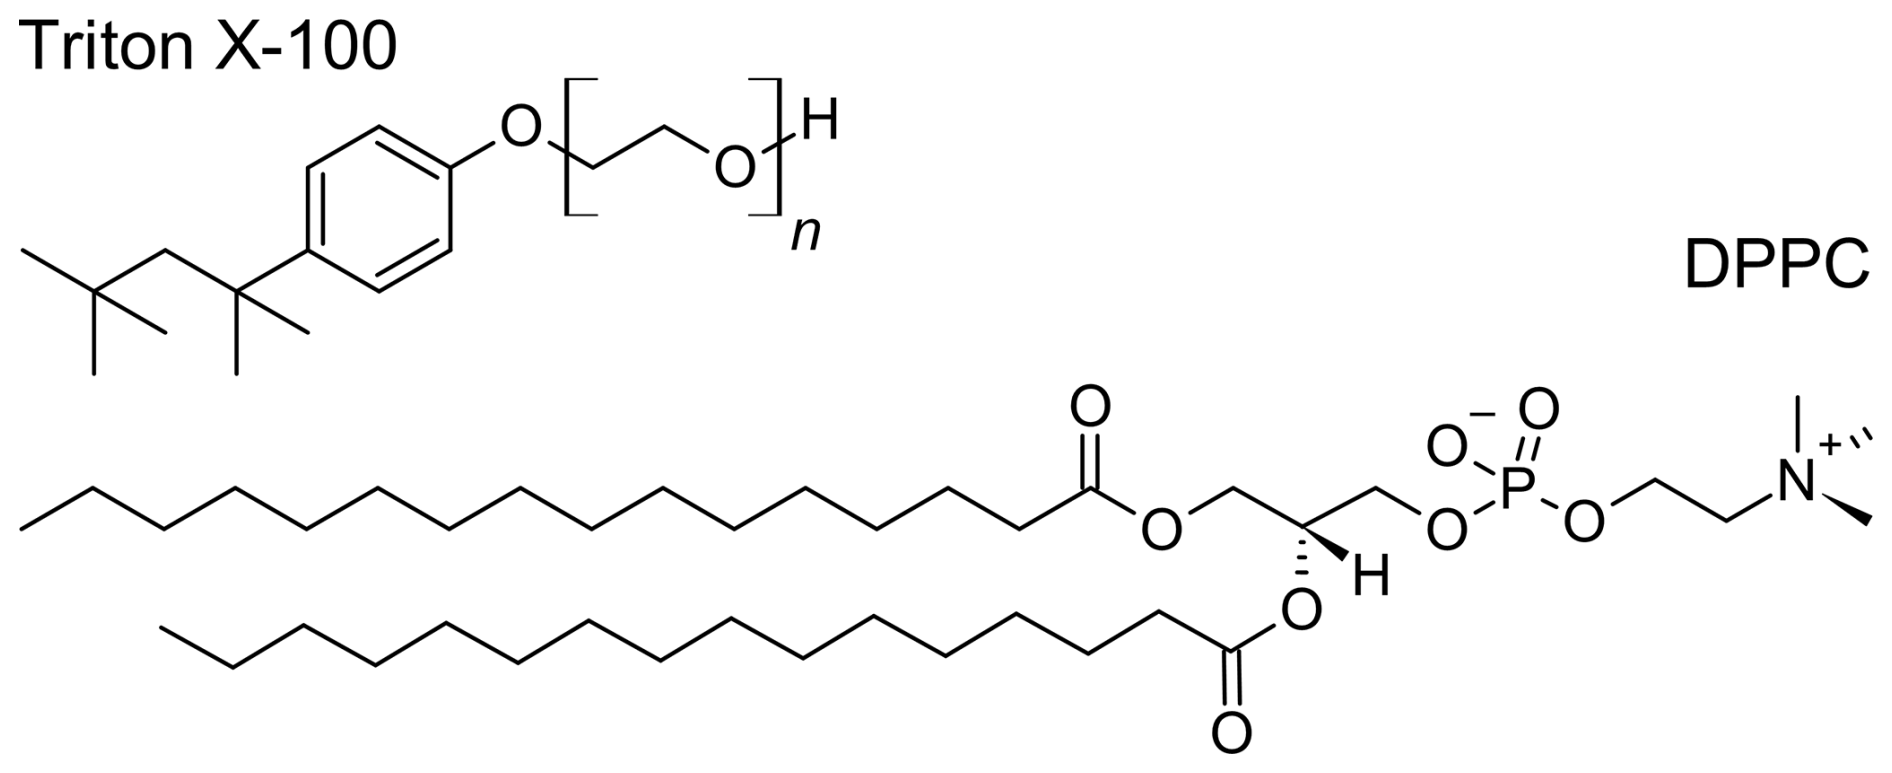
Figure 1Structural formula of the soluble surfactant Triton-X 100 (TX-100, n≈9–10) and the insoluble surfactant DPPC (1,2-Dipalmitoylphosphatidylcholine).
Setting a focus on the SML effect on air-sea gas exchange, it has been suggested to distinguish the nanolayer, which comprises the molecules directly at the interface, from the microlayer, which constitutes the volumetric properties of the SML, here considered as a bulk phase (Laß and Friedrichs, 2011; Engel et al., 2017). It is anticipated that surface-active molecules are further enriched in the nanolayer, both insoluble and soluble surfactants. The nanolayer and microlayer are strongly interlinked (e.g. by competitive adsorption equilibria of different SML surfactant classes) and often cannot be distinguished from each other in practical experiments using standard analysis methods. In the literature, it is therefore common practice to capture the effect of the SML as a whole by characterizing the presence of SML surfactants by enrichment factors (EF) or operationally defined volumetric sum parameters.
In this context, surfactant activity is typically expressed in terms of TX-100 equivalents (in units of µg Teq L−1). Although TX-100 is not necessarily a perfect proxy substance for natural SML surfactants in terms of gas exchange (Frew et al., 1995; Asher, 2019), it has initially been chosen as a reference compound by Ćosović and Vojvodić (1998) who established the characterization of SML samples using phase-sensitive alternating current voltammetry (AC voltammetry). Here, it served as a model substance because it provides a stable and reproducible surfactant signal, making it a practical calibration standard. AC voltammetry, which is since then widely used for SML surfactant characterization (Rickard et al., 2019), takes advantage of the effect of surfactant adsorbates at the electrode–solution interface that alter the double layer capacitance. Thus, AC voltammetry characterizes the surfactant activity of the microlayer and not of the nanolayer as the mercury electrode is hanging into the volumetric SML water sample, which is well-stirred during analysis.
Note that some authors use the term surfactant concentration (in terms of a TX-100 equivalent concentration) instead of surfactant activity. We prefer the latter, as the composition of the surfactant pool is decisive for the resulting surfactant effects and not, as one might easily misinterpret, the total concentration summed over all surfactants.
In the context of the sea surface microlayer, it is also reasonable to specify the surfactant enrichment factor, that is the ratio of surfactant activity in the SML relative to the underlying water (ULW). From the perspective surfactant enrichment, Wurl et al. (2011) have shown that the SML is widely prevalent throughout the oceans. Moreover, the enrichment factor helps to clarify biogeochemical mechanisms that lead to the formation of the SML and subsequent build-up of the surfactant pool (Wurl et al., 2011; Engel and Galgani, 2016; Engel et al., 2017; Barthelmeß and Engel, 2022). However, to range the potential of SML surfactants on air-sea gas exchange processes, the absolute value of the surfactant activity is a more decisive factor. Among the surface activity data shown by Wurl et al. (2011), two common scenarios can be observed. Scenario 1 is typical for oligotrophic regions where ULW surfactant activity is generally low (about 100 µg Teq L−1). In this case, even low surfactant activities in the SML can result in high enrichment factors. In scenario 2, it is just the opposite: In more productive regions, surfactant activity was often found to be elevated both in the ULW (e.g. 300 µg Teq L−1) and the SML (e.g. 450 µg Teq L−1), hence resulting in moderate enrichment factors. However stronger wave damping effects from surfactant accumulation at the interface are expected, despite the lower enrichment compared to scenario 1. It is evident that an absolute measure, such as surfactant activity, is a better suited starting point for characterizing the impact of SML surfactants on air-sea gas exchange (Laxague et al., 2024).
The aim of this work is to take a further step, that is to directly link SML surfactant activity in the microlayer with a surfactant surface coverage parameter derived from nanolayer measurements. In recent years, we have tested and further developed vibrational sum-frequency generation methodology (VSFG) for analyzing marine samples. VSFG spectroscopy is a non-linear laser spectroscopic method widely used to investigate the molecular structure and reactivity of synthetic molecular films at interfaces (Buck and Himmelhaus, 2001), but applications have extended into environmental research as well (Geiger, 2009; Jubb et al., 2012; Hosseinpour et al., 2020). For example, VSFG has been successfully employed for the analysis of sea spray aerosol spectra (Ebben et al., 2013) and for quantifying the coadsorption of saccharides in marine films to improve the modeling of sea spray organic enrichment (Burrows et al., 2016). Further studies focused on elucidating the reactivity of organic monolayers across different time scales (Kleber et al., 2013; Saak and Backus, 2024). VSFG is inherently surface-sensitive due to the underlying spectroscopic selection rules of sum frequency generation (SFG) and only probes molecules present directly at the air-water interface on a molecular scale. Using a tuneable infrared (IR) laser, VSFG yields spectra indicating vibrational bands similar to standard IR spectroscopy. As such, spectral signatures are indicative for the molecular composition of the nanolayer whereas the organic matrix in the volumetric microlayer contributes (almost) no signal. Corresponding work of the VSFG group at Kiel University covered the first demonstration of VSFG for SML nanolayer analysis (Laß et al., 2010), first steps toward the interpretation of the measured spectra (Laß and Friedrichs, 2011), a time-series study at Boknis Eck time-series station in the Baltic sea showing the yearly periodicity of organic material in the sea surface nanolayer (Laß et al., 2013), and first wind-wave tank studies aiming to link VSFG surfactant signatures to biogeochemical processes and wave damping effects (Engel et al., 2018, 2026).
To create a viable sum parameter for practical use and for scaling up the effects of the organic nanolayer on air-sea gas exchange and reactivity, we have previously introduced an operationally defined parameter termed “(surfactant) surface coverage” sc (Laß and Friedrichs, 2011; Engel et al., 2018; Bibi et al., 2025b). This parameter, which will be elaborated in the subsequent sections in more detail, provides a rough measure to quantify the effective coverage of the air-water interface with surface-active organic substances on the nanometer scale. In earlier work, we defined the sc metric relative to a reference state corresponding to a fully surfactant-covered surface in a highly ordered 2-dimensional phase state. For this purpose, we used a dense, highly compressed monolayer of the well-studied insoluble surfactant DPPC (1,2-dipalmitoylphosphatidylcholine, see Fig. 1) and used the corresponding spectral signatures of C−H stretch vibrations in the VSFG spectra as a reference for quantifying the presence of surface-active molecules. At such high surface concentrations, DPPC forms highly ordered monolayers at the air-water interface with strictly parallel alkyl chains in an all-trans conformation (Ma and Allen, 2006; Laß et al., 2010; Feng et al., 2016). While this system provides a well-defined spectroscopic reference, such an idealized surfactant monolayer is not representative of the complex situation encountered in natural sea surface microlayer (SML) samples, which consist of heterogeneous mixtures of soluble and insoluble surfactants. In this study, we therefore revisit the operational definition of the sc reference state and aim to determine a more suitable reference for characterizing the surfactant surface coverage of natural samples, thereby allowing a more intuitive understanding of what a surfactant surface coverage of 100 % actually signifies.
Beyond refining the molecular interpretation of the sc metric, a key objective of this work is to link VSFG spectral signal intensity to established bulk analytical measures of surfactant abundance. Specifically, we combine VSFG-derived surface coverage with corresponding AC voltammetry measurements to establish an empirical relationship between surfactant activity and effective interfacial surfactant surface coverage. This relationship enables the interpretation of more widely available surfactant activity data in terms of surface coverage and as such provides a pathway to estimate surfactant film coverage on regional and global scales. Motivated by the recent study of Elliott et al. (2018), which proposed a global biogeography of surface tension, the present work concludes with an initial attempt to derive maps of surfactant surface coverage potential based on primary production and the newly established SML specific surfactant activity – surface coverage correlation.
The paper is structured as follows. First, VSFG experiments with the model surfactants TX-100 and DPPC will be analyzed in some detail and directly compared with VSFG spectra of natural SML samples from a large-scale phytoplankton bloom mesocosm experiment in order to derive a surface coverage parameter. Secondly, we have applied this parameter to (i) characterize the surfactant state during a mesocosm algal bloom experiment using North Sea water and (ii) to identify slick and non-slick condition during a research cruise near the island Helgoland (North Sea). Thirdly, surfactant coverage data are directly compared with the surfactant activity measured for the same samples using AC voltammetry. Supplemented by additional data from a few previous studies (Baltic Sea and wind-wave tank data), for the first time a Langmuir-adsorption type of correlation between microlayer surfactant activity (as a measure for surfactant volumetric concentration) and nanolayer surfactant coverage (as a measure for the surfactant surface concentration) is established. Finally, taking advantage of a previously derived correlation between primary productivity and surfactant activity, the Langmuir adsorption model was tested for creating seasonally averaged global maps of surfactant coverage potential. Such maps could serve as a basis to better model the effect of surfactants on air-sea gas exchange as well as abiotic formation of volatile organic compounds from interfacial photolysis and ozonolysis (Brüggemann et al., 2018; Novak and Bertram, 2020).
2.1 Vibrational Sum-Frequency Spectrometer
A commercially available picosecond VSFG spectrometer (EKSPLA) was used to analyze the samples. A schematic setup of the VSFG spectrometer is shown in Fig. 2, it has been described in detail by Laß et al. (2010). Briefly, a Nd:YAG laser (PL 2241A) produced 30 ps laser pulses with a fundamental wavelength of 1064 nm and a pulse energy of 30 mJ. This fundamental pulse is passed through a harmonic unit to generate a second and third harmonic pulse with wavelengths of 532 nm (VIS) and 355 nm. In an additional parametric generator (PG 401) and difference frequency generation (DFG 2-10P) stage, both the fundamental and the third harmonic pulses are used to generate a tunable IR pulse in the wavenumber range 1000–4400 cm−1. A delay line and sample stage equipped with several steering mirrors, polarizing optics, and lenses was used to temporally and spatially overlap the VIS beam from the harmonic unit with the IR beam from the OPG/DFG unit. The SFG pulse is generated on the surface of the sample and is spatially and spectrally filtered from the reflected VIS and IR beams by using an iris and a notch filter. Finally, the SFG beam is directed through a monochromator and detected with a gated photomultiplier tube. The SFG process is resonance-enhanced, meaning that strong SFG response of the sample is generated when the frequency of the incident IR beam matches the frequency of a molecular vibration. Moreover, SFG is allowed only in environments without inversion symmetry, which is provided by the interface. As a result, VSFG spectra yield intrinsically surface-specific information on the vibrational spectra of the molecues at the interface, with nanometer-scale and sub-monolayer sensitivity. All spectra were recorded using the ssp polarization combination for the SFG, VIS, and IR beams. This polarization combination is sensitive to vibrational transition dipole moments oriented perpendicular to the water surface. Compared to other polarization combinations, such as ppp, the ssp spectra were found to offer both richer spectral detail and an improved signal-to-noise ratio. Section S1 in the Supplement provides a direct comparison between the ssp and ppp spectra.
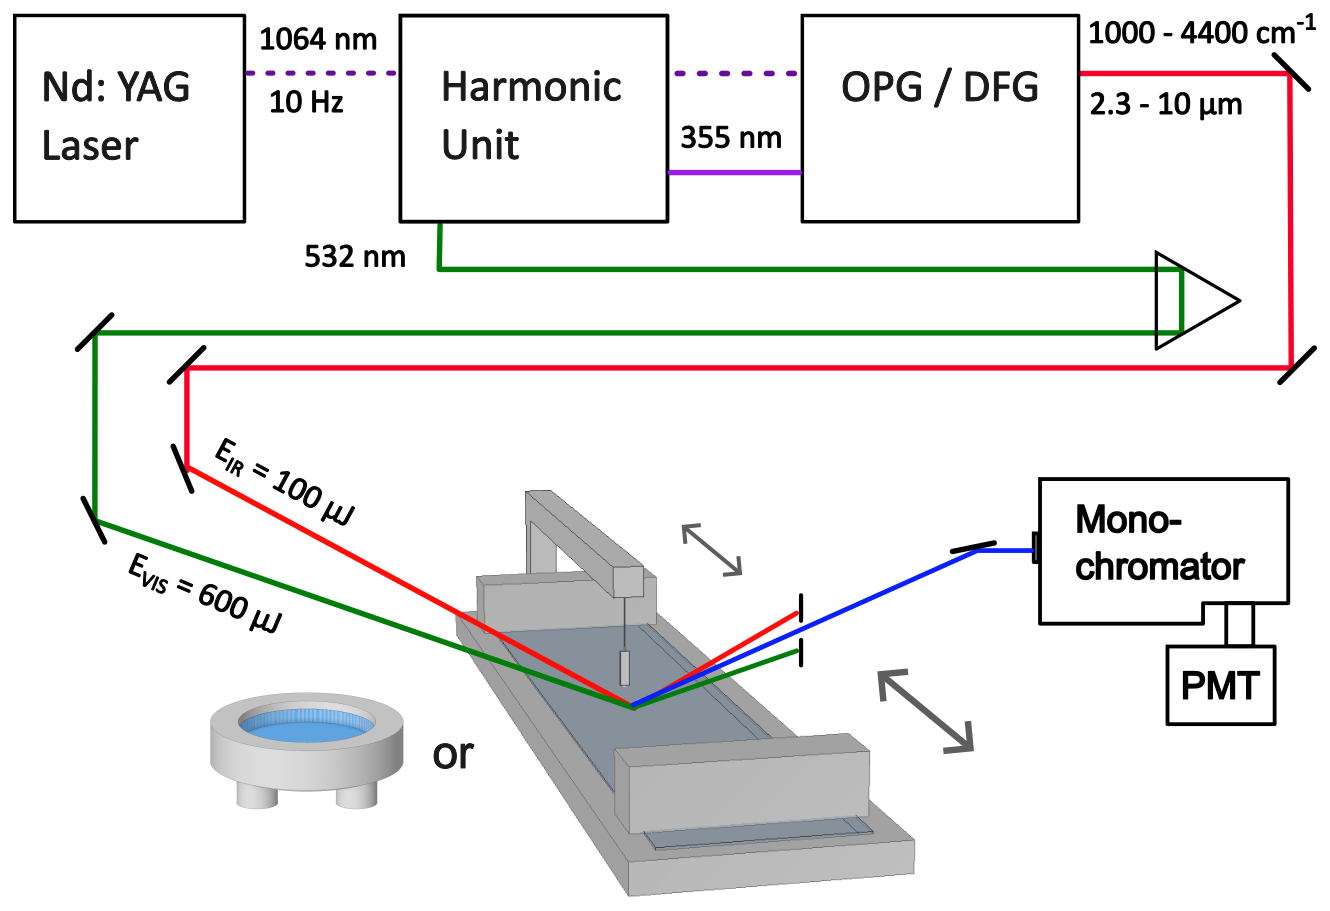
Figure 2Schematic setup of the VSFG spectrometer, including the Teflon sample dish and Langmuir trough. OPG: optical parameteric generator, DFG: difference-frequency generator, PMT: (gated) photomultiplier tube.
Compared to conventional IR spectroscopy, the orientational sensitivity of the SFG signal introduces additional complexity with regard to the measured spectral intensities, which will be addressed in more detail in Sect. 3.1. SML samples and proxy samples prepared with artificial surfactants were analyzed under ambient conditions (T=20 °C) by placing the samples directly into the beam path.
2.2 Artificial laboratory samples
A circular teflon dish with a surface area of 20 cm2 was filled with 10 mL ultra pure water (Elga Purelab Ultra, 18.2 MΩ cm). Variable amounts of a 1 mM DPPC (Sigma-Aldrich, 99 %) stock solution have been spread on the water surface using an Eppendorf pipette, where volumes of 1.0–8.3 µL correspond to monolayer surface concentrations of (0.3–2.5)×1014 molecules cm2. Alternatively, a Langmuir trough (KIBRON Micro Trough G2, see Fig. 2) has been used to study the interface properties of DPPC monolayers, where both surface pressure isotherms as well as VSFG spectra of DPPC were measured under variable conditions. The trough was filled with 180 mL water and provided a maximum surface area of 280 cm2. Two movable barriers compressed the available area down to 44 cm2. Surface tension γ and surface pressure were measured using the filter paper method (Wilhelmi balance) with a precision of 10 µN m−1. In case of the soluble TX-100 (Sigma-Aldrich, laboratory grade, ), the Teflon dish was filled with TX-100 solutions at concentrations ranging from 50 µg L−1 to 20.0 mg L−1 in 35 g L−1 NaCl solution and static VSFG spectra have been recorded. The surface tension of the TX-100 solutions has been measured independently by a Du-Nüoy-Paddy tensiometer (KIBRON Aqua Pi Plus).
2.3 Natural Samples
2.3.1 Surfactant Analysis
VSFG spectroscopy is a laboratory based analysis method, hence 50 mL SML samples from the mesocosm and open-sea studies were stored in polyethylen bottles at −18 °C and analyzed within a few weeks. Preliminary experiments showed that the measured SFG spectra of samples frozen for many weeks did not differ from those of fresh, unfrozen samples. The defrosted samples were thoroughly mixed and aliquots of 10 mL were quickly transferred to the teflon dish. The samples were allowed to rest for about 10 min before starting an SFG spectral scan by tuning the IR laser frequency in steps of 5 cm−1 over the C−H stretch vibration wavenumber range of 2800–3000 cm−1. Selected samples from the Helgoland cruise were also analyzed in the wavenumber range 1650–1800 cm−1, which is typically assigned to the C=O stretch vibrations of carbonyl groups. The determination of the surface coverage sc from the average VSFG spectrum of the 3–5 aliquotes for each sample will be described in more detail in Sect. 3.1. Within the limits of the model's validity and derived from error propagation using the 1σ repeatability of the individual spectra (6 %), the analytical precision of sc is assessed to be 10 % (2σ). Surfactant activity was measured with an analytical precision of <10 % by AC voltammetry (METROHM 797 VA Computrace) with a hanging drop mercury electrode according to a protocol developed by Ćosović and Vojvodić (1982, 1987) and modified with an internal calibration technique (Wurl et al., 2011). All SML samples were collected in polyethylene bottles (50 mL) and stored at 4 °C. 10 mL of the unfiltered samples were analyzed in triplicate using a standard addition technique. Calibration via standard addition was performed by the addition of TX-100 stock solution, where the surfactant activity is given as µg TX-100 equivalent . Sodium chloride solution (NaCl) with a concentration of 35 g L−1 was used as blanks.
2.3.2 SURF Mesocosm Experiment
A large-scale algal bloom mesocosm experiment has been conducted in the Sea Surface Facility (SURF) at the Institute for Chemistry and Biology of the Marine Environment in Wilhelmshaven, Germany, from 18 May to 16 June in 2023. The experiment was part of the BASS (biogeochemical processes and air-sea exchange in the sea-surface microlayer) project targeting the role of the SML in biogeochemical cycles and air-sea interaction. The details and related studies of the mesocosm campaign are described elsewhere (Bibi et al., 2025b; Thölen et al., 2026; Zöbelein et al., 2026; Jibaja Valderrama et al., 2026; Rauch et al., 2026). The induced phytoplankton bloom with a distinct succession of pre-bloom, bloom, and post-bloom phase led to high surfactant concentration with distinct slick formation and surfactant activities up to 1868 µg Teq L−1 in the SML, hence exceeding that observed in natural environments. In brief, the experiment was conducted as follows. The 8.5 m long, 2 m wide, and 1 m deep concrete pool was filled with 17 000 L of pretreated salt water from the Jade Bay ( N, E). The pool was equipped with eight flow pumps (AQUALIGHT, ATK-4 Wavemaker, 18 000 L h−1) at the bottom of the pool to ensure homogeneity of the water column and to prevent particle settling and biofilm formation on the pool walls. All pumps were operated at low power settings to mimic a slow natural mixing in the bulk water and its surface without turbulent mixing. The facility was exposed to ambient light and was protected from raining events by a retractable 4 mm polycarbonate roof (highly transmissible for sunlight). Prior to the start of the time series, the water surface was cleaned of organic matter by extensive glass plate sampling over 9 h. Throughout the experiment, nutrients were added to the tank on three different days (26, 31 May and 1 June 2023) to achieve final concentrations of 0, 10, and 5 µmol L−1 for nitrogen, 1.2, 0.6, and 0.3 µmol L−1 for phosphorus and 19.8, 10, and 0 µmol L−1 for silicate, respectively. The samples shown in this study were collected daily, alternating between morning (around 6 ) and afternoon (around 4 ) based on the sunrise timing. The SML samples were taken using the glass plate method according to a protocol outlined in Cunliffe and Wurl (2014).
2.3.3 Helgoland field study
The samples were taking during the BASS Helgoland field campaign (RV Heincke, cruise no. HE644) taking place from 9 June to 1 August in 2024. All SML samples were collected off-shore of the island Helgoland (North Sea, around 54°15′ N, 8°00′ E) by remote-controlled catamarans using a rotating sampler, either the autonomous surface vehicle HALOBATES (Wurl et al., 2024) or the radio-controlled vehicle GLAUCUS. Additionally, underlying water samples were collected at 1 m depth. The field campaign target was to spot patches of SML slick and perform sampling inside and outside the slick patch to elucidate differences in the SML, for this study in particular the surfactant state. Ideally, a sampling series of a given sampling event consisted of 9 distinct samples (). The SML samples are qualitatively categorized into SML (slick), SML (non-slick), whether or not a reduction of the surface tension of the water – becoming visible through a pronounced damping of the wave field – was observed during sampling.
This section is structured into three conceptionally distinct subsections. The first subsection outlines a methodological advancement, offering a comprehensive examination of how VSFG can be employed to characterize the surfactant state of the nanolayer in natural samples via a surfactant surface coverage parameter sc. TX-100 and DPPC serve as suitable reference compounds, representing soluble (wet) and insoluble (dry) surfactants, respectively. Following this, the second subsection employs the concept of surface coverage to assess two separate datasets of natural SML samples, specifically the SURF mesocosm study and the Helgoland field study. In the final subsection, based on the described methodology and gathered data, a correlation function is proposed between the surface coverage parameter and concurrently measured surfactant activity using a Langmuir adsorption model. This correlation permits preliminary conclusions regarding the potential surfactant coverage on ocean water on a global scale.
3.1 Surface coverage parameter
The surface coverage parameter sc presented here serves as a practical, operationally defined parameter measure to assess the molecular coverage of a nanolayer by organic surfactants. Conceptually, 0 % represents a pure, surfactant-free air-water interface, whereas 100 % signifies complete coverage by an organic monolayer, which is characterized by a sufficiently dense organic monolayer of a suitable reference substance. It is noteworthy that sc values exceeding 100 % may occur as a result of the variability of SML surfactants. It may also indicate either a natural organic monolayer with exceptionally high molecular order (e.g. due to dense or compacted lipid surfactants) or the unique formation of surfactant multilayers facilitated by the favorable co-adsorption of various surfactant types at the interface (Burrows et al., 2016).
VSFG spectroscopy primarily reveals information about molecules located directly at the air-water interface. The theory of non-linear VSFG is well established. We refer readers new to VSFG spectroscopy to the tutorial-style introduction by Lambert et al. (2005) and reviews focusing on environmental applications (Buck and Himmelhaus, 2001; Geiger, 2009; Jubb et al., 2012; Hosseinpour et al., 2020). Despite the method's numerous benefits, it remains challenging to directly quantify the absolute concentration of either a single unknown compound or, more challenging yet, a mixture of substances. In simplified terms, the SFG signal intensity, normalized to the intensities of the IR and VIS light beams, is proportional to the square of the second-order susceptibility χ(2) of the interacting interface:
For air-water interfaces, non-resonant contributions to χ(2) can be largely neglected such that the resulting spectrum consists essentially of peaks representing resonant vibrational excitations of interfacial molecules. For example, the VSFG spectrum of organic matter detected in natural SML samples is dominated by various C−H stretching vibrations of the alkyl groups at wavenumbers in the range 2800–3000 cm−1. The second-order susceptibility χ2 in Eq. (1) can be interpreted as the macroscopic average of molecular hyperpolarizabilities, β, such that the overall SFG intensity is proportional to the square of the number of probed SFG-active molecules N. In addition to the resulting N2 dependence, β itself may also depend on the surfactant surface concentration, mainly due to changes in the overall molecular orientation of the probed molecules. For sure this is true when analyzing monolayers of long-chain lipids in which the alkyl chains, initially lying randomly on the water surface, detach from the water surface as the surface concentration increases and form structurally well-ordered monolayers with aligned alkyl chains. Previous studies by Laß et al. (2013), however, indicated that – despite variations in the total organic matter content and corresponding SFG intensity across different SML samples – the VSFG spectra appear almost identical. This suggests that for natural SML samples the influence of orientational effects (β(N)) on the SFG signal can be largely neglected. This far-reaching assumption is further supported by the data provided in this work (see Sects. S1 and S2 in the Supplement, with Fig. S1 in the Supplement revealing consistent signal trends for VSFG spectra measured both in ssp and ppp polarization combination and Fig. S2 in the Supplement highlighting the spectral trends of VSFG spectra of natural samples in comparison with Triton X-100 and DPPC). In practice, neglecting structural effects much simplifies the analysis of VSFG spectra and allows us to use the square root of the integrated area of SFG intensity in the C−H stretch vibrational spectral range as a relative measure of the number of molecules (or, more precisely, the number of contributing oscillators) present at the surface. In accordance with our previous work, we define the spectral area aSFG-CH as a relative surface concentration measure (N∝aSFG-CH):
By subtracting the integral area of a surfactant-free water sample, the spectral area becomes a more accurate relative measure of the concentration of organic molecules in the nanolayer. To derive an even more intuitive sum parameter, the surface coverage parameter is simply defined as the percentage of the spectral area of a sample spectrum divided by the spectral area of a carefully selected reference compound, the latter associated with a fully covered monolayer:
This conceptual approach for calculating sc is depicted in Fig. 3. Here, a few representative SML spectra with increasing signal intensity in the C−H stretch vibrational range are compared with the spectrum of DPPC at a surface concentration corresponding to sc=100 % (as specified further below). Note that the overall shapes of the spectra are all similar, with prominent peaks around 2850 cm−1 (symmetric stretch vibration of CH2 groups, d+-mode), 2875 cm−1 (symmetric stretch of CH3 groups, r+-mode), and a broader band around 2950 cm−1 (typically assigned to Fermi resonances of CH2 and CH3 deformation vibrations with the symmetric stretching bands, rFR-mode). Such a spectrum indicates the presence of lipoid organic molecules. Moreover, the insensitivity of the SML spectra on the overall total intensity confirms the fact that β(N) in Eq. (1) can be treated as a constant factor. The background spectrum of pure water (yellow curve in Fig. 3) displays no distinct peaks and reflects the weak non-resonant signal background of water in this spectral range. Considering the water spectrum as a background is reasonable, however, the direct comparison between the water and the weakest SML spectra reveals the limit of this approach. Clearly, around 2900 and 2975 cm−1 the SML spectrum yields lower SFG intensity than the water background spectrum, actually an SFG-specific effect that can be traced back to either destructive interference of resonant out-of-phase SML contributions or alterations of the interfacial water structure caused by the overlaying organic layer (Lambert et al., 2005; Jubb et al., 2012). In the context of this paper, such spectral anomalies are treated as minor disturbances and their neglect results in uncertainties of the calculated surface coverage at low signal strengths. Therefore, due to both the N2 signal dependence, causing particularly small signals at low surface coverage, and the possible baseline subtraction inaccuracies, we consider sc values below 20 % as less reliable. However, this is not a fundamental problem of the methodology, as prominent surfactant effects on air-sea gas exchange are only expected towards higher surface coverages anyway.
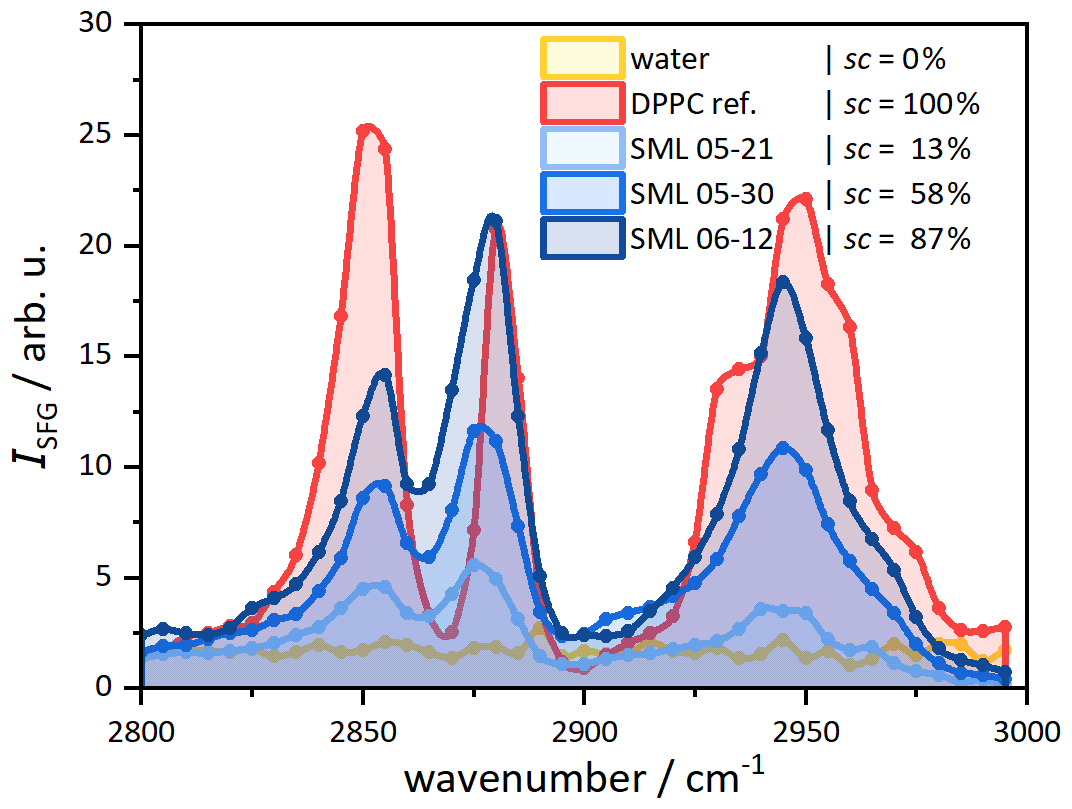
Figure 3VSFG example spectra for surface coverage determination: three SML samples (from the mesocosm study), reference compound DPPC (corresponding to 100 % coverage, red), and pure water (for background correction, yellow). Measured data points are connected by spline interpolations to better guide the eye.
3.1.1 Triton X-100 as a proxy for soluble/wet surfactants
Triton X-100 is widely used in the marine science community as a reference compound to measure surfactant activity by means of AC voltammetry (Ćosović and Vojvodić, 1982, 1998; Frew et al., 1995; Mesarchaki et al., 2015; Adenaya et al., 2021) and to study the effect of a soluble surfactant on air-sea gas exchange (Ribas-Ribas et al., 2018; Mustaffa et al., 2020; Laxague et al., 2024). To the best of our knowledge, there are no VSFG studies available in the literature addressing the surfactant behavior of TX-100. Figure 4a displays VSFG spectra of TX-100 for increasing bulk concentrations. Already at the lowest concentration of 50 µg L−1, clear spectral signatures are visible, indicating that the air-water interface is already covered by a significant fraction by TX-100 molecules. This is consistent with measurements that have reported a pronounced inhibition of air-sea gas transfer already at such low concentrations (Frew et al., 1995; Mesarchaki et al., 2015). As outlined above, the observed vibrational bands at 2850, 2880, and 2950 cm−1 can be assigned to , and rFR. Compared to common VSFG spectra of fatty acids with longer alkyl chains such as DPPC, stearic acid or oleic acid (Bell et al., 1996; Ma and Allen, 2006; Laß et al., 2010), the observed vibrational bands are broader, probably due to variable line shifts resulting from both mesomeric and inductive effects acting on the different CH2 and CH3 groups in the molecule (see Fig. 1). Here, the presence of the ether group in the polyether tail is expected to induce a blue shift of CH2 group directly bound to the ether group, and the positive inductive effects of the alkyl groups in the hydrophobic part of the molecule should lead to a red shift of C−H signatures of the octyl group. Quite unusual for VSFG spectra measured in the ssp polarization combination is the distinct band at 2915 cm−1, which can be assigned to the antisymmetric stretch vibration of the methylene group (CH2, d− mode). d− is often not detected for molecules with longer alkyl chains because (i) the pseudo-inversion symmetry of apposing facing methylene groups in highly ordered alkyl chains in all-trans conformation cancels out the corresponding SFG intensities and (ii) the net contribution of the this vibration to the transition dipole moment perpendicular to the interface remains small. In principle, d− intensity in TX-100 can arise from both the CH2 groups in the polyether chain and the hydrophobic octyl part of the molecule. At low surface concentrations, the polyether chains lie flat on the surface and thus contribute to the signal. Such a structure is supported by molecular dynamics simulations of Parra et al. (2020) (see Fig. S9 in their Supplement). However, as the surface concentration increases, the polyether groups are expected to get displaced from the interface and get integrated into the water network. This is expected to reduce the overall structural order, consequently diminishing the intensity contributions to the VSFG signal. Note, however, that the d− peak remains prominent in all spectra, suggesting that a CH2 group maintains a preferred orientation even when the surface concentration is high. Tentatively, we attribute this strong signal component to the single CH2 in the hydrophobic part of the molecule as it may result from the packing pattern of the bulky alkylbenzene group on the surface. Future polarisation dependent measurements are needed to further elucidate such interesting structural effects (Wang et al., 2005).
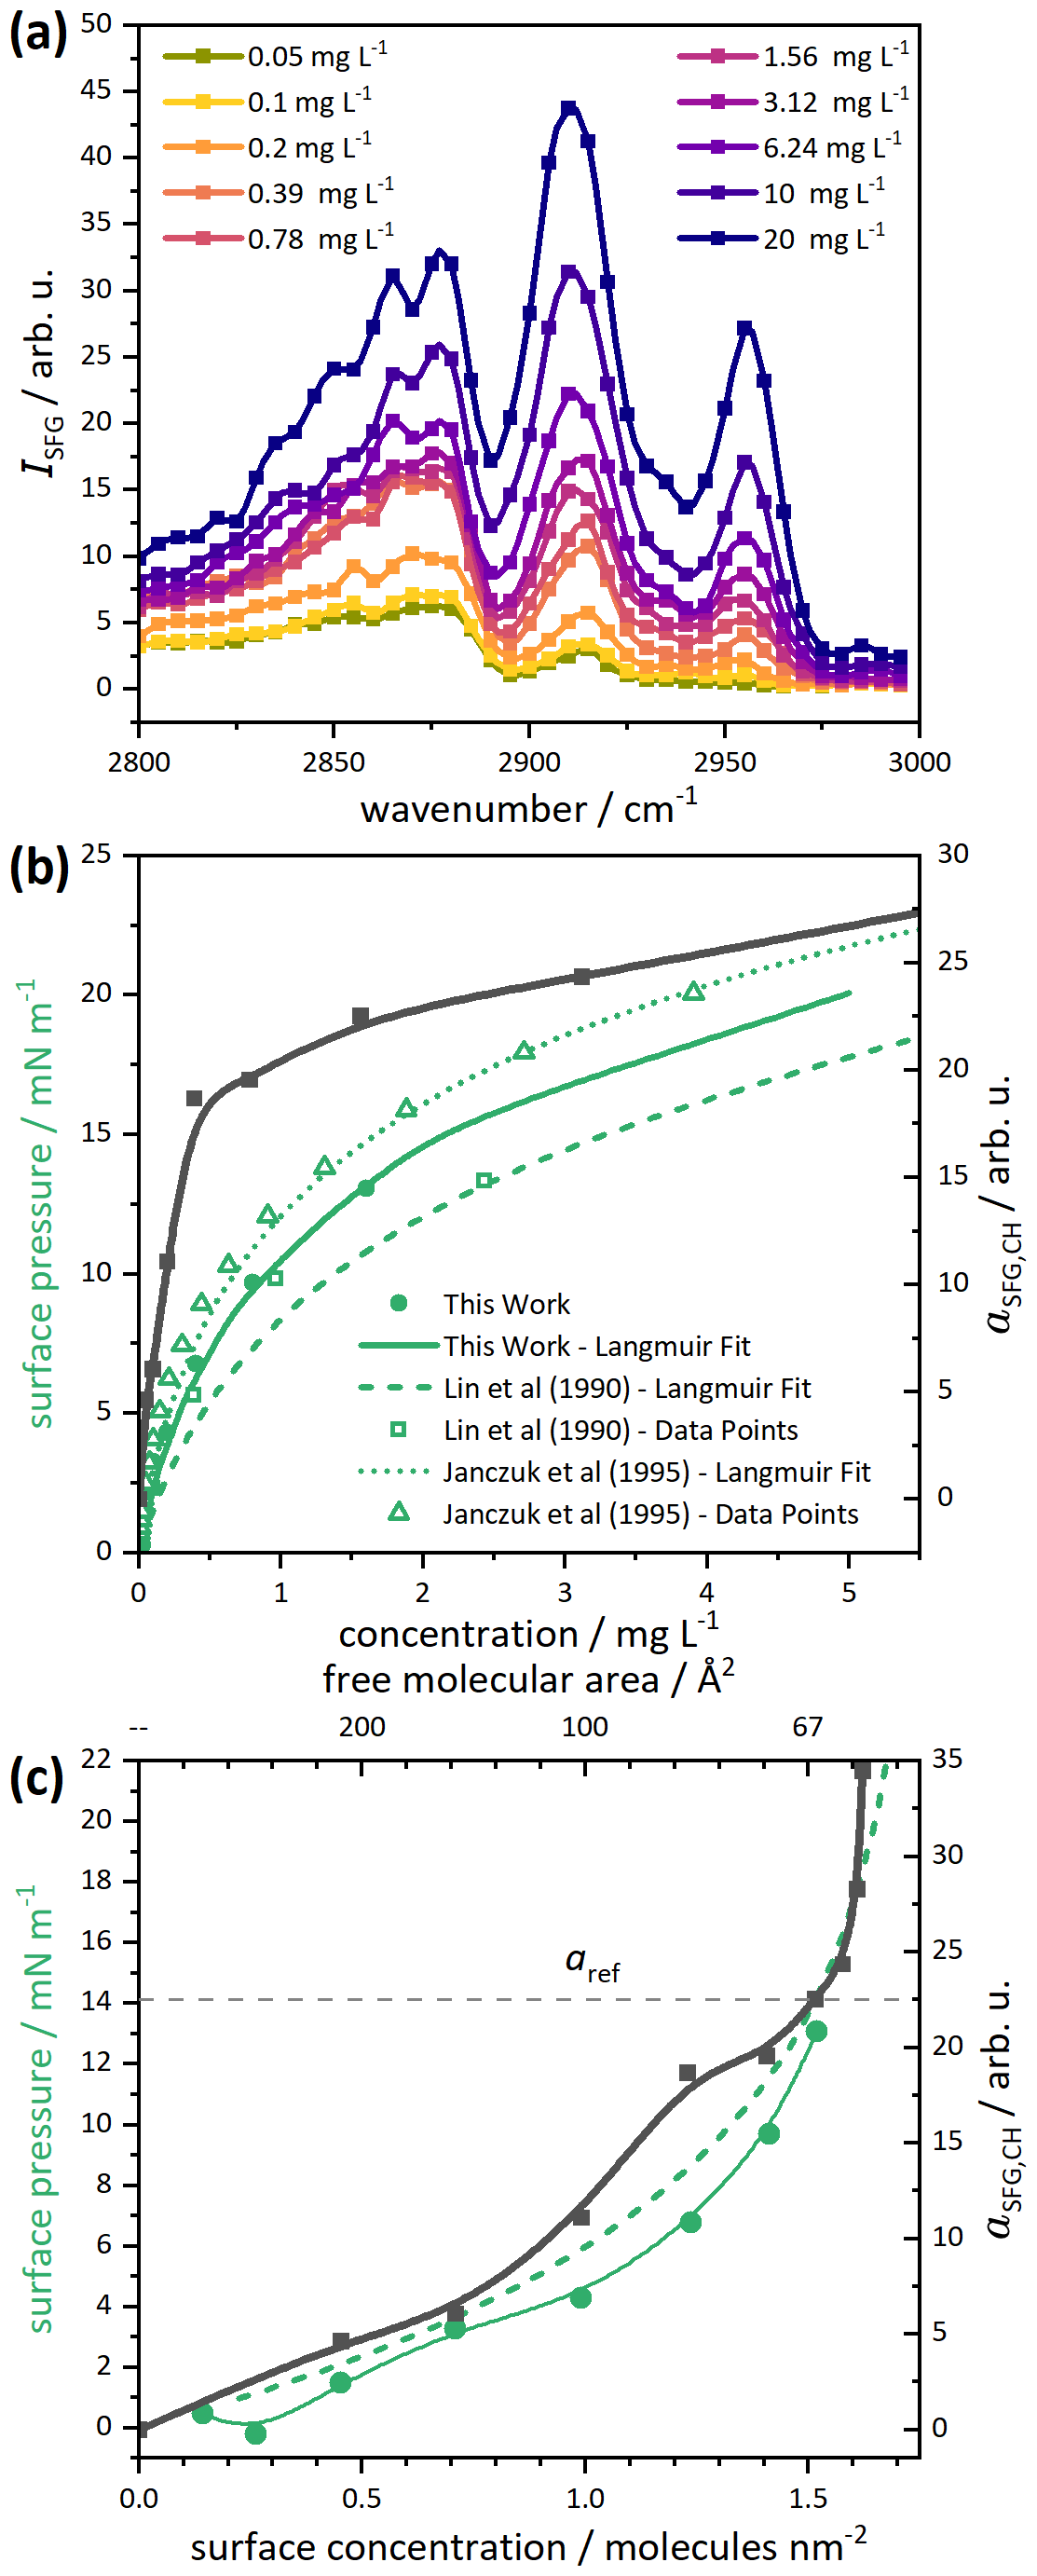
Figure 4(a) TX-100 SFG spectra for different bulk concentrations. (b) Spectral area of the TX-100 spectra at different bulk concentrations (black), shown together with the surface pressure (green). (c) Same as panel (b), but plotted vs. surface concentration (lower axis) and the corresponding free molecular area (upper axis), respectively. All curves are spline interpolations to the data points to guide the eye.
In order to link the measured SFG intensity to surface concentration and surface coverage, Fig. 4b directly compares the measured surface pressure at T=293 K (filled green circles) with the VSFG spectral area aSFG-CH (black squares) as function of the volumetric TX-100 concentration in the bulk. The open green symbols correspond to surface pressure data taken from Janczuk et al. (1995) (interpolated to 293 K) and Lin et al. (1990) (room temperature) for comparison. The three data sets are largely consistent but do not match up entirely. This could be attributed to minor variations in the compositions of the TX-100 batches used (comprising molecules with differing polyether chain lengths), alongside residual impacts from temperature and pH variations. However, both the surface-pressure data as well as VSFG curves reveal a Langmuir-type behavior, demonstrating the adsorption equilibrium of TX-100 between the volumetric water phase and the interface. The Langmuir isotherm can be written as
with KL the Langmuir adsorption constant quantifying the affinity of a molecule for adsorption at an interface. Γ denotes the surface excess (i.e. the additional amount of a component per unit area that accumulates at an interface compared to its bulk concentration), cs the surface concentration (in units of molecules/area), θ the number of available adsorption sites per unit area, and sc the surface coverage as defined in this work. The corresponding maximum values in the denominator are the limiting values for high surfactant concentration c in the bulk. As we shall demonstrate in the following sections, scmax≈100 % is applicable to an interface completely covered with natural surfactants.
In order to convert the volumetric surfactant concentration c to a surface concentration cs, we take advantage of the Gibbs adsorption equation for an ideal dilute solution, providing the link between surface tension γ and surface concentration in terms of surface excess.
Here, R is the gas constant and T the absolute temperature. The combination of the Langmuir and Gibbs equations (Eqs. 4 and 5) leads to the Szyszkowski equation (Adamson and Gast, 1997), which enables the calculation of surface pressure , with γ0 the surface tension of a surfactant-free water interface.
The Langmuir constant KL and the maximum surface excess Γmax are frequently derived from fitting experimental surface pressure isotherms. In case of the rather strongly adsorbing TX-100 (, Lin et al., 1990), the fraction of bulk molecules within a monolayer thickness of δ=2 nm is small compared to the surface excess. Hence, surface excess equals surface concentration () in this case.
Building on this thermodynamic framework, Fig. 4c shows the same isotherms as in Fig. 4b, but plotted as function of the surface concentration. While the surface pressure isotherm exhibits a continuous rise in surface pressure, a behavior characteristic of soluble surfactants, the associated VSFG signal intensity indicates a shoulder or a plateau-like trend at surface concentrations of approximately (corresponding to a free molecular area of 83 Å2 molecule−1). Such a significant change in the gradient of the SFG intensity curve often indicates a 2D phase transformation of the structure or at least a significant re-structuring of the molecules in the organic monolayer. Consequently, based on the interpretation of the VSFG spectrum outline above, the signal plateau corresponds to the surface concentration level where the interactions among polyethylene chains lead to their detachment from the interface. This surface concentration can be identified as a surface almost completely covered with organic molecules. The dashed gray line in Fig. 4c corresponds to the SFG signal intensity that we set equivalent to a surface coverage of sc=100 %, actually based on DPPC spectra discussed in the next section. Note that this signal level is consistent with the end of the plateau region of TX-100. Finally, at surface concentrations corresponding to free molecular areas below 67 Å2 molecule−1 a steep increase of SFG intensity is observed. This points at a densely packed 2D phase state with high molecular order, again consistent with the expected maximum possible surface concentration of a stable monolayer of TX-100 with a collapse point at a molecular area of about 66 Å2 molecule−1 (Fainerman et al., 2009).
3.1.2 DPPC as a proxy for insoluble surfactants
DPPC is a well-studied insoluble surfactant with a typical 2D phase behavior of a phospholipid or fatty acid (Zuo et al., 2016). The 2D phase behavior is clearly visible in VSFG spectra as well (Ma and Allen, 2006; Feng et al., 2016). Figure 5a shows a series of VSFG spectra with increasing surface pressure. The symmetric r+ and d+ vibrations of the CH2 and CH3 groups yield well resolved peaks at 2850 and 2875 cm−1, going along with the corresponding overlapping Fermi resonances around 2955 cm−1. With increasing surface pressure, the intensity of the CH3(r+) vibration increases, while the CH2(d+) vibration slightly decreases. The resulting decrease of the ratio is associated with the increasingly uniform all-trans alignment of the alkyl chains (Ma and Allen, 2006; Lambert et al., 2005; Wang et al., 2005). In Fig. 5b, the measured Langmuir isotherm of DPPC is shown together with the integrated SFG signal intensity aSFG-CH (black symbols and interpolated curve). Both the surface-pressure isotherm and the SFG signal trend can be interpreted in the context of 2D phase transitions. For example, at surface concentrations below the lift-off point, the insoluble surfactant DPPC has an almost negligible impact on surface tension ( from 1.0–1.25 molecules nm−2). This is in striking contrast to soluble surfactants showing a gradual decrease of the surface tension as outlined for TX-100 in the preceding section. The lift-off point at 80 Å2 molecule−1 separates the 2D gas phase from the liquid expanded (LE) phase. It corresponds a situation where lateral interactions between neighboring molecules become noticeable. This situation can phenomenologically be identified with a surface being loosely covered with surfactants. Towards higher surface concentration, the plateau of the surface pressure between 66 Å2 molecule−1 and 50 Å2 molecule−1 can be attributed to a phase transition from the liquid expanded (LE) phase into liquid condensed (LC) phase. Here, the molecules start to avoid unfavorable intermolecular interactions by the reorientation of alkyl chains. This reduces repulsive interactions from steric hindrance and enhances favorable interactions such as van der Waals forces between densely packed alkyl chains. Phenomenologically, it is reasonable to identify this situation with a surface being completely covered with surfactants, hence sc=100 %. Note that the phase transition to the liquid condensed 2D phase is going along with a plateau-like SFG signal intensity (Fig. 5b), again highlighting that the phase transition corresponds to a monolayer compression going along with significant structural re-organization of the surfactant molecules. Consequently, the corresponding integral signal intensity at a surface concentration of , serves as a suitable reference point to scale the surface coverage parameter to 100 %.
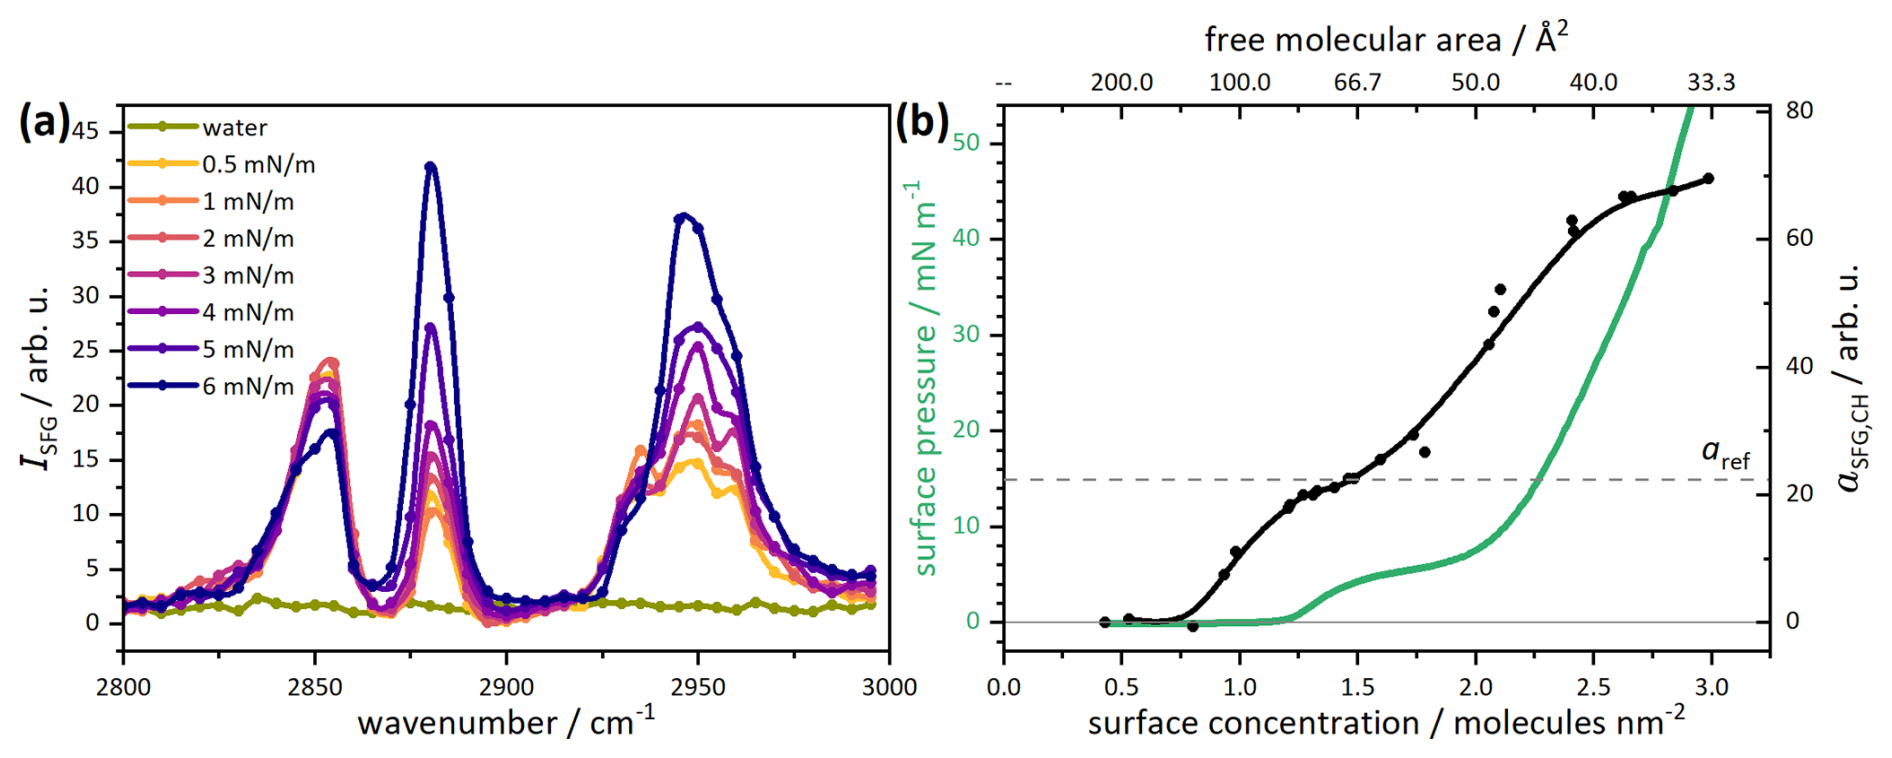
Figure 5(a) DPPC VSFG spectra in the alkyl region for different surface pressures. (b) Spectral area aSFG-CH (black symbols, together with a spline interpolation to guide the eye) and surface pressure isotherm (green lines) as function of the DPPC surface concentration (lower axis) and the respective free molecular area (upper axis).
Note that in previous work (Laß and Friedrichs, 2011; Engel et al., 2018), we have chosen a higher surface concentration of DPPC, 40 Å2 molecule−1, as the reference point. This alternative reference point with an about 2.6 times higher aSFG-CH value corresponds to the leveling off of the SFG intensity. It is close to the collapse point of the monolayer, where DPPC is in its highly compressed solid 2D phase state with straight and perfectly aligned alkyl chains. Considering (i) that such a well-ordered monolayer is unlikely to be representative of a natural SML nanolayer and (ii) that a pronounced SFG signal enhancement is induced by the preferred orientation of the transition moment of the terminal methyl groups of the lipid chain, we consider the plateau signal at about 69 Å2 molecule−1 as a more practical choice for naturally existing SML interfaces. The corresponding signal level is indicated as a horizontal dashed line both in Fig. 5 for DPPC and in Fig. 4 for TX-100. This choice has advantages and limitations. Firstly, this reference point is relatively easy to reproduce experimentally and, secondly, it represents a not perfectly structured monolayer. This is realistic for natural systems, which typically consist of complex mixtures of more or less soluble lipids, carbohydrates, proteins, and other organic compounds. The diversity in molecular substance classes, molecular size and structure is expected to induce a certain degree of disorder. Thirdly, it turns out that the corresponding aref value for DPPC is fully consistent with the observed SFG plateau level of TX-100 that has been identified with a completely covered surface as well. This seems all very consistent in itself, nevertheless is important to emphasize that the selection of the reference point remains somewhat arbitrary and is guided by such practical considerations. Therefore, the operational definition of the surface coverage parameter sc should not be taken as a universal thermodynamic threshold applicable to all surfactants or interfacial systems. Rather the objective of this approach is to establish a surface coverage parameter that is easily comprehensible and directly applicable for the characterization of SML samples through SFG spectroscopy, bypassing intricate spectroscopic details.
3.2 Application to natural SML samples
Natural samples have been collected in two field studies in order to test and further validate the practicability of the surface coverage concept. In particular, VSFG based surfactant surface coverage data will be directly compared with surfactant activity data measured by AC voltammetry.
3.2.1 SURF – Mesocosm time series
In the SURF mesocosm experiment, a nutrient-induced phytoplankton bloom development in North Sea water has been investigated to gain a comprehensive understanding on the dynamic coupling of biogeochemical processes between the SML and the underlying water (ULW). We provided data on surface coverage and surface activity, which have been discussed in a complementary overview paper in the context of biological processes that fed into the surfactant pool (Bibi et al., 2025b). Here, we focus on the direct comparison of surface coverage and surface activity data during the three main phases of the experiments (18–26 May: pre-bloom, 27 May–4 June: bloom, 5–16 June: post-bloom), which are well reflected by the abundance of chlorophyll a (chl a) shown as a green shaded curve in Fig. 6 (Bibi et al., 2025b). The black square symbols correspond to the daily measured SML surface coverage data as derived from the VSFG spectrum using Eqs. (2) and (3) and the red and blue square symbols to the SML and ULW surfactant activity values in TX-100 equivalents. The solid curves correspond to a spline interpolation to guide the eye. All data are listed in Table S1 in the Supplement together with uncertainty limits representing the analytical precision of the replicated measurements. Data are also available in PANGAEA (Bibi et al., 2025a), and have been discussed previously in the context of biological drivers for surfactant formation in Bibi et al. (2025b).
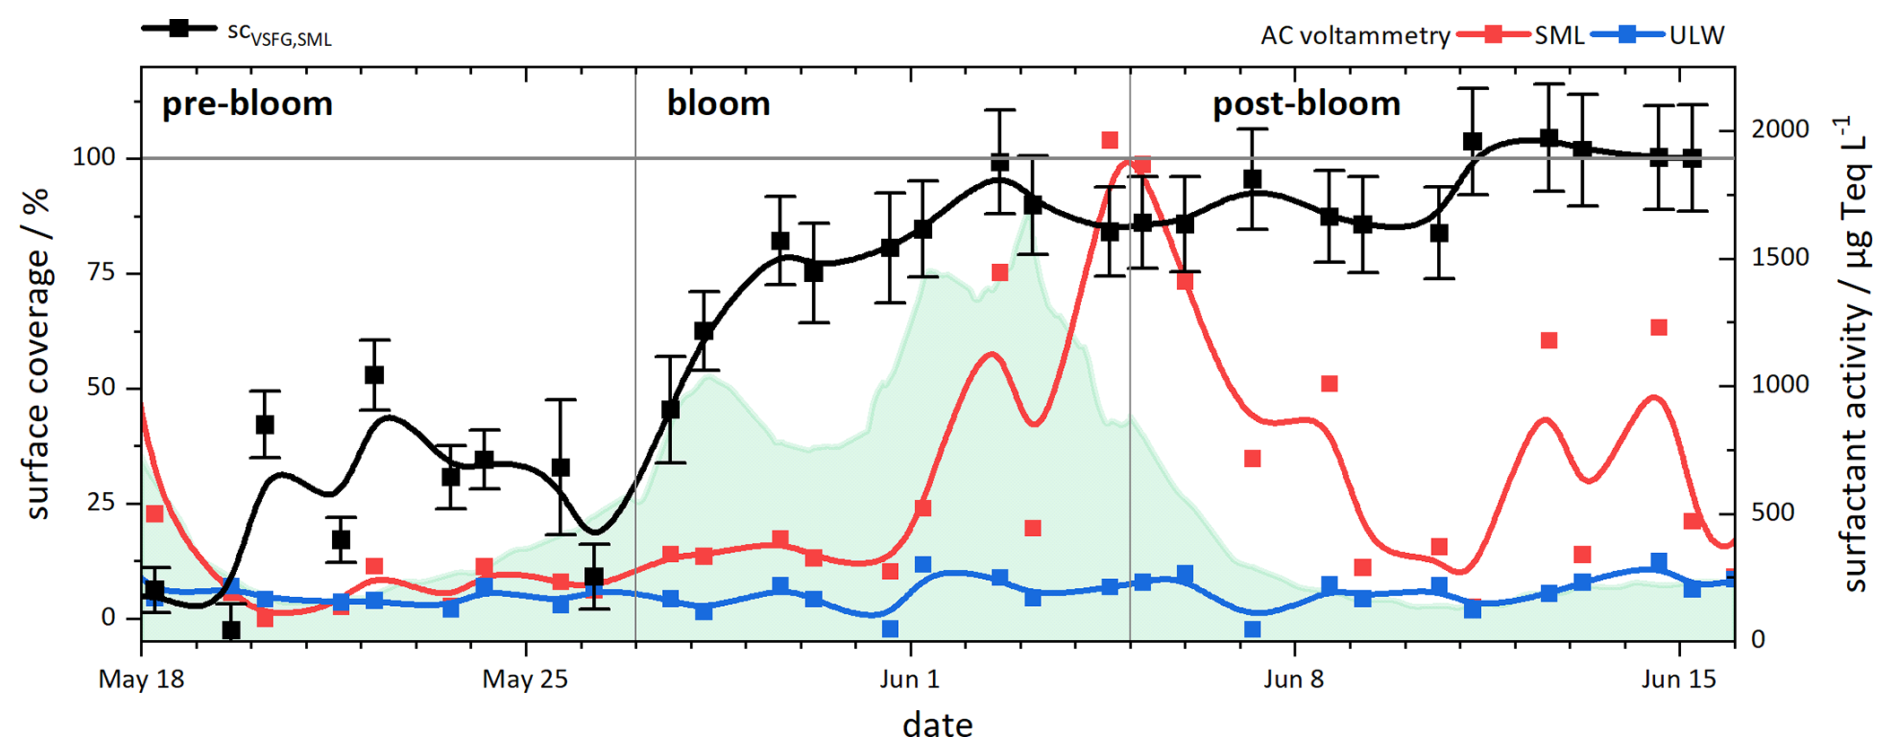
Figure 6Time series of the measured data (Bibi et al., 2025a, b) for surface coverage (SML, black dots), surfactant activity (SML, red; ULW, blue), and chl a (green shaded, linear scale with a peak value of 14.8 µg L−1. The solid curves are B-spline interpolations to guide the eye.
Initially, the surface coverage was very low (<10 %), as expected after the extensive cleaning of the surface prior to the start of the experiment. From 20–26 May, still in the pre-bloom phase, a slight increase in surface coverage can be observed, averaging 31 %. After the first nutrient addition on 26 May, a strong increase was observed, with surface coverage reaching values above 80 % within three days. For the remainder of the experiment, surface coverage remained high. The slight increase towards the end of the experiment is within the uncertainty limits, suggesting that the nanolayer quickly approached a saturation level, latest at the end of the bloom phase. The observed surfactant coverage trend is in surprisingly stark contrast with the surfactant activity data. Here, the ULW data show almost constant surfactant activity throughout the experiment, with mean values for the pre-bloom, bloom, and post-bloom phases of 174, 184, and 205 µg Teq L−1, respectively. In contrast, the SML surfactant activity increases substantially in response to the algal bloom. From the pre-bloom to early bloom phase, surfactant activity increases from roughly 200–400 µg Teq L−1, paralleling the rise in surface coverage observed up to 31 May. In the late bloom and post-bloom phases, SML surfactant activity reaches its maximum, peaking at about 2000 µg Teq L−1, with a few days delay compared to the chl a data. While surfactant activity decreases after this peak, it remains elevated, with most post-bloom measurements above 400 µg Teq L−1.
The surfactant data clearly reveal a bloom-induced enrichment of surfactants in the SML, either by effective ULW to SML transport or by enhanced formation in the SML slick acting as a biofilm-like habitat (Wurl et al., 2016). Indeed, Bibi et al. (2025b) reported that the SML was enriched in bacterial cells during the bloom phase, whereas bacterial abundance in the ULW remained relatively low, followed by higher abundance of bacterial cells during the post-bloom phase in both SML and ULW. Biosurfactants are formed, in particular, by microbial processing of organic matter Kurata et al. (2016), where the delay of the surfactant peak compared to chl a aligns well with the utilization of phytoplankton derived OM. Mismatches of surfactant abundance and primary productivity have been reported previously (Laß et al., 2013; Sabbaghzadeh et al., 2017) and are in line with surfactants originating from phytoplankton exudates or cellular lysis (Ẑutić et al., 1981). The decline in surfactant activity observed towards the end of the experiment is probably due to ongoing microbial activity or photochemical breakdown of surfactants. Light exposure remained consistently high in the later phase of the experiment, and the carbon utilization assay indicated that bacterial activities were increasingly targeting carbohydrates as substrates for respiration (Bibi et al., 2025b), suggesting a modification in the molecular composition of the available OM pool.
Overall, the direct comparison of the data clearly shows that surfactant activity and surfactant coverage serve as complementary sum parameters. Whereas surface activity is a measure of surfactant availability in the bulk SML, the surface coverage parameter sc provides direct information about the equilibrium of surfactants between the bulk SML and the nanolayer. For the OM pool present in this study, it is evident that already at surfactant activity values of 400 µg Teq L−1, the surface is almost completely covered with surface-active substances, at least in the non-disturbed equilibrium that was established under our laboratory conditions with resting water samples. Even the slight increase in surface activity at the beginning of the bloom phase around 27 May was sufficient to saturate the surface with surfactants. Until the end of the experiment, the surfactant activity did not fall significantly below this value again and the SML essentially represented a slick layer. Certainly, these persistent conditions can be ascribed to the fact that the experiment was carried out in the confined environment of a mesocosm pool. While the potential bias resulting from the accumulation of insoluble surfactants on the surface was mitigated by their selective removal during routine plate sampling, under open ocean conditions, wave motion and the extensive surface area would typically inhibit the establishment of persistent slicks.
However, the surfactant activities reported here are not out of the range. Even for open ocean conditions, typical values range from 100 to 600 µg Teq L−1 in SML samples (Sabbaghzadeh et al., 2017), and a general threshold value of 1000 µg Teq L−1 has been suggested for visible/strong slick events (Wurl et al., 2011). The latter is fully compatible with our threshold value of about 400 µg Teq L−1 indicating a completely (>80 %) surfactant covered surface. Data from a wind–wave tunnel experiment with natural sea water from Engel et al. (2026) have shown that surface coverages above this threshold correspond to conditions associated with strong reduction in the mean square slope of surface waves, whereas surface coverages below 50 % had an overall small effect. When applied to our dataset, this could indicate a pronounced shift between surfactant conditions which would induce low and high wave damping effects. While pre-bloom and ULW concentrations of 200 µg Teq L−1 may fall short of inducing wave damping, concentrations rapidly surpassing 400 µg Teq L−1 in the SML during the bloom phase could be very effective. This consideration suggests that even moderate increases in SML surfactant activity may disproportionately enhance surface coverage and wave damping effects (Mustaffa et al., 2020; Laxague et al., 2024), reinforcing the importance of including surfactant microlayer dynamics in future air–sea gas exchange parameterizations.
3.2.2 Helgoland Cruise
Our research focus of the Helgoland field campaign was to compare the magnitude of surface coverage values obtained from the mesocosm study with those from natural open ocean samples on the one hand, and to assess surface coverage differences under slick and non-slick conditions relative to the ULW on the other hand.
Figure 7a shows the surface coverage data for the three sample categories using a box-and-whisker plot. Corresponding single surface coverage and surfactant activity values are listed in Table S2 in the Supplement. The data resemble days where patches of slick events have been observed and samples could be classified as slick, non-slick and ULW according to visible or not visible wave attenuation. Although the overall linear correlation between surfactant activity and surface coverage was weak (R2=0.31, p=0.03), a clear trend in median surface coverages with 72 % (SML slick) >47 % (SML non-slick) >23 % ULW is evident. We attribute the wide 25 %–75 % interquartile ranges (IQR) at least partly to uncertainties arising from the somewhat subjective classification scheme for slick and non-slick conditions, but also to substantial natural variability, likely driven by fluctuations in wind, weather, oceanic fronts, and biological activity. The significantly lower ULW values are in line with expectation that surfactants are accumulated in the SML. Moreover, the comparison of surface coverage for ULW and SML (non-slick and slick samples) at comparable surfactant activities revealed a factor of about 2.5 higher surface coverages for the SML samples, suggesting that the surfactant pool in the SML may differ from that in the ULW. Further evidence of a changing molecular composition of the different samples is provided by VSFG spectral signatures. Whereas uniform spectra have been measured in the C−H wavenumber range 2800–3000 cm−1, a notable spectral feature was observed in the C=O stretch vibration range, which is typical for carbonyl groups (1650–1800 cm−1). Figure 7b compares averaged VSFG spectra from the ULW and SML (slick and non-slick) samples. The vibrational bands at 1720 and 1740 cm−1 can be assigned to aldehydes and ketones or ester and acid functional groups, respectively. The intensity of the spectra show the same trend as the surface coverage, , but the signal enhancement in the slick samples is much more pronounced than one would expect based on the surface coverage ratios alone. In principle, this could indicate enhanced photochemical or oxidative processing of SML surfactants in slicks, which has been reported in previous studies (Donaldson and George, 2012; Engel et al., 2017; Brüggemann et al., 2018; Jibaja Valderrama et al., 2026). However, the sensitivity of SFG with respect to molecular orientation effects (Eq. 1) may have lead to higher signal intensities in the dense organic monolayer of the slick samples as well.
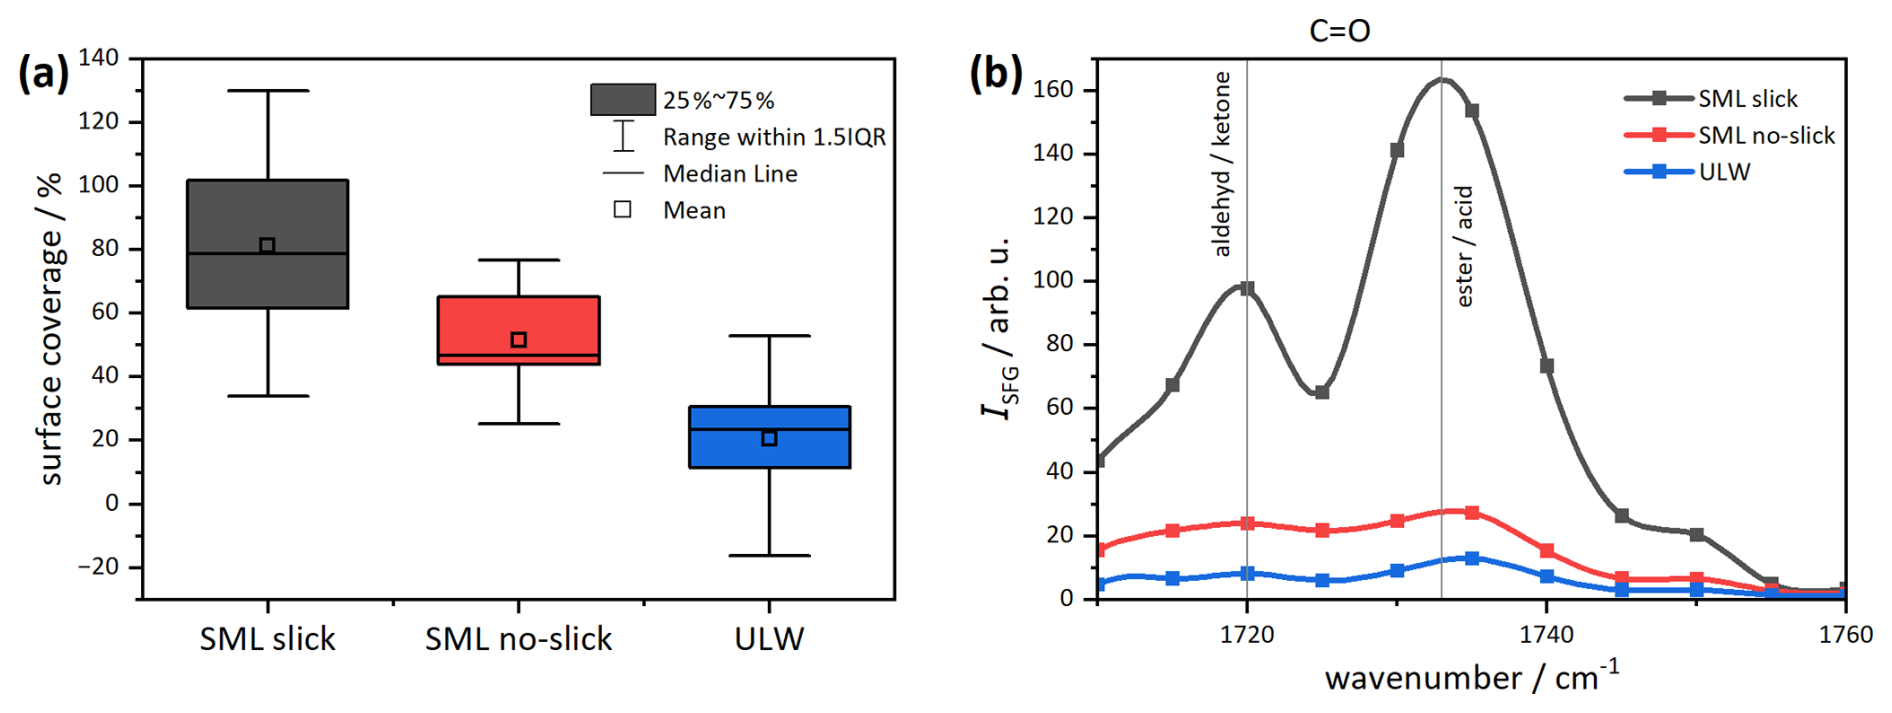
Figure 7(a) Box-and-whisker plot of surface coverage data for SML samples, categorized into slick (black) and non-slick (red) conditions. ULW samples collected during the same events are shown in blue. (b) Mean VSFG spectra in the carbonyl stretch vibrational range, indicating the presence of oxygen-rich compounds.
Overall, the observed surface coverage values are comparable to those obtained in the mesocosm experiment and the highest measured values are fully compatible with our definition of 100 % coverage, further supporting the validity of the chosen surface coverage reference point. Interestingly, even the non-slick samples exhibited relatively high surface coverages on average. Given that the distinction between slick and non-slick was made purely on visual grounds, this suggests that a significant, visible wave attenuation only occurs for essentially completely surfactant covered surfaces. The high values of the non-slick samples also raise the question of whether such high values could be normal under open sea conditions. To come closer to answering this question, we first need to establish a link between surface coverage and the easier accessible surfactant activity measure.
3.3 Surface coverage – surfactant activity correlation
Figure 8 provides an overview of all available SML measurements in which both surfactant activity and surfactant coverage were determined. The black symbols correspond to the data from the SURF mesocosm experiment and the red symbols to data from the Helgoland study. For the latter, only the SML data have been included to avoid a potential bias from altered surfactant composition of the ULW samples as outline above. Next to the data of this study, we could only reconstruct a few more data points from previous work. The two green triangles were derived from data in the dissertation of Lange (2021) who analyzed SML samples from the BalticGasEx cruises (Booge, 2018). A reanalysis of his cruise-averaged data using the new reference point for sc=100 % revealed rather low surface coverages of 36 % for research cruises in the southwestern Baltic Sea near the Boknis Eck time series station (54°31.2′ N, 10°02.5′ E) in June and September 2018. The corresponding surfactant activity data were adopted from Barthelmeß and Engel (2022), again as cruise averages of 300 and 350 µg Teq L−1. The blue triangle symbols were obtained from the results of a wind-wave tank experiment with seawater performed as part of a larger campaign at the Heidelberg “Aelotron” facility, conducted in November 2014 to investigate various air-sea exchange processes under controlled wind conditions (Engel et al., 2026). Missing surfactant activity data were recovered from Ribas-Ribas et al. (2018), but were only available for three common sampling days with measurements at low or high wind speed (6, 11, and 13 November in the aforementioned papers; average of reported data for or ). As both the BalticGasEx as well as the Aelotron data were obtained by combining data sets from two independent sources, they should be treated with some caution. However, the derived data fit well into the overall trend of the data compilation in Fig. 8.
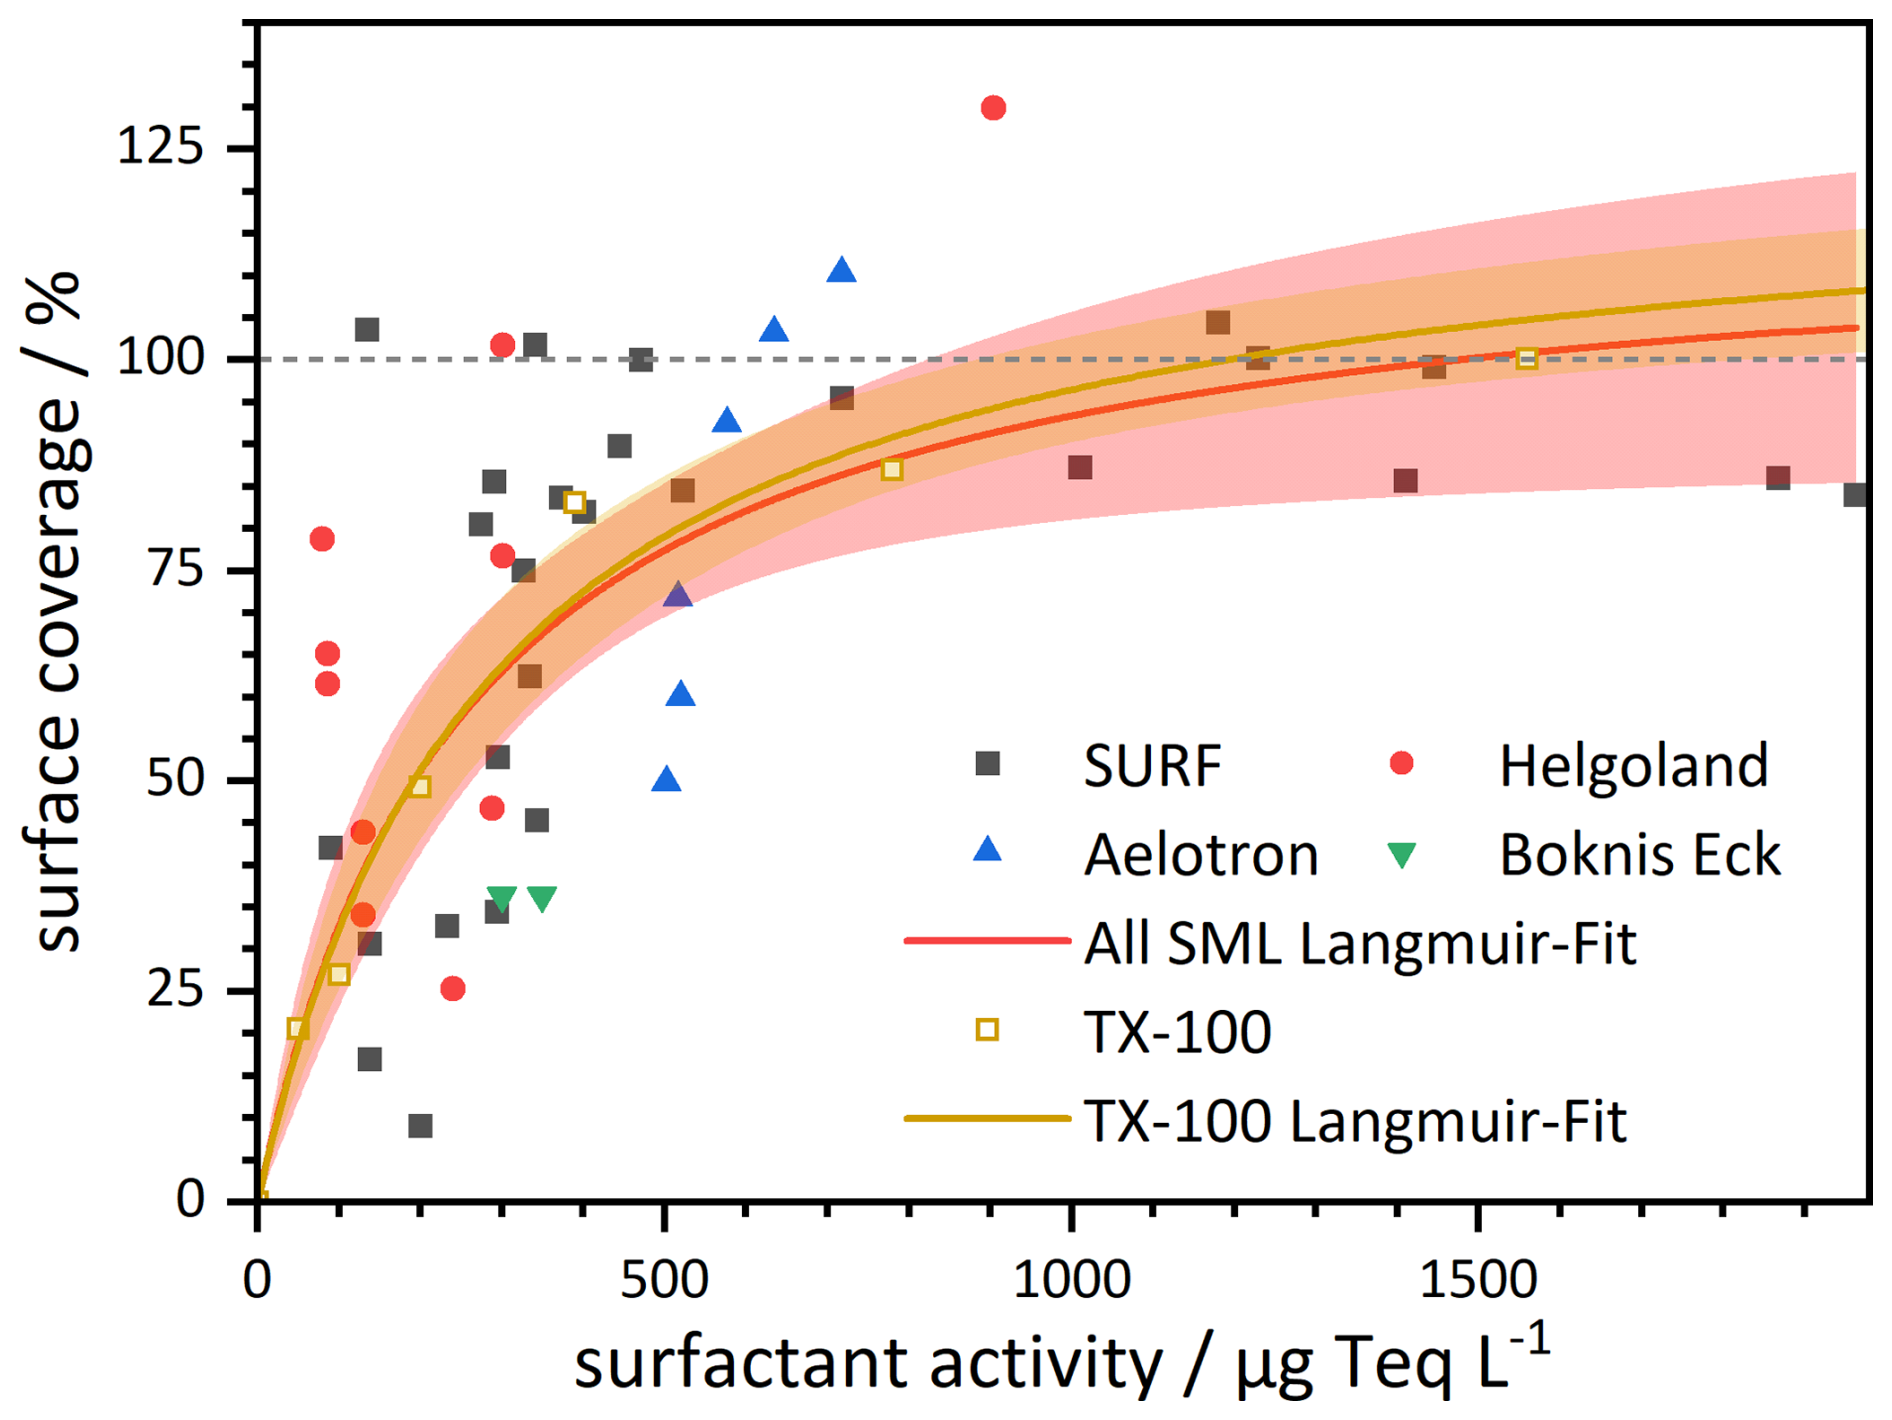
Figure 8Langmuir-type correlation between surface coverage and surfactant activity for SML samples from different experimental studies (filled symbol and red curve, see text); in comparison with data for a TX-100 salt water solution (open squares and dark yellow curve).
The data from the SURF mesocosm time series clearly suggest the presence of a saturation threshold and, except for one data point from the Helgoland study, the highest measured surfactant surface coverages are all on the order of sc=100 %. Therefore, despite the larger scatter at lower surface coverage, which is probably a result of natural variability of the surfactant pool in combination with the uncertainties of both the surfactant activity and surface coverage measurements, it is tempting to represent the data by assuming a Langmuir-type adsorption behavior of the SML surfactants. Surface coverage increases steeply up to about 70 % from 0–400 µg Teq L−1, and then gradually from 70 % to 100 % over the range of 400–2000 µg Teq L−1.
The resulting Langmuir fit according to Eq. (4) with the concentration c set equal to the TX-100 equivalent concentration cTeq from AC voltammetry yields a Langmuir constant of and a maximum surface coverage of ) (red curve). Here, the error limits (red-colored confidence band in Fig. 8) represents the 1σ fit uncertainty. In the simplest case, scmax=100 % would be expected, but the obtained slightly higher value is still in line with the concept of a saturable nanolayer and the chosen reference point for the surface coverage parameter. Note that the surface coverage approaches 100 % at a surfactant activity near 1500 µg Teq L−1, a value that certainly corresponds to a surface slick. We therefore consider the overall consistent results as a confirmation that the operationally defined surface coverage and its determination from VSFG data using Eq. (3) is indeed a suitable measure to characterize the surfactant coverage at the air-water interface of natural SML samples.
It turns out that the obtained Langmuir constant is fully consistent with the Langmuir constant obtained by fitting our TX-100 data. These are included in Fig. 8 as open squares, with the data point at 1500 µg Teq L−1 representing the chosen reference point for 100 % coverage. Surprisingly, the fitted Langmuir constant of and (dark yellow curve and confidence band) is identical with the SML derived values within error limits. We view this quantitative agreement as (i) evidence that the mean surface activity of surfactants within the SML, represented by surfactant activity and quantified through AC voltammetry, also characterizes the mean surface activity of the molecules at the interface. In addition, (ii) the assumption of a simple Langmuir adsorption model seems to be sufficient to describe the surface coverage resulting from the surfactant activity. Note that this interpretation does not contradict the fact that certain classes of surfactants (with higher surface activity and Langmuir constants) will preferentially accumulate at the interface. Rather, the overall surface-activity of the SML surfactants is apparently well captured by the measured surfactant activity value. Note again that the sum parameter surface activity does not specify the composition or concentration of a specific class of surfactants. More or less pronounced deviations from the simple Langmuir correlation are expected in cases where either insoluble substances contribute significantly to surface coverage (these would not be adequately captured by the surfactant activity measurement) or where pronounced cooperative effects occur, as the one described by Burrows et al. (2016) (e.g. strong co-adsorption of one surface-active substance induced by the presence of another surface-active substance at the interface). At this point, however, we consider it purely speculative whether the deviations and scatter seen in Fig. 8 could be partly attributable to such effects. Further research, based on experiments similar to those described here, are necessary to answer such questions.
3.4 Global surface coverage potential
With the necessary surfactant activity–surfactant coverage correlation at hand, this final section introduces a first step to expand the surface coverage concept as a predictor to assess the SML's impact on air-sea gas exchange on a global scale. Air-sea gas exchange can be substantially reduced by surfactant-induced damping of capillary and short gravity waves under low wind conditions () and still exert influence at moderate wind speeds (5–10 m s−1), but diminishes at higher wind speeds () where processes such as wave breaking, near-surface turbulence, and bubble-mediated transfer becomes dominant (Garbe et al., 2014). In the following, we are creating a highly simplified representation of surfactant surface coverage potential by using comprehensively averaged parameters. Future model implementations with improved spatial and temporal resolution will certainly need to account for the variability of the SML, which is closely linked to biogeochemical processes and physical forcing. Short-term fluctuations due to weather events, bloom dynamics, or episodic slick formation are not captured in our approach. While it is tempting to directly associate SML surfactants with biogeochemical processes and physical forcing, our initial methodology is straightforward by directly building on measured surfactant activities. This allows us to adopt our Langmuir-type correlation to construct maps of surfactant coverage potential. We are referring to surfactant coverage potential here, as we are assuming steady equilibrium of the SML surfactants with the interface. Most likely, this will only be the case at sufficiently calm conditions at low wind speed, as the integrity of the SML is lost at too high winds and its reformation is not instantaneous (Jessup et al., 2009).
Global surfactant activity data are adopted and constructed based on a study of Wurl et al. (2011). Aiming at a global mapping of sea-surface microlayer abundance, they categorized surfactant activity data from 337 SML samples collected at various geolocations. Average surfactant activity (SAS) values of 320±66, 502±107, and were determined for oligotrophic, mesotrophic and eutrophic zones based on primary productivity thresholds being below, in-between or above 0.4 and 1.2 , respectively. A wind speed dependence has only been considered by setting all regions with a monthly average wind speed above 10 m s−1 as free of SML. Even though Sabbaghzadeh et al. (2017) did not find a direct linear correlation between surfactant activity and either chl a or primary production on a daily timescale, we assume that primary production can still serve as a reasonably suitable first-level proxy for the formation of biosurfactant when averaging over longer time scales such as months or seasons. As such, we do not yet account for the temporal delay between primary production peaks and the subsequent formation of surfactants that has been reported in several studies (Ciglenečki et al., 2020; Laß et al., 2013; Gašparović and Ćosović, 2003) and that has been ascribed to (i) zooplankton grazing on phytoplankton, (ii) microbial transformation of organic matter, and (iii) the release of substances due to broken cells or excretion. These biological processes are complex, nonlinear, and subject to regional variability (Sabbaghzadeh et al., 2017; Barthelmeß et al., 2021; Barthelmeß and Engel, 2022; Penezić et al., 2022).
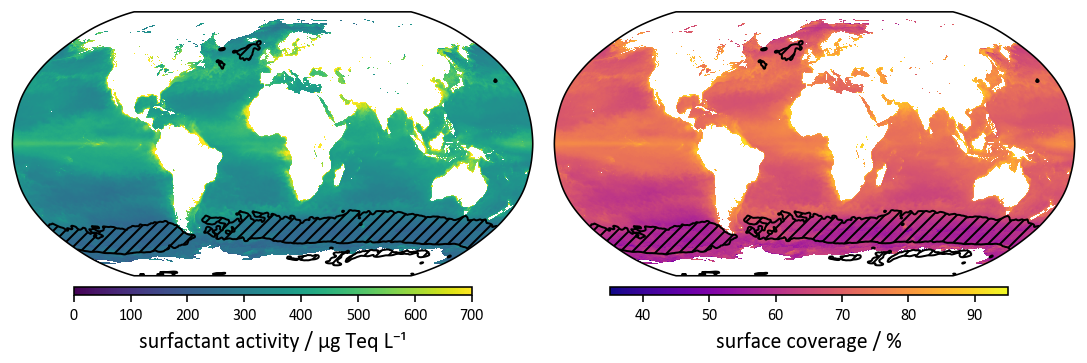
Figure 9Predicted global surfactant activity and surface coverage potential under calm conditions for the Northern Hemisphere spring season (March, April, May) based on a correlation of year 2024 primary productivity data and surfactant activity, combined with a Langmuir-type correlation between surfactant activity and surface coverage as derived in this work. The shaded areas highlight regions with a mean wind speed above 10 m s−1.
To derive global maps with continuously varying surfactant coverages, we have interpolated the three surfactant activity values from Wurl et al. (2011) as follows (a more detailed description can be found in Sect. S4 in the Supplement): Monthly averaged primary productivity (PP) data were taken from the E.U. Copernicus Marine Service Information (Copernicus Marine Service, 2024a, c). This dataset is based on satellite-derived data of chl a, photosynthetically active radiation (PAR), sea surface temperature, and a photosynthetic efficiency parameter to estimate depth-integrated primary production using the Vertically Generalized Production Model (VGPM) (Behrenfeld and Falkowski, 1997; Copernicus Marine Service, 2024b). Year-average PP values across the respective trophic zones were assigned to the three corresponding surfactant activity values, which were then fitted using a modified logistic saturation function with intercept (see Fig. S5 in the Supplement) and to fully cover the range of measured surfactant activity values. The resulting PP-SAS correlation was used in combination with the SAS-sc Langmuir saturation function (Eq. 4) to calculate global surfactant coverage values. Aiming at a first rough estimate of the upper limit for surfactant coverage, certainly important factors such as wind speed dependence and the expected temperature dependence of the Langmuir equilibrium constant, have not been implemented yet.
Figure 9 illustrate the resulting global maps of both surface activity (left) and surface coverage potential (right) for the season of March, April and May. Surfactant coverage values span the range from 30 % to about 90 %, where the lower limit of 30 % is simply set by the assumed minimum possible surfactant activity (104 µg Teq L−1, corresponding to the lowest measured value in Wurl et al., 2011) as a result of the PP-SAS fit. The shaded areas mark regions where the mean wind speed is above 10 m s−1 and the neglect of wind may lead to higher uncertainties. Corresponding plots highlighting the seasonal trends across the full year are provided in Figs. S6 and S7 in the Supplement. As expected, the overall observed global pattern follow the well-known primary productivity trends (Wurl et al., 2011), which will therefore not be further discussed in detail here. Within the scope of this study, it is more important to note that the comparison of the SAS and sc maps reveals a reduced overall contrast for surfactant coverage, hence partly even out the disparities between the three trophic zones. This is a result of the saturation behavior of nanolayer surfactants. Note that even the less productive oligotrophic zones exhibit an average surface coverage potential around 40 %. The thresholds for mesotrophic and eutrophic zones with surfactant activities of 400 and 610 µg Teq L−1 already correspond to potential surface coverages of 73 % and 83 %, respectively. Such high surface coverage values have shown to induce strong capillary wave damping effects up to wind speed of about 6 m s−1, whereas values well below 50 % indicated a significantly reduced effect (Engel et al., 2026). A corresponding plot of wind-wave tank data adopted from the work of Engel et al. (2026) is provided in Sect. S5 in the Supplement as Fig. S8 in the Supplement. Here, the observed mean square slope of the waves (as a measure of water surface roughness) vs. wind speed clearly illustrates both the surface coverage and wind speed dependent influence of surfactants on the wave field. Assuming that the surface tension reduction from SML-biosurfactants dominates the wave damping effect, both in meso- and oligotrophic zones biosurfactants in the SML hold high potential to serve as a decisive factor for modulating air-sea exchange processes. It is the seemingly narrow interval of PP values from 0 to in oligotrophic regions where surface coverage sensitivity is highest and surface coverage potential switches from low to almost complete surfactant coverage. This first conclusion highlights the need to account for surfactants and, in particular, for their saturation-like behavior. Even at surfactant activities commonly found in open ocean environments, a significant effect on air-sea gas exchange may arise at low wind speeds, in accordance with gas transfer reduction data reported for the western Pacific by Mustaffa et al. (2020).
By focusing on surface coverage and the related surface tension effect, our approach to estimate the role of SML surfactants goes in a very similar direction to the conceptional modeling framework proposed by Elliott et al. (2018) These authors tried to bridge the gap from marine biographies of proteins and lipids to a global biogeography of surface tension. Here, the abundance of proteins and lipids served as proxies for the two main biosurfactant classes and their partitioning to the interface was modeled by a power-Langmuir model. The latter was used to account for the pronounced difference in the surface pressure isotherms of soluble and insoluble surfactants (as highlighted in our Figs. 4 and 5). Elliott et al. identified so-called “surfactomes”, i.e. biogeochemical provinces with similar surfactant characteristics. In-line with our findings, in the remote central ocean at middle-latitudes the estimated surface pressure effects diminish and a band of lowered surface pressure should be observable in the North Pacific and Atlantic. We also predict high surfactant coverages for the equatorial regions. Although the model of Elliott et al. is a comparatively detailed model, the authors clearly state the numerous assumptions, approximations, and omissions still made, including the neglect of vertical gradients. Consequently, factors such as the influence of wind and the SML related enrichment of biosurfactants have not been explicitly incorporated into their modeling. Combining our surfactant activity-surface coverage parametrization with the outcome of meta-analytical approaches such as the one recently published by Silva et al. (2026) to assess compound class specific enrichment in the SML may pave the way to further refine such models and to upscale SML effects on air-sea exchange in the future. Such efforts should also investigate the role of different biogeochemical provinces, as variable biosurfactant compositions could definitively challenge the uniform SAS-sc correlation as the one outlined in this work in Fig. 8.
VSFG spectroscopy provides molecular-level information on nanometer scale for molecules located directly at the air-water interface (the so-called nanolayer), whereas AC voltammetry captures the overall surfactant activity in surface water samples, typically representing the micrometer to millimeter SML scale. In this study, we have investigated two model surfactants TX-100 (wet, soluble) and DPPC (dry, insoluble) to establish suitable laboratory proxy compounds as a reference for quantification of the surfactant surface coverage of natural SML samples. Based on a detailed analysis of the dependence of VSFG spectral intensity and surface tension reduction on the surface concentration, we placed the already previously used surfactant surface coverage parameter sc on a solid physicochemical basis. Conceptually, sc=0 % corresponds to a surfactant-free water surface and sc=100 % reflects the behavior associated with a fully covered monolayer of the model substances in their liquid-expanded 2D phase state. Reference concentrations and corresponding surface pressures are:
Our new and previous data for natural SML samples, spanning the range of wind wave tank experiment over a mesoscosm study to field campaigns, revealed that the proposed surfactant coverage parameter yields a consistent description of surfactant-covered natural water interfaces.
For example, the algal bloom in the SURF mesocosm experiment clearly showed that the nanolayer can quickly reach a saturation state, even though total surfactant concentrations (in terms of surfactant activity) in the bulk SML continued to increase. Putting all data together, a first empirical Langmuir-type correlation could be established to link measured surfactant activity with surfactant coverage, according to:
Clearly, the current database remains limited in scope and the question remains to what extend the proposed correlation is sensitive to the chemical composition of natural surfactants that can vary considerably depending on ecosystem type, biological productivity, and degradation pathways. Although the VSFG spectra of natural sea surface microlayer samples appear remarkably consistent across all our experiments, an extended dataset is required to verify the robustness of the surface coverage–surfactant activity correlation under more diverse environmental conditions.
Nevertheless, we provided a first-level estimate of global surfactant coverage potential, revealing that typical surfactant activities in mesotrophic and eutrophic zones yield potential surface coverage values high enough to induce strong capillary wave damping. As such, surfactants and the related surface tension reduction going along with high surfactant coverage may indeed significantly modulate air-sea exchange processes, in particular at lower wind-speeds where common air-sea gas exchange parameterizations struggle to capture the observed variability of reported air-sea gas transfer coefficients in natural marine systems. Future systematic investigations into the spatial and temporal variability of sea surface microlayer composition, as well as potential influences on surface coverage, are necessary to fully assess the applicability and limitations of our surfactant coverage approach. Although much work needs to be done, this study lays a solid foundation to continue research in this direction.
All surfactant activity and surface coverage data are provided in Tables S1 and S2 in the Supplement, for the SURF mesocosms they are also integrated into the PANGAEA dataset (https://doi.org/10.1594/PANGAEA.984101, Bibi et al., 2025a). Original VSFG spectra and tensiometry data are available from the authors upon reasonable request.
The supplement related to this article is available online at https://doi.org/10.5194/bg-23-3159-2026-supplement.
FAS has been responsible for investigation, methodology, formal analysis, data curation, and visualization. MRR acquired funding, investigated, and validated data. OW acquired funding and was responsible for project administration and resources. GF conceptualized the research, provided methodology, supervised the project, and acquired funds. FAS wrote the original draft and all authors were involved in reviewing, editing, and finalizing the manuscript.
The contact author has declared that none of the authors has any competing interests.
Publisher's note: Copernicus Publications remains neutral with regard to jurisdictional claims made in the text, published maps, institutional affiliations, or any other geographical representation in this paper. The authors bear the ultimate responsibility for providing appropriate place names. Views expressed in the text are those of the authors and do not necessarily reflect the views of the publisher.
This article is part of the special issue “Biogeochemical processes and Air–sea exchange in the Sea-Surface microlayer (BG/OS inter-journal SI)”. It is not associated with a conference.
This research was part of the research unit DFG-FOR 5267 “Biogeochemical processes and Air–sea exchange in the Sea-Surface microlayer (BASS)”, in particular of the subproject SP 1.4 “Chemical and photochemical transformation of organic matter” in collaboration with SP 2.3 “Dynamics of convection linking the seasurface microlayer (SML) with the bulk phase” and SP 1.5 “Molecular characterization of dissolved organic matter in the sea surface microlayer (SML) and its influence on the inorganic carbon cycle”. We thank the whole BASS research team participating the SURF mesocosm and Helgoland (RV Heincke, HE644) field studies, in particular Edgar Fernando Cortés Espinoza, Jasper Zöbelein and Olenka Jibaja Valderrama for handling the SML samples, as well as Mike Novak for providing chlorophyll a and Carola Lehners for making available surface activity data. This work has been motivated by stimulating initial results reported in the PhD thesis of Florian Lange, and we thank him for providing original data from the Baltic GasEx research cruises (FS Alkor, AL510 and AL516) for re-analysis. Minor grammatical and spelling corrections were made with the assistance of ChatGPT/TextGPT (OpenAI) and DeepL. The authors reviewed all edits, and no scientific content was generated by these tools.
This research has been supported by the Deutsche Forschungsgemeinschaft (grant no. 451574234).
This paper was edited by Peter S. Liss and reviewed by two anonymous referees.
Adamson, A. W. and Gast, A. P.: Physical Chemistry of Surfaces, John Wiley and Sons, Nashville, TN, 6th edn., ISBN 978-0-471-14873-9, 1997. a
Adenaya, A., Haack, M., Stolle, C., Wurl, O., and Ribas-Ribas, M.: Effects of natural and artificial surfactants on diffusive boundary dynamics and oxygen exchanges across the air–water interface, Oceans, 2, 752–771, https://doi.org/10.3390/oceans2040043, 2021. a
Asher, W.: The sea-surface microlayer and its effect on global air-sea gas transfer, in: Sea Surface and Global Change, edited by: Liss, P. S. and Duce, R. A., Cambridge Univ. Press, New York, https://doi.org/10.1017/CBO9780511525025.009, 1997. a
Asher, W. E.: The Role of Surfactants in Air-Sea Exchange, Elsevier, https://doi.org/10.1016/b978-0-12-409548-9.10883-8, 49–58, 2019. a, b
Barthelmeß, T. and Engel, A.: How biogenic polymers control surfactant dynamics in the surface microlayer: insights from a coastal Baltic Sea study, Biogeosciences, 19, 4965–4992, https://doi.org/10.5194/bg-19-4965-2022, 2022. a, b, c
Barthelmeß, T., Schütte, F., and Engel, A.: Variability of the sea surface microlayer across a filament's edge and potential influences on gas exchange, Frontiers in Marine Science, 8, https://doi.org/10.3389/fmars.2021.718384, 2021. a
Behrenfeld, M. J. and Falkowski, P. G.: A consumer's guide to phytoplankton primary productivity models, Limnol. Oceanogr., 42, 1479–1491, https://doi.org/10.4319/lo.1997.42.7.1479, 1997. a
Bell, G. R., Bain, C. D., and Ward, R. N.: Sum-frequency vibrational spectroscopy of soluble surfactants at the air/water interface, J. Chem. Soc. Faraday T., 92, 515–523, https://doi.org/10.1039/FT9969200515, 1996. a
Bibi, R., Ribas-Ribas, M., Jaeger, L., Lehners, C., Gassen, L., Cortés, E. F., Wollschläger, J., Thölen, C., Waska, H., Zöbelein, J., Brinkhoff, T., Athale, I., Röttgers, R., Novak, M., Engel, A., Barthelmeß, T., Karnatz, J., Reinthaler, T., Spriahailo, D., Friedrichs, G., Schäfer, F., and Wurl, O.: Physical, chemical, and biogeochemical parameters from a mesocosm experiment at the Sea Surface Facility (SURF), Wilhelmshaven, Germany, spring 2023, PANGAEA [data set], https://doi.org/10.1594/PANGAEA.984101, 2025a. a, b, c
Bibi, R., Ribas-Ribas, M., Jaeger, L., Lehners, C., Gassen, L., Cortés-Espinoza, E. F., Wollschläger, J., Thölen, C., Waska, H., Zöbelein, J., Brinkhoff, T., Athale, I., Röttgers, R., Novak, M., Engel, A., Barthelmeß, T., Karnatz, J., Reinthaler, T., Spriahailo, D., Friedrichs, G., Schäfer, F. A., and Wurl, O.: Biogeochemical dynamics of the sea-surface microlayer in a multidisciplinary mesocosm study, Biogeosciences, 22, 7563–7589, https://doi.org/10.5194/bg-22-7563-2025, 2025b. a, b, c, d, e, f, g, h
Bock, E. J., Hara, T., Frew, N. M., and McGillis, W. R.: Relationship between air sea gas transfer and short wind waves, J. Geophys. Res.-Oceans, 104, 25821–25831, https://doi.org/10.1029/1999jc900200, 1999. a
Booge, D.: FS Alkor Cruise Reports: AL510 and AL 516, Tech. rep., GEOMAR Helmholtz-Zentrum für Ozeanforschung, Kiel, https://doi.org/10.3289/CR_AL510, 2018. a
Broecker, H.-C., Petermann, J., and Siems, W.: The influence of wind on CO2-exchange in a wind-wave tunnel, including the effects of monolayers, J. Mar. Res., 36, 595–610, 1978. a
Brüggemann, M., Hayeck, N., and George, C. E.: Interfacial photochemistry at the ocean surface is a global source of organic vapors and aerosols, Nat. Commun., 9, 2101, https://doi.org/10.1038/s41467-018-04528-7, 2018. a, b
Buck, M. and Himmelhaus, M.: Vibrational spectroscopy of interfaces by infrared–visible sum frequency generation, J. Vac. Sci. Technol. A, 2717–2736, https://doi.org/10.1116/1.1414120, 2001. a, b
Burrows, S. M., Gobrogge, E., Fu, L., Link, K., Elliott, S. M., Wang, H., and Walker, R.: OCEANFILMS 2: representing coadsorption of saccharides in marine films and potential impacts on modeled marine aerosol chemistry, Geophys. Res. Lett., 43, 8306–8313, https://doi.org/10.1002/2016gl069070, 2016. a, b, c
Ciglenečki, I., Vilibić, I., Dautović, J., Vojvodić, V., Ćosović, B., Zemunik, P., Dunić, N., and Mihanović, H.: Dissolved organic carbon and surface active substances in the northern Adriatic Sea: long-term trends, variability and drivers, Sci. Total Environ., 730, 139104/1–14, https://doi.org/10.1016/j.scitotenv.2020.139104, 2020. a
Copernicus Marine Service: Global Ocean Colour (Copernicus-GlobColour), Bio-Geo-Chemical, L4 (monthly and interpolated) from Satellite Observations (1997-ongoing), Tech. rep., https://doi.org/10.48670/moi-00281, 2024a. a
Copernicus Marine Service: Product User Manual For Ocean Colour Products: Global Ocean Colour (Copernicus-GlobColour), Bio-Geo-Chemical, L4 (monthly and interpolated) from Satellite Observations (1997-ongoing), Tech. rep., https://doi.org/10.48670/moi-00281, 2024b. a
Copernicus Marine Service: Global Ocean Monthly Mean Sea Surface Wind and Stress from Scatterometer and Model, Tech. rep., https://doi.org/10.48670/moi-00181, 2024c. a
Ćosović, B. and Vojvodić, V.: The application of ac polarography to the determination of surface-active substances in seawater, Limnol. Oceanogr., 27, 361–369, https://doi.org/10.4319/lo.1982.27.2.0361, 1982. a, b
Ćosović, B. and Vojvodic, V.: Direct determination of surface active substances in natural waters, Mar. Chem., 22, 363–373, https://doi.org/10.1016/0304-4203(87)90020-x, 1987. a
Ćosović, B. and Vojvodić, V.: Voltammetric analysis of surface active substances in natural seawater, Electroanalysis, 10, 429–434, https://doi.org/10.1002/(SICI)1521-4109(199805)10:6<429::AID-ELAN429>3.0.CO;2-7, 1998. a, b
Cunliffe, M. and Wurl, O.: Guide to best practices to study the ocean's surface, Occasional Publications of the Marine Biological Association of the United Kingdom, Plymouth, UK, https://doi.org/10.25607/OBP-1512, 2014. a
Cunliffe, M., Engel, A., Frka, S., Gašparović, B., Guitart, C., Murrell, J. C., Salter, M., Stolle, C., Upstill-Goddard, R., and Wurl, O.: Sea surface microlayers: a unified physicochemical and biological perspective of the air–ocean interface, Prog. Oceanogr., 109, 104–116, https://doi.org/10.1016/j.pocean.2012.08.004, 2013. a
Donaldson, D. J. and George, C.: Sea-surface chemistry and its impact on the marine boundary layer, Environ. Sci. Technol., 46, 10385–10389, https://doi.org/10.1021/es301651m, 2012. a
Ebben, C. J., Ault, A. P., Ruppel, M. J., Ryder, O. S., Bertram, T. H., Grassian, V. H., Prather, K. A., and Geiger, F. M.: Size-resolved sea spray aerosol particles studied by vibrational sum frequency generation, J. Phys. Chem. A, 117, 6589–6601, https://doi.org/10.1021/jp401957k, 2013. a
Elliott, S., Burrows, S., Cameron-Smith, P., Hoffman, F., Hunke, E., Jeffery, N., Liu, Y., Maltrud, M., Menzo, Z., Ogunro, O., Van Roekel, L., Wang, S., Brunke, M., Jin, M., Letscher, R., Meskhidze, N., Russell, L., Simpson, I., Stokes, D., and Wingenter, O.: Does marine surface tension have global biogeography? Addition for the OCEANFILMS package, Atmosphere-Basel, 9, 216, https://doi.org/10.3390/atmos9060216, 2018. a, b, c, d
Engel, A. and Galgani, L.: The organic sea-surface microlayer in the upwelling region off the coast of Peru and potential implications for air–sea exchange processes, Biogeosciences, 13, 989–1007, https://doi.org/10.5194/bg-13-989-2016, 2016. a
Engel, A., Bange, H. W., Cunliffe, M., Burrows, S. M., Friedrichs, G., Galgani, L., Herrmann, H., Hertkorn, N., Johnson, M., Liss, P. S., Quinn, P. K., Schartau, M., Soloviev, A., Stolle, C., Upstill-Goddard, R. C., van Pinxteren, M., and Zäncker, B.: The ocean's vital skin: toward an integrated understanding of the sea surface microlayer, Frontiers in Marine Science, 4, https://doi.org/10.3389/fmars.2017.00165, 2017. a, b, c, d
Engel, A., Sperling, M., Sun, C., Grosse, J., and Friedrichs, G.: Organic matter in the surface microlayer: insights from a wind wave channel experiment, Frontiers in Marine Science, 5, https://doi.org/10.3389/fmars.2018.00182, 2018. a, b, c
Engel, A., Friedrichs, G., Krall, K. E., and Jähne, B.: Wind-induced collapse of the biopolymeric surface microlayer induces sudden changes in sea surface roughness, Biogeosciences, 23, 2101–2117, https://doi.org/10.5194/bg-23-2101-2026, 2026. a, b, c, d, e
Fainerman, V., Lylyk, S., Aksenenko, E., Makievski, A., Petkov, J., Yorke, J., and Miller, R.: Adsorption layer characteristics of Triton surfactants, Colloids Surface A, 334, 1–7, https://doi.org/10.1016/j.colsurfa.2008.09.015, 2009. a
Feng, R.-J., Li, X., Zhang, Z., Lu, Z., and Guo, Y.: Spectral assignment and orientational analysis in a vibrational sum frequency generation study of DPPC monolayers at the air/water interface, J. Chem. Phys., 145, 244707, https://doi.org/10.1063/1.4972564, 2016. a, b
Frew, N. M.: The role of organic films in air–sea exchange, in: Sea Surface and Global Change, edited by: Liss, P. S. and Duce, R. A., Cambridge Univ. Press, New York, https://doi.org/10.1017/CBO9780511525025.006, 121–172, 1997. a
Frew, N. M., Bock, E. J., McGillis, W. R., Karachintsev, A. V., Hara, T., Münsterer, T., and Jähne, B.: Variation of air–water gas transfer with wind stress and surface viscoelasticity. 3rd Intern. Symp. on Air-Water Gas Transfer, Heidelberg, Germany, https://doi.org/10.5281/zenodo.10405, 1995. a, b, c
Garbe, C. S., Rutgersson, A., Boutin, J., de Leeuw, G., Delille, B., Fairall, C. W., Gruber, N., Hare, J., Ho, D. T., Johnson, M. T., Nightingale, P. D., Pettersson, H., Piskozub, J., Sahlée, E., Tsai, W.-t., Ward, B., Woolf, D. K., and Zappa, C. J.: Transfer Across the Air-Sea Interface, Springer Berlin Heidelberg, Berlin, Heidelberg, https://doi.org/10.1007/978-3-642-25643-1_2, 55–112, 2014. a
Gašparović, B. and Ćosović, B.: Surface-active properties of organic matter in the North Adriatic Sea, Estuar. Coast. Shelf S., 58, 555–566, https://doi.org/10.1016/S0272-7714(03)00133-1, 2003. a
Geiger, F. M.: Second harmonic generation, sum frequency generation, and χ(3): dissecting environmental interfaces with a nonlinear optical Swiss army knife, Annu. Rev. Phys. Chem., 60, 61–83, https://doi.org/10.1146/annurev.physchem.59.032607.093651, 2009. a, b
Hosseinpour, S., Roeters, S. J., Bonn, M., Peukert, W., Woutersen, S., and Weidner, T.: Structure and dynamics of interfacial peptides and proteins from vibrational sum-frequency generation spectroscopy, Chem. Rev., 120, 3420–3465, https://doi.org/10.1021/acs.chemrev.9b00410, 2020. a, b
Janczuk, B., Bruque, J. M., Gonzalez-Martin, M. L., and Dorado-Calasanz, C.: The adsorption of Triton X-100 at the air-aqueous solution interface, Langmuir, 11, 4515–4518, https://doi.org/10.1021/la00011a055, 1995. a
Jessup, A. T., Asher, W. E., Atmane, M., Phadnis, K., Zappa, C. J., and Loewen, M. R.: Evidence for complete and partial surface renewal at an air-water interface, Geophys. Res. Lett., 36, https://doi.org/10.1029/2009GL038986, 2009. a
Jibaja Valderrama, O., Scheres Firak, D., Schaefer, T., van Pinxteren, M., Fomba, K. W., and Herrmann, H.: Photochemistry of the sea-surface microlayer (SML) influenced by a phytoplankton bloom: a mesocosm study, Biogeosciences, 23, 1965–1985, https://doi.org/10.5194/bg-23-1965-2026, 2026. a, b
Jubb, A. M., Hua, W., and Allen, H. C.: Environmental chemistry at vapor/water interfaces: insights from vibrational sum frequency generation spectroscopy, Annu. Rev. Phys. Chem., 63, 107–130, https://doi.org/10.1146/annurev-physchem-032511-143811, 2012. a, b, c
Jähne, B. and Haußecker, H.: Air-water gas exchange, Annu. Rev. Fluid Mech., 30, 443–468, https://doi.org/10.1146/annurev.fluid.30.1.443, 1998. a
Kleber, J., Laß, K., and Friedrichs, G.: Quantitative time-resolved vibrational sum frequency generation spectroscopy as a tool for thin film kinetic studies: new insights into oleic acid monolayer oxidation, J. Phys. Chem. A, 117, 7863–7875, https://doi.org/10.1021/jp404087s, 2013. a
Kurata, N., Vella, K., Hamilton, B., Shivji, M., Soloviev, A., Matt, S., Tartar, A., and Perrie, W.: Surfactant-associated bacteria in the near-surface layer of the ocean, Sci. Rep.-UK, 6, https://doi.org/10.1038/srep19123, 2016. a
Lambert, A. G., Davies, P. B., and and, D. J. N.: Implementing the theory of sum frequency generation vibrational spectroscopy: a tutorial review, Appl. Spectrosc. Rev., 40, 103–145, https://doi.org/10.1081/ASR-200038326, 2005. a, b, c
Lange, F.-D.: Investigation of Sea Surface Nanolayer Properties and Photochemistry Using Modern Laser Spectroscopic and Surface Analytical Techniques, PhD thesis, Kiel University, Kiel, Germany, https://nbn-resolving.org/urn:nbn:de:gbv:8:3-2021-00564-5 (last acccess: 20 April 2026), 2021. a
Laß, K. and Friedrichs, G.: Revealing structural properties of the marine nanolayer from vibrational sum frequency generation spectra, J. Geophys. Res.-Oceans, 116, C08042/1–15, https://doi.org/10.1029/2010JC006609, 2011. a, b, c, d
Laß, K., Kleber, J., and Friedrichs, G.: Vibrational sum-frequency generation as a probe for composition, chemical reactivity, and film formation dynamics of the sea surface nanolayer, Limnol. Oceanogr.-Meth., 8, 216–228, https://doi.org/10.4319/lom.2010.8.216, 2010. a, b, c, d
Laß, K., Bange, H. W., and Friedrichs, G.: Seasonal signatures in SFG vibrational spectra of the sea surface nanolayer at Boknis Eck Time Series Station (SW Baltic Sea), Biogeosciences, 10, 5325–5334, https://doi.org/10.5194/bg-10-5325-2013, 2013. a, b, c, d
Laxague, N. J. M., Zappa, C. J., Soumya, S., and Wurl, O.: The suppression of ocean waves by biogenic slicks, J. R. Soc. Interface, 21, 20240385, https://doi.org/10.1098/rsif.2024.0385, 2024. a, b, c
Lin, S., McKeigue, K., and Maldarelli, C.: Diffusion controlled surfactant adsorption studied by pendant drop digitization, AIChE J., 36, 1785–1795, https://doi.org/10.1002/aic.690361202, 1990. a, b
Ma, G. and Allen, H. C.: DPPC Langmuir monolayer at the air-water interface: probing the tail and head groups by vibrational sum frequency generation spectroscopy, Langmuir, 22, 5341–5349, https://doi.org/10.1021/la0535227, 2006. a, b, c, d
Mesarchaki, E., Kräuter, C., Krall, K. E., Bopp, M., Helleis, F., Williams, J., and Jähne, B.: Measuring air–sea gas-exchange velocities in a large-scale annular wind–wave tank, Ocean Sci., 11, 121–138, https://doi.org/10.5194/os-11-121-2015, 2015. a, b
Mustaffa, N. I. H., Ribas-Ribas, M., Banko-Kubis, H. M., and Wurl, O.: Global reduction of in situ CO2 transfer velocity by natural surfactants in the sea-surface microlayer, P. Roy. Soc. A-Math. Phy., 476, 20190763, https://doi.org/10.1098/rspa.2019.0763, 2020. a, b, c, d
Novak, G. A. and Bertram, T. H.: Reactive VOC production from photochemical and heterogeneous reactions occurring at the air–ocean interface, Acc. Chem. Res., 53, 1014–1023, https://doi.org/10.1021/acs.accounts.0c00095, 2020. a
Parra, J. G., Iza, P., Dominguez, H., Schott, E., and Zarate, X.: Effect of Triton X-100 surfactant on the interfacial activity of ionic surfactants SDS, CTAB and SDBS at the air/water interface: a study using molecular dynamic simulations, Colloids Surface A, 603, 125284, https://doi.org/10.1016/j.colsurfa.2020.125284, 2020. a
Penezić, A., Drozdowska, V., Novak, T., and Gašparović, B.: Distribution and characterization of organic matter within the sea surface microlayer in the Gulf of Gdańsk, Oceanologia, 64, 631–650, https://doi.org/10.1016/j.oceano.2022.05.003, 2022. a
Rauch, C., Deyle, L., Jaeger, L., Cortés-Espinoza, E. F., Ribas-Ribas, M., Karnatz, J., Engel, A., and Wurl, O.: Phytoplankton blooms affect microscale differences of oxygen and temperature across the sea surface microlayer, Ocean Sci., 22, 403–426, https://doi.org/10.5194/os-22-403-2026, 2026. a
Ribas-Ribas, M., Helleis, F., Rahlff, J., and Wurl, O.: Air-sea CO2-exchange in a large annular wind-wave tank and the effects of surfactants, Frontiers in Marine Science, 5, 457/1–16, https://doi.org/10.3389/fmars.2018.00457, 2018. a, b, c
Rickard, P. C., Uher, G., Upstill-Goddard, R. C., Frka, S., Mustaffa, N. I. H., Banko-Kubis, H. M., Cvitešić Kušan, A., Gašparović, B., Stolle, C., Wurl, O., and Ribas-Ribas, M.: Reconsideration of seawater surfactant activity analysis based on an inter-laboratory comparison study, Mar. Chem., 208, 103–111, https://doi.org/10.1016/j.marchem.2018.11.012, 2019. a
Saak, C.-M. and Backus, E. H. G.: The role of sum-frequency generation spectroscopy in understanding on-surface reactions and dynamics in atmospheric model-systems, J. Phys. Chem. Lett., 15, 4546–4559, https://doi.org/10.1021/acs.jpclett.4c00392, 2024. a
Sabbaghzadeh, B., Upstill-Goddard, R. C., Beale, R., Pereira, R., and Nightingale, P. D.: The Atlantic Ocean surface microlayer from 50°N to 50°S is ubiquitously enriched in surfactants at wind speeds up to 13 m/s, Geophys. Res. Lett., 44, 2852–2858, https://doi.org/10.1002/2017GL072988, 2017. a, b, c, d
Salter, M. E., Upstill-Goddard, R. C., Nightingale, P. D., Archer, S. D., Blomquist, B., Ho, D. T., Huebert, B., Schlosser, P., and Yang, M.: Impact of an artificial surfactant release on air-sea gas fluxes during Deep Ocean Gas Exchange Experiment II, J. Geophys. Res.-Oceans, 116, C11016/1–9, https://doi.org/10.1029/2011JC007023, 2011. a
Silva, A., Nikzad, S., Barthelmeß, T., Engel, A., Herrmann, H., van Pinxteren, M., Wirtz, K., Wurl, O., and Schartau, M.: Meta-analytical insights into organic matter enrichment in the surface microlayer, Biogeosciences, 23, 1697–1718, https://doi.org/10.5194/bg-23-1697-2026, 2026. a
Thölen, C., Wollschläger, J., Novak, M. G., Röttgers, R., and Zielinski, O.: Colored and Fluorescent DOM in the Sea-Surface Microlayer: Response to a Phytoplankton Bloom and Photodegradation in a Mesocosm Study, EGUsphere [preprint], https://doi.org/10.5194/egusphere-2025-5350, 2026. a
Wang, H.-F., Gan, W., Lu, R., Rao, Y., and Wu, B.-H.: Quantitative spectral and orientational analysis in surface sum frequency generation vibrational spectroscopy (SFG-VS), Int. Rev. Phys. Chem., 24, 191–256, https://doi.org/10.1080/01442350500225894, 2005. a, b
Wanninkhof, R., Asher, W. E., Ho, D. T., Sweeney, C., and McGillis, W. R.: Advances in quantifying air-sea gas exchange and environmental forcing, Annu. Rev. Mar. Sci., 1, 213–244, https://doi.org/10.1146/annurev.marine.010908.163742, 2009. a
Wurl, O., Wurl, E., Miller, L., Johnson, K., and Vagle, S.: Formation and global distribution of sea-surface microlayers, Biogeosciences, 8, 121–135, https://doi.org/10.5194/bg-8-121-2011, 2011. a, b, c, d, e, f, g, h, i
Wurl, O., Stolle, C., Van Thuoc, C., The Thu, P., and Mari, X.: Biofilm-like properties of the sea surface and predicted effects on air–sea CO2 exchange, Prog. Oceanogr., 144, 15–24, https://doi.org/10.1016/j.pocean.2016.03.002, 2016. a
Wurl, O., Ekau, W., Landing, W. M., and Zappa, C. J.: Sea surface microlayer in a changing ocean – a perspective, Elementa: Science of the Anthropocene, 5, 31, https://doi.org/10.1525/elementa.228, 2017. a
Wurl, O., Gassen, L., Badewien, T. H., Braun, A., Emig, S., Holthusen, L. A., Lehners, C., Meyerjürgens, J., and Ribas, M. R.: HALOBATES: an autonomous surface vehicle for high-resolution mapping of the sea surface microlayer and near-surface layer on essential climate variables, J. Atmos. Ocean. Tech., 41, 1197–1211, https://doi.org/10.1175/JTECH-D-24-0021.1, 2024. a
Zöbelein, J., Sawle, S., Friedrichs, G., Ribas-Ribas, M., Lehners, C., Paetz, K., Pflaum, M., and Waska, H.: Buoyancy and polarity driven accumulation of dissolved organic matter in the sea surface microlayer during a phytoplankton bloom, EGUsphere [preprint], https://doi.org/10.5194/egusphere-2025-6563, 2026. a
Zuo, Y. Y., Chen, R., Wang, X., Yang, J., Policova, Z., and Neumann, A. W.: Phase transitions in dipalmitoylphosphatidylcholine monolayers, Langmuir, 32, 8501–8506, https://doi.org/10.1021/acs.langmuir.6b01482, 2016. a
Ẑutić, V., Ćosović, B., Marčenko, E., Bihari, N., and Kršinić, F.: Surfactant production by marine phytoplankton, Mar. Chem., 10, 505–520, https://doi.org/10.1016/0304-4203(81)90004-9, 1981. a