the Creative Commons Attribution 4.0 License.
the Creative Commons Attribution 4.0 License.
 | 08 May 2026
Complexity in biogeochemical models: consequences for the biological carbon pump
Jonathan Rogerson
Alessandro Tagliabue
Agathe Nguyen
Marcello Vichi
Lewis Wrightson
Prima Anugerahanti
Olivier Aumont
Marion Gehlen
Ocean biogeochemical models underpin projections of future marine ecosystem change, including anticipated shifts in the biological carbon pump (BCP) and broader biogeochemical cycles. However, their outputs remain highly sensitive to model complexity and parameterisation choices. Here, we evaluate five configurations of the Pelagic Interaction Scheme for Carbon and Ecosystem Studies (PISCES) to quantify intramodel variability in net primary productivity (NPP), carbon export (Cexp), and export efficiency (e-ratio) over the 21st century under the high emissions RCP8.5 scenario. The tested PISCES configurations differed from the standard model through distinct modifications to phytoplankton growth processes, but are forced by identical physical variables, representing an ensemble opportunity. All configurations resolve NPP and Cexp within the range of remote-sensing variability. The more complex Quota-based configurations produce 15–21 (10–18) Pg C yr−1 more NPP than the simpler Monod-quota models in the reference (future) period, but this increase, driven by elevated small phytoplankton biomass, does not enhance Cexp, yielding lower e-ratios (0.14–0.17) than in the Monod-quota configurations (∼0.25). The introduction of a picophytoplankton functional type (PFT) emerges as one of the most influential parameterisation choices. It drives opposing future NPP responses between 30–60° N/S, an increase in the Monod-quota configurations versus a decline in the Quota-based ones, as well as contrasting latitudinal trends in Cexp within the same region. Other parameterisations, such as a low-iron scheme, an added diazotroph PFT, and explicit manganese cycling, exert more modest, regionally confined effects under high emissions scenarios, influencing NPP and Cexp primarily at biome scales rather than driving large-scale divergence in model behaviour.
- Article
(2462 KB) - Full-text XML
-
Supplement
(6360 KB) - BibTeX
- EndNote


The biological carbon pump (BCP) plays a critical role in regulating Earth's climate by facilitating the vertical transport of carbon from the surface to the deep ocean, thereby helping to remove atmospheric CO2 on centennial to millennial timescales (Falkowski et al., 1998, 2000; Buesseler et al., 2007; Visser, 2025). Since pre-industrial times (∼280 ppm), global atmospheric CO2 concentrations have risen by 51 %, reaching 419 ppm as of 2023 (Friedlingstein et al., 2023). This increase has contributed to a ∼1.5 °C rise in average global surface temperatures, with the previous decade (2014–2024) marking the warmest on record (Ripple et al., 2024; WMO, 2025). The ocean has absorbed 20 %–30 % of anthropogenic CO2 emissions since the mid-1980s (Sabine et al., 2004; Bindoff et al., 2019), equivalent to 2.1–2.4 Pg C yr−1 (DeVries et al., 2023). Stand-alone ocean model studies suggest that, at equilibrium, BCP-mediated processes result in baseline atmospheric CO2 concentrations being 150–200 ppm lower than they would be otherwise in their absence (Maier-Reimer et al., 1996; Falkowski et al., 2000). A fully interactive Earth System Model (ESM) refines this estimate, showing a 163 ppm increase in pre-industrial CO2 when marine ecosystems are removed (Tjiputra et al., 2025). The BCP therefore represents a substantial ecosystem service, valued at USD 0.8–1.1 trillion per year globally (Berzaghi et al., 2025). Understanding how the biological processes that underpin the BCP, and its efficiency, will respond to climate change remains an important and active area of research (Jin et al., 2020).
Through air–sea gas exchange, atmospheric CO2 dissolves into the surface ocean, increasing the dissolved inorganic carbon (DIC) pool. In the ocean, this DIC is absorbed and sequestered through two mechanisms, the solubility pump and BCP. The solubility pump is driven by the combination of thermodynamic and physical processes that slowly transport DIC from the surface ocean into the interior via mode and deep water formation. It is the dominant mechanism for the uptake and transport of anthropogenic CO2 from the surface ocean to below the mixed layer (Bindoff et al., 2019). The BCP further facilitates this vertical transport of carbon through the export of particulate organic carbon (POC), synthesised via phytoplankton net primary productivity (NPP) in the sunlit surface ocean. The subsequent sinking and export (Cexp) of POC out of the euphotic zone and into the deep ocean (>1000 m) contributes to the long-term removal of carbon on timescales of hundreds to thousands of years (Falkowski et al., 1998, 2000; Buesseler et al., 2007; Visser, 2025). Phytoplankton photosynthesis lowers the partial pressure of CO2 in the surface ocean while export production sustains the vertical gradients in DIC necessary to promote the absorption of CO2 from the atmosphere. Therefore, the BCP emerges as a critical, climate-relevant pathway in the ocean's role as a long-term carbon sink (Falkowski et al., 2000; Sigman and Boyle, 2000).
In the upper ocean, most of the produced POC is rapidly remineralised, with only a small fraction (∼20 %) being exported below 100 m (Falkowski et al., 2000; Laws et al., 2000; Ducklow et al., 2001; Henson et al., 2012; Siegel et al., 2014; Nowicki et al., 2022). The efficiency of the BCP, commonly denoted as the e-ratio (), principally determines how much fixed carbon is exported from the surface ocean to depth, indirectly influencing the long-term sequestration of atmospheric CO2. A consensus emerging from multi-model intercomparison studies is that global warming will lead to higher sea surface temperatures (SSTs), increased stratification, and reduced oxygen solubility by the end of the 21st century (Steinacher et al., 2010; Bopp et al., 2013; Bindoff et al., 2019; Kwiatkowski et al., 2020). In response to these changing physical environmental conditions, marine ecosystems and phytoplankton community composition (Bopp et al., 2005; Basu and Mackey, 2018; Tréguer et al., 2018; Benedetti et al., 2021; Henson et al., 2021; Frémont et al., 2022; Fisher et al., 2025) are expected to be impacted, which will have consequences for ocean productivity and export production.
Capturing the complexity of the BCP remains a major challenge in ESMs (Doney et al. 2024). Across successive generations of Coupled Model Intercomparison Project(s) (CMIP), there is substantial intermodel variability in projected 21st century NPP and Cexp (Bopp et al., 2013; Laufkötter et al., 2015, 2016; Kwiatkowski et al., 2020; Tagliabue et al., 2021; Wilson et al., 2022), reflecting large differences in how models represent key biogeochemical processes and marine ecosystem complexity (Séférian et al., 2020; Henson et al., 2022). Under the high-emissions SSP5-8.5 scenario, CMIP6 models project that export production will change by −41 % to +1.8 % by the end of the 21st century relative to the pre-industrial period (Henson et al., 2022) and relative to present-day (1995–2014) conditions, global NPP is projected to decline by 1.76 %, with a model standard deviation of 9.01 % (Tagliabue et al., 2021). Furthermore, future declines in NPP could likely be underestimated within the CMIP6 ensemble, considering their contemporary trends relative to remote-sensing (Ryan-Keogh et al., 2025).
Within the CMIP ensemble, a wide range of biogeochemical models is represented (e.g. BEC – Moore et al., 2001, 2004; BFM – Vichi et al., 2007; PISCES – Aumont et al., 2015; REcoM2 – Hauck et al., 2013; TOPAZ – Dunne et al., 2012), each differing in its complexity and parameterisation of key biogeochemical processes. Although model intercomparison projects have provided valuable insights into the global BCP, it remains unclear how differences in these biogeochemical parameterisations, and complexity thereof, contribute to the divergence among CMIP models in their projections of the BCP over the 21st century. Most model intercomparison studies evaluate different architectures against common criteria to identify model shortcomings and ensemble-wide patterns (Fennel et al., 2022). However, pinpointing sources of divergence and the role of individual parameterisations is challenging within this context. An alternative is to compare different parameterisations within the same biogeochemical model under identical physical forcing, enabling variability arising solely from biogeochemical differences to be isolated.
This study employs the PISCES ocean biogeochemical model (Aumont et al., 2015) in a suite of distinct configurations under high emissions RCP8.5 scenario to isolate how differences in biogeochemical parameterisations and complexity drive variability in the BCP over the 21st century. The methodology details the various PISCES configurations and their nuances while the results are presented in two parts. In the first, we compare present-day PISCES outputs with remote-sensing data to evaluate whether variations in biogeochemical parameterisations and complexity lead to discernible differences in NPP and export production at global and biome scales. The second examines how these variables evolve between present/reference (1986–2005) and future (2091–2100) projections, highlighting how differences in top-down processes propagate through NPP and Cexp. Ultimately, the study identifies key biogeochemical parameterisations that strongly shape ecosystem dynamics, driving differences in NPP and export production, and contributing to intramodel variability in projections of the BCP.
2.1 PISCES configurations
Table 1 presents a summary of the five PISCES configurations used in this study, which differ primarily in their parameterisation of phytoplankton growth processes. The standard PISCES (PST) model of Aumont et al. (2015) served as the foundation for all configurations. The PST model simulates the lower trophic levels of marine ecosystems and resolves the biogeochemical cycles of carbon and the main nutrients of P, N, Si and Fe. The model has four living compartments, two phytoplankton functional types (PFTs; diatoms and nanophytoplankton) and two zooplankton size classes (microzooplankton and mesozooplankton). Particulate detritus, produced through phytoplankton–zooplankton–nutrient interactions, is partitioned into small and large particles. Both size classes arise from multiple processes, including zooplankton grazing, phytoplankton and zooplankton mortality, and aggregation. However, their dominant sources differ as small particles are primarily linked to nanophytoplankton–microzooplankton interactions, whereas large particles are mainly associated with those of diatom-mesozooplankton. The PST model employs a hybrid of Monod-quota formulations in representing the cycling of major nutrients. Phytoplankton C : N : P stoichiometry is fixed, with N and P limitations governed by a Monod parameterisation. As a result, growth rates follow a rectangular hyperbolic function of the limiting external nutrient concentration (Monod, 1949; Flynn, 2003). In contrast, Fe limitation is represented with a quota-based approach (Aumont et al., 2015), where growth depends on the internal nutrient quota of a cell, which itself is regulated by the external nutrient concentration (Droop, 1968).
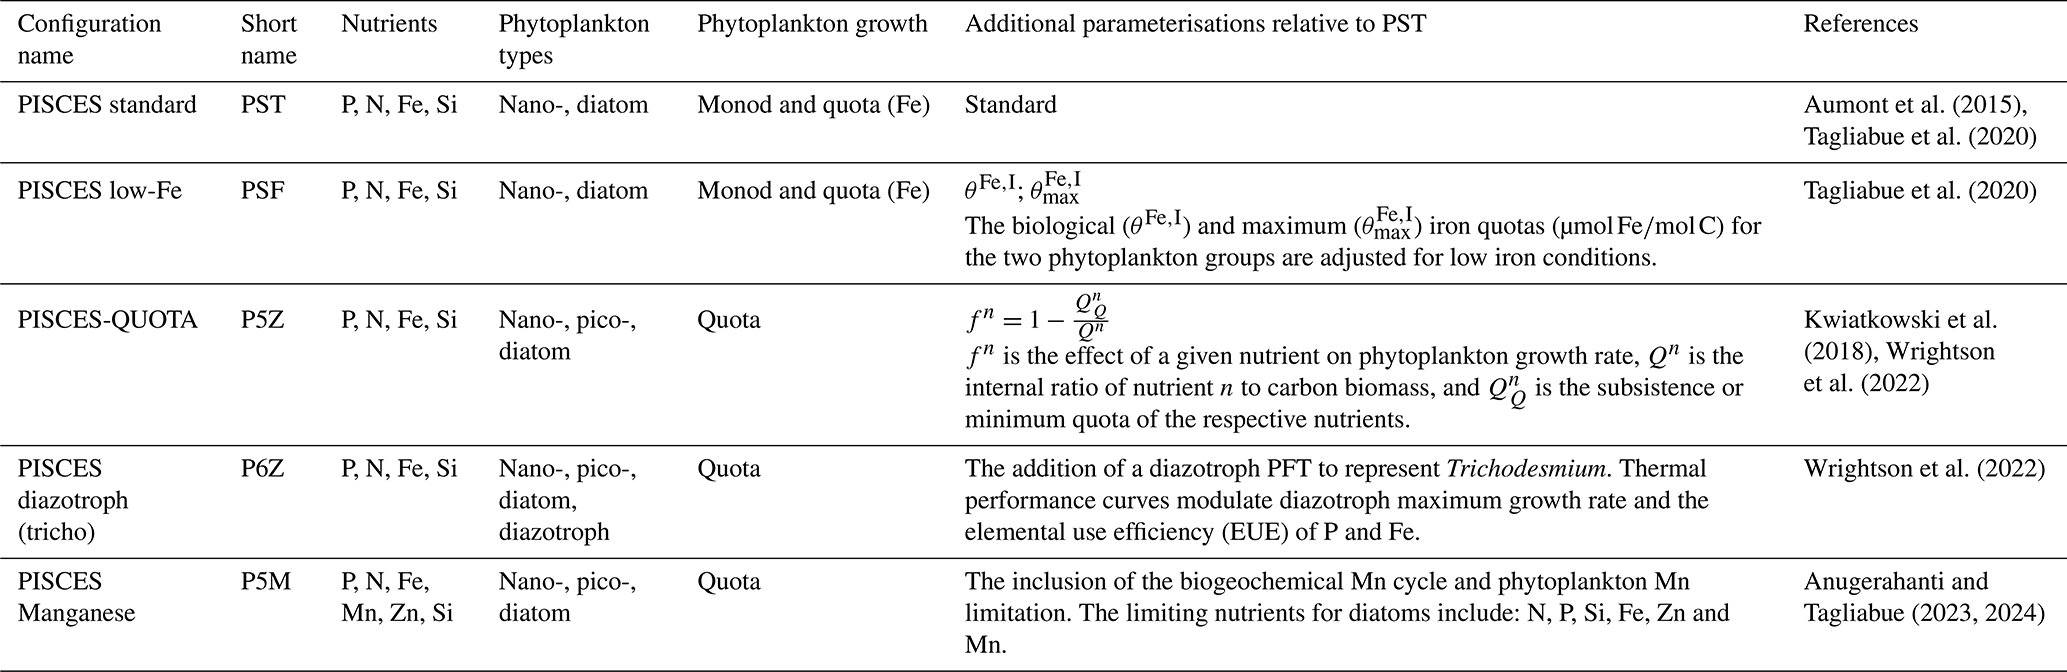
The PST and low-Fe PISCES (PSF) configurations are those described in Tagliabue et al. (2020). The PSF configuration modified PST by adjusting biological and maximum iron quotas for phytoplankton growth to better reflect low-iron conditions and their implications under climate change. Iron availability plays a key role in regulating phytoplankton growth and global NPP (Tagliabue et al., 2017); however, ESMs often show large uncertainties in representing the ocean iron cycle and its effect on productivity (Tagliabue et al., 2016). Unlike PST and PSF, the PISCES-QUOTA (P5Z) model allows for variable C : N : P stoichiometry (Kwiatkowski et al., 2018), with growth exclusively governed by quota-based formulations (Table 1). P5Z resolves 39 prognostic variables, compared to 24 in PST, and importantly includes three phytoplankton groups: picophytoplankton, nanophytoplankton, and diatoms.
Wrightson et al. (2022) further developed the model by introducing an explicit diazotroph PFT (Crocosphaera and Trichodesmium), along with temperature-dependent nutrient uptake parameterised via elemental use efficiencies (EUEs), resulting in the P6Z configuration. These additions addressed a key limitation in P5Z, which represented nitrogen fixation as an implicit flux of ammonia, preventing mechanistic investigation of diazotroph dynamics. Given that marine nitrogen fixation plays a critical role in shaping the response of NPP to climate change (Wrightson and Tagliabue, 2020; Bopp et al., 2022), explicitly resolving diazotrophs in P6Z allowed responses to environmental drivers, especially rising ocean temperatures, to be investigated. Preliminary work conducted in this study showed little difference in global Cexp or NPP patterns across the various P6Z versions in Wrightson et al. (2022). Therefore, in this study, we used only the configuration that included temperature dependent EUEs for Fe and P for the generic N-fixing PFT (Table 1).
Anugerahanti and Tagliabue (2024) built upon the base P5Z model by incorporating manganese (Mn), following Hawco et al. (2022), which included its role in limiting phytoplankton productivity in the Southern Ocean, where observations show Mn as either a primary or co-limiting micronutrient alongside Fe (Wu et al., 2019; Browning et al., 2021; Hawco et al., 2022). The resulting P5M configuration explicitly simulates coupled Mn and zinc (Zn) cycles (Richon and Tagliabue, 2021), including biological uptake, scavenging, and regeneration for Mn and Zn.
The various PISCES configurations (Table 1) were identically forced with physical outputs from the IPSL-CM5A-LR (https://doi.org/10.1594/WDCC/CMIP5.IPILr8) climate model on the ORCA tripolar grid with 2° horizontal spatial resolution. Two model runs were conducted for each configuration. The first simulation was forced by outputs derived from historical (1851–2005) climate forcing and the second with the high emission Representative Concentration Pathway 8.5 (RCP8.5) scenario (2006–2100). For this study, we conducted our analysis of the BCP using averaged model outputs over two time windows, the “reference” (1986–2005) and “future” (2091–2100).
2.2 Remote-sensing products
The five PISCES configurations were assessed for the reference period against an ensemble of satellite-derived NPP and Cexp products, averaged over 1998–2005. This period was chosen to align with the model simulations while accommodating the earliest availability of satellite observations. Although the averaging periods differ between the model outputs and remote-sensing products, the use of multi-year means reduces the influence of interannual variability and allows for a consistent comparison of large-scale patterns. Model outputs and remote-sensing products were compared globally as well as across RECCAP2 biomes (Fig. S1 in the Supplement) by ocean basin (Fay and McKinley, 2014; Doney et al., 2024).
Several algorithms have been described to estimate primary production based on ocean-colour remote-sensing observations, each differing in complexity and formulation and exhibiting substantial variability across regions such as the subtropical gyres and the Southern Ocean (Ryan-Keogh et al., 2023a; Westberry et al., 2023). Common algorithms include the: Vertically Generalised Production Model (VPGM), Carbon-based Production Model (CbPM), and Carbon Absorption Fluorescence Euphotic-resolving (CAFE) model. This study used six different NPP datasets (Fig. S2), all of which are derived from ESA Ocean Colour Climate Change Initiative (OC-CCI) remotely-sensed chlorophyll concentrations (Sathyendranath et al., 2019). Five were from the regular 25 km gridded NPP datasets at 8 d resolution of Ryan-Keogh et al. (2023a), who considered the Eppley-VGPM (Eppley, 1972), Behrenfeld-VGPM (Behrenfeld and Falkowski, 1997), Behrenfeld-CbPM (Behrenfeld et al., 2005), Westberry-CbPM (Westberry et al., 2008), and the Silsbe-CAFE model (Silsbe et al., 2016). The sixth NPP dataset was the 9 km monthly resolution product from the Biological Pump and Carbon Exchange Processes (BICEP) project (Kulk et al., 2020, 2021) which used a modified version of the base algorithm of Longhurst et al. (1995).
Similar to NPP, a number of algorithms exist to compute Cexp from remotely-sensed observations (Jönsson et al., 2023). Export production can be related to NPP through a simple scaling factor (Eppley and Peterson, 1979) or include multiple relationships, such as mixed-layer depth (MLD), chlorophyll and SST (Jönsson et al., 2023). For simplicity, we restricted our analysis to export algorithms that estimate Cexp from empirical relationships between NPP and SST. We applied five commonly used formulations (Fig. S3 and Table S1 in the Supplement): Laws et al. (2000), Henson et al. (2011), two equations from Laws et al. (2011), and Li and Cassar (2016). These algorithms have been evaluated against in situ observations (e.g. Dunne et al., 2005; Mouw et al., 2016; Bisson et al., 2018), with reported skill scores of (Li and Cassar, 2016; Jönsson et al., 2023). It is important to note that they estimate export at different depth horizons such as Henson et al. (2011) at 100 m and Li and Cassar (2016) at the climatological MLD, meaning biases in subtropical gyres and polar regions may differ slightly across algorithms. We used SST from the 0.05° Operational Sea Surface Temperature and Sea Ice Analysis (OSTIA) product, which is a Level 4 product that combines multi-sensor satellite and in situ data (Good et al., 2020). From the daily fields for 1998–2005, monthly SST averages were computed for OSTIA. Thereafter, Cexp was computed using the five algorithms applied to the monthly SST and six NPP fields (interpolated to the 2° model grid), resulting in 30 individual Cexp estimates. For each algorithm, outputs from the six datasets were then averaged to produce a single representative Cexp field, yielding five ensemble algorithm outputs (Fig. S3).
3.1 Model and remote-sensing variability
At both the global (Table 2) and biome scales (Fig. 1), differences in the complexity of phytoplankton processes and parameterisations (Table 1) among the five PISCES configurations leads to substantial intramodel variability in both the reference and future states (Figs. 2 and 3), particularly for NPP. For the reference period (Table 2), the coefficient of variation (CV) for global NPP across the five configurations is ∼20 %, indicating substantial divergence among models.
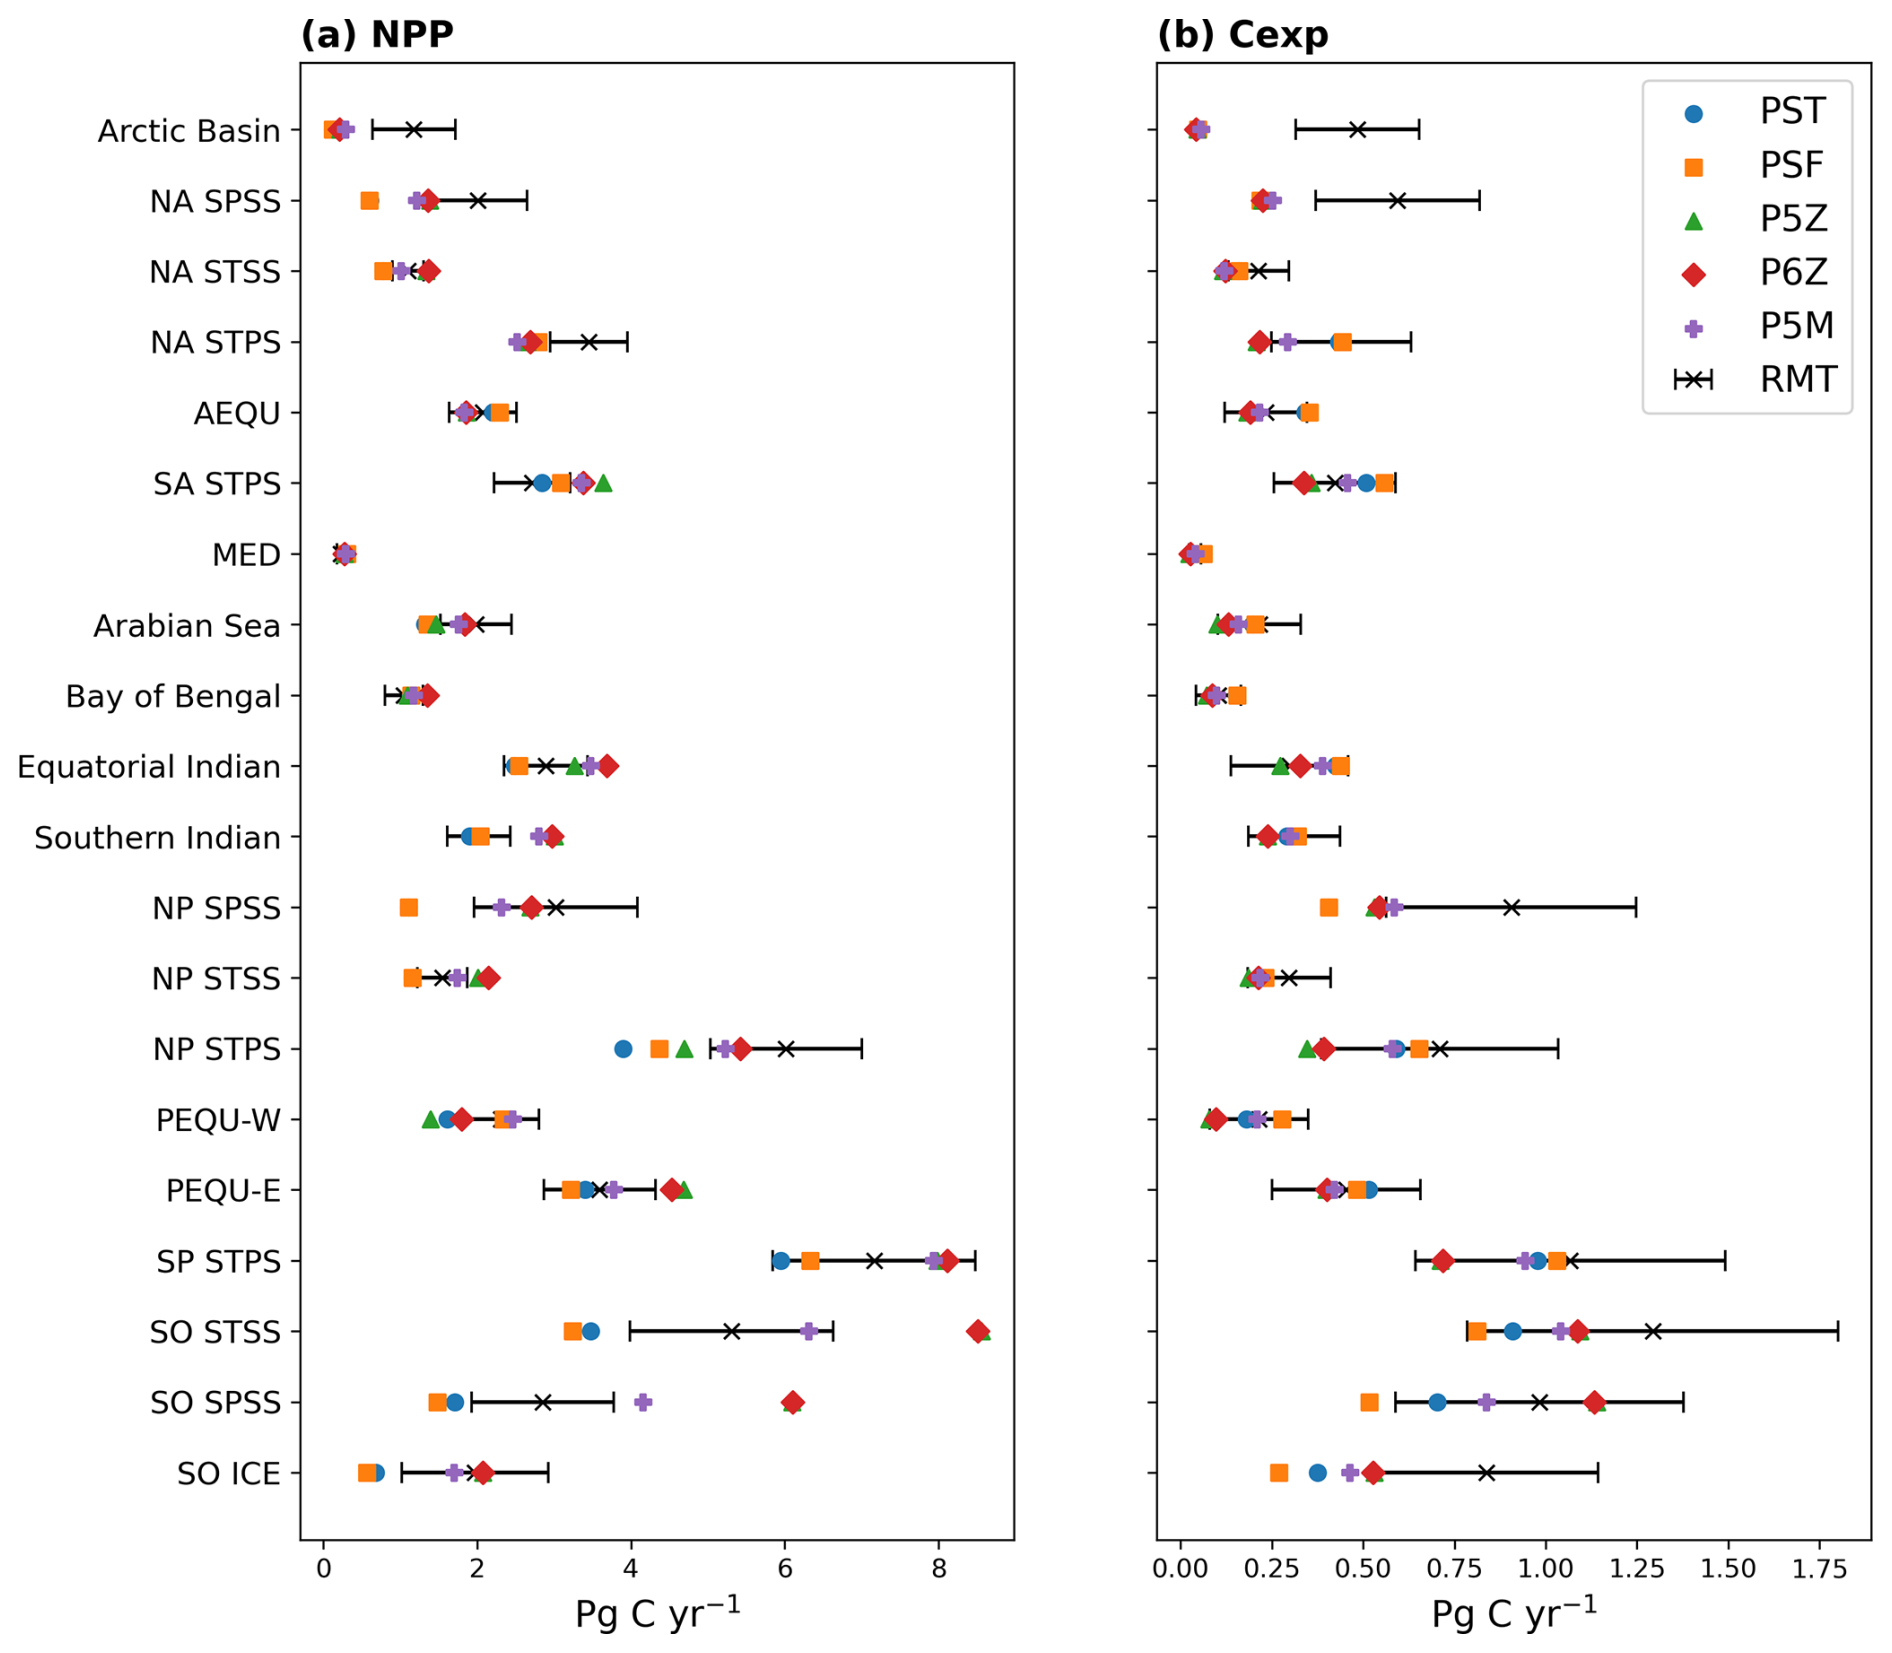
Figure 1Model and remote-sensing (RMT) estimates of (a) NPP and (b) Cexp, integrated over each RECCAP2 biome (refer to Fig. S1). Black bars indicate ±1 standard deviation across the remote-sensing ensemble.
The two Monod-quota configurations, PST and PSF, simulate 15–21 Pg C yr−1 less NPP than the purely Quota-based configurations (P5Z, P6Z and P5M). In contrast, the relative range of Cexp is much lower (CV≈5 %), showing export production is far more consistent across configurations and reflecting the fact that no direct adjustments were made to the equations or parameterisations explicitly controlling carbon export across the different configurations. Variability arises as an indirect outcome, emerging primarily from upstream differences in primary productivity patterns, which cascade down to influence export. Collectively, this results in the Monod-quota configurations resolving a more efficient BCP than the purely Quota-based ones. However, despite these intramodel differences, all the PISCES configurations largely fall within the range of remote-sensing estimates for both NPP and Cexp (Table 2). Compared to the CMIP5 ensemble, NPP for the PISCES configurations lies within the range of variability, whereas Cexp exceeds the upper bound.
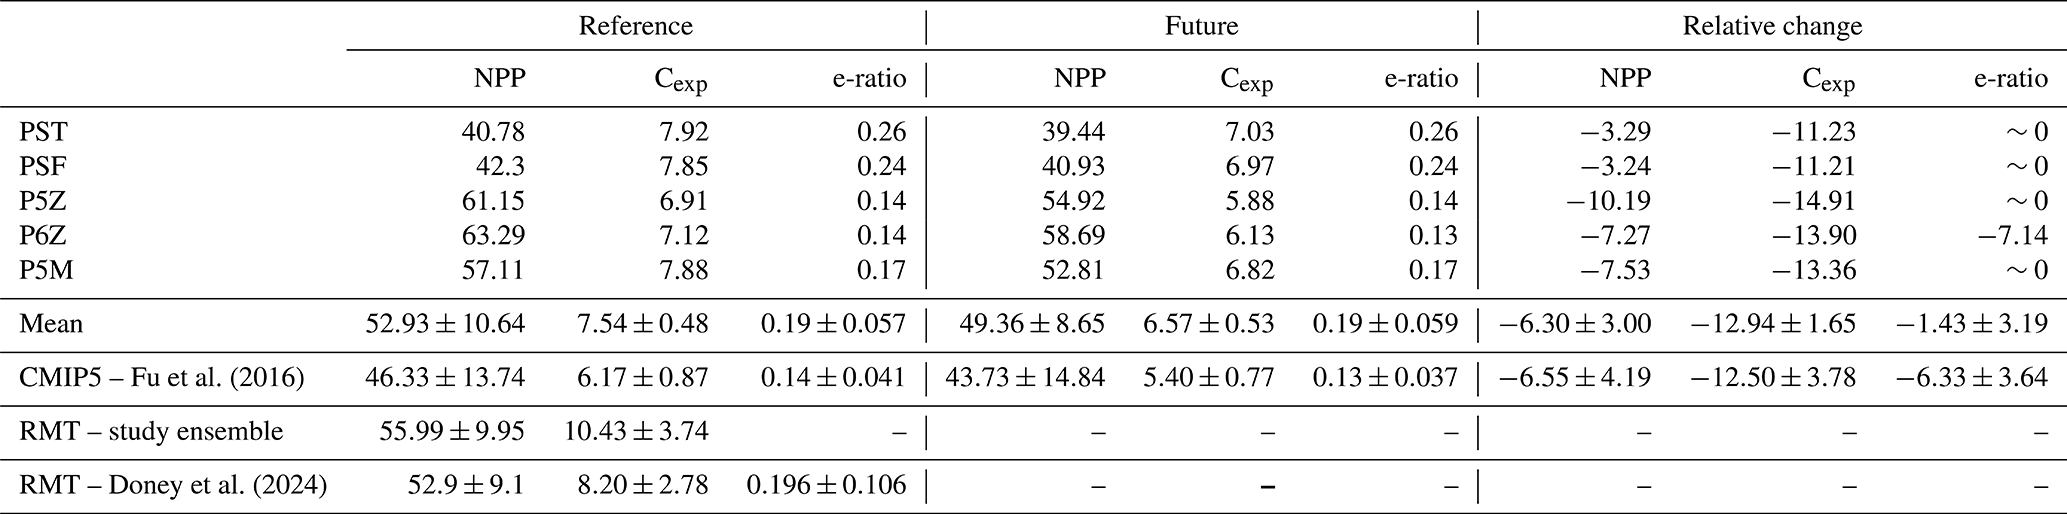
Table 2Reference and future projections of NPP, Cexp, and e-ratio for the five PISCES configurations. Cexp is defined as the mass of POC sinking through the 100 m depth horizon, consistent with CMIP conventions (Palevsky and Doney, 2018). The e-ratio (Cexp/NPP) reflects the efficiency of the BCP as governed by particle formation and sinking processes. NPP is integrated over the upper 100 m when calculating the e-ratio. NPP and Cexp are reported as globally integrated values (Pg C yr−1), and the e-ratio as an area-weighted global mean. Relative changes (%) from the reference to future period are shown, alongside CMIP5 estimates from Fu et al. (2016) and remote-sensing (RMT) values from this study's ensemble and Doney et al. (2024).
At the biome scale (Fig. 1), no single configuration consistently reproduces all regions, with intramodel variability in NPP (Fig. 1a) and Cexp (Fig. 1b) varying considerably. A similar state of variability exists for remote-sensing derived estimates. The Southern Ocean shows the strongest intramodel variability (CV≥30 %; Fig. S4). P5Z and P6Z yield the highest NPP and Cexp, while the Monod-quota models give the lowest. P5M stands apart from both groups, with the inclusion of the manganese cycle dampening phytoplankton growth in this region, resulting in lower NPP than the other Quota-based configurations. This reduction in productivity propagates downstream, ultimately leading to lower Cexp.
In the equatorial and subtropical gyres, the Quota-based configurations simulate higher NPP, yet the simpler Monod-quota models produce slightly higher Cexp, indicating that greater primary production does not directly translate into greater export in these regions (see also Fig. 2). The inclusion of a diazotroph PFT in P6Z introduces regional differences relative to P5Z within these biomes, most notably in the South Atlantic and North Pacific subtropical gyres; however, Cexp remains broadly similar between the two configurations (Fig. 1b). The absence of a uniform NPP response to the added diazotroph group reflects basin-specific nutrient limitation regimes, particularly differences in Fe and P availability that constrain diazotroph growth across ocean basins (Wrightson et al., 2022). For PSF, the low-iron biological parameterisation results in slightly higher NPP in the equatorial biomes and subtropical gyres, but marginally lower productivity in the Southern Ocean compared to PST. This occurs because PSF prescribes smaller Fe : C quotas for phytoplankton, enabling growth under lower iron supply. As a result, productivity in low latitude biomes responds more strongly to assumptions about biological iron uptake, where Fe and N limitation play a larger role, whereas productivity in the Southern Ocean is less affected due to its already pervasive iron limitation (Tagliabue et al., 2020).
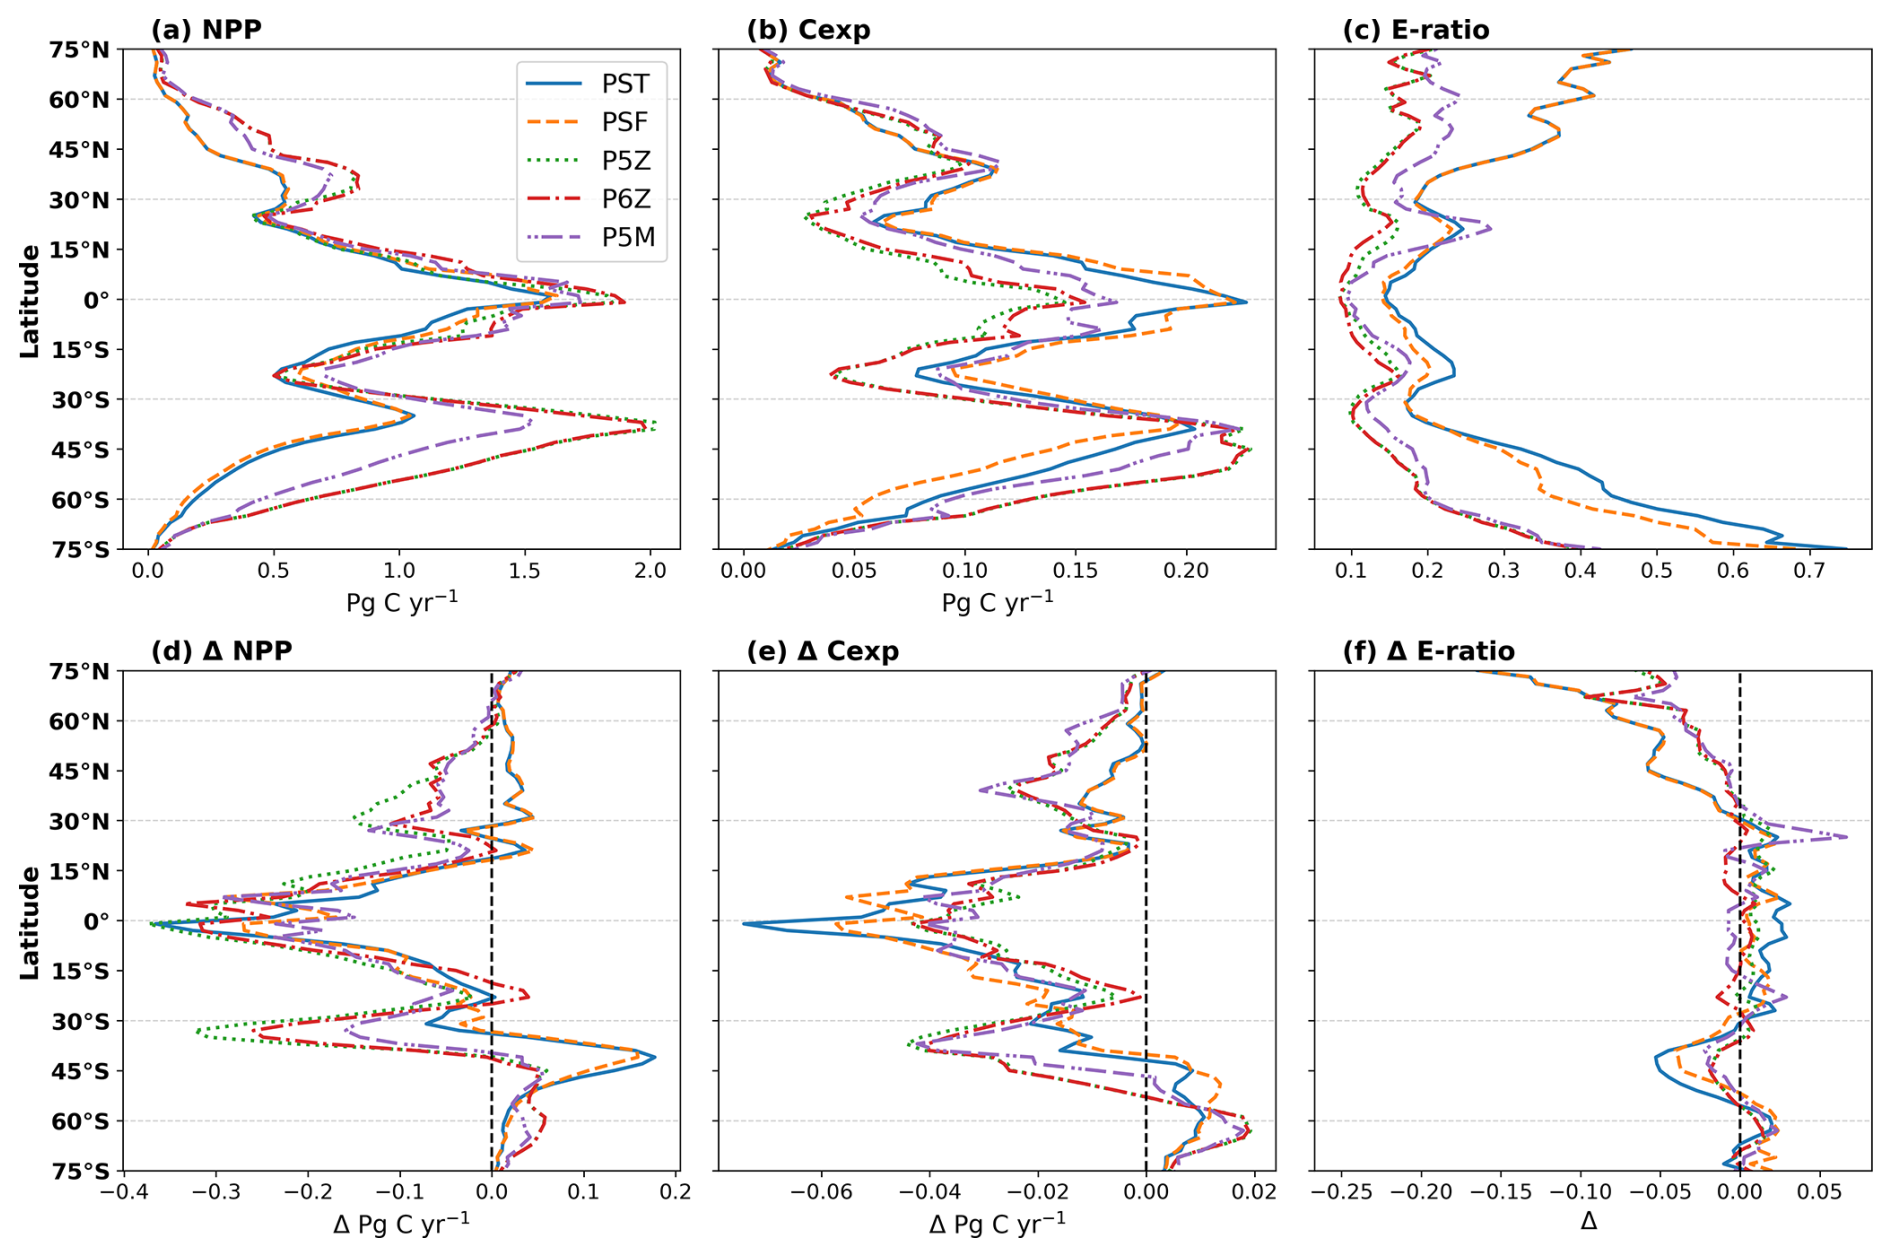
Figure 2Top row shows zonally integrated (a) NPP and (b) Cexp, and the area-weighted mean (c) e-ratio for the reference period. The lower row (d–f) shows the respective changes in the future relative to the reference period.
3.2 Future projections of the BCP
From Table 2, all configurations project future global declines in both NPP and Cexp by 2100, with NPP decreasing by 6.30±3.00 % and Cexp by 12.94±1.65 %; however, the e-ratio remains largely unchanged. For NPP and Cexp, the largest absolute and relative declines are observed in the Quota-based configurations but all configurations fall within the variability of the CMIP5 ensemble (Table 2).
Figure 2 expounds on the biome scale assessment in Fig. 1, presenting zonally integrated NPP and Cexp, and area-weighted e-ratios for the reference period, along with their projected future changes. For the reference period (Fig. 2a–c), all configurations reproduce the expected pattern of elevated NPP and Cexp in the equatorial region and at high latitudes, including the Southern Ocean and the subpolar to polar regions of the Northern Hemisphere, with lower values in the subtropical gyres. Differences arise mainly in magnitude, with the Quota-based configurations simulating higher NPP than the simpler Monod-quota ones (Fig. 2a); however, this does not translate into uniformly higher Cexp (Fig. 2b), resulting in a less efficient BCP (Fig. 2c). Intramodel variability in Cexp is less than NPP, with PST and PSF producing slightly higher export production between ∼20° N/S but notably lower Cexp than the Quota-based configurations in the Southern Ocean (40–75° S).
For future projections (Fig. 2d–f), all configurations simulate declining NPP between 30° N/S (Fig. 2d). Beyond this band, the models diverge. Around 45° S, PST and PSF show an increase in NPP of ∼25 %, whereas the Quota-based configurations show only a 4 %–5 % rise. North of 30° N, the Monod-quota configurations exhibit increasing NPP (from by 60° N), while the Quota-based configurations instead show a sharp decline of 15 %–25 % at 30° N, which gradually weakens poleward. All configurations eventually project higher NPP in the northern polar region (Fig. 2d). In contrast, future changes in Cexp (Fig. 2e) follow a broadly consistent pattern across configurations, differing mainly in magnitude rather than trajectory. All configurations show declining export production over most latitudes, with a regional exception in the Southern Ocean, where Cexp increases. This increase occurs farther north (∼45° S) in PST and PSF, reflecting their distinct NPP response, while the Quota-based models show a similar feature centred farther south. North of 30° N, all configurations show declining Cexp, though the strength of the reduction varies Collectively, the e-ratio remains relatively stable across latitudes, with no clear model-specific pattern between 30° N/S (Fig. 2f). All models show a 10 %–20 % decline in the e-ratio near 45° S, an increase of south of 60° S, and a consistent decrease north of 30° N (Fig. 2f).
Intramodel variability in NPP, Cexp, and e-ratio across the reference and future periods reflects both the direct effects of differing phytoplankton parameterisations (Table 1) and the cascading, top-down consequences of these choices. To interpret the latitudinal patterns in Fig. 2, it is necessary to examine how phytoplankton biomass responds within each configuration. Accordingly, Fig. 3 shows the reference and relative future changes in total phytoplankton biomass, grouped into small (SML) and large (LRG) phytoplankton to accommodate differences in PFT structure across configurations.
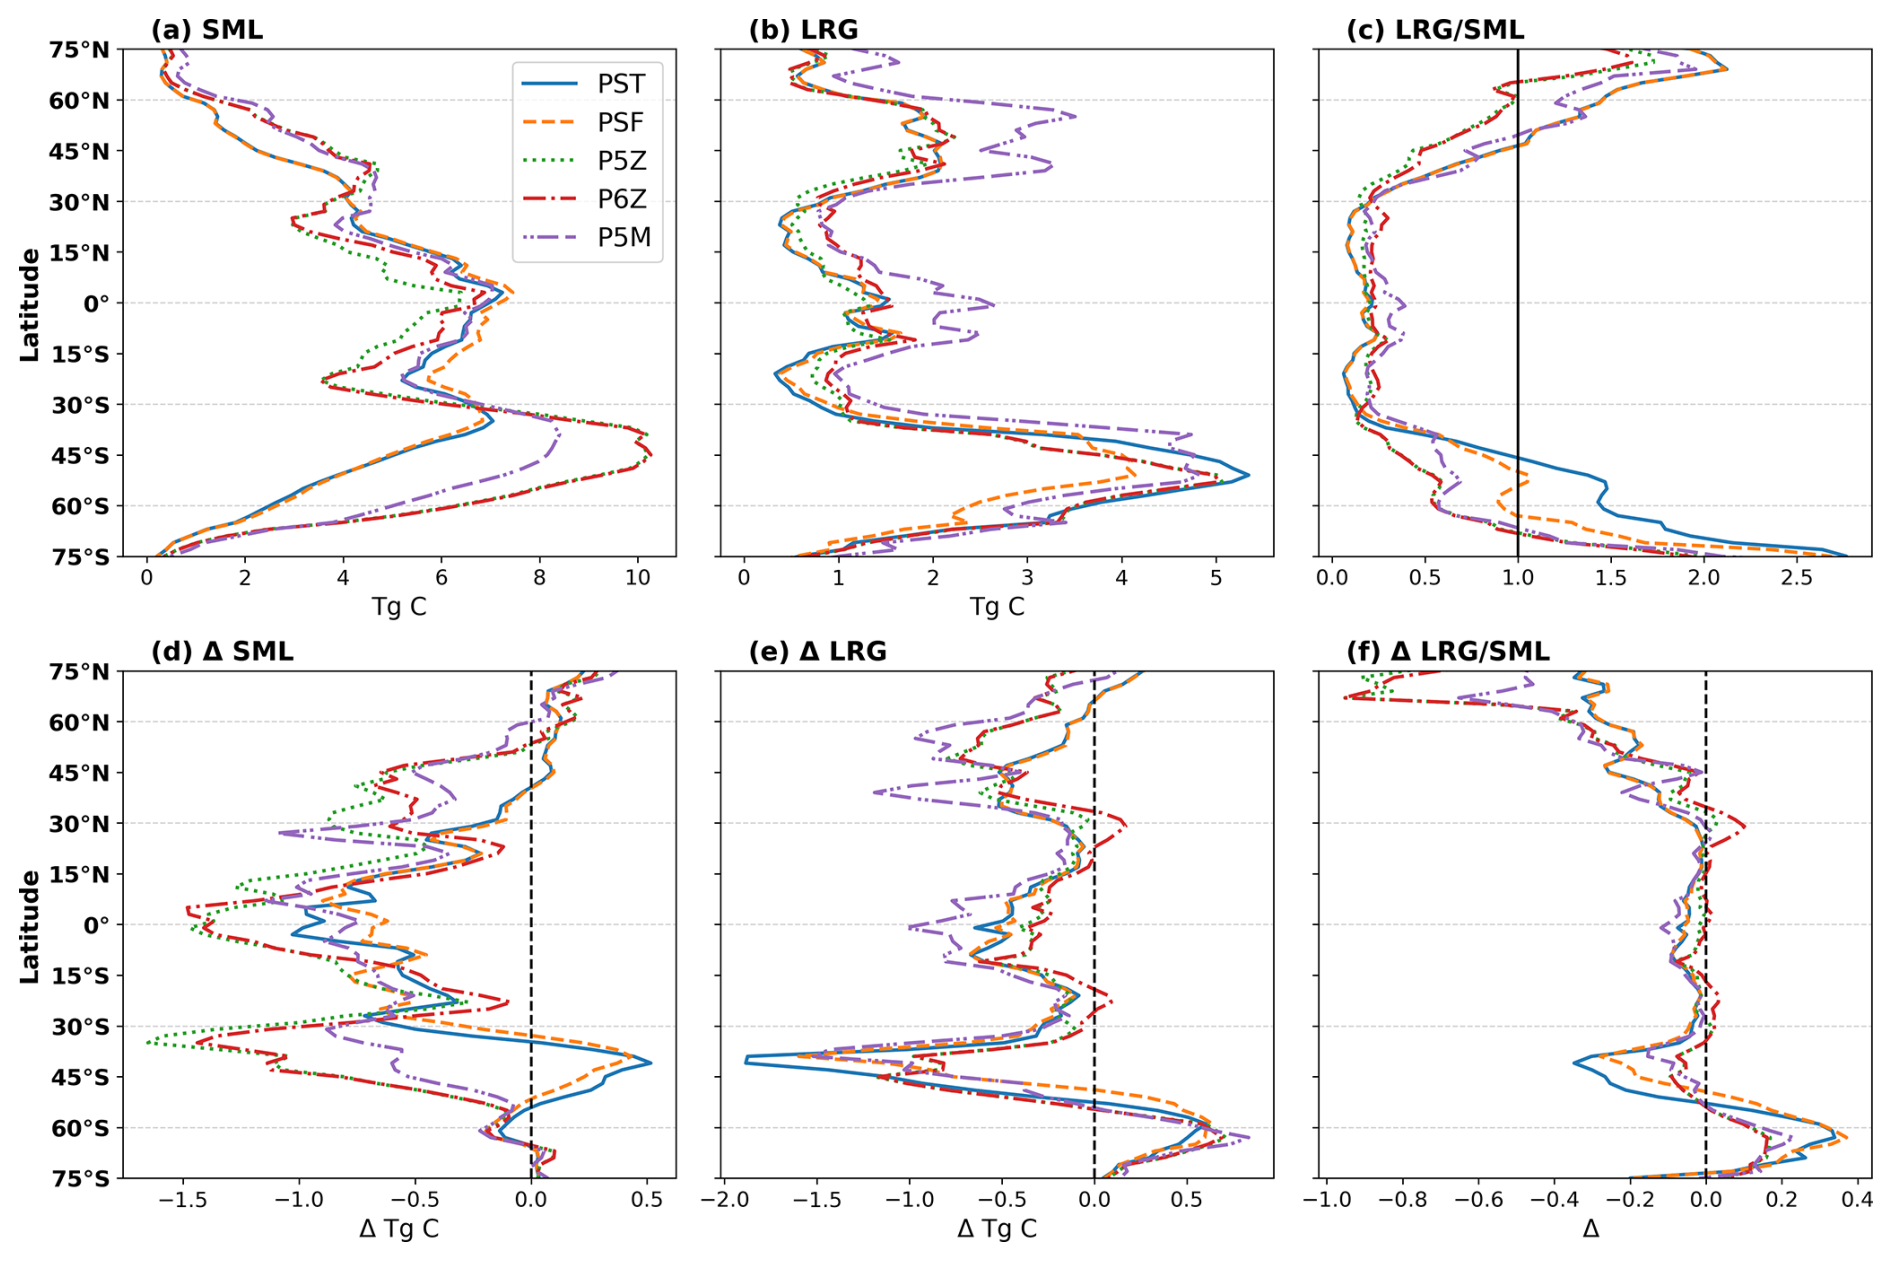
Figure 3Top row shows zonally integrated (a) Small (SML) and (b) Large (LRG) phytoplankton biomass, and the area-weighted mean (c) LRG/SML ratio for the reference period. Across the different PISCES configurations, PST and PSF have two PFTs, whereas the Quota-based configurations incorporate three (P5Z and P5M) and four (P6Z). To enable a comparison of phytoplankton biomasses, PFTs were grouped into “small” (nano-, pico- and N-fixers) and “large” (diatoms) categories. The lower row (d–f) shows the respective changes in the future relative to the reference period.
For the reference period (Fig. 3a–c), the spatial patterns and intramodel differences in small (Fig. 3a) and large (Fig. 3b) phytoplankton biomass closely parallel those of NPP (Fig. 2a) and Cexp (Fig. 2b). These patterns are expected and stem from the differing ecological functions and environmental sensitivities of small versus large phytoplankton in the model. Small phytoplankton dominate most of the ocean (LRG/SML<1; Fig. 3c) but contribute little to export because they remain in the surface layer, whereas large phytoplankton form larger, faster-sinking particles that disproportionately drive carbon export (Aumont et al., 2015). A striking feature is the substantially higher biomass of large phytoplankton (Fig. 3b) in P5M relative to the other configurations, particularly in the equatorial region and north of 30° N. Because P5M was specifically tuned to represent Mn and other co-limiting trace-metal effects in the Southern Ocean, its divergence elsewhere likely reflects model-specific tuning that produces unrealistic behaviour outside that region. This may also explain why P5M yields slightly higher global Cexp (Table 2) than the other Quota-based configurations.
Responding to future changes in marine environmental conditions, small and large phytoplankton show global declines of 7.88±2.97 % and 14.24±1.82 %, respectively by 2100. Across configurations, the latitudinal patterns of future changes in small (Fig. 3d) and large (Fig. 3e) phytoplankton biomass broadly follow those of NPP and Cexp (Fig. 2d and e). Intramodel divergence is most pronounced for small phytoplankton (Fig. 3d). South of 30° S, PST and PSF show increasing small phytoplankton biomass toward higher latitudes, whereas the Quota-based configurations simulate the opposite trend. Around ∼40° S this contrast is strongest, marking the clearest separation between the two model frameworks. North of 30° N, the configurations also diverge, with opposing latitudinal trends between 30–60° N. These differences likely stem from the contrasting phytoplankton complexity (i.e. the number of PFTs) and growth formulations across the Monod-quota and Quota-based configurations, which strongly shape how small phytoplankton, and therefore NPP, respond to future environmental change. This top-down interpretation is further supported by the broadly consistent spatial patterns and projected changes in N and P inventories across configurations (Fig. S5).
Large phytoplankton show comparatively little intramodel variability (Fig. 3e), with all configurations exhibiting similar spatial patterns and future changes, differing mainly in magnitude. The largest deviations occur again in P5M outside the Southern Ocean, reflecting its anomalously high large phytoplankton biomass in the reference state (Fig. 3b). Overall, the LRG/SML ratio is projected to decline globally by 6.83±3.33 %, with the largest absolute and relative changes occurring for PST and PSF, especially near ∼45 and 60° S (Fig. 3f). A declining ratio indicates a shift towards proportionally more small phytoplankton at the global scale, although regional exceptions occur, most notably in parts of the Southern Ocean, where large phytoplankton become locally more dominant (Fig. 3f). Nevertheless, the concurrent global declines in both small and large phytoplankton biomass ultimately reduces future NPP and Cexp.
4.1 Differences in phytoplankton parameterisations driving intramodel variability
Our results show that the more complex Quota-based configurations, which each include some combination of additional PFTs, a more detailed growth formulation, and expanded nutrient cycling, simulate a less efficient BCP than the simpler Monod-quota configurations for both the reference and future periods. For the reference period, the added complexity across the five PISCES configurations produces notable differences at both global (Table 2) and biome (Fig. 1) scales, most clearly in NPP. Intramodel variability in Cexp is smaller and appears mainly as an indirect consequence of differences in NPP rather than from explicit changes to export related parameterisations. Despite these differences, all configurations reproduce broadly similar large-scale patterns in NPP, Cexp, and the distribution of small and large phytoplankton for the reference period, with intramodel differences arising in the magnitude of these respective fields.
The more complex Quota-based configurations simulate higher global NPP than the Monod-quota configurations, but this increase does not translate uniformly into higher Cexp because the additional productivity is carried by small phytoplankton, which enhance upper-ocean biomass but contribute little to export. From Fig. 2b, export production is greater in PST and PSF between ∼20° N/S, whereas outside these latitudes, particularly in the Southern Ocean, Cexp is highest in the Quota-based models. These contrasting, and in some regions contradictory, patterns in NPP and Cexp behaviour for the reference period between the configurations likely arise from top-down controls linked to the greater PFT complexity in the Quota-based configurations and its influence on zooplankton dynamics. These interactions also likely underpin the intramodel differences seen in the future projections of NPP and the BCP.
Between the standard model (Aumont et al., 2015) and PISCES-QUOTA, the two biggest updates are the representation of phytoplankton growth processes to use a quota-formulation and the addition of a dedicated picophytoplankton PFT (Kwiatkowski et al., 2018). Furthermore, the zooplankton feeding parameterisations are also adjusted. In the standard PST and PSF configurations, mesozooplankton feed on nanophytoplankton and diatoms, generating large sinking particles via faecal pellet production. In PISCES-QUOTA, however, picophytoplankton are grazed exclusively by microzooplankton rather than mesozooplankton. From this study, it is not possible to fully disentangle the respective contributions of the quota-based growth formulation and the inclusion of additional PFTs to variability in NPP and Cexp within the Quota-based configurations. The higher NPP simulated by these configurations (Table 2) is partly attributable to their explicit treatment of nitrogen assimilation costs as flexible stoichiometry reduces respiratory losses when ammonium () is available. This then yields higher effective growth rates than in the Monod-quota configurations, particularly in low latitudes and during summer at high latitudes. However, NPP differences between the Monod-quota and Quota-based configurations remain modest in low latitudes (Fig. 2a), whereas in polar regions, a clearer association emerges between elevated small phytoplankton biomass and enhanced NPP in the Quota-based configurations. Kwiatkowski et al. (2018) concluded that accounting for variable phytoplankton stoichiometry has a limited impact on the global carbon cycle such that the added PFT complexity is likely the primary parameterisation driving the divergence in behaviour between the Monod-quota and Quota-based configurations in our study.
The competition index (CI; Fig. 4a) shows that the single small nanophytoplankton PFT in the Monod-quota configurations outcompetes the nanophytoplankton PFT in the Quota-based configurations across the equatorial and lower-latitude regions, although it is consistently outcompeted by the picophytoplankton group across all regions (Fig. 4b). Splitting the small phytoplankton PFT of the standard model into two distinct PFTs in PISCES-QUOTA allows for greater ecosystem complexity and differentiation across environmental niches. For the open-ocean regions of the lower latitudes (0–30° N/S), picophytoplankton dominate, comprising 50 %–70 % of total phytoplankton biomass for the reference period (Fig. S6). Consequently, relative to the Monod-quota configurations, nanophytoplankton biomass is smaller in the Quota-based configurations, but this reduction is offset by picophytoplankton biomass, leading to similar overall NPP in the region. However, because mesozooplankton feed exclusively on nanophytoplankton and diatoms, the reduced nanophytoplankton biomass in the Quota-based configurations limits their food supply. This leads to lower mesozooplankton grazing rates (Fig. S7d) and a reduced production of large sinking particles. This mechanistically explains why export production is higher in the equatorial region in PST and PSF compared with the Quota-based configurations (Fig. 2b).
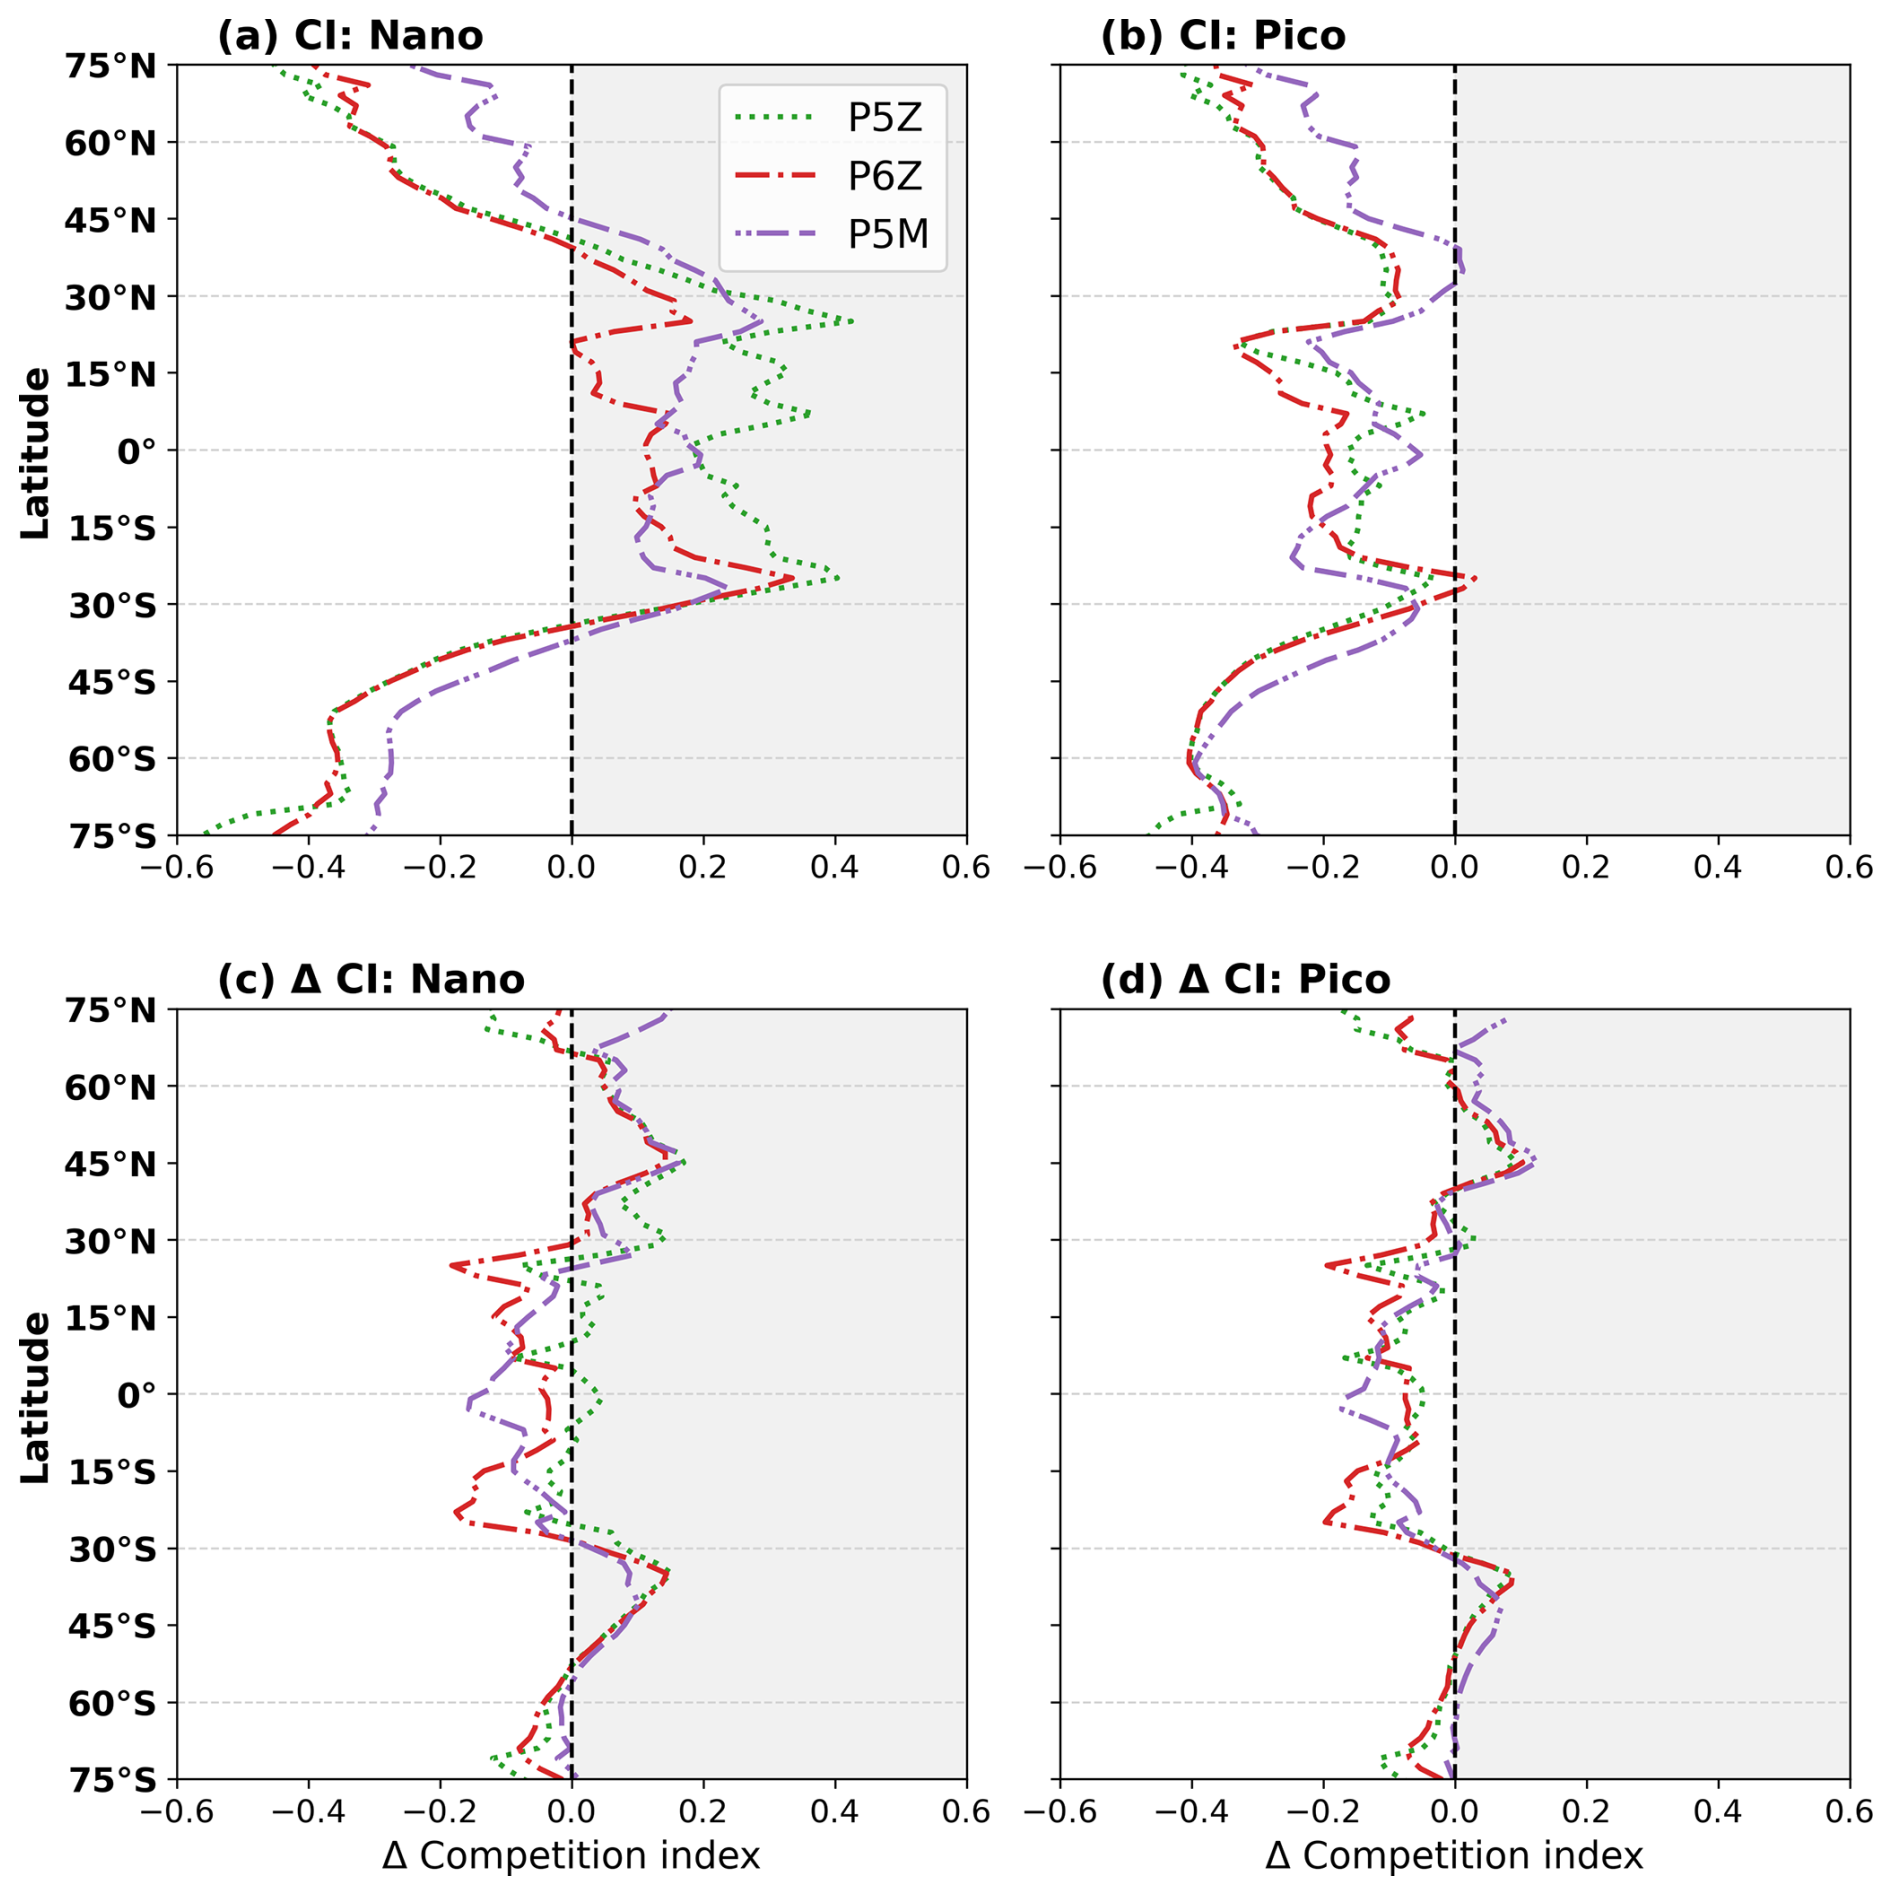
Figure 4The competition index (CI) quantifies where the standard nanophytoplankton PFT (mean of PST and PSF) outperforms the nano- and picophytoplankton PFTs of the Quota-based configurations. CI is computed from the mean realised growth rates (μ) over the upper 100 m and defined as , where μ1 is the mean Monod-quota nano-PFT and μ2 is either the nano- or picophytoplankton PFT from the Quota-based configurations. Positive values showcase regions where the nanophytoplankton PFT of the Monod-quota configurations outcompetes the nano- and/or picophytoplankton PFT of the Quota-based models. Panels show CI for the reference (a, b) period and future shifts (c, d).
Outside of 30° N/S, the CI shows a shift in competitive behaviour, with the nanophytoplankton PFT for the Quota-based configurations now outcompeting the single nanophytoplankton PFT of the Monod-quota models (Fig. 4a). Because picophytoplankton already outcompete the Monod-quota nano- PFT everywhere (Fig. 4b), this means that small phytoplankton as a whole can proliferate more effectively in the Quota-based configurations beyond the tropics. This explains the higher small phytoplankton biomass (Fig. 3a) and elevated NPP (Fig. 2a) in these regions. This pattern is strongest in the Southern Ocean, where the Quota-based configurations show substantially higher NPP and export production compared to PST and PSF. The elevated small phytoplankton biomass fuels enhanced micro- and mesozooplankton grazing rates (Fig. S7c and d), enhancing export production in the Southern Ocean (Fig. 2b) and this mechanism is consistent with the findings of Laufkötter et al. (2013).
The mechanistic patterns identified in the reference period provide a critical foundation for understanding why certain regions show stronger divergence than others in the future projections of NPP and the BCP across the PISCES configurations. By 2100, our results show global NPP and Cexp are projected to decline by 6.30±3.00 % and 12.94±1.65 %, respectively, accompanied by a shift towards dominance of small phytoplankton species. These findings align with previous modelling studies (Bindoff et al., 2019), and fall within the variability of the CMIP5 ensemble (Bopp et al., 2013; Fu et al., 2016). The comparable magnitude of variability in NPP and Cexp (Table 2) indicates that differences in parameterisations among the selected PISCES configurations can generate a spread in results of similar order to that found across CMIP5 models (Séférian et al., 2020). While this does not imply that the present ensemble captures the full diversity of CMIP model structural differences, it nevertheless highlights the sensitivity of biogeochemical outputs to relatively subtle differences in the representation of phytoplankton growth processes and ecosystem complexity which do contribute to intermodel variability.
Global future reductions in NPP and Cexp likely reflect reduced nutrient supply to the surface associated with enhanced stratification and increased interior residence times (Dunne, 2023); however, the e-ratio shows little to no significant change for the five PISCES configurations, indicating that BCP efficiency is maintained relative to the reference period. In Fig. 4c and d, the CI shows little change between the reference and future periods, indicating that the relative competitive balance among PFTs remains largely unchanged. Consequently, the Quota-based configurations continue to sustain higher absolute NPP in the future (Table 2) than the Monod-quota configurations. However, they also maintain lower Cexp, reflecting persistent regional differences in phytoplankton-zooplankton interactions (Fig. S7) that stem from the contrasting levels of PFT complexity, particularly within the small phytoplankton community, across the PISCES configurations.
Intramodel variability is greatest between 30–60° N/S for future projections of NPP and Cexp. Small phytoplankton biomass increases from 30° S to a peak near ∼40° S in the Monod-quota configurations before weakening toward 60° S, whereas the Quota-based configurations show the opposite latitudinal pattern, with both model families converging at ∼60° S (Fig. 3d). NPP responds accordingly, though the impact on Cexp is more muted. Under future changes in marine environmental conditions, such as warmer SSTs and enhanced stratification, the simpler Monod-quota models project an increase in small phytoplankton biomass, whereas the Quota-based configurations project a decline in this region. This divergence arises from the added phytoplankton complexity in the Quota-based configurations. By explicitly representing picophytoplankton, P5Z, P6Z, and P5M resolve a broader range of ecological niches. As marine environmental conditions shift, the response of picophytoplankton dominates the overall behaviour of the small phytoplankton community, leading to a decrease in biomass (Fig. 3d). In contrast, the single nanophytoplankton PFT in the Monod-quota models, being more generalised and arguably over-parameterised, responds differently and shows an increase for 30–60° S. A similar pattern emerges in the Northern Hemisphere, where both model families project an overall decline in small phytoplankton biomass but the latitude–dependent trends differ (Fig. 3d). Again, this reflects the distinct niche sensitivities of the picophytoplankton PFT in the Quota-based configurations versus the more simplified single nanophytoplankton PFT present in the Monod-quota configurations.
4.2 Complexity and the persistence of uncertainty
For both the reference and future periods, our results show that differences in biogeochemical parameterisations constitute a major axis of divergence across the five PISCES configurations. Importantly, not all parameterisations exert influence at the same scale. Some, such as the introduction of the picophytoplankton PFT in PISCES-QUOTA, generates substantial shifts in global NPP, which in turn leads to moderate but consistent differences in Cexp, for both the reference and future periods relative to the Monod-quota configurations. Other parameterisations exert more limited effects, such as low-iron parameterisation in PSF, added diazotroph PFT in P6Z, and explicit manganese cycling for P5M, impacting phytoplankton growth rates or expanding phytoplankton complexity in ways that manifest significant differences in NPP and Cexp behaviour at the biome scale rather than globally. Together, our findings highlight that certain parameterisations fundamentally reshape model behaviour, whereas others provide more subtle or regionally confined refinements.
Added complexity in biogeochemical models is intended to improve the representation of marine ecosystem functioning. However, the current uncertainty ranges in remote-sensing estimates of global NPP and Cexp remain extremely large at 46.3 % and 109.8 %, respectively (Doney et al., 2024). As shown in Fig. 1, all five PISCES configurations fall well within the spectrum of remote-sensing estimates at the biome scale such that understanding whether the added complexity is improving representation of the marine system is difficult to discern. Although not the focus of the study, a skill assessment of the different configurations relative to the ensemble mean of the various remote-sensing NPP and Cexp datasets showed increased complexity may improve global NPP magnitude without improving, and possibly worsening, spatial pattern fidelity, while for Cexp, there is little difference in skill across configurations (Fig. S8). This raises an important point, one that is actively discussed within the modelling community, determining the optimal balance of model complexity, and the most effective combination of parameterisations, when utilising biogeochemical models for future projections of the carbon cycle and the BCP.
One may argue that more complex biogeochemical models permit more sources of error and degrees of freedom; however, Flynn (2010) makes the bold statement that models that ignore key biogeochemical processes are inherently dysfunctional. Especially for future projections beyond the extent of observations as the absence of process driven biogeochemical feedback will lead to compensating errors and large future uncertainties. Furthermore, one also needs to consider the computational expenses that accompany greater complexity as PISCES-QUOTA is far more costly to operate than the simpler standard model (Kwiatkowski et al., 2018). These quid pro quos preclude a single “best” configuration, but they illuminate the key considerations when choosing among PISCES configurations of differing complexity. Finally, we tested these different configurations under the very strong climate forcing of the RCP8.5 scenario. Results may be different under weaker levels of global warming currently expected or strongly mitigated scenarios.
In this study, we used five distinct PISCES configurations of varying complexity that differ in their number of PFTs, growth formulations, imposed nutrient limitations, and the representation of nutrient cycling. We showed that these parameterisation differences alone can generate substantial divergence and intramodel variability under the high emissions RCP8.5 scenario in projections of the BCP, with NPP responding more sensitively than Cexp. Yet, despite these contrasts, all configurations produce for the reference period NPP and Cexp magnitudes that fall within the broad range of remote-sensing estimates, making it difficult to assess whether added complexity unequivocally improves model realism. Moreover, the spread in future NPP and Cexp projections across the PISCES configurations is comparable to that seen in the CMIP5 ensemble, suggesting that relatively subtle differences in phytoplankton processes and their parameterisation may underpin a substantial fraction of the intermodel variability in ESM projections.
The introduction of a picophytoplankton PFT in PISCES-QUOTA, and its presence in the other Quota-based configurations, emerges as one of the most influential parameterisation choices, producing higher global NPP yet slightly lower Cexp, and driving opposing future NPP responses and latitudinal trends in Cexp between 30–60° N/S compared with the Monod-quota configurations. Other parameterisations, such as the low-iron scheme in PSF, the added diazotroph PFT in P6Z, and explicit manganese cycling in P5M, exert more modest, regionally confined effects, influencing NPP and Cexp primarily at biome scales rather than driving large-scale divergence in model behaviour. Finding that differing parameterisations produce contrasting model outputs is unsurprising, but the nature of our study allowed us to identify which parameterisations generate substantial intramodel variability and which exert only minimal influence. The discrete number of configurations inevitably constrains our conclusions to parameterisations centred on phytoplankton processes. Nevertheless, within the PISCES and broader ESM modelling community, this study represents a novel contribution, highlighting how different configurations of a biogeochemical model behave in projecting contemporary and future states of NPP and Cexp.
The code to do the calculations and generate the main manuscript figures can be found at https://github.com/RGRJON002/Complexity_in_Biogeochemical_Models_BCP_Rogerson.git (https://doi.org/10.5281/zenodo.19843388, Rogerson, 2026).
The remote-sensing data products used in this study are publicly available. The BICEP NPP (https://doi.org/10.3390/rs12050826), datasets of Ryan-Keogh et al. (2023a) (https://doi.org/10.5281/zenodo.8314348, Ryan-Keogh et al., 2023b), and OSTIA SST (https://doi.org/10.48670/moi-00168, CMEMS, 2025) can be sourced from the links provided. Model outputs from the different PISCES configurations are available either through direct correspondence with the respective lead authors or via the repository links provided in their associated publications.
The supplement related to this article is available online at https://doi.org/10.5194/bg-23-3179-2026-supplement.
Conceptualization: JR, AT, MV, MG Methodology: JR, AT, AN, OA, MG Formal analysis: JR, AN Writing-Original Draft: JR Data curation: JR, AT, LW, PA Writing-Review and Editing: JR, AT, MV, LW, PA, OA, MG Funding acquisition: MG, AT, MV
The contact author has declared that none of the authors has any competing interests.
Views and opinions expressed are however those of the author(s) only and do not necessarily reflect those of the European Union or European Research Executive Agency. Neither the European Union nor the granting authority can be held responsible for them.
Publisher's note: Copernicus Publications remains neutral with regard to jurisdictional claims made in the text, published maps, institutional affiliations, or any other geographical representation in this paper. The authors bear the ultimate responsibility for providing appropriate place names. Views expressed in the text are those of the authors and do not necessarily reflect the views of the publisher.
A portion of the result's section was presented at the 2025 OceanICU Annual Meeting and the work benefited from discussions during the PISCO conference (25–26 September 2025). We thank the two reviewers, John Dunne and Shengwei Liu, for their helpful comments and feedback. Special thanks are given to Robbie Norfolk, Lulu White and Betty White. Finally, this manuscript is dedicated to the memory of Lulu, miss you lots.
This research has been supported by the European Union's Horizon 2020 research and innovation programme under grant agreement no. 862923 (AtlantECO). MG was funded by the European Union under grant agreement no. 101083922 (OceanICU).
This paper was edited by Jack Middelburg and reviewed by John Dunne and Shengwei Liu.
Anugerahanti, P. and Tagliabue, A.: Process controlling iron–manganese regulation of the Southern Ocean biological carbon pump, Philos. T. R. Soc. A., 381, 20220065, https://doi.org/10.1098/rsta.2022.0065, 2023.
Anugerahanti, P. and Tagliabue, A.: Response of Southern Ocean resource stress in a changing climate, Geophys. Res. Lett., 51, e2023GL107870, https://doi.org/10.1029/2023GL107870, 2024.
Aumont, O., Ethé, C., Tagliabue, A., Bopp, L., and Gehlen, M.: PISCES-v2: an ocean biogeochemical model for carbon and ecosystem studies, Geosci. Model Dev., 8, 2465–2513, https://doi.org/10.5194/gmd-8-2465-2015, 2015.
Basu, S. and Mackey, K. R.: Phytoplankton as key mediators of the biological carbon pump: Their responses to a changing climate, Sustainability, 10, 869, https://doi.org/10.3390/su10030869, 2018.
Behrenfeld, M. J. and Falkowski, P. G.:Photosynthetic rates derived from satellite-based chlorophyll concentration, Limnol. Oceanogr., 42, 1–20, https://doi.org/10.4319/lo.1997.42.1.0001, 1997.
Behrenfeld, M. J., Boss, E., Siegel, D. A., and Shea, D. M.: Carbon-based ocean productivity and phytoplankton physiology from space, Global Biogeochem. Cy., 19, 1–14, https://doi.org/10.1029/2004GB002299, 2005.
Benedetti, F., Vogt, M., Elizondo, U. H., Righetti, D., Zimmermann, N. E., and Gruber, N.: Major restructuring of marine plankton assemblages under global warming, Nat. Commun., 12, 5226, https://doi.org/10.1038/s41467-021-25385-x, 2021.
Berzaghi, F., Pinti, J., Aumont, O., Maury, O., Cosimano, T., and Wisz, M. S.: Global distribution, quantification and valuation of the biological carbon pump, Nat. Clim. Change, 15, 385–392, https://doi.org/10.1038/s41558-025-02295-0, 2025.
Bindoff, N. L., Cheung, W. W. L, Kairo, J. G., Arístegui, J., Guinder, V. A., Hallberg, R., Hilmi, N., Jiao, N., Karim, M. S., Levin, L., O'Donoghue, S., Purca Cuicapusa, S. R., Rinkevich, B., Suga, T., Tagliabue, A., and Williamson, P.: Changing Ocean, Marine Ecosystems, and Dependent Communities, in: IPCC Special Report on the Ocean and Cryosphere in a Changing Climate, edited by: Pörtner, H. O., Roberts, D. C., Masson-Delmotte, V., Zhai, P., Tignor, M., Poloczanska, E., Mintenbeck, K., Alegría, A., Nicolai, M., Okem, A., Petzold, J., Rama, B., and Weyer, N. M., Cambridge University Press, Cambridge (UK) and New York (NY, USA), 447–587, https://doi.org/10.1017/9781009157964.007, 2019.
Bisson, K. M., Siegel, D. A., DeVries, T., Cael, B. B., and Buesseler, K. O.: How data set characteristics influence ocean carbon export models', Global Biogeochem. Cy., 32, 1312–1328, https://doi.org/10.1029/2018GB005934, 2018.
Bopp, L., Aumont, O., Cadule, P., Alvain, S., and Gehlen, M.: Response of diatoms distribution to global warming and potential implications: A global model study, Geophys. Res. Lett., 32, 1–4, https://doi.org/10.1029/2005GL023653, 2005.
Bopp, L., Resplandy, L., Orr, J. C., Doney, S. C., Dunne, J. P., Gehlen, M., Halloran, P., Heinze, C., Ilyina, T., Séférian, R., Tjiputra, J., and Vichi, M.: Multiple stressors of ocean ecosystems in the 21st century: projections with CMIP5 models, Biogeosciences, 10, 6225–6245, https://doi.org/10.5194/bg-10-6225-2013, 2013.
Bopp, L., Aumont, O., Kwiatkowski, L., Clerc, C., Dupont, L., Ethé, C., Gorgues, T., Séférian, R., and Tagliabue, A.: Diazotrophy as a key driver of the response of marine net primary productivity to climate change, Biogeosciences, 19, 4267–4285, https://doi.org/10.5194/bg-19-4267-2022, 2022.
Browning, T. J., Achterberg, E. P., Engel, A., and Mawji, E.: Manganese co-limitation of phytoplankton growth and major nutrient drawdown in the Southern Ocean, Nat. Commun., 12, 884, https://doi.org/10.1038/s41467-021-21122-6, 2021.
Buesseler, K. O., Lamborg, C. H., Boyd, P. W., Lam, P. J., Trull, T. W., Bidigare, R. R., Bishop, J. K., Casciotti, K. L., Dehairs, F., Elskens, M., and Honda, M.: Revisiting carbon flux through the ocean's twilight zone, Science, 316, 567–570, https://doi.org/10.1126/science.1137959, 2007.
CMEMS (Copernicus Marine Environment Monitoring Service): Global Ocean OSTIA Sea Surface Temperature and Sea Ice Reprocessed, European Union CMEMS: Marine Data Store [data set], https://doi.org/10.48670/moi-00168, 2025.
DeVries, T., Yamamoto, K., Wanninkhof, R., Gruber, N., Hauck, J., Müller, J. D., Bopp, L., Carroll, D., Carter, B., Chau, T. T. T., and Doney, S. C.: Magnitude, trends, and variability of the global ocean carbon sink from 1985 to 2018, Global Biogeochem. Cy., 37, e2023GB007780, https://doi.org/10.1029/2023GB007780, 2023.
Doney, S. C., Mitchell, K. A., Henson, S. A., Cavan, E., DeVries, T., Gruber, N., Hauck, J., Mouw, C. B., Müller, J. D., and Primeau, F. W.: Observational and numerical modeling constraints on the global ocean biological carbon pump, Global Biogeochem. Cy., 38, e2024GB008156, https://doi.org/10.1029/2024GB008156, 2024.
Droop, M. R.: Vitamin B12 and marine ecology. IV. The kinetics of uptake, growth and inhibition in Monochrysis lutheri, J. Mar. Biol Assoc. UK, 48, 689–733, https://doi.org/10.1017/S0025315400019238, 1968.
Ducklow, H. W., Steinberg, D. K., and Buesseler, K. O.: Upper ocean carbon export and the biological pump, Oceanography, 14, 50–58, 2001.
Dunne, J. P.: Physical mechanisms driving enhanced carbon sequestration by the biological pump under climate warming, Global Biogeochem. Cy., 37, e2023GB007859, https://doi.org/10.1029/2023GB007859, 2023.
Dunne, J. P., Armstrong, R. A., Gnanadesikan, A., and Sarmiento, J. L.: Empirical and mechanistic models for the particle export ratio, Global Biogeochem. Cy., 19, 1–16, https://doi.org/10.1029/2004GB002390, 2005.
Dunne, J. P., John, J. G., Adcroft, A. J., Griffies, S. M., Hallberg, R. W., Shevliakova, E., Stouffer, R. J., Cooke, W., Dunne, K. A., Harrison, M. J., and Krasting, J. P.: GFDL's ESM2 global coupled climate–carbon earth system models. Part I: Physical formulation and baseline simulation characteristics, J. Climate, 25, 6646–6665, https://doi.org/10.1175/JCLI-D-11-00560.1, 2012.
Eppley, R. W.: Temperature and phytoplankton growth in the sea, Fish. B-NOAA., 70, 1063–1085, 1972.
Eppley, R. W. and Peterson, B. J.: Particulate organic matter flux and planktonic new production in the deep ocean, Nature, 282, 677–680, https://doi.org/10.1038/282677a0, 1979.
Falkowski, P. G., Barber, R. T., and Smetacek, V.: Biogeochemical controls and feedbacks on ocean primary production, Science, 281, 200–206, https://doi.org/10.1126/science.281.5374.200, 1998.
Falkowski, P., Scholes, R. J., Boyle, E. E. A., Canadell, J., Canfield, D., Elser, J., Gruber, N., Hibbard, K., Högberg, P., Linder, S., and Mackenzie, F. T.: The global carbon cycle: a test of our knowledge of earth as a system, Science, 290, 291–296, https://doi.org/10.1126/science.290.5490.291, 2000.
Fay, A. R. and McKinley, G. A.: Global open-ocean biomes: mean and temporal variability, Earth Syst. Sci. Data, 6, 273–284, https://doi.org/10.5194/essd-6-273-2014, 2014.
Fennel, K., Mattern, J. P., Doney, S. C., Bopp, L., Moore, A. M., Wang, B., and Yu, L.: Ocean biogeochemical modelling, Nat. Rev. Methods Primers, 2, 76, https://doi.org/10.1038/s43586-022-00154-2, 2022.
Fisher, B. J., Poulton, A. J., Meredith, M. P., Baldry, K., Schofield, O., and Henley, S. F.: Climate-driven shifts in Southern Ocean primary producers and biogeochemistry in CMIP6 models, Biogeosciences, 22, 975–994, https://doi.org/10.5194/bg-22-975-2025, 2025.
Flynn, K. J.: Modelling multi-nutrient interactions in phytoplankton; balancing simplicity and realism, Prog. Oceanogr., 56, 249–279, https://doi.org/10.1016/S0079-6611(03)00006-5, 2003.
Flynn, K. J.: Ecological modelling in a sea of variable stoichiometry: dysfunctionality and the legacy of Redfield and Monod, Prog. Oceanogr., 84, 52–65, https://doi.org/10.1016/j.pocean.2009.09.006, 2010.
Frémont, P., Gehlen, M., Vrac, M., Leconte, J., Delmont, T. O., Wincker, P., Iudicone, D., and Jaillon, O.: Restructuring of plankton genomic biogeography in the surface ocean under climate change, Nat. Clim. Change, 12, 393–401, https://doi.org/10.1038/s41558-022-01314-8, 2022.
Friedlingstein, P., O'Sullivan, M., Jones, M. W., Andrew, R. M., Bakker, D. C. E., Hauck, J., Landschützer, P., Le Quéré, C., Luijkx, I. T., Peters, G. P., Peters, W., Pongratz, J., Schwingshackl, C., Sitch, S., Canadell, J. G., Ciais, P., Jackson, R. B., Alin, S. R., Anthoni, P., Barbero, L., Bates, N. R., Becker, M., Bellouin, N., Decharme, B., Bopp, L., Brasika, I. B. M., Cadule, P., Chamberlain, M. A., Chandra, N., Chau, T.-T.-T., Chevallier, F., Chini, L. P., Cronin, M., Dou, X., Enyo, K., Evans, W., Falk, S., Feely, R. A., Feng, L., Ford, D. J., Gasser, T., Ghattas, J., Gkritzalis, T., Grassi, G., Gregor, L., Gruber, N., Gürses, Ö., Harris, I., Hefner, M., Heinke, J., Houghton, R. A., Hurtt, G. C., Iida, Y., Ilyina, T., Jacobson, A. R., Jain, A., Jarníková, T., Jersild, A., Jiang, F., Jin, Z., Joos, F., Kato, E., Keeling, R. F., Kennedy, D., Klein Goldewijk, K., Knauer, J., Korsbakken, J. I., Körtzinger, A., Lan, X., Lefèvre, N., Li, H., Liu, J., Liu, Z., Ma, L., Marland, G., Mayot, N., McGuire, P. C., McKinley, G. A., Meyer, G., Morgan, E. J., Munro, D. R., Nakaoka, S.-I., Niwa, Y., O'Brien, K. M., Olsen, A., Omar, A. M., Ono, T., Paulsen, M., Pierrot, D., Pocock, K., Poulter, B., Powis, C. M., Rehder, G., Resplandy, L., Robertson, E., Rödenbeck, C., Rosan, T. M., Schwinger, J., Séférian, R., Smallman, T. L., Smith, S. M., Sospedra-Alfonso, R., Sun, Q., Sutton, A. J., Sweeney, C., Takao, S., Tans, P. P., Tian, H., Tilbrook, B., Tsujino, H., Tubiello, F., van der Werf, G. R., van Ooijen, E., Wanninkhof, R., Watanabe, M., Wimart-Rousseau, C., Yang, D., Yang, X., Yuan, W., Yue, X., Zaehle, S., Zeng, J., and Zheng, B.: Global Carbon Budget 2023, Earth Syst. Sci. Data, 15, 5301–5369, https://doi.org/10.5194/essd-15-5301-2023, 2023.
Fu, W., Randerson, J. T., and Moore, J. K.: Climate change impacts on net primary production (NPP) and export production (EP) regulated by increasing stratification and phytoplankton community structure in the CMIP5 models, Biogeosciences, 13, 5151–5170, https://doi.org/10.5194/bg-13-5151-2016, 2016.
Good, S., Fiedler, E., Mao, C., Martin, M. J., Maycock, A., Reid, R., Roberts-Jones, J., Searle, T., Waters, J., While, J., and Worsfold, M.: The current configuration of the OSTIA system for operational production of foundation sea surface temperature and ice concentration analyses, Remote Sens.-Basel, 12, 720, https://doi.org/10.3390/rs12040720, 2020.
Hauck, J., Völker, C., Wang, T., Hoppema, M., Losch, M., and Wolf-Gladrow, D. A.: Seasonally different carbon flux changes in the Southern Ocean in response to the southern annular mode, Global Biogeochem. Cy., 27, 1236–1245, https://doi.org/10.1002/2013GB004600, 2013.
Hawco, N. J., Tagliabue, A., and Twining, B. S.: Manganese limitation of phytoplankton physiology and productivity in the Southern Ocean, Global Biogeochem. Cy., 36, e2022GB007382, https://doi.org/10.1029/2022GB007382, 2022.
Henson, S. A., Sanders, R., Madsen, E., Morris, P. J., Le Moigne, F., and Quartly, G. D.: A reduced estimate of the strength of the ocean's biological carbon pump, Geophys. Res. Lett., 38, 1–5, https://doi.org/10.1029/2011GL046735, 2011.
Henson, S. A., Sanders, R., and Madsen, E.: Global patterns in efficiency of particulate organic carbon export and transfer to the deep ocean, Global Biogeochem. Cy., 26, 1–14, https://doi.org/10.1029/2011GB004099, 2012.
Henson, S. A., Cael, B. B., Allen, S. R., and Dutkiewicz, S.: Future phytoplankton diversity in a changing climate, Nat. Commun., 12, 5372, https://doi.org/10.1038/s41467-021-25699-w, 2021.
Henson, S. A., Laufkötter, C., Leung, S., Giering, S. L., Palevsky, H. I., and Cavan, E. L.: Uncertain response of ocean biological carbon export in a changing world, Nat. Geosci., 15, 248-254, https://doi.org/10.1038/s41561-022-00927-0, 2022.
Jin, D., Hoagland, P., and Buesseler, K. O.: The value of scientific research on the ocean's biological carbon pump, Sci. Total Environ, 749, 141357, https://doi.org/10.1016/j.scitotenv.2020.141357, 2020.
Jönsson, B. F., Kulk, G., and Sathyendranath, S.: Review of algorithms estimating export production from satellite derived properties, Front. Mar. Sci., 10, 1149938, https://doi.org/10.3389/fmars.2023.1149938, 2023.
Kulk, G., Platt, T., Dingle, J., Jackson, T., Jönsson, B. F., Bouman, H. A., Babin, M., Brewin, R. J., Doblin, M., Estrada, M., and Figueiras, F. G.: Primary production, an index of climate change in the ocean: satellite-based estimates over two decades, Remote Sens.-Basel, 12, 826, https://doi.org/10.3390/rs12050826, 2020.
Kulk, G, Platt, T., Dingle, J., Jackson, T., Jönsson, B. F., Bouman, H. A., Babin, M., Brewin, R. J. W., Doblin, M., Estrada, M., Figueiras, F. G., Furuya, K., González-Benítez, N., Gudfinnsson, H. G., Gudmundsson, K., Huang, B., Isada, T., Kovač, Ž., Lutz, V. A., Marañón, E., Raman, M., Richardson, K., Rozema, P. D., van de Poll, W. H., Segura, V., Tilstone, G. H., Uitz, J., van Dongen-Vogels, V., Yoshikawa, T., and Sathyendranath, S.: BICEP/NCEO: Monthly global Marine Phytoplankton Primary Production, between 1998–2020 at 9 km resolution (derived from the Ocean Colour Climate Change Initiative v4.2 dataset), NERC EDS Centre for Environmental Data Analysis [data set], https://doi.org/10.5285/69b2c9c6c4714517ba10dab3515e4ee6, 2021.
Kwiatkowski, L., Aumont, O., Bopp, L., and Ciais, P.: The impact of variable phytoplankton stoichiometry on projections of primary production, food quality, and carbon uptake in the global ocean, Global Biogeochem. Cy., 32, 516–528, https://doi.org/10.1002/2017GB005799, 2018.
Kwiatkowski, L., Torres, O., Bopp, L., Aumont, O., Chamberlain, M., Christian, J. R., Dunne, J. P., Gehlen, M., Ilyina, T., John, J. G., Lenton, A., Li, H., Lovenduski, N. S., Orr, J. C., Palmieri, J., Santana-Falcón, Y., Schwinger, J., Séférian, R., Stock, C. A., Tagliabue, A., Takano, Y., Tjiputra, J., Toyama, K., Tsujino, H., Watanabe, M., Yamamoto, A., Yool, A., and Ziehn, T.: Twenty-first century ocean warming, acidification, deoxygenation, and upper-ocean nutrient and primary production decline from CMIP6 model projections, Biogeosciences, 17, 3439–3470, https://doi.org/10.5194/bg-17-3439-2020, 2020.
Laufkötter, C., Vogt, M., and Gruber, N.: Long-term trends in ocean plankton production and particle export between 1960–2006, Biogeosciences, 10, 7373–7393, https://doi.org/10.5194/bg-10-7373-2013, 2013.
Laufkötter, C., Vogt, M., Gruber, N., Aita-Noguchi, M., Aumont, O., Bopp, L., Buitenhuis, E., Doney, S. C., Dunne, J., Hashioka, T., Hauck, J., Hirata, T., John, J., Le Quéré, C., Lima, I. D., Nakano, H., Seferian, R., Totterdell, I., Vichi, M., and Völker, C.: Drivers and uncertainties of future global marine primary production in marine ecosystem models, Biogeosciences, 12, 6955–6984, https://doi.org/10.5194/bg-12-6955-2015, 2015.
Laufkötter, C., Vogt, M., Gruber, N., Aumont, O., Bopp, L., Doney, S. C., Dunne, J. P., Hauck, J., John, J. G., Lima, I. D., Seferian, R., and Völker, C.: Projected decreases in future marine export production: the role of the carbon flux through the upper ocean ecosystem, Biogeosciences, 13, 4023–4047, https://doi.org/10.5194/bg-13-4023-2016, 2016.
Laws, E. A., Falkowski, P. G., Smith Jr, W. O., Ducklow, H., and McCarthy, J. J.: Temperature effects on export production in the open ocean, Global Biogeochem. Cy., 14, 1231–1246, https://doi.org/10.1029/1999GB001229, 2000.
Laws, E. A., D'Sa, E., and Naik, P.: Simple equations to estimate ratios of new or export production to total production from satellite-derived estimates of sea surface temperature and primary production, Limnol. Oceanogr-Meth., 9, 593–601, https://doi.org/10.4319/lom.2011.9.593, 2011.
Li, Z. and Cassar, N.: Satellite estimates of net community production based on O2/Ar observations and comparison to other estimates, Global Biogeochem. Cy., 30, 735–752, https://doi.org/10.1002/2015GB005314, 2016.
Longhurst, A., Sathyendranath, S., Platt, T., and Caverhill, C.: An estimate of global primary production in the ocean from satellite radiometer data, J. Plankton Res., 17, 1245–1271, https://doi.org/10.1093/plankt/17.6.1245, 1995.
Maier-Reimer, E., Mikolajewicz, U., and Winguth, A.: Future ocean uptake of CO2: interaction between ocean circulation and biology, Clim. Dynam., 12, 711–722, https://doi.org/10.1007/s003820050138, 1996.
Monod, J.: The growth of bacterial cultures, Annu. Rev. Microbiol., 3, 371–394, https://doi.org/10.1146/annurev.mi.03.100149.002103, 1949.
Moore, J. K., Doney, S. C., Kleypas, J. A., Glover, D. M., and Fung, I. Y.: An intermediate complexity marine ecosystem model for the global domain, Deep-Sea Res. Pt. II, 49, 403–462, https://doi.org/10.1016/S0967-0645(01)00108-4, 2001.
Moore, J. K., Doney, S. C., and Lindsay, K.: Upper ocean ecosystem dynamics and iron cycling in a global three-dimensional model, Global Biogeochem. Cy., 18, 1–21, https://doi.org/10.1029/2004GB002220, 2004.
Mouw, C. B., Barnett, A., McKinley, G. A., Gloege, L., and Pilcher, D.: Global ocean particulate organic carbon flux merged with satellite parameters, Earth Syst. Sci. Data, 8, 531–541, https://doi.org/10.5194/essd-8-531-2016, 2016.
Nowicki, M., DeVries, T., and Siegel, D. A.: Quantifying the carbon export and sequestration pathways of the ocean's biological carbon pump, Global Biogeochem. Cy., 36, e2021GB007083, https://doi.org/10.1029/2021GB007083, 2022.
Palevsky, H. I. and Doney, S. C.: How choice of depth horizon influences the estimated spatial patterns and global magnitude of ocean carbon export flux, Geophys. Res. Lett., 45, 4171–4179, https://doi.org/10.1029/2017GL076498, 2018.
Richon, C. and Tagliabue, A.: Biogeochemical feedbacks associated with the response of micronutrient recycling by zooplankton to climate change, Glob. Change Biol., 27, 4758–4770, https://doi.org/10.1111/gcb.15789, 2021.
Ripple, W. J., Wolf, C., Gregg, J. W., Rockström, J., Mann, M. E., Oreskes, N., Lenton, T. M., Rahmstorf, S., Newsome, T. M., Xu, C., and Svenning, J. C.: The 2024 state of the climate report: Perilous times on planet Earth, BioScience, 74, 812–824, https://doi.org/10.1093/biosci/biae087, 2024.
Rogerson, J.: RGRJON002/Complexity_in_Biogeochemical_Models_BCP_Rogerson, Zenodo [code], https://doi.org/10.5281/zenodo.19843389, 2026.
Ryan-Keogh, T. J., Thomalla, S. J., Chang, N., and Moalusi, T.: A new global oceanic multi-model net primary productivity data product, Earth Syst. Sci. Data, 15, 4829–4848, https://doi.org/10.5194/essd-15-4829-2023, 2023a.
Ryan-Keogh, T., Thomalla, S., Chang, N., and Moalusi, T.: Net primary production from the Eppley-VGPM, Behrenfeld-VGPM, Behrenfeld-CbPM, Westberry-CbPM and Silsbe-CAFE algorithms (1.1), Zenodo [data set], https://doi.org/10.5281/zenodo.8314348, 2023b.
Ryan-Keogh, T. J., Tagliabue, A., and Thomalla, S. J.: Global decline in net primary production underestimated by climate models, Commun. Earth Environ., 6, 75, https://doi.org/10.1038/s43247-025-02051-4, 2025.
Sabine, C. L., Feely, R. A., Gruber, N., Key, R. M., Lee, K., Bullister, J. L., Wanninkhof, R., Wong, C. S. L., Wallace, D. W., Tilbrook, B., and Millero, F. J.: The oceanic sink for anthropogenic CO2, Science, 305, 367–371, https://doi.org/10.1126/science.1097403, 2004.
Sathyendranath, S., Brewin, R. J., Brockmann, C., Brotas, V., Calton, B., Chuprin, A., Cipollini, P., Couto, A. B., Dingle, J., Doerffer, R., and Donlon, C.: An ocean-colour time series for use in climate studies: the experience of the ocean-colour climate change initiative (OC-CCI), Sensors, 19, 4285, https://doi.org/10.3390/s19194285, 2019.
Séférian, R., Berthet, S., Yool, A., Palmiéri, J., Bopp, L., Tagliabue, A., Kwiatkowski, L., Aumont, O., Christian, J., Dunne, J., and Gehlen, M.: Tracking improvement in simulated marine biogeochemistry between CMIP5 and CMIP6, Curr. Clim. Change Rep., 6, 95–119, https://doi.org/10.1007/s40641-020-00160-0, 2020.
Siegel, D. A., Buesseler, K. O., Doney, S. C., Sailley, S. F., Behrenfeld, M. J., and Boyd, P. W.: Global assessment of ocean carbon export by combining satellite observations and food-web models, Global Biogeochem. Cy., 28, 181–196, https://doi.org/10.1002/2013GB004743, 2014.
Sigman, D. M. and Boyle, E. A.: Glacial/interglacial variations in atmospheric carbon dioxide, Nature, 407, 859–869, https://doi.org/10.1038/35038000, 2000.
Silsbe, G. M., Behrenfeld, M. J., Halsey, K. H., Milligan, A. J., and Westberry, T. K.: The CAFE model: A net production model for global ocean phytoplankton, Global Biogeochem. Cy., 30, 1756–1777, https://doi.org/10.1002/2016GB005521, 2016.
Steinacher, M., Joos, F., Frölicher, T. L., Bopp, L., Cadule, P., Cocco, V., Doney, S. C., Gehlen, M., Lindsay, K., Moore, J. K., Schneider, B., and Segschneider, J.: Projected 21st century decrease in marine productivity: a multi-model analysis, Biogeosciences, 7, 979–1005, https://doi.org/10.5194/bg-7-979-2010, 2010.
Tagliabue, A., Aumont, O., DeAth, R., Dunne, J. P., Dutkiewicz, S., Galbraith, E., Misumi, K., Moore, J. K., Ridgwell, A., Sherman, E., and Stock, C.: How well do global ocean biogeochemistry models simulate dissolved iron distributions?, Global Biogeochem. Cy., 30, 149–174, https://doi.org/10.1002/2015GB005289, 2016.
Tagliabue, A., Bowie, A. R., Boyd, P. W., Buck, K. N., Johnson, K. S., and Saito, M. A.: The integral role of iron in ocean biogeochemistry, Nature, 543, 51–59, https://doi.org/10.1038/nature21058, 2017.
Tagliabue, A., Barrier, N., Du Pontavice, H., Kwiatkowski, L., Aumont, O., Bopp, L., Cheung, W. W., Gascuel, D., and Maury, O.: An iron cycle cascade governs the response of equatorial Pacific ecosystems to climate change, Glob. Change Biol., 26, 6168–6179, https://doi.org/10.1111/gcb.15316, 2020.
Tagliabue, A., Kwiatkowski, L., Bopp, L., Butenschön, M., Cheung, W., Lengaigne, M., and Vialard, J.: Persistent uncertainties in ocean net primary production climate change projections at regional scales raise challenges for assessing impacts on ecosystem services, Front. Clim., 3, 738224, https://doi.org/10.3389/fclim.2021.738224, 2021.
Tjiputra, J. F., Couespel, D., and Sanders, R.: Marine ecosystem role in setting up preindustrial and future climate, Nat. Commun., 16, 2206, https://doi.org/10.1038/s41467-025-57371-y, 2025.
Tréguer, P., Bowler, C., Moriceau, B., Dutkiewicz, S., Gehlen, M., Aumont, O., Bittner, L., Dugdale, R., Finkel, Z., Iudicone, D., and Jahn, O.: Influence of diatom diversity on the ocean biological carbon pump, Nat. Geosci., 11, 27–37, https://doi.org/10.1038/s41561-017-0028-x, 2018.
Vichi, M., Pinardi, N., and Masina, S.: A generalized model of pelagic biogeochemistry for the global ocean ecosystem. Part I: Theory, J. Marine Syst., 64, 89–109, https://doi.org/10.1016/j.jmarsys.2006.03.006, 2007.
Visser, A. W.: Sequestration by the biological carbon pump: Do we really know what we are talking about?, Limnol. Oceanogr. Lett., 10, 851–858, https://doi.org/10.1002/lol2.70053, 2025.
Westberry, T., Behrenfeld, M. J., Siegel, D. A., and Boss, E.: Carbon-based primary productivity modeling with vertically resolved photoacclimation, Global Biogeochem. Cy., 22, 1–18, https://doi.org/10.1029/2007GB003078, 2008.
Westberry, T. K., Silsbe, G. M., and Behrenfeld, M. J.: Gross and net primary production in the global ocean: An ocean color remote sensing perspective, Earth-Sci. Rev., 237, 104322, https://doi.org/10.1016/j.earscirev.2023.104322, 2023.
Wilson, J. D., Andrews, O., Katavouta, A., de Melo Viríssimo, F., Death, R. M., Adloff, M., Baker, C. A., Blackledge, B., Goldsworth, F. W., Kennedy-Asser, A. T., and Liu, Q.: The biological carbon pump in CMIP6 models: 21st century trends and uncertainties, P. Natl. Acad. Sci. USA, 119, e2204369119, https://doi.org/10.1073/pnas.2204369119, 2022.
World Meteorological Organization (WMO): WMO confirms 2024 as warmest year on record at about 1.55 °C above pre-industrial level, https://wmo.int/news/media-centre/wmo- confirms-2024-warmest-year-record-about-155degc-above-pre-industrial-level, last access: 21 January 2025.
Wrightson, L. and Tagliabue, A.: Quantifying the impact of climate change on marine diazotrophy: Insights from earth system models, Front. Mar. Sci., 7, 635, https://doi.org/10.3389/fmars.2020.00635, 2020.
Wrightson, L., Yang, N., Mahaffey, C., Hutchins, D. A., and Tagliabue, A.: Integrating the impact of global change on the niche and physiology of marine nitrogen-fixing cyanobacteria, Glob. Change Biol., 28, 7078–7093, https://doi.org/10.1111/gcb.16399, 2022.
Wu, M., McCain, J. S. P., Rowland, E., Middag, R., Sandgren, M., Allen, A. E., and Bertrand, E. M.: Manganese and iron deficiency in Southern Ocean Phaeocystis antarctica populations revealed through taxon-specific protein indicators, Nat. Commun., 10, 3582, https://doi.org/10.1038/s41467-019-11426-z, 2019.