the Creative Commons Attribution 4.0 License.
the Creative Commons Attribution 4.0 License.
 | 11 May 2026
Benthic phosphorus cycling in the northern Benguela upwelling system: excess P supply and altered pelagic nutrient stoichiometry
Kristin A. Ungerhofer
Darci Rush
Gert-Jan Reichart
The northern Benguela upwelling system (NBUS) off Namibia is one of the most productive marine regions globally, with intense biogeochemical cycling and burial of essential elements such as carbon (C), nitrogen (N) and phosphorus (P). Redox conditions, a key parameter in coupled biogeochemical cycling, are highly variable in both space and time; a perennial oxygen minimum zone (OMZ; minimum O2 ∼ 50 µmol L−1) impinges on the slope while the shelf is seasonally oxygen-depleted and even euxinic (i.e. free sulfide in the water column). Areas such as the NBUS are not only significant in regional and global marine element cycles and budgets but can also help predict the impact of globally increasing marine oxygen loss and associated altered nutrient cycling. Here, we aim to provide a hitherto lacking mechanistic framework for coupled benthic-pelagic cycling of the major nutrients N and P in response to (variable) redox conditions in the NBUS, with specific attention to the occurrence and importance of poorly understood, non-traditional P cycling mechanisms. We combine biogeochemical water-column and sediment data collected from the shelf to slope (100–1500 m water depth) during a cruise in austral summer when shelf bottom waters were low in oxygen. We show shifts in P cycling mechanisms from the slope to the shelf, and major shifts in N : P stoichiometry on the shelf from decoupled N-P cycling: nutrient-N (NO, NH) is lost as N2 by anaerobic microbial metabolism while excess P is supplied from the sediment. This excess P supply derives from labile sediment P pools other than organic matter: visual core inspection, phosphorus sequential extraction and pore-water chemistry together indicated that a large proportion of the highly reactive sedimentary P pool in shelf sediments consists of (i) P supplied in fish debris rather than marine algal biomass and/or (ii) P accumulated intracellularly by sulfide-oxidizing bacteria (SOB). To further improve our understanding of (de)coupled OMZ nutrient dynamics, we quantify the prominent role of excess benthic P supply in the pelagic N deficit in our study area. In this study, we not only provide an integrated framework for how coupled benthic-pelagic processes shape OMZ nutrient dynamics but also highlight the sensitivity of coupled biogeochemical cycles to spatial and temporal variability in depositional conditions.
- Article
(6823 KB) - Full-text XML
-
Supplement
(1665 KB) - BibTeX
- EndNote


The major nutrients nitrogen (N) and phosphorus (P) are crucial for marine primary productivity and thereby regulate the uptake and (long-term) storage of atmospheric CO2 in the ocean via the biological pump (Holland, 1978; Ruttenberg, 1993; Falkowski, 1997; Raven and Falkowski, 1999). The bioavailability of N and P for primary producers depends on the balance between supply to and removal from the ocean, which is in turn strongly affected by ocean oxygenation (i.e. redox conditions). For N, oxygen depletion in the water column and sediment boosts anaerobic N transformation processes, which represent a net sink for N through the conversion of inorganic nutrient-N (ammonium, NH, and nitrate, NO) to N2 or N2O (Voss et al., 2013). For P, reducing conditions generally decrease the sediment P retention capacity and thereby enhance recycling of P into overlying waters (Gächter et al., 1988; Ingall and Jahnke, 1994; Slomp et al., 2004). The P retention capacity is strongly linked to redox-dependent iron-sulfur (Fe-S) cycling: ferric iron (oxyhydr)oxides are efficient scavengers of dissolved phosphate that can undergo reductive dissolution accompanied by release of associated P, by microbial iron reduction or reaction with sulfide (Berner, 1984; Ruttenberg, 2014). The disparate responses of the marine biogeochemical N and P cycles to changes in redox conditions have been linked to marked changes in nutrient availability, stoichiometry and ocean biogeochemistry during past environmental perturbations, such as ocean anoxic events (Kuypers et al., 2004; Mort et al., 2007; Jenkyns, 2010). However, our incomplete understanding of the impact of such perturbations on (de)coupled N and P cycling in heterogenous marine environments inhibits accurate reconstruction of ancient ocean biogeochemical feedbacks and the co-evolution of redox conditions and nutrient cycles on Earth (Stüeken et al., 2016; Reinhard et al., 2017). Such feedbacks are also of importance considering the globally increasing extent and intensification of contemporary marine oxygen depletion, which is strongly connected to anthropogenic climate change and eutrophication (Diaz and Rosenberg, 2008; Middelburg and Levin, 2009; Breitburg et al., 2018; Oschlies et al., 2018).
Among marine systems that undergo seasonal, periodic or permanent oxygen depletion, upwelling areas are of great interest. These highly productive ocean regions are biogeochemical hotspots: the four major eastern boundary upwelling systems (EBUS), associated with the California, Humboldt, Canary and Benguela current systems (Chavez and Messié, 2009) together represent 1 % of ocean area but 5 % of global primary productivity (Messié and Chavez, 2015). The high organic matter fluxes boost the respiratory oxygen demand, resulting in oxygen depletion and even anoxia (i.e. absence of dissolved O2) in intermediate waters (the so-called oxygen minimum zone, OMZ) and shelf waters of EBUS. The spatially and temporally variable patterns of oxygen availability (i) modulate living conditions and communities of microbial and higher life and (ii) control the biogeochemical reaction pathways that determine the abundance and fate of N and P. Through benthic-pelagic coupling, altered benthic biogeochemical functioning can affect pelagic nutrient availability and stoichiometry, particularly in shallow waters such as EBUS shelf environments (Marcus and Boero, 1998; Dale et al., 2017). Because EBUS are directly connected to the open ocean, the element fluxes on the shelf can have large-scale (regional) effects on ocean biogeochemistry (Giraud et al., 2008; Ruttenberg, 2014; Dale et al., 2017).
Here, we study benthic-pelagic N and P cycling in the northern Benguela upwelling system (NBUS) off Namibia in the southeast Atlantic Ocean. The NBUS features a perennial OMZ (∼ 50 µmol L−1 O2) between 200–400 m below the sea surface (mbss). Shelf waters experience spatially and seasonally strongly variable redox conditions, with anoxia during austral summer. Recent work in the research area has shown extensive N loss on the shelf during anoxia, likely attributable to water-column denitrification (van Kemenade et al., 2022). Off-shelf transport of these N-depleted waters fuels N fixation in Angolan shelf waters to the north when currents transport the relatively N-depleted waters into the Angolan Gyre (Nagel et al., 2013; Flohr et al., 2014). However, little is known about benthic P dynamics and their role in the altered nutrient stoichiometry of shelf waters. High concentrations of phosphate have been measured in shelf sediments and attributed to P accumulation and release by sulfur-oxidizing microbes (Thiomargarita sp.) that also boost loss of N as N2 and thereby help regulate benthic N-P cycling (Schulz and Schulz, 2005; Goldhammer et al., 2010; Chuang et al., 2022). Regarding the chemical P pools in the sediment, Küster-Heins et al. (2010b) performed chemical sequential extractions of slope sediments (∼ 1000 mbss) that indicated that calcium phosphate (Ca-P) in fish debris is an important P burial phase and potentially a source of dissolved P. What remains missing so far is more integral insight into P burial and regeneration mechanisms as function of variable depositional conditions on the shelf and slope.
We performed sampling and chemical analysis of the water column and sediment from the anoxic shelf to the oxygenated slope in the northern Benguela upwelling system (NBUS) off Namibia (22–25° S; 100–1500 mbss; dissolved oxygen from 3 to 180 µmol L−1, equivalent to ∼ 0 %–50 % saturation). We combine water-column profiles of dissolved nutrients and supporting chemical parameters with chemical analyses of pore-water and bulk sediment composition as well as chemical forms of iron (Fe), P and sulfur (S) in surface sediments (0–40 cm sediment depth). We find that a combination of benthic and pelagic processes results in strong alteration of pelagic N and P concentrations and stoichiometry on the shelf under oxygen-depleted conditions. High rates of P release from labile pools in the uppermost sediment drive an efficient upward diffusive flux of P to the water column. In light of the global marine relationships between nutrient stoichiometry, microbial community composition and rates of primary productivity and remineralization (Lenton and Klausmeier, 2007; Moore et al., 2013; Moreno and Martiny, 2018), our results provide further insight into the coupled processes regulating benthic-pelagic N and P cycling.
2.1 Research area and sampling stations
Between 1 and 12 February 2019, the FUNAMOX (Biogeochemical functioning in Namibian oxygen-depleted waters) research expedition with RV Pelagia (cruise code 64PE449) was undertaken on the shelf and slope in the northern part of the BUS off the coast of Namibia between 22° and 26° S (Fig. 1). In the research area, shelf waters (up to ∼ 150 mbss) are characterized by high productivity as a result of upwelling of high-nutrient and low-oxygen waters from the deep sea (Chapman and Shannon, 1987; Shannon et al., 1987; Summerhayes et al., 1995; Emeis et al., 2017). Upwelling and current patterns result in (i) a perennial OMZ with dissolved O2 concentrations down to ∼ 50 µmol L−1 on the slope between ∼ 200–400 mbss, and (ii) seasonal bottom-water anoxia on the shelf with recurring water-column anoxia and episodic sedimentary release of hydrogen sulfide (HS−) (Mohrholz et al., 2014; Nagel et al., 2016; Ohde and Dadou, 2018; van Kemenade et al., 2022). The northern BUS (NBUS) is a region with its own distinct seasonality of wind forcing and upwelling (Emeis et al., 2017) with most intense oxygen depletion on the shelf in late austral summer, i.e. January–February (Brüchert et al., 2006; Mohrholz et al., 2008).
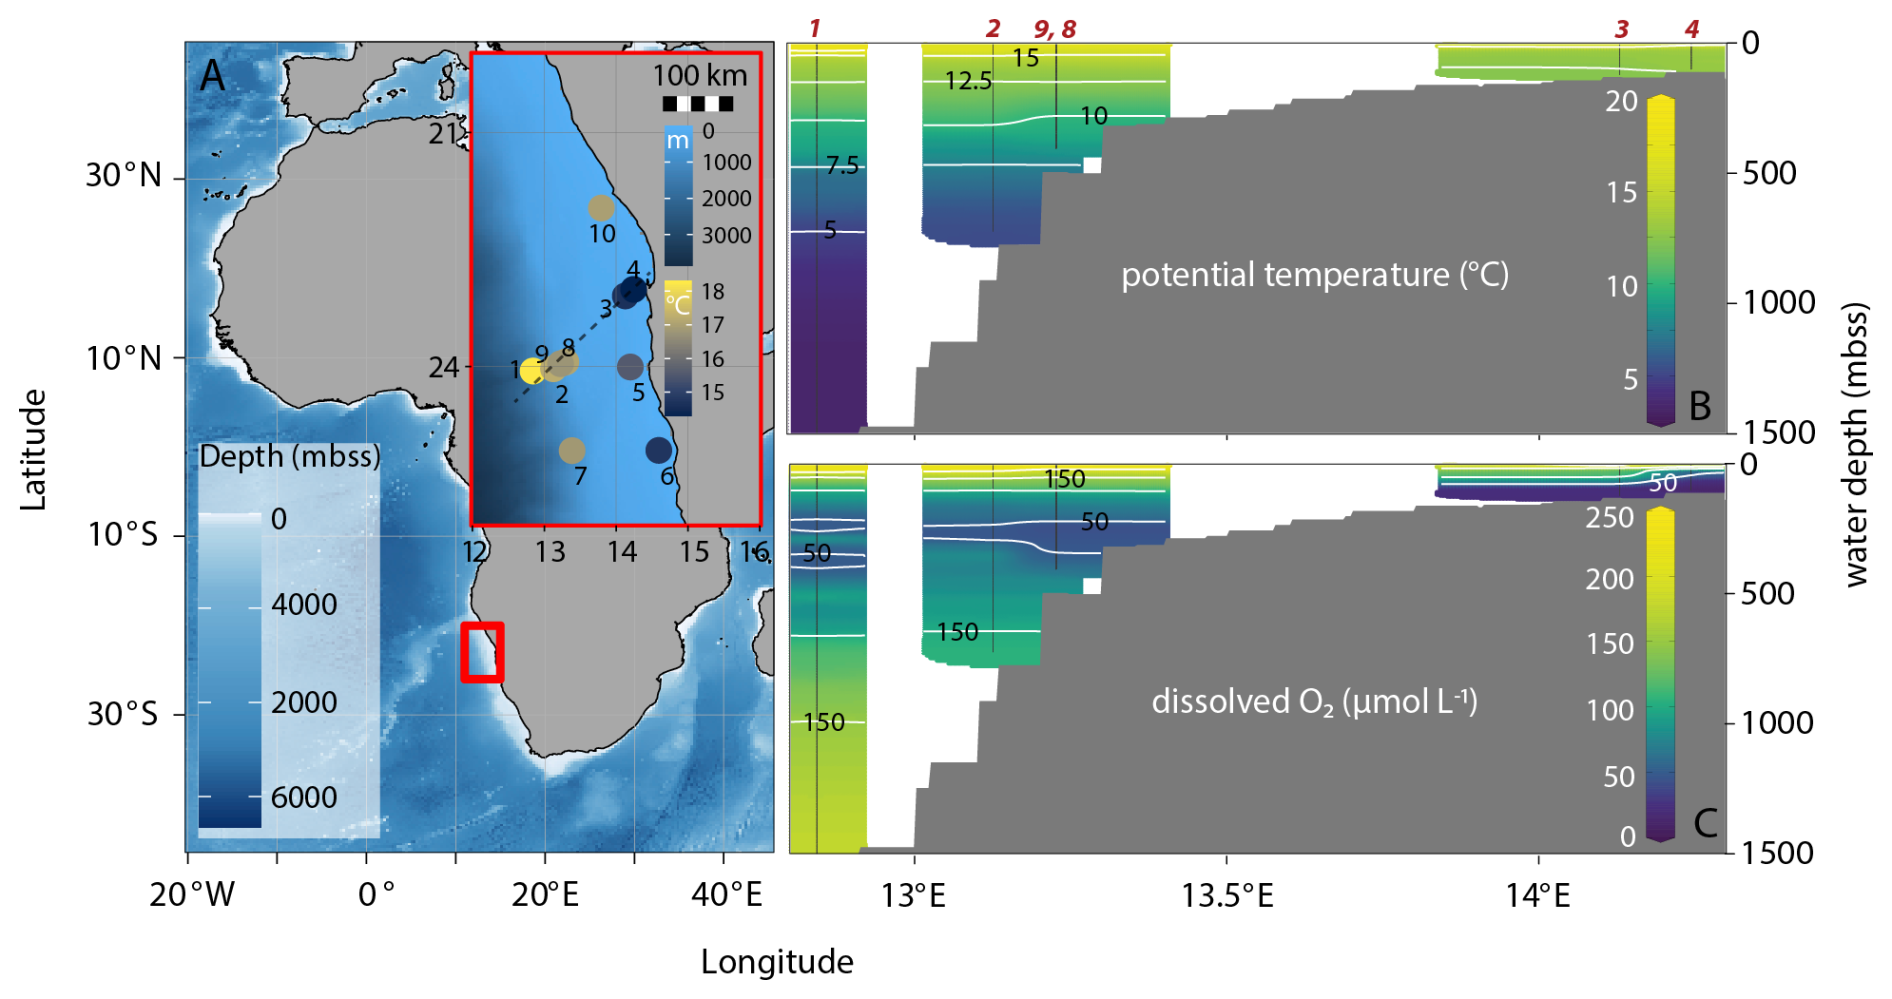
Figure 1Bathymetric map of eastern Atlantic Ocean with general research area indicated by the red square and the inset showing station locations within the research area; inset has color bars for bathymetry and surface-water temperature, the latter showing upwelling as low temperatures at coastal stations. The dashed line shows the transect chosen for the cross sections in the other panels (stations 1, 2, 3, 4, 8, 9) (A). Cross sections show gridded, interpolated potential temperature (B) and dissolved oxygen (C) with station locations in red. Potential temperature shows relatively cold surface waters from coastal upwelling: yellow colors indicating highest water temperatures can be seen in the slope area but not the shelf area (green color, lower temperature). Dissolved oxygen shows the mild perennial OMZ at 200–300 mbss and the strongly oxygen-depleted waters (< 5 µmol L−1) on the shelf. Bathymetric map was made with ggOceanMaps in Rstudio, cross sections are adapted from Ocean Data View (Schlitzer, 2025).
During FUNAMOX, water and sediment were sampled at shelf and slope stations between 100 and 1500 mbss, from the anoxic shelf to the oxygenated slope below the perennial OMZ. Physicochemical properties were measured throughout the water column at each station using a CTD-rosette equipped with conductivity-temperature-density (CTD, Seabird SBE 911plus), oxygen (Seabird SBE 43), fluorescence and turbidity (Seabird ECU FLNTU) sensors mounted on a rosette with 24 polypropylene water-sampling bottles (volume 12 L). The oxygen sensor was calibrated using O2 measurements (Winkler titration) in discrete water samples capturing the full range of O2 concentrations encountered during the cruise (∼ 0–200 µmol L−1). The sensor has an uncertainty of approximately ± 5 µmol O2 L−1 as indicated by the supplier; concentrations around 0 µmol L−1 (anoxia) should be treated with some caution. Discrete water samples were taken by remotely closing sampling bottles at selected depths for subsequent sub-sampling and (on-board) chemical analyses (see below). Surface sediments were collected with a multi-corer (Oktopus GmbH) equipped with 10 polycarbonate tubes (10 cm diameter).
2.2 Water-column sampling and analysis
Immediately after recovery of the CTD-rosette, bottles were sub-sampled for a range of dissolved species as detailed in Table 1. First, a 30 mL sample was taken with a polypropylene syringe and filtered using a 0.8/0.2 µm Pall Acropak syringe filter that was rinsed three times with sample water. Once all bottles had been sampled, water samples were taken into a laboratory container and sub-sampled for: total alkalinity (TAlk); dissolved inorganic carbon (DIC); soluble reactive P (SRP; here referred to as HPO, the dominant species at seawater pH of 8.2) and Si (H4SiO4); NH, NO and NO (together termed dissolved inorganic nitrogen, DIN). All these analytes were measured by segmented-flow analysis (QuAAtro auto-analyser, AA). Quality control was performed by including a 10-point calibration for each analyte (r = 0.9999–1.0000) and replicate measurement during each analytical run of an internal nutrient standard, which has been validated in various inter-calibration exercises (ICES, Quasimeme, Inter Comparison). Furthermore, two KANSO CRMs (BY, CA) were included in analytical runs for N, P and Si. Dickson CRMs were measured in all DIC and TAlk analytical runs and a correction to the results was applied based on the offset between the measured and certified value (relative standard deviation generally < 5 %). Method detection limits were determined by analysis of 10 replicate samples containing 2 % of the highest standard, limits were (in µmol L−1): 3.5 (DIC, TAlk), 0.005 (HPO), 0.019 (NH), 0.015 (NO), 0.003 (NO), 0.008 (Si). Relative standard deviation was < 1 % for replicate measurement of all species. For HS−, we used the methylene-blue colorimetric method (Cline, 1969). A stock solution was prepared from Na2S, validated by iodometric titration and used for a calibration curve between 0 – 100 µmol L−1. The detection limit for HS− was determined as twice the standard deviation of five milli-Q blanks: ∼ 3 µmol L−1. At stations 2 (750 mbss) and 6 (100 mbss), contrasting slope and shelf environments, in addition to SRP and DIN measurements, another set of sub-samples was taken at selected depths for analysis of total (dissolved + particulate) and total dissolved pore-water P and N, see the Supplement. The difference between total dissolved N and DIN was assumed to represent dissolved organic N (DON). The difference between total dissolved P and HPO was assumed to represent dissolved organic P (DOP). The difference between filtered and unfiltered totals represents particulate N and P. For dissolved Fe and Mn analysis, filtered pore-water samples were diluted 30-fold with 1 M, twice-distilled HNO3 and analysed by induced coupled plasma mass spectrometry (ICP-MS, Thermo Scientific Element II). The HNO3 matrix contained internal standards (In, Rh) to correct for drift. Iron and manganese calibrations, using an element cocktail prepared from certified standards, were included in each analytical run. Acid blanks were included to correct the baseline. Detection limits were < 0.1 µmol L−1 for Fe and Mn.
Table 1Sampling, treatment and analysis of aqueous samples.
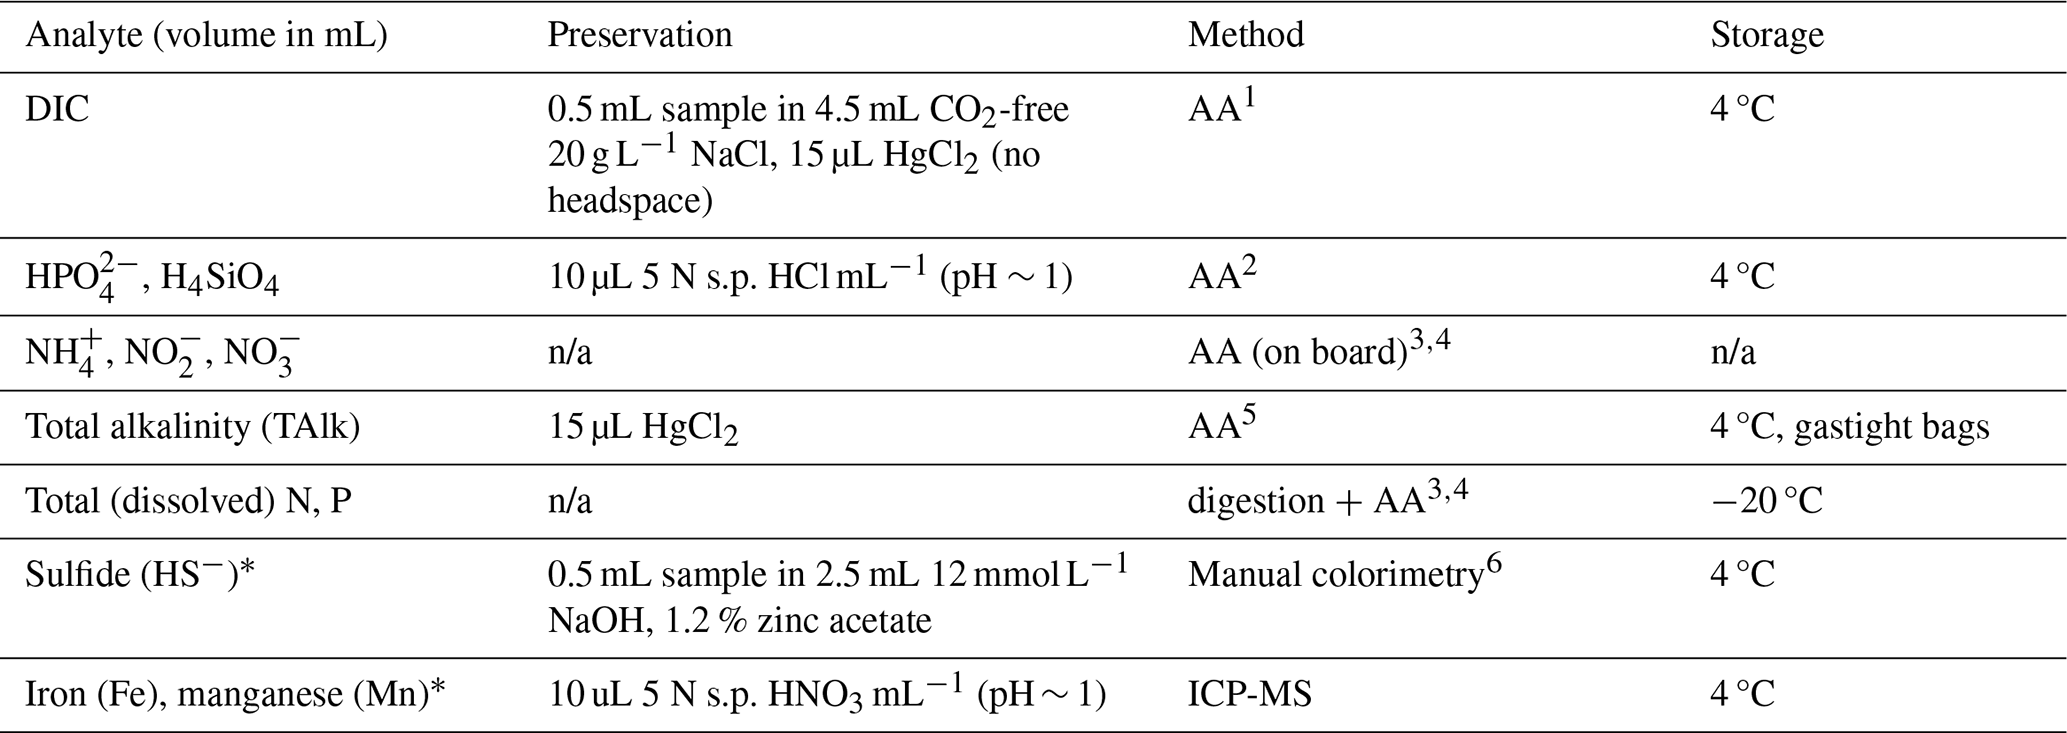
1Stoll et al. (2001); 2Murphey and Riley (1962); 3Helder and De Vries (1979); 4Grasshoff et al. (2009); 5Sarazin et al. (1999); 6Cline (1969). n/a: not applicable. ∗ Note: sub-samples for dissolved HS−, Fe and Mn were only taken from pore-water. Ammonium, nitrite and nitrate were measured on board, and all other analyses were performed at the NIOZ.
2.3 Sediment sampling and analysis
2.3.1 Micro-profiling
Immediately after recovery, sediment cores were checked to ensure that the sediment surface was intact and that cores showed no visible signs of disturbance. Several cores were then processed for a suite of analyses. One core was immediately transported into the dry lab, where the core was carefully manipulated so that ∼ 5 cm of overlying water remained, after which replicate O2 micro-profiles were collected with Unisense OX-50 (50 µm tip) glass micro-electrodes operated with a micromanipulator and connected to a Unisense PA2000 picoamperometer. Vertical measurement interval was 250–1000 µm, increasing with sediment depth. Profiling was stopped once O2 concentrations approached zero. For replicate measurements, the micro-electrode was moved to a new, undisturbed area of the sediment surface. The O2 readings are reported as % air saturation at ambient bottom-water temperature; O2 profiles and information on the temperature calibration at 100 % air saturation can be found in the Supplement. Diffusive O2 uptake by the sediment at each station was calculated from the dissolved O2 gradient in the diffusive boundary layer as described in the Supplement. Stations with strongly oxygen-depleted bottom water (3, 4, 5, 6, 10) were omitted because of bias introduced by introduction of atmospheric oxygen into the overlying water before and during measurements. Individual profiles took about 10 min; we saw no evidence of large drift in the results reported here.
2.3.2 Core slicing for porosity
A second core was placed on a hydraulic core slicer in a temperature-controlled container set to bottom-water temperature and the core was sectioned into intervals of 0.5–4 cm, the resolution decreasing with depth. A sub-sample of each sediment interval was transferred into a pre-weighed 20 mL plastic container that was stored at −20 °C until further processing. The remaining sediment from each interval was transferred into a geochemical sampling bag and stored frozen. Back in the NIOZ laboratory on shore, the 20 mL containers with frozen wet sediment were weighed, freeze-dried and then weighed again; the mass loss was used to calculate the gravimetric water content and porosity (Burdige, 2006). In addition, the water content was used to correct the mass of dried samples for the contribution by sea salt, which was significant (up to ∼ 50 % of dry sample mass) especially in top samples with high porosity.
2.3.3 Core slicing for pore-water and solid sediment chemistry
A third core was immediately transferred into an N2-purged glove bag in a temperature-controlled container set to bottom-water temperature. A bottom-water sample was taken about 10 cm above the sediment surface with a 20 mL syringe; this sample was processed together with the pore-water samples. Subsequently, the sediment was sliced at the same vertical resolution as the core sectioned for porosity. Sediment slices were transferred into polypropylene centrifuge tubes that were centrifuged for 30 min at 4000 rpm and transferred into a second N2-purged glove bag, where the pore-water was decanted into acid-cleaned 20 mL polypropylene syringes and filtered using acid-cleaned 0.2 µm PES syringe filters. The filtered pore-water was subsampled for analysis of dissolved species as detailed in Table 1. Fluoride was measured with the spectrophotometric method of Greenhalgh and Riley (1961). Depletion of F− can be indicative of formation of calcium fluorapatite (Ca5(PO4)3F), an important long-term P sink (Ruttenberg and Berner, 1993; Schenau et al., 2000). The wet sediment residue was stored under N2 in gas-tight aluminium-laminate bags at −20 °C to minimize alteration of the original sediment chemistry.
2.3.4 Analysis of bulk sediment chemistry
At NIOZ, the frozen wet sediment residue was allowed to thaw in a N2-purged glove bag. A well-mixed sub-sample of the wet sediment was taken, weighed and gravimetric water content was determined from mass loss after freeze-drying. The freeze-dried material was ground and used for measurement of (i) total organic carbon (TOC) and total nitrogen (TN), and (ii) total elements. We note that minor loss of N can occur upon decalcification, which can affect N isotopic composition but has only a minor effect on total N content. For TOC and TN, a sub-sample of the freeze-dried and ground sediment was weighed into a tin cup and decalcified by adding small aliquots of 2 M HCl and placing the wetted samples in a desiccator containing an open beaker of fuming HCl for 12 h. After adding two final aliquots of 30 µL of 2 M HCl to each sample, sample were dried in an oven at 60 °C for 1 h (modified protocol of Needoba et al. (2007)). The TOC and TN content in the carbonate-free sediment was measured with a Thermo-Interscience Flash EA 1112 CN analyser. Total major and minor elements (Al, Ca, Cd, Fe, Mn, Mo, P, S, V) were measured in acid digests of the sediment with a Thermo Scientific Element 2 high-resolution ICP-MS. For acid digestion, about 100–125 mg of the freeze-dried and homogenized sediment was digested in a closed Teflon vessel on a hot block in a mixture of 2.5 mL HF, 1 mL HNO3, 1.5 mL HClO4 and 1 mL HCl at 90 °C for 12 h. Subsequently, the acid mixture was evaporated to near dryness at 190 °C, after which the residue was re-dissolved in 20 mL of 1 M HNO3 at 110 °C overnight. The Ca content was used to calculate CaCO3 content including correction for clay-associated Ca using Al content and the Ca Al ratio in clay: CaCO3(wt %) (Ca).
2.3.5 Sequential wet chemical extraction of sediment iron, phosphorus and sulfur pools
From the thawed wet sediment in the N2-purged glove bag at NIOZ, three further sub-samples were taken for sequential chemical extraction of Fe, P and S (Table 2). A modified protocol based on Poulton and Canfield (2005) and Claff et al. (2010) as presented in Kraal et al. (2017) was used to extract highly reactive Fe (HR-Fe), which has been defined by Poulton and Canfield (2005) as the combined Fe pools that are reactive towards or have reacted with dissolved sulfide. Iron concentrations in the extracts were determined with the 1,10-phenanthroline method (APHA, 2005). In the 1 M HCl extracts (i.e. labile Fe), Fe(II) and total Fe were determined by measuring Fe before and after adding the reducing agent hydroxylamine, respectively; Fe(III) was then calculated by difference (Viollier et al., 2000). The pool of poorly reactive + unreactive Fe (PR-Fe), which represents silicate-bound Fe and potentially other recalcitrant Fe species, was calculated as the difference between HR-Fe and total Fe, the latter obtained from total sediment digestion.
Table 2Sequential extraction protocols for highly reactive iron, total phosphorus and reduced inorganic sulfur. Highly-reactive Fe (HR-Fe) is the sum of the extracted Fe pools listed below; poorly-reactive and unreactive Fe (PR-Fe) is the difference between HR-Fe and total Fe determined from sediment total digestion.
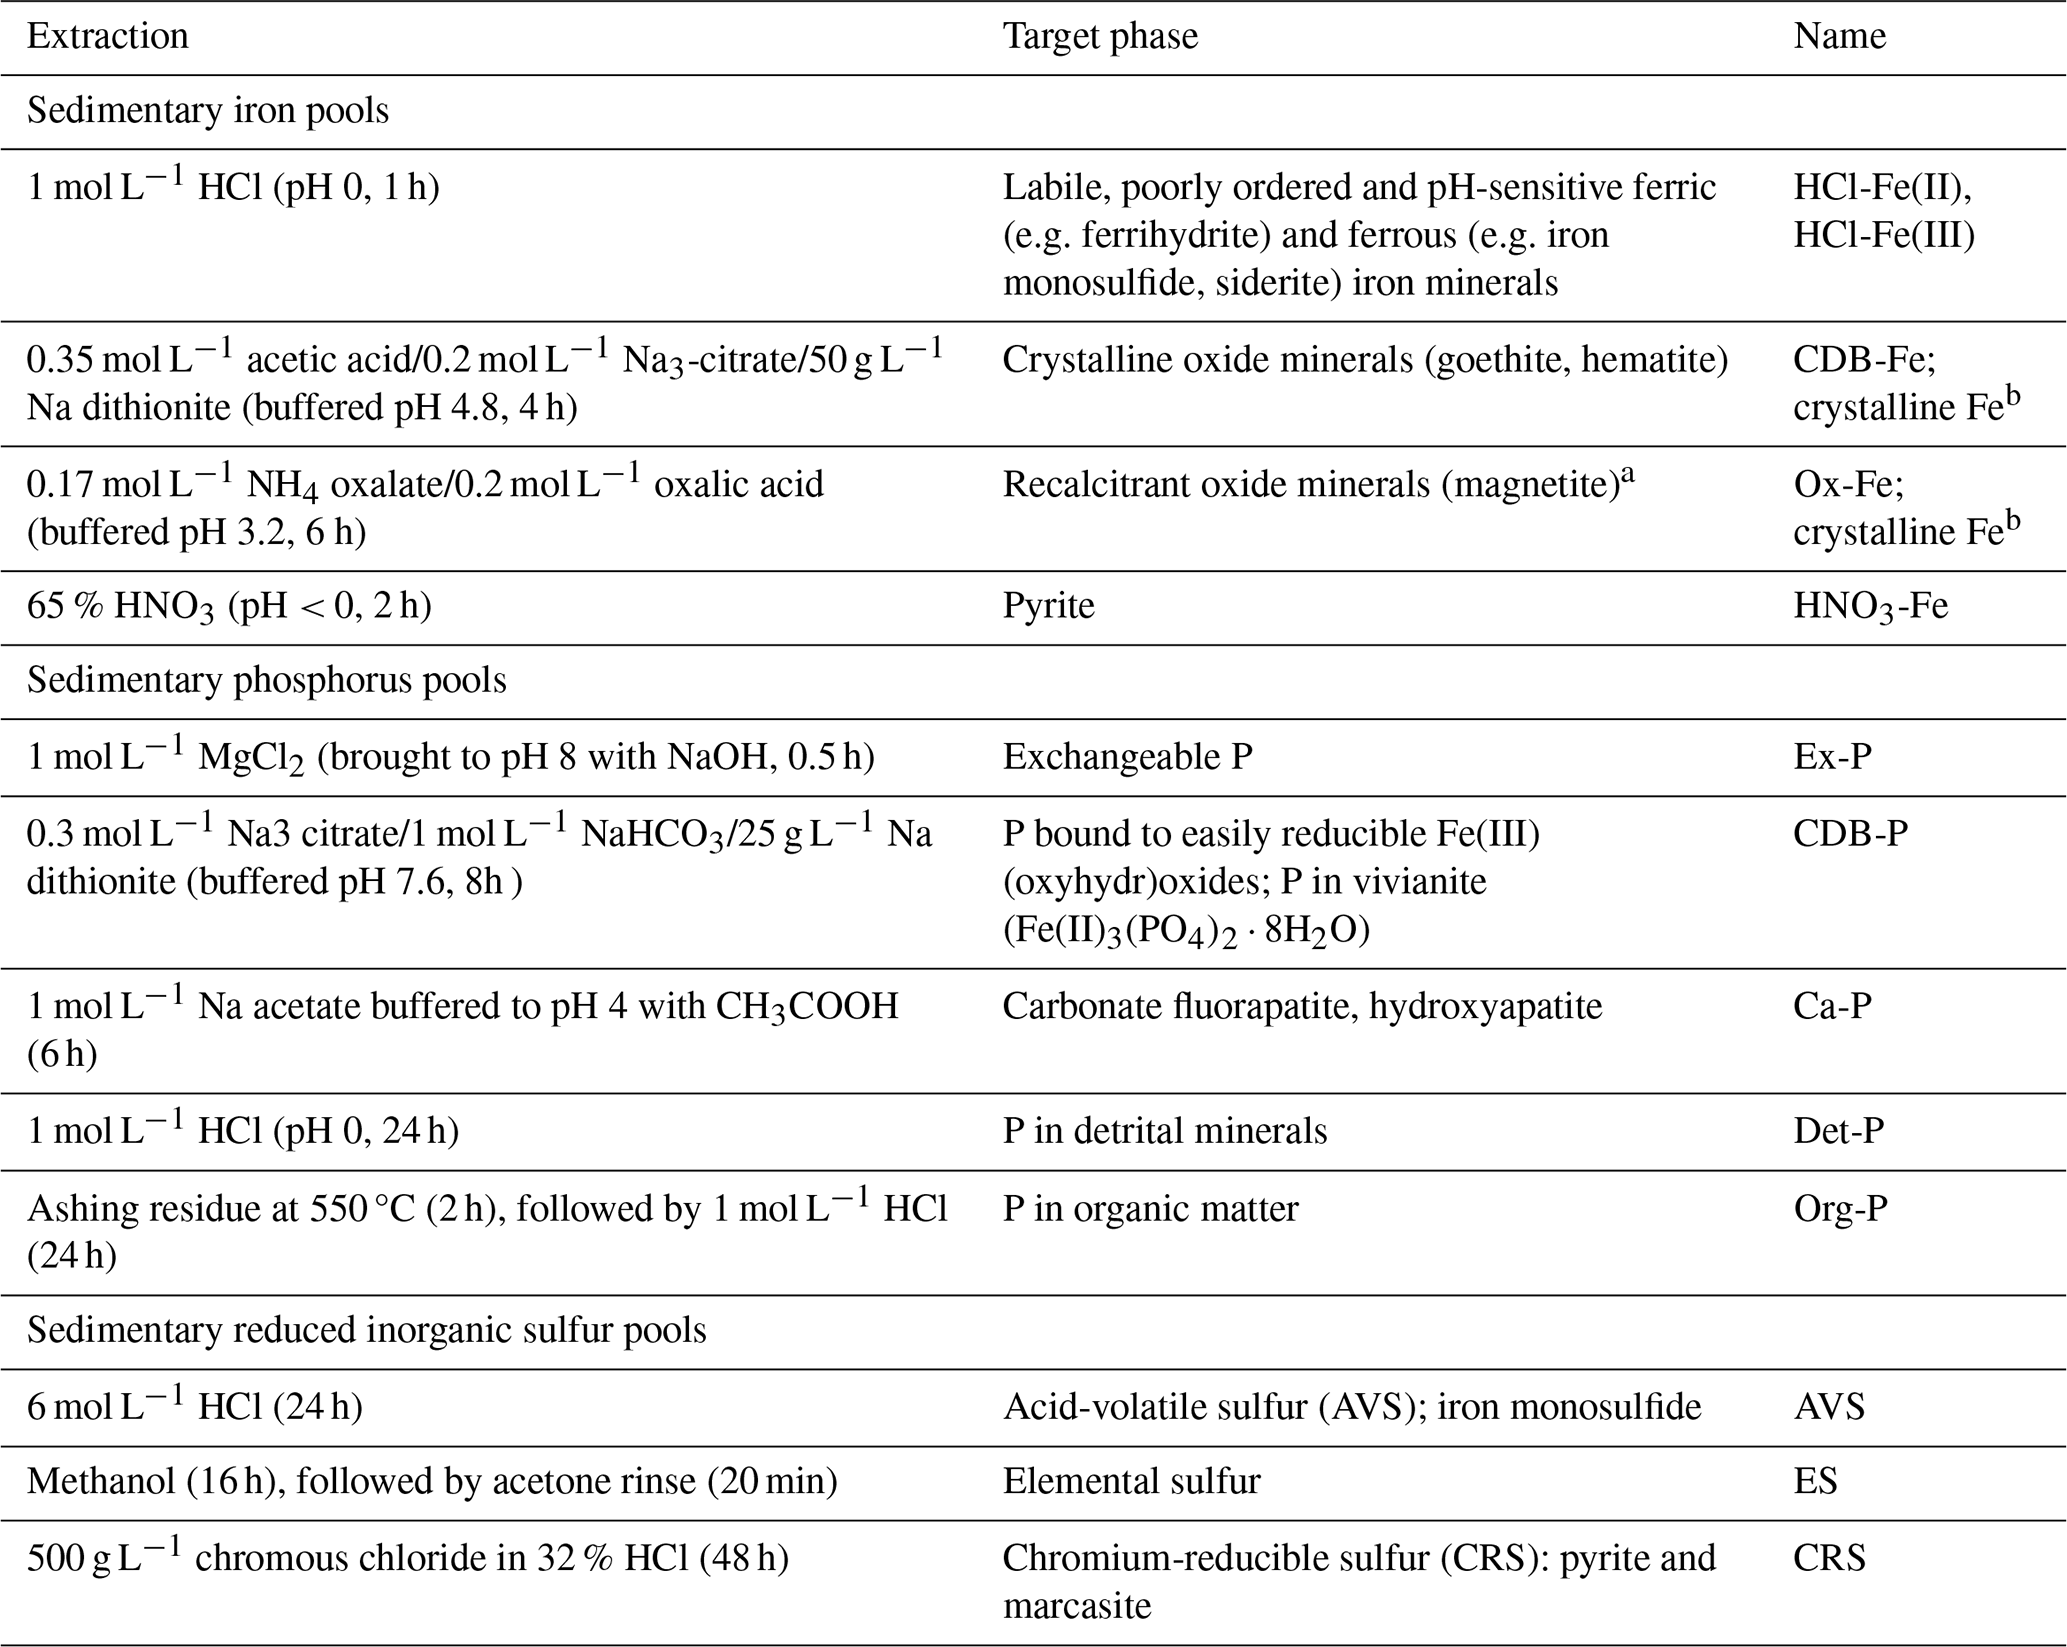
a Due to likely partial dissolution of magnetite in 1 mol L−1 HCl (Poulton and Canfield, 2005) and the acetic acid–citrate–dithionite solution (Claff et al., 2010), this likely only represents the most recalcitrant magnetite. b In light of the above uncertainty, CDB-Fe and oxalate-Fe are collectively referred to as crystalline Fe(III).
For P, total P was fractionated using the SEDEX protocol of Ruttenberg (1992). Phosphorus concentrations in the extracts were determined with the molybdate-blue method (APHA, 2005). For the dithionite extracts, this was done following the sample pretreatment detailed in Anschutz et al. (2005) to overcome issues with the matrix.
Reduced inorganic sulfur (RIS) pools (i.e. metal monosulfides, elemental sulfur, pyrite) were extracted following the protocol detailed in Kraal et al. (2013) based on the passive sulfide extraction method presented in Burton et al. (2008). The AVS and CRS were quantified by iodometric titration (APHA, 2005), the ES was quantified using the cyanolysis method detailed in Bartlett and Skoog (1954). The difference between total S from sediment digestion and the extracted RIS pools is assumed to represent organic S.
2.4 Benthic flux measurements by on-deck, whole-core incubations
Table 3Overview of selected key parameters for the investigated stations, grouped as shelf, OMZ and slope stations. BWO is bottom-water oxygen concentration, OPD is oxygen penetration depth in mm, with standard deviation in parentheses. Note that not all parameters were determined at all stations, missing data indicated with hyphen. TOC represents surface sediment (top 2 cm) with the standard deviation between parentheses (TOC not determined for stations 5 and 9).
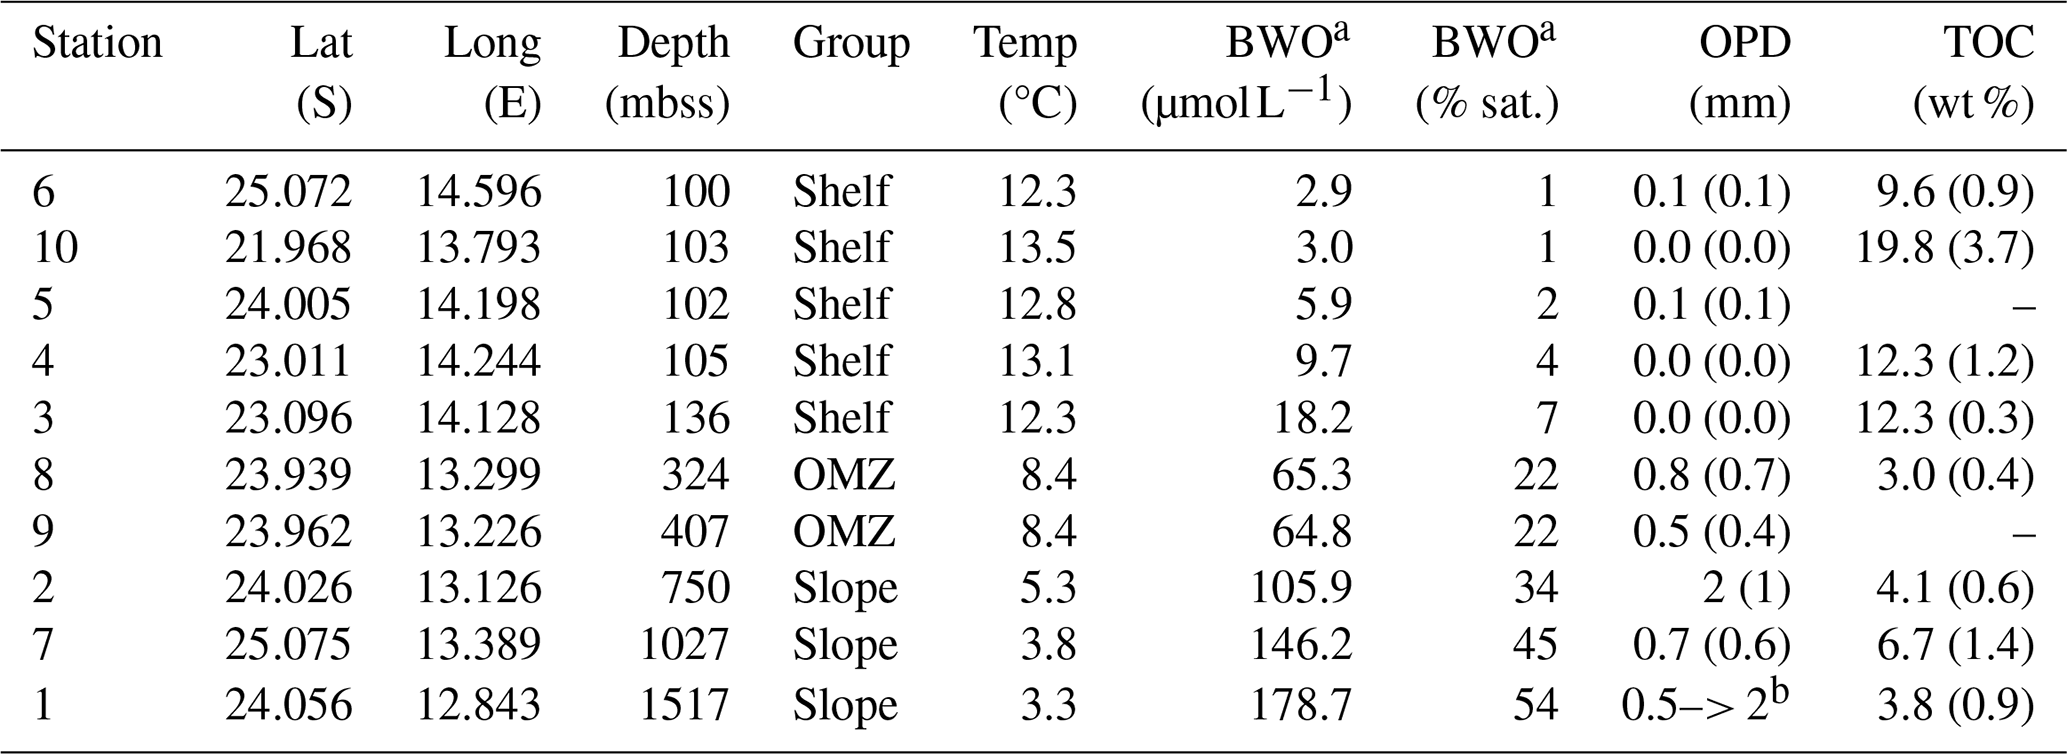
a Deepest value determined with CTD-mounted O2 sensor, about 5 m above the sea floor. b Incomplete profile for one replicate; zero O2 not reached at 2 mm sediment depth.
At selected stations covering the redox transect (2, 3, 4, 6, 7, 8, 10), three multi-core tubes (10 cm diameter) were equipped with Presens (GmbH) oxygen spots and, after core recovery from the seafloor, capped with custom-made gas-tight lids with two ports and a stir motor to which a small stir bar was magnetically attached. The core tubes contained ∼ 25 cm sediment and 35 cm overlying water. The overlying water was continuously stirred (60 rpm) and O2 was measured every 5 min using a Presens OXY-4 setup with fibre optic cables and sensor spots, operated with the Presens Measurement Studio 2 software. One port of the lid was connected to a 10 L carboy with water from the deepest CTD/rosette bottle collected at the station, usually 5–10 m above the seafloor. The second port was used as sampling port, through which 20 mL samples of the overlying water were taken with an acid-cleaned, 30 mL polypropylene syringe at different time intervals (six sampling points equally spaced over an incubation period of ∼ 10 h; see time series in the Supplement). During sampling, the extracted volume was replenished with bottom water from the connected carboy. The water samples were immediately filtered using 0.2 µm acid-cleaned PES syringe filters and sub-sampled for: DIC, TAlk, major and minor elements (metals), NH, NO, NO, HPO, Si, as described in Table 1. The first few mL of sample were used to rinse the filter. At each sampling point, only 2 % of the water was replaced (< 15 % over the whole incubation), minimizing the impact of an evolving difference in chemistry between the water in the container and in the core incubation. Cores were checked throughout the incubation for signs of sediment suspension which would indicate over-stirring. Whole-core benthic fluxes were calculated as described in the Supplement.
A summary of key sediment and bottom-water properties is provided in Table 3. The investigated stations were grouped as shelf, OMZ and slope stations. Shelf stations (6, 10, 5, 4, 3) had water depths of around 100 m, deep waters with relatively high temperatures of 12–13 °C and low oxygen concentrations (3–10 µmol L−1), and surface sediments (0–2 cm) that were strongly enriched in TOC (10 wt %–20 wt %). The OMZ stations (8, 9) were located at intermediate depths of 300–400 mbss within the perennial OMZ, with colder (8 °C) and better oxygenated (65 µmol L−1) bottom waters compared to the shelf, and with surface sediment that showed the lowest TOC contents (3 wt %) of the investigated stations. The slope stations (1, 2, 7) between 750 and 1500 mbss were characterized by the lowest deep-water temperatures (3–5 °C), relatively high bottom-water oxygen concentrations (100–180 µmol L−1) and organic-rich surface sediment (4–7 wt % TOC).
3.1 Sediment chemistry
Bulk solid-phase elemental profiles showed contrasts in sediment chemistry between the shelf and slope sites (Fig. 2). The CaCO3 content was relatively low (12 ± 8 wt %, range 0–40 wt %) in sediments on the shelf, while TOC was strongly enriched (mean 12 ± 5 wt %) with a maximum of 26 wt %. The highest CaCO3 and TOC contents were measured at station 10, which also stood out because of the high and variable P content of up to 1500 µmol g−1 (4.6 wt %), correlating with Ca content. Total contents of Fe, P, S, Mo and V (determined by ICP-MS analysis of sediment digests) were (considerably) higher in shelf sediments compared to slope sediments, where the CaCO3 content was high (69 ± 7 wt %) and TOC was relatively low: 5 ± 2 wt % (range 3–11 wt %). Solid-phase manganese (Mn) concentrations were very low at all stations, with a maximum of 6 µmol g−1 (data not shown). The shelf stations showed downward increasing TOC N, most notably at stations 6 and 10 where values increased from 4–7 to 10–11. The molar TOC N ratios revealed no down-core trend but considerable scatter in slope and OMZ sediment with values of 8–10 and 10–12, respectively (Fig. 3). The molar TOC P ratio showed large variability between stations across the different depositional environments with values < 100 on the shelf, in the OMZ and on the upper slope (station 2), while values of 100–200 were observed at the deepest slope stations 7 and 1. The lowest values were measured in sediment at station 10: average 28 ± 19, range 6–78. The molar Fetot/Stot ratio was relatively constant down-core at most stations and showed an overall increase from the shelf (< 0.5) to the slope (1–1.5). Station 6 stood out with a strong down-core increase in Fetot/Stot from < 0.1 to a maximum of 2.3 at depth.
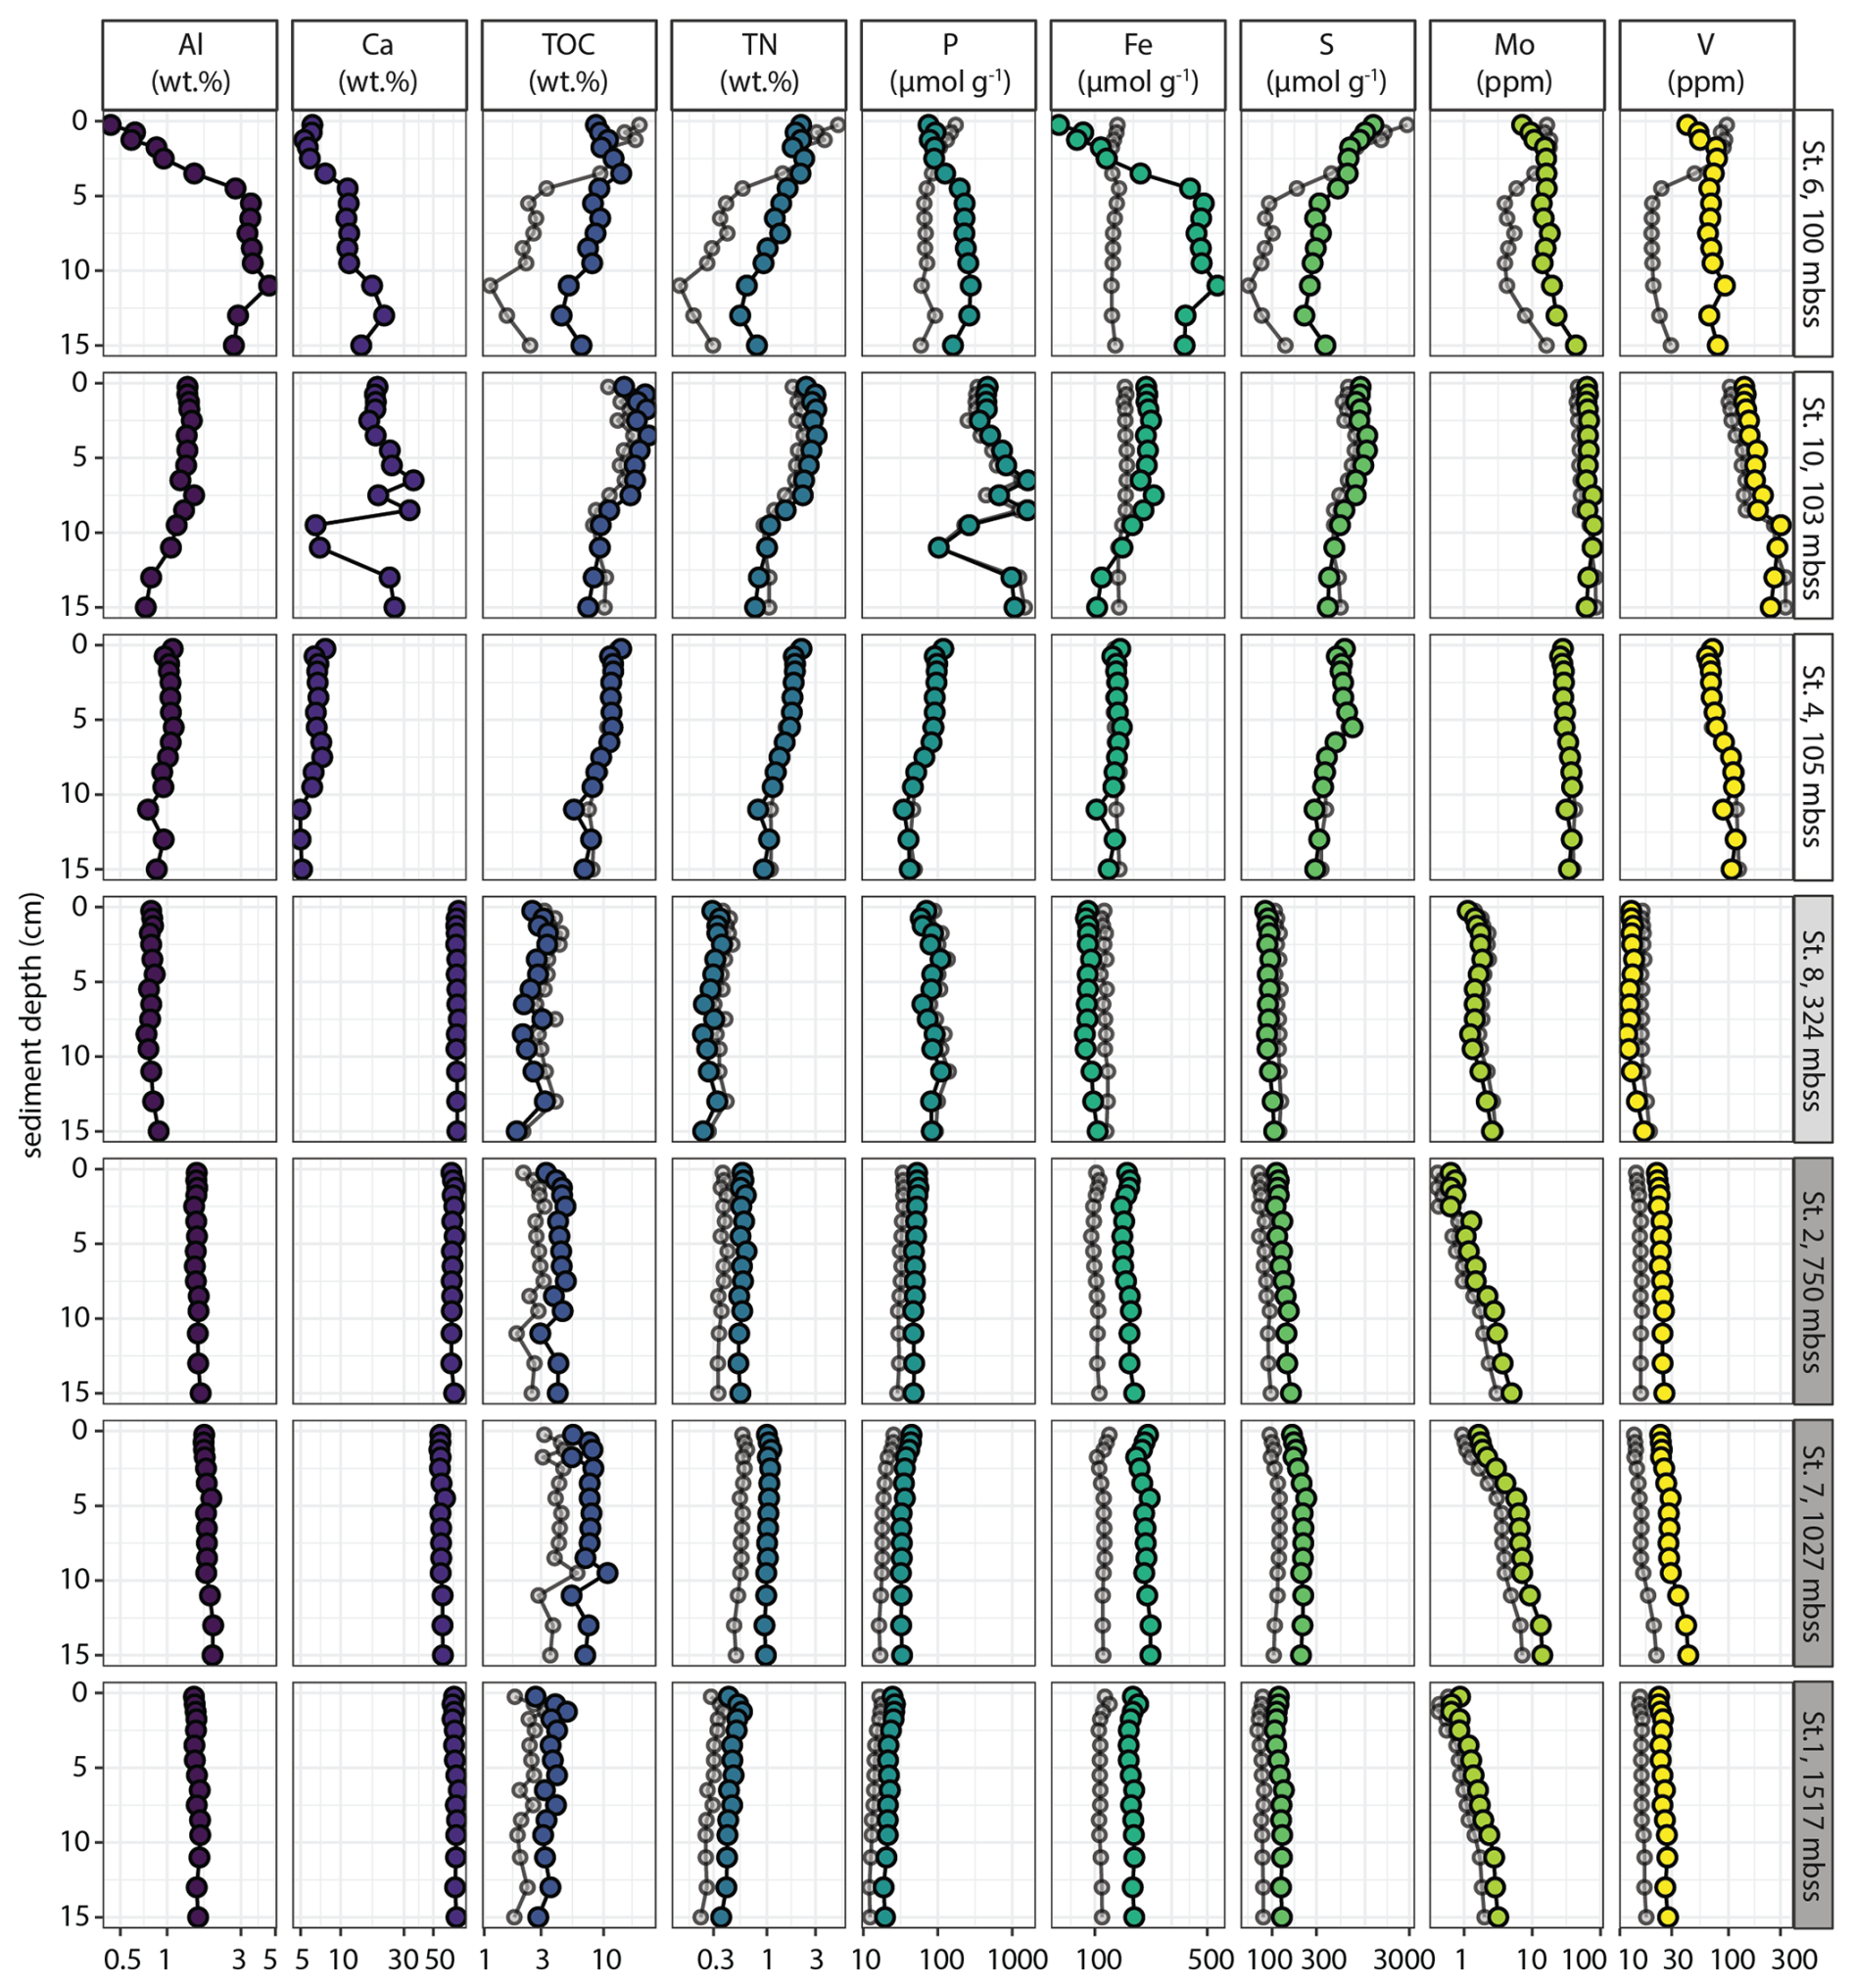
Figure 2Sediment profiles of key solid-phase chemical parameters (total concentrations). Al-normalized profiles are shown in semi-transparent grey. In all figures: white, light grey and grey fills of title panels on left indicate shelf, OMZ and slope stations, respectively (see Table 3).
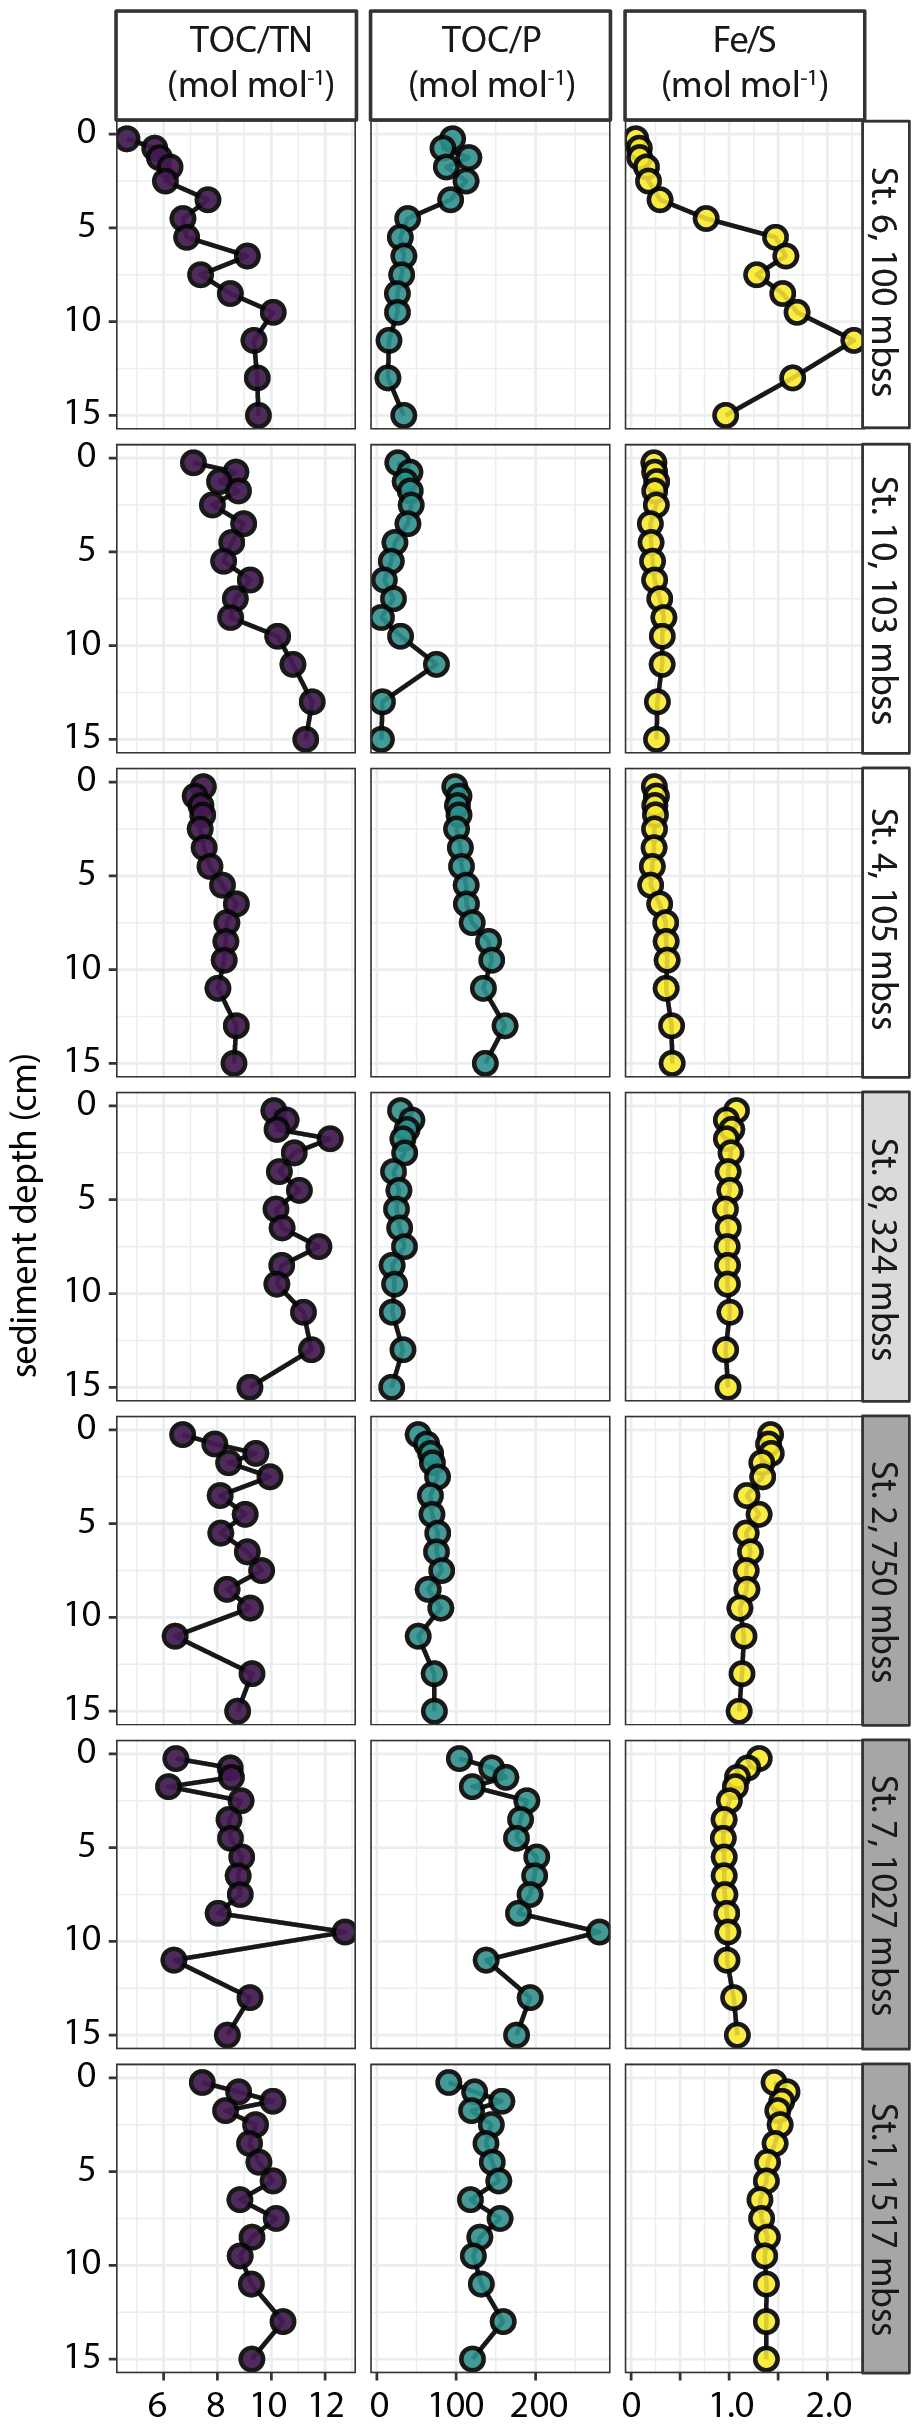
Figure 3Molar ratios of sedimentary TOC N, TOC P and Fe S plotted against sediment depth for selected stations.
The sedimentary Fe pool was dominated by poorly reactive and unreactive Fe (PR-Fe, e.g. silicate-bound Fe) (Fig. 4A), which made up 73 ± 11 % of total solid-phase Fe. Only at sediment depth > 5 cm at station 7 was reactive Fe quantitatively more important than PR-Fe. The major reactive Fe pools were HCl-Fe(II), CBD-Fe and HNO3-Fe that all accounted for 5 %–20 % of Fe at the selected stations. At Station 4, a small but persistent pool of HCl-Fe(III) was detected.
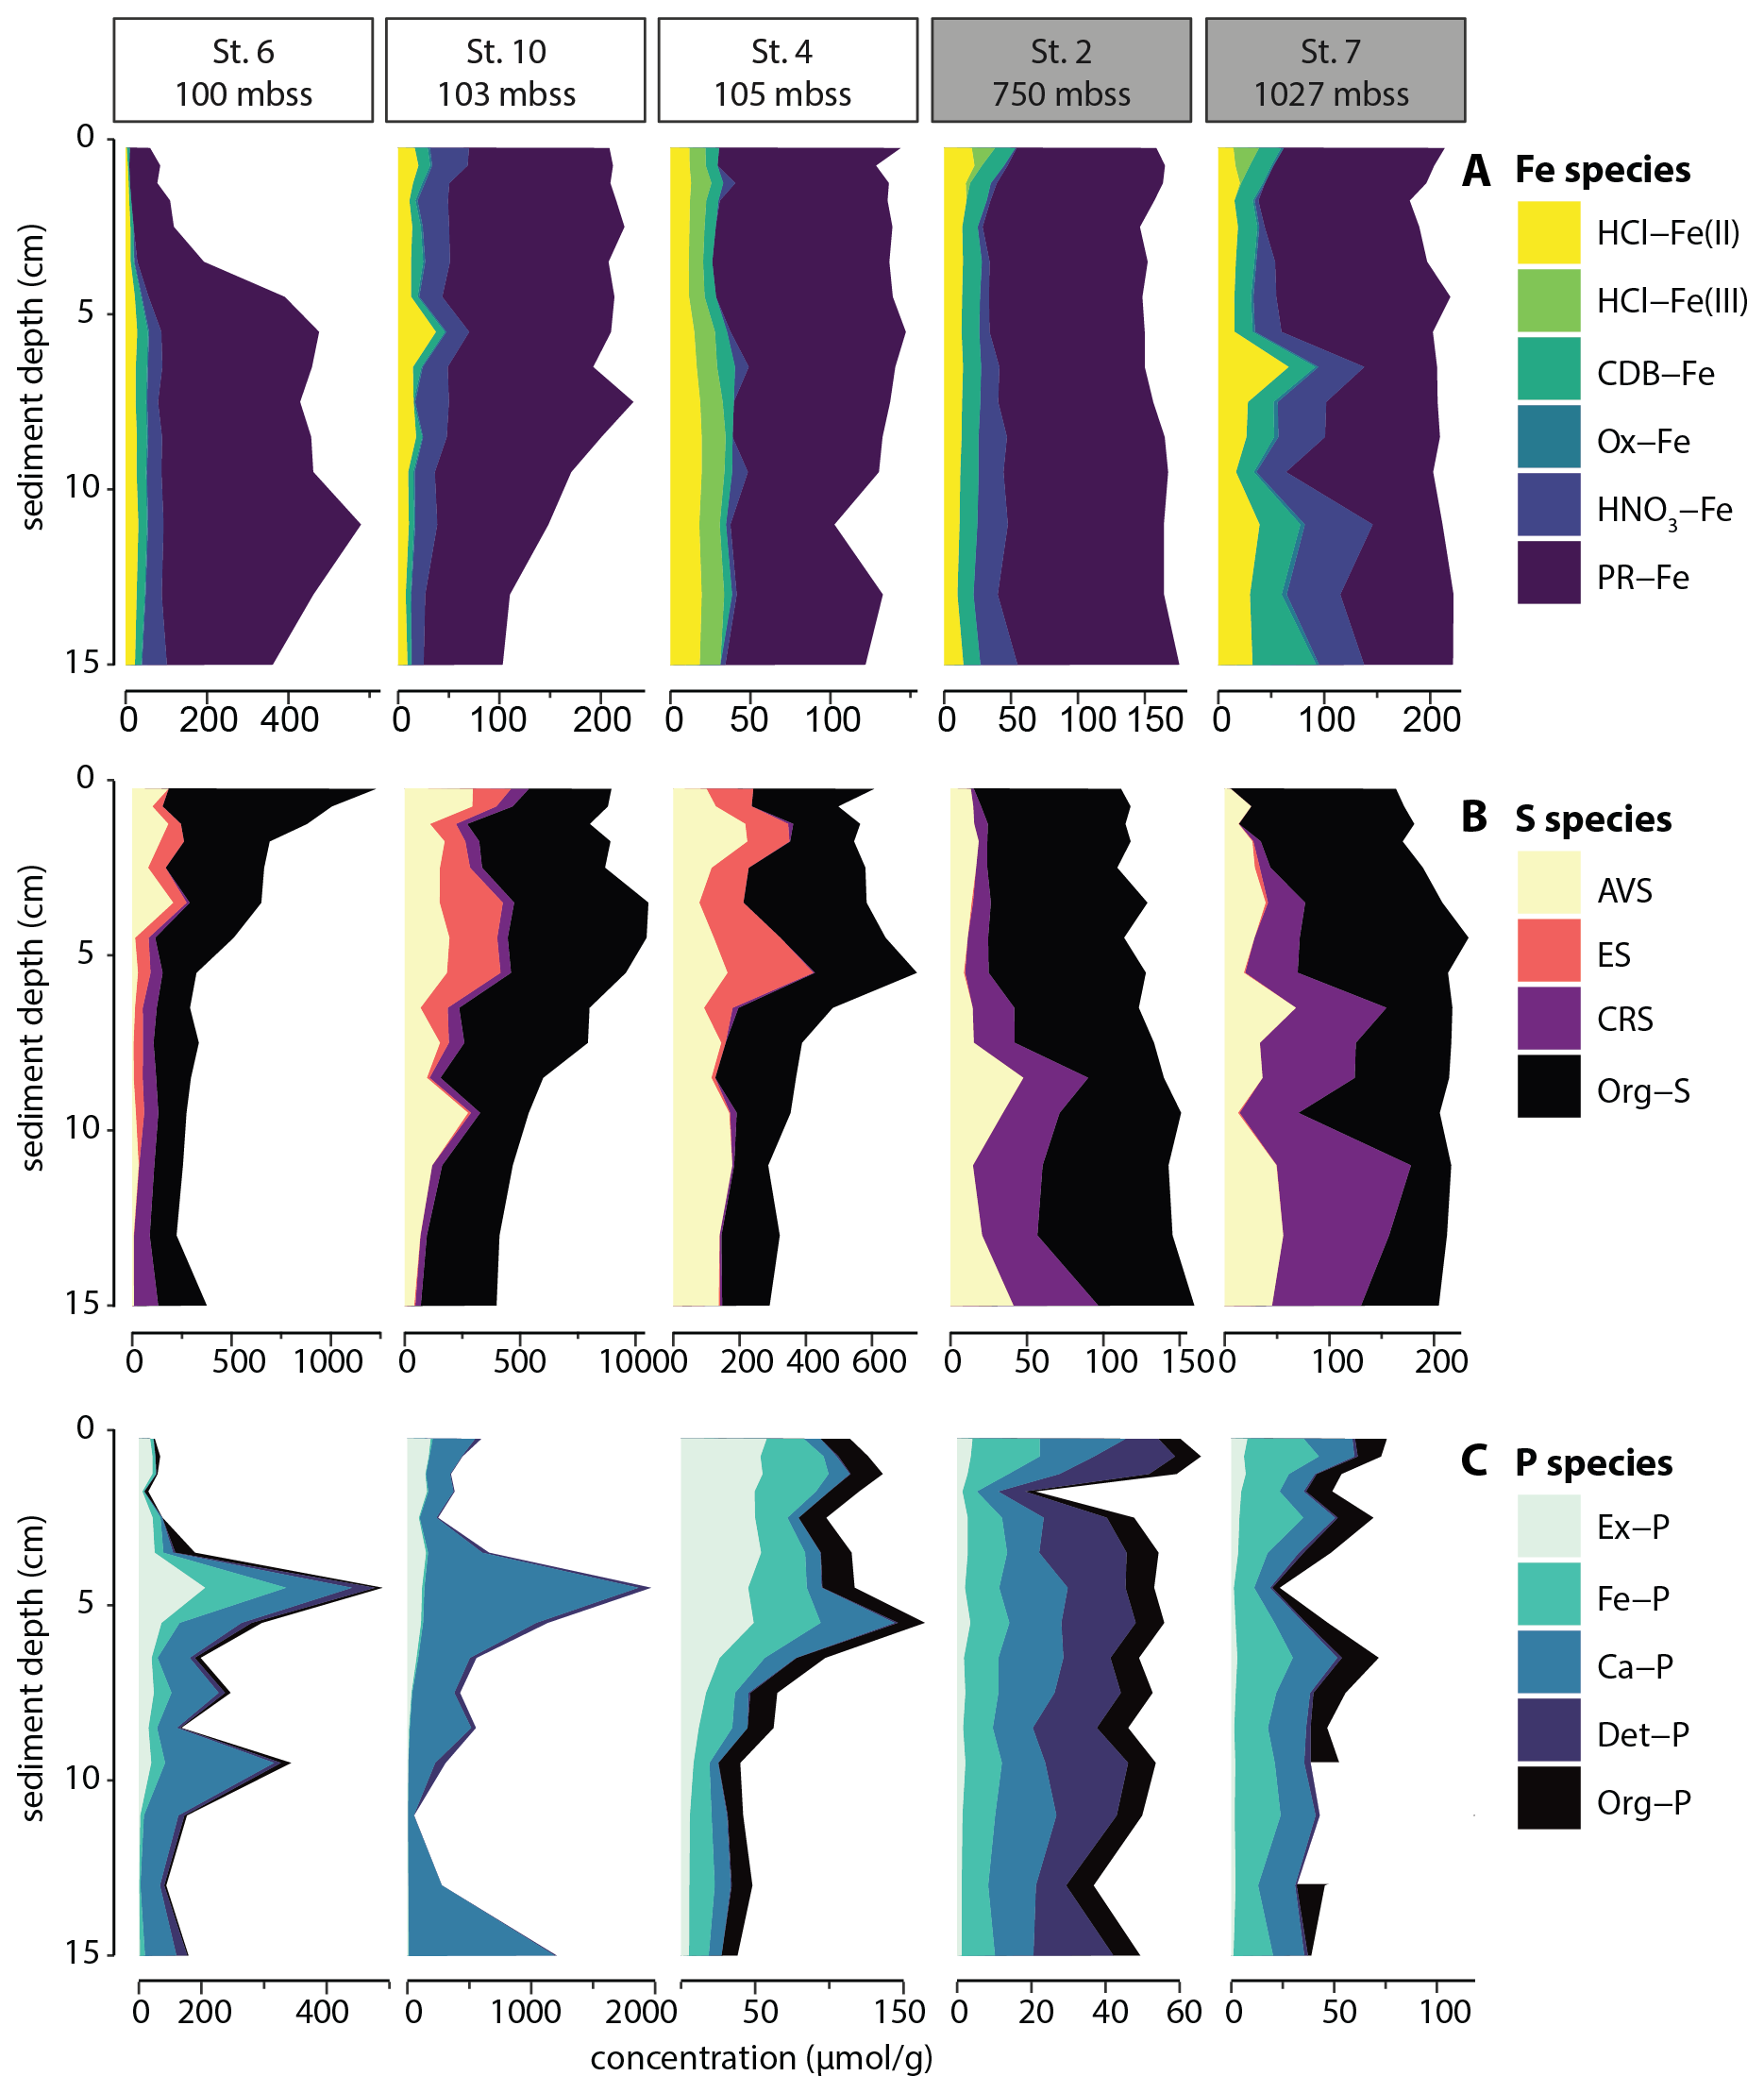
Figure 4Solid-phase sedimentary iron (A), sulfur (B) and phosphorus (C) pools plotted against sediment depth for selected stations. Outlier for Org-P at 11 cm for station 7 was removed.
The solid-phase S pool consisted predominantly of organic S (Fig. 4B), which accounted for 61 ± 17 % of total S. The deeper sediment at station 7, with relatively high reactive Fe, contained relatively large pools of AVS and particularly CRS, together making up more than 80 % of the total S pool. In sediments of the slope stations, reduced inorganic S (RIS) was dominated by AVS and CRS, while AVS and elemental sulfur (ES) made up the RIS pool in sediment of the shelf stations, where CRS was largely absent.
The deepest slope station selected for sequential P extraction (station 2; 750 mbss) showed roughly equally sized pools of Fe-associated, Ca-associated, detrital and organic P, with only minor exchangeable P (Fig. 4C). The sedimentary P pool at slope station 7 showed a similar P sediment chemistry, except that detrital P was nearly absent. Shelf station 4 showed concentrations and composition of P pools similar to station 7, but with a large exchangeable P pool in the surface sediment < 5 cm depth. Shelf stations 6 and 10 showed markedly different sediment P chemistry: total P contents were much higher (values up to 1500 µmol g−1 rather than 50–150 µmol g−1 as found at the other stations), particularly at station 10. Furthermore, P was present predominantly as Ca-associated P with minor contributions of exchangeable and/or Fe-associated P. Note that organic P was not determined for station 10 because of analytical issues; however, mass balance (i.e. total P from sediment digest compared to cumulative P from SEDEX extraction steps) indicated that this was a minor P pool.
3.2 Pore-water chemistry
Micro-profiles of dissolved O2 at the sediment-water interface showed an increase in oxygen penetration from < 0.2 mm at shelf stations to 1–2 mm on the slope (Table 3). Pore-water profiles reflected the distinct chemistry of shelf stations compared to OMZ and slope stations (Fig. 5). All DIC profiles showed down-core increases, with much higher concentrations on the shelf stations (up to 15 mmol L−1) compared to the slope (up to 2.5 mmol L−1). Similarly, pore-water NH concentrations reached much higher concentration at depth in the sediment on the shelf (up to 2 mmol L−1) than on the slope (up to 60 µmol L−1). Dissolved nitrate and nitrite concentrations were about an order of magnitude lower than NH (up to 80 and 7 µmol L−1, respectively), with marked peaks at depth in the sediment at the shelf stations, particularly stations 5, 6 and 10. Dissolved HPO showed maxima of 100 and 700 µmol L−1 on the shelf and slope, respectively, while dissolved H4SiO4 increased downcore to 800 µmol L−1 on the shelf and 400 µmol L−1 on the slope. The shelf stations showed down-core decreases in pore-water F− concentrations (up to 75 %; F− from ∼ 100 to 25 µmol L−1), while dissolved F− was more stable in slope sediments (< 10 % down-core decrease). Dissolved sulfide (HS−) was absent or very low in the pore-water at slope stations, where dissolved SO concentrations were stable at ∼ 28 mmol L−1. By contrast, HS− concentrations up to 10 mmol L−1 developed at depth in the shelf sediment, with associated decreases in dissolved SO. Dissolved Fe and Mn concentrations were low, at most 30 and 2.5 µmol L−1, respectively. Dissolved Fe and Mn showed a pattern of sub-surface peaks that increased in magnitude with increasing station water depth, and Fe additionally showed marked enrichments at depth in the sediment of shelf stations, coinciding with NO peaks. Of the shelf stations, station 6 stood out with pore-water peaks in NH, HPO, HS− and SiO in the top sediment rather than at depth. Dissolved organic N was a significant pore-water N pool (up to 50 % of dissolved N) while DOP was a minor P pool, < 10 % (see the Supplement).
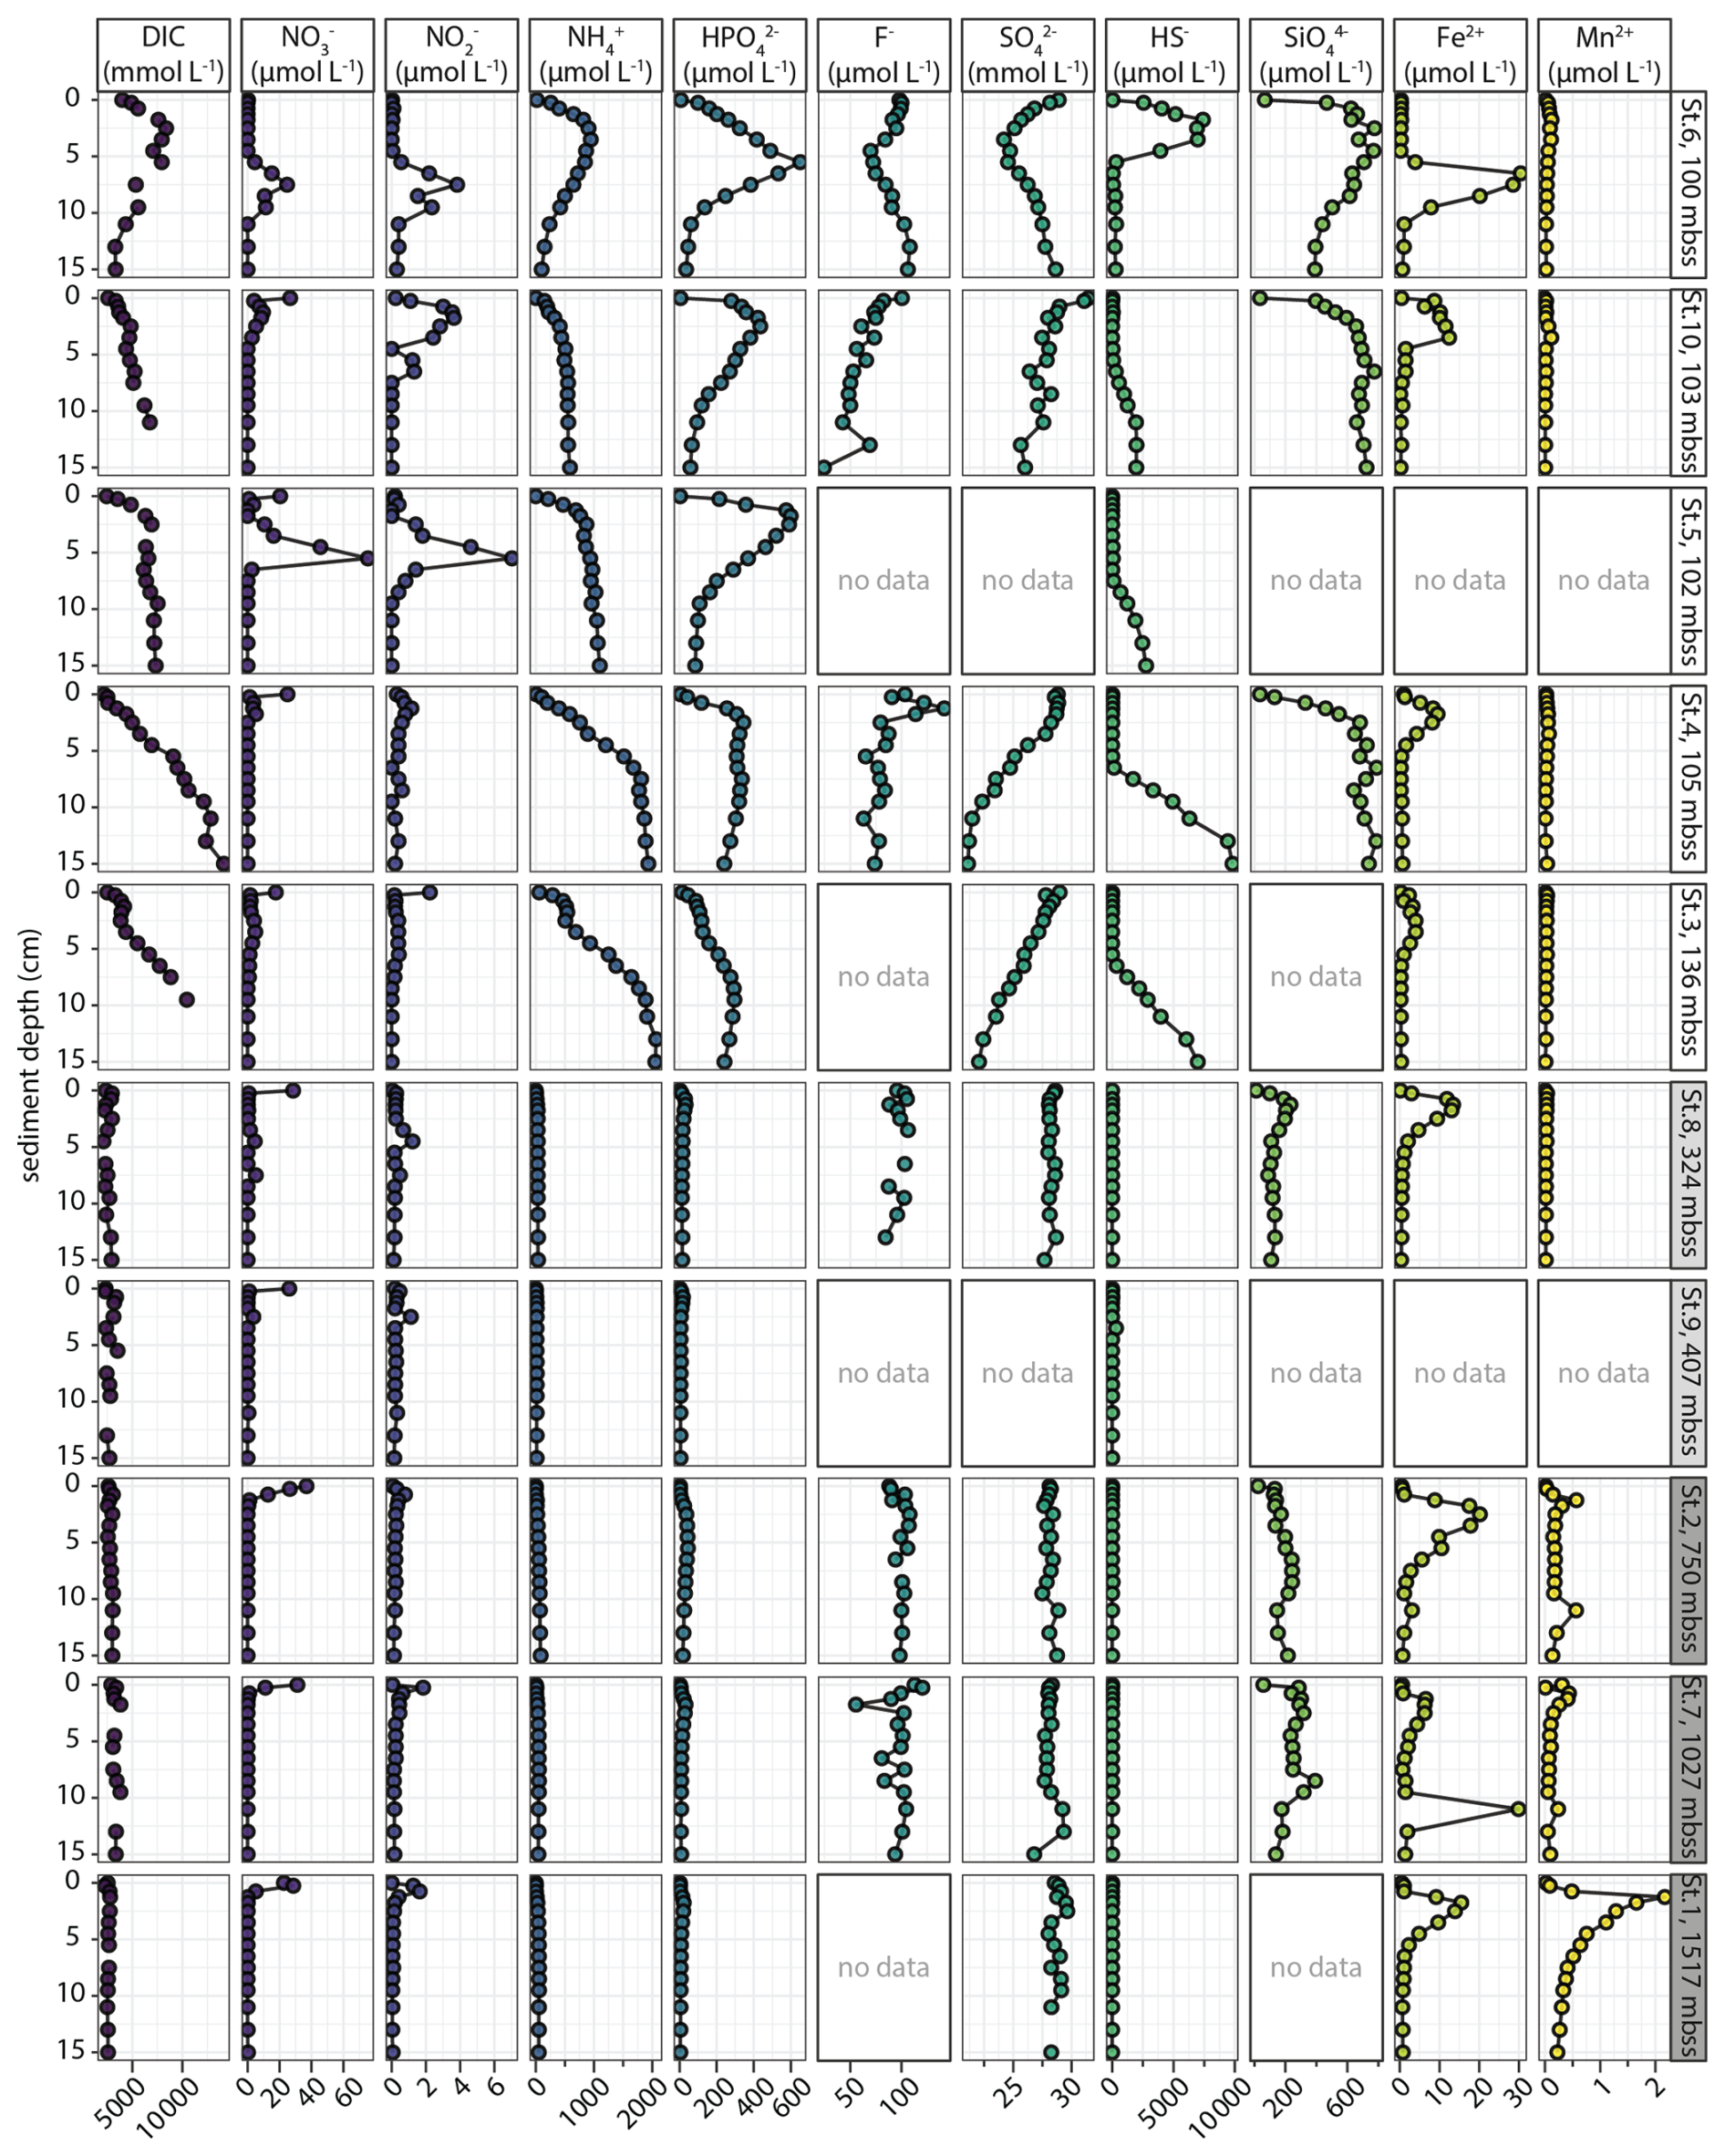
Figure 5Key pore-water species plotted against sediment depth. Top data point is from bottom-water sample.
Finally, we compared measured HPO profiles to calculated “expected” HPO profiles based on DIN and DIP release from organic matter breakdown with Redfield stoichiometry (N P = 16 mol mol−1; see the Supplement for calculation). The measured HPO accumulation strongly exceeded the calculated expected HPO concentration in the top 5–15 cm of the sediment at all stations except Station 3 (Fig. 6). At greater depth, measured HPO profiles show a sharp decline, generally to values below expected values. Notable exceptions are the OMZ stations, where measured HPO were low (5–15 µmol L−1) but consistently higher than calculated values.
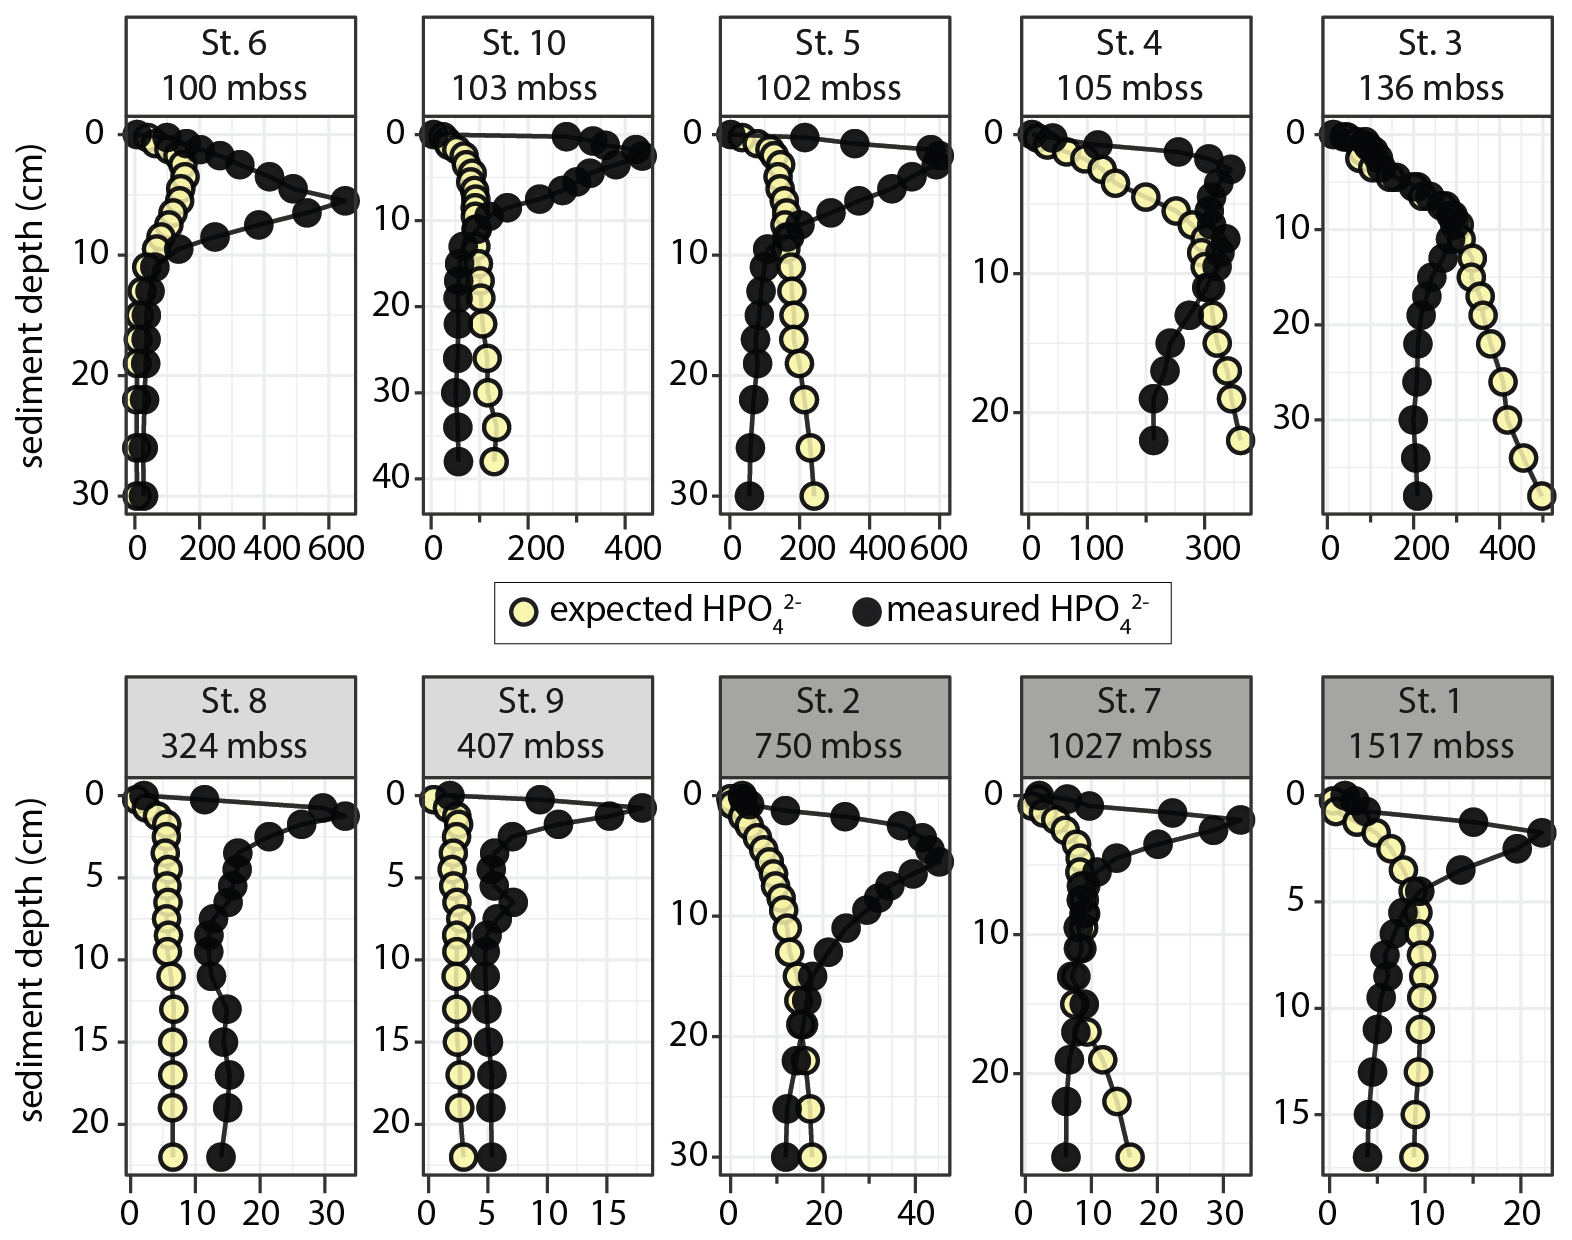
Figure 6Measured and “expected” dissolved phosphate profiles (all in µmol L−1) plotted against sediment depth. The calculated profiles are based on assumed release of NH and HPO from degradation of marine algal organic matter with Redfield stoichiometry (N P = 16).
3.3 Benthic fluxes and bottom-water chemistry
Calculated diffusive fluxes for O2, SO, N and P across the sediment-water interface show a shelf-to-slope transition from sulfate reduction to oxic respiration as the dominant OM degradation process (Fig. 8, left panels). Fluxes for DIC, TAlk and HS− can be found in the Supplement. The calculated diffusive fluxes of NH and HPO were all positive, up to 11 and 4 mmol m−2 d−1, respectively, suggesting efflux of these nutrients from the sediment into the overlying water at all stations, with relatively high values on the shelf. A small flux of NO into the sediment of up to −1 mmol m−2 d−1 was calculated for all stations except at station 1 where a small efflux from the sediment (0.1 mmol m−2 d−1) was calculated. The molar N P ratio of the benthic efflux was generally well below the Redfield N P ratio of 16 (Redfield C : N : P ≈ 106 : 16 : 1), ranging between 1–7 : mol : mol−1 except for station 3 (19 mol mol−1). Stoichiometry further showed that the ratio of diffusive DIC and NH fluxes (∼ 3) was relatively low compared to Redfield (∼ 6.5). Lastly, station 6 showed a strong efflux of HS− from the sediment into the overlying water (∼ 100 mmol m−2 d−1), in line with the steep increase in dissolved HS− in the uppermost sediment (SI).
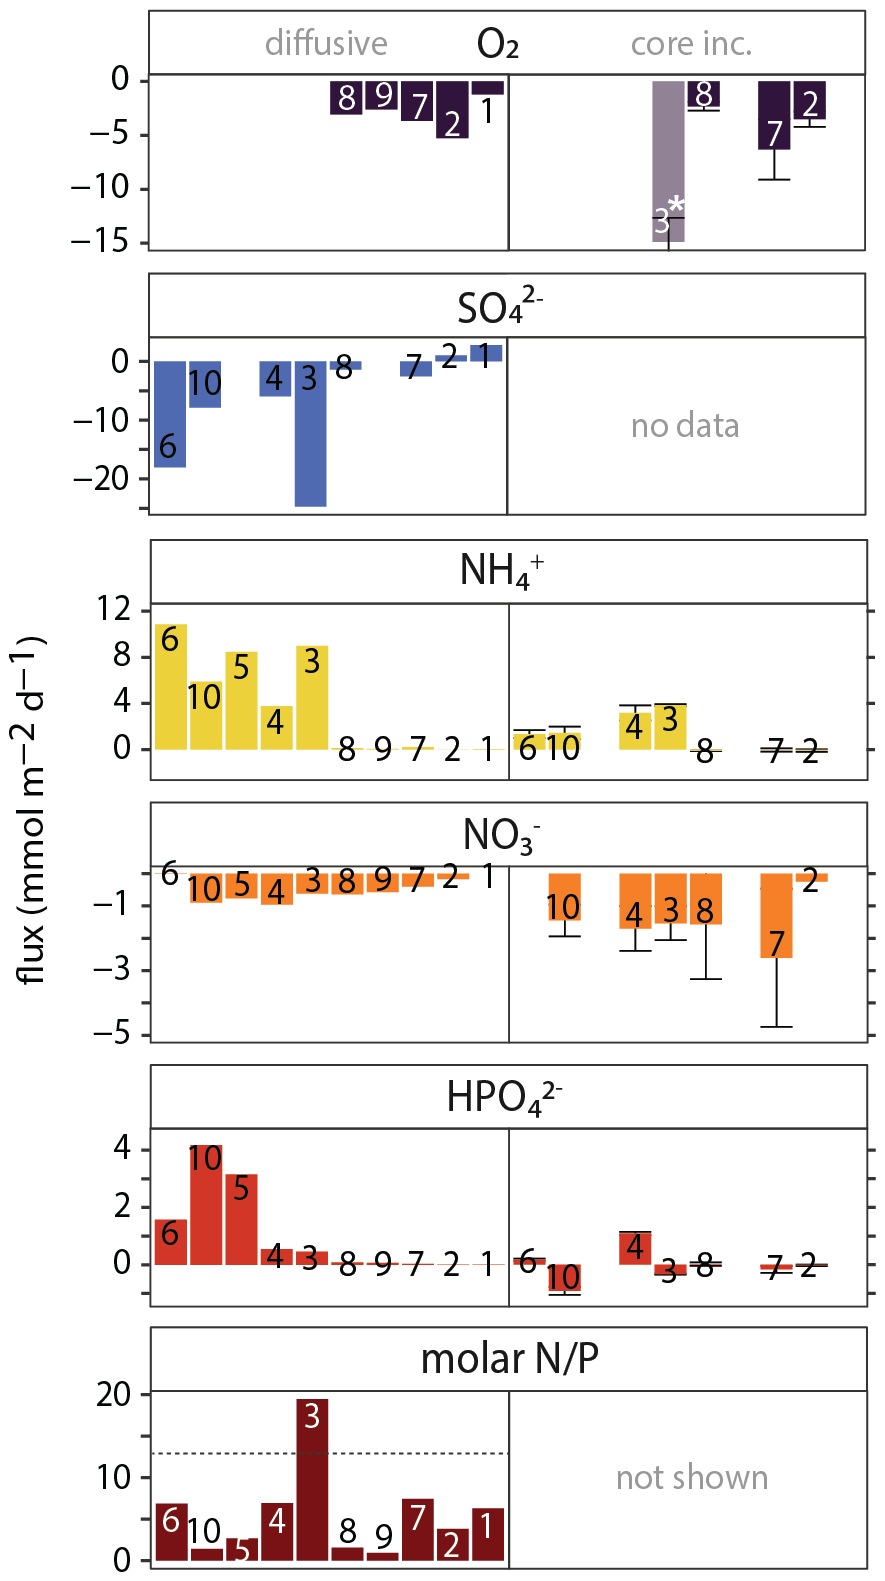
Figure 7Benthic fluxes of O2, N and P across the sediment-water interface: negative fluxes are directed into the sediment, positive fluxes are directed into the bottom water. Left panels: calculated fluxes using concentration gradient in the diffusive boundary layer (O2) or the gradient between bottom water and uppermost pore-water sample at 0.25 cm depth (all other species). Right panels: measured benthic fluxes calculated from changes in bottom-water chemistry during whole-core incubations. For measured fluxes, mean values and standard deviation of replicate core incubations are shown. ∗ Note that the O2 flux for station 3 should be treated with caution because the starting O2 concentration was relatively high, suggesting introduction of O2 during incubation setup (see the Supplement for more details). For SO, no whole-core fluxes can be determined because of the high seawater background (28 mmol L−1); whole-core HS− fluxes were not determined. The molar N P ratio for whole-core fluxes ranged wildly because of the highly variable HPO (DIP) fluxes and is therefore not shown.
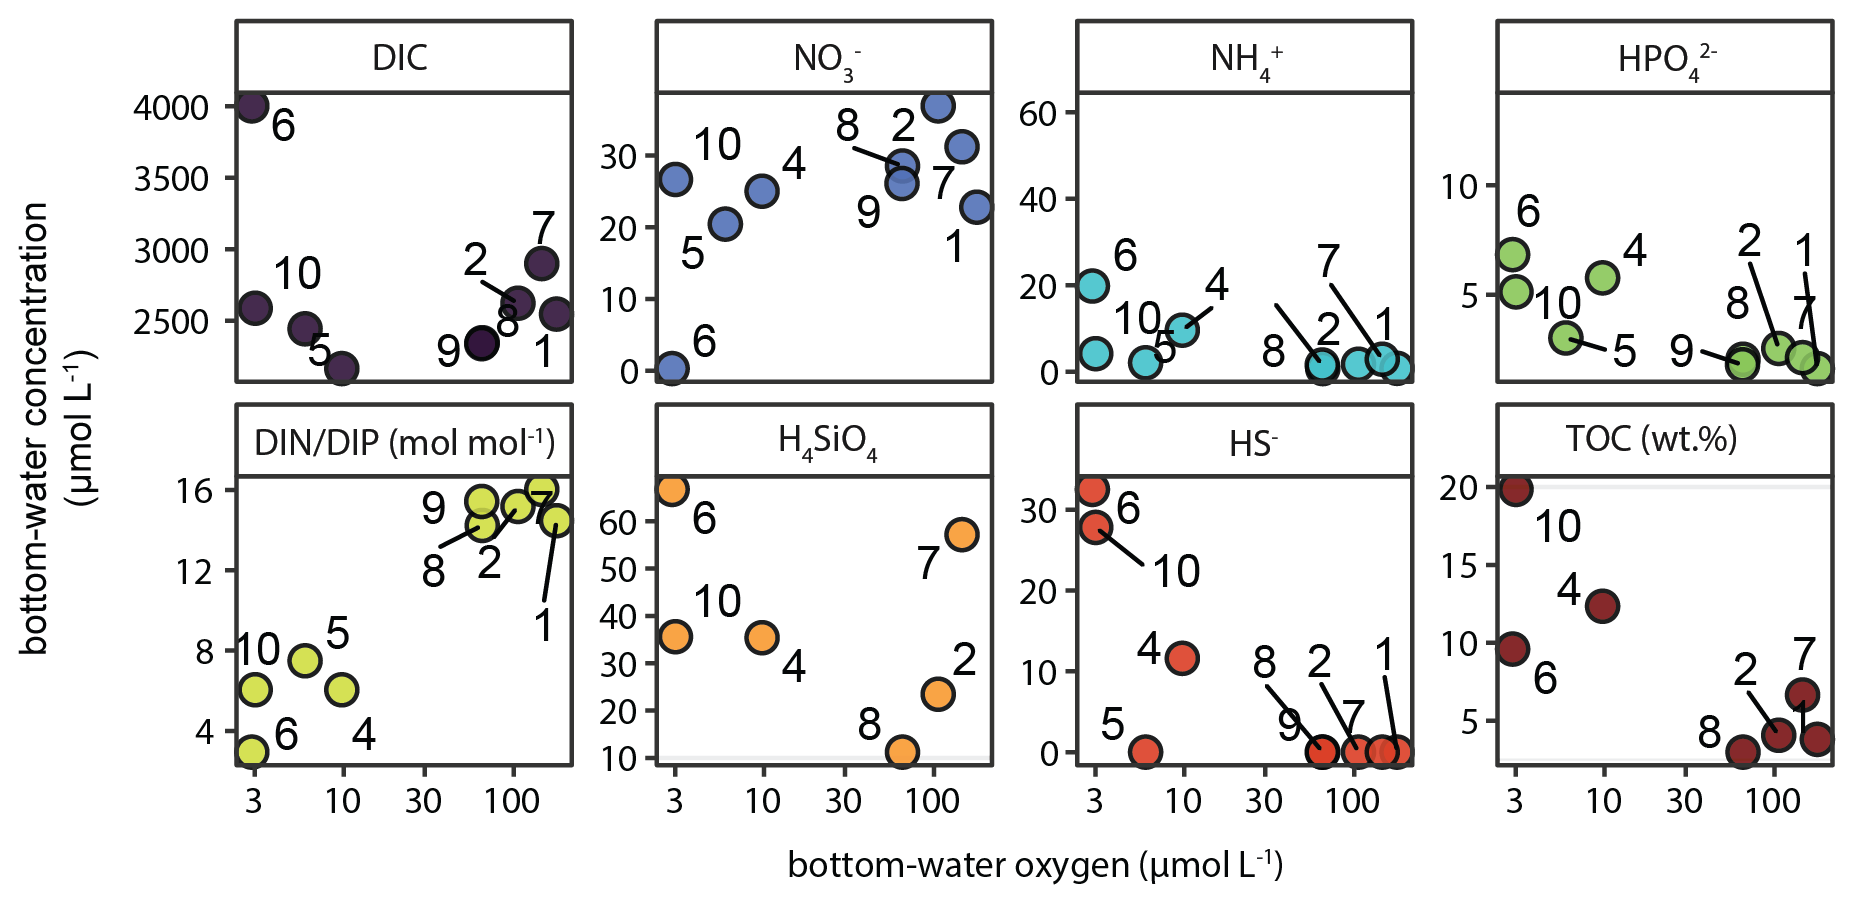
Figure 8Key chemical parameters in bottom water (i.e. overlying water in sediment cores collected with the multi-corer) as function of bottom-water oxygen (i.e. deepest CTD/rosette measurement, ∼ 5 m above the seafloor). Unit is µmol L−1 unless indicated otherwise. TOC (wt %) is the average TOC content in the top 2 cm of the sediment at each station.
The measured benthic exchange rates generally showed much higher variability than the calculated diffusive fluxes (Fig. 7, right panels). Where they were both obtained (station 2, 7 and 8), diffusive and whole-core O2 fluxes were similar, ranging between 2 and 6 mmol m−2 d−1, but no consistent difference between diffusive and whole-core fluxes. Whole-core NH fluxes were similar but relatively high compared to calculated diffusive fluxes, while whole-core NO fluxes were relatively high. The trends were similar: NO uptake into the sediment at all stations and NH efflux concentrated on the shelf under low-oxygen bottom waters. In contrast to calculated diffusive fluxes, the measured HPO fluxes did not show a trend from high to low fluxes from the shelf to the slope, but rather strong variation between stations, with negative (uptake) and positive (efflux) fluxes measured on the shelf.
In addition to pore-water analysis, the bottom water overlying the sediment collected with the multi-corer was sampled and analysed. The results showed that with decreasing O2, NO decreased while NO, NH, HPO and SiO increased (Fig. 8). The opposite trends in bottom-water NO and HPO resulted in a marked decline of the DIN : DIP ratio with decreasing oxygen, from near-Redfield (16) to as low as 3. Moreover, accumulation of dissolved HS− was detected in the bottom water at the stations experiencing strong bottom-water oxygen depletion (Station 4, 6, 10). For context, Fig. 8 also shows the strong increasing trend in surface-sediment TOC content from the slope to the shelf in the bottom left panel.
3.4 Physical and chemical water-column properties
Water-column profiles of key physical and chemical parameters (Fig. 9) showed rapid oxygen depletion and near-anoxic waters in the bottom 25–50 m on the shelf, except at station 3 where oxygen decline was more gradual. The OMZ stations were located where the core of the perennial OMZ intersected the slope, with oxygen concentrations around the threshold for hypoxic conditions (63 µmol L−1). Below the OMZ, bottom-water dissolved oxygen increased to 179 µmol L−1 (54 % saturation) at the deepest station (1, 1500 mbss). Salinity profiles indicated the presence of a distinct, low-salinity water mass between 500–1000 mbss. The turbidity profiles showed increased turbidity in bottom waters, most prominently at stations 2, 4 and 6.
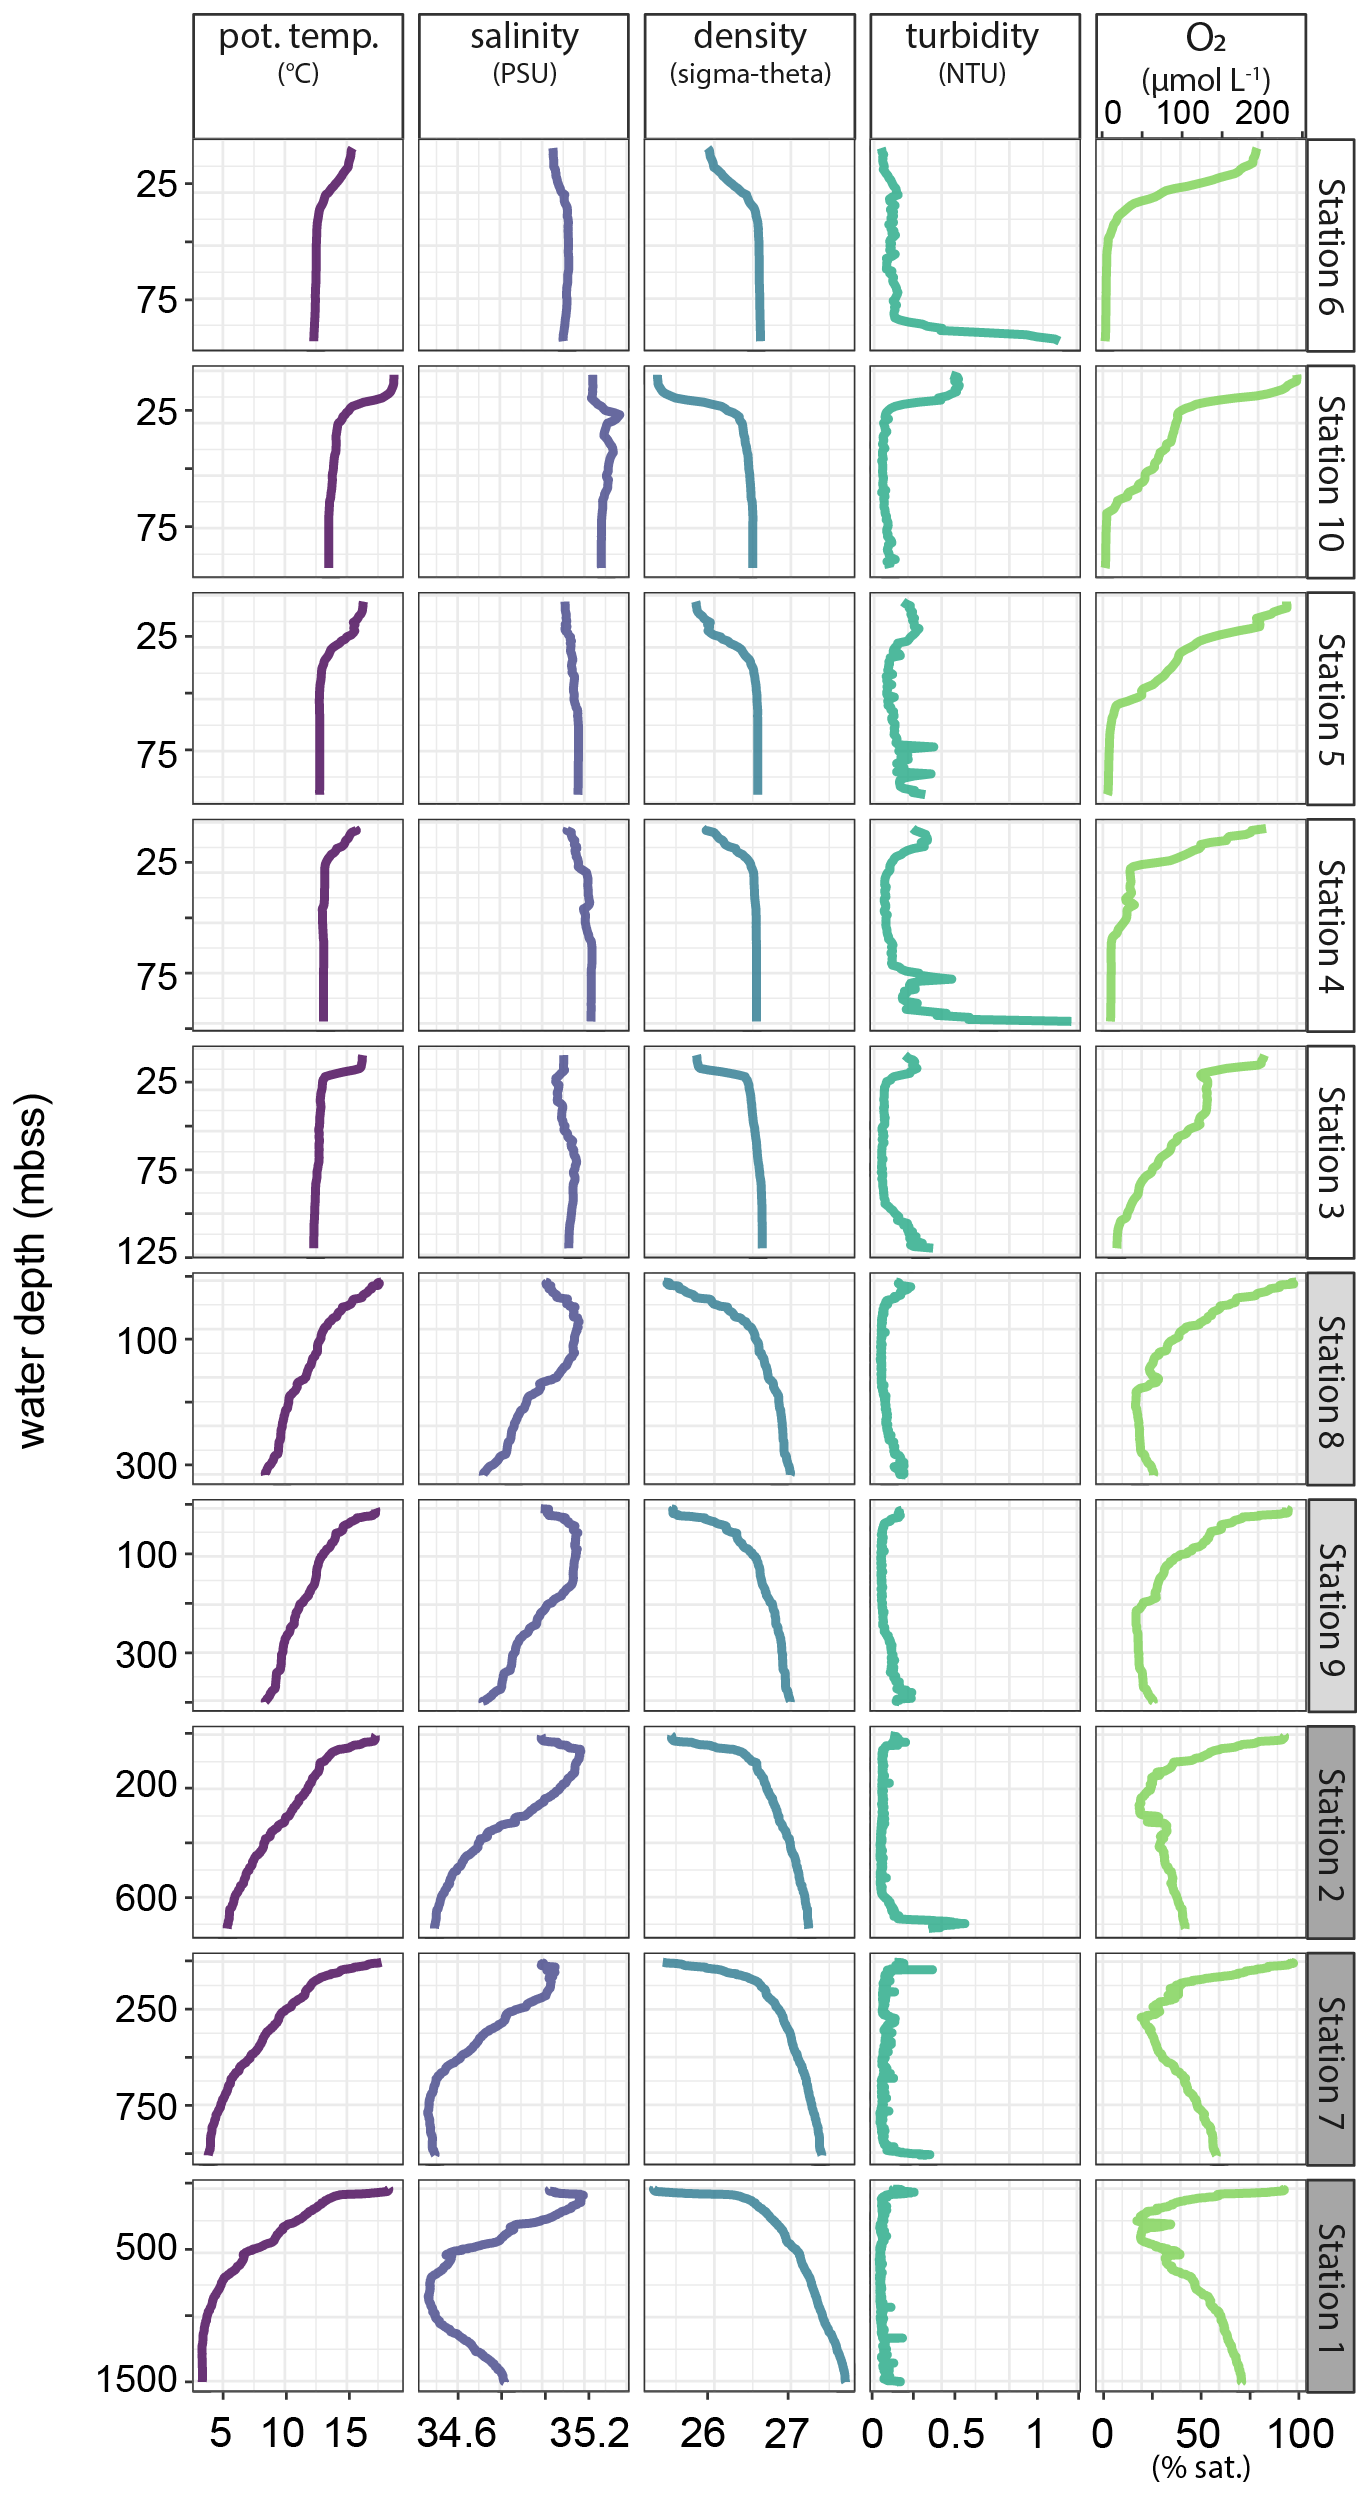
Figure 9Profiles of key physical and chemical water-column properties plotted against water depth. Stations are in order of increasing water depth.
Dissolved carbon and nutrients (DIC, NH, NO, NO, HPO, SiO; Fig. 10) showed relatively high DIC concentrations in the top 100 m of shelf waters. Dissolved NH was generally low (< 1 µmol L−1) with small sub-surface (25–50 mbss) peaks of 2–3 µmol L−1 at several OMZ and shelf stations. Furthermore, there was a marked bottom-water NH accumulation up to 10 µmol L−1 at station 6. At this station, a strong enrichment in NO was observed in the waters above the deep NH peak. For the rest, NO concentrations were < 1 µmol L−1 with small sub-surface peaks coinciding with peaks in NH. Generally, the NO profiles showed surface-water depletion and downward increases to 30–40 µmol L−1. Notable exception was the NO-depleted bottom water at station 6, where NO decreased from 25 to 0.3 µmol L−1 between 50 and 100 mbss The HPO profiles generally showed downward increasing concentrations that stabilized at 2–3 µmol L−1. Station 6 showed an increase in HPO in the bottom 25 m to 4 µmol L−1, concurring with the NH peak. The molar DIN : DIP ratio was close to Redfield (14–16) throughout the water column at the slope and OMZ stations, except for lower ratios down to 6 in surface waters. At the shelf stations, by contrast, the DIN : DIP ratio was much more variable and showed decreases both in surface and bottom waters, most prominently at station 6 where the ratio declined to 3–4. Dissolved silica profiles showed down-ward increases up to 50 µmol L−1, with relatively sharp increases in deeper waters on the shelf. Also notable was the decline below 1250 mbss at Station 1, co-occurring with an increase in salinity (Fig. 9).
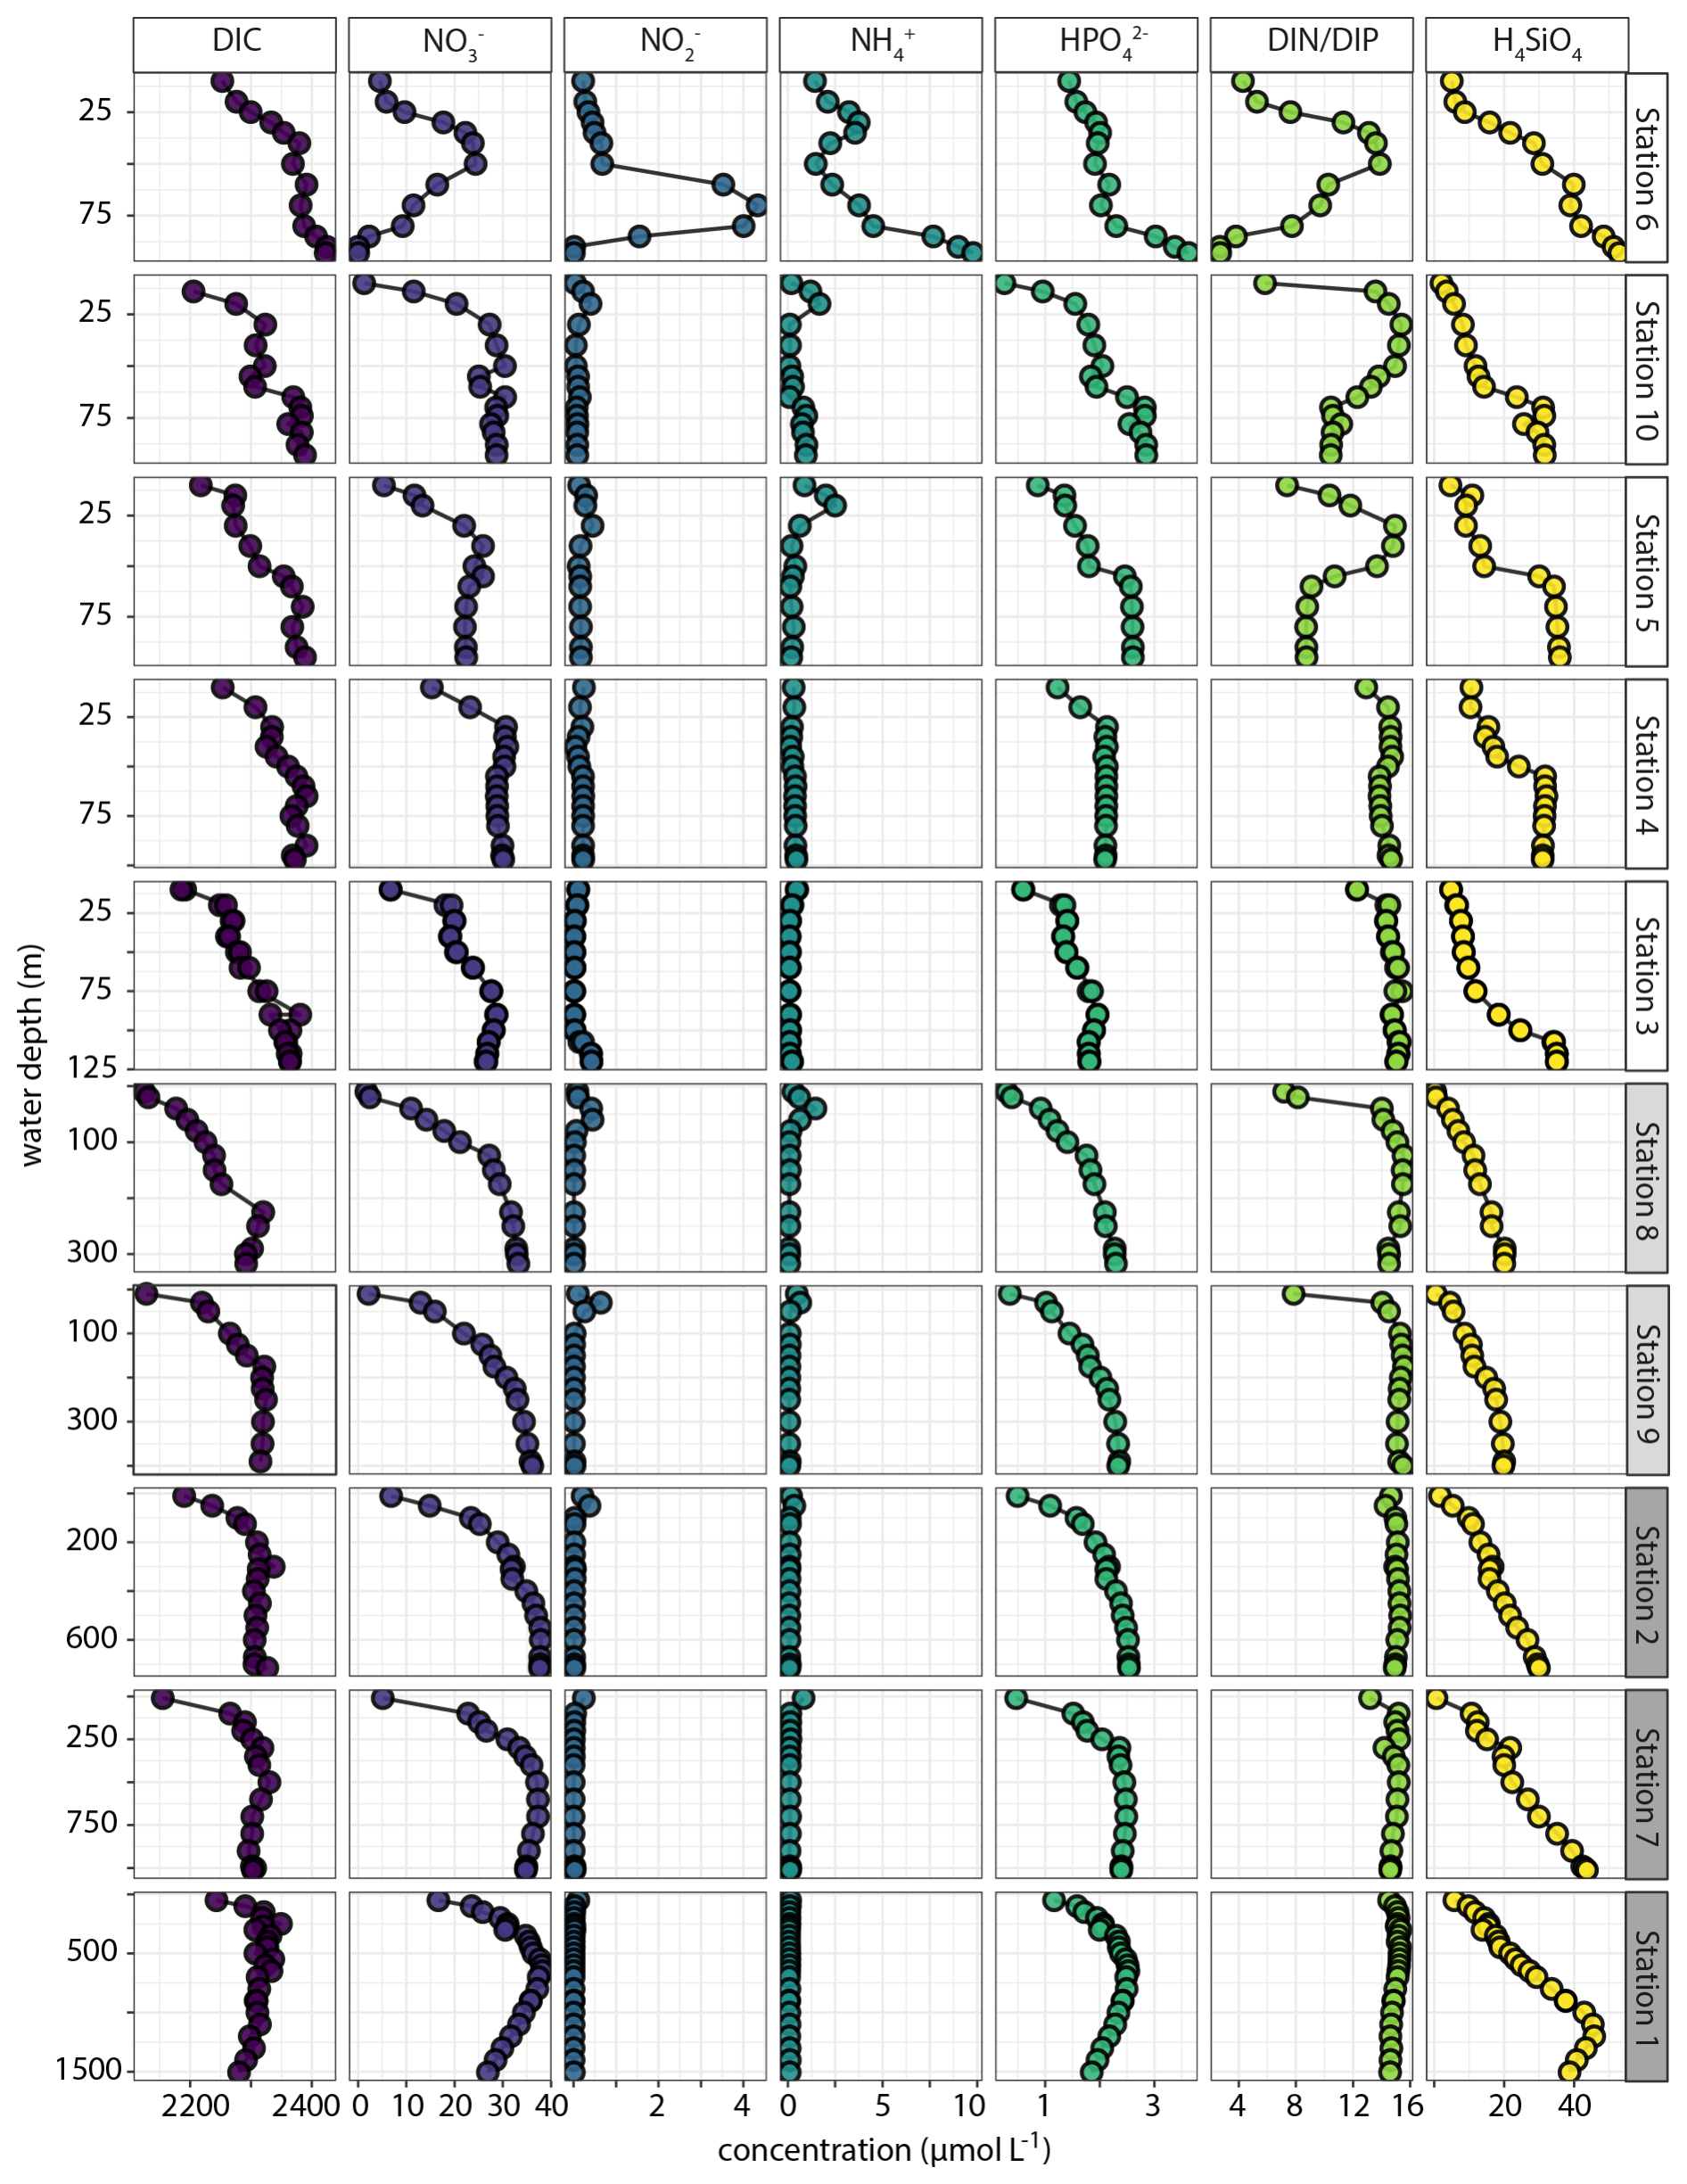
Figure 10Water-column C, N, P and Si depth profiles plotted against water depth at the investigated stations. The only derived variable is the total dissolved inorganic N to inorganic P ratio (DIN DIP). Stations are ordered based on water depth. All species in µmol L−1 except DIN DIP in mol mol−1.
The measurement of various N and P species in selected water-column samples from stations 2 and 6 suggested small DON (3–6 µmol L−1) and DOP (0.1–0.4 µmol L−1) pools (SI). Furthermore, the difference between total N and total dissolved N in the deeper waters at station 6 (where turbidity was high; Fig. 9) suggested a particulate N pool that was roughly the same size as the DON pool. There was no evidence in the data for a particulate P pool.
4.1 Sources of labile sedimentary P pools on the shelf and implications for C : N : P stoichiometry
Dissolved phosphate concentrations in the shelf sediment (stations 3, 4, 5, 6, 10) were about an order of magnitude higher than on the slope, reaching values up to 600 µmol L−1 (Fig. 5) with 200–400 µmol L−1 of excess HPO with respect to stoichiometric N and P release from OM degradation in the top 10 cm of sediment (Fig. 6). The low solid-phase TOC P ratios in the strongly reducing shelf sediment (Fig. 3; TOC P as low as 5) in combination with high excess HPO indicates the presence of P sources other than OM. This suggests additional P cycling processes that drive the development of strong HPO gradients and associated fluxes across the SWI. The high relative abundance of ex-P, Fe-P and Ca-P in the shelf sediments investigated in this study (Fig. 4), together accounting for > 90 % of total solid-phase P, reflects the predominance of labile P pools that can easily transform and thereby drive intense P cycling. Reductive dissolution of Fe(III) (oxyhydr)oxides and release of sorbed P (Ruttenberg, 2014) likely plays a minor role in this shelf setting; the pool of Fe(III) (oxyhydr)oxides (FeOx; CDB-Fe and Ox-Fe in Fig. 4) is too small: < 20 µm mol g−1 (Fig. 4). The limited availability of reducible solid-phase Fe is further expressed in the low dissolved Fe2+ concentrations (Fig. 5). Assuming an Fe P stoichiometry of 5–15 for highly reactive Fe(III) (oxyhydr)oxides with sorbed or coprecipitated P (Dzombak and Morel, 1990; Jensen et al., 1992; Sundby et al., 1992; Anschutz et al., 1998; Kraal et al., 2019), dissolution of reactive Fe and associated P would result in only a few µm mol P L−1, an insignificant fraction of the observed excess HPO. Considering the minor role that Fe-P plays in the shelf sediment, it is likely that other labile P pools, e.g. CaCO3-associated P and labile Ca-P, dissolved in the extraction step targeting Fe-associated P (Kraal et al., 2017). In general, caution in required when interpreting chemical P fractionation results for the investigated shelf sediments with abundant, highly labile P.
In upwelling areas, high primary production supports large fish populations and associated fluxes of organic and mineral fish remains to the seafloor (Suess, 1981; Froelich et al., 1988; Schenau and De Lange, 2000). Fish bone consists for ∼ 50 wt % of hydroxyapatite (HAP), a poorly crystalline Ca-P mineral with the general formula Ca10(PO4)6(OH)2 (Nriagu, 1982). Fish debris are characterized by TOC P ratios well below 100 (Logesh et al., 2012; Wijayanti et al., 2021; Løes et al., 2022) Biogenic HAP is efficiently buried in rapidly accumulating, anoxic sediments: sedimentation rates in the research area range from ∼ 10 cm kyr−1 on the slope to 30–120 cm kyr−1 on the shelf in our research area (Calvert and Price, 1983; Summerhayes et al., 1995; Küster-Heins et al., 2010a). Subsequent dissolution of labile biogenic HAP in the sediment boosts pore-water HPO concentrations and fuels authigenic precipitation of more stable carbonate fluorapatite (CFA), Ca10(CO3, PO4)6F2 (Suess, 1981; Froelich et al., 1988; Schenau et al., 2000; Oxmann and Schwendenmann, 2015). Sediments from the two stations with the highest and most variable P content (stations 6 and 10) contained visible, mm- to cm-scale fish debris (large fragments were removed prior to chemical analyses). The heterogeneous distribution of fish debris in the sediment likely resulted in the marked peaks in sediment P content and the relatively large discrepancy between total P determined by sediment acid digestion (Fig. 2) and the sum of the sequentially extracted P pools (Fig. 4). The values of the TOC P at stations 6 and 10, as low as 5 with a mean of 28 ± 15 compared to Redfield (106), suggest that biogenic Ca-P may be an important P pool in shelf sediment, accounting for the majority of P in specific sediment intervals. In line with this, a chemical extraction method used to estimate the contribution of fish debris to the solid-phase P pool (Schenau and De Lange, 2000) indicated that HAP in fish bones constituted 20 %–50 % of total P in sediments on the continental slope (∼ 1300 mbss) off Namibia in the BUS (Küster-Heins et al., 2010b). Fish debris were also suggested to play a central role in P cycling and benthic P fluxes on the Peruvian shelf (Suess, 1981; Froelich et al., 1988). Heterogeneous distribution of fish debris in sediment may introduce bias; additional analyses such as bone counts could help constrain the role of fish debris in the P budget. However, a more recent detailed study into P cycling on the Peruvian shelf and slope (74–1000 mbss) by Lomnitz et al. (2016) provided no evidence for an important role for fish debris as additional P source, instead highlighting the potential role of bacteria is supplying additional P to the sediment.
Phosphorus cycling in sediments from upwelling regions is known to be impacted by large sulfur-oxidizing bacteria (SOB) (Schulz and Schulz, 2005; Cosmidis et al., 2013; Lomnitz et al., 2016). Off Namibia, previous work has established the presence of SOB genera Thiomargarita, Beggiatoa and Thioploca, their presence and abundance varying with availability of the oxidants O2 and NO in bottom waters (Gallardo et al., 1998; Brüchert et al., 2003; Schulz and Schulz, 2005; Flood et al., 2021; Chuang et al., 2022). Sulfur-oxidizing bacteria accumulate cellular P in the form of polyphosphates, releasing dissolved HPO to the pore-water under reducing conditions and triggering formation of authigenic Ca-P and even phosphorite. The chemical P extraction procedure used here does not allow for quantification of polyphosphate-P, which could be extracted in the first few extraction steps as part of the labile P pool. While trial DNA analysis and 31P-NMR did not provide conclusive evidence for SOB in the sediment of shelf stations (SI), we visually observed white filaments, likely SOB genera, in the surface sediments from shelf stations 4, 5 and 6 (see the Supplement). Furthermore, chemical signatures indicative of SOB were observed in shelf sediment, even at stations where there was no visual confirmation of SOB presence: at stations 3, 4, 5 and 10, dissolved HS− accumulation only occurred at depth (> 5 cm) in the sediment (Fig. 5), while the sulfide oxidation product elemental sulfur was detected in the uppermost sediment < 5 cm (Fig. 4). In addition, unexpected peaks in pore-water NO and NO at depth in the reducing shelf sediment (Fig. 5) suggest the presence of SOB that concentrate NO in their vacuoles to use as electron acceptor for sulfide oxidation (McHatton et al., 1996; Jørgensen and Gallardo, 1999; Schulz, 2006). Lastly, the sharp peaks in excess pore-water HPO (Fig. 6) in surface sediment were similar in shape and magnitude to those associated with SOB in the work on the BUS shelf by Schulz and Schulz (2005). We note that these lines of evidence for SOB are indirect. The role of SOB can be further tested with cell counts, metagenomics and poly-P assays which lay beyond the scope of this study.
The SOB contribute to efficient reoxidation of HS− produced by sulfate-reducing bacteria and drive rapid sulfur redox cycling in shelf sediments off Namibia which further impacts C, N and P cycling (Dale et al., 2009; Chuang et al., 2022). Furthermore, by inhibiting HS− buildup in the uppermost sediment, SOB maintain weak HS− gradients around the sediment-water interface and thereby limit benthic efflux of toxic HS− (Ohde and Dadou, 2018; Callbeck et al., 2021; Flood et al., 2021). At the same time, steep pore-water HPO gradients develop which result in high benthic HPO fluxes, particularly at stations 5, 6 and 10. By contrast, shelf stations 3 and 4, with similar general sediment properties and environmental conditions (Table 3), showed a much smaller pool of excess HPO (Fig. 6), much smaller labile P pools (Fig. 4) and relatively small diffusive P fluxes (Fig. 7). These contrasting results for apparently similar shelf stations highlight that P cycling processes on the shelf in the NBUS are highly variable not only temporally (seasonality of BWO; growth and decline of microbial communities) but also spatially, the latter perhaps revealing a high sensitivity of the P cycle to small differences in depositional conditions. The observed differences between diffusive and whole-core HPO fluxes (Fig. 7) further underscore the highly variable nature of P release.
Overall, we find abundant pools of labile P, low TOC P and high excess pore-water HPO in NBUS shelf sediments, indicating P cycling mechanisms other than degradation of algal material, such as biogenic Ca-P (fish debris) and/or P accumulation and release by SOB. At depth in the shelf sediment, HPO accumulation triggers phosphogenesis, i.e. formation of calcium fluorapatite (CFA) reflected in concurrent decreases in pore-water HPO and F− (Figs. 5, 6). We observe not only a stark difference in P cycling processes on the slope and shelf but also between shelf stations. The temporal and spatial variability in the P cycle, expressed on both the short-term (pore-water HPO profiles, benthic fluxes) and the long-term (solid-phase P profiles), is significant. Therefore, (i) robust P budgets for upwelling systems can only be made with insight into seasonal variability and (ii) the functioning of the sediment as sink or source of P can change dramatically over time in response to even small changes in depositional conditions. Considering that upwelling systems are areas of (periodically) efficient and extensive P removal from the water column, the latter is a crucial consideration when forecasting the impact of environmental change (specifically deoxygenation) on the global marine P cycle.
4.2 Sediment C, N, P stoichiometry informs about depositional conditions and P pools in OMZ sediments
The abundance of labile sedimentary P pools not derived from algal OM profoundly disrupts the common relationship between redox conditions and TOC P. The P retention capacity of the sediment generally decreases as redox conditions become more reducing, resulting in TOC P ratios well above Redfield under oxygen-depleted bottom waters (Slomp et al., 2002; Algeo and Ingall, 2007; Kraal et al., 2010; Kraal et al., 2012). Our results differ markedly from this paradigm: TOC P well below Redfield were also recorded in shelf sediments underlying strongly oxygen-depleted waters, while highest TOC P values were measured in sediment on the slope where bottom waters were reasonably well-oxygenated (> 100 µmol L−1) (Fig. 11). This suggests that the supply of additional P by SOB and fish debris can disrupt TOC TP as redox proxy in upwelling areas. Comparison to other OMZs may provide further insight into the key driver of this disruption. Similar to our results, Lomnitz et al. (2016) found TOC P around and below Redfield in organic-rich sediments underlying oxygen-depleted bottom waters in the Peruvian OMZ, with evidence for SOB but not fish debris as additional sedimentary P pool. Conversely, Kraal et al. observed a more straightforward positive correlation between degree of bottom-water oxygen depletion and TOC P in the upwelling area of the Arabian Sea, with values exceeding Redfield in the core of the OMZ. In the latter study area, fish debris play an important role in benthic P cycling (Schenau and De Lange, 2001) but pore-water sulfide accumulation hardly occurs in surface sediments that therefore do not provide a suitable niche for SOB. This suggests that while biogenic P in fish debris can affect the TOC TP ratio, SOB may be predominantly responsible for actual disruption of the positive correlation between TOC TP and BWO in upwelling regions. As such, careful consideration of depositional conditions and P supply mechanisms is required when interpreting TOC P ratios in the context of redox conditions. Considering that redox conditions and seafloor colonization by SOB are seasonal in the NBUS, it is noteworthy that the impact of SOB seems to be recorded in bulk sediment chemistry. This indicates that while SOB presence is transient, it has a lasting effect on P burial. Furthermore, we observe that the N P ratio mirrors the trend in TOC P along the BWO transect (Fig. 11), emphasizing that excess P supply and cycling rather than C dynamics control the TOC P relationship.
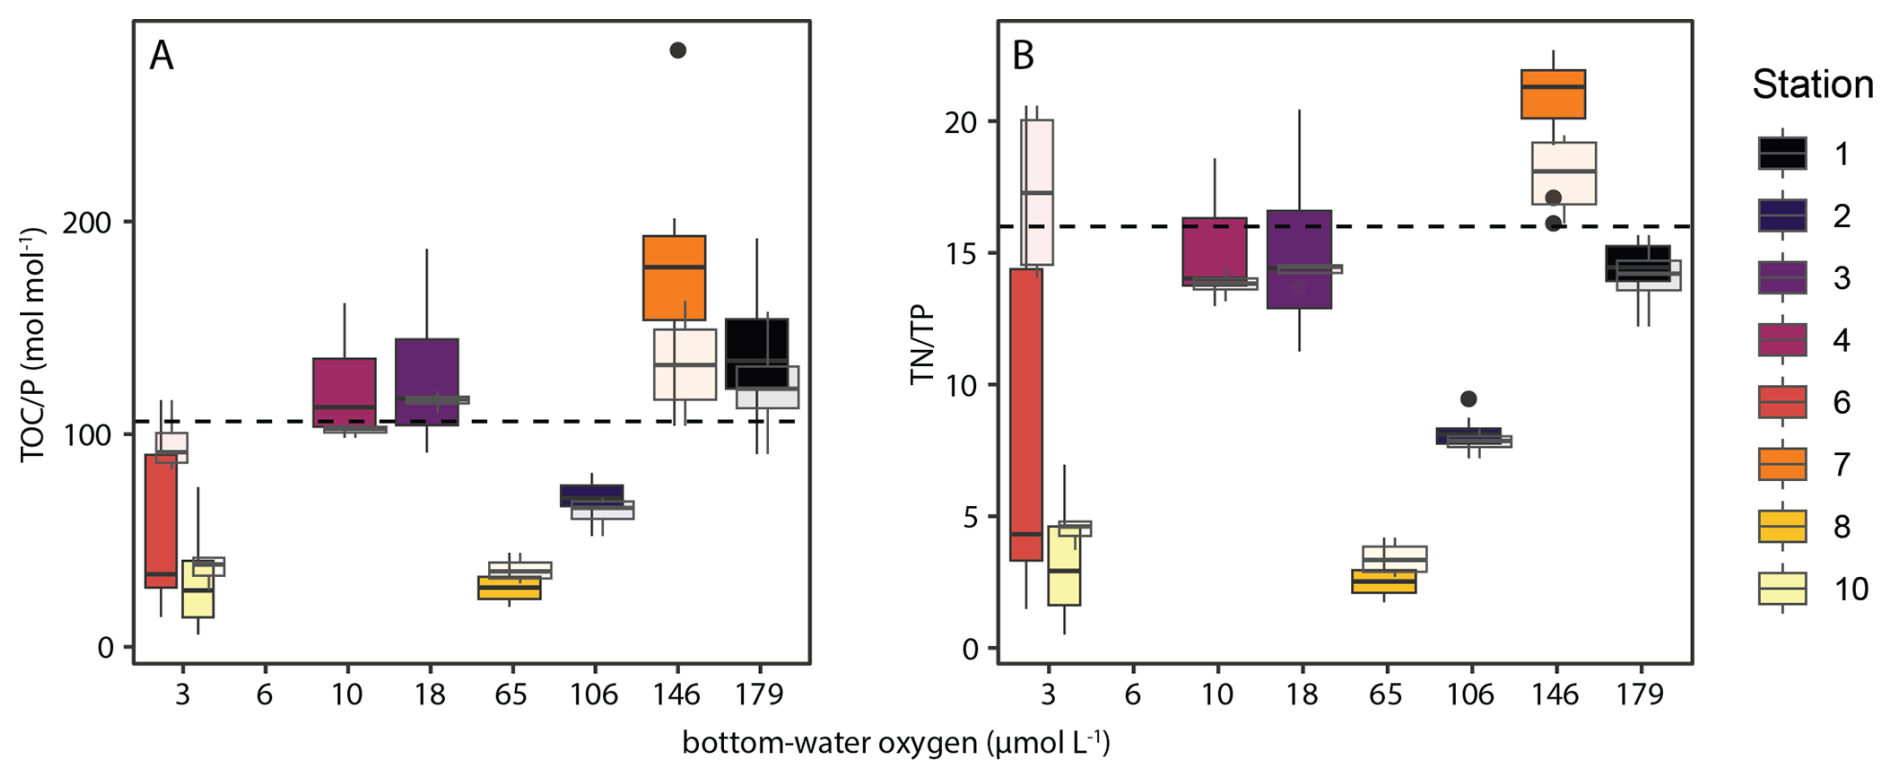
Figure 11Box-and-whisker plots with molar TOC Ptotal ratios (A) and (N P)total ratios (B) along the investigated depth (redox) transect. Opaque plots show values for top 15 cm of sediment, semi-transparent plots show values for top 2 cm, the latter representing relatively unaltered top sediment. Note the distinct surface sediment at station 6, which is likely a decaying algal bloom as described in the text. Lower and upper hinges correspond to the first and third quartiles (the 25th and 75th percentiles). The upper whisker extends from the hinge to the largest value no further than 1.5 × IQR from the hinge (where IQR is the inter-quartile range, or distance between the first and third quartiles). The lower whisker extends from the hinge to the smallest value at most 1.5 × IQR of the hinge. Data beyond the end of the whiskers are called “outlying” points and are plotted individually.
Besides excess supply of P in biogenic Ca-P and by SOB, other factors also play a role in shaping TOC P ratios, such as shelf-to slope sediment transport and high biological activity and bioturbation in the OMZ. Station 7 (1027 mbss) was located in a “depo centre” where OM, which has been resuspended from the shelf, is concentrated and buried (Inthorn et al., 2006a; Inthorn et al., 2006b). Resuspended OM undergoes repetitive redox sequences and oxic respiration (Aller, 1998), which selectively preserves relatively recalcitrant, N- and P-poor OM and thus enhances TOC P. Contrasting with previous work that mentions the refractory nature of OM in the depo centre, we note that relative high TOC content and benthic O2 and DIC fluxes suggest rapid breakdown of relatively fresh OM at station 7 during our visit. The peaks in bottom-water turbidity observed at most stations during our cruise suggest active seafloor mass transport in a bottom nepheloid layer (Inthorn et al., 2006a) throughout the research area (Fig. 9). In and below the OMZ, we observed abundant benthic faunal activity and burrows, suggesting active bioturbation and -irrigation that can enhance OM breakdown in surface sediment by intensifying and prolonging exposure to high-energy-yield oxidants such as O2 and NO (Aller, 2014; Middelburg, 2018). Such faunal activity would add to an already relatively long oxygen exposure time (OET) on the slope (5–30 yr) compared to the shelf (< 0.5 yr), calculated using the OPD (Table 3) and conservative estimates of the sedimentation rate (0.3 mm yr−1 on the shelf; 0.1 mm yr−1 on the slope (Calvert and Price, 1983; Summerhayes et al., 1995)). In the sediment, prolonged OET can lead to low TOC P ratios (below Redfield) as the C is lost as CO2 or HCO while P is retained, likely by scavenging onto Fe (oxyhydr)oxides.
Overall, our results indicate that minor changes in environmental (redox) conditions in upwelling areas can strongly alter benthic P burial mechanisms and efficiency. This is important because the extent, duration and intensity of oxygen depletion in upwelling areas is changing as a result of anthropogenic global warming (Stramma et al., 2008; Wright et al., 2012; Breitburg et al., 2018; Oschlies et al., 2018). Moreover, distinct P deposition and cycling mechanisms in high-productivity areas can introduce alternative, counteracting feedback mechanisms that disrupt the BWO–TOC P relationship. With the majority of global OM and P burial occurring on the shelf and slope in productive areas, such modulations of the redox dependence of P burial can have marked implications for our understanding of P cycling and bioavailability under eutrophication and intensifying ocean deoxygenation in the (ancient) past and the future.
4.3 Decoupled benthic nutrient fluxes and bottom-water chemistry
The calculated benthic diffusive NH and HPO fluxes show that release of N and P from the sediment is highest from organic-rich shelf sediments with low-oxygen bottom waters. The calculated diffusive HPO fluxes on the shelf (0.5–4 mmol m−2 d−1) were in the same range as measured and calculated fluxes from the Arabian (0.2–6 mmol m−2 d−1), Mauritanian (0.1–0.2 mmol m−2 d−1) and Peruvian (0.2–1.5 mmol m−2 d−1) OMZs (Schenau and De Lange, 2001; Lomnitz et al., 2016; Schroller Lomnitz et al., 2019). The maximum measured whole-core HPO flux (∼ 1 mmol m−2 d−1) was similar to measured in-situ HPO flux from Namibian shelf sediment (140 mbss) from the same area (∼ 2 mmol m−2 d−1 (Chuang et al., 2022)) and to the maximum efflux measured under strongly oxygen-depleted bottom waters in the Peruvian OMZ using in-situ sediment incubation chambers (Noffke et al., 2012). In line with our results, previous work on the Namibian shelf also showed variability in the magnitude and direction of the HPO flux, ranging between −0.9–1.1 (this study) and −0.2–2 mmol m−2 d−1 (Chuang et al., 2022). Our results show low values for the NH HPO ratio of diffusive fluxes at most stations (1–8 mol mol−1), well below the Redfield molar N P ratio of 16, except at station 3 (NH HPO 19). These low ratios result from high HPO gradients around the sediment-water interface, driven by excess release of HPO relative to NH (Fig. 6). Additionally, N release can be suppressed by anaerobic nitrogen-loss processes such as denitrification (also by SOB) and anammox, which may constitute an efficient N sink in surface sediments with co-occurring NO3, NO and NH (Voss et al., 2013; Chuang et al., 2022; Pascal et al., 2025). We found a strong correlation coefficient (Pearson's r= 0.9, see the Supplement) between NH and DIC diffusive fluxes, while the correlation coefficient between HPO and DIC fluxes was much lower (Pearson's r= 0.6), further supporting a decoupling between OM degradation and sedimentary P effluxes.
The calculated and measured HPO fluxes were in the same range but the trends between diffusive and net fluxes were very different. Measured net HPO fluxes on the shelf were high and highly variable, with positive (sediment to water) and negative (water to sediment) values. This variability is likely linked to spatially and temporally dynamic benthic P cycling processes. Deposition and breakdown of biogenic Ca-P as well as P sequestration and release by SOB can occur on short timescales, restricted to the uppermost sediment. Furthermore, bio-irrigation by sediment macro-fauna, particularly under more oxygenated slope sediments, may have affected benthic fluxes and thereby contributed to the difference between diffusive and whole-core fluxes. Overall, the role of NBUS sediments as sink or source of essential elements such as P can only be determined with long-term data of high temporal resolution, which was beyond the scope of this research expedition. The results from the diffusive calculations, whole-core flux measurements and bottom-water chemistry (more detail below) highlight that (i) benthic-pelagic coupling in the NBUS is not at steady state and (ii) benthic C, N and P fluxes become (temporarily) decoupled.
Using bottom-water chemistry, we can further evaluate benthic-pelagic coupling and the impact of sediment biogeochemistry on water-column chemistry. This requires some caution, as pressure effects during coring can force pore-water into the overlying bottom water to an unknown extent. The results show chemical trends as function of surface-sediment OM enrichment and BWO (Fig. 8). Organic matter enrichment and BWO are strongly correlated (Pearson's r= −0.72; see the Supplement). With decreasing BWO and increasing TOC, nutrient fluxes increase, and bottom waters become increasingly enriched in NH, HPO and H4SiO4. The high Si concentration in bottom waters at slope station 7 may reflect dissolution of redeposited diatom frustules. With decreasing BWO and increasing sediment TOC enrichment, the strong decrease in the bottom-water dissolved N P ratio reflects decoupling of fluxes. Anaerobic N loss is reflected in a strong decrease in bottom-water NO with decreasing BWO. Together with nutrients, dissolved HS− also accumulated in the bottom waters at stations with oxygen-depleted bottom waters, most notably at stations 6 and 10 for which positive diffusive HS− fluxes were calculated (Fig. 7). The calculated fluxes for the latter stations varied strongly, while bottom-water HS− concentrations were similar, suggesting that the pore-water chemistry from which the fluxes were calculated is a snapshot that may not reflect benthic exchange on longer timescales. In general, we note that samples were taken during late austral summer (early February) during which seasonal anoxia develops on the NBUS shelf and thus HS− efflux is most likely to occur. Similarly, the seasonally highly variable redox conditions will affect fluxes of C, N and P as well and as such, measured fluxes cannot easily be extrapolated: long-term time series of benthic fluxes are needed to quantify nutrient budgets and monitor the response to environmental change on seasonal to decadal timescales.
4.4 Benthic and pelagic nitrogen and phosphorus cycling: implications of altered nutrient ratios
In the BUS, benthic N P stoichiometry is affected by SOB-modulated N loss and P turnover (Chuang et al., 2022) and the resulting release of excess P from the sediment (Bailey, 1987; Flohr et al., 2014; Emeis et al., 2017). In the NBUS region studied here, oxygen depletion in the water column drives (i) pelagic anaerobic N loss processes and (ii) benthic P supply that together result in off-shelf transport of N-depleted waters (Flohr et al., 2014).
These processes drive N P ratios in the water column to low values, resulting in the so-called “N deficit” determined on the shelf during our research expedition (van Kemenade et al., 2022), calculated as the difference between measured DIN and expected DIN based on HPO (DIP) and Redfield stoichiometry (N P = 16). As such, the N deficit is an operational indicator of the extent to which the measured N P drops below the Redfield value. Our results illustrate how interacting sedimentary and pelagic biogeochemical processes result in shelf waters with molar N P as low as 2.6 in bottom waters (station 6, 100 mbss, BWO = 3 µmol L−1).
Here, we use our nutrient data to estimate the impact of excess P supply to bottom waters on the N deficit. The water-column HPO profiles for shelf stations 5, 6 and 10 show enrichments in the bottom ∼ 25 m of 2.6–3.6 µmol L−1 (Fig. 5). Stations 3 and 4 do not show this enrichment; HPO reaches ∼ 2 µmol L−1. We assume that this would have been the concentration of HPO in bottom waters at stations 5, 6 and 10 as well in the hypothetical absence of the sediment-derived bottom-water HPO enrichment. Using this conservative estimate, we can then approximate to what extent excess P (likely from sources other than algal OM; see Sect. 4.1) rather than N depletion contributes to the N deficit. The contribution of excess P to the N deficit we call the “P-driven N deficit”, which is the difference between the N-driven N deficit calculated with a bottom-water P concentration of 2 µmol L−1 and the actual N deficit (DIN − 16 × DIP). The results are striking: 25 %–85 % of the N deficit can be contributed to the bottom-water excess P, likely delivered by the sediment (Fig. 12). This highlights how benthic P inputs can shape the N deficit in the NBUS and perhaps more broadly in upwelling regions, as we show an N deficit can occur without extensive anaerobic N loss (see station 10 in Fig. 12). Here, we do not consider in detail the processes underlying the N deficit calculated in surface waters (∼ 0–25 mbss, Fig. 12), but we point out that a relative P excess is in line with global oceanic data showing that N commonly becomes depleted before P in the photic zone (Tyrrell, 1999).
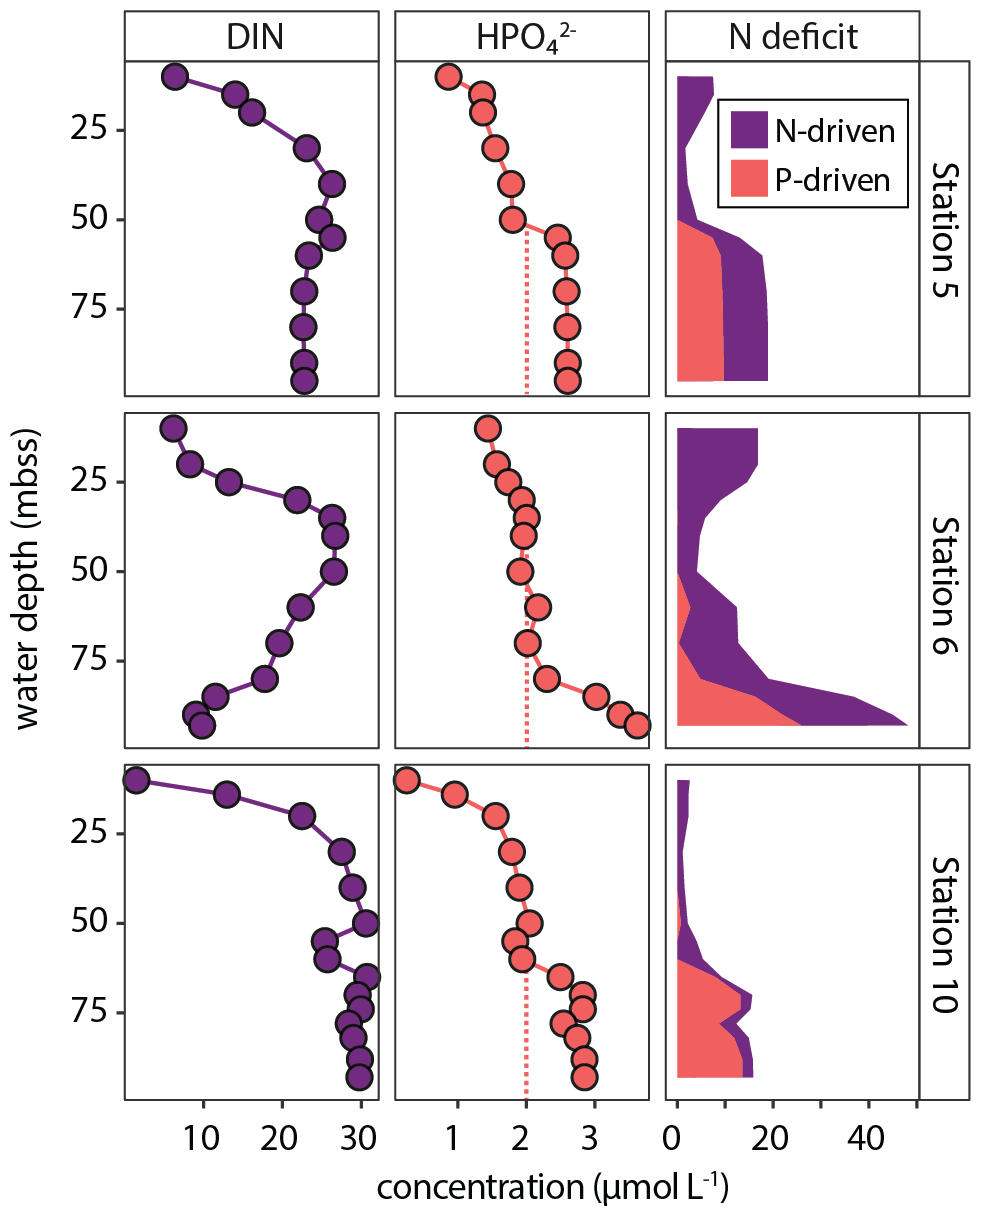
Figure 12Water-column profiles of DIN (left panels) and HPO (middle panels). Right panels show stacked plot of N deficit, showing the contributions from anaerobic N loss (purple) and excess supply of P (orange). The orange dashed lines show an assumed “normal” bottom-water HPO concentration of ∼ 2 µmol L−1. Any additional P is considered excess P, supplied from the sediment by dissolution of labile P sources (fish debris, sulfur-oxidizing bacteria), which results in a “P-driven” pelagic N deficit.
Our results show dramatic changes in the dissolved N P ratio during low-oxygen conditions on the NBUS shelf. Alteration of nutrient stoichiometry can have a profound impact on ocean biogeochemistry by affecting the microbial community composition (Moore et al., 2013). For instance, low N P waters are thought to boost the relative abundance of N2-fixing cyanobacteria in both ancient (Kuypers et al., 2004) and modern marine systems including the NBUS (Vahtera et al., 2007; Flohr et al., 2014; Emeis et al., 2017). The physicochemical water-column data (temperature, density; Fig. 10) do not indicate strong stratification of the bottom waters, suggesting that the enrichment is due to active benthic P efflux and not bottom water restriction. However, our findings are in line with those of Flohr et al. (2014) in suggesting that the wider impact of altered nutrient stoichiometry is minor, at least in the period the research cruise was undertaken. The water-column N P ratios beyond the shelf break are close to Redfield throughout the water column; the waters transported off the shelf do not have a distinct, P-enriched and/or N-depleted signature. Furthermore, we note that nutrient stoichiometry on bottom water on the shelf is likely a function of the seasonally variable redox conditions. We sampled in austral summer with shelf anoxia, the optimal timeframe to find decoupled N and P cycling. Our results do indicate that the increasing extent and intensity of ocean oxygen depletion in general and OMZs in particular have the potential to shift marine nutrient availability and stoichiometry through interacting, redox-dependent benthic and pelagic biogeochemical N and P cycling processes.
-
High nutrient availability and strong redox gradients in the NBUS result in the formation and sediment burial of highly labile biogenic P phases such as calcium phosphate in fish bones and intracellular polyphosphate in sulfur-oxidizing bacteria on the oxygen-depleted shelf;
-
The labile P pools have relatively low C/P and N P ratios compared to algal OM (the predominant P source in most of the marine realm) and dissolve rapidly, leading to high concentrations of excess P in the pore-water and bottom water and thereby altering nutrient stoichiometry;
-
Benthic P cycling and P fluxes on the oxygen-depleted shelf are highly variable in time and space with locally distinct depositional conditions and seasonal trends in bottom-water oxygenation; this complicates extrapolation of measurements for nutrient budgets;
-
High fluxes of excess P from the sediment into the water column on the oxygen-depleted shelf locally affect water-column nutrient stoichiometry and contribute to the N deficit to the same extent as anaerobic microbial N loss, but this effect seems restricted to the shelf under current conditions;
-
Ongoing ocean deoxygenation driven by eutrophication and global warming, specifically expansion and intensification of OMZs, will amplify changes in (de)coupled N-P cycling and stoichiometry and thereby impact ocean biogeochemistry and specifically the distribution of microbial communities.
The data presented in this article are available in the Supplement and as data tables stored in the NIOZ data archive system (DAS) under DOI https://doi.org/10.25850/nioz/7b.b.wk (Kraal, 2026).
The supplement related to this article is available online at https://doi.org/10.5194/bg-23-3253-2026-supplement.
PK led the research expedition, designed the on-board experiments and performed them together with KU, and wrote the manuscript with contributions from all co-authors. KU performed the on-board experiments and the onshore laboratory analyses and contributed to the manuscript (review and editing). DR co-led the research expedition and contributed to the manuscript (review and editing). GJR contributed to the manuscript (review and editing).
The contact author has declared that none of the authors has any competing interests.
Publisher's note: Copernicus Publications remains neutral with regard to jurisdictional claims made in the text, published maps, institutional affiliations, or any other geographical representation in this paper. The authors bear the ultimate responsibility for providing appropriate place names. Views expressed in the text are those of the authors and do not necessarily reflect the views of the publisher.
We thank the crew, technical support and science party of Pelagia expedition 64PE449 to the northern Benguela upwelling system. Special thanks to Zeynep Erdem for the collaboration during cruise planning and execution. We are grateful to Karel Bakker for on-board nutrient analysis in water and pore-water samples. Royal NIOZ and National Marine facilities are thanked for financial support and providing ship time for this expedition. We would like to thank Sanne Vreugdenhil for her help with DNA extractions, Wietse Reitsma for his assistance with data analysis, and Laura Villanueva for her help with data interpretation. Kasper Reitzel and Anna-Marie Klamt of the University of Southern Denmark (SDU) in Odense, Denmark, performed solid-state and liquid 31P-NMR on sediment samples in search of polyphosphates. We are grateful to the reviewers (Gwénaëlle Chaillou and one anonymous) for their feedback that improved the quality of this article.
This research has been supported by the Utrecht University–NIOZ agreement (2015–2025).
This paper was edited by Edouard Metzger and reviewed by two anonymous referees.
Algeo, T. J. and Ingall, E.: Sedimentary Corg:P ratios, paleocean ventilation, and Phanerozoic atmospheric pO2, Palaeogeogr. Palaeocl., 256, 130–155, https://doi.org/10.1016/j.palaeo.2007.02.029, 2007.
Aller, R. C.: Mobile deltaic and continental shelf muds as suboxic, fluidized bed reactors, Mar. Chem., 61, 143–155, https://doi.org/10.1016/S0304-4203(98)00024-3, 1998.
Aller, R. C.: 8.11 – Sedimentary Diagenesis, Depositional Environments, and Benthic Fluxes, in: Treatise on Geochemistry (Second Edition), edited by: Holland, H. D., and Turekian, K. K., Elsevier, Oxford, 293–334, https://doi.org/10.1016/B978-0-08-095975-7.00611-2, 2014.
Anschutz, P., Zhong, S., Sundby, B., Mucci, A., and Gobeil, C.: Burial efficiency of phosphorus and the geochemistry of iron in continental margin sediments, Limnol. Oceanogr., 43, 53–64, https://doi.org/10.4319/lo.1998.43.1.0053, 1998.
Anschutz, P., Dedieu, K., Desmazes, F., and Chaillou, G.: Speciation, oxidation state, and reactivity of particulate manganese in marine sediments, Chem. Geol., 218, 265–279, https://doi.org/10.1016/j.chemgeo.2005.01.008, 2005.
APHA: Standard methods for the examination of water and wastewater, 21, American Public Health Association – American Water Works Association – Water Environment Federation, https://www.standardmethods.org/doi/abs/10.2105/SMWW.2882.001, 2005.
Bailey, G. W.: The role of regeneration from the sediments in the supply of nutrients to the euphotic zone in the southern Benguela system, Afr. J. Mar. Sci., 5, 273–285, https://doi.org/10.2989/025776187784522478, 1987.
Bartlett, J. K. and Skoog, D. A.: Colorimetric determination of elemental sulfur in hydrocarbons, Anal. Chem., 26, 1008–1011, https://doi.org/10.1021/ac60090a014, 1954.
Berner, R. A.: Sedimentary pyrite formation: An update, Geochim. Cosmochim. Acta, 48, 605–615, https://doi.org/10.1016/0016-7037(84)90089-9, 1984.
Breitburg, D., Levin, L. A., Oschlies, A., Grégoire, M., Chavez, F. P., Conley, D. J., Garçon, V., Gilbert, D., Gutiérrez, D., Isensee, K., Jacinto, G. S., Limburg, K. E., Montes, I., Naqvi, S. W. A., Pitcher, G. C., Rabalais, N. N., Roman, M. R., Rose, K. A., Seibel, B. A., Telszewski, M., Yasuhara, M., and Zhang, J.: Declining oxygen in the global ocean and coastal waters, Science, 359, https://doi.org/10.1126/science.aam7240, 2018.
Brüchert, V., Currie, B., Peard, K. R., Lass, U., Endler, R., Dübecke, A., Julies, E., Leipe, T., and Zitzmann, S.: Biogeochemical and physical control on shelf anoxia and water column hydrogen sulphide in the Benguela coastal upwelling system off Namibia, Dordrecht, 161–193, https://doi.org/10.1007/1-4020-4297-3_07, 2006
Brüchert, V., Jørgensen, B. B., Neumann, K., Riechmann, D., Schlösser, M., and Schulz, H.: Regulation of bacterial sulfate reduction and hydrogen sulfide fluxes in the central namibian coastal upwelling zone, Geochim. Cosmochim. Acta, 67, 4505–4518, https://doi.org/10.1016/S0016-7037(03)00275-8, 2003.
Burdige, D. J.: Geochemistry of marine sediments, Princeton University Press, https://doi.org/10.1017/S0016756807003743, 2006.
Burton, E. D., Sullivan, L. A., Bush, R. T., Johnston, S. G., and Keene, A. F.: A simple and inexpensive chromium-reducible sulfur method for acid-sulfate soils, Appl. Geochem., 23, 2759–2766, https://doi.org/10.1016/j.apgeochem.2008.07.007, 2008.
Callbeck, C. M., Canfield, D. E., Kuypers, M. M. M., Yilmaz, P., Lavik, G., Thamdrup, B., Schubert, C. J., and Bristow, L. A.: Sulfur cycling in oceanic oxygen minimum zones, Limnol. Oceanogr., 66, 2360–2392, https://doi.org/10.1002/lno.11759, 2021.
Calvert, S. E. and Price, N. B.: Geochemistry of Namibian Shelf Sediments, in: Coastal Upwelling Its Sediment Record: Part A: Responses of the Sedimentary Regime to Present Coastal Upwelling, edited by: Suess, E., and Thiede, J., Springer US, Boston, MA, 337–375, https://doi.org/10.1007/978-1-4615-6651-9_17, 1983.
Chapman, P. and Shannon, L. V.: Seasonality in the oxygen minimum layers at the extremities of the Benguela system, Afr. J. Mar. Sci., 5, 85–94, https://doi.org/10.2989/025776187784522162, 1987.
Chavez, F. P. and Messié, M.: A comparison of Eastern Boundary Upwelling Ecosystems, Prog. Oceanogr., 83, 80–96, https://doi.org/10.1016/j.pocean.2009.07.032, 2009.
Chuang, P.-C., Anderson, C. H., Kossack, M., Fabian, J., Su, C.-C., Vosteen, P., Zabel, M., Scholz, F., Schulz-Vogt, H. N., Sommer, S., and Dale, A. W.: Nutrient turnover by large sulfur bacteria on the Namibian mud belt during the low productivity season, Front. Mar. Sci., 9, https://doi.org/10.3389/fmars.2022.929913, 2022.
Claff, S. R., Sullivan, L. A., Burton, E. D., and Bush, R. T.: A sequential extraction procedure for acid sulfate soils: Partitioning of iron, Geoderma, 155, 224–230, https://doi.org/10.1016/j.geoderma.2009.12.002, 2010.
Cline, J. D.: Spectrophotometric determination of hydrogen sulfide in natural waters, Limnol. Oceanogr., 14, 454–458, https://doi.org/10.4319/lo.1969.14.3.0454, 1969.
Cosmidis, J., Benzerara, K., Menguy, N., and Arning, E.: Microscopy evidence of bacterial microfossils in phosphorite crusts of the Peruvian shelf: implications for phosphogenesis mechanisms, Chem. Geol., https://doi.org/10.1016/j.chemgeo.2013.09.009, 2013.
Dale, A. W., Brüchert, V., Alperin, M., and Regnier, P.: An integrated sulfur isotope model for Namibian shelf sediments, Geochim. Cosmochim. Acta, 73, 1924–1944, https://doi.org/10.1016/j.gca.2008.12.015, 2009.
Dale, A. W., Graco, M., and Wallmann, K.: Strong and dynamic benthic-pelagic coupling and feedbacks in a coastal upwelling system (Peruvian shelf), Front. Mar. Sci, 4, https://doi.org/10.3389/fmars.2017.00029, 2017.
Diaz, R. J. and Rosenberg, R.: Spreading dead zones and consequences for marine ecosystems, Science, 321, 926–929, https://doi.org/10.1126/science.1156401, 2008.
Dzombak, D. A. and Morel, F. M. M.: Surface complexation modeling: Hydrous ferric oxide, Wiley, New York, 416 pp., ISBN 0-471-63731-9, 1990.
Emeis, K., Eggert, A., Flohr, A., Lahajnar, N., Nausch, G., Neumann, A., Rixen, T., Schmidt, M., Van der Plas, A., and Wasmund, N.: Biogeochemical processes and turnover rates in the Northern Benguela Upwelling System, J. Mar. Syst., https://doi.org/10.1016/j.jmarsys.2017.10.001, 2017.
Falkowski, P. G.: Evolution of the nitrogen cycle and its influence on the biological sequestration of CO2 in the ocean, Nature, 387, 272–275, https://doi.org/10.1038/387272a0, 1997.
Flohr, A., van der Plas, A. K., Emeis, K.-C., Mohrholz, V., and Rixen, T.: Spatio-temporal patterns of C : N : P ratios in the northern Benguela upwelling system, Biogeosciences, 11, 885–897, https://doi.org/10.5194/bg-11-885-2014, 2014.
Flood, B. E., Louw, D. C., Van der Plas, A. K., and Bailey, J. V.: Giant sulfur bacteria (Beggiatoaceae) from sediments underlying the Benguela upwelling system host diverse microbiomes, PLoS One, 16, e0258124, https://doi.org/10.1371/journal.pone.0258124, 2021.
Froelich, P. N., Arthur, M. A., Burnett, W. C., Deakin, M., Hensley, V., Jahnke, R., Kaul, L., Kim, K. H., Roe, K., Soutar, A., and Vathakanon, C.: Early diagenesis of organic-matter in Peru continental-margin sediments – Phosphorite precipitation, Mar. Geol., 80, 309–343, https://doi.org/10.1016/0025-3227(88)90095-3, 1988.
Gächter, R., Meyer, J. S., and Mares, A.: Contribution of bacteria to release and fixation of phosphorus in lake-sediments, Limnol. Oceanogr., 33, 1542–1558, https://doi.org/10.4319/lo.1988.33.6part2.1542, 1988.
Gallardo, V., Klingelhoeffer, E., Arntz, W., and Graco, M.: First report of the bacterium Thioploca in the Benguela ecosystem off Namibia, J. Mar. Biol. Ass. UK, 78, 1007–1010, https://doi.org/10.1017/s0025315400044945, 1998.
Giraud, X., Le Quéré, C., and da Cunha, L. C.: Importance of coastal nutrient supply for global ocean biogeochemistry, Global Biogeochem. Cy., 22, https://doi.org/10.1029/2006GB002717, 2008.
Goldhammer, T., Bruchert, V., Ferdelman, T. G., and Zabel, M.: Microbial sequestration of phosphorus in anoxic upwelling sediments, Nature Geosci., 3, 557–561, https://doi.org/10.1038/ngeo913, 2010.
Grasshoff, K., Kremling, K., and Ehrhardt, M.: Methods of seawater analysis, John Wiley & Sons, https://doi.org/10.1002/9783527613984, 2009.
Greenhalgh, R. and Riley, J. P.: The determination of fluorides in natural waters, with particular reference to sea water, Anal. Chim. Acta, 25, 179–188, https://doi.org/10.1016/0003-2670(61)80199-2, 1961.
Helder, W. and De Vries, R. T. P.: An automatic phenol-hypochlorite method for the determination of ammonia in sea- and brackish waters, Neth. J. Sea Res., 13, 154–160, https://doi.org/10.1016/0077-7579(79)90038-3, 1979.
Holland, H. D.: The chemistry of the atmosphere and oceans, Wiley, New York, ISBN 0-471-03509-2, 1978.
Ingall, E. and Jahnke, R.: Evidence for enhanced phosphorus regeneration from marine sediments overlain by oxygen depleted waters, Geochim. Cosmochim. Acta, 58, 2571–2575, https://doi.org/10.1016/0016-7037(94)90033-7, 1994.
Inthorn, M., Mohrholz, V., and Zabel, M.: Nepheloid layer distribution in the Benguela upwelling area offshore Namibia, Deep-Sea Res. Pt. I, 53, 1423–1438, https://doi.org/10.1016/j.dsr.2006.06.004, 2006a.
Inthorn, M., Wagner, T., Scheeder, G., and Zabel, M.: Lateral transport controls distribution, quality, and burial of organic matter along continental slopes in high-productivity areas, Geology, 34, 205–208, https://doi.org/10.1130/G22153.1, 2006b.
Jenkyns, H. C.: Geochemistry of oceanic anoxic events, Geochem. Geophys. Geosyst., 11, Q03004, https://doi.org/10.1029/2009gc002788, 2010.
Jensen, H. S., Kristensen, P., Jeppesen, E., and Skytthe, A.: Iron-phosphorus ratio in surface sediment as an indicator of phosphate release from aerobic sediments in shallow lakes, Hydrobiologia, 235, 731–743, https://doi.org/10.1007/BF00026261, 1992.
Jørgensen, B. B. and Gallardo, V. A.: Thioploca spp.: filamentous sulfur bacteria with nitrate vacuoles, FEMS Microbiol. Ecol., 28, 301–313, https://doi.org/10.1111/j.1574-6941.1999.tb00585.x, 1999.
Kraal, P.: Data supplement to “Benthic phosphorus cycling in the northern Benguela upwelling system: excess P supply and altered pelagic nutrient stoichiometry”, NIOZ data archive system [data set], https://doi.org/10.25850/nioz/7b.b.wk, 2026.
Kraal, P., Slomp, C. P., and de Lange, G. J.: Sedimentary organic carbon to phosphorus ratios as a redox proxy in Quaternary records from the Mediterranean, Chem. Geol., 277, 167–177, https://doi.org/10.1016/j.chemgeo.2010.08.003, 2010.
Kraal, P., Slomp, C. P., Reed, D. C., Reichart, G.-J., and Poulton, S. W.: Sedimentary phosphorus and iron cycling in and below the oxygen minimum zone of the northern Arabian Sea, Biogeosciences, 9, 2603–2624, https://doi.org/10.5194/bg-9-2603-2012, 2012.
Kraal, P., Burton, E. D., and Bush, R. T.: Iron monosulfide accumulation and pyrite formation in eutrophic estuarine sediments, Geochim. Cosmochim. Acta, 122, 75–88, https://doi.org/10.1016/j.gca.2013.08.013, 2013.
Kraal, P., Dijkstra, N., Behrends, T., and Slomp, C. P.: Phosphorus burial in sediments of the sulfidic deep Black Sea: key roles for adsorption by calcium carbonate and apatite authigenesis, Geochim. Cosmochim. Acta, 204, 140–158, https://doi.org/10.1016/j.gca.2017.01.042, 2017.
Kraal, P., van Genuchten, C. M., Behrends, T., and Rose, A. L.: Sorption of phosphate and silicate alters dissolution kinetics of poorly crystalline iron (oxyhydr)oxide, Chemosphere, 234, 690–701, https://doi.org/10.1016/j.chemosphere.2019.06.071, 2019.
Küster-Heins, K., de Lange, G. J., and Zabel, M.: Benthic phosphorus and iron budgets for three NW African slope sediments: a balance approach, Biogeosciences, 7, 469–480, https://doi.org/10.5194/bg-7-469-2010, 2010a.
Küster-Heins, K., Steinmetz, E., De Lange, G. J., and Zabel, M.: Phosphorus cycling in marine sediments from the continental margin off Namibia, Mar. Geol., 274, 95–106, https://doi.org/10.1016/j.margeo.2010.03.008, 2010b.
Kuypers, M. M. M., van Breugel, Y., Schouten, S., Erba, E., and Sinninghe Damsté, J. S.: N2-fixing cyanobacteria supplied nutrient N for Cretaceous oceanic anoxic events, Geology, 32, https://doi.org/10.1130/G20458.1, 2004.
Lenton, T. M. and Klausmeier, C. A.: Biotic stoichiometric controls on the deep ocean N:P ratio, Biogeosciences, 4, 353–367, https://doi.org/10.5194/bg-4-353-2007, 2007.
Løes, A.-K., Ahlin, J. P., Ahuja, I., Krogstad, T., Smevoll, S., and Waag, H.: Effects of formic Acid preservation of fishbones on the extractability of ammonium lactate–acetate soluble calcium, phosphorus, magnesium, and potassium, Waste Biom. Valor., 13, 3547–3559, https://doi.org/10.1007/s12649-022-01744-7, 2022.
Logesh, A. R., Pravinkumar, M., Raffi, S. M., and Kalaiselvam, M.: Calcium and phosphorus determination in bones of low value fishes, Sardinella longiceps (Valenciennes) and Trichiurus savala (Cuvier), from Parangipettai, Southeast Coast of India, Asian Pac. J. Trop. Disease, 2, S254–S256, https://doi.org/10.1016/S2222-1808(12)60160-1, 2012.
Lomnitz, U., Sommer, S., Dale, A. W., Löscher, C. R., Noffke, A., Wallmann, K., and Hensen, C.: Benthic phosphorus cycling in the Peruvian oxygen minimum zone, Biogeosciences, 13, 1367–1386, https://doi.org/10.5194/bg-13-1367-2016, 2016.
Marcus, N. H. and Boero, F.: Minireview: The importance of benthic-pelagic coupling and the forgotten role of life cycles in coastal aquatic systems, Limnol. Oceanogr., 43, 763–768, https://doi.org/10.4319/lo.1998.43.5.0763, 1998.
McHatton, S. C., Barry, J. P., Jannasch, H. W., and Nelson, D. C.: High nitrate concentrations in vacuolate, autotrophic marine Beggiatoa spp, Appl. Environ. Microb., 62, 954–958, https://doi.org/10.1128/aem.62.3.954-958.1996, 1996.
Messié, M. and Chavez, F. P.: Seasonal regulation of primary production in eastern boundary upwelling systems, Prog. Oceanogr., 134, 1–18, https://doi.org/10.1016/j.pocean.2014.10.011, 2015.
Middelburg, J. J.: Reviews and syntheses: to the bottom of carbon processing at the seafloor, Biogeosciences, 15, 413–427, https://doi.org/10.5194/bg-15-413-2018, 2018.
Middelburg, J. J. and Levin, L. A.: Coastal hypoxia and sediment biogeochemistry, Biogeosciences, 6, 1273–1293, https://doi.org/10.5194/bg-6-1273-2009, 2009.
Mohrholz, V., Bartholomae, C. H., van der Plas, A. K., and Lass, H. U.: The seasonal variability of the northern Benguela undercurrent and its relation to the oxygen budget on the shelf, Cont. Shelf Res., 28, 424–441, https://doi.org/10.1016/j.csr.2007.10.001, 2008.
Mohrholz, V., Eggert, A., Junker, T., Nausch, G., Ohde, T., and Schmidt, M.: Cross shelf hydrographic and hydrochemical conditions and their short term variability at the northern Benguela during a normal upwelling season, J. Mar. Syst., 140, 92–110, https://doi.org/10.1016/j.jmarsys.2014.04.019, 2014.
Moore, C. M., Mills, M. M., Arrigo, K. R., Berman-Frank, I., Bopp, L., Boyd, P. W., Galbraith, E. D., Geider, R. J., Guieu, C., Jaccard, S. L., Jickells, T. D., La Roche, J., Lenton, T. M., Mahowald, N. M., Maranon, E., Marinov, I., Moore, J. K., Nakatsuka, T., Oschlies, A., Saito, M. A., Thingstad, T. F., Tsuda, A., and Ulloa, O.: Processes and patterns of oceanic nutrient limitation, Nature Geosci., 6, 701–710, https://doi.org/10.1038/ngeo1765, 2013.
Moreno, A. R. and Martiny, A. C.: Ecological stoichiometry of ocean plankton, Annu. Rev. Mar. Sci., 10, 43–69, https://doi.org/10.1146/annurev-marine-121916-063126, 2018.
Mort, H. P., Adatte, T., Föllmi, K. B., Keller, G., Steinmann, P., Matera, V., Berner, Z., and Stüben, D.: Phosphorus and the roles of productivity and nutrient recycling during oceanic anoxic event 2, Geology, 35, https://doi.org/10.1130/G23475A.1, 2007.
Murphy, J. and Riley, J. P.: A modified single solution method for the determination of phosphate in natural waters, Anal. Chim. Acta, 27, 31–36, https://doi.org/10.1016/S0003-2670(00)88444-5, 1962.
Nagel, B., Emeis, K. C., Flohr, A., Rixen, T., Schlarbaum, T., Mohrholz, V., and van der Plas, A.: N-cycling and balancing of the N-deficit generated in the oxygen minimum zone over the Namibian shelf – An isotope-based approach, JGR Biogeosciences, 118, 361–371, https://doi.org/10.1002/jgrg.20040, 2013.
Nagel, B., Gaye, B., Lahajnar, N., Struck, U., and Emeis, K.-C.: Effects of current regimes and oxygenation on particulate matter preservation on the Namibian shelf: Insights from amino acid biogeochemistry, Mar. Chem., 186, 121–132, https://doi.org/10.1016/j.marchem.2016.09.001, 2016.
Needoba, J. A., Foster, R. A., Sakamoto, C., Zehr, J. P., and Johnson, K. S.: Nitrogen fixation by unicellular diazotrophic cyanobacteria in the temperate oligotrophic North Pacific Ocean, Limnol. Oceanogr., 52, 1317–1327, https://doi.org/10.4319/lo.2007.52.4.1317, 2007.
Noffke, A., Hensen, C., Sommer, S., Scholz, F., Bohlen, L., Mosch, T., Graco, M., and Wallmann, K.: Benthic iron and phosphorus fluxes across the Peruvian oxygen minimum zone, Limnol. Oceanogr., 57, 851–867, https://doi.org/10.4319/lo.2012.57.3.0851, 2012.
Nriagu, J. O.: Rapid decomposition of fish bones in Lake Erie sediments, Hydrobiologia, 106, 217–222, https://doi.org/10.1007/BF00008119, 1982.
Ohde, T. and Dadou, I.: Seasonal and annual variability of coastal sulphur plumes in the northern Benguela upwelling system, PLoS One, 13, e0192140, https://doi.org/10.1371/journal.pone.0192140, 2018.
Oschlies, A., Brandt, P., Stramma, L., and Schmidtko, S.: Drivers and mechanisms of ocean deoxygenation, Nature Geosci., 11, 467–473, https://doi.org/10.1038/s41561-018-0152-2, 2018.
Oxmann, J. F. and Schwendenmann, L.: Authigenic apatite and octacalcium phosphate formation due to adsorption–precipitation switching across estuarine salinity gradients, Biogeosciences, 12, 723–738, https://doi.org/10.5194/bg-12-723-2015, 2015.
Pascal, L., Cloutier-Artiwat, F., Zanon, A., Wallace, D. W. R., and Chaillou, G.: New deoxygenation threshold for N2 and N2O production in coastal waters and sediments, Global Biogeochem. Cy., 39, e2024GB008218, https://doi.org/10.1029/2024GB008218, 2025.
Poulton, S. W. and Canfield, D. E.: Development of a sequential extraction procedure for iron: implications for iron partitioning in continentally derived particulates, Chem. Geol., 214, 209–221, https://doi.org/10.1016/j.chemgeo.2004.09.003, 2005.
Raven, J. A. and Falkowski, P. G.: Oceanic sinks for atmospheric CO2, Plant, Cell & Environment, 22, 741–755, https://doi.org/10.1046/j.1365-3040.1999.00419.x, 1999.
Reinhard, C. T., Planavsky, N. J., Gill, B. C., Ozaki, K., Robbins, L. J., Lyons, T. W., Fischer, W. W., Wang, C., Cole, D. B., and Konhauser, K. O.: Evolution of the global phosphorus cycle, Nature, 541, 386–389, https://doi.org/10.1038/nature20772, 2017.
Ruttenberg, K. C.: Development of a sequential extraction method for different forms of phosphorus in marine sediments, Limnol. Oceanogr., 37, 1460–1482, 1992.
Ruttenberg, K. C.: Reassessment of the oceanic residence time of phosphorus, Chem. Geol., 107, 405–409, 1993.
Ruttenberg, K. C.: The global phosphorus cycle, in: Treatise on Geochemistry (Second Edition), edited by: Holland, H. D., and Turekian, K. K., Elsevier, Oxford, 499–558, https://doi.org/10.1016/B978-0-08-095975-7.00813-5, 2014.
Ruttenberg, K. C. and Berner, R. A.: Authigenic apatite formation and burial in sediments from non-upwelling, continental-margin environments, Geochim. Cosmochim. Acta, 57, 991–1007, https://doi.org/10.1016/0016-7037(93)90035-U, 1993.
Sarazin, G., Michard, G., and Prevot, F.: A rapid and accurate spectroscopic method for alkalinity measurements in sea water samples, Water Res., 33, 290–294, https://doi.org/10.1016/S0043-1354(98)00168-7, 1999.
Schenau, S. J. and De Lange, G. J.: A novel chemical method to quantify fish debris in marine sediments, Limnol. Oceanogr., 45, 963–971, https://doi.org/10.4319/lo.2000.45.4.0963, 2000.
Schenau, S. J. and De Lange, G. J.: Phosphorus regeneration vs. burial in sediments of the Arabian Sea, Mar. Chem., 75, 201–217, https://doi.org/10.1016/S0304-4203(01)00037-8, 2001.
Schenau, S. J., Slomp, C. P., and De Lange, G. J.: Phosphogenesis and active phosphorite formation in sediments from the Arabian Sea oxygen minimum zone, Mar. Geol., 169, 1–20, https://doi.org/10.1016/S0025-3227(00)00083-9, 2000.
Schlitzer: Ocean Data View, https://odv.awi.de/ (last access: 30 April 2026), 2025.
Schroller Lomnitz, U., Hensen, C., Dale, A. W., Scholz, F., Clemens, D., Sommer, S., Noffke, A., and Wallmann, K.: Dissolved benthic phosphate, iron and carbon fluxes in the Mauritanian upwelling system and implications for ongoing deoxygenation, Deep-Sea Res. Pt. 1, 143, 70–84, https://doi.org/10.1016/j.dsr.2018.11.008, 2019.
Schulz, H. N.: The genus Thiomargarita, in: The Prokaryotes, 1156–1163, https://doi.org/10.1007/0-387-30746-X_47, 2006.
Schulz, H. N. and Schulz, H. D.: Large sulfur bacteria and the formation of phosphorite, Science, 307, 416–418, https://doi.org/10.1126/science.1103096, 2005.
Shannon, L. V., Agenbag, J. J., and Buys, M. E. L.: Large- and mesoscale features of the Angola-Benguela front, Afr. J. Mar. Sci., 5, 11–34, https://doi.org/10.2989/025776187784522261, 1987.
Slomp, C. P., Thomson, J., and De Lange, G. J.: Enhanced regeneration of phosphorus during formation of the most recent eastern Mediterranean sapropel (S1), Geochim. Cosmochim. Acta, 66, 1171–1184, https://doi.org/10.1016/S0016-7037(01)00848-1, 2002.
Slomp, C. P., Thomson, J., and de Lange, G. J.: Controls on phosphorus regeneration and burial during formation of eastern Mediterranean sapropels, Mar. Geol., 203, 141–159, https://doi.org/10.1016/s0025-3227(03)00335-9, 2004.
Stoll, M. H. C., Bakker, K., Nobbe, G. H., and Haese, R. R.: Continuous-Flow Analysis of Dissolved Inorganic Carbon Content in Seawater, Anal. Chem., 73, 4111–4116, https://doi.org/10.1021/ac010303r, 2001.
Stramma, L., Johnson, G. C., Sprintall, J., and Mohrholz, V.: Expanding oxygen-minimum zones in the tropical oceans, Science, 320, 655–658, https://doi.org/10.1126/science.1153847, 2008.
Stüeken, E. E., Kipp, M. A., Koehler, M. C., and Buick, R.: The evolution of Earth's biogeochemical nitrogen cycle, Earth-Sci. Rev., 160, 220–239, https://doi.org/10.1016/j.earscirev.2016.07.007, 2016.
Suess, E.: Phosphate regeneration from sediments of the Peru continental margin by dissolution of fish debris, Geochim. Cosmochim. Acta, 45, 577–588, https://doi.org/10.1016/0016-7037(81)90191-5, 1981.
Summerhayes, C. P., Kroon, D., Rosell-Melé, A., Jordan, R. W., Schrader, H. J., Hearn, R., Villanueva, J., Grimalt, J. O., and Eglinton, G.: Variability in the Benguela Current upwelling system over the past 70 000 years, Prog. Oceanogr., 35, 207–251, https://doi.org/10.1016/0079-6611(95)00008-5, 1995.
Sundby, B. r., Gobeil, C., Silverberg, N., and Alfonso, M.: The phosphorus cycle in coastal marine sediments, Limnol. Oceanogr., 37, 1129–1145, https://doi.org/10.4319/lo.1992.37.6.1129, 1992.
Tyrrell, T.: The relative influences of nitrogen and phosphorus on oceanic primary production, Nature, 400, 525–531, https://doi.org/10.1038/22941, 1999.
Vahtera, E., Conley, D. J., Gustafsson, B. G., Kuosa, H., Pitkänen, H., Savchuk, O. P., Tamminen, T., Viitasalo, M., Voss, M., Wasmund, N., and Wulff, F.: Internal ecosystem feedbacks enhance nitrogen-fixing cyanobacteria blooms and complicate management in the Baltic Sea, AMBIO, 36, 186–194, https://doi.org/10.1579/0044-7447(2007)36[186:Iefenc]2.0.Co;2, 2007.
van Kemenade, Z. R., Villanueva, L., Hopmans, E. C., Kraal, P., Witte, H. J., Sinninghe Damsté, J. S., and Rush, D.: Bacteriohopanetetrol-x: constraining its application as a lipid biomarker for marine anammox using the water column oxygen gradient of the Benguela upwelling system, Biogeosciences, 19, 201–221, https://doi.org/10.5194/bg-19-201-2022, 2022.
Viollier, E., Inglett, P. W., Hunter, K., Roychoudhury, A. N., and Van Cappellen, P.: The ferrozine method revisited: Fe(II)/Fe(III) determination in natural waters, Appl. Geochem., 15, 785–790, https://doi.org/10.1016/s0883-2927(99)00097-9, 2000.
Voss, M., Bange, H. W., Dippner, J. W., Middelburg, J. J., Montoya, J. P., and Ward, B.: The marine nitrogen cycle: recent discoveries, uncertainties and the potential relevance of climate change, Philos. Trans. R. Soc. London, B, 368, https://doi.org/10.1098/rstb.2013.0121, 2013.
Wijayanti, I., Benjakul, S., and Sookchoo, P.: Effect of high pressure heating on physical and chemical characteristics of Asian sea bass (Lates calcarifer) backbone, J. Food Sci. Technol., 58, 3120–3129, https://doi.org/10.1007/s13197-020-04815-6, 2021.
Wright, J. J., Konwar, K. M., and Hallam, S. J.: Microbial ecology of expanding oxygen minimum zones, Nat. Rev. Microbiol., 10, 381–394, https://doi.org/10.1038/nrmicro2778, 2012.